Submitted:
12 April 2023
Posted:
13 April 2023
Read the latest preprint version here
Abstract
This paper presents the goals and components of a quantitative energy balance assessment framework to define PEDs flexibly in three important contexts: the context of the district's density and RES potential, the context of a district's location, induced mobility and the context of the dis-trict's future environment and its decarbonized energy demand or supply. It starts by introducing the practical goals of this definition approach: achievable, yet sufficiently ambitious to be inline with Paris 2050 for most urban and rural Austrian district typologies. It goes on to identify the main design parts of the definition: system boundaries, balancing weights and balance targets and argue how they can be linked to the definition goals in detail. In particular we specify three levels of system boundaries and argue their individual necessity: operation, including everyday mobili-ty, including embodied energy and emissions. It argues that all three pillars of PEDs, energy effi-ciency, onsite renewables and energy flexibility can be assessed with the single metric of a prima-ry energy balance when using carefully designed, time-dependent conversion factors. Finally, it is discussed how balance targets can be interpreted as information and requirements from the sur-rounding energy system, which we identify as a "context factor". Three examples of such context factors, each corresponding to the balance target of one of the previously defined system bounda-ries operation, mobility and embodied emissions are presented: Density (as a context of opera-tion), sectoral energy balances and location (as a context for mobility) and an outlook of a person-al emission budgets (as a context for embodied emissions). Finally, the proposed definition framework is applied to seven distinct district typologies in Austria and discussed in terms of its design goals.
Keywords:
Positive energy districts
; PED definition
; Context Factors
; energy balance assessment
1. Introduction
The need for a PED definition stems from both EU and individual project level: On EU level it is necessary to uniformly define PEDs to measure the success of the SET Plan mission of bringing hundred PEDs on the way until 2025 [1], and at the same time individual projects need criteria that can be met to be referenced, and possibly certified as PED. As a consequence, PED definition has been discussed extensively [2,3,4,5,6], and although there is recognition for the need of a common definition, none could be arrived at as of yet [2,6,7]. Many approaches have been put forward that do not or not exclusively employ a quantitative assessment scheme [8,9,10], but many researchers and practitioners agree that the definition of a PED must ultimately entail the evaluation of an energy balance, whose result must be positive [1,2,3,5,6,11].
The differences between existing definitions that employ such a positive energy balance as a sufficiency criterion can be outlined like this: Firstly the question of which energy services should be considered: There exist many approaches [12], but most converge on the minimum of operation of the district’s HVAC system [9] and sometimes also user electricity such as plug-loads [3,13]. Mobility and Embodied Energy on the other hand is less prevalent, due to the apparent negative effects on a positive energy balance or the lack of suitable assessment methodologies in theory and practice. Other approaches forego a uniformely quantifiable definition altogether and instead make this determination a project specific process [3,4].
The second divergence is the balance metric or KPI to be used: energy end use or flexibility KPIs [14], total or non-renewable primary energy [3,13,15] or GHG emissions [16], or a combination of the above and others [8,14]. In the latest IEA Annex 83 review however, most definitions use a primary energy indicator, with notable exceptions [17]. However still, differences in primary energy conversion can cause drastically different balance assessments [18,19,20,21].
Thirdly, there is divergence in the kind of system boundaries the balance is evaluated on, although “the majority of PEDs in Europe apply the dynamic-PED concept, with geographical boundaries” [12](p.13). This can be further obfuscated by the fact that many projects do not readily achieve their positive balance without some form of “offsite subsidies”, be it in the form of RES credits or outright including these resources in the PED boundary [3,9], but not necessarily clear rules how this inclusion must be performed. Temporally, most use an annual balancing period of an operation year [17].
What is typically not discussed at length is the goal and scope of the definition: Is it suitable for green or brown field developments, any climate zone and density? Should it be possible for any district or of which ambition level to achieve “PED”? As with other European standardization processes such as the EPBD [22], one could separate what a PED is in different levels of regionality from European, national, municipal all the way down to project specific. In practice however, most definitions are developed in international or national projects, but used mostly by the districts within that project. This further adds to the conundrum which definitions can and should be used for which PED projects, and most importantly: why? In fact, using multiple different definitions on different levels of regionality and detail, from broad European frameworks through national standardizations to project level specification could be a promising way forward. Anyway by now, the need to bridge the gap between a standardized and unambiguous definition for EU reporting on one side and the flexibility to account for local contexts and feasibility on the other has become abundantly clear [5,7]. This paper aims to add to the theory underpinning PED definitions by introducing a conceptual view on the positive energy balance, in which the assumed target of positivity can be calibrated by the use of so called “context factors” (CF for short). These are virtual balance components, that need to be designed district-independently to maintain PED feasibility in the desired context.
2. Methods and Approach: PED Definition as a Design Problem
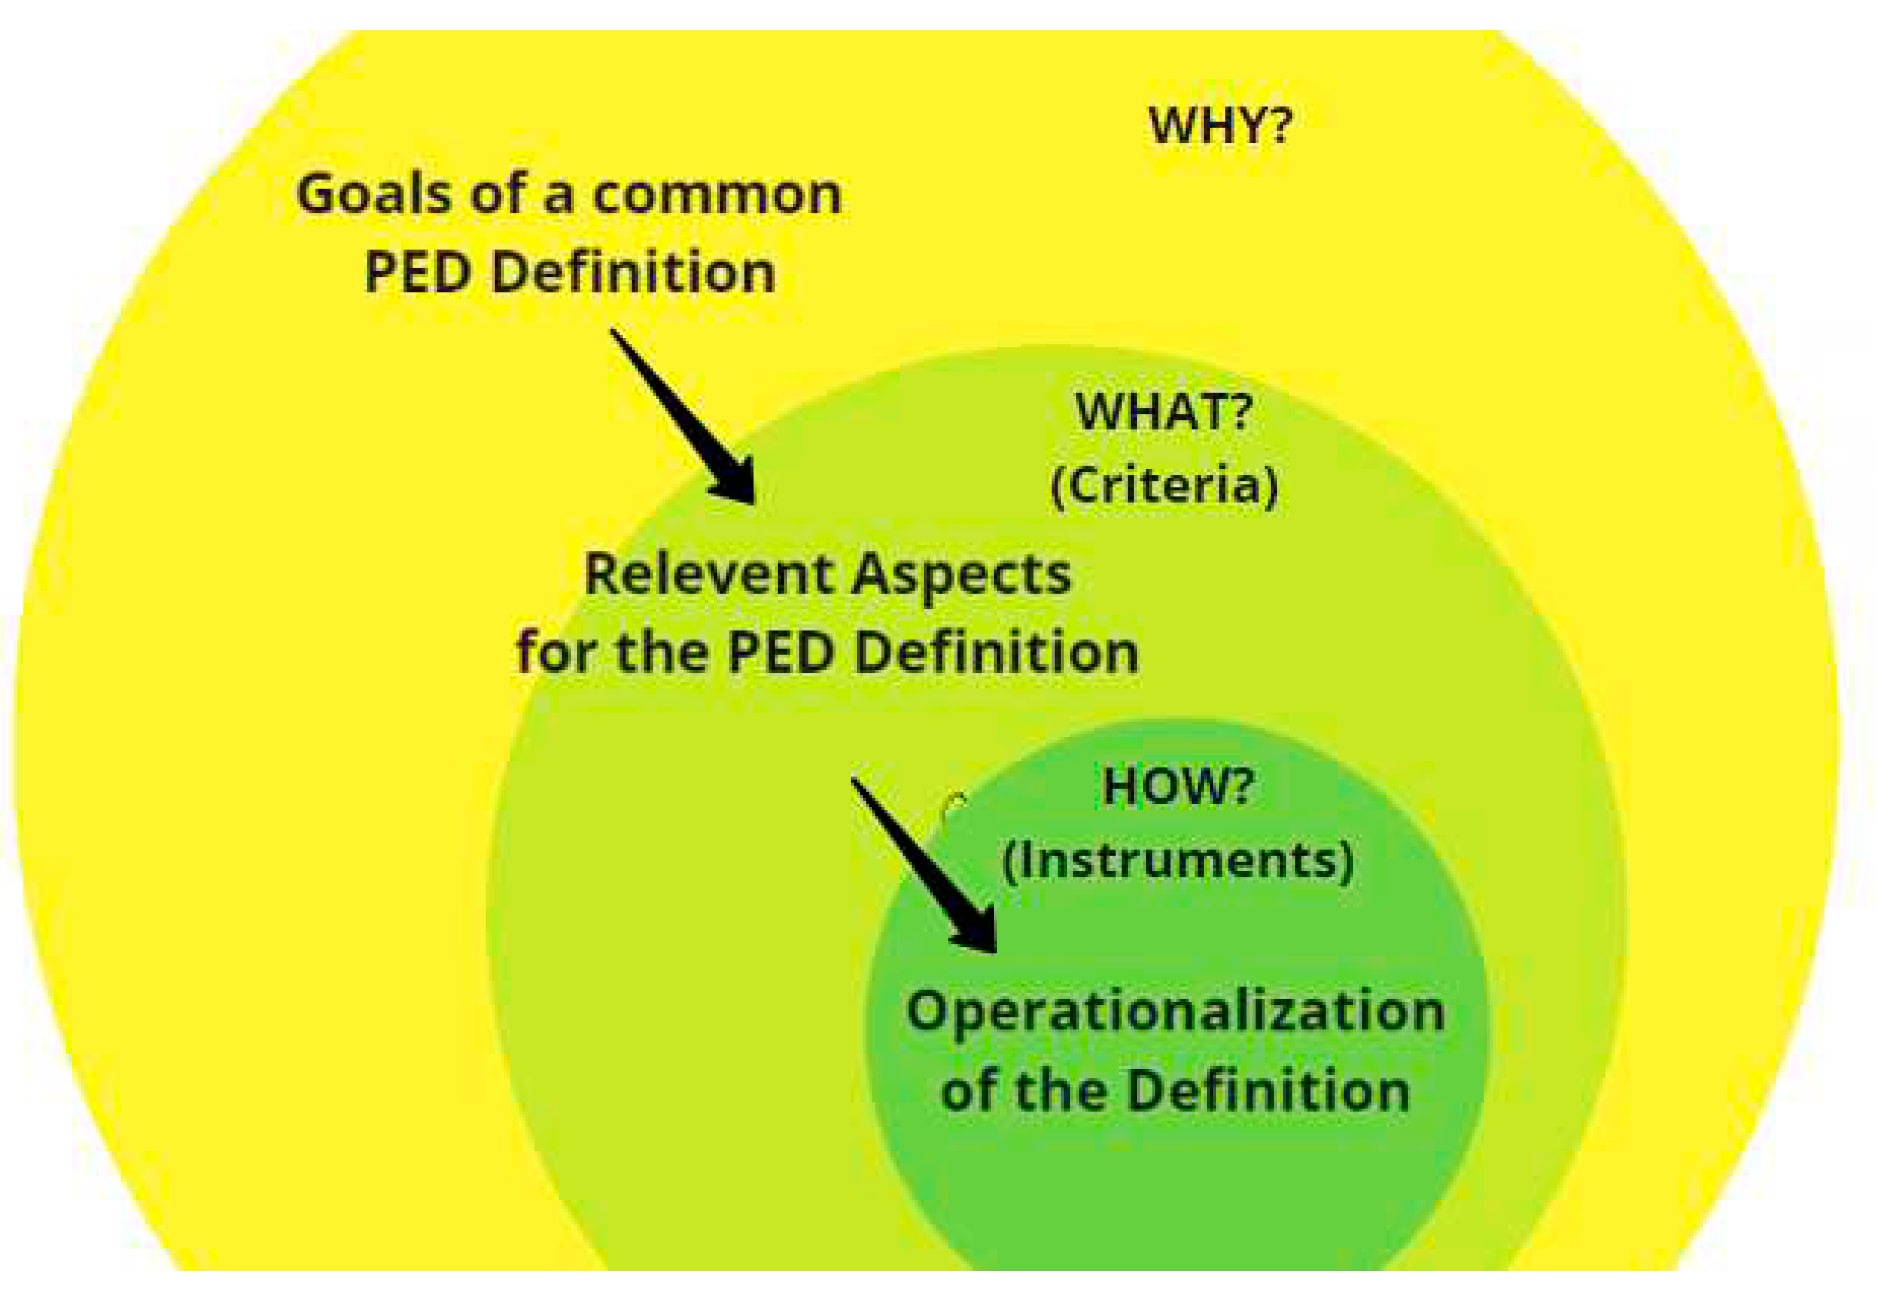
It can be argued that creating a definition is in itself not a scientific process but rather a design problem [23]. A definition cannot be observed, theorized upon and validated. Instead, it specifies and regulates the appropriate use of language. And in this case, “appropriate” is very open for interpretation (compare e.g. [24]). If the definition ought to be useful, it needs to show exactly how. For that reason, it is our understanding that the most important part of the PED definition are the arguments, why it has settled exactly on the determinations and components and is very articulate about the goals it is aimed at. Most definitions indeed solve many of the varying stakeholder problems, but they often do so implicitly rather than stating these plainly. But only if the aims of the definition are declared alongside, can it be tested if it is indeed suited to fulfil them. The following figure illustrates this taken design approach starting with the goals and deriving the criteria and their operationalization thereafter:
Figure 1.
The definition was approached as a design problem starting at the goals.
After the definition goals, the actual components of a PED definition were identified as a quantitative balance assessment, that can be structured in three main parts (in accordance to [23]) : (1) System or balance boundaries, (2) a balance weighting system and (3) a balance target, which we will proceed to construct by means of the aforementioned “context factors” (CF), which as the name implies are derived project-independently from a national PED context. This is illustrated in Figure 2.
These three areas of district system boundary, system balance weighting and balance targets correspond to the three questions a quantitative PED definition via an energy balance needs to address in unison as the definition design problem. From the get-go, the balance target is not necessarily positive or zero, but can in principle be a function of any set of parameters deemed relevant. Thus, the definition through an energy balance target can include both project-intrinsic and project-extrinsic factors. On the one hand, this is an additional challenge, but at the same time it is an opportunity: With this, dynamic external requirements can be related to project-specific proposed solutions.
This might be surprising as it seems to contradict the prevailing understanding of a hard-set target of “greater than zero”. But it can be argued that targets can be reformulated as context factors and as such be included as virtual demands and supplies in a still formally positive balance. In fact, many current definitions already use some form of virtual demands and supplies to modulate the balance feasibility. Most notably, NOT including certain energy services in the balance such as mobility and embodied energy is equivalent to instead including a virtual supply of equal size from somewhere to offset its demand. The goal of this paper is to provide a formalism in which this somewhere can be defined more transparently and uniformly.
3. Goals of the PED Definition
The PED definition cannot be separated from its goals and implications in practice. The presented definition’s goal is: to be achievable, yet sufficiently ambitious to be compatible with Paris 2050 for any urban and rural Austrian district typology. This is in line with the EU Commission’s statement that the ambition of PEDs is to “go well beyond what is already requested in the Energy Performance of Buildings Directive” [25], but also aims at the sufficiency question as well. The definition development of the approach was therefore done under these guiding objectives:
- The PED definition contains all relevant features of a future 100% renewable energy system. Such PEDs anticipate future requirements by the precautionary principle and must take into consideration its future surroundings
- The PED definition is achievable in both rural and urban contexts, or areas of low and high building density (technically, legally and economically). Lower densities should not be implicitly favored by the PED definition
- The PED definition is achievable for different types of usage mixes with comparable ambition, not just for uses with low energy demand or good temporal alignment between supply and demand.
- The PED definition achievability is not dependent on incidental, but uncommon availability of local renewables such as local (industrial) waste heat, hydro or wind power.
- The PED definition is linking the national climate goals (i.e., a decarbonized future energy supply) with the local targets of a district in a comprehensive quantitative system
- The PED definition is compatible with the definition developed at the European level by the Alignment Task-Force JPI UE Framework Definition [1]
- The PED definition has directional stability and consistency for all process phases: From project development to implementation or monitoring (zoning, architectural competition, planning, execution and operation). This ultimately means a stable definition operationalization and accompanying assessment framework to be part of a nationally accredited standardization and certification scheme.
- The PED definition concept should be flexible and extendable: from operation (PED Alpha) to mobility (PED Beta) to the entire life cycle (PED Omega) and should lend itself for transparent reparameterization in the future.
The goal of this definition is to envisage the PED as part of a future decarbonized energy system and to quantitatively relate the PED balance targets to the achievement of these national and international climate goals. This requires a quantitative method of allocation and effort sharing, which was presented in [26] and will further be detailed in section 4 through 6.
The aim of the definition is to make the flexibility of the district quantifiable such that higher energy flexibility simultaneously has a positive impact on the achievement of the PED balance target. This is important to quantitatively link all three energy dimensions of a PED, i.e., energy efficiency, local renewable generation, and energy flexibility. This also allows different districts to prioritize and realize their respective potentials for achieving the PED definition according to their local circumstances without the need for further definitional additions. This is addressed as part of the balance weighting system in Section 5.
3.1. Non-Goals
The focus of the PED definition design is encapsulating climate neutrality requirements of the built environment through the means of a positive energy balance. Therefore, an explicit design choice is made to not concern the definition with possible additional - albeit important - dimensions and aspects of district development and assessment. Instead the definition should be compatible and work in conjunction with already existing assessment and certification systems that consider these aspects. Also missing in this definition are criteria and specifications for the district development and planning process, as different stakeholders and ownership structures (such as new construction versus existing) and spatial and urban planning organization require different planning processes. Prescribing a specific process or awarding points complicates and distracts from the main design goals of this PED definition. Instead, districts can use dedicated systems for this such as the Austrian klima:aktiv standard for districts and neighborhoods [27], LEED [28] or BREEAM [29].
Another non-issue is the definition of important aspects of social, economic and environmental dimension: This is not to say that these aspects of district development such as social inclusion, safety and comfort, community development and the creation of a sustainable ecosystem are not equally, if not more important than the energy assessment. But they should be better covered by assessment and certification systems focused on them and complementary to achieving the PED definition. Such as Total Quality Building (TQB), klima:aktiv [30], local requirements of subsidized housing, and other regulatory and legal instruments [31].
This approach also foregoes the definition of minimum or sufficiency criteria for individual aspects such as energy efficiency, renewable production, flexibility: Because districts have very diverse typologies, the definition of accurate individual criteria is correspondingly complex. Sufficiency criteria, e.g. defined in the building code or other standards, are helpful but not necessary in the context of a PED definition: A district should be free to decide how to best use its potentials and how it contributes to climate neutrality. Complementary systems could again be passive house standard [32] and the local building code [33], instruments of zoning and development plans, urban planning framework agreements [34], etc.
4. System Boundaries
System boundaries are considered in a spatial, temporal and functional sense, in accordance to the fundamentals of PED energy modelling described in [11]. The definition of system boundaries is required to enable balancing of flows over these defined boundaries. As such, it is necessary to distinguish and define all three different types:
Spatial means an actual physical boundary of included energy services and supplies. In other approaches this boundary is sometimes used to make “offsite” RES party possible. In the presented approach, the available “offsite RES” is instead addressed as part of every PED’s surrounding in form of a balance-target-adjusting context factor, introduced in section 6 and not subject to spatial boundaries.
Temporal system boundaries can be interpreted as the balancing period and are typically set to one operational year.
Functional system boundaries are used to identify specific energy functions, uses or demands to be included or excluded according to function, rather than spatial proximity. Functional system boundaries can be further differentiated in renewable energy supply within the system boundary, referred to as on-site, and energy services to be accounted for in the balance. Note that “on-site” here does not necessarily mean spatially on-site but rather “within the system boundary”, counting positively towards the energy balance.
The functional system boundaries and the included energy services can be roughly grouped into three regimes of increased responsibility: 1) Operational energy and user electricity, 2) Mobility and 3) Embodied energy and emissions. This approach defines three variants, or shells: From PED Alpha in the innermost part to consider only the operating energy, over PED Beta including private everyday mobility up to PED Omega in the outermost part, where also embodied energy of district construction, maintenance, repair and mobility are considered: The three system boundaries reflect three areas of quantitative assessment: Operation, Mobility induced by the location and Embodied Energy respectively. Each is associated with increasing effort and greater uncertainty than the last. The expandability of the system boundary is important because, on the one hand, different data and information are available in the course of the project and, on the other hand, there are already partly considerable differences between projects in the available data and the objectives. At the same time, appropriate data are necessary for simulation and verification. The system boundaries are illustrated in Figure 3 and are detailed in the following subsections.
4.1. Functional System Boundary: Considered Energy Services
The definition considers all energy demand for building operation, DHW, lighting and building services as well as the energy demand for living, working and services (e.g. appliances, computers). Process energy is not considered directly, but indirectly through crediting of national surpluses or deficits. Everyday individual mobility and embodied energy are also included in their respective boundary, as is listed in Table 1.
4.2. Spatial System Boundary
The spatial system boundary coincides with the physical district boundary. All definition components refer to the area that is necessary for the full use of the district. A "Gerrymandering" of the spatial boundaries for targeted inclusion or exclusion for energy and emission balance reasons must be avoided. District boundaries should be as convex as possible and as concave as necessary. Within these spatial boundaries, all local renewable energy sources are permissible regardless of the conversion technology and can be used to cover the energy balance as long as the assumption holds that its use within the district does not limit the usability for areas outside the district. This is particularly important to consider for thermal and electrical use of flowing water for cooling and small hydropower. Further than that it does not seem practical to generalize the validity and shape: The spatial system boundary should be drawn in such a way that the immediately surrounding areas do not suffer any obvious disadvantage from becoming PEDs themselves.
5. Balance Weighting System
The weighting and the associated evaluation of energy flows is a central and controversially discussed topic of the PED definition. For this approach, the focus is less on the physical self-sufficiency or autonomy of the district and more on the assessment of the district's contribution to the climate neutrality of the overarching national energy system. Specific weighting objectives are:
- Linking to planning practice and existing literature: Use of total primary energy and GHG emissions by means of conversion factors from the current building code or, in the case of district heating, county-specific regulations.
- Mapping of seasonal differences: Monthly conversion factors based on Austrian building code [33], feed-in in summer and winter import weighted differently due to their varying grid support.
- Evaluation of energy flexible, grid-serving, i.e. time-sensitive grid use and feed-in: Otherwise unavailable energy in the surrounding system is weighted with conversion factor of Zero.
- Biomass use is possible, but not implicitly preferred due to low conversion factors in the building code: Instead, an average of total and non-renewable primary energy is used. If only the first was used, biomass would mostly be infeasible and if only the latter, biomass systems would easily outperform electricity-based systems.
These goals led to the conversion factors presented in Table A1, which are further discussed in Section 8.

Table 2.
Weighting factors for energy flows over the defined system boundaries.
| Energy Flow | PED Alpha, PED Beta | PED Omega | Source |
|---|---|---|---|
| Uncontrolled grid use and feed-in |
Total Primary energy Monthly conversion feed-in sign-inversed |
CO2-equiv. Monthly conversion feed-in sign-inversed |
National building code [33] |
| Energy-flexible grid use (DSM) | Zero | Zero | Section 5.1 |
| Biomass | 100% renewable + 50% non-renewable primary energy | CO2- equiv. | |
| Other Energy Carriers | Total Primary energy | CO2-equiv. | National building code [33] |
| Fuels (Mobility) | Total Primary energy | CO2-equiv. |
5.1. Energy-Flexible Grid Use (DSM)
The PED definition aims to assess a district’s capabilities for energy-flexible and grid-serving operation through a corresponding weighting in the energy balance itself, instead of using a separate KPI for it. The advantage is that the three core qualities of the PED - energy efficiency, local renewable generation and energy flexibility - can be assessed with a single indicator: the energy balance. This also allows for different districts and contexts to set priorities accordingly. Indicators such as the Grid Support Coefficient [35] or the Smart Readiness Indicator[36,37,38] can enable a more differentiated assessment of energy flexibility and grid serviceability. At the same time, however, they increase the complexity of modelling and verification. We try to avoid the use of multiple indicators to assess the PED dimensions as multiple indicators with sufficiency character, i.e. with target values - would limit the solution space of PEDs. The use of several indicators to be maximized in parallel is also not in line with this approach’s objectives: namely to use a comparable, yet differently achievable single target of the energy balance that allows a statement about the sufficient contribution of the district to the climate neutrality of the Austrian energy system.
As such, a distinction is made between generally available regional renewables and situational RES, useable only by an appropriately energy-flexible district - i.e., the energy flexibility provided by the district. The former is considered by a corresponding allocation of the total regionally available renewables for the district depending on the remaining energy system, as shown in section 6. The latter are accounted for by weighting with a primary energy conversion factor of zero in the balance, but are subject to operational constraints: Particularly in dense urban environments, there is a discussion whether it is sensible to generate all the required energy of a particular system boundary within the district itself. Conversely, rural areas often have a surplus of renewables in the form of large wind and hydropower plants. This raises the question of how these "regionally available renewables" can be used and accounted for elsewhere, such as in a specific district. Different approaches could apply: The use of virtual system boundaries, which allows a form of offsetting (e.g. through acquisition of credits), or the distribution of the energy to districts through a provisioning quota (i.e. per inhabitant or floor area) or direct contracting with operators of external RE plants.
All considerations ultimately lead to an allocation problem that should be openly addressed, taking also the other components of the surrounding energy system into account as well. Regionally available RES must also be regionally balanced and generally available to all energy needs of the region according to an allocation, in order to prevent individual parts from overusing the available resources and leaving a more difficult situation for the rest. The use of what is generally available must be divided between the sectoral needs of industry and agriculture, mobility and buildings through appropriate effort sharing. This has to happen on a superordinate level. The allocation described in section 6.2 for example results in a quantifiable provisioning of available RES that can be allocated to each district according to its created usable space.
It is important to note that in this approach, no a-priori allocation of external regional renewable energies is required for the building sector - and thus especially not for PEDs. This means that by and large the building sector is responsible for its own renewable energy supply by use of decentralized generation (e.g. PV, Solar Thermal, etc.). This is because other sectors such as industry and public transport.
The situation is different for renewable electricity, which could not be integrated at all without corresponding strategies and regulations: Enabling this integration is a key goal of energy flexibility PEDs and is therefore treated differently in terms of methodology in principle. For a 100% renewable Austria, expansion rates of wind power by a factor of 5 and PV by a factor of 20 are needed, depending on the scenario, which means that strong seasonal fluctuations have to be compensated.
How can this energy flexibility be provided? The physical principles presented in IEA EBC Annex 67 on energy-flexible buildings [39] (p.67) apply: In particular, the thermal storage masses of buildings and districts, with good thermal insulation and heavy building components, can lead to significant displacement periods of several days, during which the system can freely choose the timing of its energy use for heating and cooling [40]. The principle is schematically summarized in the following illustration:
Figure 4.
Example illustration of flexible DSM in a PED to maximize RES utilization. The DSM operation is included and assessed in the energy balance by lowering the associated weighting of energy import during times of regionally available surpluses.
Figure 4.
Example illustration of flexible DSM in a PED to maximize RES utilization. The DSM operation is included and assessed in the energy balance by lowering the associated weighting of energy import during times of regionally available surpluses.

6. Balance Targets (Are Reversed Context Factors)
By now it has become apparent, that the typically assumed target of the energy balance to be positive, or above zero, needs further clarification; and as pointed above also justification. By rephrasing balance targets as contextual factors in a strictly positive balance, the targets can be parametrized to reflect any desired context. The balance target value becomes a target function: A key feature of the PED definition approach is that the target value is a variable quantity and does not have to be positive per se. A variable target value for the balance across the system boundary can be considered as a virtual credit for the district balance: The quantitative target value is equivalent to an external credit/debit of opposite sign:
Primary Energy Balance = Weighted Exports – Weighted Imports > Balance target
Figure 5 is illustrating and comparing this approach with context factors with a situation, where the feasibility of the PED balance is accomplished by other means. It is an important consequence of this definition that any balance definition can be mapped to any other with an appropriate context factor. In other words: Any inclusion or exclusion of energy services in the energy balance can be realized with the inclusion of an appropriate context factor. This can be leveraged to shift the discussion of system boundaries to a discussion of targets and appropriate context factors, which can offset balance components.
Using this paradigm, a quantitative PED definition can be designed with a positive balance target using the context factors for the appropriate system boundaries depicted in Table 3. The inclusion of these ultimately virtual factors in the balance could be designed in an arbitrary number of ways. Their use must be rooted in its comprehensibility and link to the definition goals, which is examined in the following subsections. that can be quantified.
6.1. PED Alpha Context:Density & the Feasibility for PED Districts in Urban Contexts
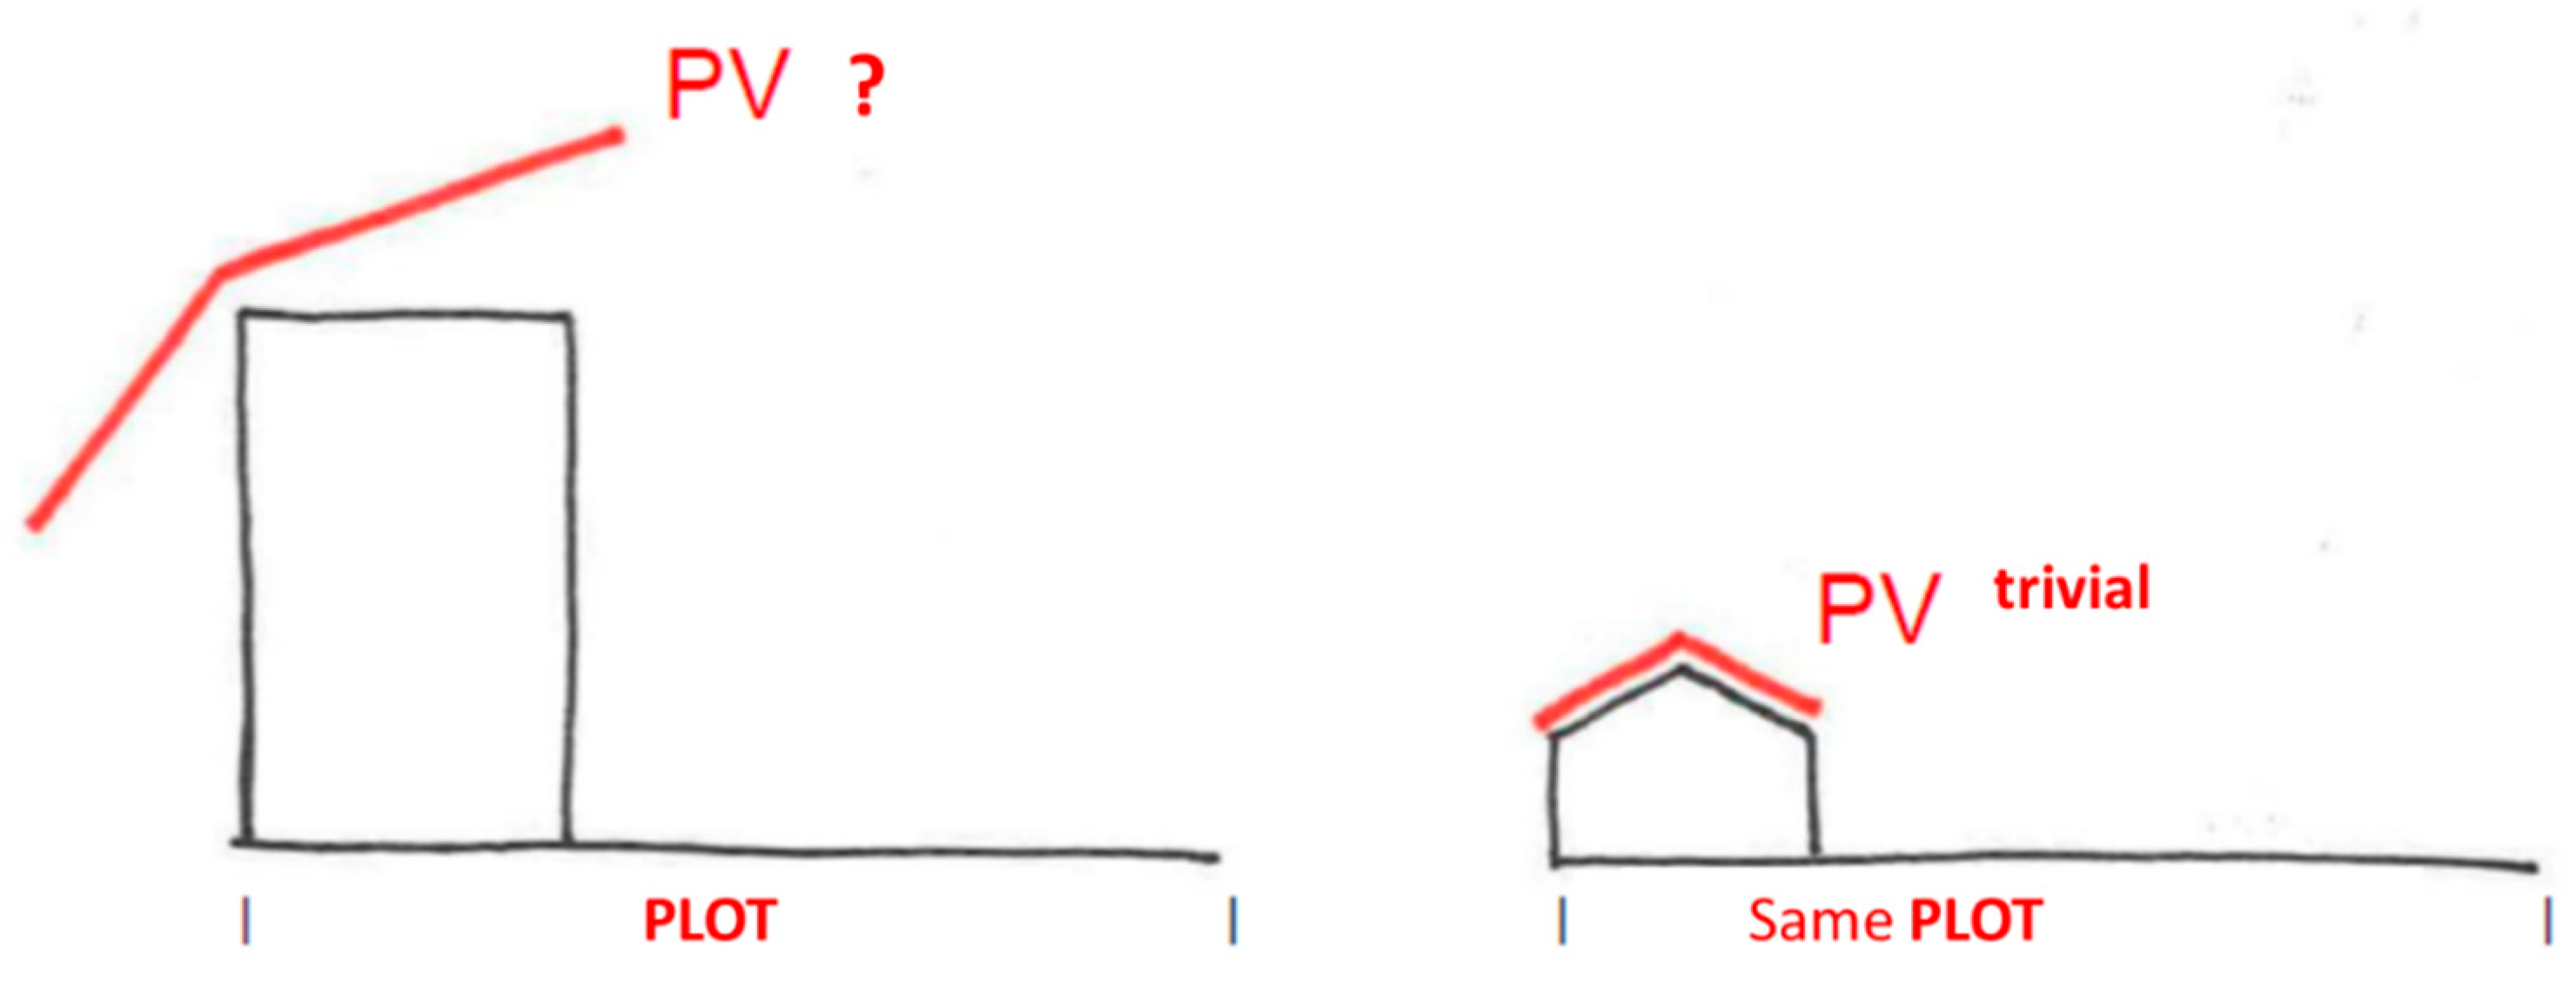
One of the main results of preliminary projects was to link the target value of the energy balance of a sustainable district to its building density - expressed by the floor area ratio (FAR). The approach was motivated by the observation that the energy balance depends significantly on the floor area ratio (FAR), i.e., the ratio between gross floor area (GFA) and plot size. This is because the energy demand correlates mostly with GFA, but the potential for local renewable energy generation is generally proportional to the size of the plot [15]. The relationship between district density and resulting energy balance is both empirically evident [41], and analytically derivable. A definition that is to be equally achievable in an urban context must therefore take this into account and refrain from a static target value. There are two aspects to consider here: First, this is simply a consequence of the physical facts, as detailed in [15,31,42]. However, there is a second point: in principle, the PED concept should not be opinionated about when and where it can be achievable and how easily. This is ultimately a political design question that can only be answered by quantitatively embedding the definition in the appropriate political context:
For Austria, this context is that the available building land reserves have been declining sharply and subsequently land use conflicts will become ever more prevalent due to geographic constraints [43]. Therefore, efficient land use is a recurring political topic in recent years and has been called for with good reason. In Austria, therefore, special care must be taken to ensure that a PED definition does not encourage inefficient land use by making it easier to achieve in lower densities. The following graph shows the relationship graphically: The development on the left creates more usable space on the same lot, requires less infrastructure per person but would require infeasible amounts of PV (as the only commonly available source of local renewable electricity).
Figure 6.
Illustration of the physical difference between high- and low-density districts in balancing their high and low energy use respectively with onsite renewables (represented by required PV area). As plot area correlates with onsite RES potential, but energy use intensity correlates mostly with used floor area, the achievable energy balance is a function of the ratio of the two (Floor Area Ratio = Floor over Plot area).
A 2021 study on the PED potential of urban typologies in Vienna, Austria, found that only detached housing districts can achieve a positive annual energy balance (for heat and power) of 110%, whereas more dense typologies fail to achieve the criteria with an annual balance ranking between 61% and 97% [42].
Figure 7 shows example energy balances of a number of districts in Austria, that also show the impact of the building density on the spread of the primary energy balance of districts: The vertical spread is caused by the different variants of a district (of constant density). From conventional variants without local renewable generation and efficiency measures at the lower end of the spectrum to "maximum" variants at the upper end, which feature highly efficient thermal hulls and HVAC systems with heat pumps for low temperature heating and cooling and DHW heating, and consider energy flexible DSM and the maximum technical PV potential. The latter was determined on a project-specific basis, which inhibits a direct comparison between the maximum and minimum district variant. However, the representation of all analysed district variants as one point on this FAR-to-PE balance diagram shows the connection with the building density and the target value derived from it.
This correlation was also reported in similar studies [41] and comes as no surprise: The empirical relation between density and the possible PED balance can be also derived analytically: Based on a balance of energy demand and local renewable generation, the dependency on building density (FAR) is derived as follows:
with the onsite renewable energy supply (RES) and the local energy demand (ED), which both can be expressed as a product of the specific supply and demand per reference area ( per available plot area and per useable floor area. Division of the entire equation with the useable floor area changes the balance from absolute to floor-area-specific (kWh/m²NFA), and reveals the analytical dependency on the floor area ratio, as it is defined as FAR=Floor Area/Plot Area:
Since the two parameters of the balance function and are conceptual variables, a scientifically deterministic determination is not expedient. Instead, they are considered as control variables for the effort sharing between sparsely and densely built-up districts. They are determined politically within the framework of technical and economic feasibility according to the provision principle. For operational purposes, the formula for the density context factor was extended to include a cutoff and an offset in the x-axis (dx):
A comparison with Table 5 and Figure 8 shows that the factors were parameterized with approx.
It is important to note that the parameterization is not a quantitative representation of the technical potential of a district as a function of the FAR. In fact, the parameterization is motivated by the technical potential, but the level of the factors is significantly lower than the actual technical potential and demand. Their level is derived from the resulting Effort-sharing that results in the Austrian building sector. It is important to keep this in mind: The parameterization of the PED Alpha target through an equivalent context factor for “density” only operationalizes a small part of the technical potential difference. As a result, in the comparison of possible district configurations, some project variants are able to exceed the target value - sometimes significantly. These are mostly variants with technically but not economic feasibility.
The parameterization is carried out along the steps outlined in Figure 8: The target of the building sector is determined from the top-down consideration of the 100% renewable energy scenario Austria 2040 and the distribution according to the balance sheet allocation of generation and demand sectors presented at the beginning. With the assumption of the following refurbishment rates and classes, this results in the following parameterization across all FARs of the building sector:
As a next step, the share of PEDs in the building sector and the other district typologies are classified and their performance estimated depending on density, as is shown in Table 5. Note that this is a first approximation and can and should be detailed as necessary to reflect the desired context.
Table 4.
Assumption on the surrounding energy system.
| Source | ||
| Electricity demand of the building sector 2040 for operation and MIT after sectoral allocation | 137,6 PJ/a | [26] based on [44] |
| Technical potential of the building sector 2030 | 48,24 PJ/a | [45] |
| Allocation scenario | ||
| Photovoltaics target 2040 (allocation to buildings) | 114,8 PJ/a | [26] based on [44] |
| Electricity balance target of the building sector | -22,7 PJ/a |
Figure 9 shows the size and distribution of the defined district typologies depending on their density and their respective energy balance target. This allocation can be tweaked to reflect other scenarios of building sector performance in a future energy system by changing the balance target of -22,7 PJ/a. It can also serve as grounds for discussion as to the relative performance and effort sharing of different parts of the building stock.
6.2. PED Beta Context: Mobility and the Surrounding Energy System
Nationally and internationally, there are conflicting opinions as to whether and in what form mobility should be included as an energy service in the system boundary of a PED. The main arguments are listed in the following Table 6:
The PED Beta system boundary is an attempt to expand the PED definition to include everyday mobility in the sense of the above-mentioned arguments without decreasing feasibility of reaching a positive balance outright. For this purpose, the following approach was developed, which can be applied to all districts and neighborhoods in Austria at the beginning of project development without significant effort: Specifically, this is done by considering two additional components in the primary energy balance:
- The mobility energy demand induced by individual motorized mobility of the district as a statistical approximation. This is operationalized to depend on the public transport connection of the location, as well as the mix of uses in the district, which results in a district-specific mobility profile and the associated energy demand.
- A project extrinsic mobility energy budget, or context factor, from the surrounding renewable energy system, derived as the surplus from regional renewable supply, which is allocated to the district via its share of useable floor space in the building sector.
Together with the density context factor of PEQ Alpha, PEQ Beta thus fulfils a key requirement of this PED definition approach: the link to the surrounding renewable energy system and the mapping of effort sharing within Austria's building sector with the assessment target of a PED’s energy balance.
Derivation of the Mobility Context Factor of a PED
The integration of everyday mobility into the PED balance impedes its positivity potential, unless there is a form of offsetting that does not have to be created directly at the site. We again propose to design a virtual context factor to fulfil this role. But what mobility offsetting budget can be allocated to every district? We try to answer by looking at the district in the context of the Austrian national energy system "top-down": Assuming, according to current legislation and political aims, that Austria will be 100% renewable in 2040, a sectoral budget can be identified for projected energy supply and consumers that can be used PER PERSON to cover private everyday mobility. The following figure illustrates the national allocation as modelled in [26]:
The surplus (or deficit) from large-scale renewable power plants is allocated to the entire resident population. In Austria, most scenarios of future 100% renewable energy supply result in a surplus from central power plants and thus a bonus for the individual districts. In other systems, there may just as well be a deficit, making the increased use of decentralized RES plants necessary to account also for more of its mobility energy demands. Assuming that these are also equally distributed to the building sector, this results in an additional malus, or negative context factor. A PED Beta must then not only cover its local individual everyday mobility, but also support the surrounding energy system with an additional local renewable surplus. But the allocation illustrated in Figure 9 results in an electricity surplus from the regional "central large-scale power plants" of 6.3 TWh EE/a and a surplus from biomass of 0.36 TWhEE/a, or a total primary energy surplus of 10.7 TWhPE/a for use for MIV in the built environment.
Table 7.
Central surplus as budget to cover private everyday mobility in Austria per person.
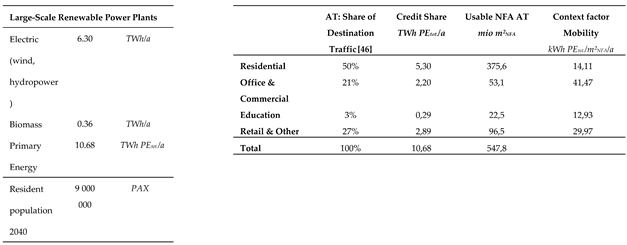 |
This surplus is distributed to all settlement and district areas in Austria on a pro rata basis according to the Austrian average share of this use in destination traffic: Thus, about 50% of all Austrians' journeys home are for residential use. Accordingly, these journeys receive a 50% share of the total credit.
At the same time, the energy demand of motorized individual mobility must be determined by means of an Austria-wide statistical allocation of usable areas to inhabitants and their average annual trip kilometers, as outlined in [27,46] and shown in Figure 10 for a range from hundred percent EV use in blue to hundred percent fossil vehicles in gray. It shows that on average the credit – or mobility context factor – in red is not sufficient to cover the energy demand of private everyday mobility for most locations in Austria. In general, PED Beta is thus more difficult to achieve than PED Alpha and more ambitious. In particular, however, the energy demand depends on the remaining share of private transport via the location-dependent public transport quality and can deviate by up to 50% upwards and downwards from the Austrian mean value. This allocation has the effect that in "rural" areas with poor public transport accessibility, the target value is more difficult to achieve than in "urban" areas with higher public transport density.
6.3. Context: Emission Budgets and Embodied Emission Context
The PED Omega system boundary represents the final shell of this methodology. It aims to enable to balance the entire climate change-related environmental impacts of a district and make them comparable with a target value or context sensitive budget. This enables a statement on whether the district is compatible with the demands of a future climate-friendly, emission-neutral society or to which extent it would require further measures and possibly retrofitting down the line. Despite, or precisely because of the methodological complexity, it is now more necessary than ever to start with the quantitative linking of (inter)national and individual climate goals of each person and to locate them and make them visible where there is also concrete scope for action for this - as in the case of district planning - and where it is possible to set the course for achieving the 2040 climate goals. The context factor or credit for PED Omega is made up of three parts: Firstly, a basic personal credit that represents the emission target of 800 kg CO2equiv/Pers/a, which represents the share that is allocated for the operation of the building and its production and repair. In addition, there are two credits, which are calculated analogously to the first two system boundaries PED Alpha and PED Beta and result from a conversion of the primary energy credits for building density and a mobility budget into GHG emission equivalents. Since the parametrization
7. Definition Application Examples
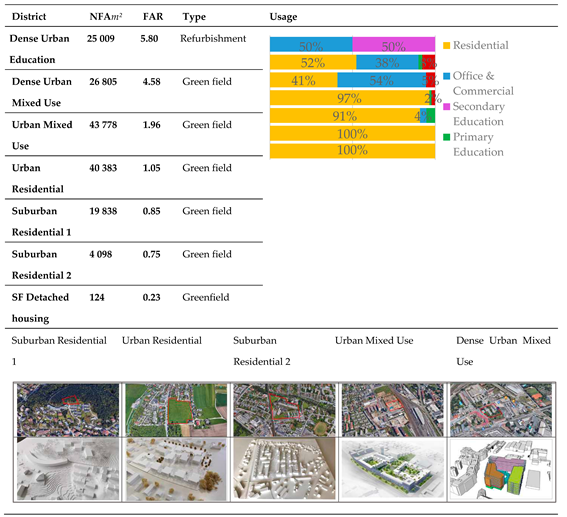
This section gives a brief overview of example assessments of seven different Austrian district typologies. As shown in Table 9, these districts represent different usage patterns and cover a wide range of different densities from suburban and rural detached single family homes to dense urban typologies of different uses with up to seven storeys. The definition was designed to be feasible for all typologies with extensive additional measures of onsite RES, energy flexible operation and partial electrification and reduction of private motorized mobility. The resulting energy balances are shown in Figure 11. Note how the positivity of the project balance without Context Factors correlates with density: Higher FAR districts cannot achieve a positive balance even with most ambitious measures, whereas districts of lower density could (over)achieve a positive balance, the lower the density the easier without ambitious measures.
Table 8.
Overview of example districts.
 |
8. Discussion
Context Factors Compared to Other Offsetting Mechanisms Such as RES Credits
The main difference is not in its effect but rather in its conceptual perspective and its resulting comparability. A context factor is just a framework to include an arbitrary design goal into the quantitative definition and formulate it as explicitly as possible. In fact, practically anything can be mapped into a context function and as such included in a given quantitative framework. Arguably, “context function” might be a more appropriate term, as it almost always is also dependent on project internal and external variables.
This may even proof useful for the comparison of different quantitative definitions themselves. The resulting balance for a district under a certain assessment can be reinterpreted as its own context function and compared. With enough such PED balance assessments, it could even be useful to compare the effects of different system boundaries and weighting systems in this manner. This also means that, in contrast to e.g. [5] (p.13), we see the framework of context factors capable of flexibly encapsulating enough contexts of different districts, so that the other parts of the balance definition, i.e. the system boundaries and weighting systems, can omit their current task of modulating feasibility and instead be defined uniformly and comparatively.
Why Is the Context Factor for Mobility Allocated per Usable NFA and Not per Person?
The advantage of this approach is that neither the resulting credit nor the mobility energy demand induced by the district depend on the actual occupancy density and number of users in the district. The approach is therefore more uniform and not dependent on the actual density of people in the district, which proofs difficult to determine in practice.
Why Is Mobility Only Taken to Include Individual Motorized Mobility?
A guiding principle of the PED definition is that of subsidiarity, according to which the smallest possible unit in a system should have the greatest possible autonomy in dealing with tasks. A district can affect individual forms of mobility through its location, design and measures, which is why it should be made partly responsible in the context of PED definition. Public transport, on the other hand, is a superordinate mode of transport that primarily serves to connect districts with each other and with other means of transport. The accessibility of a district or settlement can strongly depend on the available public transport infrastructure; conversely, district developers cannot necessarily, and actually only in exceptional cases, influence the design of public transport. Moreover, more energy-intensive infrastructure is necessary for public transport, which also serves the general public beyond the district. For these reasons, the energy and emission provisions for public transport should be situated at a higher than district level. These provisions could in turn be allocated to the district, which then gives rise to non-trivial question of the allocation method, which is even more complex for public transport than for individual everyday mobility, because the occupancy density and the allocation of trips to floor usage is less clear.
The district development timeline also plays a crucial role here, as district projects and their development with public transport do not always take place at the same time and in accordance with the initial plan.
Consideration of Delivery and Other Occupational Traffic
Delivery and occupational traffic can be considered, given an appropriate dataset, which was not available in this definition. Namely, if the underlying annual transport survey includes occupational and delivery journeys differentiated by targeted space use, i.e. home deliveries and occupational deliveries. But again, inclusion will likely only serve this PED definition design goals, if district measures can be quantified and linked to a derivative target from the surrounding.
Non-Everyday Mobility and Air Traffic
This is excluded from consideration for similar reasons: There is no methodology to assess the effect of district locations and measures on non-commonplace mobility. On top of that, it is predominantly influenced by individual lifestyles and not clear if and how energy and emission targets can be derived here.
Hourly Weighting of Energy Flows
Instead of monthly weighting, which improves the accuracy compared to annual primary energy conversion factors, it is considered to use hourly conversion factors. Providers such as ElectricityMap [47] already provide both historical and real-time data for emission intensities. Conversion to primary energy content is in principle possible, but has not yet been standardized. In addition, forecasts of hourly PE and GHG intensities are of particular interest in the case of corresponding demand and generation developments.
Timeframe: Current, Future or Cumulative?
Based on the difference in primary energy conversion today and in the future, the question of different observation periods arises. What statements and consequences do these different considerations and standards have on the measures and projects derived from them? What are the advantages and disadvantages and how can they be combined? In view of the advancing climate catastrophe, not only the statistically annual but also the cumulative consideration of emissions up to 2040, taking into account the time of emission, is relevant, even if this would pose additional challenges for operationalization.
Existing Districts and Refurbishment
The renovation sector was largely excluded from the analysis, although it will of course play the most important role in the coming years. In principle, the definition and operationalization presented here can also be applied to refurbishment of existing buildings and, as initial studies show, can sometimes be achieved. However, it is clear that especially the PED Alpha system boundary with the relatively high implicit requirements for energy efficiency and local renewable energy production will not be easily - if at all - achievable for all existing quarters. Here, apart from the building density, the credit must also be examined and, if necessary, parameterized depending on additional parameters such as the building age or the settlement typology.
Although the presented definition can be used for both green and brown field development, there currently is no specific context factor considering potentially lower balance feasibility for refurbishments. As the first two boundaries Alpha and Beta do not include embodied emissions, they are easier to achieve for green field developments, whereas the opposite is true for brown field and refurbishments, where the embodied emissions due to materials is lower and thus favors the last definition Omega. It is unclear as of yet, if this distinction is sufficient in theory and practice, as the sample size of refurbishment PEDs is still small and only now expected to expand with the investigation of the second round of JPI UE PED projects.
9. Conclusions
PED definition must be understood as a design problem and cannot be detached from the goals and aims to be furthered by it. Indeed, it is only these goals and aims that make any definition useful. The positive energy balance is the unique feature of the PED concept, and with these three design choices on boundaries, weighting and targeting, can be used to define PEDs and assess the three pillars of energy efficiency, flexibility and onsite renewables with a single indicator. Crucially, the inclusion of dynamic balance targets allows a comprehensive link between balance assessment and definition goals.
To this end, this paper introduced a theoretical framework of PED definition through quantitative energy balance that can be unified while still leaving room for contextual targeting. With this framework it is possible to contextualize PED balance assessments on different frames of regionality, from international to municipal, rendering incomparable project-specific contextualization redundant.
This paper shows that setting PED balance targets is analogous to quantifying context impacts. This allows for a formalization of PED contexts and can improve comparability between projects and other quantitative balance definitions. This can be done by deriving their implicit context factor from example PEDs achieving differently defined energy balances. This general framework was used to construct three distinct PED definitions that are needed for PED planning and certification practice in Austria: PED Alpha for operation and use, PED Beta for included private mobility and PED Omega for embodied emissions from construction and mobility.
The effects of this PED definition design were exemplified by seven district assessments that show its feasibility in various green field contexts: The use of a context factor for density allows both district typologies of very high (FAR > 3) and low (FAR < 1) density to achieve a positive energy balance for operation with comparable ambition for energy efficiency, energy flexibility and onsite renewable generation measures. Furthermore, the use of a context factor for mobility derived as a credit from the surrounding energy system allocated by useable floor area can be used to offset the energy demand induced by including individual motorized mobility in the energy balance. With this it is feasible for both urban and rural districts and neighborhoods to achieve a positive energy balance with again similar ambition in terms of reduced motorized mobility demand and switch to electric vehicles.
Author Contributions
Conceptualization, S.S, methodology, S.S, T.Z.; validation, S.S., D.S and T.Z.; investigation, S.S.; resources, S.S. and D.S.; writing—original draft preparation, S.S.; writing—review and editing, J.B.; supervision, J.B. All authors have read and agreed to the published version of the manuscript
Funding
This research was partly funded by the Austrian Research Promotion Agency (FFG) research project “Future District Austria” (german) (online accessed 31.3.23: https://nachhaltigwirtschaften.at/de/sdz/projekte/zukunftsquartier-oesterreich.php).
Conflicts of Interest
The authors declare no conflict of interest.
Appendix A
Table A1.
Grid electricity conversion factors.
| Primary Energy | GHG-Emissions | ||
| Month | kWh/kWh | kgCO2eq./kWh | |
| January | 1.80 | 0.304 | |
| February | 1.79 | 0.304 | |
| March | 1.72 | 0.264 | |
| April | 1.58 | 0.211 | |
| May | 1.47 | 0.167 | |
| June | 1.46 | 0.163 | |
| July | 1.44 | 0.163 | |
| August | 1.48 | 0.167 | |
| September | 1.58 | 0.208 | |
| October | 1.71 | 0.260 | |
| November | 1.77 | 0.282 | |
| December | 1.79 | 0.291 | |
| Average | 1.63 | 0.231 | |
References
- JPI Urban Europe / SET Plan Action 3.2 White Paper on PED Reference Framework for Positive Energy Districts and Neighbourhood; 2020.
- Hedman, Å.; Rehman, H.U.; Gabaldón, A.; Bisello, A.; Albert-Seifried, V.; Zhang, X.; Guarino, F.; Grynning, S.; Eicker, U.; Neumann, H.-M.; et al. IEA EBC Annex83 Positive Energy Districts. Buildings 2021, 11, 130. [Google Scholar] [CrossRef]
- Gabaldón Moreno, A.; Vélez, F.; Alpagut, B.; Hernández, P.; Sanz Montalvillo, C. How to Achieve Positive Energy Districts for Sustainable Cities: A Proposed Calculation Methodology. Sustainability 2021, 13, 710. [Google Scholar] [CrossRef]
- Shnapp, S.; Paci, D.; Bertoldi, P. Enabling Positive Energy Districts across Europe: Energy Efficiency Couples Renewable Energy. 2020.
- Williams, K.; Heller, R.; Wees, M. van; Vastenhout, T. Assessing the Performance of Positive Energy Districts: The Need for Innovative Methods. IOP Conf. Ser.: Earth Environ. Sci. 2022, 1085, 012014. [Google Scholar] [CrossRef]
- Casamassima, L.; Bottecchia, L.; Bruck, A.; Kranzl, L.; Haas, R. Economic, Social, and Environmental Aspects of Positive Energy Districts—A Review. Wiley Interdisciplinary Reviews: Energy and Environment 2022, e452.
- Derkenbaeva, E.; Halleck Vega, S.; Hofstede, G.J.; van Leeuwen, E. Positive Energy Districts: Mainstreaming Energy Transition in Urban Areas. Renewable and Sustainable Energy Reviews 2022, 153, 111782. [Google Scholar] [CrossRef]
- Wiik, M.K.; Mamo Fufa; Krogstie, J.; Ahlers, D.; Wyckmans, A.; Driscoll, P.; Brattebø, H.; Gustavsen, A. ZERO EMISSION NEIGHBOURHOODS IN SMART CITIES Definition, Key Performance Indicators and Assessment Criteria: Version 1.0. Bilingual Version. 2018. 2018. [CrossRef]
- Salom, J.; Tamm, M. D3.1 METHODOLOGY FRAMEWORK FOR PLUS ENERGY BUILDINGS AND NEIGHBOURHOODS; WP3 Technology Integration in Smart Managed Plus Energy Buildings and Neighbourhoods; 2020.
- Koutra, S.; Becue, V.; Gallas, M.-A.; Ioakimidis, C.S. Towards the Development of a Net-Zero Energy District Evaluation Approach: A Review of Sustainable Approaches and Assessment Tools. Sustainable Cities and Society 2018, 39, 784–800. [Google Scholar] [CrossRef]
- Bottecchia, L.; Gabaldón, A.; Castillo-Calzadilla, T.; Soutullo, S.; Ranjbar, S.; Eicker, U. Fundamentals of Energy Modelling for Positive Energy Districts. In Proceedings of the Sustainability in Energy and Buildings 2021; Littlewood, J.R., Howlett, R.J., Jain, L.C., Eds.; Springer Nature: Singapore, 2022; pp. 435–445. [Google Scholar]
- Hedman, Å.; Rehman, H.U.; Gabaldón, A.; Bisello, A.; Albert-Seifried, V.; Zhang, X.; Guarino, F.; Grynning, S.; Eicker, U.; Neumann, H.-M.; et al. IEA EBC Annex83 Positive Energy Districts. Buildings 2021, 11, 130. [Google Scholar] [CrossRef]
- U. Nyffenegger Leitfaden Plusenergie-Quartier. 2018.
- Ala-Juusela, M.; Pozza, C.; Salom, J.; Luque Segura, I.; Tuerk, A.; Lollini, R.; Gaitani, N.; Belleri, A. Workshop on Positive Energy Buildings—Definition. In Proceedings of the The 9th Annual Edition of Sustainable Places (SP 2021); MDPI, December 2 2021; p. 26.
- Schöfmann, P.; Zelger, T.; Bartlmä, N.; Schneider, S.; Leibold, J.; Bell, D. Zukunftsquartier - Path to positive energy districts in Vienna; Reports form Energy and Environmental Research (german) Vienna, 2020; p. 203.
- Wiik, M.K.; Fufa, S.M.; Andresen, I.; Brattebø, H.; Gustavsen, A. A Norwegian Zero Emission Neighbourhood (ZEN) Definition and a ZEN Key Performance Indicator (KPI) Tool. IOP Conf. Ser.: Earth Environ. Sci. 2019, 352, 012030. [CrossRef]
- Albert-Seifried, V.; Murauskaite, L.; Massa, G.; Aelenei, L.; Baer, D.; Krangsås, S.G.; Alpagut, B.; Mutule, A.; Pokorny, N.; Vandevyvere, H. Definitions of Positive Energy Districts: A Review of the Status Quo and Challenges. Sustainability in Energy and Buildings 2021 2022, 493–506. [Google Scholar]
- Hamels, S. CO2 Intensities and Primary Energy Factors in the Future European Electricity System. Energies 2021, 14, 2165. [Google Scholar] [CrossRef]
- Hamels, S.; Himpe, E.; Laverge, J.; Delghust, M.; Brande, K.; Janssens, A.; Albrecht, J. The Use of Primary Energy Factors and CO2 Intensities -- Reviewing the State of Play in Academic Literature; 2021. 2021.
- Latõšov, E.; Volkova, A.; Siirde, A.; Kurnitski, J.; Thalfeldt, M. Primary Energy Factor for District Heating Networks in European Union Member States. Energy Procedia 2017, 116, 69–77. [Google Scholar] [CrossRef]
- Vuarnoz, D.; Jusselme, T. Temporal Variations in the Primary Energy Use and Greenhouse Gas Emissions of Electricity Provided by the Swiss Grid. Energy 2018, 161, 573–582. [Google Scholar] [CrossRef]
- Directive 2010/31/EU of the European Parliament and of the Council of 19 May 2010 on the Energy Performance of Buildings (Recast); 2010; Vol. 153. 19 May.
- Sartori, I.; Napolitano, A.; Voss, K. Net Zero Energy Buildings: A Consistent Definition Framework. Energy and Buildings 2012, 48, 220–232. [Google Scholar] [CrossRef]
- Steemers, K.; Krangsås, S.G.; Ashrafian, T.; Giancola, E.; Konstantinou, T.; Liu, M.; Prebreza, B.; Soutullo, S. Challenges for a Positive Energy District Framework. 2022, 10.
- European Commission FAQ-Work Programme 2018 for Horizon 2020—Smart Cities and Communities—Lighthouse Projects Available online: https://ec.europa.eu/info/funding-tenders/opportunities/docs/cap/h2020/lc-sc3-scc-1-2018-2019-2020/1872640-faq_scc01_(updated)_v10_en.pdf (accessed on 23 August 2021).
- Schneider, S.; Zelger, T.; Klauda, L. Reflections on the question of what share of renewable energy must be provided locally in Austria in 2050 (german); realcorp Conference, Graz, 2020; p. 10.
- O. Mair am Tinkhof, H.S. Guidelines and Target Values for Settlements for the Integral Assessment of the Climate Compatibility of Buildings and Mobility Infrastructure in New Settlements (german); Reports from Energy and Environmental Research; Federal Ministry of Transport, Innovation and Technology , 2017; p. 118;
- LEED Rating System |, U.S. Green Building Council. Available online: https://www.usgbc.org/leed (accessed on 28 March 2023).
- BREEAM - BRE Group. Available online: https://bregroup.com/products/breeam/ (accessed on 28 March 2023).
- klimaaktiv Lifestyle Check. Available online: https://lifestylecheck.klimaaktiv.at (accessed on 10 March 2021).
- Fellner, M.; Zelger, T.; Leibold, J.; Huemer-Kals, V.; Kleboth, A.; Granzow, I.; Storch, A.; Schieder, W.; Fleischhacker, A. Smart City MicroQuarters (german); Reports from energy and environmental research; Vienna, 2018.
- Passivhaus Institut. Available online: https://passiv.de/en/02_informations/02_passive-house-requirements/02_passive-house-requirements.htm (accessed on 28 March 2023).
- Austrian Institute for Building Technology OIB RL6 -Energy Saving and Thermal Insulation (regulation, german); OIB-330.6-026/19; 2019. 2019.
- Zelger, T., Leibold, J., Schneider, S., Holzer, P., Stuckey, D., Drexel, C., Schöfmann, P., Aspern Climatefit. Project Report (german). Vienna, 2020.
- Klein, K.; Langner, R.; Kalz, D.; Herkel, S.; Henning, H.-M. Grid Support Coefficients for Electricity-Based Heating and Cooling and Field Data Analysis of Present-Day Installations in Germany. Applied Energy 2016, 162, 853–867. [Google Scholar] [CrossRef]
- Knotzer, A.; Fechner, J.; Zelger, T.; Berger, A. Smart Readiness Indikator. 2022.
- Märzinger, T.; Österreicher, D. Supporting the Smart Readiness Indicator—A Methodology to Integrate A Quantitative Assessment of the Load Shifting Potential of Smart Buildings. Energies 2019, 12, 1955. [Google Scholar] [CrossRef]
- Verbeke S; Waide P; Bettgenhäuser K; Uslar M; Bogaert S; Support for Setting up a Smart Readiness Indicator for Buildings and Related Impact Assessment - Final Report; Brussels, 2018.
- Knotzer, A.; Weiss, T.; Metzger, A.S.; Kastner, W. IEA Energie in Gebäuden und Kommunen (EBC) Annex 67: Energie-flexible Gebäude. 2019, 76.
- Junker, R.G.; Azar, A.G.; Lopes, R.A.; Lindberg, K.B.; Reynders, G.; Relan, R.; Madsen, H. Characterizing the Energy Flexibility of Buildings and Districts. Applied Energy 2018, 225, 175–182. [Google Scholar] [CrossRef]
- Neumann, H.-M.; Garayo, S.D.; Gaitani, N.; Vettorato, D.; Aelenei, L.; Borsboom, J.; Etminan, G.; Kozlowska, A.; Reda, F.; Rose, J.; et al. Qualitative Assessment Methodology for Positive Energy District Planning Guidelines. 2022, 263, 507–517. [CrossRef]
- Neumann, H.-M.; Hainoun, A.; Stollnberger, R.; Etminan, G.; Schaffler, V. Analysis and Evaluation of the Feasibility of Positive Energy Districts in Selected Urban Typologies in Vienna Using a Bottom-Up District Energy Modelling Approach. Energies 2021, 14, 4449. [Google Scholar] [CrossRef]
- Banko, G.; Weiß, M. Dedicated, Undeveloped Building Land -Evaluation for Austria (german); Federal Environmental Agency: Wien, 2016; p. 61.
- Streicher, W.; Schnitzer, H.; Tatzber, F.; Heimrath, R.; Wetz, I.; Titz, M.; Hausberger, S.; Haas, R.; Kalt, G.; Damm, A.; et al. Energy Autarcy for Austria; 2010.
- Fechner, H. Determination of the area potential for photovoltaic expansion in Austria: Which area categories are of particular importance for development in order to be able to realise the green electricity target; 2020; p. 69;
- Herry Consult Urban Area Parameter AP4&6 Mobilität; 2017.
- Tranberg, B.; Corradi, O.; Lajoie, B.; Gibon, T.; Staffell, I.; Andresen, G.B. Real-Time Carbon Accounting Method for the European Electricity Markets. Energy Strategy Reviews 2019, 26, 100367. [Google Scholar] [CrossRef]
Figure 2.
A PED definition through energy balance assessment can be broken into three distinct design problems: System Boundaries, Weighting System and Balance Target.
Figure 2.
A PED definition through energy balance assessment can be broken into three distinct design problems: System Boundaries, Weighting System and Balance Target.
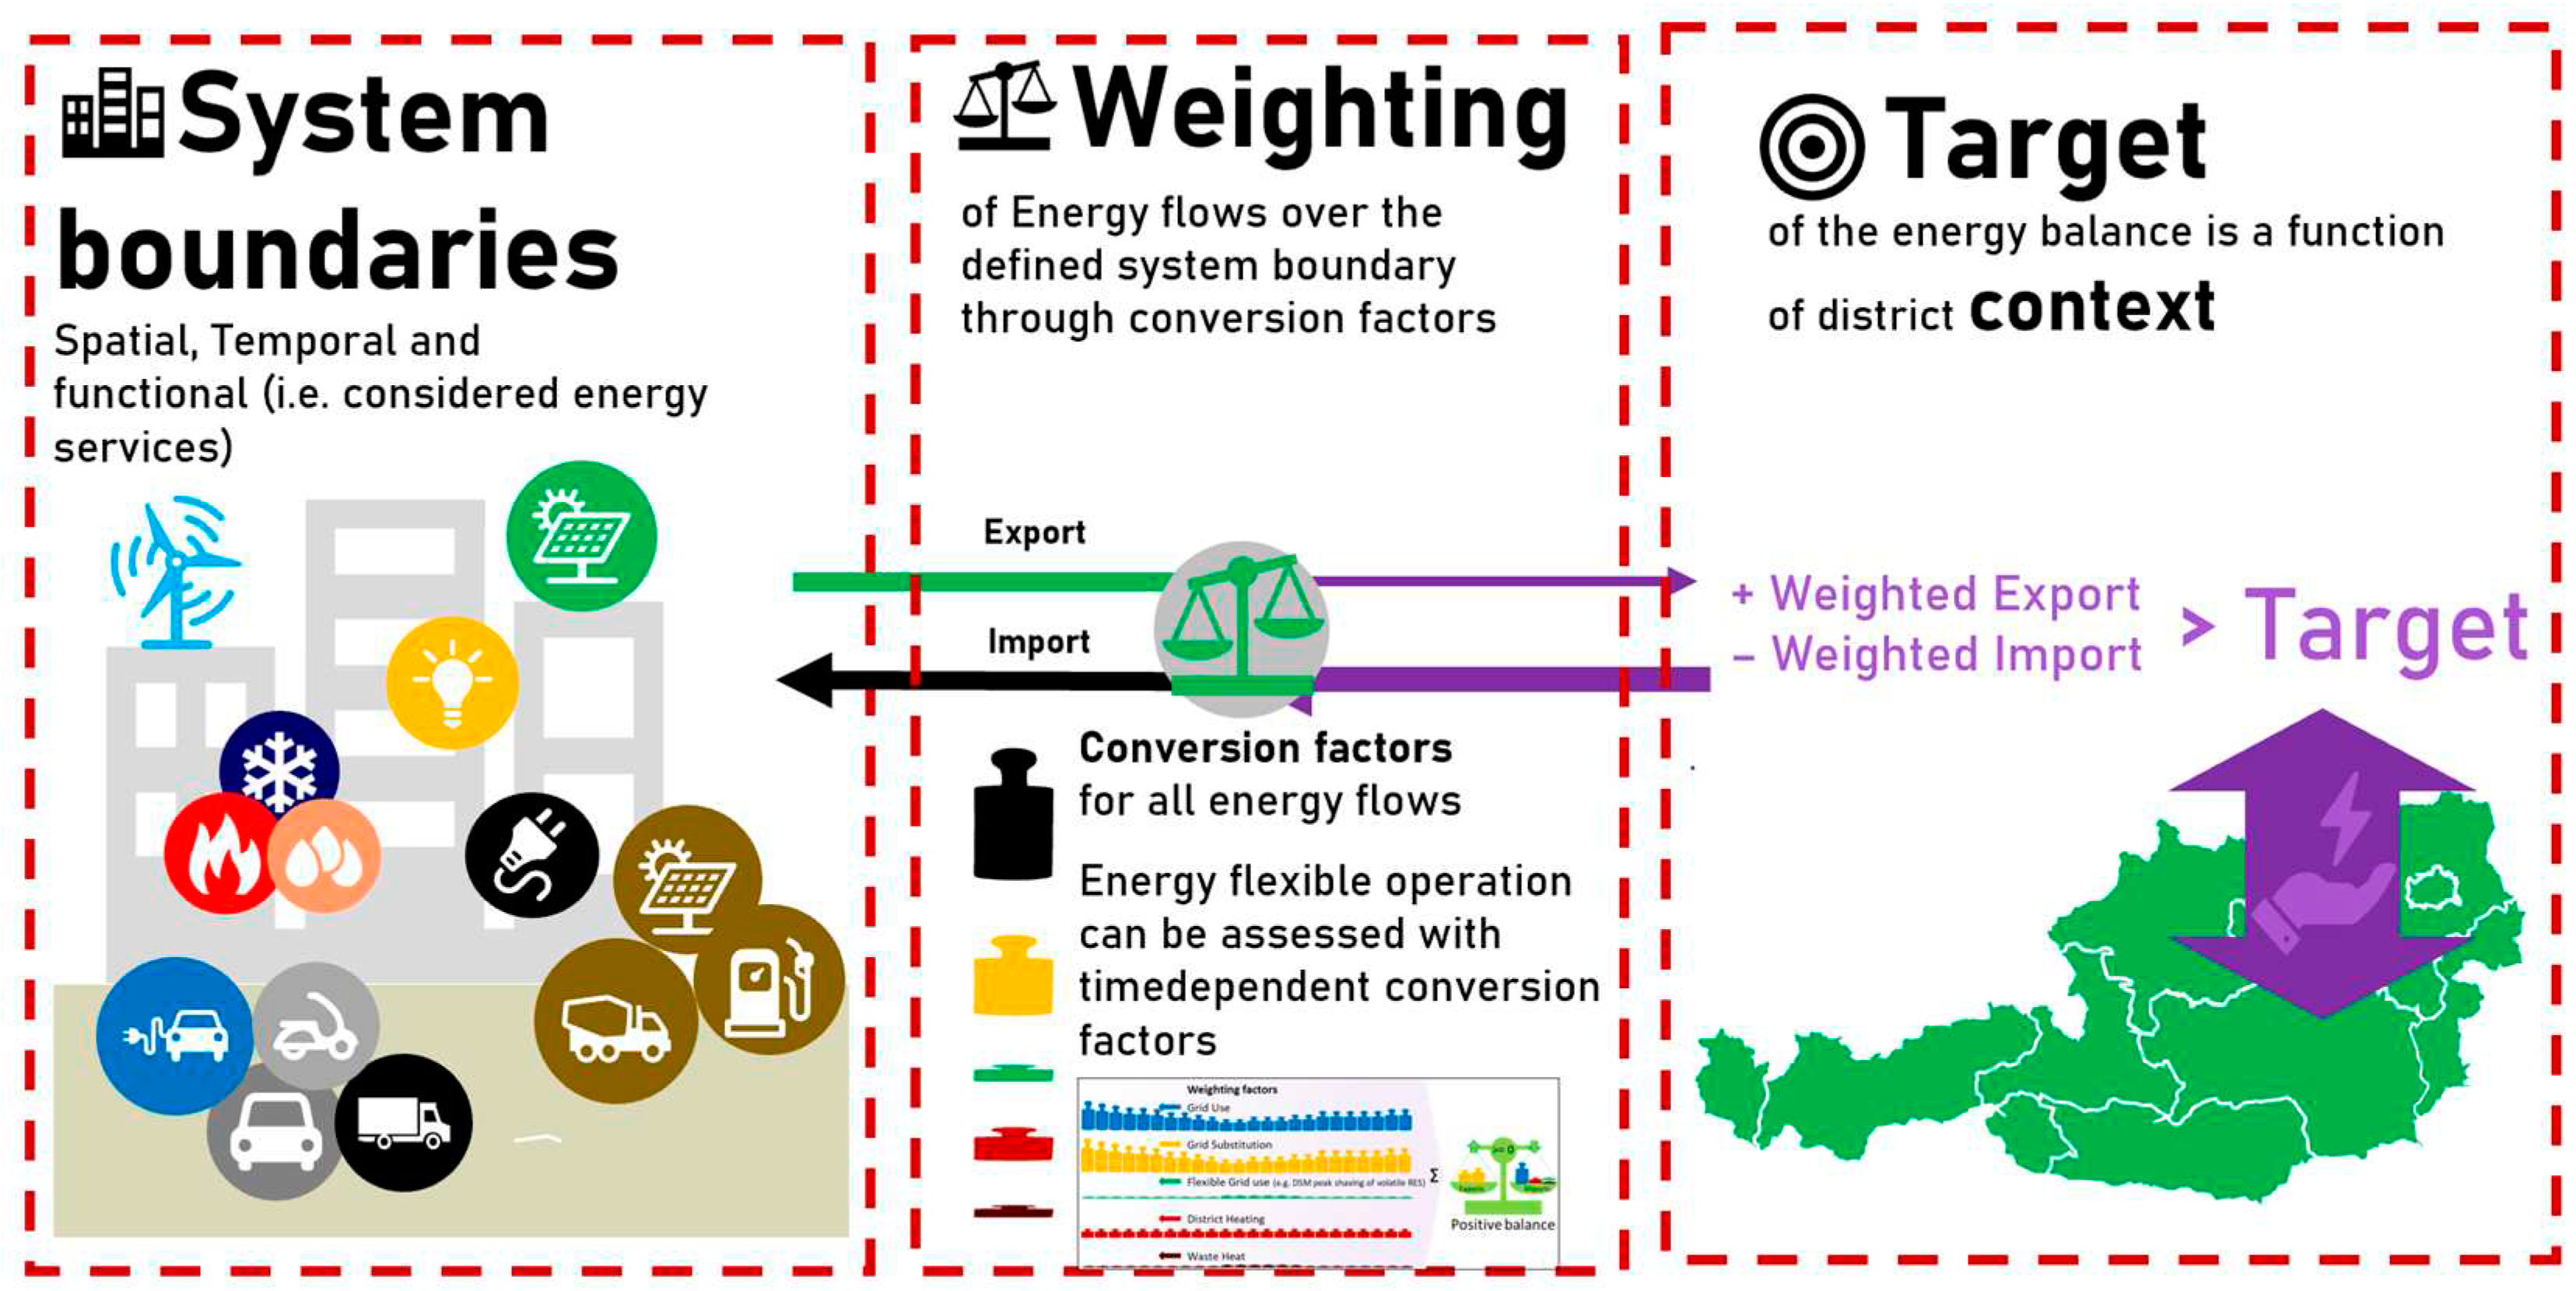
Figure 3.
Three types of system boundaries expand the considered energy services from operation and use (PED Alpha) to include motorized individual Mobility (PED Beta) and finally all emissions, both in operation and embodied in construction and maintenance of buildings and mobility (PED Omega).
Figure 3.
Three types of system boundaries expand the considered energy services from operation and use (PED Alpha) to include motorized individual Mobility (PED Beta) and finally all emissions, both in operation and embodied in construction and maintenance of buildings and mobility (PED Omega).
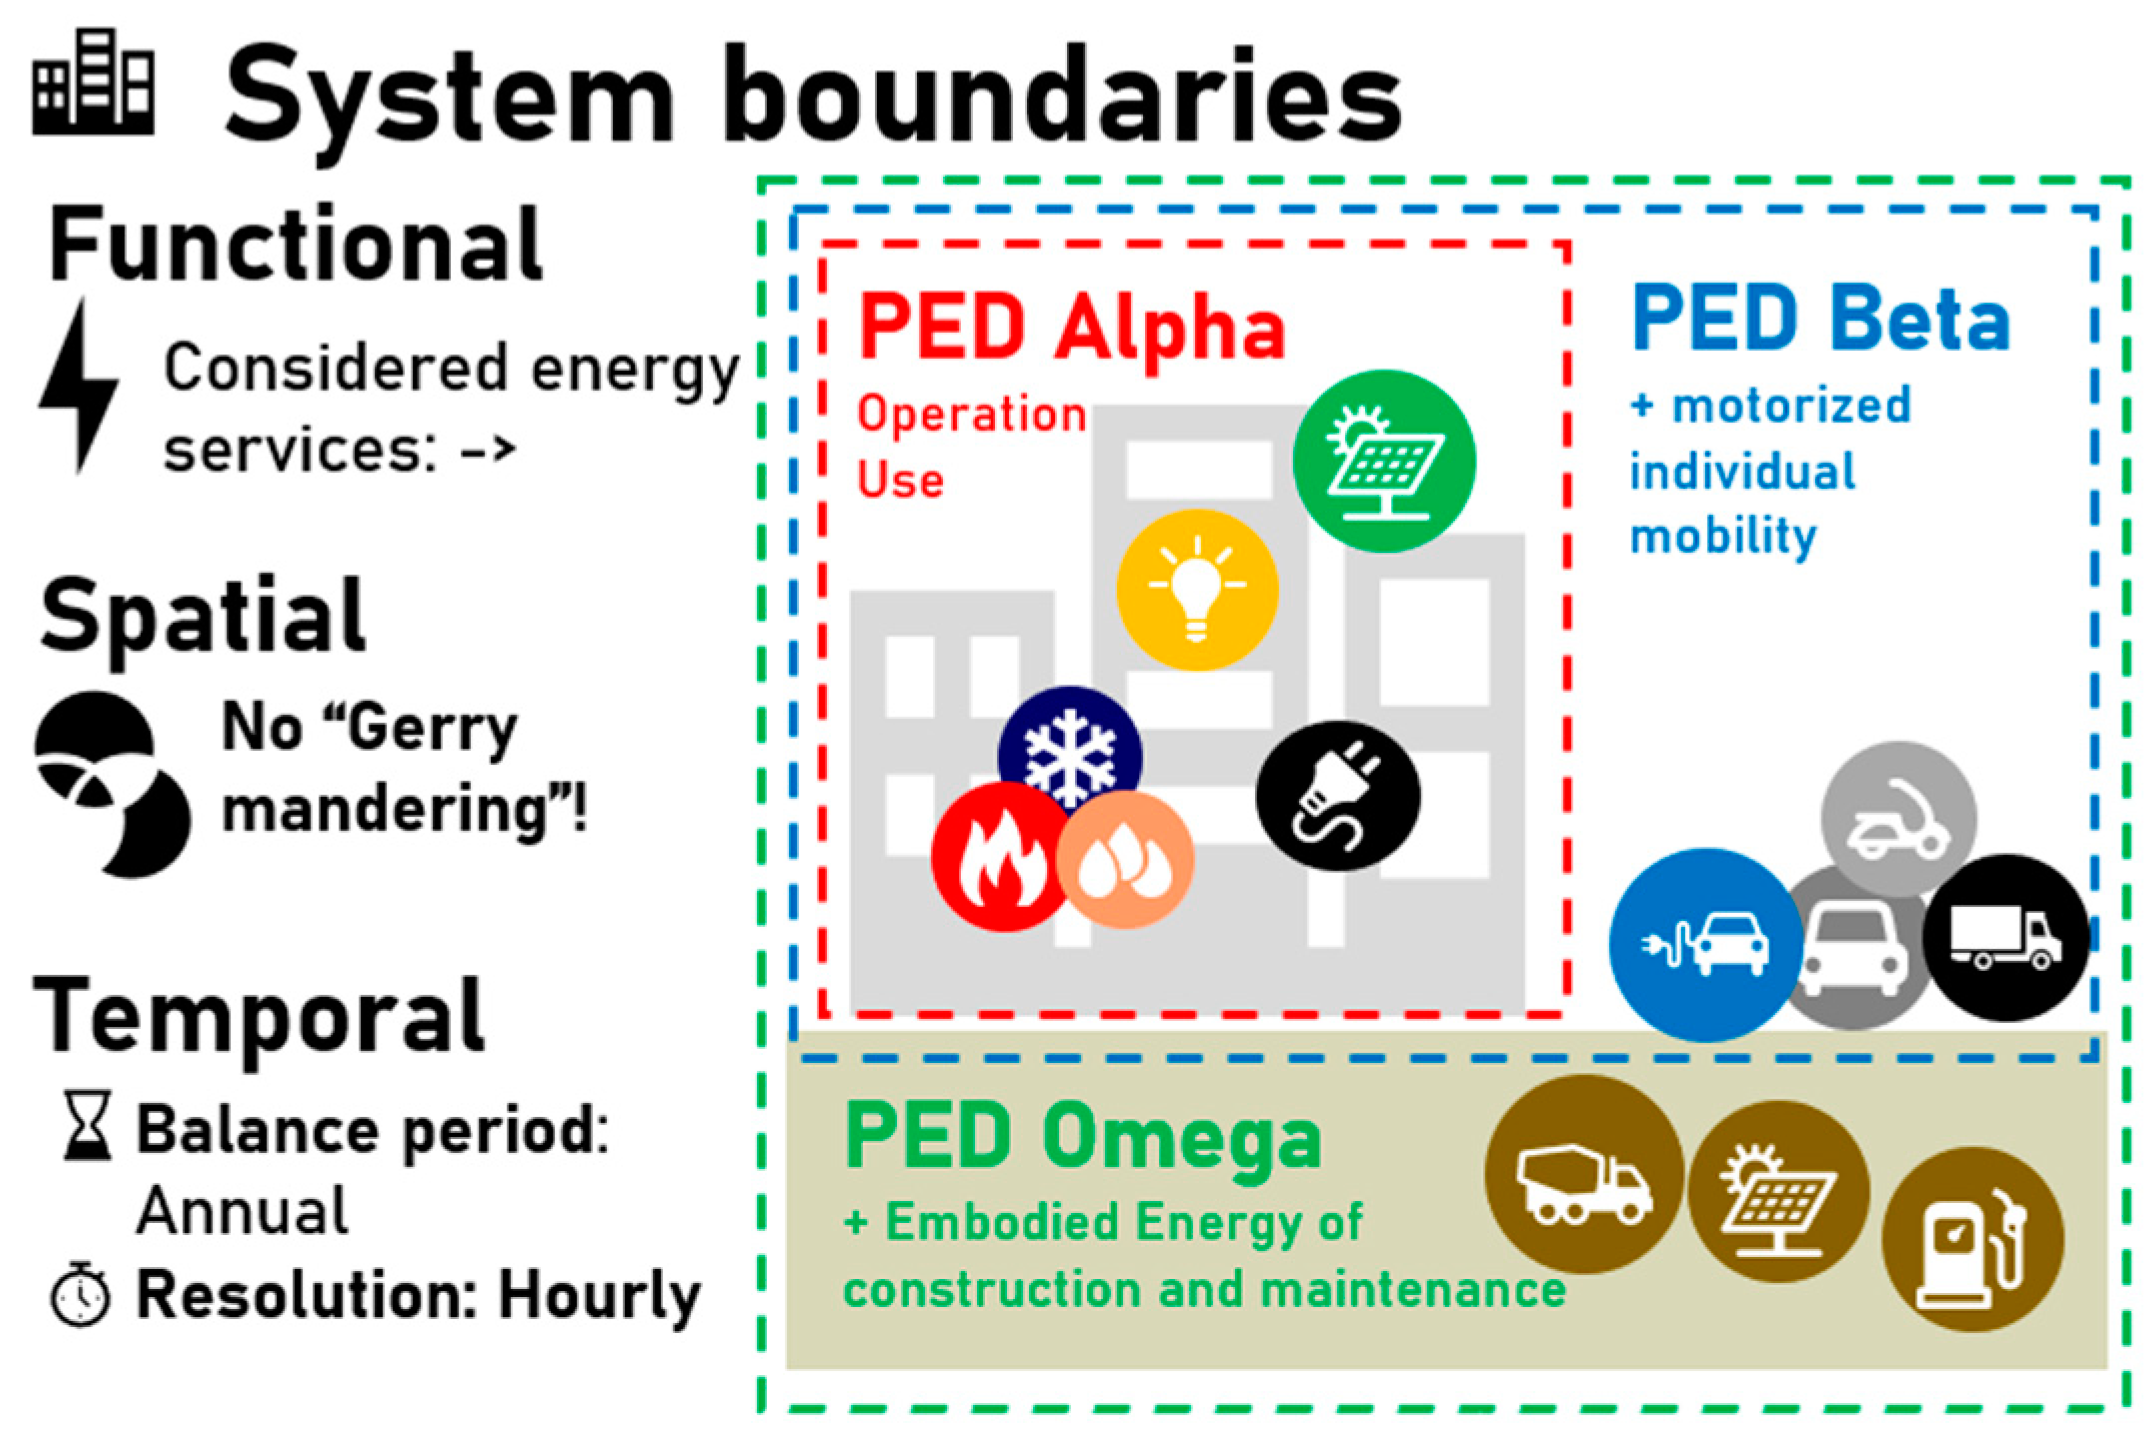
Figure 5.
Illustration of the conceptual differences without (left) and with explicit context factors (right).
Figure 5.
Illustration of the conceptual differences without (left) and with explicit context factors (right).
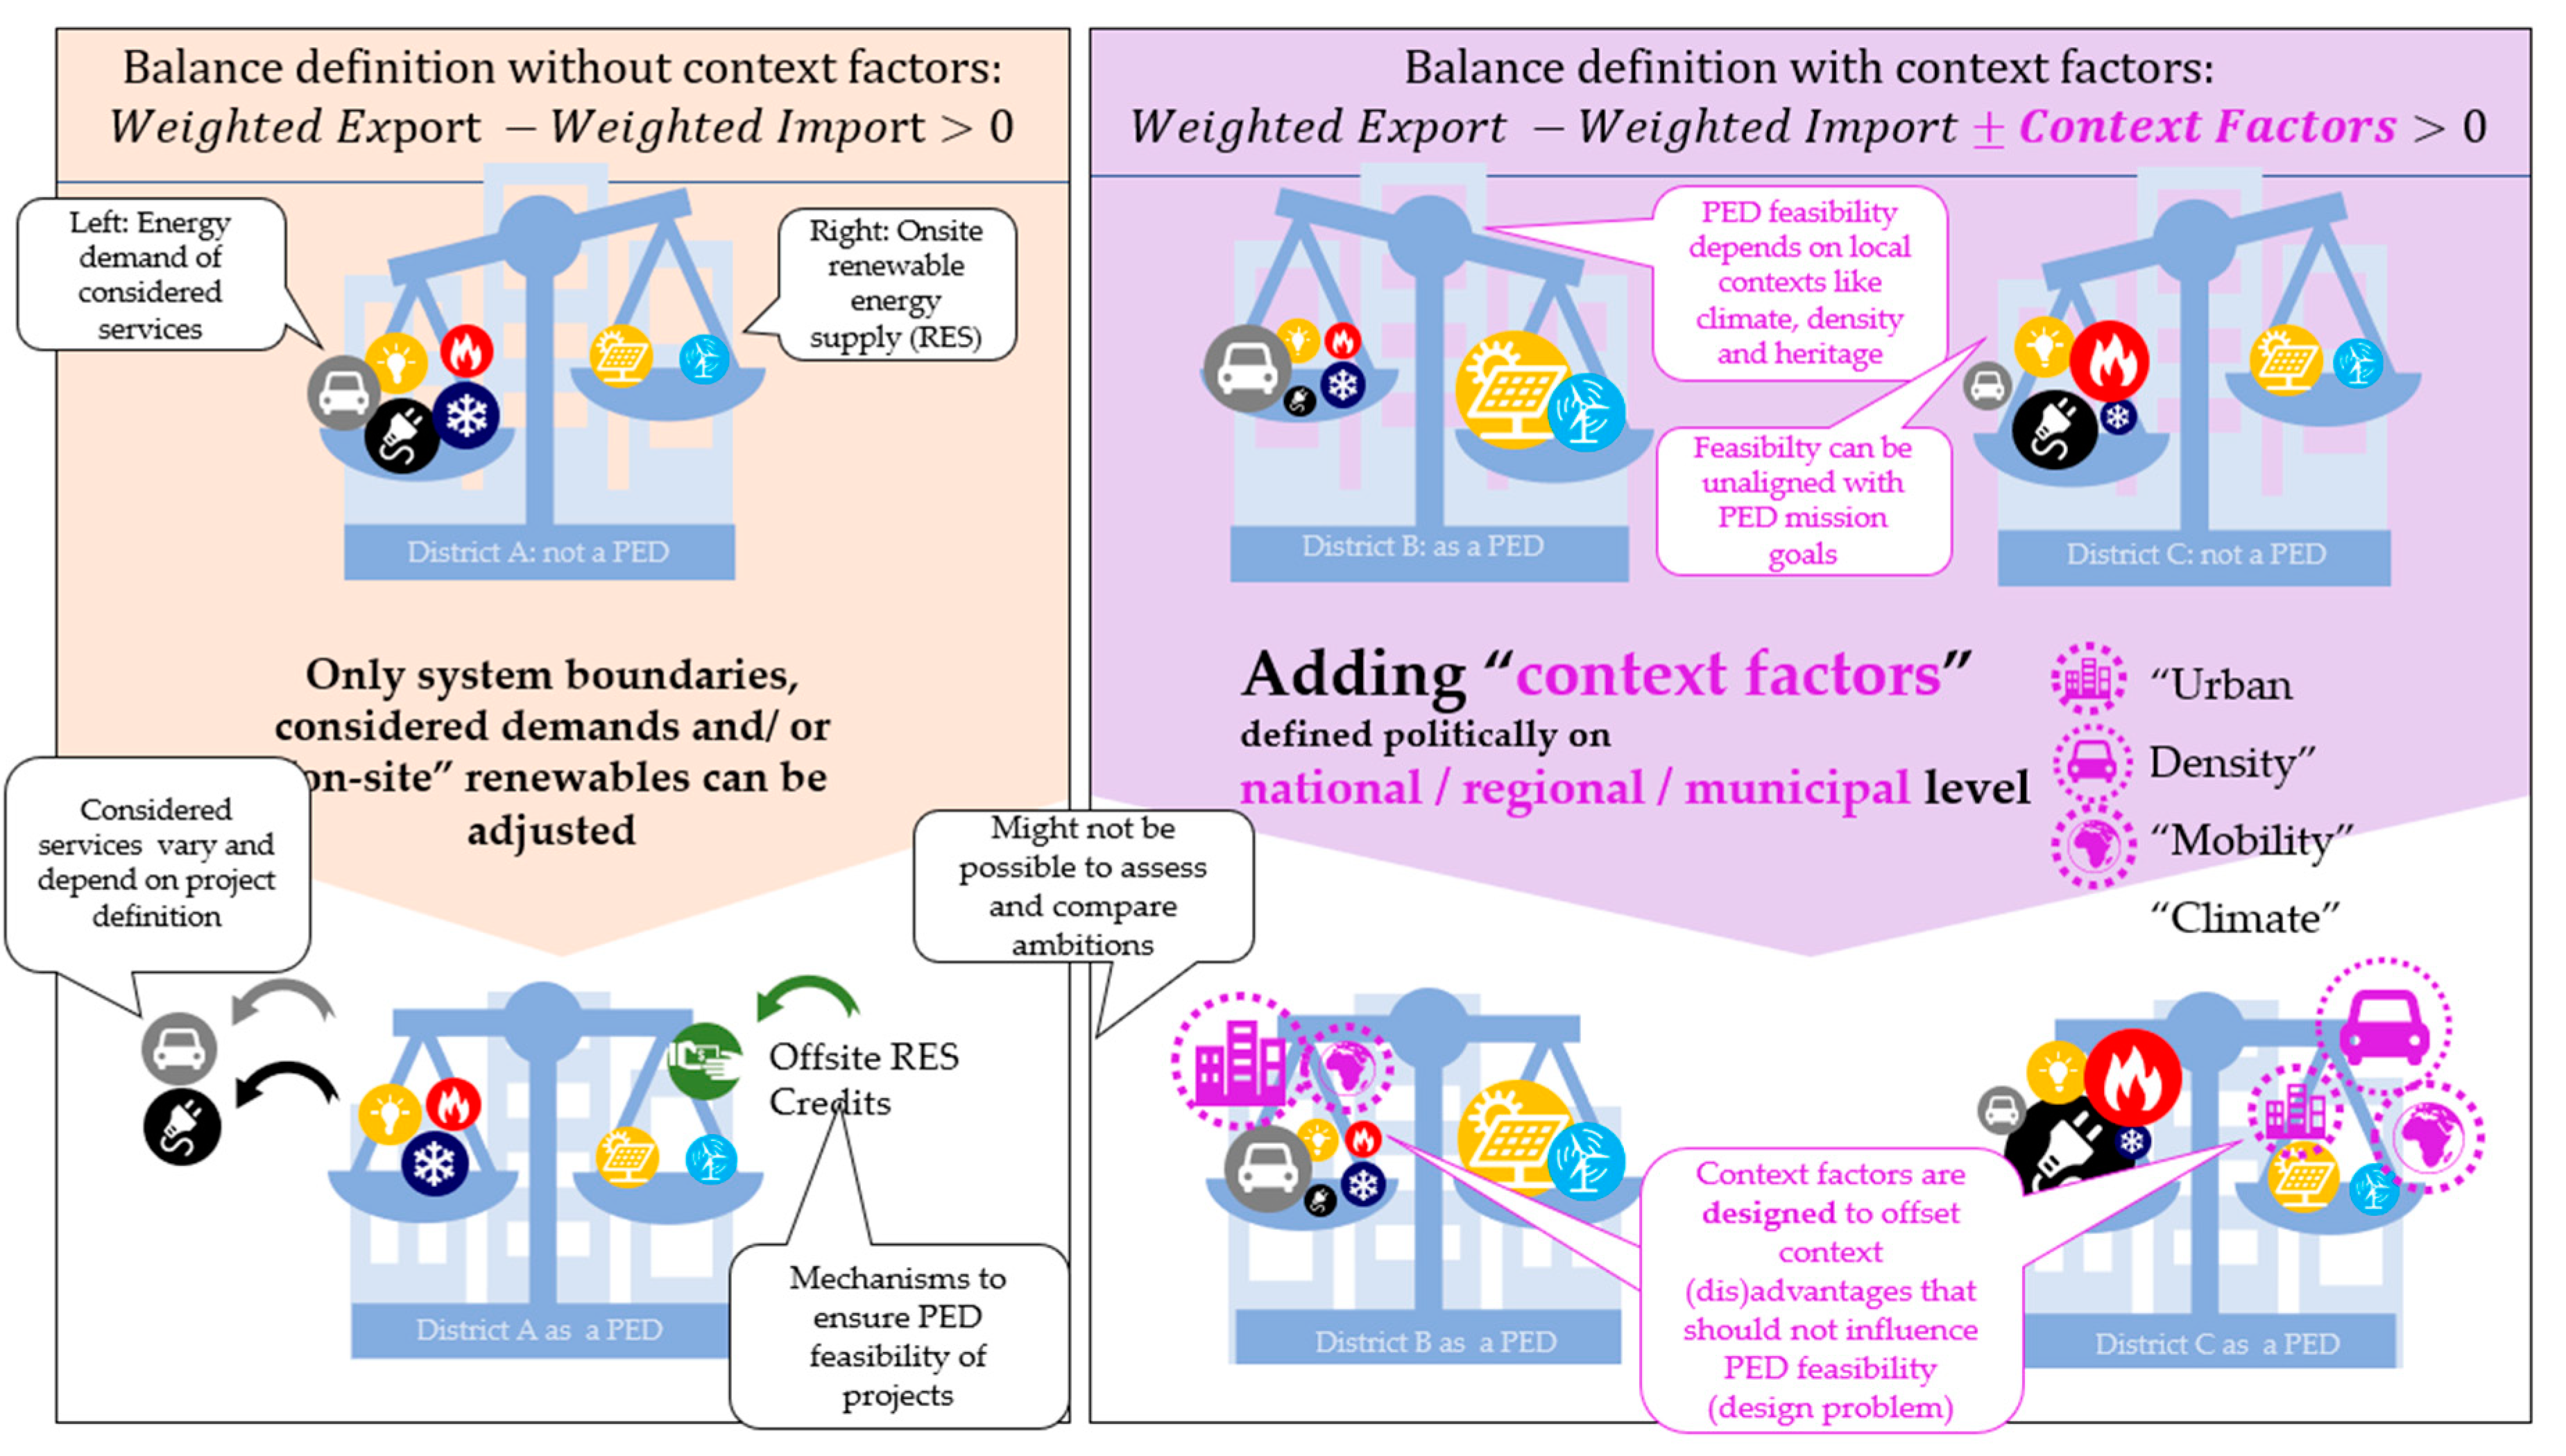
Figure 7.
Primary energy balances of example districts over their density (FAR). Vertical arrangements of samples represent the same district with increasingly ambitious measures, topmost typically corresponding to maximal technical feasibility. The red line represents the proposed context factor density as modified target.
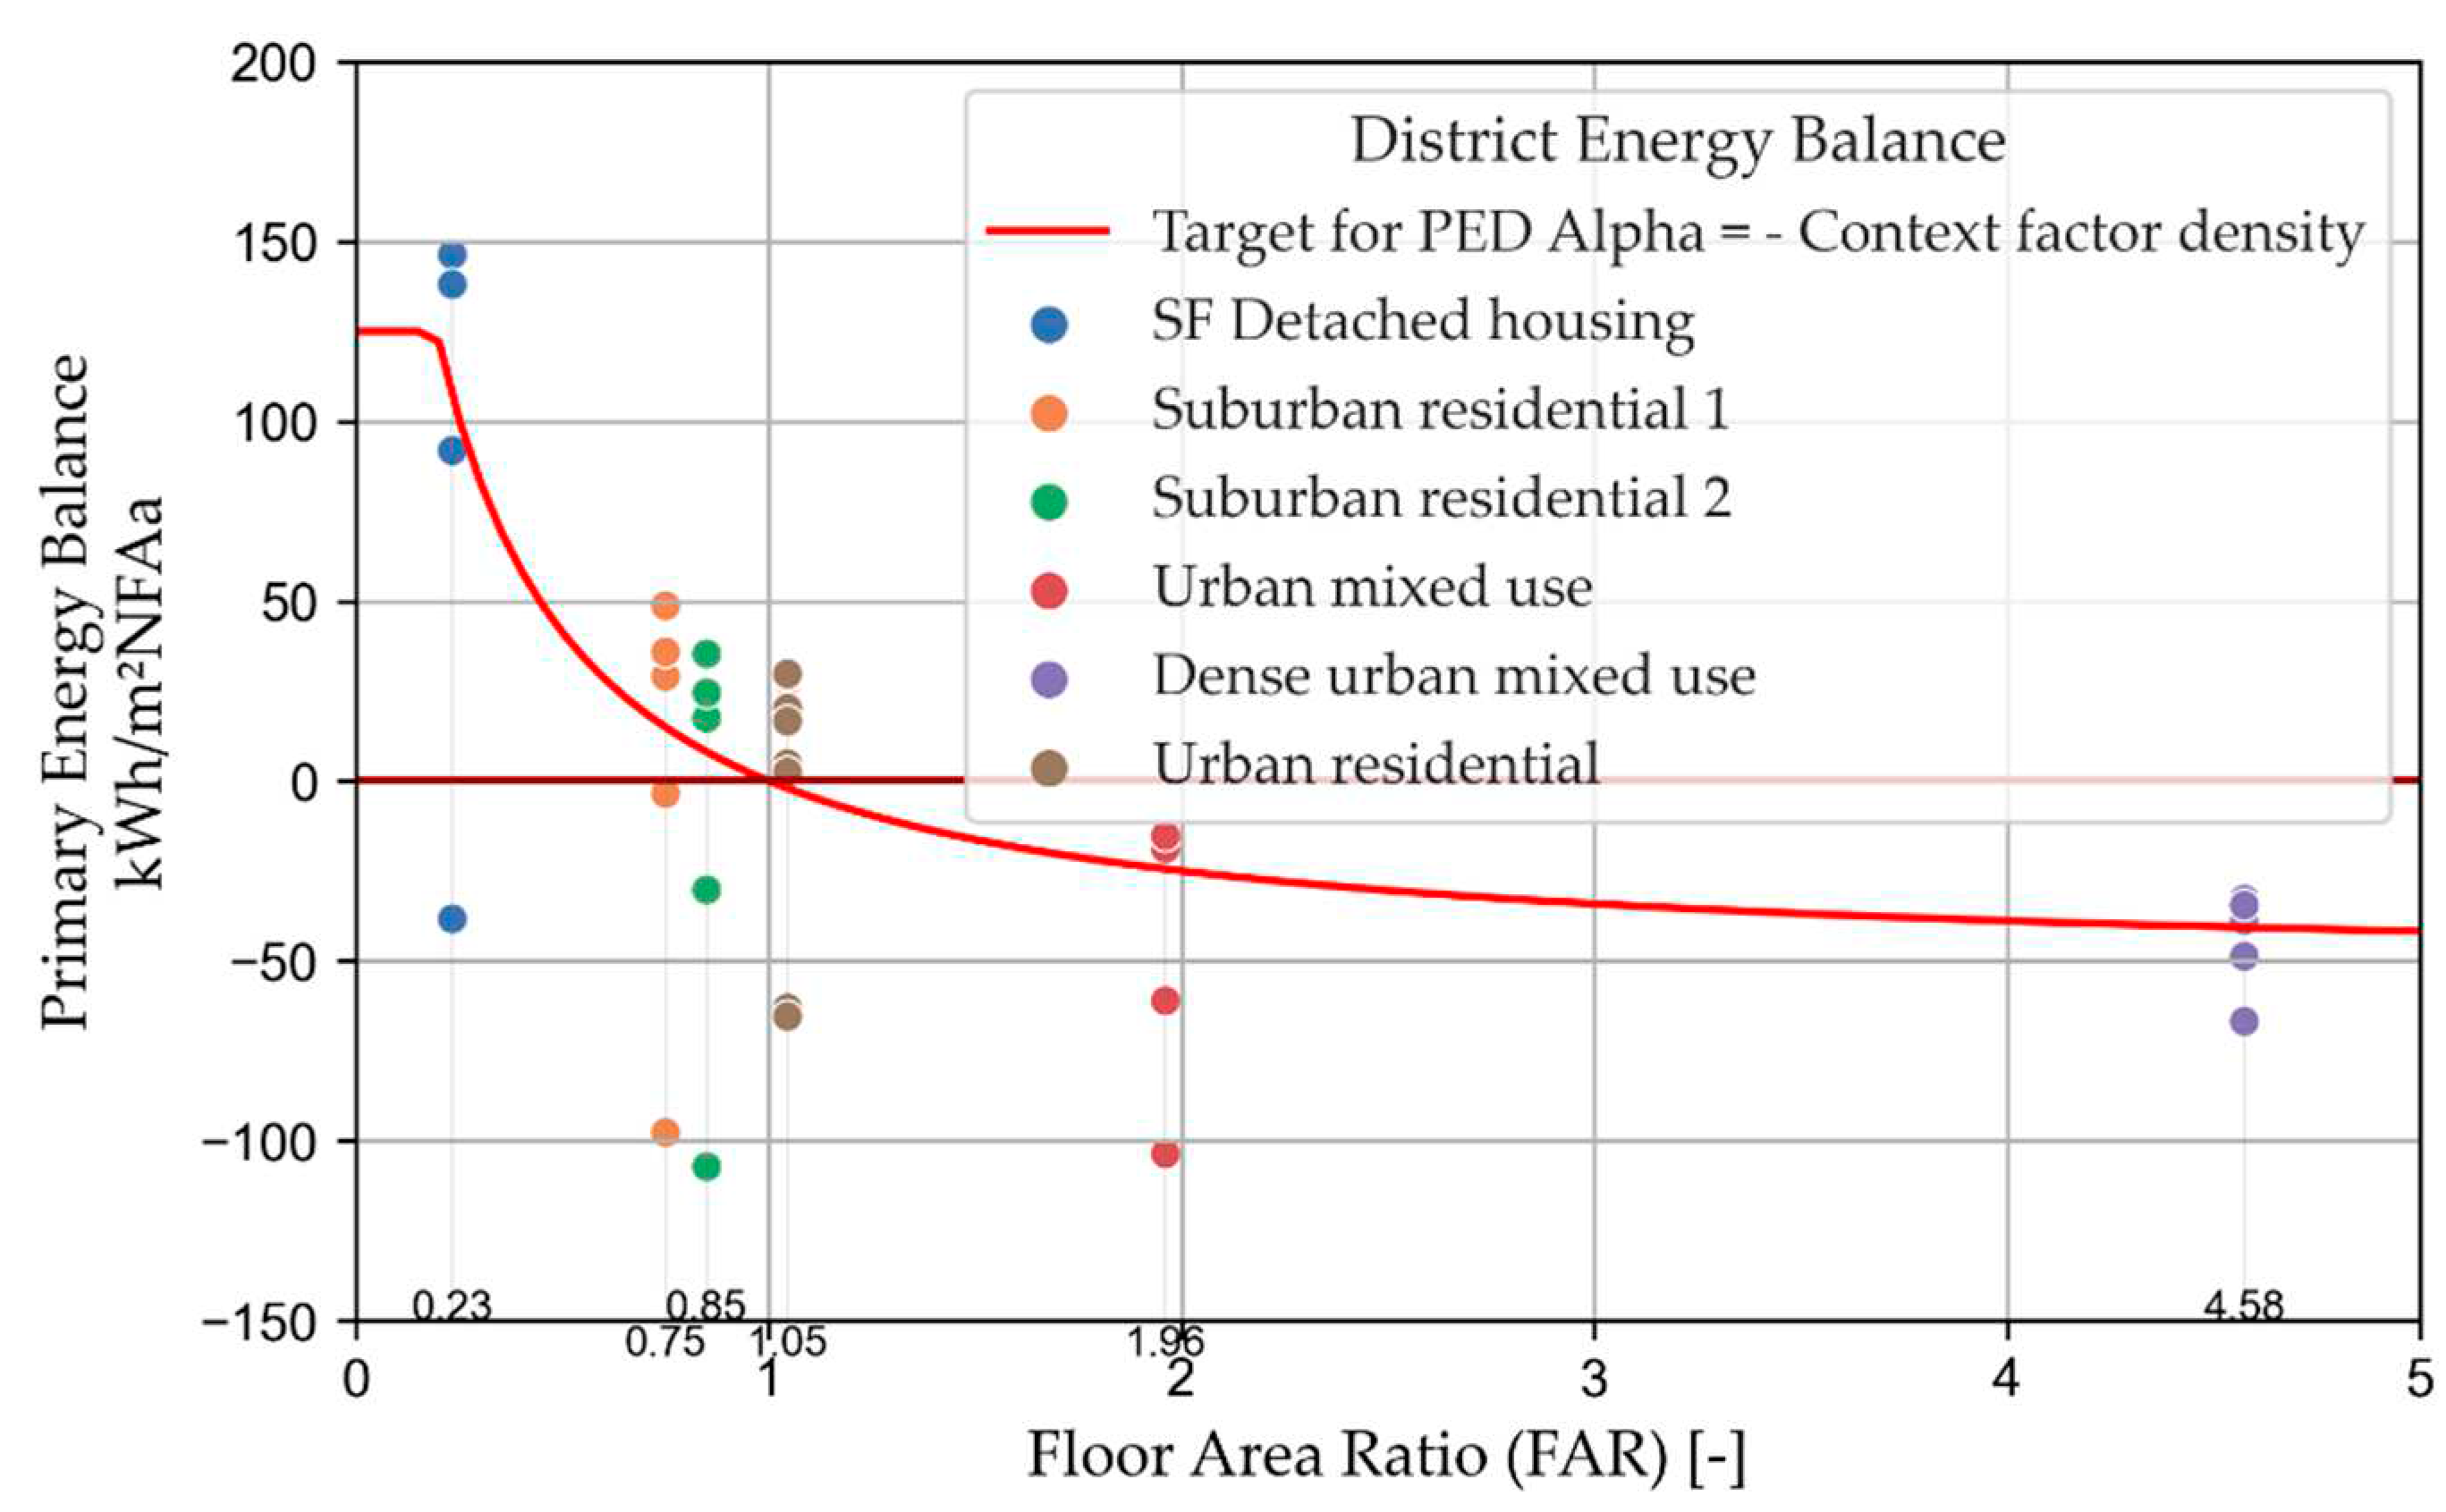
Figure 8.
Parametrization steps of District Density Context Factor.
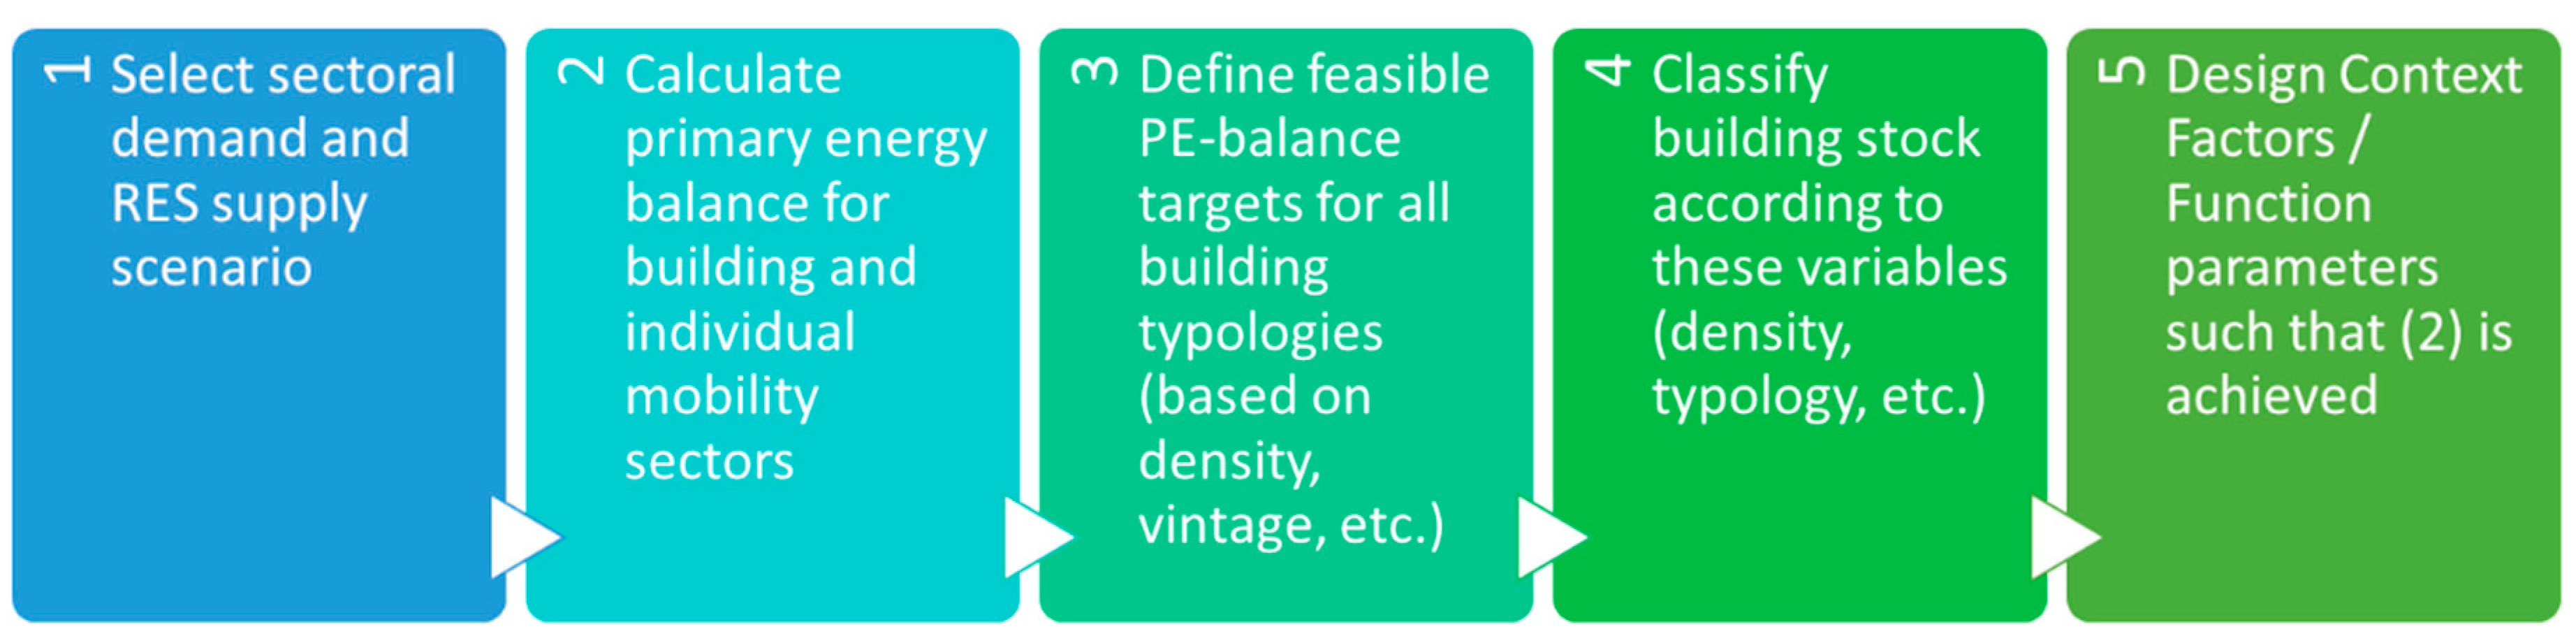
Figure 9.
Distribution of district typologies and their approx. average energy balance.
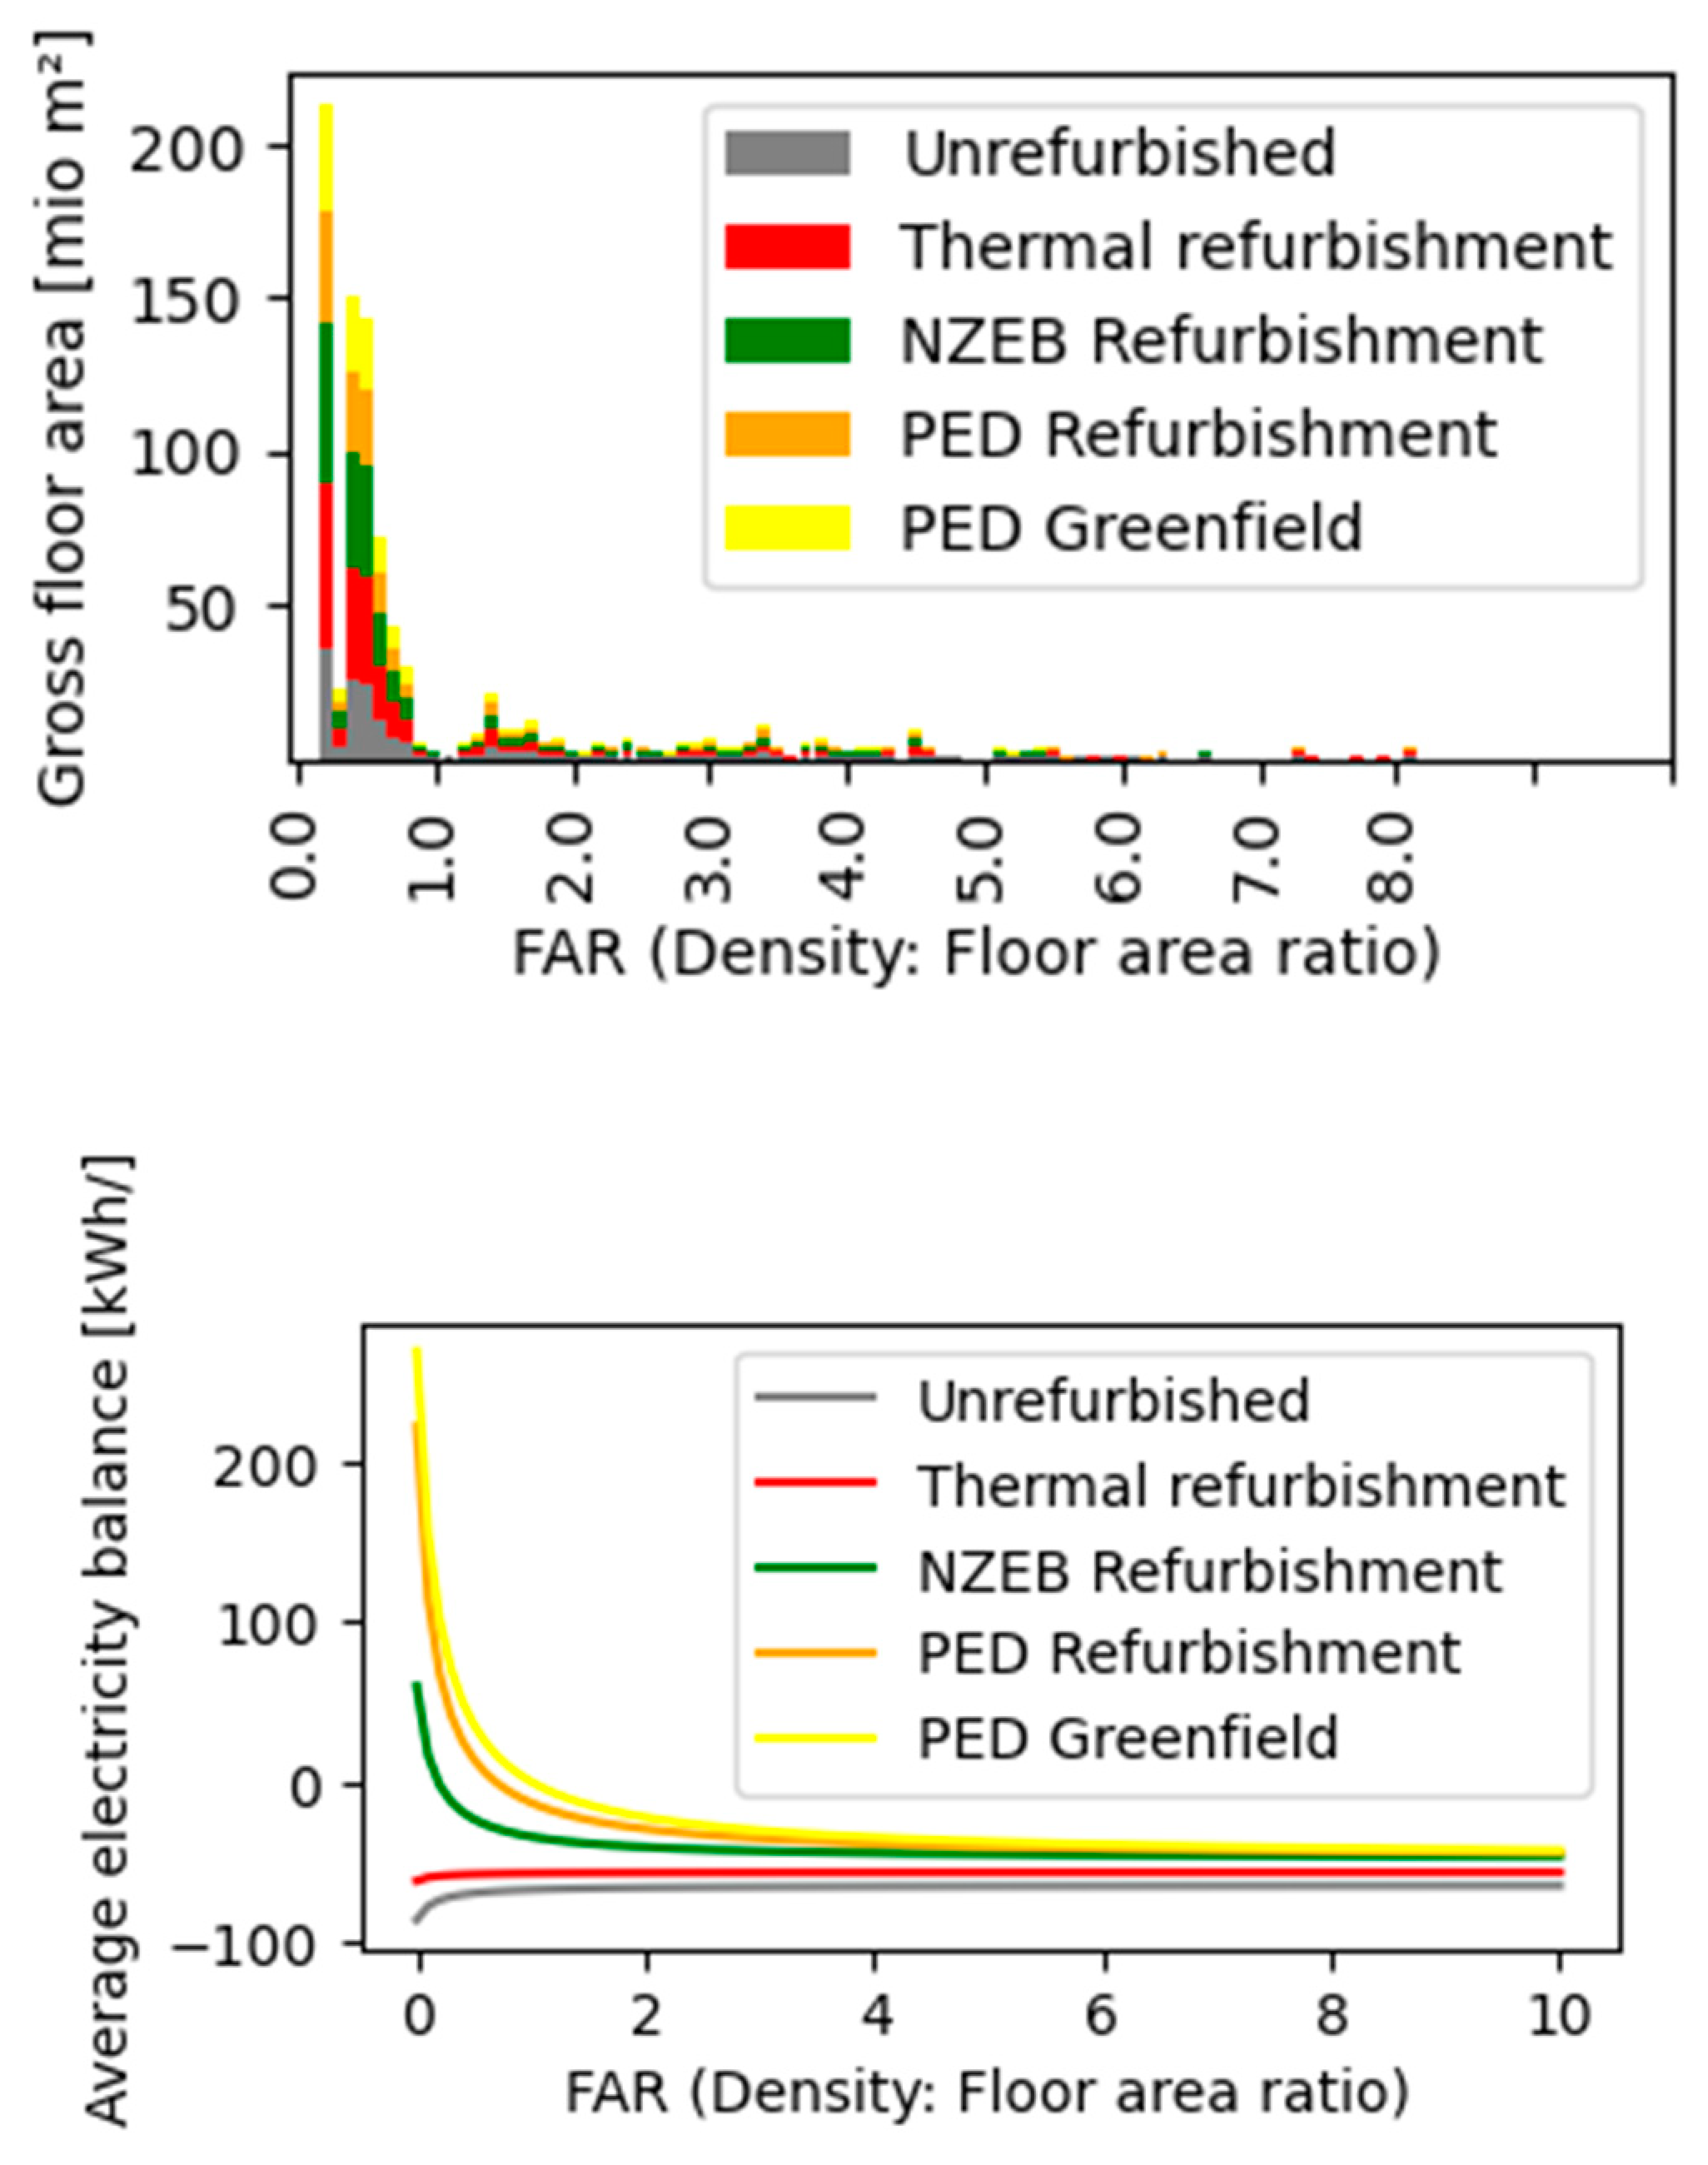
Figure 10.
Schematic representation of the system boundaries of the building sector in relation to the surrounding sectors of the future decarbonized energy system: It shows a balance "surplus" that can be distributed per capita or floor area to the entire building sector with system boundary PEQ Beta, i.e. including individual motorized mobility. The quantification of this specific surplus is presented in [26].
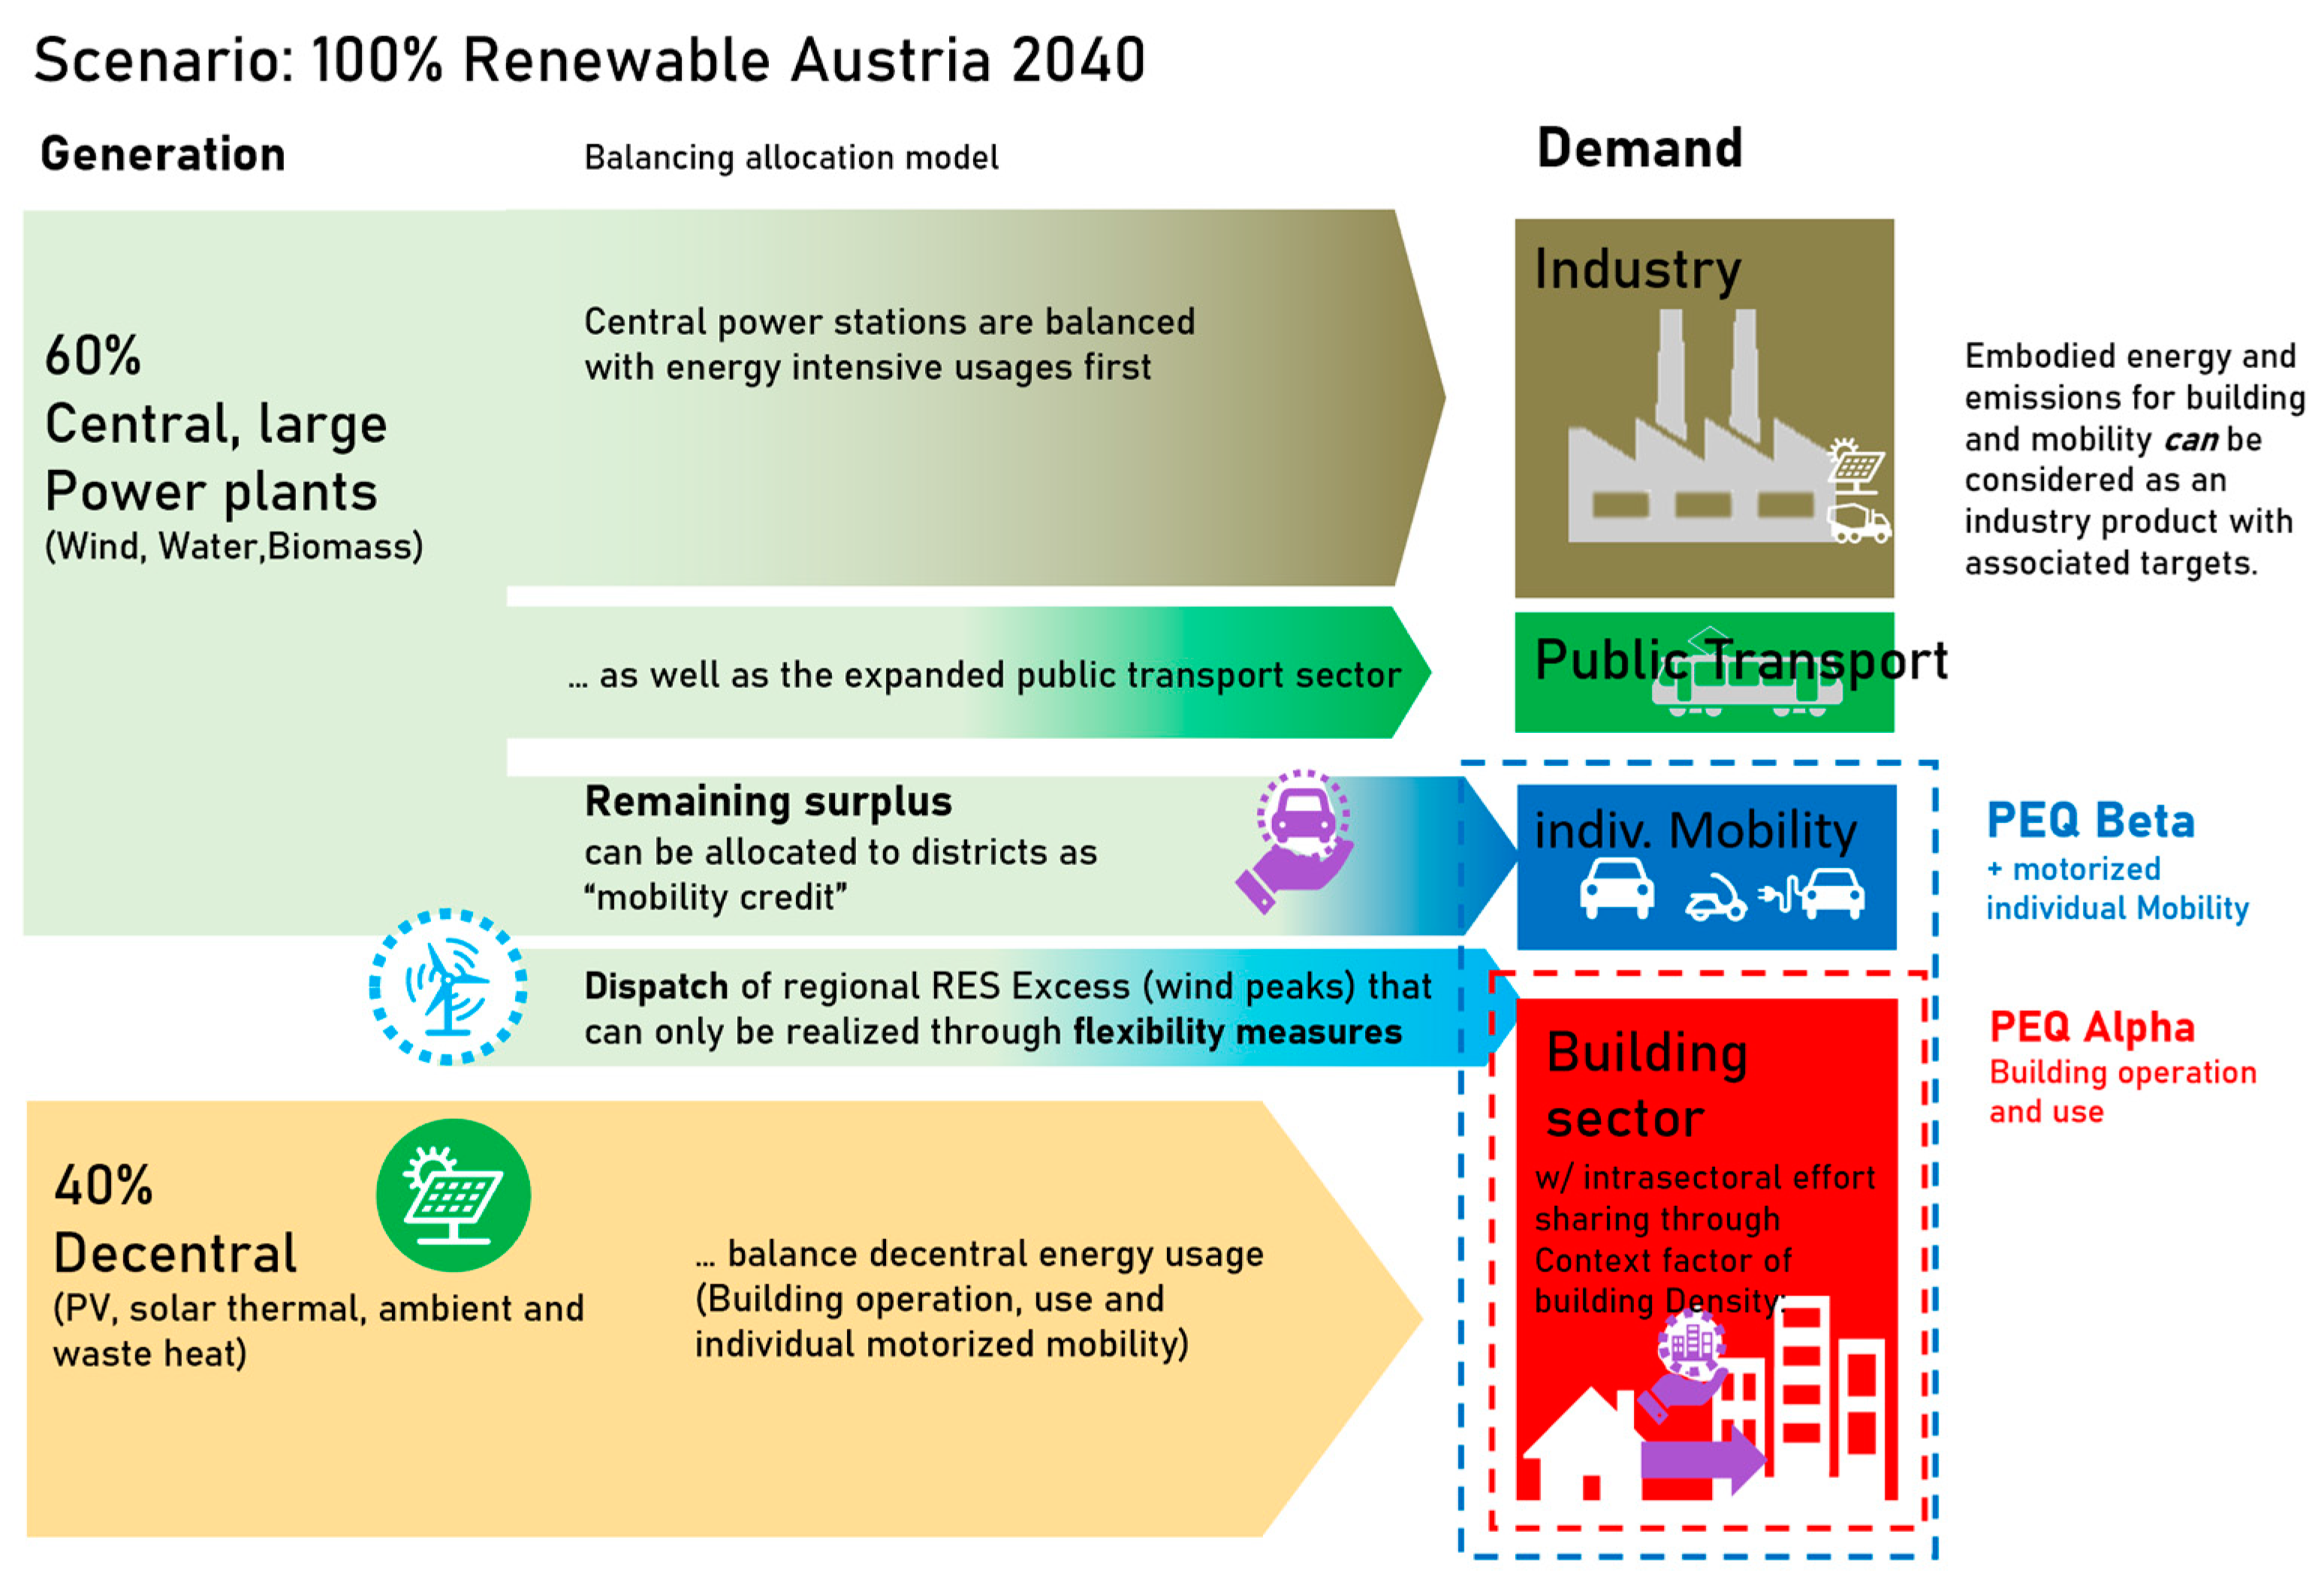
Figure 11.
Comparison between energy demand for 100% fossil (grey) and 100% electric (blue) everyday mobility per regional public transport classification (left in figure: initial data 2014 and right: optimised). The mobility context factor is shown as a red line and is proportionally the same for all uses (top left: residential, top right: office&commercial, bottom left: education, bottom right: retail).
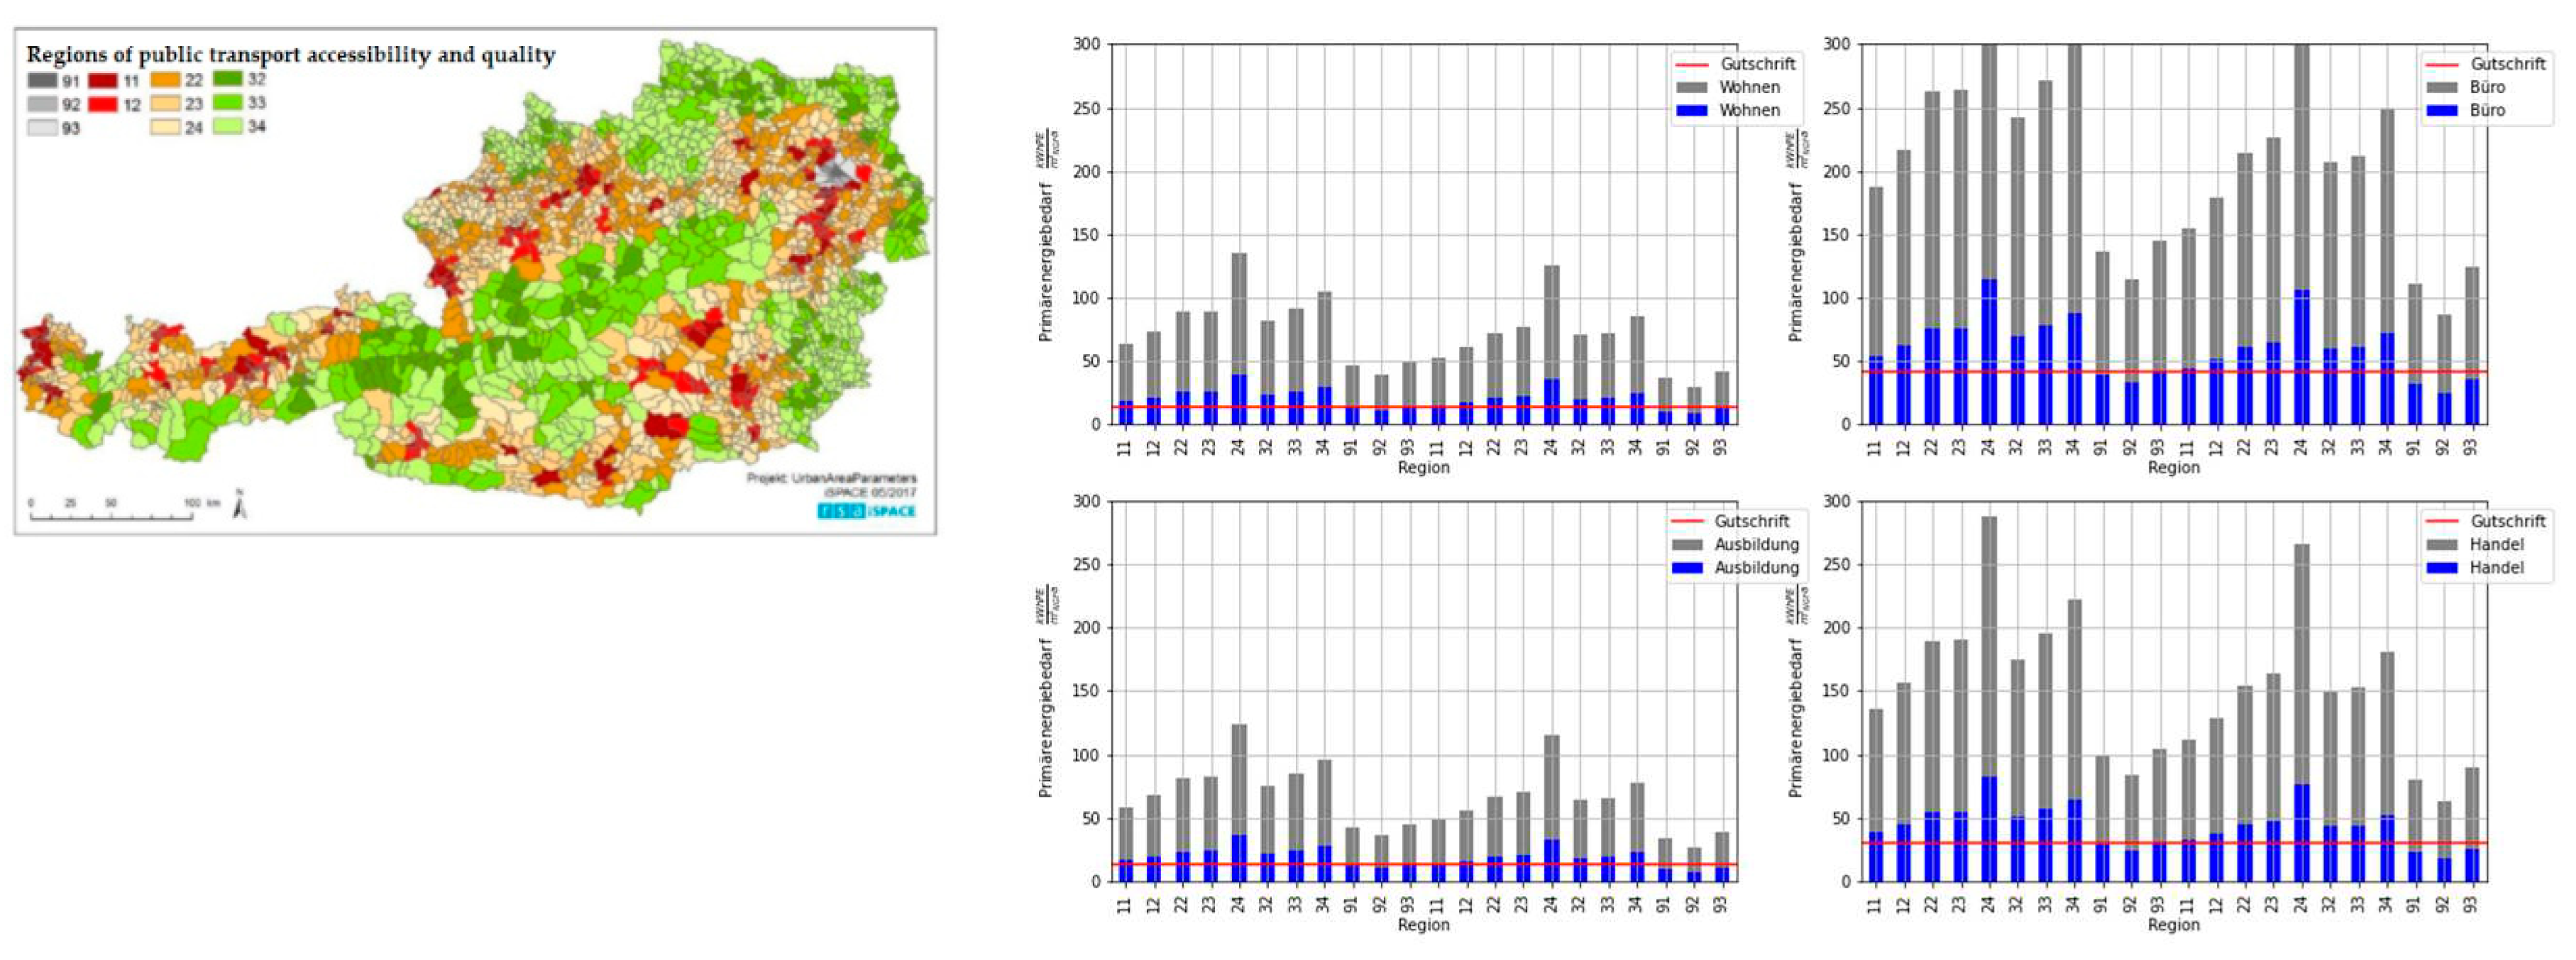
Figure 12.
Primary energy balance of seven example districts. All points above the dashed 45° line are considered PED, following the established convention. Districts show the following configurations, that each add to the last: 1) Baseline (project specific, varying ambition), 2) With additional measures (maximum ambition of project), 3) With consideration of the Density Context factor: Note that it adds both virtual demand (horizontally) or supply (vertically) depending on the district density (FAR) 4) Included energy for individual motorized mobility (varying share of EV, around 50%), and 5) including the Context Factor designed to offset the mobility energy in the balance.
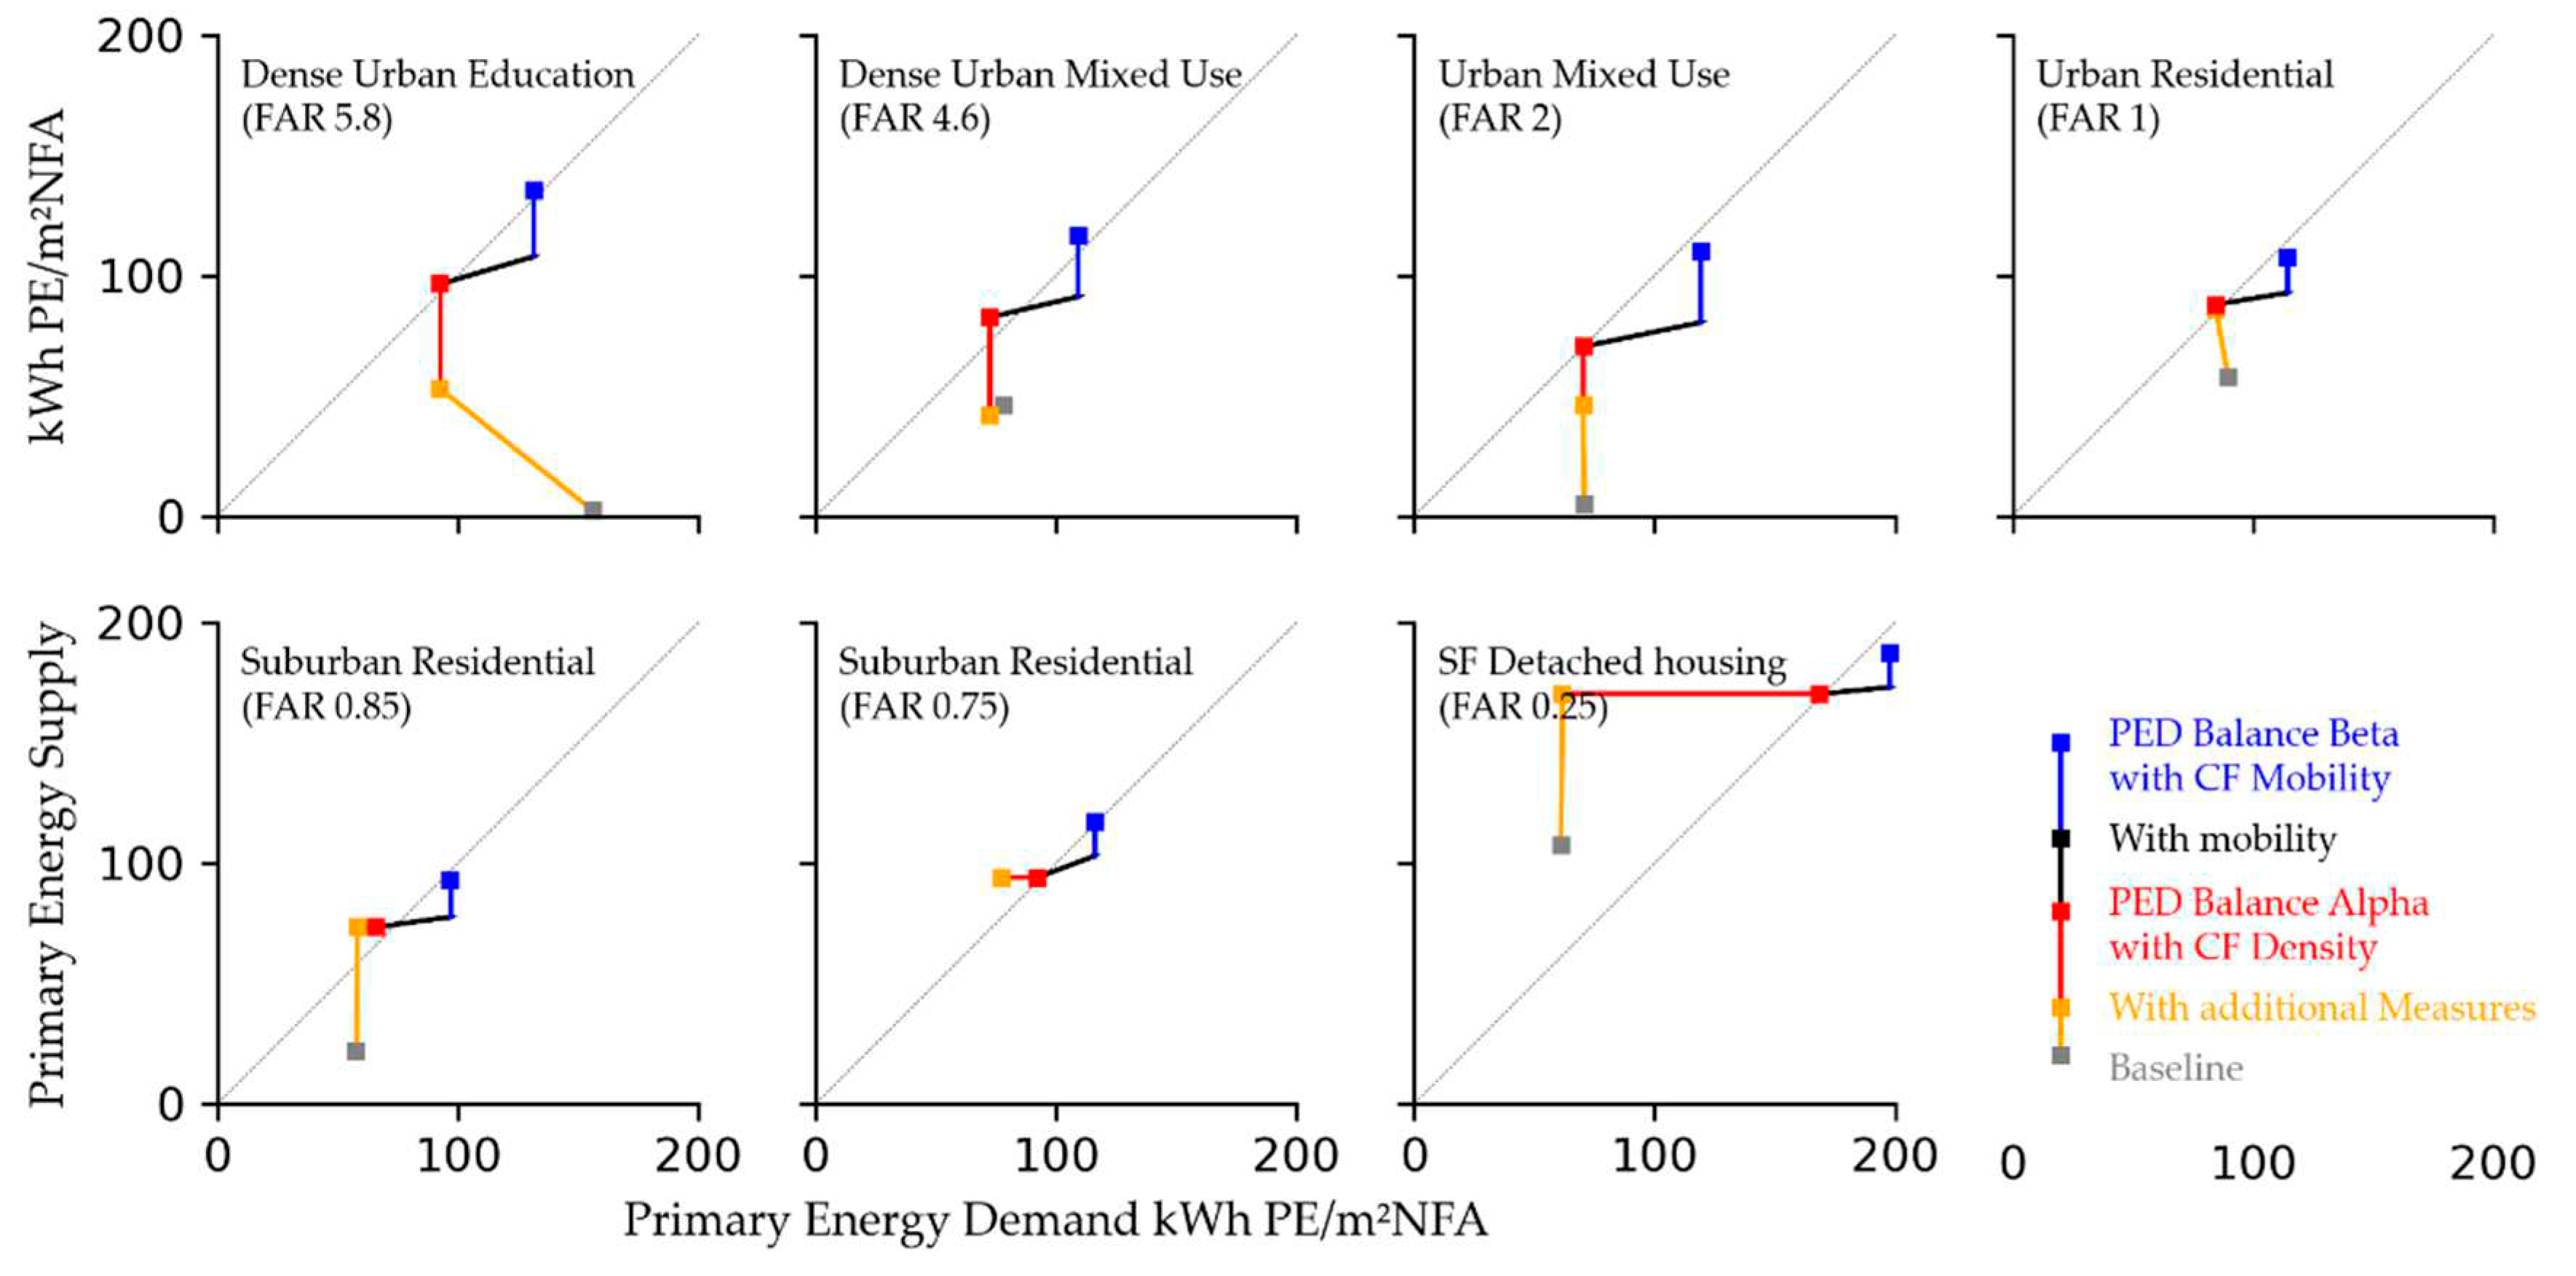
Table 1.
Considered Energy Services within PED boundaries Alpha, Beta and Omega.
| Energy Services | Alpha | Beta | Omega | Implicit* | |
|---|---|---|---|---|---|
|
Building operation |
Heating | ✓ | ✓ | ✓ | - |
| Cooling | ✓ | ✓ | ✓ | - | |
| Humidification and dehumidification | ✓ | ✓ | ✓ | - | |
| Ventilation | ✓ | ✓ | ✓ | - | |
| Auxiliary power of the building services system | ✓ | ✓ | ✓ | - | |
| General power & lift | ✓ | ✓ | ✓ | - | |
| Lighting | ✓ | ✓ | ✓ | - | |
|
District operation Industry, agriculture |
Power requirements of users (plug loads) | ✓ | ✓ | ✓ | - |
| Operating power (office, retail, school) | ✓ | ✓ | ✓ | - | |
| Process heat | - | - | - | ✓ | |
| Process cooling | - | - | - | ✓ | |
| Electricity demand for industrial production processes | - | - | - | ✓ | |
| Electricity demand for general use (incl. services) | ✓ | ✓ | ✓ | - | |
| Mobility | Motorized private transport | - | ✓ | ✓ | - |
| Public transport | - | - | - | ✓ | |
| Other mobility | - | - | - | - | |
|
Embodied Energy |
Components of the Austrian energy certificate | - | - | ✓ | - |
| Accessory components (cellars, underground parking, garages, carports, bicycle storage areas, balconies and terraces, other outbuildings) | - | - | ✓ | - | |
| Building and energy equipment | - | - | ✓ | - | |
| Vehicles and infrastructure for mobility | - | - | ✓ | - | |
| Public transport | - | - | - | ✓ |
* Not included in any system boundary but instead part of the district context of the surrounding energy scenario that in turn influences the balance target as context factors.
Table 3.
Balance targets.
| System Boundary | Scope | Balance | Context Factors | Target | KPI |
|---|---|---|---|---|---|
| Alpha | Operation, use | Primary Energy Exports – Imports* | > 0 | kWh PEtot./m²NFA/a | |
| Beta | Operation, use, individual motorized mobility | Primary Energy Exports – Imports* | > 0 | kWh PEtot./m²NFA/a | |
| Omega | Operation, mobility and embodied emissions | GHG Emission Exports – Imports* | > 0 | kg CO2eq. /m²NFA/a |
* Energy flows into the district are counted negatively (e.g. grid electricity purchases and district heating), energy exports across the system boundary are accounted for positively (e.g. PV surpluses).
Table 5.
Energy balance performance approximation of Austrian district typologies.
| Share | Potential Electricity Yield | Electricity Demand | Cutoff | Electricity Balance | ||
| District Type | ||||||
| PJ/a | ||||||
| Unrefurbished | 0% | -1,0 | 50 | 0,15 | - | 0 |
| Thermal refurbishment | 40% | 0,0 | 38,5 | 0,15 | - | -42,16 |
| Refurbishment with minimal PV | 20% | 30,4 | 35 | 0,15 | 13 | -3,69 |
| PED Refurbishment | 20% | 30,4 | 26,4 | 0,15 | 62 | +11,55 |
| PED New construction | 20% | 30,4 | 26,4 | 0,15 | 62 | +11,55 |
| Total | -22,7 |
Table 6.
Arguments to include mobility in the PED energy balance.
| PRO Mobility Inclusion | AGAINST Mobility Inclusion |
|---|---|
|
|
Disclaimer/Publisher’s Note: The statements, opinions and data contained in all publications are solely those of the individual author(s) and contributor(s) and not of MDPI and/or the editor(s). MDPI and/or the editor(s) disclaim responsibility for any injury to people or property resulting from any ideas, methods, instructions or products referred to in the content. |
© 2023 by the authors. Licensee MDPI, Basel, Switzerland. This article is an open access article distributed under the terms and conditions of the Creative Commons Attribution (CC BY) license (http://creativecommons.org/licenses/by/4.0/).
Copyright: This open access article is published under a Creative Commons CC BY 4.0 license, which permit the free download, distribution, and reuse, provided that the author and preprint are cited in any reuse.


