
Submitted:
10 April 2023
Posted:
10 April 2023
You are already at the latest version
Abstract
This paper proposes a data-driven approach to the calculation of ship overtaking boundary conditions in narrow channels based on ship overtaking characteristics by the Automatic Identification System (AIS) data. First, we collect the ship tracking process data in a narrow channel by processing the original AIS data, followed by a normality test and correlation analysis, and finally, the boundary conditions are obtained using a weighted K-means clustering algorithm. to identify the relevant data. We applied the proposed approach to estimate the overtaking boundary conditions of ships in the straight channel section of Shanghai South Passage. The method yields boundary conditions that significantly reduce collision risk when a ship engages in pursuit behavior in narrow waterways, providing a scientific basis for the overtaking of Marine Autonomous Surface Ships (MASS) in autonomous navigation within such environments, further promoting the automation level of USVs and autonomous vessels.
Keywords:
waterway transportation
; boundary conditions
; AIS data
; MASS
; intelligent transportation
1. Introduction
The shipping industry has experienced remarkable growth in recent years, particularly as attention to intelligent ship development continues to increase. Though laws and regulations regarding intelligent ships have been refined, and a range of intelligent ship systems implemented, the problem of ship collisions remains a difficult one to solve effectively. There is still some way to go in achieving autonomous navigation of intelligent ships. According to statistical data, there are over three thousand maritime accidents globally each year, with collision accidents accounting for up to 40% [1]. The risk of collision is the primary challenge faced by marine traffic research, particularly during ship encounters, which can be further divided into head-on, crossing, and overtaking situations [2]. The highest proportion of collisions occurs when ships are overtaking, especially within the last kilometer of narrow waterways and dense traffic areas, which constitutes a challenging problem for the study of intelligent ship navigation. Therefore, investigating overtaking characteristics in narrow waters is of paramount importance.
AIS (Automatic Identification System) data contains a vast amount of ship traffic information. For example, AIS data can be used to reconstruct a ship's navigation trajectory [3], and dynamic ship analyses can be performed using AIS information [4,5,6]. To solve the problem of ship collision avoidance, researchers have explored the concept of ship domains. Xiang, Z.; Hu, Q.; and others used a considerable amount of AIS data to obtain the ship domain in restricted waters [7], and other scholars subdivided ship domain models based on different ship types and waterways [8,9,10,11,12,13,14], These studies have advanced the field of ship automatic collision avoidance. To achieve automatic collision avoidance, He, Y.; et al. proposed the use of the ship three-degree-of-freedom MMG hydrodynamic model and the translation center elliptical ship domain model theory [15], while other researchers studied collision avoidance by improving the artificial potential field method [16,17,18]. Zinchenko, S.; Nosov, P.; and others conducted research in the field of multi-vessel automatic collision avoidance [19,20,21,22,23]. In recent years, intelligent algorithms have achieved remarkable results in solving collision avoidance problems. Zhao, Z. and Wang, J.J.S.T.E; et al. optimized automatic collision avoidance decisions using intelligent algorithms [23,24,25]. However, most of these studies have been conducted in open-water environments.
In the study of narrow waterways, Kang, M.J.; Zohoori, S.; et al. [26] applied the road traffic congestion index to the sea and quantified the congestion of different sections by considering the geometry of the channel, time, vessel type, and scale to facilitate congestion resolution in narrow waterways. Liu, C.; Zhou, X.; et al. [27], based on the structural characteristics of traffic flow under AIS data, used the K-means clustering algorithm while considering vessel type and vessel domain to further obtain the capacity of different vessels in narrow waterways.
To study the collision avoidance problem in narrow waterways, Wu, X.; Rahman, A.; et al. [28] studied navigational behavior and navigation methods when a ship passes through a high-risk point of collision based on AIS data. Jie, M.; Yudong, S.; et al. [29], proposed a ship collision avoidance decision method that combines the idea of speed barrier and artificial potential field theory to solve the collision avoidance of ships in restricted waters. Yu, Y.; Zheng, J.; et al. [30] considered not only the navigable environment of open water but also the complex nature of narrow waterways when modeling maritime traffic, concluding that the ship chase process in restricted waters is more dangerous than that in open waters. Therefore, studying the pursuit process in narrow waterways is of great interest.
The focus of this paper is on the problem of ships overtaking in crowded waters, particularly ships overtaking in the straight channel in port waters. Since the positions of two ships change dynamically during the overtaking process, this paper specifically focuses on overtaking after the straight and horizontal sections.
2. Vessel Chasing Across in a Straight Channel
Figure 1.
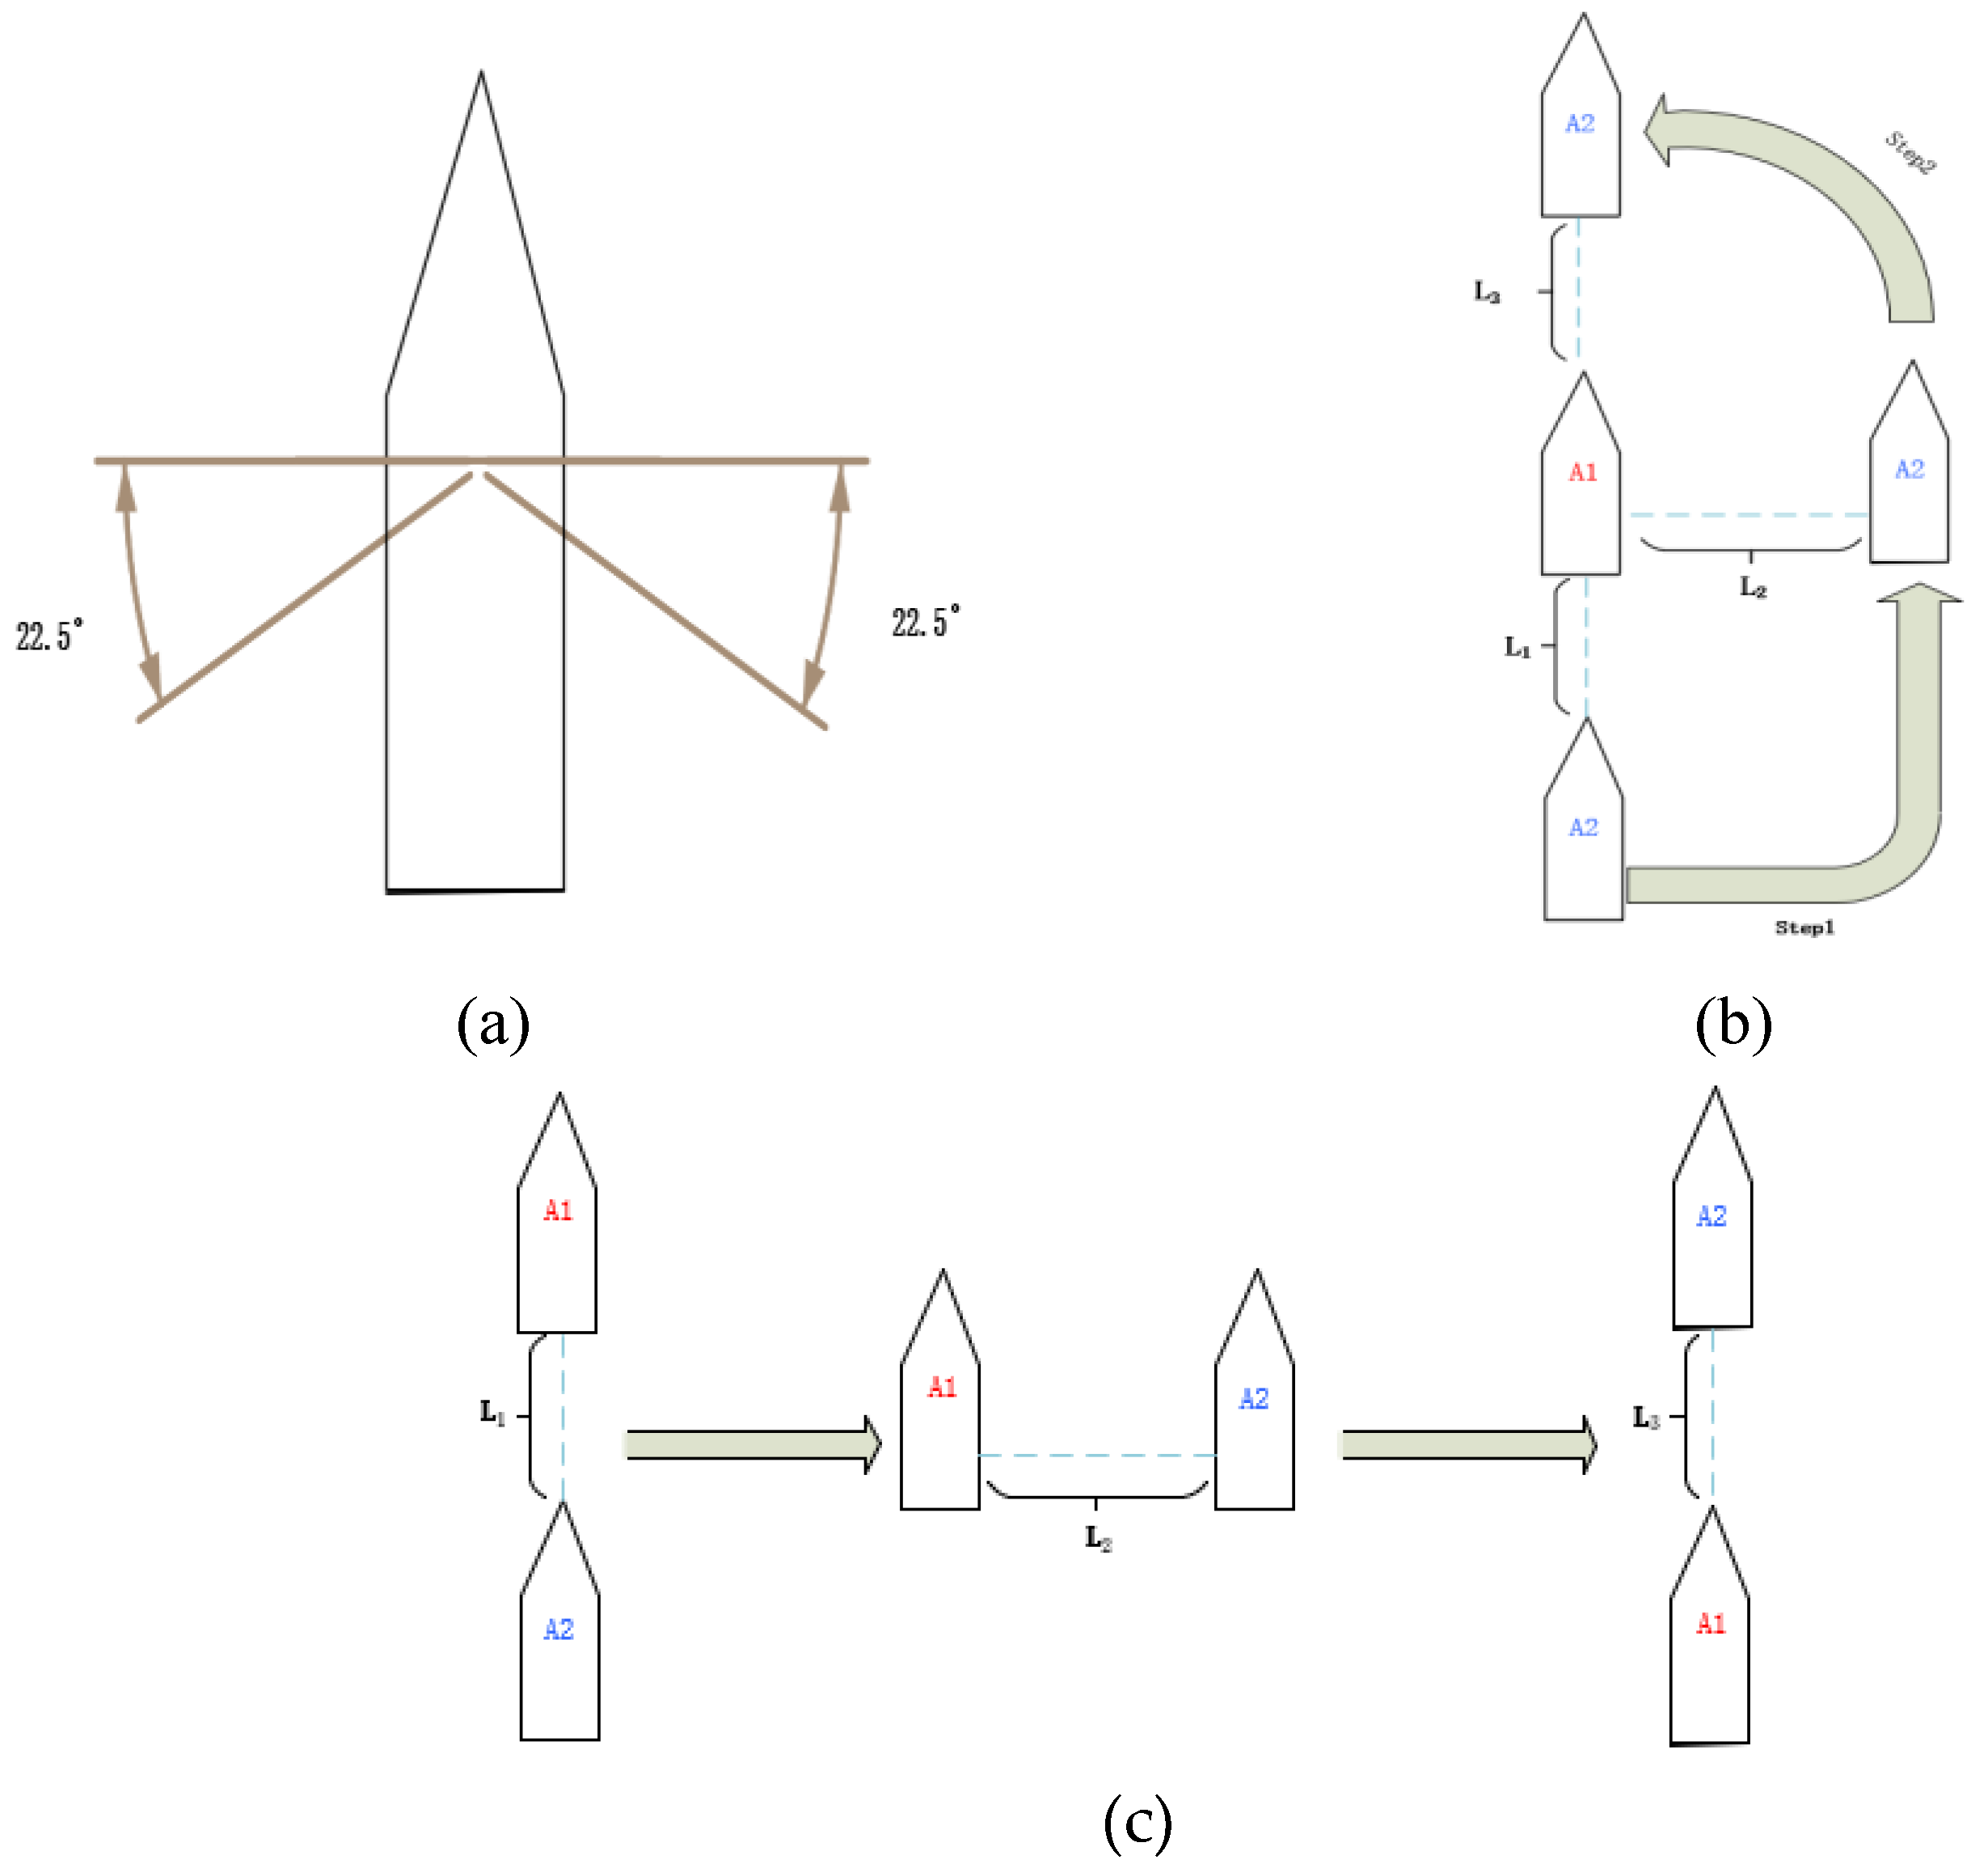
Schematic diagram of the position of the ship overtaking: (a) Schematic diagram of the overtaking situation; (b) Chase behind; (c) Change of position indication during overtaking.
Figure 1.
Schematic diagram of the position of the ship overtaking: (a) Schematic diagram of the overtaking situation; (b) Chase behind; (c) Change of position indication during overtaking.
The chase process has a close relationship with ship navigation safety, particularly in narrow waterways and deep water channels where the risk of collision due to ship chase is higher. Therefore, to resolve the issue of ship chase and collision in narrow waterways, and to identify the characteristic parameters and boundary conditions of the chase process, a clear understanding of basic knowledge related to ship chase is crucial.
According to the definition of overtaking by a ship in the International Regulations for Preventing Collisions at Sea 1972, three conditions need to be met for a pilot to determine whether his ship is overtaking.
(1) Position condition, the ship is in any position greater than 22.5° directly astern of the preceding ship and the ship is within the range of the preceding ship's stern light.
(2) Speed condition, the speed of the vessel astern must be greater than that of the vessel ahead so as to indicate that the vessel is catching up with the vessel ahead.
(3) The distance condition, where the boat behind must be within observable distance of the boat ahead, whether by day or by night.
Where the position condition of the ship chasing over is given in Figure 1a, Figure 1b indicates the chasing process of the chasing vessel A2 from directly behind the chased vessel A1, and L1, L2, L3, indicates the initial longitudinal distance when the ship starts to chase over, the lateral distance difference when the longitudinal distance between the two vessels is the same, and the longitudinal distance between the two vessels at the end of the chase over. Figure 1c gives the specific overtaking process, divided into the phase at the beginning of the overtaking, the parallel phase, and the phase at the end of the overtaking.
3. Chasing Over Eigenvalue Solutions
3.1. Establishment and Transformation of the Coordinate System
A coordinate system is established using a point in a section of unidirectional deep water channel as a reference point. The longitude and latitude coordinates of the ship in the AIS data are converted into distance coordinates. The form of the established coordinate system is shown in Figure 2. x-direction is the longitudinal direction of the channel, x-positive direction is the direction of ship travel, y-direction is the transverse direction of the channel, and y-positive direction is the positive transverse direction of the ship traveling along the channel in the positive direction.
Use the Mercator projection calculation method for coordinate axis transformation:
is the first eccentricity; is the second eccentricity. Among them, and represent the semi-major axis and semi-minor axis of the ellipsoid, respectively. There are three kinds of ellipsoid parameters commonly used in our country. In this case, a = 6378245, b = 6356863, and the units of both parameters are meters.
Denote the coordinates of latitude and longitude as (lat, lon), and the converted coordinates as (x, y).
Wherein represents the latitude of the origin of the established coordinate system, and represents the longitude of the origin of the established coordinate system. and are the transformed coordinates.
3.2. Algorithms
3.2.1. Determination of Overtaking Ships
By analysing a large number of trajectories of chasing vessels in the straight channel, it is found that the trajectory of both the chasing vessel and the chased vessel in the direction of the channel X can be approximated as a diagonal line; the trajectory of the chasing vessel in the direction of the channel Y is approximated as a curve with a crest, and the crest appears in the parallel phase. The determination of the chase vessel is shown in Figure 3, where the "reasonable range" for judging whether there is a chase vessel is specified as the coordinates of the intersection point in the channel.
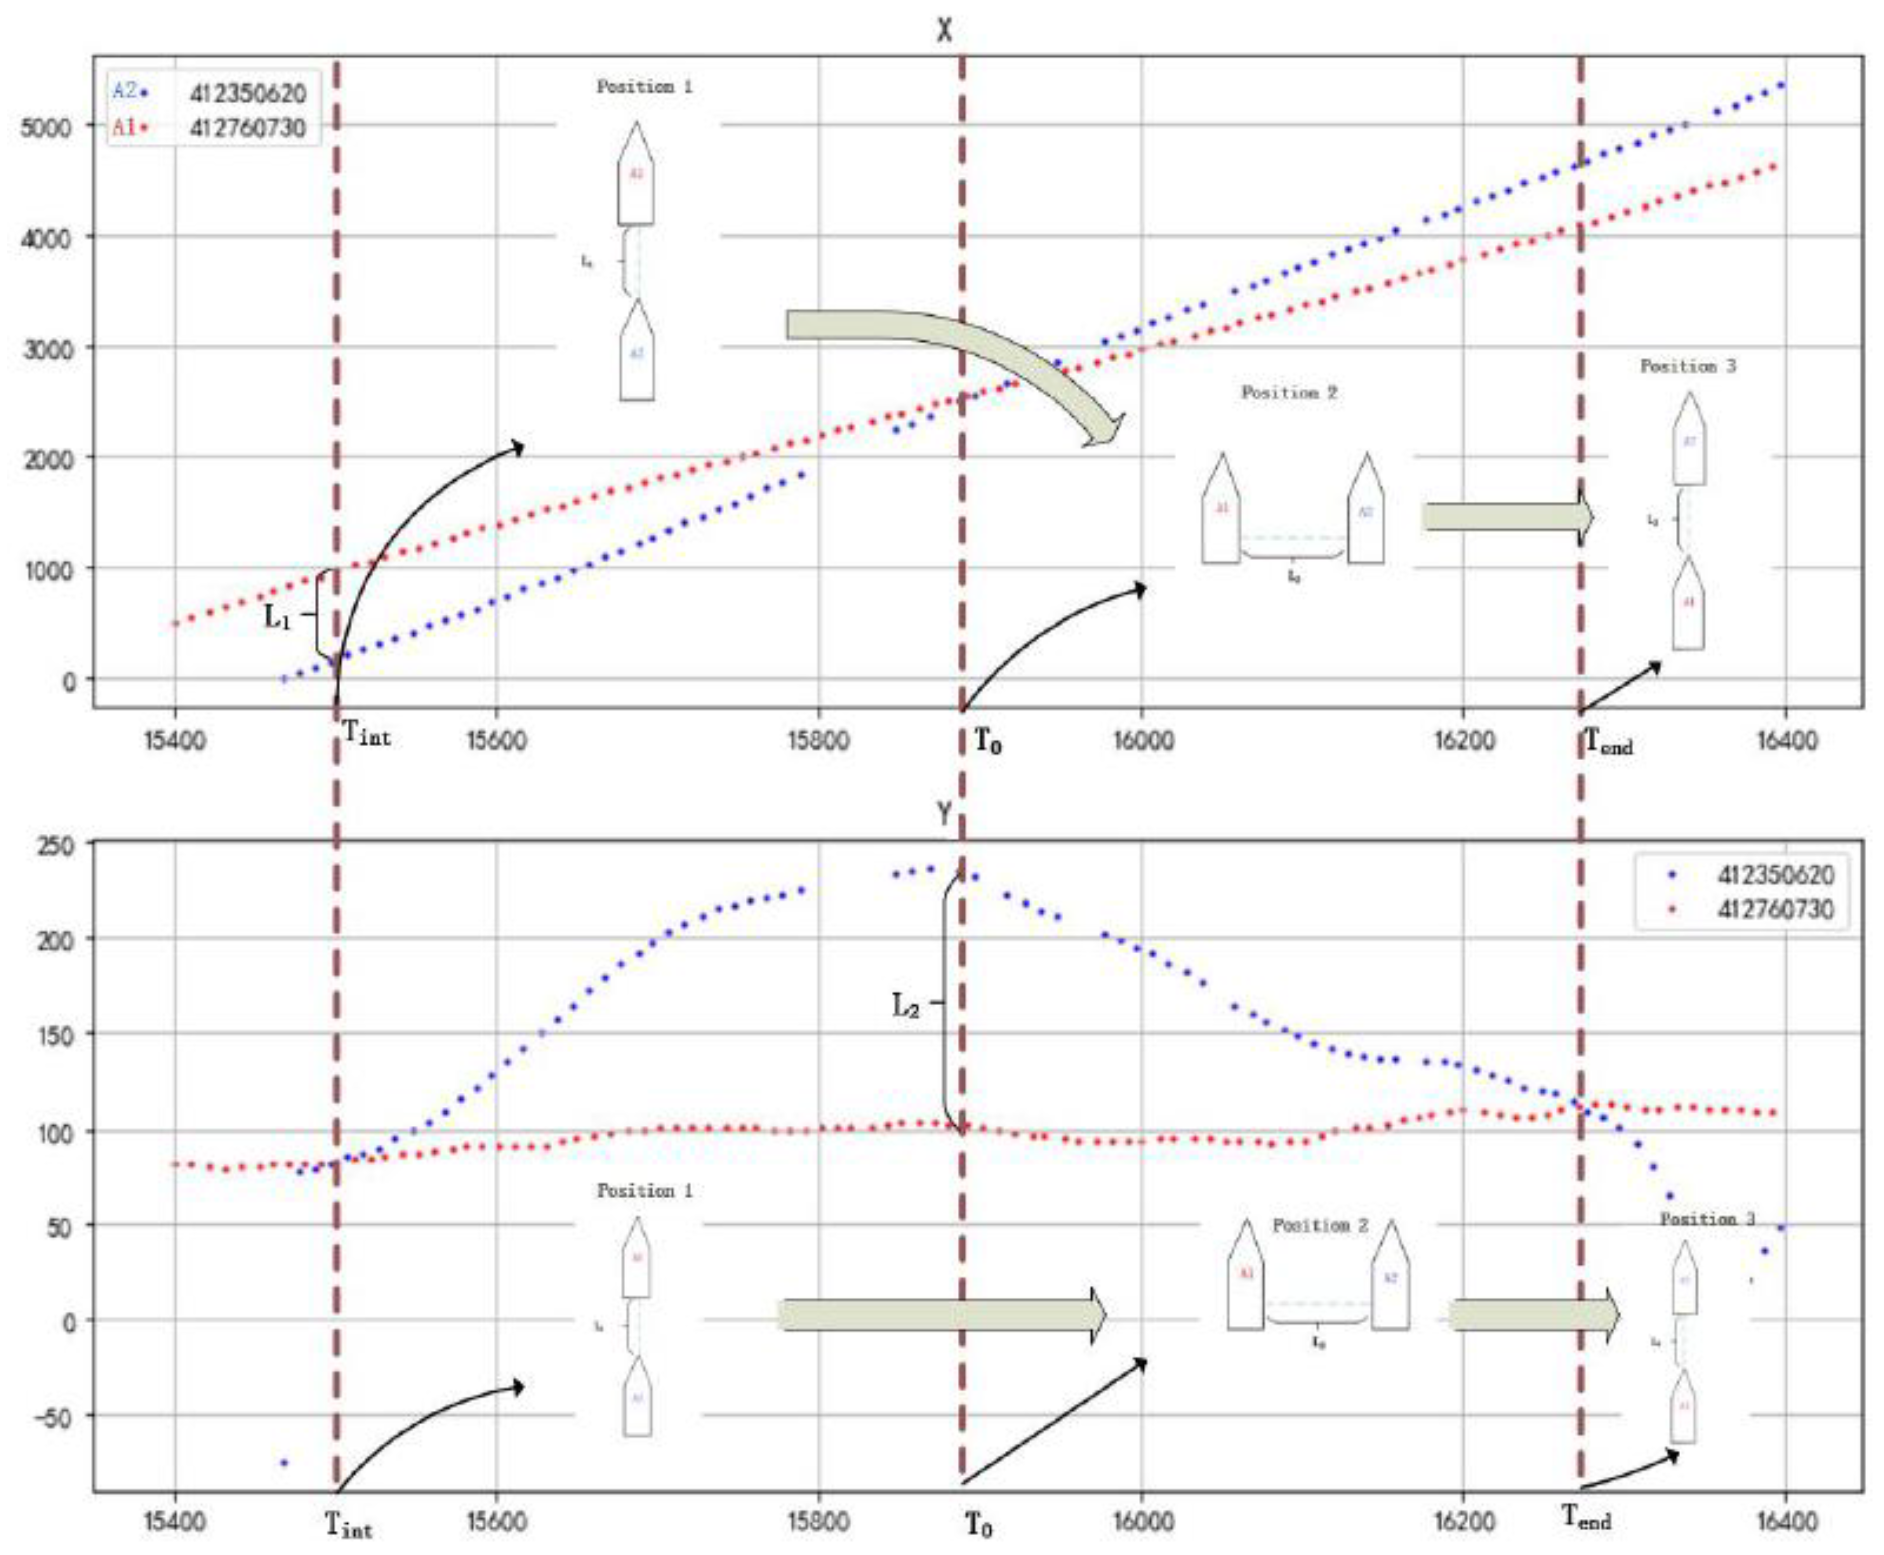
The process of vessel overtaking is shown in Figure 4, where Tint, T0, and Tend are the start of the overtaking phase, the parallel phase, and the end of the overtaking phase respectively.
Figure 3.
Determination of overtaking the ship.
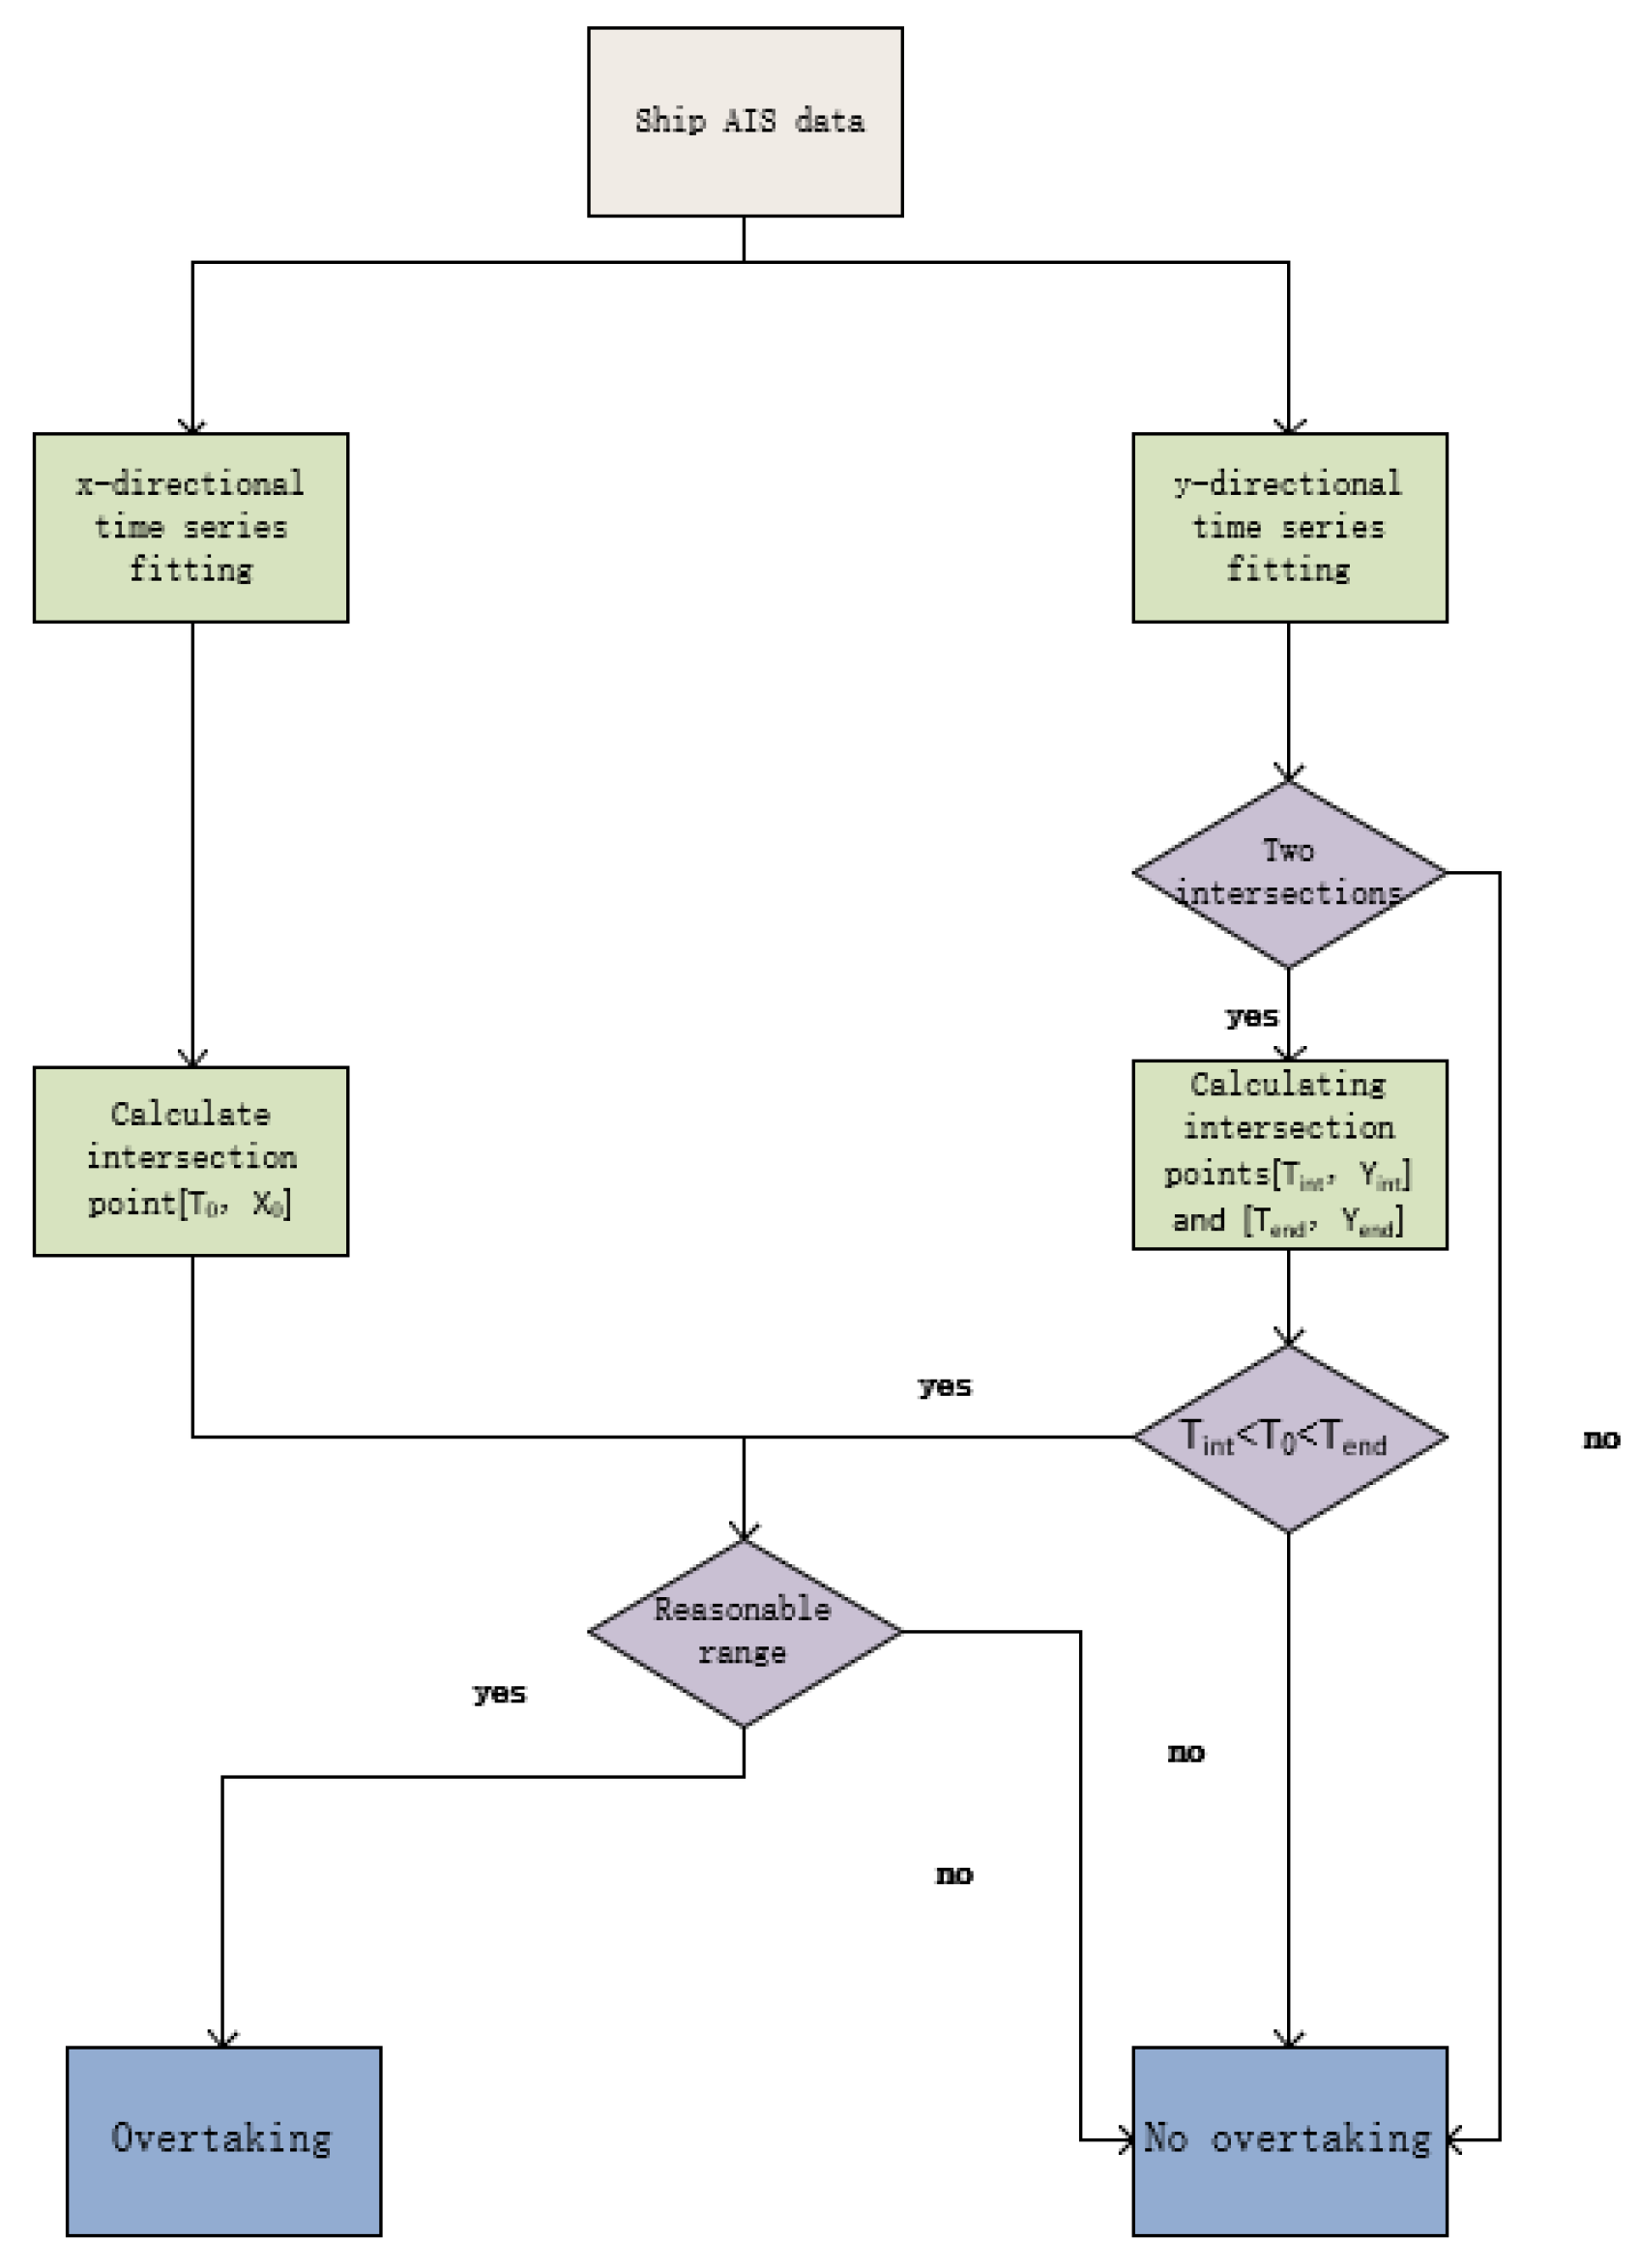
Figure 4.
Schematic diagram of the ship chase.
In order to be able to quantitatively describe the 3 phases in a pursuit, 7 pursuit characteristics were selected as well to determine whether the pursuit was carried out from the port or starboard side of the vessel being pursued. These characteristic quantities are
The initial longitudinal distance L1 at the start of the pursuit; the speed difference ΔV1 at the start of the pursuit; the lateral distance L2 when the longitudinal distances of the two vessels are the same; the speed difference ΔV2 when the longitudinal distances of the two vessels are the same; the longitudinal distance L3 between the two vessels at the end of the pursuit; the speed difference ΔV3 between the two vessels at the end of the pursuit; and the maximum steerage ΔC of the pursuing vessel.
To facilitate the calculation, some preconditions must first be declared when defining overtaking characteristics.
(1) In the reduction of the ship's track in this paper, the ship's motion is identified as that of a point, ignoring attributes such as the ship's captain.
(2) At the beginning and end of the pursuit, the lateral component of the speed is considered to be zero and only the longitudinal speed exists and in the same direction when calculating the difference in speed between the pursuing and pursued vessel ΔV1 and ΔV3.
3.2.2. Chasing the Feature Solver
Calculation of Overtaking Characteristics of Straight Channels
Step1: Find the time T2 when the longitudinal distance between the two ships is the same, then analyze the trajectories in the X direction, perform linear fitting on the trajectories of the two ships in the X direction, and calculate the intersection point of the two oblique lines, which is the time point T2 when the longitudinal distance between the two ships is the same.
Step2: By substituting T1 and T2 into the function formulas of the two ships after fitting in the X direction and subtracting them, the initial longitudinal distance L1 of the two ships and the longitudinal distance L3 of the two ships at the end of overtaking can be obtained. Similarly, the lateral distance L2 when the longitudinal distance between the two ships is the same can be obtained according to T2.
Step3: When fitting the values in the X direction of the two ships, the values in the two stages of [T1, T2] and [T2, T3] will be linearly fitted respectively, and a total of 4 analytical formulas of straight lines will be obtained. The slopes are the speeds of the two ships at T1 and T3, respectively. This paper assumes that the two ships have speeds in the X direction and the same direction at T1 and T3. Subtraction gives the speed differences between ΔV1 and ΔV3.
Step4: At T2, the two ships have lateral speed and are in the parallel sailing stage, so it is considered that the two ships are heading in the same direction. The fitting functions of the two ships in the Y direction at time T2 are respectively derived, but since the trajectory of the overtaking ship in the Y direction is not very regular, the direct use of the polynomial interpolation method may cause large errors. Therefore, it is possible to use a piecewise method and use the Cubic Spline method to fit. The speed components Vy1 and Vy2 of the two ships in the Y direction are obtained respectively, and the speed of the two ships is obtained by combining the speed vectors in the X and Y directions, and the speed difference ΔV2 can be obtained by subtracting them.
Step5: The speed of the overtaking ship in the X direction is almost constant, and the overtaking ship is located directly behind the overtaking ship when it starts to overtake, and the change in the magnitude of its rotation mainly depends on the speed Vy in the Y direction, Therefore, the maximum value of Vy can be found. At this time, the rotation amplitude ΔC of the overtaking ship is the maximum rotation amplitude.
3.3. Normality Test
Due to the inherent weaknesses of sample data, such as different characteristics across samples and a limited number of samples, it may not be possible to reflect other characteristics beyond the sample range. Therefore, in order to fully capture the characteristics of the overall population, fitting the data characteristics to a distribution is necessary to obtain a scientific reflection of the overall probability distribution. The process of testing the normality of the distribution of each feature involves first creating a QQ plot for each indicator. If the scatter of the QQ plot falls closely along the same line, there is a high probability that the distribution is normal. A K-S test is then performed on these potential features.
(1) Quantile-Quantile Plot
QQ plot is a test method to test whether a group of data obeys a certain distribution or whether two groups of data obey the same distribution in the form of graphics. It is a kind of distribution test that uses the comparison of actual quantiles and theoretical quantiles.
QQ plot is a scatter plot, where the abscissa is the quantile of one set of data, and the ordinate is the quantile of another set of data. If the two sets of data follow the same distribution, then all the points in the graph should all fall on a straight line with a slope of 45°, or cluster around a straight line with a slope of 45°.
(2) K-S test
The K-S test is used to test whether the actual distribution of a set of sample data is consistent with a hypothesized theoretical distribution.
The principle of the K-S test is to compare the cumulative frequency of the frequency distribution in the sample data with the theoretical cumulative frequency under a specified distribution. If the difference between the two is not large, the sample data can be considered to conform to the specified distribution.
3.4. Clustering
In order to obtain the boundary conditions of the chase-crossing characteristics of this section of the straight channel, seven chase crossing characteristics need to be analyzed. By analyzing the distribution characteristics between L1, L2 L3 ΔV1, ΔV2 and ΔV3, ΔC. at different distances, the final boundary conditions of the straight channel chase over the section are obtained. However, if these distance characteristics are segmented based on subjective experience, no scientific boundary conditions can be obtained. In order to segment the 3 distance features into, four 2-dimensional data sets were clustered by a K-means clustering algorithm based on weighting coefficients, and the number of classification clusters K was determined by the Silhouette coefficient.
The silhouette coefficient is a method used to measure the close relationship between points in a class and points in other classes and is also used to evaluate the number of clusters. The specific calculation formula is as follows:
where represents the minimum value of the average distance between sample point and sample points in other clusters. The larger the value, the greater the difference between different clusters.
represents the average distance from sample point to other sample points in the same cluster. The smaller the value, the greater the similarity between the clusters.
It can be seen from formula 7 that the value range of is , and the larger the value, the more reasonable the clustering result is.
When , it means that the clustering result of the sample point i is correct;
When , it means that the sample point i is on the boundary of two clusters;
When , it means that the clustering result of sample point i is wrong.
in formula 2-2 represents the total number of samples, represents the average value of all sample points , when takes the maximum value, the corresponding cluster centers are The number K is the optimal number of clusters.
In the K-means clustering algorithm, the feature weighting coefficient also reflects the size of the result when the distance between the sample point and the cluster center is calculated [31]. The selection of the weighting coefficient should be based on the degree of dispersion between the samples of each type of tracing feature.
In this paper, the discrete coefficient is selected as the weighting coefficient of each feature, which is defined as the ratio of the standard deviation of a group of data to the average value. The calculation formula is:
and represent the standard deviation and mean of a set of sample features, respectively. Because a feature with a larger degree of dispersion has a greater impact on the clustering result, the weighting coefficient of the feature will also be larger.
The weighted Euclidean distance calculation formula at this time is:
denotes 1 feature in a dataset with feature dimension n, and denote the i-th and j-th sample points of feature m in the dataset, respectively, and denotes the weight.
4. Experiments
In order to verify the algorithm proposed in this paper for calculating the overtaking characteristics of the straight channel, this chapter will use the algorithm to solve the overtaking characteristics of the actual data and analyze these characteristics.
The research water area selected in this paper is a certain straight channel of Shanghai Port, and the selected data is the AIS data of this channel in January 2010. The scope of this channel is shown in Figure 5. The selected channel reference coordinates are (121.5832°E, 31.3919°N), (121.6843°E, 31.3428°N), (121.6776°E, 31.3347°N), (121.5773°E, 31.3833°N). The direction of the x-axis is the longitudinal direction of the channel, and the direction of the y-axis is the transverse direction of the channel.
This section of the channel was chosen as the example channel for analysis because.
(1) There is a high volume of vessel traffic in the channel, the navigation situation is complex and there are many different types of vessels, and the maneuverability of vessels varies considerably, so there is a possibility of overtaking.
(2) The AIS data for this section of the waterway in January 2010 was selected because at that time the prohibition of overtaking was not strictly enforced. According to the Regulations of the Safety Management Method of the Yangtze River Estuary Deep Water Navigation Channel issued on 15 January 2018, chase crossing has been banned in this section of the channel, which came into effect on 1 September 2019.
4.1. Experimental Results
Based on the AIS data for this section of the channel in January 2010, a total of 105 sets of chase overflows were found by applying the algorithm described above to a total of 31 days of data for that month. The analysis of these 105 sets of chase overpasses resulted in the partial data shown in Table 1.
The 7 kinds of eigenvalues of the straight channel overtaking are obtained through the algorithm, and then the histogram and the density map are drawn. The data diagram of the chasing process is shown in Figure 6 below:
The test results of 7 tracking characteristic values are shown in Table 2:
4.2. Experimental Analysis
4.2.1. Normality Test
First, use the QQ map to test it. The pictures of these 6 eigenvalues are as follows:
Figure 7.
QQ plot test: (a) ; (b) ; (c) ; (d) ; (e) ; (f) .
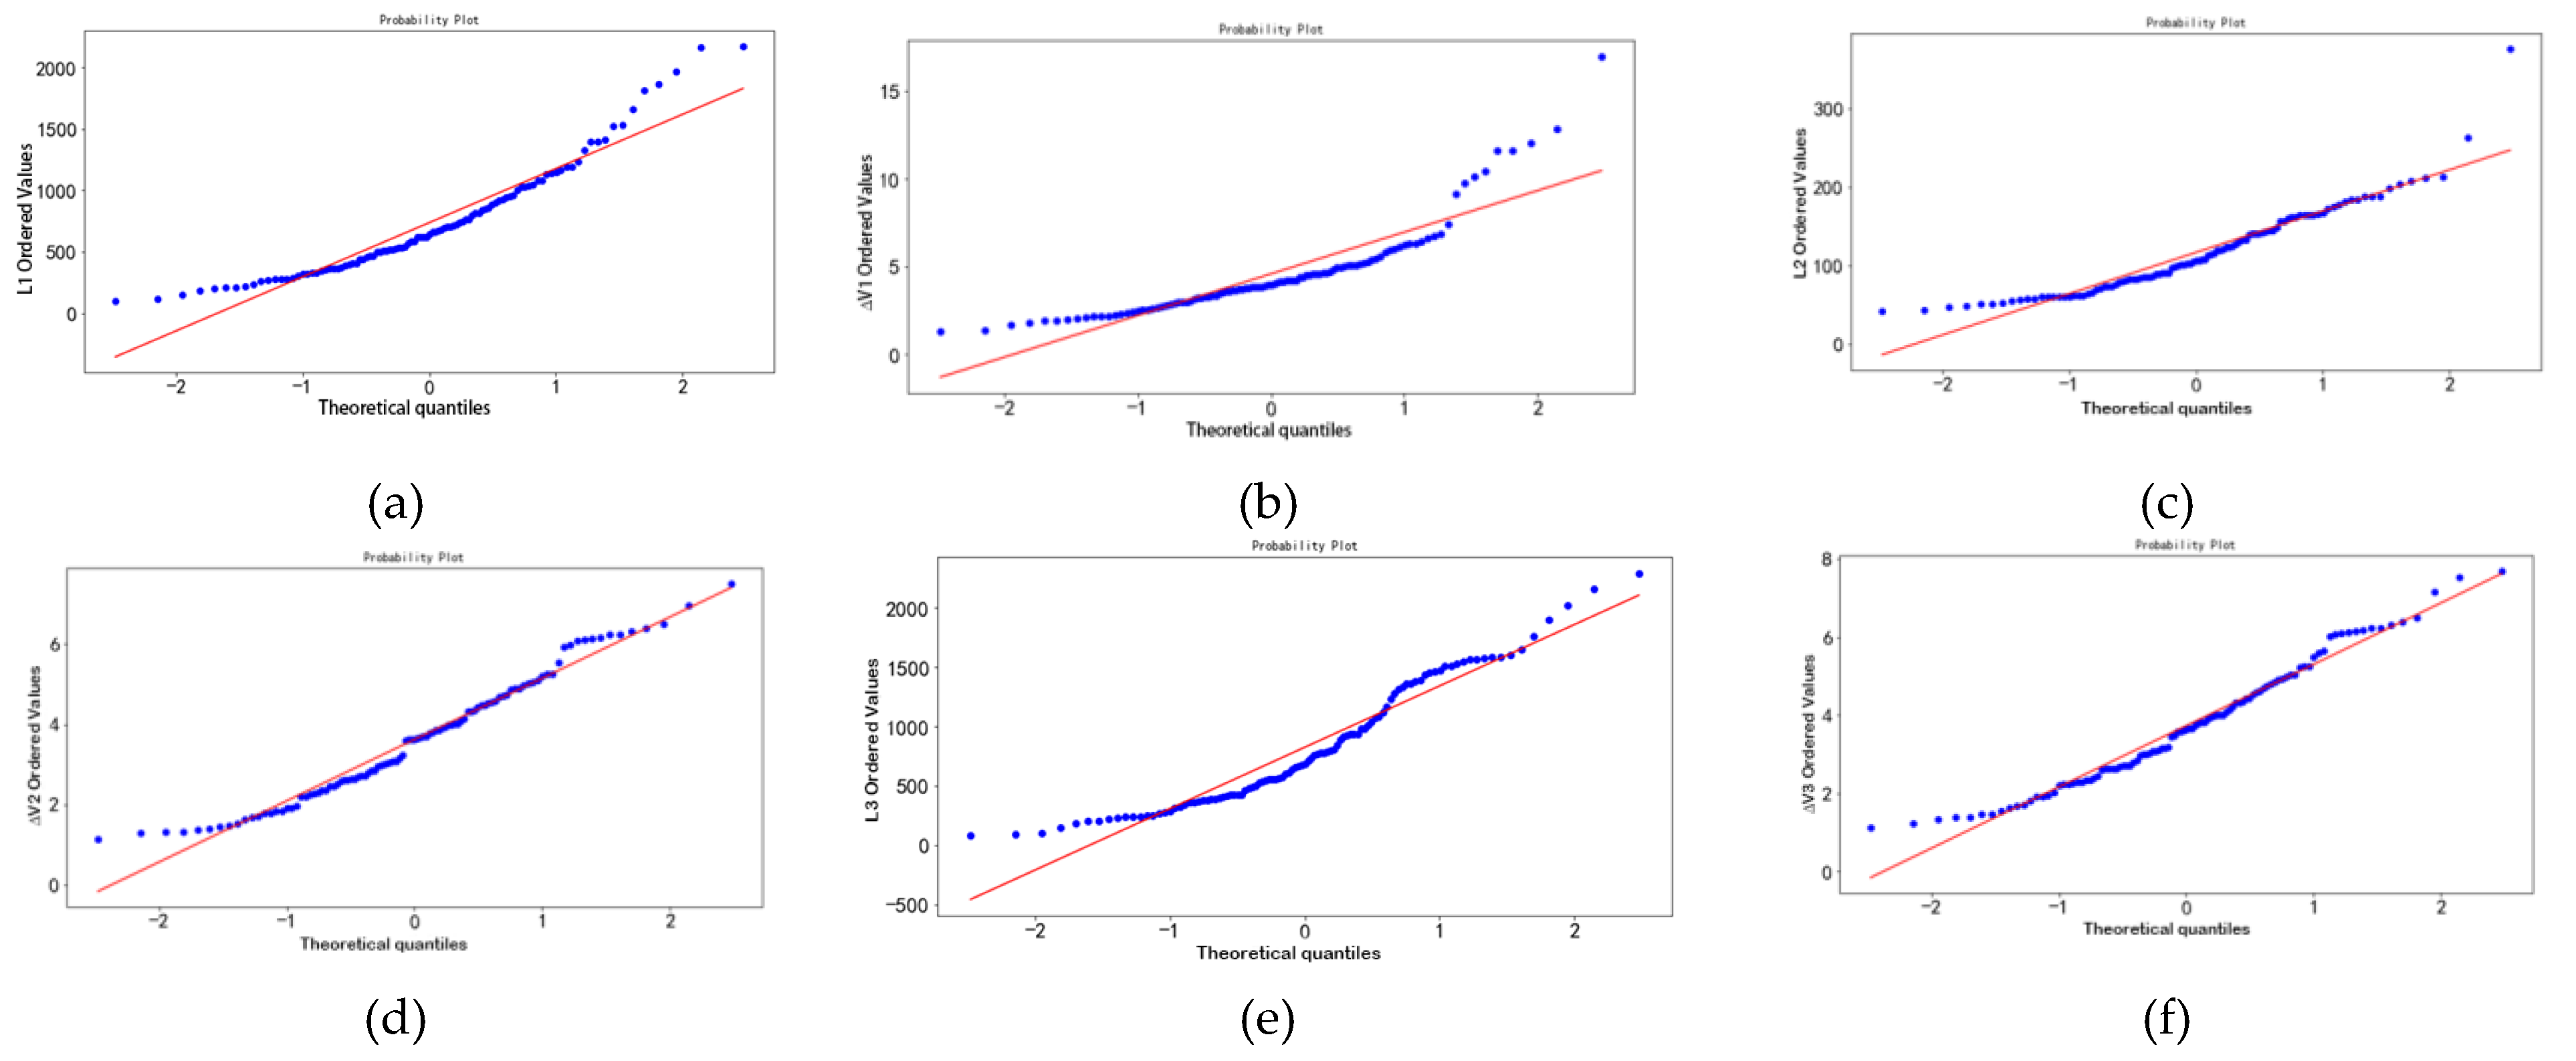
Most of the scatter points of the six features in the figure fall on the same straight line, and it is inferred that these features conform to a normal distribution. In order to verify the correctness of the inference, it is also necessary to perform a K-S test on these 6 features.
The selected significance level of this test is α = 0.05, n = 105, which is obtained from the critical value table according to the calculation formula:
Through the calculation, the maximum difference Dn between the cumulative frequency of the sample data of the 6 features and the theoretical frequency is obtained.
As shown in Table 3, these 6 eigenvalues all conform to the normal distribution.
4.2.2. Correlation Test
The Pearson correlation coefficient was used to test, and the correlation coefficient and p value test results between the three groups of features were obtained, and the test level α = 0.05 was selected.

Table 4.
Correlation coefficients between groups of features.
| Group | ] | ] | |
|---|---|---|---|
| Correlation coefficient | 0.203 | -0.14 | 0.46 |
| p | 0.037 | 0.153 | 0.00000808 |
According to Table 4, it can be seen that there is a significant positive linear relationship between the initial longitudinal distance L1 and the speed difference ΔV1, that is, the initial longitudinal distance L1 when the overtaking ship begins to overtake depends partly on the speed of the two ships The magnitude of the difference; although the correlation coefficient between the lateral distance L2 and the speed difference ΔV2 when the longitudinal distance between the two ships is the same is not 0, the p value is > 0.05, so there is no linear relationship between L2 and ΔV2; There is a strong positive linear relationship between the longitudinal distance L3 of the ship and the speed difference ΔV3.
4.3. Cluster Analysis
Analyze the distribution characteristics of the seven eigenvalues under different distance conditions to find the boundary conditions for the straight channel to overtake. In order to segment the three distance features, four groups of two-dimensional data sets are clustered by the K-means clustering algorithm based on the weighting coefficient, and the number of classification clusters K is determined by the Silhouette coefficient. The four datasets are [,], [,], [,], [,]. After normalizing the 7 features, the data is clustered by the traditional K-means clustering algorithm and the K-means clustering algorithm based on weighting coefficients.
Table 5.
Maximum Silhouette Coefficient of Two Clustering Methods.
| Algorithm | ] | ] | ] | ] |
|---|---|---|---|---|
| Algorithm1 | 0.469 | 0.468 | 0.420 | 0.460 |
| Algorithm2 | 0.756 | 0.704 | 0.719 | 0.759 |
As shown in Table 5, Algorithm 2 is better than Algorithm 1, and the clustering results of Algorithm 2 are as follows:
Figure 8.
Eigenvalue clustering: (a) [,]; (b) [,]; (c) [,]; (d) [,].
5. Conclusions
In order to further solve the problem of ships overtaking in narrow waterways, This study proposes a method to restore ship overtaking in narrow waters from historical AIS data to study the relevant characteristics of ship overtaking, and obtain three stages of overtaking characteristics. Finally, a case of a straight channel in Shanghai port based on AIS data is studied, and some statistical methods are used to obtain the distribution characteristics of the overtaking features of this straight channel and the relationship between the overtaking features. The evaluation is carried out, and the boundary conditions of the overtaking characteristics of the straight channel are obtained. The strength of the approach appears in the capability to obtain boundary conditions of navigable waters before sailing. The boundary conditions obtained can provide a data base for the underlying control model that enables intelligent ships in narrow waterways to chase over the situation, further enhancing the ship's autonomous navigation capability and providing a scientific basis for the study of intelligent ships chasing over in narrow waterways.
Due to the deterministic and acceptable solution derived for the complex overtaking situation, the large variation in the boundary conditions obtained for different study waters, repetition and robustness for the uncertainty of other ship’s behaviours, it can be applied to an on board overtaking decision-making system and promotes the automation level of a USV or an autonomous ship.
The method can be further improved by taking into account multiple ship encounter scenarios and varying ship sizes, specifying distinct boundary conditions for different encounter modes based on ship sizes, and considering the uncertainty of environmental disturbances and regional obstructions.
Author Contributions
The authors confirm that the contributions to the paper are as follows: study conception and design: Y.L. and J.L.; data collection: Y.L. and J.L.; analysis and interpretation of results: Y.L. and J.L.; draft manuscript preparation: Y.L. and J.L. All the authors reviewed the results and approved the final version of the manuscript. All authors have read and agreed to the published version of the manuscript.
Funding
This work was supported by the National Natural Science Foundation of China under grant 51509151, and in part by the Shandong Province Key Research and Development Project under grant 2019JZZY020713, the Shanghai Commission of Science and Technology Project under grant 21DZ1201004 and 2300501900, and the Anhui Provincial Department of Transportation Project under grant 2021-KJQD-011.
References
- Ferdowsi, M.A. UNCTAD–United Nations conference on trade and development. In A Concise Encyclopedia of the United Nations; Brill Nijhoff, 2010; pp. 698–705. [Google Scholar]
- Fang, Z.; Yu, H.; Ke, R.; Shaw, S.L.; Peng, G. Automatic identification system-based approach for assessing the near-miss collision risk dynamics of ships in ports. IEEE Transactions on Intelligent Transportation Systems 2018, 20, 534–543. [Google Scholar] [CrossRef]
- Kim, S.H.; Roh, M.I.; Oh, M.J.; Park, S.W.; Kim, I.I. Estimation of ship operational efficiency from AIS data using big data technology. International Journal of Naval Architecture and Ocean Engineering 2020, 12, 44. [Google Scholar] [CrossRef]
- Yim, J.B.; Lee, C.K. Identifying high-collision potential vessel-bridge pairs in vessel traffic service. Journal of Marine Science and Technology 2020, 28, 17. [Google Scholar]
- Thind, N.S.; Soffker, D. Probabilistic ship behavior prediction using generic models. In Proceedings of the 2022 IEEE 25th International Conference on Intelligent Transportation Systems (ITSC); 2022; pp. 250–255. [Google Scholar]
- Zhen, R.; Jin, Y.X.; Hu, Q.Y.; Shi, C.J.; Wang, S.Z. Vessel behavior prediction based on AIS data and BP neural network. Navig. China 2017, 40, 6–10. [Google Scholar]
- Zhe, X.; Qin-you, H.U.; Chao-jian, S.H.I.; Chun, Y. Computation method of ship domains in restricted waters based on AIS data. Jiao Tong Yun Shu Gong Cheng Xue Bao 2015, 15, 110–117. [Google Scholar]
- Goodwin, E.M. A statistical study of ship domains. The Journal of Navigation 1973, 26, 130. [Google Scholar] [CrossRef]
- van der Tak, C.; Spaans, J.A. A Model for Calculating a Maritime Risk Criterion Number. J. Navig. 1977, 30, 287–295. [Google Scholar] [CrossRef]
- Davis, P.V.; Dove, M.J.; Stockel, C.T. A Computer Simulation of Multi-Ship Encounters. J. Navig. 1982, 35, 347–352. [Google Scholar] [CrossRef]
- Coldwell, T.G. Marine Traffic Behaviour in Restricted Waters. J. Navig. 1983, 36, 430–444. [Google Scholar] [CrossRef]
- Dinh, G.H.; Im, N.-K. The combination of analytical and statistical method to define polygonal ship domain and reflect human experiences in estimating dangerous area. Int. J. e-Navigation Marit. Econ. 2016, 4, 97–108. [Google Scholar] [CrossRef]
- Im, N.; Luong, T.N. Potential risk ship domain as a danger criterion for real-time ship collision risk evaluation. Ocean Eng. 2019, 194, 106610. [Google Scholar] [CrossRef]
- Hörteborn, A.; Ringsberg, J.W.; Svanberg, M.; Holm, H. A Revisit of the Definition of the Ship Domain based on AIS Analysis. J. Navig. 2019, 72, 777–794. [Google Scholar] [CrossRef]
- He, Y.; Huang, L.; Mou, J.J. Automatic collision avoidance for ships approaching head-on with MMG and ship domain. Navig China 2014, 4, 92–95. [Google Scholar]
- Zinchenko, S.; Mateichuk, V.; Nosov, P.; Popovych, I.; Solovey, O.; Mamenko, P.; Grosheva, O. Use of Simulator Equipment for the Development and Testing of Vessel Control Systems. Electr. Control. Commun. Eng. 2020, 16, 58–64. [Google Scholar] [CrossRef]
- Liu, R.; Xue, Y.; Liu, Y.; Lin, X.J. Numerical model of ship automatic collision avoidance and the application in restricted water areas. Harbin Gongye Daxue Xuebao Journal of Harbin Institute of Technology 2018, 50, 171–177. [Google Scholar]
- Nie, H.; Ren, J.; Ren, H. USV's automatic collision avoidance based on improved dynamic potential field method. In Proceedings of the 2021 International Conference on Security, Pattern Analysis, and Cybernetics (SPAC); 2021; pp. 590–595. [Google Scholar]
- Zinchenko, S.M.; Nosov, P.S.; Mateychuk, V.M.; Mamenko, P.P.; Grosheva, O.O. Automatic collision avoidance with multiple targets, including maneuvering ones. Radio Electronics, Computer Science 2019, 4, 211–222. [Google Scholar] [CrossRef]
- Xu, X.; Cai, P.; Ahmed, Z.; Yellapu, V.S.; Zhang, W. Path planning and dynamic collision avoidance algorithm under COLREGs via deep reinforcement learning. Neurocomputing 2021, 468, 171–197. [Google Scholar] [CrossRef]
- Shen, H.; Hashimoto, H.; Matsuda, A.; Taniguchi, Y.; Terada, D.; Guo, C. Automatic collision avoidance of multiple ships based on deep Q-learning. Appl. Ocean Res. 2019, 86, 268–288. [Google Scholar] [CrossRef]
- He, Y.; Li, Z.; Mou, J.; Hu, W.; Li, L.; Wang, B. Collision-avoidance path planning for multi-ship encounters considering ship manoeuvrability and COLREGs. Transp. Saf. Environ. 2021, 3, 103–113. [Google Scholar] [CrossRef]
- Junmin, M.; Mengxia, L.; Weixuan, H.; Xiaohan, Z.; Shuai, G.; Pengfei, C.; Yixiong, H. Mechanism of dynamic automatic collision avoidance and the optimal route in multi-ship encounter situations. J. Mar. Sci. Technol. 2021, 26, 141–158. [Google Scholar] [CrossRef]
- Lyu, H.; Yin, Y.; Yin, J. Application of hybrid intelligent systems collision avoidance decision-making automatic ships. Journal of Dalian Maritime University 2015, 41, 29–36. [Google Scholar]
- Zhao, Z.; Wang, J.X. Ship automatic anti-collision path simulations based on reinforcement learning in different encounter situations. Sci. Technol. Eng 2018, 18, 218–223. [Google Scholar]
- Kang, M.J.; Zohoori, S.; Hamidi, M.; Wu, X. Study of narrow waterways congestion based on automatic identification system (AIS) data: A case study of Houston Ship Channel. J. Ocean Eng. Sci. 2022, 7, 578–595. [Google Scholar] [CrossRef]
- Liu, C.; Liu, J.; Zhou, X.; Zhao, Z.; Wan, C.; Liu, Z. AIS data-driven approach to estimate navigable capacity of busy waterways focusing on ships entering and leaving port. Ocean Eng. 2020, 218, 108215. [Google Scholar] [CrossRef]
- Wu, X.; Rahman, A.; Zaloom, V.A. Study of travel behavior of vessels in narrow waterways using AIS data—A case study in Sabine-Neches Waterways. Ocean Eng. 2018, 147, 399–413. [Google Scholar] [CrossRef]
- Jie, M.A.; Yudong, S.U.; Yong, X.I.; Yu, Z.H.; Xin, Y.A. Decision-making method for collision avoidance of ships in confined waters based on velocity obstacle and artificial potential field. China Safety Science Journal 2020, 30, 60. [Google Scholar]
- Yu, Y.; Zheng, J.; Chen, J. Vessel behavior analysis on a narrow waterway. In ICTE; 2015; pp. 2799–2805. [Google Scholar]
- Sun, Q.; Zhang, Y.; Sun, L.; Li, Q.; Gao, P.; He, H. Spatial–temporal differences in operational performance of urban trunk roads based on TPI data: The case of Qingdao. Phys. A: Stat. Mech. its Appl. 2021, 568, 125696. [Google Scholar] [CrossRef]
Figure 2.
Coordinate map of overtaking channel.
Figure 5.
Selected channel and coordinates.
Figure 6.
Data diagram of overtaking process: (a) ; (b) ; (c) ; (d) ; (e) ; (f) ; (g) .
Table 1.
Partial data on ship chase characteristics.
| (m) | (kn) | (m) | (kn) | (m) | (kn) | (°) |
|---|---|---|---|---|---|---|
| 718.00 | 1.38 | 62.00 | 1.36 | 253.00 | 2.60 | 8.8 |
| 352.00 | 3.07 | 100.00 | 2.99 | 1566.00 | 2.99 | 8.7 |
| 736.00 | 6.63 | 143.00 | 6.14 | 1652.00 | 6.12 | 12.7 |
| 765.00 | 2.24 | 102.00 | 2.20 | 239.00 | 3.17 | 15 |
| 441.00 | 3.01 | 47.00 | 1.85 | 315.00 | 1.94 | 6.7 |
Table 2.
Statistical results of overtaking features.
| Chasing eigenvalues | Average value | Standard deviation | Minimum | Maximum |
|---|---|---|---|---|
| (m) | 736.30 | 453.68 | 102 | 2174 |
| (m) | 116.67 | 54.46 | 60.56 | 376 |
| (m) | 825.08 | 527.39 | 104 | 2294 |
| (kn) | 4.601 | 2.62 | 1.3 | 17 |
| (kn) | 3.623 | 1.53 | 1.13 | 7.52 |
| (kn) | 3.734 | 1.57 | 1.13 | 7.7 |
| (°) | 11.607 | 8.57 | 4.2 | 57.76 |
Table 3.
K-S test of overtaking features.
| Overtaking features | ||||||
|---|---|---|---|---|---|---|
| Dn | 0.107 | 0.121 | 0.108 | 0.132 | 0.124 | 0.085 |
Table 6.
and boundary conditions.
| Classification | Average | MIN | MAX | Median | Proportion |
|---|---|---|---|---|---|
| (m) [0, 640] | 390.06 | 102 | 622 | 379.5 | 49.52% |
| (kn) | 4.143 | 1.302 | 11.604 | 3.86 | 49.52% |
| (m) [640, 1300] | 898.02 | 646 | 1230 | 884 | 39.05% |
| (kn) | 4.888 | 1.380 | 17.009 | 3.849 | 39.05% |
| (m) [1300, 2200] | 1684.17 | 1324 | 2174 | 1597.5 | 11.43% |
| (kn) | 5.603 | 2.780 | 12.032 | 4.587 | 11.43% |
Table 7.
and boundary conditions.
| Classification | Average | MIN | MAX | Median | Proportion |
|---|---|---|---|---|---|
| (m) [0, 900] | 493.05 | 102 | 884 | 500 | 69.52% |
| (°) | 11.29 | 4.2 | 57.76 | 9.12 | 69.55% |
| (m) [900, 2200] | 1291.22 | 902 | 2174 | 1154 | 30.48% |
| (°) | 12.33 | 4.64 | 54 | 8 | 30.48% |
| (m) [0, 900] | 493.05 | 102 | 884 | 500 | 69.52% |
Table 8.
and boundary conditions.
| Classification | Average | MIN | MAX | Median | Proportion |
|---|---|---|---|---|---|
| (m) [0, 120] | 80.34 | 42 | 120 | 82.5 | 59.05% |
| (kn) | 3.781 | 1.283 | 7.523 | 3.752 | 59.05% |
| (m) [120, 220] | 161.707 | 124 | 213 | 162 | 39.05% |
| (kn) | 3.458 | 1.127 | 6.959 | 3.227 | 39.05% |
| (m) [220, 400] | 319.5 | 263 | 376 | 319.5 | 1.9% |
| (kn) | 2.09 | 1.924 | 2.255 | 2.09 | 1.9% |
| (m) [0, 120] | 80.34 | 42 | 120 | 82.5 | 59.05% |
Table 9.
and boundary conditions.
| Classification | Average | MIN | MAX | Median | Proportion |
|---|---|---|---|---|---|
| (m) [0, 900] | 510.2 | 84 | 986 | 479 | 67.62% |
| (kn) | 3.309 | 1.127 | 6.240 | 3.11 | 67.62% |
| (m) [900, 2300] | 1482.62 | 1014 | 2294 | 1467.5 | 32.38% |
| (kn) | 4.622 | 2.35 | 7.70 | 4.267 | 32.38% |
| (m) [0, 900] | 510.2 | 84 | 986 | 479 | 67.62% |
Disclaimer/Publisher’s Note: The statements, opinions and data contained in all publications are solely those of the individual author(s) and contributor(s) and not of MDPI and/or the editor(s). MDPI and/or the editor(s) disclaim responsibility for any injury to people or property resulting from any ideas, methods, instructions or products referred to in the content. |
© 2023 by the authors. Licensee MDPI, Basel, Switzerland. This article is an open access article distributed under the terms and conditions of the Creative Commons Attribution (CC BY) license (http://creativecommons.org/licenses/by/4.0/).
Copyright: This open access article is published under a Creative Commons CC BY 4.0 license, which permit the free download, distribution, and reuse, provided that the author and preprint are cited in any reuse.


