
Submitted:
03 April 2023
Posted:
03 April 2023
You are already at the latest version
Abstract
The dynamic and surface manipulation of the M13 bacteriophage meeting application demands enable a pathway to design efficient applications with high selectivity and responsivity rate. Herein, we report the role of the M13 bacteriophage thin film layer deposited on an optical nanostructure involving gold nanoparticles/SiO2/Si and its influence on optical and geometrical properties. The thickness of the M13 phage layer was either controlled by varying the concentration or humidity exposure levels, and optical studies were conducted. We designed a standard and dynamic model based upon three-dimensional finite-difference time-domain (3D FDTD) simulations distinguishing the necessity of each model under variable conditions. As seen from the experiments, the origin of respective peak wavelength positions is addressed in detail with the help of simulations. The importance of the dynamic model was noted when humidity-based experiments were conducted. Inexpensive, multi-wavelength optical characteristics from a single structure, reproducibility, and reversible properties are significant advantages of involving M13 bacteriophage. We believe this work will provide fundamental insight into understanding and interpreting the geometrical and optical properties of the nanostructures involving M13 bacteriophage.
Keywords:
M13 bacteriophage
; Metallic nanoparticles
; Plasmonics
; Dynamic response
; Self-assembly
; Simulations
1. Introduction
The functionalities of biomaterials have opened pathways in various multi-disciplinary applications like bio-optics, regenerative medicine, tissue engineering, energy devices, sensors, and point-of-care devices [1,2,3,4,5,6]. Notably, in the recent decade, M13 bacteriophage (hereafter termed M13 phage) has attracted significant interest in a wide variety of applications owing to its superior advantage(s) in self-assembly properties and manipulation of surface coat proteins concerning application requirements [7,8,9]. The M13 phage involved self-assembled nanostructures revealed a repeatable and regular formation of densely packed building blocks which is highly beneficial for designing and developing efficient devices per unit volume [7,8]]. This strategy leads to building and controlling the basic structural building blocks in a highly ordered and systematic manner through self-assembly techniques (inspired by biological systems or biomimetic approach) [7,10,11,12,13,14]. Furthermore, in the synthesis approach, handling properties of M13 phage were easier and non-toxic, which becomes essential in employing these biomaterials as templates. In addition to the above benefits, these highly ordered nanostructures can be fabricated on a large scale by a complex free, straightforward self-assembly method at a relatively low-cost [15,16,17,18,19,20].
Geometrically, the M13 phage is nanofibrous with a diameter of ~ 7 nm and a height of ~ 880 nm [21,22,23,24,25]. The bottom and top ends of the M13 phage consist of five to seven copies of pVII, pIX, pVI, and pIII coat proteins. A helically arranged 2700 copies of pVIII major coat protein is located on its body’s surface. With the help of the genetic engineering process, it is possible to engineer the major coat protein according to the application requirements. The advantages of utilizing surface coat protein engineering suiting application demands, environmentally friendly synthesis, and design of highly ordered reproducible nanostructures on a low-cost scale open various exciting applications in the field of optical nanostructures, point-of-care diagnostics, environmental care, sensors, solar device, photocatalysis, nanogenerators, and so on [10,13,18,19,20,21,22,26,27,28,29,30,31,32,33].
In particular, as the role of M13 phage in the sensor field has been enormously growing in great demand, it is necessary to understand how the M13 phage interacts and influences the optical and geometrical properties when it is integrated with a plasmonic or photonic nanostructure(s) [34,35,36,37,38,39,40,41,42]. The availability of large field local enhancement (bright optical mode) from these optical nanostructures alongside M13 phage’s numerous benefits could significantly engineer a variety of areas involving non-linear optics, plasmonic/photonic sensors, SERS, and biomedical applications.
In this work, we report a detailed optical and structural analysis study of M13 phage/gold nanoparticles/SiO2/Si nanostructure. The nano-gap effect in plasmonics could act as an attractive candidate in testing the M13 phage capabilities. The fabrication of Au nanoparticles and M13 phage on a SiO2/Si was done by a simple spin-coating approach. By introducing the varied levels of humid moisture, we reveal multi-wavelength optical properties from a single sample study. We designed a standard and dynamic model to understand the optical and geometrical properties by distinguishing non-humidity and humidity-based scenarios.
2. Materials and Methods
2.1. Fabrication of plasmonic nanoparticle – M13 bacteriophage biomaterial thin film nanostructure
The schematic of the fabrication process is shown in Figure 1. We prepared a Si wafer which went through a cleaning process in the following order: acetone, methanol, and isopropyl alcohol, respectively. A 300 nm thick SiO2 film is deposited on a Si wafer by PECVD, or plasma-enhanced chemical vapor deposition method, at 350* C. Gold film with a thickness of 9 nm is deposited on the SiO2/Si by an electron beam evaporation. The deposition rate of gold was maintained at 0.06 nm s-1 at room temperature. The fabricated substrate was sliced into 2 cm x 2 cm pieces and loaded into a rapid thermal annealing or RTA chamber with a halogen lamp as a heating source. The RTA chamber is pumped down to vacuum for two hours, and a chamber pressure of 1.8 mTorr was created by introducing nitrogen gas. The gold-coated substrate was then annealed at 820*C for two minutes to form the gold nanoparticles. Before coating M13 phage, the cleaning process Ag NPs/SiO2/Si was repeated and dried with nitrogen gas. M13 phage suspension was prepared by dispersing it in Tris-buffered saline buffer (37.5 mM NaCl and 12.5 mM of Tris, with a pH condition of 7.5). The nanostructured biomaterial thin film on Au NPs/SiO2/Si substrate was fabricated by spin coating of M13 phage (1500 rpm, 2 minutes). The M13 phage film’s thickness (t) was controlled by varying concentrations (6 mg/ml, 8 mg/ml, and 10 mg/ml). The M13 phage suspension’s concentration is confirmed by a UV-Visible spectrometer (EVO300PC, Thermo Scientific) and Beer-Lambert law calculation (7, 34).
2.2. Atomic Force Microscopy
We examined the surface topography of samples utilized in this work using an NX10 AFM system in a non-contact mode (Park Systems, Korea). We utilized a specialized probe (PPP-NCHR, NANOSENSORS, Neuchatel, Switzerland) for non-contact mode. The XY directional scanning of AFM was operated by XEP 3.0.4 data acquisition program and post-processed by XEI 1.8.2 image processing software (Park systems, Korea).
2.3. Optical measurements
The reflectance spectra of the plasmonic NP – biomaterial thin film nanostructure were measured using a commercial Olympus bright-field/dark-field (BF/DF) microscope (BX53M) with a 100X 0.9 NA objective. The color film was illuminated by using an unpolarized halogen light. The reflectance of the M13 phage color film was characterized using a fiber-optic spectrometer (US/USB4000, Ocean Optics, Dunedin, USA) under a reference to the white reflectance standard. Dark-field images were captured by a dark-field (DF) microscope (Olympus BX53M). An unpolarized halogen lamp was used to illuminate the sample(s), and the collection of scattered light from the sample was done by the objective lens (100X, 0.9 NA, respectively) in a DF mode. The color images were recorded in BF/DF mode with the help of a 16 MP CMOS camera with a sensor size of 1/2.33” and a built-in integrated image-signal processor (DigiRetina16, Tucsen Photonics, China) connected to the Olympus microscope. All these measurements were carried out in a dark room to prevent external light interference. With the help of our home-built chamber system, we were able to control the humidity levels input. At first, we removed any presence of moisture in the home-built chamber (with the sample) with the help of dry N2 gas and confirmed it with the humidity sensor. The input of humidity levels (moisture flow) was varied from 20% to 90% in 10% steps.
2.4. Three-dimensional electromagnetic simulations
A three-dimensional (3D) electromagnetic Maxwell solver utilizing the finite-difference time-domain method (FDTD) was employed to carry out optical simulations (ANSYS Lumerical FDTD, Canada) [43,44]. A plane wave source was used to illuminate the plasmonic NP – biomaterial thin film nanostructure (surrounded by air (n = 1) on top) with an incident electric field of E0 (see supporting information or SI Figure S1). The nanostructure is surrounded by periodic boundary conditions in the XY direction and a perfectly matched layer (PML) boundary in the Z direction. A cross-sectional power monitor was placed close to the plasmonic NP – biomaterial thin film nanostructure to capture XZ electric field amplitude profiles. A power monitor positioned above the plane wave source recorded the reflectance spectra. A general mesh size of 5 nm was applied for the entire simulated region, and a mesh override of 0.5 nm was applied close to the NP region. We selected the Au NP diameter “D” as 70 nm with an interparticle spacing or “gap” between NPs as 10 nm. The chosen material’s refractive indices were as follows: Johnson and Christy database for gold, Palik database for Si and SiO2, and n = 1.37 have been applied for M13 bacteriophage [34,45,46].
3. Results and Discussion
3.1. Fabrication analysis and optical properties
Figure 2 (a) schematically describes how the concentration of M13 phage could help adjust the biomaterial layer thickness on top of Au NPs/SiO2/Si. After spin coating M13 phage with variable concentration, it has begun to fill the spaces between Au NPs and on top of it. This was evident from AFM images, as shown in Figure 2 (b – e). Before M13 phage deposition, due to the height difference of Au NPs from SiO2 film, it is expected to have poor surface film quality (surface roughness). As observed for 6 mg/ml and 8 mg/ml M13 phage’s concentration, it tends to fill the spaces between NP (majorly) and on its top. Due to this deposition approach, the surface roughness of the film quality improves from 23.4 nm (Au NPs only on a substrate) to 11.8 nm (8 mg/ml M13 phage concentration), as shown in Figure 2f. At 10 mg/ml concentration, we can observe two kinds of cases happening dominantly on Au NPs/SiO2/Si: first, filling the spacings between NPs noted; and second, the geometrical nature of M13 phage combine to form micron-sized bundled rod structures due to its increased density and binding nature. Because of this, the thin film surface quality jumps from 11.8 nm to 23.8 nm, which is in a similar condition as bare NPs only (Figure 2f).
We carried over reflectance measurement on these samples, and a redshift in its resonance wavelength position as a function of M13 phage thickness or concentration was noted (fig. 2g). By deposition of M13 phage film top, the longer wavelength resonance positions shifted from 620 nm (Au NPs/SiO2/Si) to 670 nm (6 mg/ml M13 phage’s concentration). By increasing the M13 phage concentration or, in other words, phage film thickness, the longer wavelength resonance peak position shifted further to 703 nm (10 mg/ml M13 phage concentration). To further validate the optical properties of resonance wavelength positions and M13 phage film thickness dependence, we carried out three-dimensional finite-difference time-domain (3D FDTD) simulations. At first, we simulated a single NP model or a randomly positioned multiple NPs model with PML boundary conditions in XYZ directions, which has been a general approach (see SI Figure S2). As seen from SI fig. S2a, a single NP model (or, in other words, a randomly positioned NPs model), reflectance results don’t agree with the experimental results. The dimer model involving two NPs separated by a gap distance of 10 nm also disagrees with experimental results (SI fig. S2b). We found that a periodic NP model with interparticle spacing or gap size of 10 nm (Au NPs/SiO2/Si) agrees well with the experimental data, as shown in Figure 2 (h, i). As a base design, the simulated periodic model and experimental data agree well with Au NPs on a substrate. Keeping this a fundamental design, we simulated the M13 phage’s thickness ranging from 30 nm to 50 nm in 10 nm steps. The reflectance spectra trend between the experiment and simulation agrees well, thereby predicting the M13 phage’s thickness (upon different concentrations used).
The AFM line scan over the M13 phage deposited samples revealed a similar thickness profile as applied in simulations ( 6 mg/ml was ~ 30 nm, 8 mg/ml was ~ 40 nm, and 10 mg/ml was ~ 50 nm), which seems to be reasonably applicable (SI fig. S3). Two kinds of peak resonance positions were observed from both experimental and simulated reflectance spectra. NP mode-based optical characteristics were observed at shorter wavelength resonances ~ 500 nm. The longer wavelength resonance positions correspond to gap-mode-based properties (607 nm for NPs only: ~ 700 nm for NPs + M13 phage). We extracted cross-section XZ electric field amplitude profiles to explain these optical mode differences. The NP mode-based properties are shown in Figure 2 (j,k)’s cross-sectional XZ electric field amplitude profiles taken at shorter wavelength resonance positions for Au NPs on the substrate and M13 phage-coated Au NPs on the substrate, respectively. In the case of Figure 2 (l,m), gap mode-based characteristics were displayed from cross-sectional XZ electric field amplitude profiles taken at longer wavelength resonance positions for Au NPs on the substrate and M13 phage-coated Au NPs on the substrate, respectively. The electric field amplitude strength differences can understand the clear distinguishability between NP and gap mode: less near-field strength for NP mode and higher near-field enhancement for gap mode-based resonance wavelengths peak positions. The slight decrease in the gap mode’s field strength for the phage-coated Au NPs sample was caused by the surrounding environment index change.
3.2. Dynamic response of M13 phage
Utilizing our home-built chamber, we varied humidity levels to study the dynamic response of M13 phage biomaterial and its influence on the optical properties of plasmonic nanoparticles. We had chosen the plasmonic NP – biomaterial thin film, which was spin-coated with a 10 mg/ml M13 phage concentration. We had chosen this M13 phage’s concentration-based thickness for two reasons: better dynamic response with a thicker layer and simultaneously the longer wavelength resonance position; The thinner M13 phage layer tends to have minimal dynamic response upon humidity exposure. The humidity levels (relative humidity percentage or RH %) ranging from 20 % to 90 % were applied into the chamber, and reflectivity spectra from the samples were measured. Figure 3a displays the dynamically responded reflectivity spectra with two significant optical properties. First, at a shorter wavelength around ~ 500 nm, a minor or negligible resonance peak position shift was observed for varied RH % levels (solid black arrow). Second, a clear redshift at longer wavelength resonance positions was significantly observed (dotted black arrow). The solid black arrow region with negligible changes in resonance wavelength position(s) as a function of varied RH % levels originate from NP mode. A dominant red-shifting optical characteristic observed at the dotted black arrow region originates from the gap mode (better gap-plasmonic coupling and hence brighter optical mode). We also recorded reflectivity and dark-field images simultaneously for the corresponding changes in the sample upon varied RH % levels (fig. 2b, c). A clear shift in captured CCD images revealed optical color changes when the humidity levels were increased. Please note that the above results can be reproduced multiple times, displaying a critical advantage in employing a M13 phage biomaterial in these nanostructures.
3.3. Understanding the optical and geometrical properties as a function of dynamic response
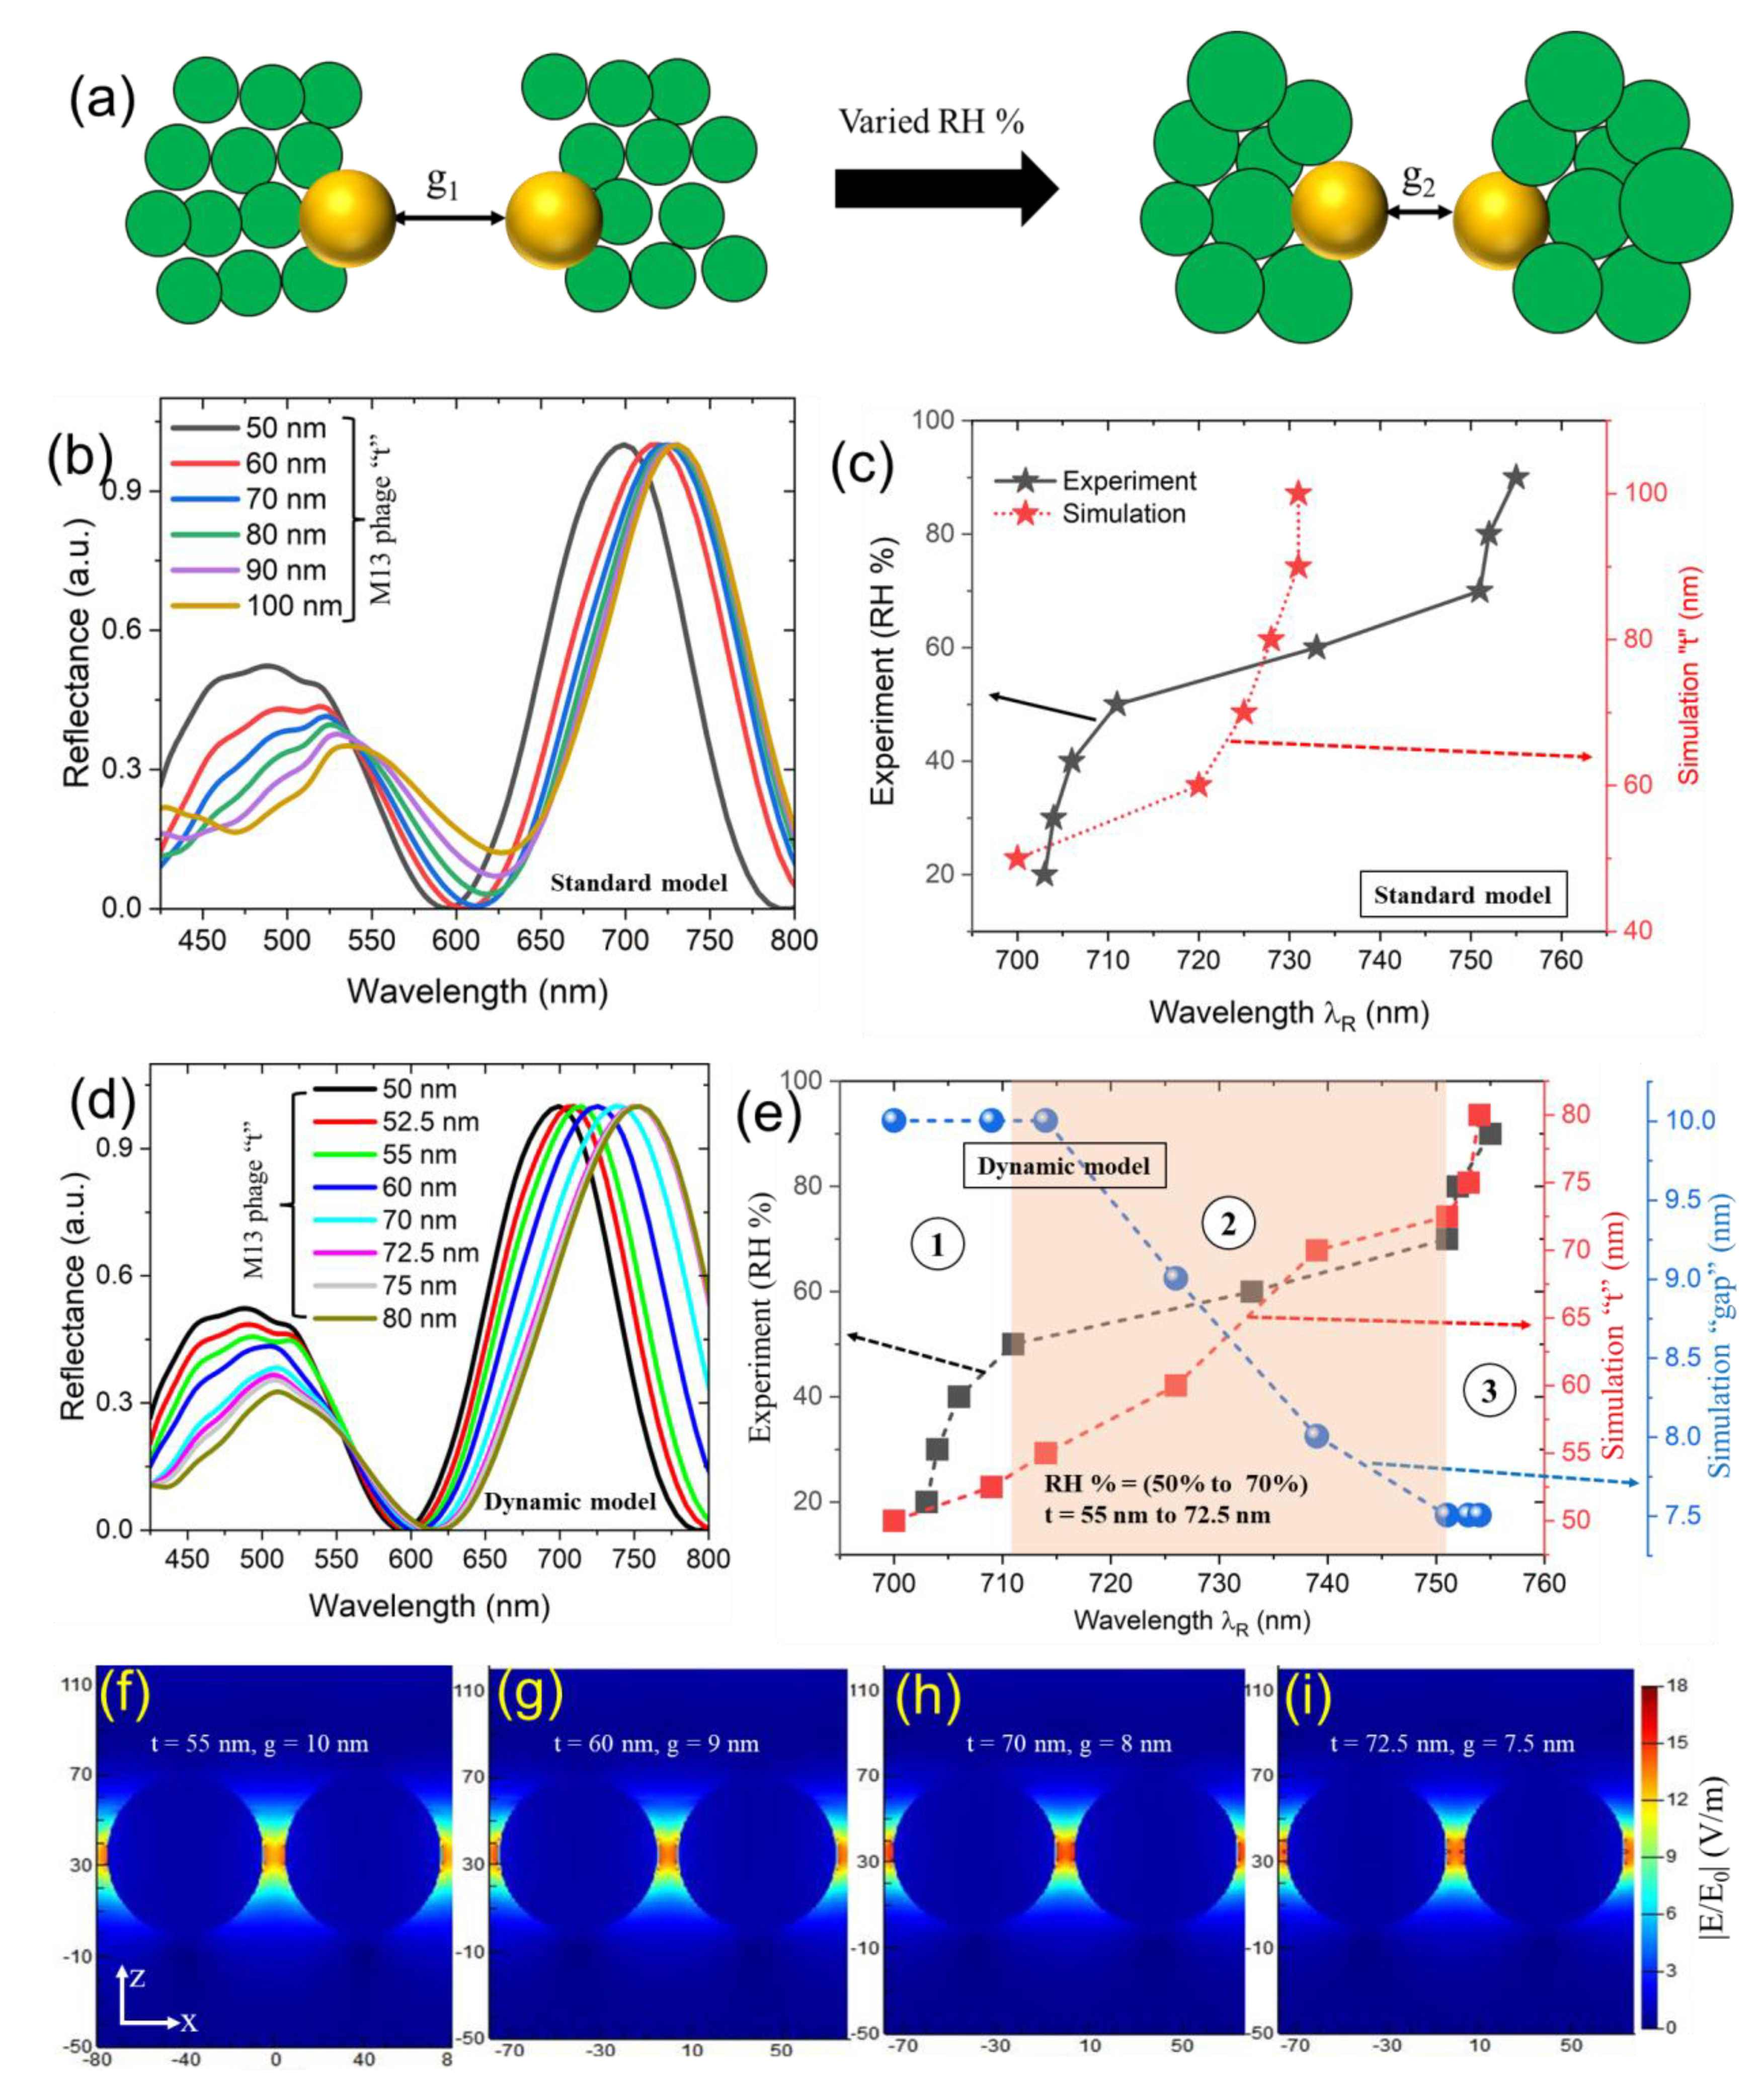
To understand the dynamic response-based properties from our sample in detail, we carried out 3D FDTD simulations to interpret geometrical and optical properties. Utilizing a simulated model, as seen in Figure 2h, doesn’t work well here. In the standard model, the g1 = g2 condition has been assigned with increasing M13 phage thickness (Fig. 4a). The simulated (labeled as a standard model) reflectance spectra (NP diameter of 70 nm, gap = 10 nm) as a function of varied M13 phage thickness ranging from 50 nm to 100 nm (10 nm steps) studies reveal red shifting of longer wavelength resonances occurred (λR = 731 nm) till M13 phage thickness “t” of 90 nm and becomes approximately consistent after that (fig. 4b). In case of experimental reflectance, the maximum redshift obtained in resonance wavelength position before becoming consistent was around ~ λR = 751 nm (fig. 4c). Herein, we introduce a dynamic model approach: by applying increased RH % levels, we model the structure based on g1 > g2. We assume the decrease in g2 happens due to the swelling behavior of M13 phage biomaterial upon its exposure to variable humidity conditions [7]. As the M13 phage’s geometry swells in three dimensions, it induces the movement or change of NPs position(s). In other words, a decrease in interparticle distance or g2 is noted compared to g1 (g2 < g1).
Figure 4 (d-e) shows the simulated reflectance data based on our dynamic model design, which agrees with an experimental trend. To discuss in detail, we plotted point type data extracted from the simulated and experimental results taken at a longer wavelength resonance (λR) relating experimental RH % versus simulated M13 phage thickness “t” and gap data (fig. 4e). We had divided the resonance wavelength (λR) regions into three parts. In part one (1), for RH % levels between 20 % to < 50 %, the red shifting of λR was tunable at a small range (703 nm – 711 nm), and the trend agrees well with the simulations (700 nm – 714 nm). In this situation, the predicted M13 phage thickness range varies from 50 nm to 55 nm, and the gap size remains unchanged (10 nm). The significant changes started in part two (2) region: from RH % of 50 % to 70 %, a drastic red shift in experimental λR was noted (711 nm to 751 nm). By correlating the data obtained from the dynamic model design at part two (2) region, M13 phage thickness “t” varied between > 55 nm to 72.5 nm with λR shifting from > 714 nm to 751 nm. The most exciting part is the change in an interparticle distance or gap size from 9 nm to 7.5 nm. In part three (3) region, RH % levels were changed from 70 % to 90 %, and similar λR peak position changes were recorded (with negligible differences). The simulated results in the third part (3) displayed a similar λR response (unchanged gap size of 7.5 nm and M13 phage thickness “t” in the range of > 72.5 nm to 80 nm). The position of the M13 phage layer plays a crucial role in inducing a shift in the peak resonance wavelength of plasmonic NPs. Specifically, when the phage layer is deposited on top of the NPs, a significant red shift in peak resonance wavelength position can be achieved. Conversely, when the phage layer is deposited below the metallic NPs, a blue shift from the original peak resonance wavelength position can occur due to the increased thickness of the dielectric layer. As both of these roles can be achieved on how we position the M13 phage layer, it is possible to realize various plasmonic applications.
Two kinds of scenarios from these three parts could be interpreted. First, in parts 1 and 3 regions, a minimal redshift in λR peak positions along with unchanged gap sizes were noted. Second, a drastic red shift in λR peak positions happened induced by the combination of reduced gap distances between NPs and increased M13 phage thickness “t”. The swelling of the M13 phage caused the decreased gap distances between NPs as a function of increased RH % levels. Part two (2) region displayed significant importance in utilizing the M13 phage biomaterial as a dielectric layer film on top of plasmonics structure for optical applications. The advantage of dynamically tunable M13 phage biomaterial can be illustrated by comparing Figure 4c,e. In the case of employing commonly used dielectric layer materials like SiO2, limits in obtaining maximum longer wavelength resonances can be visibly seen (fig. 4c) as a function of increasing thickness. But in the case of dynamically tunable M13 phage biomaterial, with relatively smaller thickness, λR red-shifted further (fig. 4e) as compared to Figure 4c data. This is critically important in fabrication and becomes advantageous in demonstrating multiwavelength studies from a single sample by utilizing this biomaterial thin film. For example, to name a few such potential applications can involve nano-particle-on-mirror (NPOM) designs, sensors, meta-optics, and so on. In particular, the genetic engineering of M13 phage introduces thousands of surface protein modifications that can be utilized for highly sensitive and selective bio-sensing applications in point-of-care diagnostics, agriculture, and environmental care [11,14,15,18,19,26,27]. Coming to the case of NPOMs, with a truly designed single bottom faceted NPOM designs that can exhibit superior optical characteristics even in case of larger spacer gap sizes, the genetically engineering M13 phage can open various plasmonic studies and applications alongside the dynamic geometry change. Please note that the dynamic changes caused by the M13 phage biomaterial are reversible and can be restored to their original characteristics on a longer lifetime basis.
4. Conclusions
We presented an experimental work based on a plasmonic NP – biomaterial thin film structure involving M13 bacteriophage. The thickness of the M13 phage layer could be controlled by either concentration change or by varied humidity levels. The optical properties observed from the experiment were interpreted in detail based on a standard and dynamic simulation model. The standard model agreed with experimental optical characteristics involving the M13 phage’s concentration-based thickness changes. The dynamic simulation model predicted and analyzed the optical and geometrical properties in detail (dynamic response of M13 phage thickness and related interparticle spacing between NPs), which explains the experimental humidity-induced changes well. In addition to the above all, fabrication feasibility, reproducibility, reversibility, and genetic engineering of surface proteins of M13 phage biomaterial can open up a variety of applications in the field of optics, sensors, plasmonics, surface-enhanced Raman spectroscopy, and so on with precise selectivity and high response rate.
Supplementary Materials
The following supporting information can be downloaded at the website of this paper posted on Preprints.org.
Acknowledgments
This research was supported by Hallym University Research Fund, 2021(HRF-202110-003)
References
- Willner, I.; Rubin, S. Control of the Structure and Functions of Biomaterials by Light. Angew. Chem. Int. Ed. Engl. 1996, 35, 367–385. [Google Scholar] [CrossRef]
- Sun, J.; Tan, H. Alginate-Based Biomaterials for Regenerative Medicine Applications. Materials 2013, 6, 1285–1309. [Google Scholar] [CrossRef] [PubMed]
- Dong, R.; Ma, P.X.; Guo, B. Conductive Biomaterials for Muscle Tissue Engineering. Biomaterials 2020, 229, 119584. [Google Scholar] [CrossRef]
- Xu, J.; Zhao, X.; Zhao, X.; Wang, Z.; Tang, Q.; Xu, H.; Liu, Y. Memristors with Biomaterials for Biorealistic Neuromorphic Applications. Small Science 2022, 2, 2200028. [Google Scholar] [CrossRef]
- Chorsi, M.T.; Curry, E.J.; Chorsi, H.T.; Das, R.; Baroody, J.; Purohit, P.K.; Ilies, H.; Nguyen, T.D. Piezoelectric Biomaterials for Sensors and Actuators. Adv. Mater. 2019, 31, 1802084. [Google Scholar] [CrossRef] [PubMed]
- Pérez, J.A.C.; Sosa-Hernández, J.E.; Hussain, S.M.; Bilal, M.; Parra-Saldivar, R.; Iqbal, H.M.N. Bioinspired Biomaterials and Enzyme-Based Biosensors for Point-of-Care Applications with Reference to Cancer and Bio-Imaging. Biocatalysis and Agricultural Biotechnology 2019, 17, 168–176. [Google Scholar] [CrossRef]
- Oh, J.-W.; Chung, W.-J.; Heo, K.; Jin, H.-E.; Lee, B.Y.; Wang, E.; Zueger, C.; Wong, W.; Meyer, J.; Kim, C.; et al. Biomimetic Virus-Based Colourimetric Sensors. Nat Commun 2014, 5, 3043. [Google Scholar] [CrossRef]
- Moon, J.-S.; Kim, W.-G.; Kim, C.; Park, G.-T.; Heo, J.; Yoo, S.Y.; Oh, J.-W. M13 Bacteriophage-Based Self-Assembly Structures and Their Functional Capabilities. Mini-Reviews in Organic Chemistry 2015, 12, 271–281. [Google Scholar] [CrossRef]
- Chung, W.-J.; Lee, D.-Y.; Yoo, S.Y. Chemical Modulation of M13 Bacteriophage And Its Functional Opportunities for Nanomedicine. IJN 2014, 9, 5825–5836. [Google Scholar] [CrossRef]
- Heo, K.; Jin, H.-E.; Kim, H.; Lee, J.H.; Wang, E.; Lee, S.-W. Transient Self-Templating Assembly of M13 Bacteriophage for Enhanced Biopiezoelectric Devices. Nano Energy 2019, 56, 716–723. [Google Scholar] [CrossRef]
- Kim, I.; Moon, J.-S.; Oh, J.-W. Recent Advances in M13 Bacteriophage-Based Optical Sensing Applications. Nano Convergence 2016, 3, 27. [Google Scholar] [CrossRef] [PubMed]
- Hess, G.T.; Guimaraes, C.P.; Spooner, E.; Ploegh, H.L.; Belcher, A.M. Orthogonal Labeling of M13 Minor Capsid Proteins with DNA to Self-Assemble End-to-End Multiphage Structures. ACS Synth. Biol. 2013, 2, 490–496. [Google Scholar] [CrossRef] [PubMed]
- Tsedev, U.; Lin, C.-W.; Hess, G.T.; Sarkaria, J.N.; Lam, F.C.; Belcher, A.M. Phage Particles of Controlled Length and Genome for In Vivo Targeted Glioblastoma Imaging and Therapeutic Delivery. ACS Nano 2022, 16, 11676–11691. [Google Scholar] [CrossRef]
- Ngo-Duc, T.-T.; Plank, J.M.; Chen, G.; Harrison, R.E.S.; Morikis, D.; Liu, H.; Haberer, E.D. M13 Bacteriophage Spheroids as Scaffolds for Directed Synthesis of Spiky Gold Nanostructures. Nanoscale 2018, 10, 13055–13063. [Google Scholar] [CrossRef] [PubMed]
- Devaraj, V.; Han, J.; Kim, C.; Kang, Y.-C.; Oh, J.-W. Self-Assembled Nanoporous Biofilms from Functionalized Nanofibrous M13 Bacteriophage. Viruses 2018, 10, 322. [Google Scholar] [CrossRef]
- Sun, Y.; Yang, C.; Wu, B.; Wang, J.; Qu, S.; Weng, J.; Feng, B. Fabrication of Nanostructured M13 Bacteriophage Films on Titanium Surfaces. Materials Letters 2016, 182, 39–42. [Google Scholar] [CrossRef]
- Chung, S.; Chung, W.-J.; Wang, D.; Lee, S.-W.; Yoreo, J.J.D. Growth of Au and ZnS Nanostructures via Engineered Peptide and M13 Bacteriophage Templates. Soft Matter 2018, 14, 2996–3002. [Google Scholar] [CrossRef]
- Manivannan, S.; Lee, D.; Kang, D.-K.; Kim, K. M13 Virus-Templated Open Mouth-like Platinum Nanostructures Prepared by Electrodeposition: Influence of M13-Virus on Structure and Electrocatalytic Activity. Journal of Electroanalytical Chemistry 2020, 879, 114755. [Google Scholar] [CrossRef]
- Zhan, S.; Fang, H.; Chen, Q.; Xiong, S.; Guo, Y.; Huang, T.; Li, X.; Leng, Y.; Huang, X.; Xiong, Y. M13 Bacteriophage as Biometric Component for Orderly Assembly of Dynamic Light Scattering Immunosensor. Biosensors and Bioelectronics 2022, 217, 114693. [Google Scholar] [CrossRef]
- Kim, H.; Lee, J.-H.; Lee, J.H.; Lee, B.Y.; Lee, B.D.; Okada, K.; Ji, S.; Yoon, J.; Lee, J.H.; Lee, S.-W. M13 Virus Triboelectricity and Energy Harvesting. Nano Lett. 2021, 21, 6851–6858. [Google Scholar] [CrossRef]
- Lee, J.H.; Fan, B.; Samdin, T.D.; Monteiro, D.A.; Desai, M.S.; Scheideler, O.; Jin, H.-E.; Kim, S.; Lee, S.-W. Phage-Based Structural Color Sensors and Their Pattern Recognition Sensing System. ACS Nano 2017, 11, 3632–3641. [Google Scholar] [CrossRef] [PubMed]
- Lee, S.-W.; Mao, C.; Flynn, C.E.; Belcher, A.M. Ordering of Quantum Dots Using Genetically Engineered Viruses. Science 2002, 296, 892–895. [Google Scholar] [CrossRef] [PubMed]
- Park, I.W.; Kim, K.W.; Hong, Y.; Yoon, H.J.; Lee, Y.; Gwak, D.; Heo, K. Recent Developments and Prospects of M13- Bacteriophage Based Piezoelectric Energy Harvesting Devices. Nanomaterials 2020, 10, 93. [Google Scholar] [CrossRef] [PubMed]
- Han, S.M.; Lee, Y.J.; Lee, M.H.; Park, C.W.; Lee, S.M.; Soh, J.O.; Lee, J.H. M13 Bacteriophage-Based Bio-Nano Systems for Bioapplication. BioChip J 2022, 16, 227–245. [Google Scholar] [CrossRef]
- Courchesne, N.-M.D.; Klug, M.T.; Chen, P.-Y.; Kooi, S.E.; Yun, D.S.; Hong, N.; Fang, N.X.; Belcher, A.M.; Hammond, P.T. Assembly of a Bacteriophage-Based Template for the Organization of Materials into Nanoporous Networks. Adv. Mater. 2014, 26, 3398–3404. [Google Scholar] [CrossRef] [PubMed]
- Lee, J.-M.; Devaraj, V.; Jeong, N.-N.; Lee, Y.; Kim, Y.-J.; Kim, T.; Yi, S.H.; Kim, W.-G.; Choi, E.J.; Kim, H.-M.; et al. Neural Mechanism Mimetic Selective Electronic Nose Based on Programmed M13 Bacteriophage. Biosensors and Bioelectronics 2022, 196, 113693. [Google Scholar] [CrossRef]
- Lee, J.-M.; Lee, Y.; Devaraj, V.; Nguyen, T.M.; Kim, Y.-J.; Kim, Y.H.; Kim, C.; Choi, E.J.; Han, D.-W.; Oh, J.-W. Investigation of Colorimetric Biosensor Array Based on Programable Surface Chemistry of M13 Bacteriophage towards Artificial Nose for Volatile Organic Compound Detection: From Basic Properties of the Biosensor to Practical Application. Biosensors and Bioelectronics 2021, 188, 113339. [Google Scholar] [CrossRef]
- Chen, P.-Y.; Ladewski, R.; Miller, R.; Dang, X.; Qi, J.; Liau, F.; Belcher, A.M.; Hammond, P.T. Layer-by-Layer Assembled Porous Photoanodes for Efficient Electron Collection in Dye-Sensitized Solar Cells. J. Mater. Chem. A 2013, 1, 2217–2224. [Google Scholar] [CrossRef]
- Chen, P.-Y.; Dang, X.; Klug, M.T.; Qi, J.; Dorval Courchesne, N.-M.; Burpo, F.J.; Fang, N.; Hammond, P.T.; Belcher, A.M. Versatile Three-Dimensional Virus-Based Template for Dye-Sensitized Solar Cells with Improved Electron Transport and Light Harvesting. ACS Nano 2013, 7, 6563–6574. [Google Scholar] [CrossRef]
- Mao, C.; Solis, D.J.; Reiss, B.D.; Kottmann, S.T.; Sweeney, R.Y.; Hayhurst, A.; Georgiou, G.; Iverson, B.; Belcher, A.M. Virus-Based Toolkit for the Directed Synthesis of Magnetic and Semiconducting Nanowires. Science 2004, 303, 213–217. [Google Scholar] [CrossRef]
- Records, W.C.; Yoon, Y.; Ohmura, J.F.; Chanut, N.; Belcher, A.M. Virus-Templated Pt–Ni(OH)2 Nanonetworks for Enhanced Electrocatalytic Reduction of Water. Nano Energy 2019, 58, 167–174. [Google Scholar] [CrossRef]
- Ghosh, D.; Kohli, A.G.; Moser, F.; Endy, D.; Belcher, A.M. Refactored M13 Bacteriophage as a Platform for Tumor Cell Imaging and Drug Delivery. ACS Synth. Biol. 2012, 1, 576–582. [Google Scholar] [CrossRef] [PubMed]
- Neltner, B.; Peddie, B.; Xu, A.; Doenlen, W.; Durand, K.; Yun, D.S.; Speakman, S.; Peterson, A.; Belcher, A. Production of Hydrogen Using Nanocrystalline Protein-Templated Catalysts on M13 Phage. ACS Nano 2010, 4, 3227–3235. [Google Scholar] [CrossRef]
- Nguyen, T.M.; Kim, S.-J.; Devaraj, V.; Song, H.; Lee, J.-M.; Choi, E.J.; Kim, Y.-J.; Jang, M.; Kim, Y.H.; Jeong, H.; et al. Biomaterial Actuator of M13 Bacteriophage in Dynamically Tunable Plasmonic Coupling Structure. Sensors and Actuators B: Chemical 2022, 369, 132326. [Google Scholar] [CrossRef]
- Sokullu, E.; Pinsard, M.; Zhang, J.; Plathier, J.; Kolhatkar, G.; Blum, A.S.; Légaré, F.; Ruediger, A.; Ozaki, T.; Gauthier, M.A. Plasmonic Enhancement of Two-Photon Excitation Fluorescence by Colloidal Assemblies of Very Small AuNPs Templated on M13 Phage. Biomacromolecules 2020, 21, 2705–2713. [Google Scholar] [CrossRef] [PubMed]
- Hou, J.; Xu, Y.; Sun, S.; Zhong, X.; Yang, C.-T.; Zhou, X. Gold Nanoparticles-Decorated M13 Phage SPR Probe for Dual Detection of Antigen Biomarkers in Serum. Sensors and Actuators B: Chemical 2023, 374, 132811. [Google Scholar] [CrossRef]
- Karoonuthaisiri, N.; Charlermroj, R.; Morton, M.J.; Oplatowska-Stachowiak, M.; Grant, I.R.; Elliott, C.T. Development of a M13 Bacteriophage-Based SPR Detection Using Salmonella as a Case Study. Sensors and Actuators B: Chemical 2014, 190, 214–220. [Google Scholar] [CrossRef]
- Pourakbari, R.; Yousefi, M.; Khalilzadeh, B.; Irani-nezhad, M.H.; Khataee, A.; Aghebati-Maleki, L.; Soleimanian, A.; Kamrani, A.; Chakari-Khiavi, F.; Abolhasan, R.; et al. Early Stage Evaluation of Colon Cancer Using Tungsten Disulfide Quantum Dots and Bacteriophage Nano-Biocomposite as an Efficient Electrochemical Platform. Cancer Nanotechnology 2022, 13, 7. [Google Scholar] [CrossRef]
- Li, L.; Zhang, H.; Song, D.; Xu, K.; Zheng, Y.; Xiao, H.; Liu, Y.; Li, J.; Song, X. Simultaneous Detection of Three Zoonotic Pathogens Based on Phage Display Peptide and Multicolor Quantum Dots. Analytical Biochemistry 2020, 608, 113854. [Google Scholar] [CrossRef]
- Yi Lai, J.; Inoue, N.; Wei Oo, C.; Kawasaki, H.; Soon Lim, T. One-Step Synthesis of M13 Phage-Based Nanoparticles and Their Fluorescence Properties. RSC Advances 2021, 11, 1367–1375. [Google Scholar] [CrossRef]
- Wen, A.M.; Podgornik, R.; Strangi, G.; Steinmetz, N.F. Photonics and Plasmonics Go Viral: Self-Assembly of Hierarchical Metamaterials. Rend. Fis. Acc. Lincei 2015, 26, 129–141. [Google Scholar] [CrossRef] [PubMed]
- Petrescu, D.S.; Blum, A.S. Viral-based Nanomaterials for Plasmonic and Photonic Materials and Devices. WIREs Nanomed Nanobiotechnol 2018, 10. [Google Scholar] [CrossRef] [PubMed]
- Devaraj, V.; Lee, I.H.; Kim, M.; Nguyen, T.M.; Son, J.P.; Lee, J.-M.; Lee, D.; Kim, K.H.; Oh, J.-W. Unveiling Facet Effects in Metallic Nanoparticles to Design an Efficient Plasmonic Nanostructure. Current Applied Physics 2022, 44, 22–28. [Google Scholar] [CrossRef]
- Kim, W.-G.; Devaraj, V.; Yang, Y.; Lee, J.-M.; Kim, J.T.; Oh, J.-W.; Rho, J. Three-Dimensional Plasmonic Nanoclusters Driven by Co-Assembly of Thermo-Plasmonic Nanoparticles and Colloidal Quantum Dots. Nanoscale 2022, 14, 16450–16457. [Google Scholar] [CrossRef]
- Johnson, P.B.; Christy, R.W. Optical Constants of the Noble Metals. Phys. Rev. B 1972, 6, 4370–4379. [Google Scholar] [CrossRef]
- List of Contributors for Volume I. In Handbook of Optical Constants of Solids; Palik, E.D., Ed.; Academic Press: Academic Press, 1997; pp. xv–xvi. ISBN 9780125444156. [Google Scholar]
Figure 1.
(a) Fabrication scheme of plasmonic nanoparticle – M13 bacteriophage biomaterial thin film nanostructure on a SiO2/Si substrate. (b) SEM image of fabricated Au NPs on the SiO2/Si. (c) Size distribution of Au NPs displaying a mean size of ~ 71.2 nm.
Figure 1.
(a) Fabrication scheme of plasmonic nanoparticle – M13 bacteriophage biomaterial thin film nanostructure on a SiO2/Si substrate. (b) SEM image of fabricated Au NPs on the SiO2/Si. (c) Size distribution of Au NPs displaying a mean size of ~ 71.2 nm.
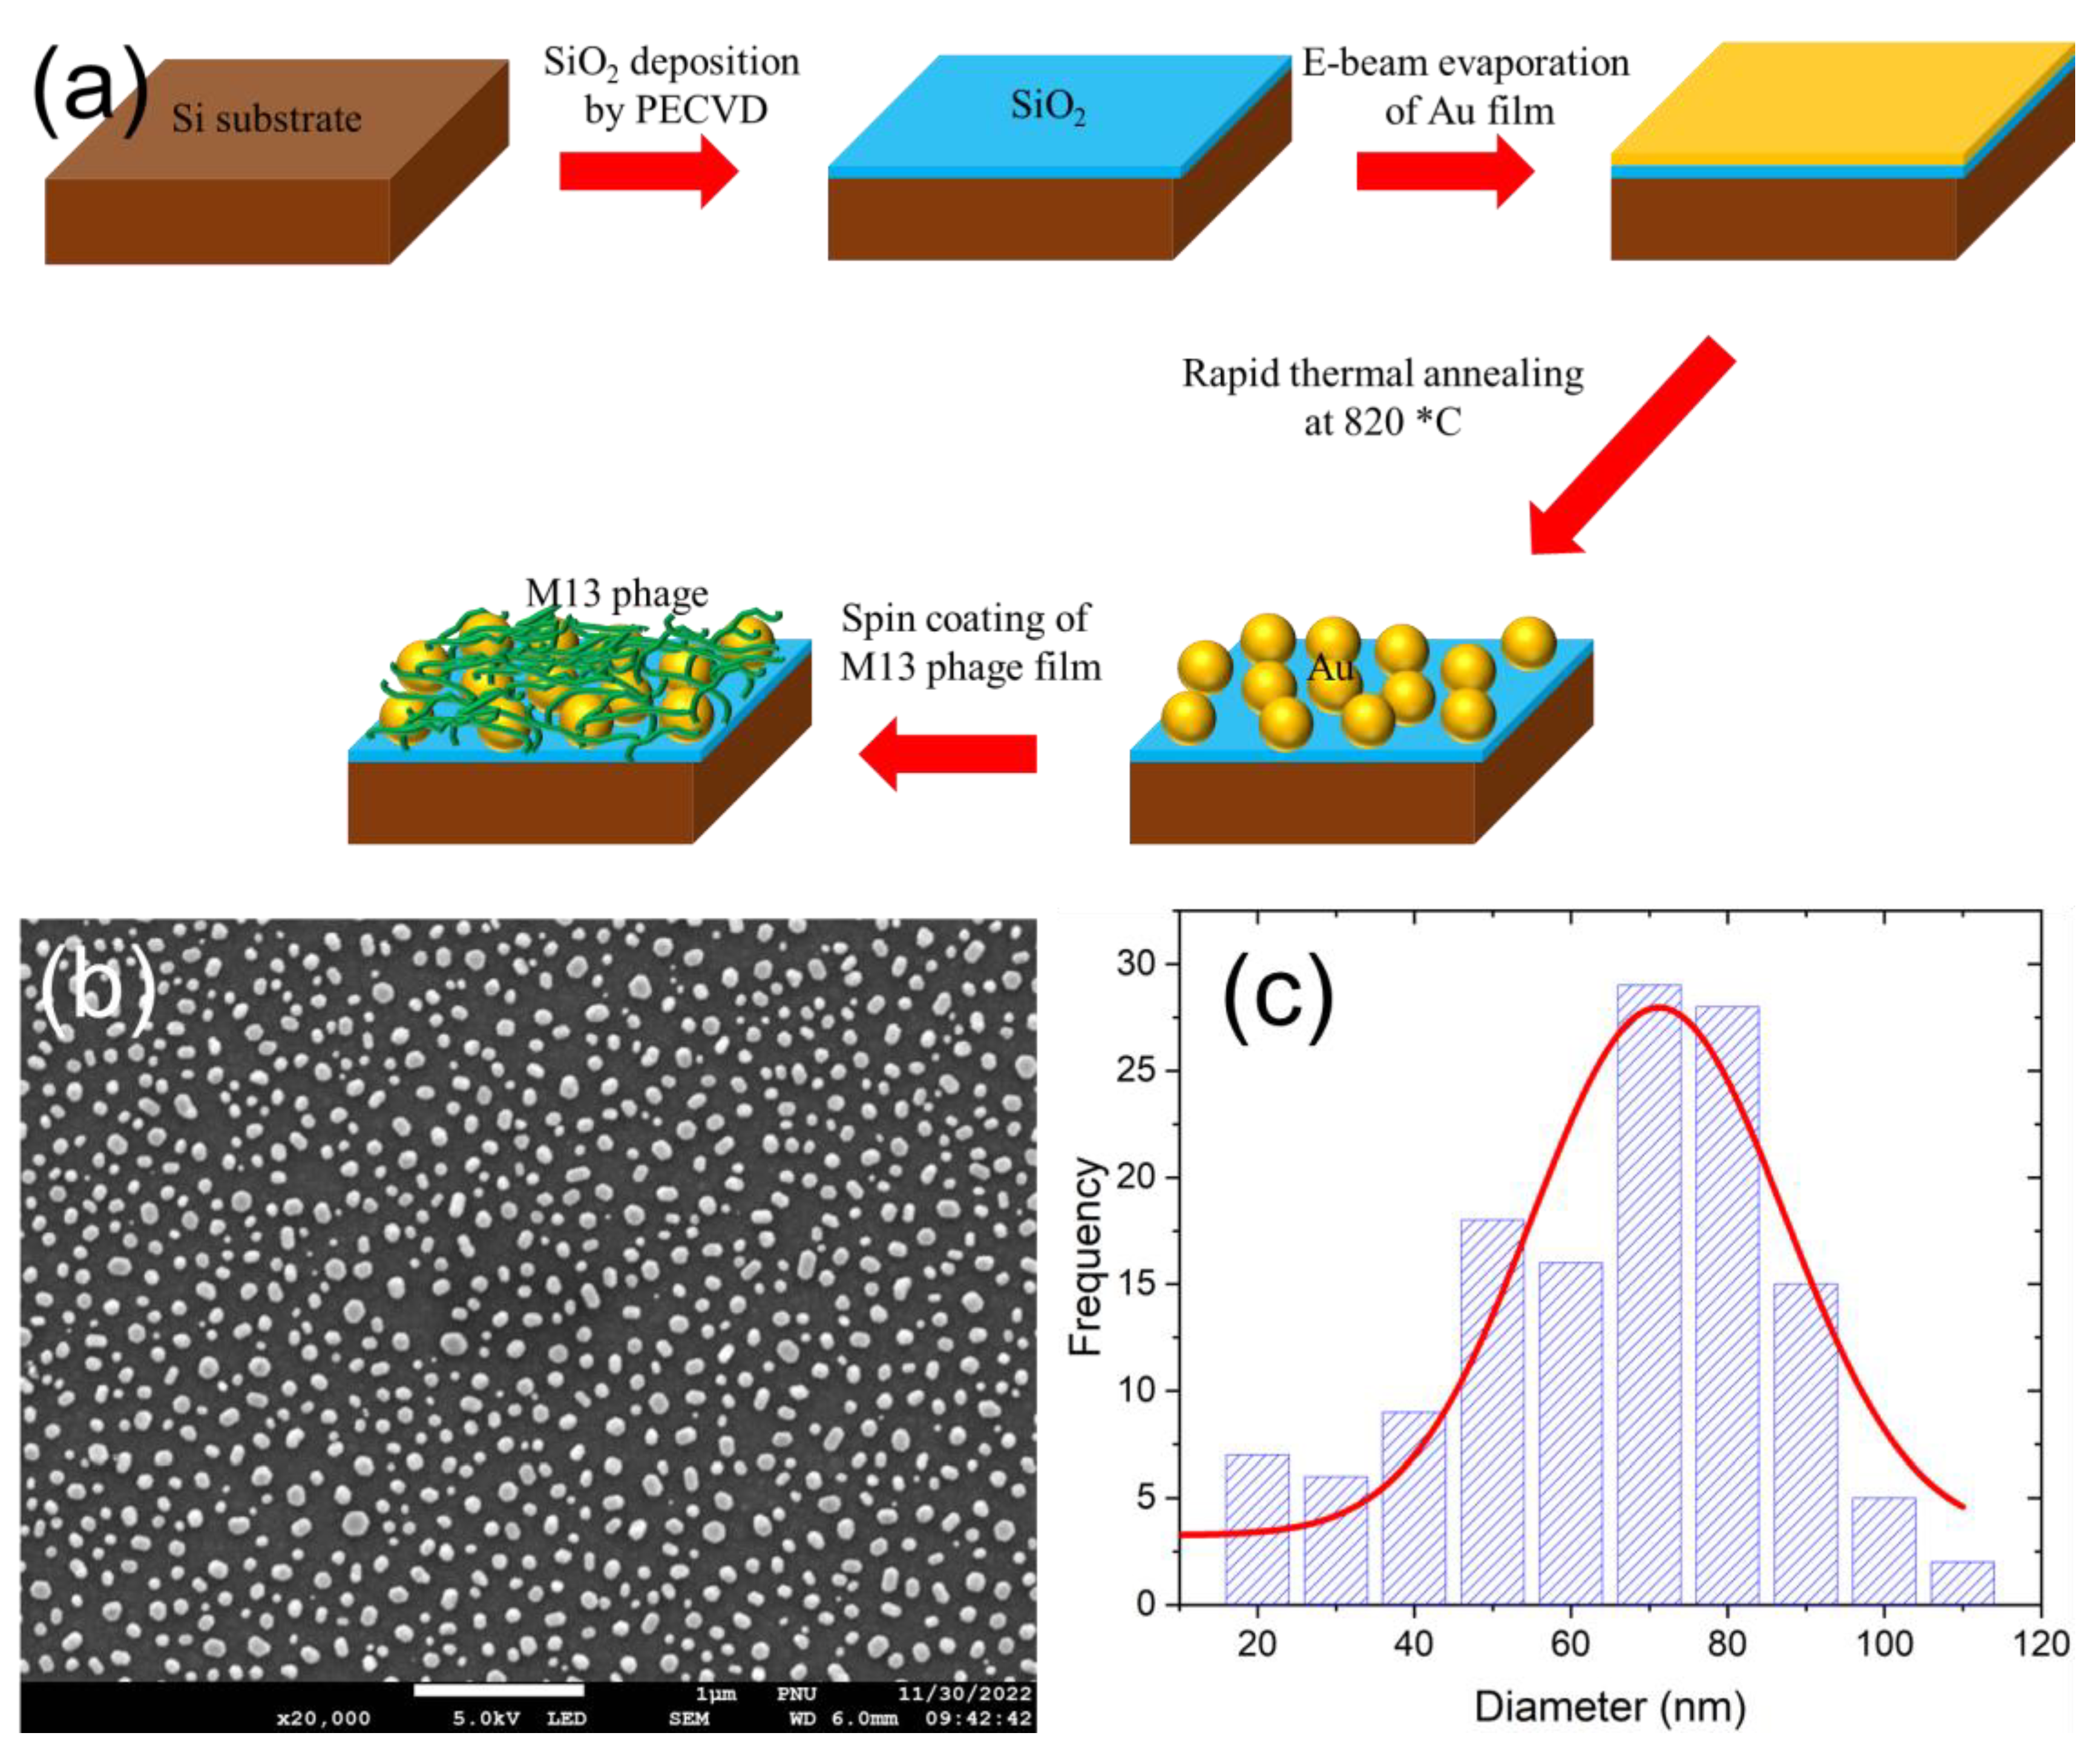
Figure 2.
(a) A schematic of M13 phage deposition on top of Au NPs as a function of increased concentration. Two-dimensional AFM scan profiles of Au NPs/SiO2/Si (b) and deposition of M13 phage biomaterial on its top as a function of 6 mg/ml (c), 8 mg/ml (d), and 10 mg/ml (e) concentrations. The scale bar is 2 µm. (f) The surface quality of the film was extracted from the AFM data as a function of the M13 phage’s concentration (0 indicates no M13 phage). Experimental (g) and simulated (h) reflectance spectra for the Au NPs on the substrate with and without M13 phage deposition. (i) Relating M13 phage’s concentration and thickness estimation from simulations as a function of longer wavelength λ resonance positions. Simulated cross-sectional XZ electric field amplitude profiles displaying NP mode (j, k) and gap mode (l, m) based optical characteristics for Au NPs structure and M13 phage coated Au NPs structure, respectively. The “x” and “z” axes numbers are in nanometers.
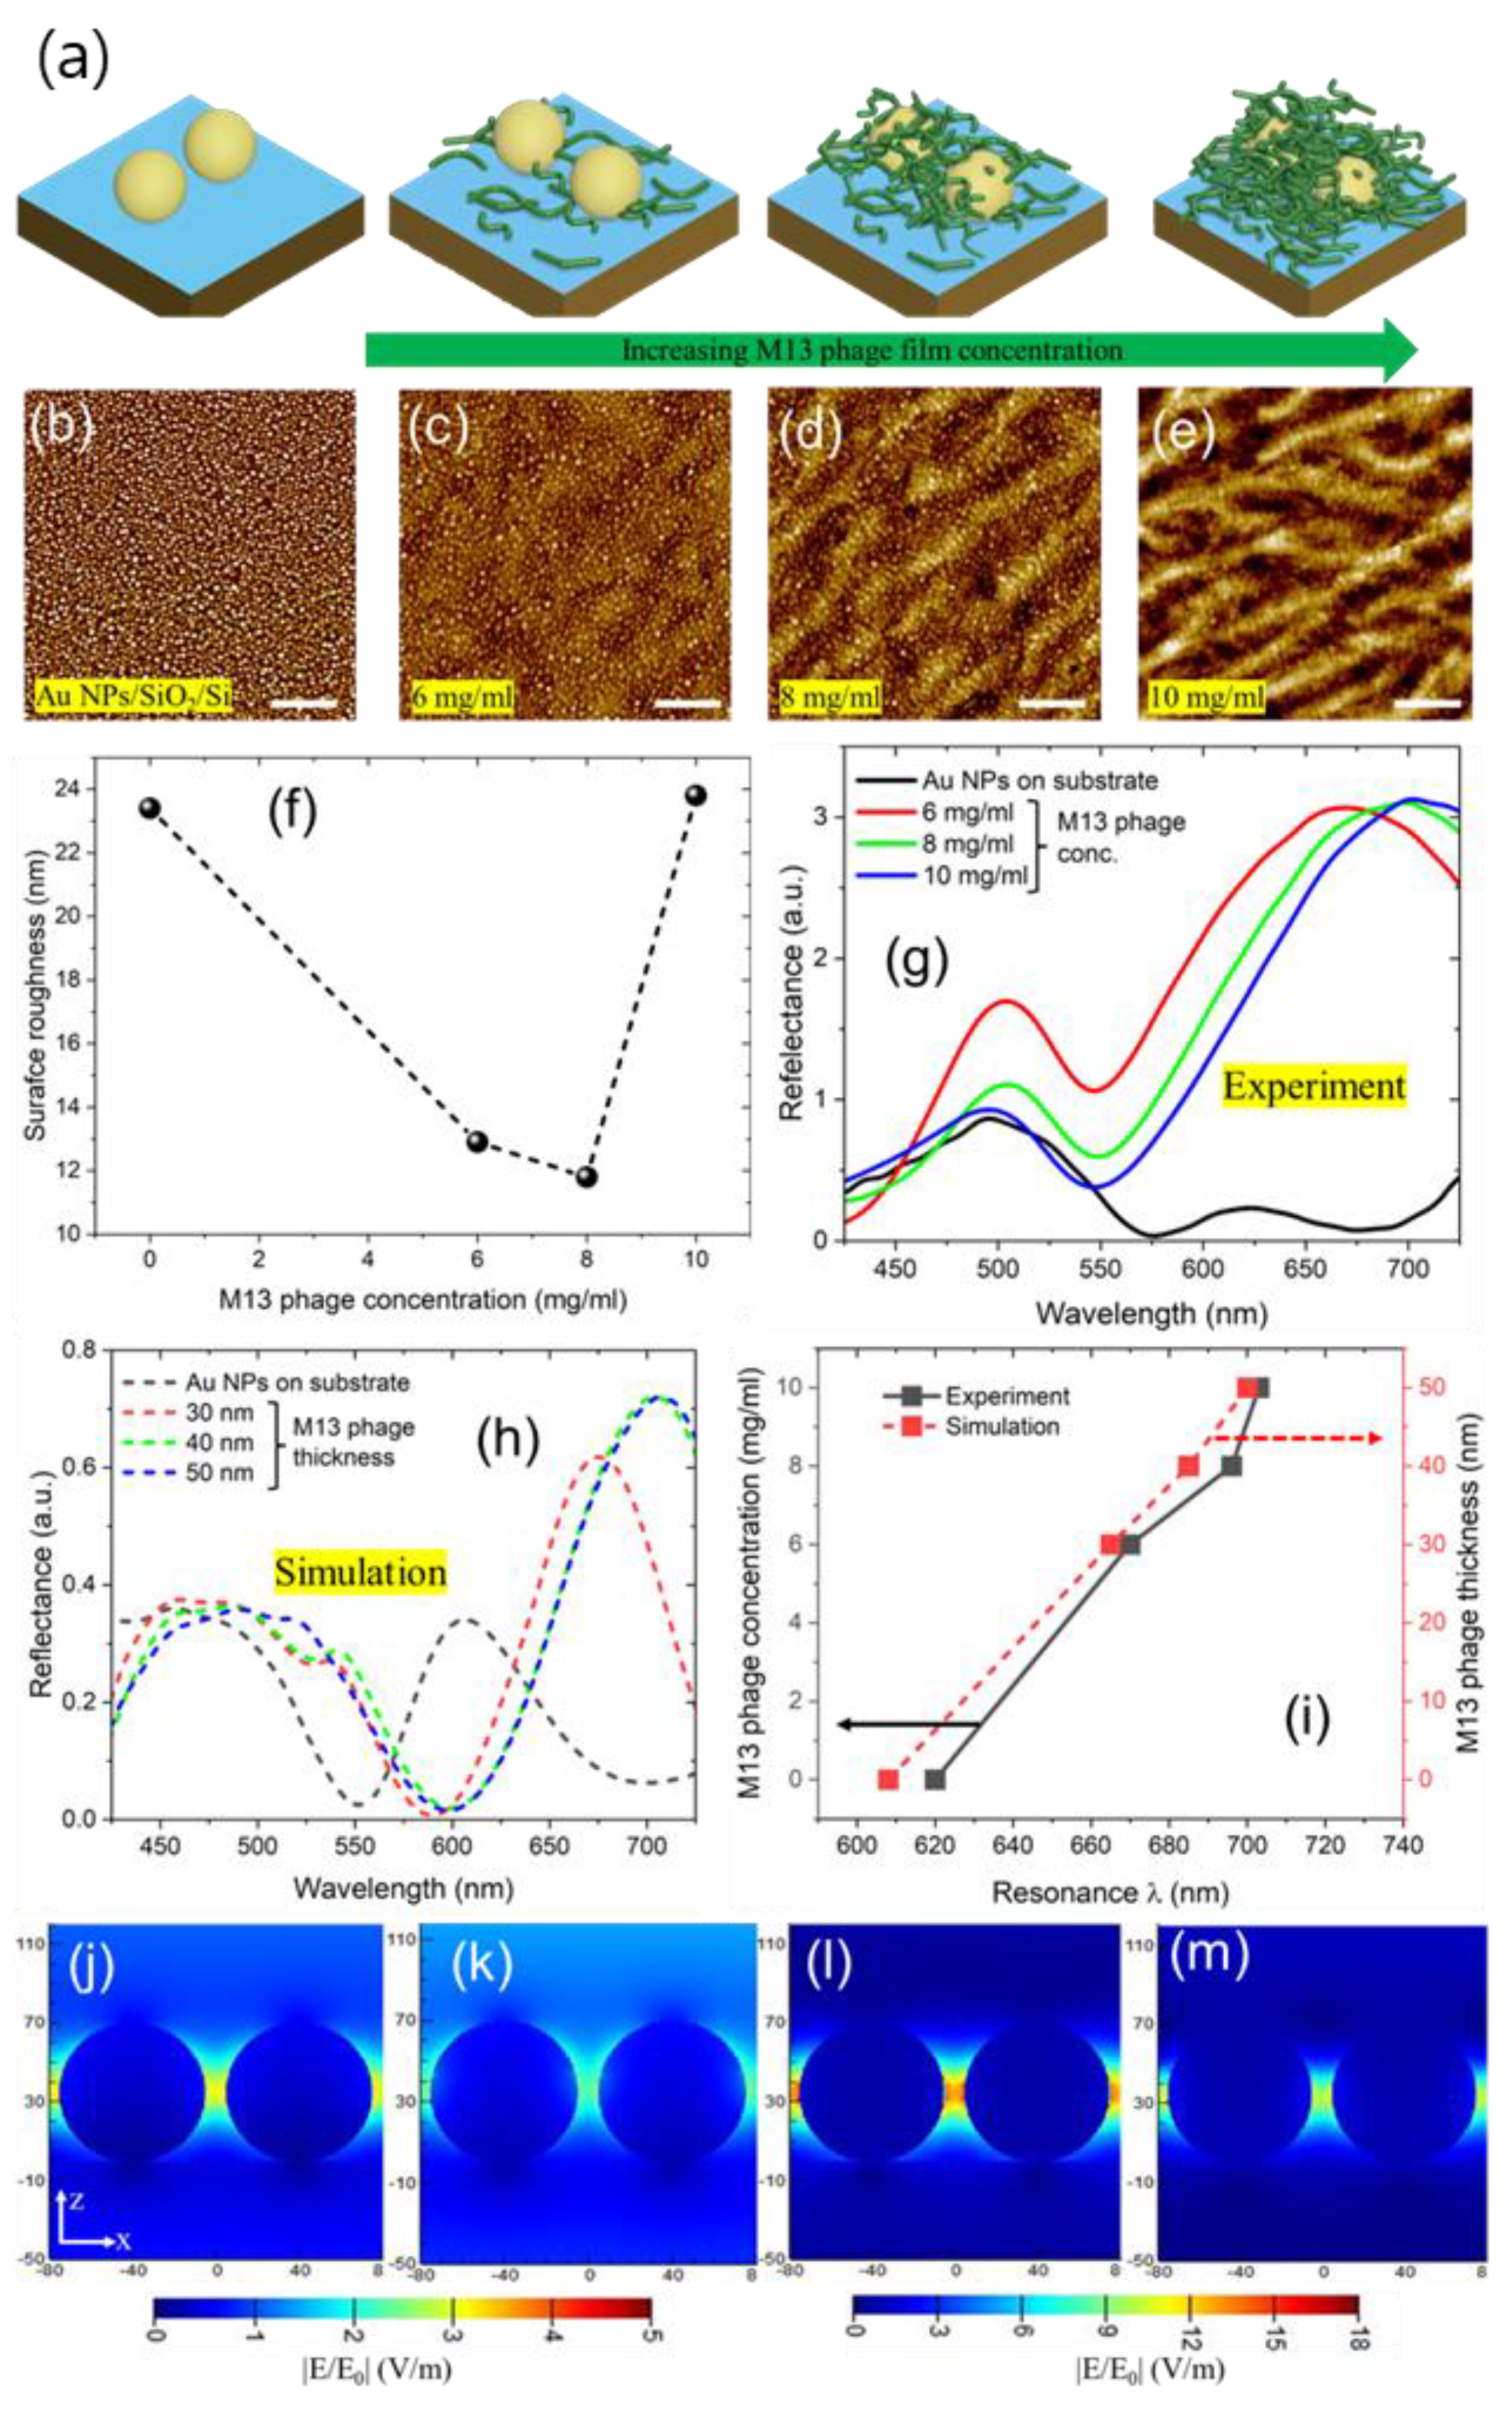
Figure 3.
(a) Experimental reflectance spectra as a function of increased humidity levels varied from 20 % to 90 % on M13 phage/Au NPs/SiO2/Si sample. The concentration of M13 phage was chosen as 10 mg/ml. Recorded CCD color images for reflectance (b) and dark field (c) at longer resonance wavelength positions for increased humidity levels. The scale bar is 5 µm for captured CCD images.
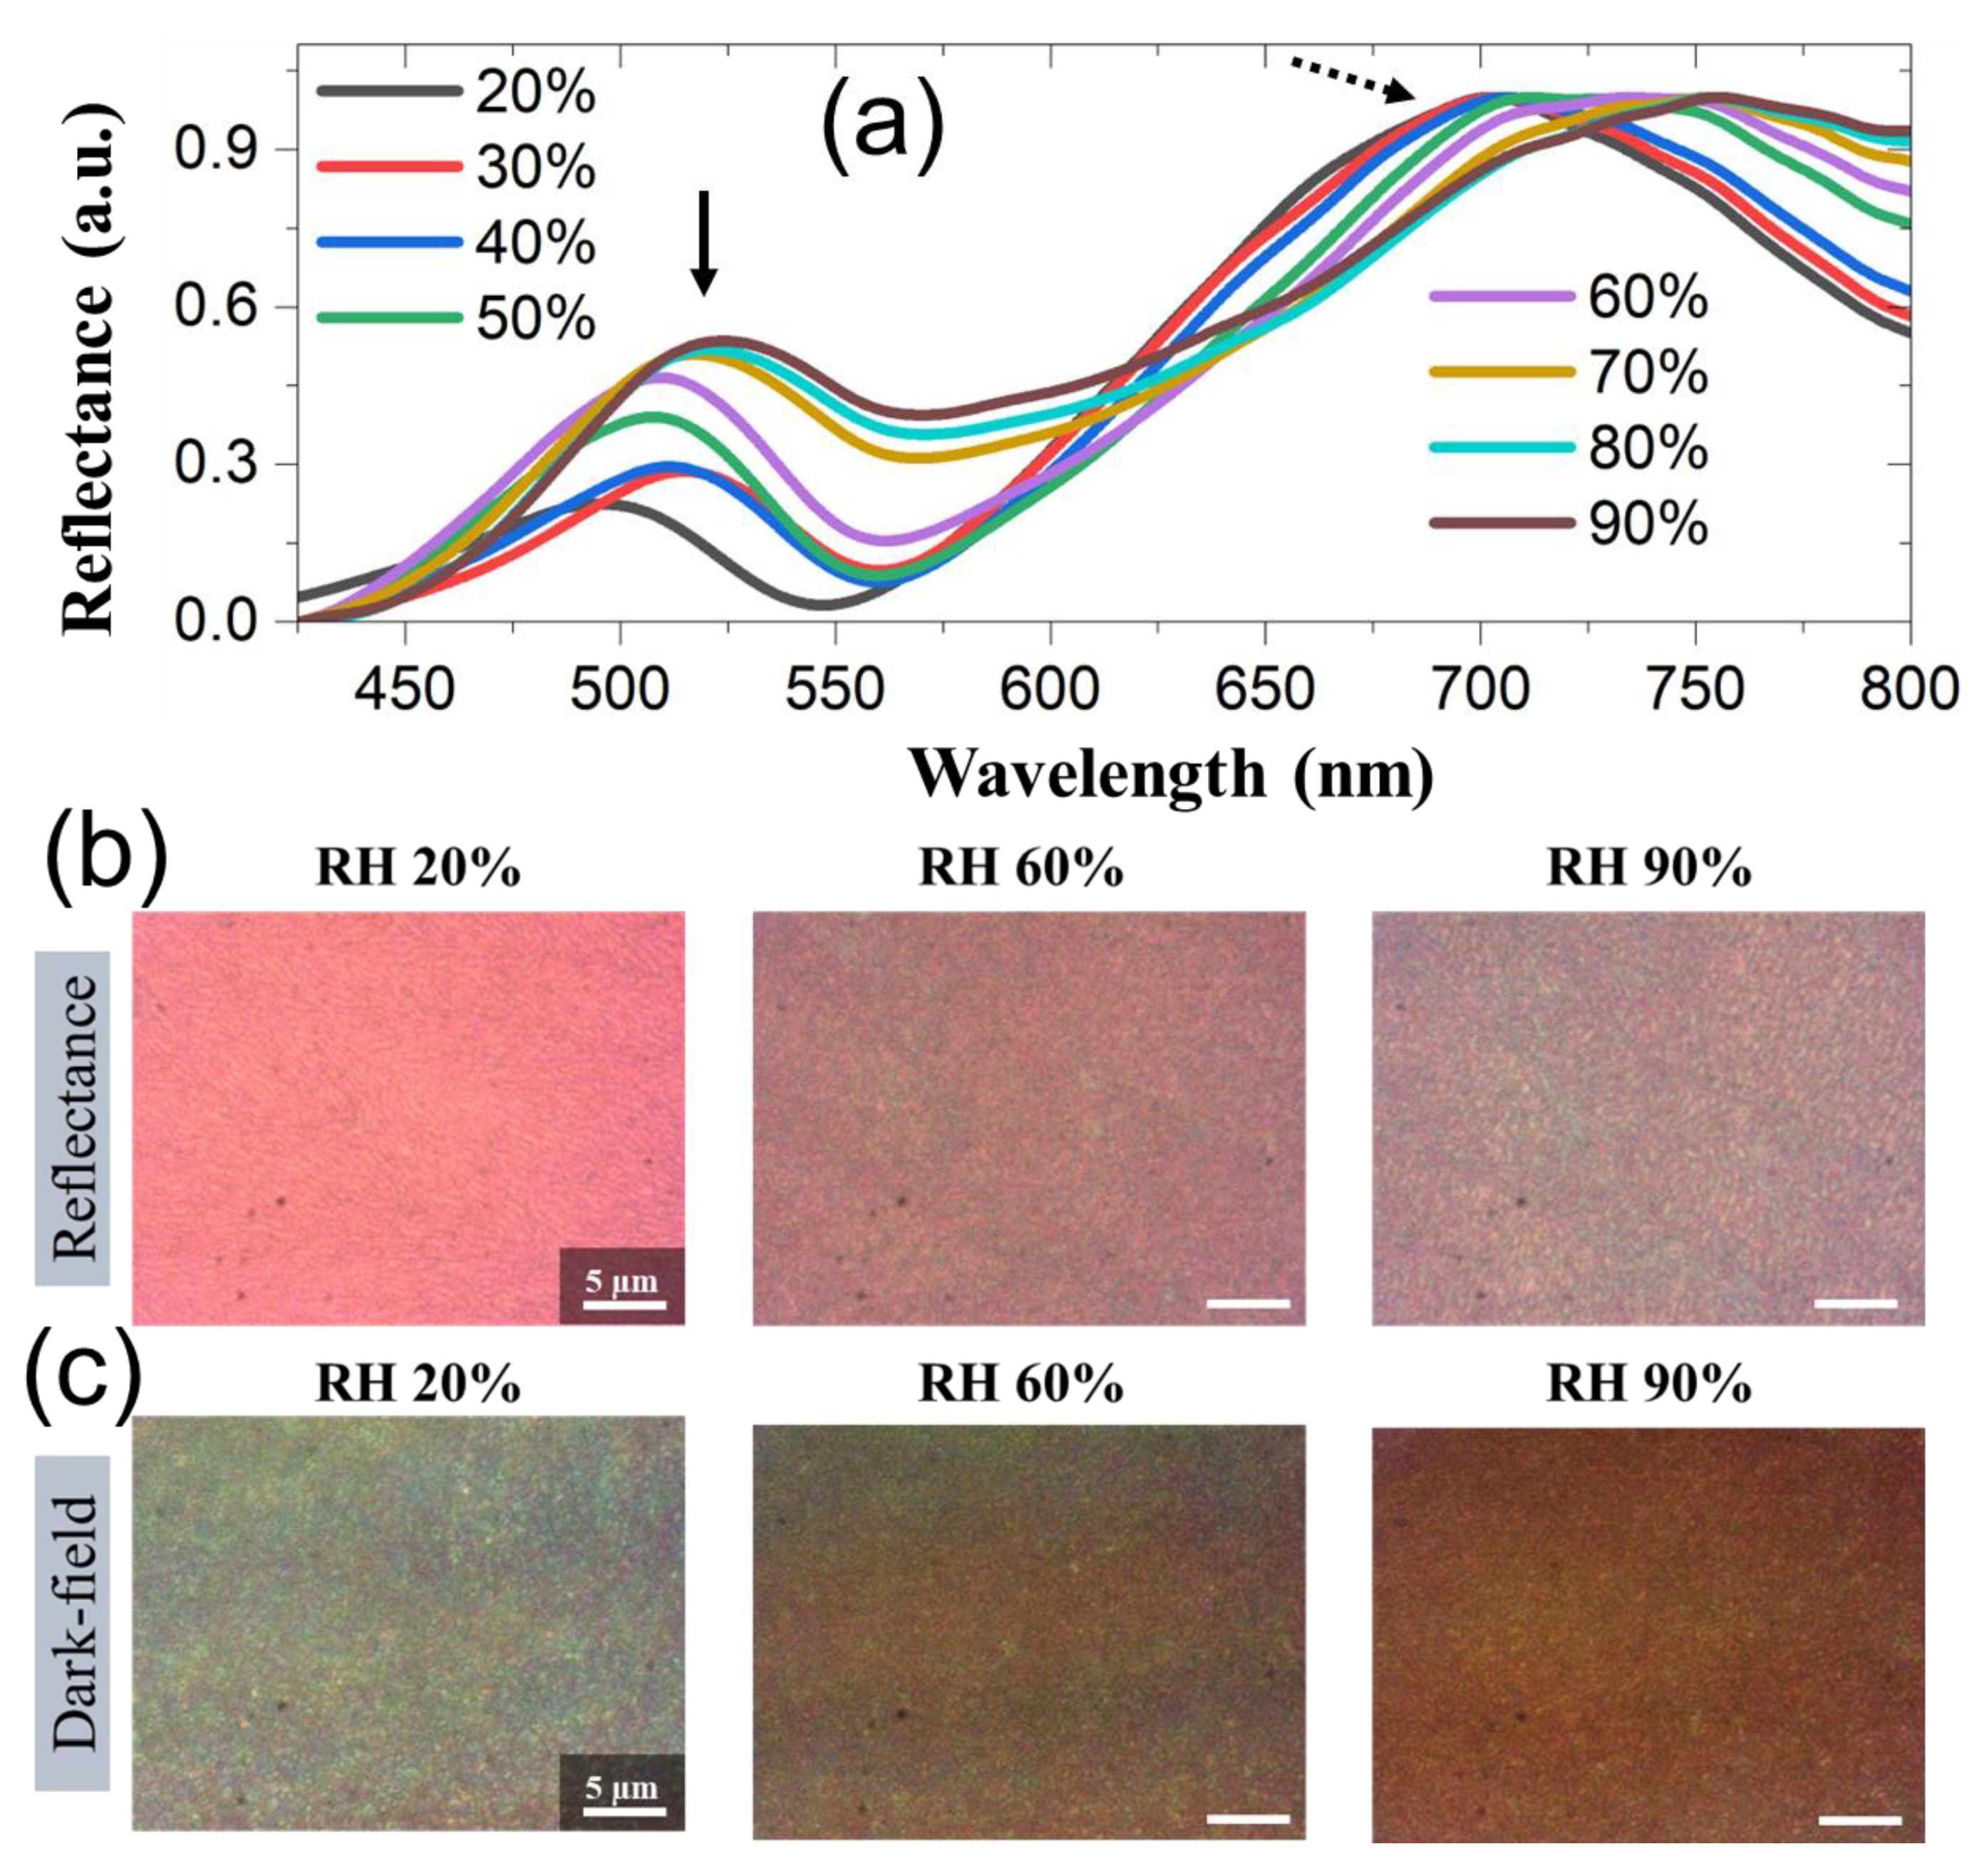
Figure 4.
(a) Understanding optical and geometrical properties of the sample by a standard and dynamic simulation model. We have interparticle gap distances termed “g1” at 20 % humidity level and “g2” at 90% humidity level. For a standard model, g1 = g2; for a dynamic model, g1 > g2. The green colored circles represent the schematic cross-section of the M13 phage. Simulated results for a standard model design (b – c) and dynamic model design (d-e). (f-i) Cross-sectional XZ electric field amplitude profiles taken for plasmonic nanostructure designs with M13 phage thicknesses of 55 nm to 72.5 nm displaying gap mode-based optical properties. The “x” and “z” axes numbers are in nanometers.
Disclaimer/Publisher’s Note: The statements, opinions and data contained in all publications are solely those of the individual author(s) and contributor(s) and not of MDPI and/or the editor(s). MDPI and/or the editor(s) disclaim responsibility for any injury to people or property resulting from any ideas, methods, instructions or products referred to in the content. |
© 2023 by the authors. Licensee MDPI, Basel, Switzerland. This article is an open access article distributed under the terms and conditions of the Creative Commons Attribution (CC BY) license (http://creativecommons.org/licenses/by/4.0/).
Copyright: This open access article is published under a Creative Commons CC BY 4.0 license, which permit the free download, distribution, and reuse, provided that the author and preprint are cited in any reuse.


