
Submitted:
21 March 2023
Posted:
22 March 2023
You are already at the latest version
Abstract
Carotenoids are essential pigments that play a vital role in the photosynthetic process of algae and are important for human health and nutrition. Despite their potential value, algal carotenoids are being neglected by biofuel industries. Recent research is aimed at producing microalgal lipids and carotenoids simultaneously under abiotic stresses. In this study, the effect of different abiotic stress factors such as Nitrogen (N), Potassium (K), Phosphorous (P), Sulphur (S), light intensity, and photoperiod on biomass, lipid, and carotenoids synthesis in Monoraphidium sp. (MP) were explored utilizing a statistical method. In addition, 2, 7-dichlorofluorescein diacetate (DCF-DA) mediated spectrofluorimetry was employed to detect the ele-vation in ROS level. The results revealed that variations in nutrients and light con-ditions are the key factors in the up-regulation of biomolecules lipids and carote-noids in the algae. The carotenoids profiling was done by Ultra Performance Liquid Chromatography Quadrupole Time-of-Flight Mass Spectroscopy (UPLC-Q-ToF-MS). Among consisting carotenoids violaxanthin, astaxanthin, and beta-carotene were enhanced by 1.3 folds, 1.19 folds, 1.08 folds, while lutein was declined by 1.32 folds under stressed condition compared to control. The identified carotenoids are rec-ognized for their importance in the pharmaceutical and nutraceutical industries, highlighting the significant role of MP in these sectors.

Keywords:
Microalgae
; Monoraphidium sp.
; Abiotic stress
; Biomass
; Carotenoids
; Lipids
1. Introduction
Microalgae are getting prominence in the food, feed, and medicine markets owing to their capacity to produce distinctive value-added products and biologically active compounds. As a result, the United Nations’ “Sustainable Development Goals” (SDGs) advocate microalgae biotechnology platforms for the synthesis of industrially significant bioproducts [1]. Microalgae produces a myriad of naturally occurring bioactive compounds, prominently lipids and carotenoids. Likewise, microalgal carotenoids can exhibit a plethora of health benefits against viral, microbial, and cancer activities, in addition to the advantages of antioxidants and vitamins [2]. Microalgal carotenoids serve as natural pigments in addition to their bioactive molecular attributes in nutraceuticals, food, feed, and aesthetics. This has prompted a rise in consumption that has driven the pursuit of novel natural origins for carotenoids [3]. In recent years, the demand for natural goods and health protection items has skyrocketed. The US Food and Drug Administration has proven the applications of numerous microalgae species in food and health [4]. The international carotenoids demand is however predicted to thrive with an average acquire profit of 3.9% [5]. Nonetheless, the industrialization of microalgae biotechnology remains difficult due to high operating and processing costs [6]. Numerous studies have been carried out in recent years to use stressors to reduce the expense of algal biotechnology, nevertheless, the outcomes failed in commercialization because of the lower yield of value-added compounds and high cultivation cost [7]. Despite lower intercellular compound production has been recorded, optimizing combinations of optimal stress conditions is critical to obtaining enhanced microalgal bioactive compounds.
For maximal biomass production, microalgae require nutrient-sufficient circumstances, although the basal amount of lipids can be adjusted by biochemical strategies like nutrition and cultivation conditions alteration [8]. Previous research has identified light, nutrients, temperature, and pH are all abiotic stressors that have a direct impact on microalgae development. Intercellular carotenoid synthesis increases during light stress to protect cells from photoinhibition [9]. Consequently, different microalgal species require different levels of light for growth and biomolecule synthesis [10]. Since the nutrients in the growth medium have a major influence on the development of microalgae, optimizing appropriate growth media is critical for industrial applications. Nitrogen is an essential nutrient for biomolecule synthesis (protein, lipids, chlorophyll, and nucleic acids), metabolism, and cell growth [11]. Nitrogen and phosphorus insufficiency alters the carbon flux protein, triggering higher lipid deposition in microalgae [12]. Moreover, a lack of phosphorus increases lipid content, which causes triacylglycerols (TAG) to build during microalgal growth. High production of biomass, lipid, and carotenoid necessitates the nutritional composition to be optimized [13]. RSM is a computational and statistical design targeted at evaluating challenges associated with reliance on multiple independent factors with the intent of improving the operation factors in an attempt to achieve the maximum response [14]. RSM was applied to optimize the variables predicated on the intricate dynamic interplay of multiple variables on biomass, lipids, and carotenoid production. It is widely known that stressing conditions could improve lipid content [15]. But nonetheless, little is known about the physiological and molecular components of the underlying processes. Despite the fact that oxygen is not hazardous to organisms, the accumulation of reactive oxygen species (ROS) could trigger oxidative harm to the cellular environment, inevitably leading to toxicity due to excessive reactive oxygen stress [16]. An earlier investigation revealed that abiotic stress causes lipid increases and the co-occurrence of ROS species in microalgae species. As a result, the yield of bioproducts is directly correlated with the ROS level generated by a particular species of microalgae.
To the finest of our knowledge, no empirical research is available on the concurrent augmentation of biomass, lipids, and carotenoids in MP through optimizing multifaceted culture conditions. In the present study, microalgae were cultivated under varying abiotic factors including N, P+K, S, LI, and PP targeting an increase in carotenoid and lipid yield. The growth performance and photosynthetic efficiency were tracked on alternate days during the culture process designed by RSM-CCD. To identify the rise in ROS level and morphometric changes, spectroscopic analysis and microscopy were used. Carotenoid content was determined after analyzing net biomass and other bioproducts. As a result, the current study intended to ascertain the optimal multimodal condition for boosting biomass, lipids, and carotenoids in MP, along with the comprehensive carotenoid profile. Carotenoid variation under stressed conditions showed a remarkable achievement for the nutraceutical and pharmaceutical market.
2. Materials and Methods
2.1. Microalgae Growth
The microalgae Monoraphidium sp. (NCM no. 5585) was procured from the National Chemical Laboratory (NCL), Pune, India. In a 100 ml Erlenmeyer flask containing 50 ml BBM medium microalgae were inoculated with pure microalgae inoculum to achieve 0.1 OD of the medium. Cultures were placed in an incubation room with a stable temperature of 28 ± 2°C, and continuous white light illumination of 100 μ mol m−2 s −1 for 24 h with intermittent agitation.
2.2. Biochemical Analysis
2.2.1. Gravimetric Estimation of Lipids
Total lipid extracted from 1 g dry microalgal biomass via the Bligh and Dyer method with a combination of 2:1 chloroform and methanol respectively [17]. Total Lipid production, productivity, and content were adjudged by Equations (1), (2) and (3) respectively.
Total lipid production (mg/L) = mass of lipid (mg)/Volume (L)
Lipid productivity (mg/L/d) = mass of lipid (mg)/ Volume (L) × cultivation duration (d)
Lipid content (%) = mass of lipid (g)/mass of culture (g) × 100
2.2.2. Estimation of Protein Content
Lowry’s method was used for the estimation of protein content and observed at 660nm absorbance moreover protein concentration was determined via Bovine Serum Albumin (BSA) standard curve [18]. By the virtue of Equation (4) protein content was estimated as:
Protein (%) =Weight of protein (BSA CURVE)/Dry cell mass (g) ×100
2.2.3. Estimation of Carbohydrate content
The 3, 5- Dinitro salicylic acid (DNS) method was used for determining the carbohydrate content present in MP [19]. To determine carbohydrate content DNS reagent was utilized and optical density was arbitrated by Microplate reader Synergid H1 (BioTek, USA) at 540 nm. The total carbohydrate content was estimated by Equation (5):
Carbohydrate Content (%) = Weight of carbohydrate (glucose standard curve) /dry cell mass×100
2.2.4. Estimation of Moisture and Ash Content
For moisture content, the weight of algal biomass prior to and afterward, 1 hr of drying at 105℃ followed by desiccation for 30 min was carried out before weighing. For ash content, the dried biomass was heated at 550℃ for 30 min, and thereafter 30 min desiccation and weighing were carried out as per [20]. The total moisture and ash content was estimated by Equations (6) and (7):
Moisture content (%) = (Weight of wet biomass-Weight of dry biomass)/ Weight of wet biomass X 100
Ash content (%) = (weight of ash / weight of dry biomass) X 100
2.3. Optimizing Nutrients, Light Intensity and Photoperiod Using the Response Surface Methodology (RSM) Based Central Composite Design (CCD) Design Expert
Three nutrient factors and two illumination factors constitute the five abiotic stress factors that were examined in this investigation. The following factors are nitrogen concentration, combine potassium and phosphorous concentration, sulphur concentration, light intensity, and photoperiod. RSM-CCD design expert 13 was opted to determine the various concentrations of all five parameters. Levels, parameters, and the experimental set are all detailed in Table 1. Forty-three experimental sets were coded in duplicate, with the biomass, lipid, chlorophyll a, chlorophyll b, and carotenoids response. All experiments were conducted on the scale of the experimental set in 250 ml Erlenmeyer flasks with a working volume of 100 ml. The Erlenmeyer flasks were locked with cotton plugs and placed in the growth chamber by providing culture conditions according to RSM-CCD, with intermittent orbital shaking at 100 rpm in a rotary orbital shaker (REMI CIS 24BL, Mumbai, India). The entire process above was analyzed with a statistical program (Design Expert 13.0.0, Stat-Ease, USA).
2.4. Biomass, Lipid, and Pigment Analysis
Microalgae biomass was determined by microplate reader Synergid H1 (BioTek, USA) spectra-fluorometer on every alternate day, 200 µL culture loaded on 96 well plates, and the absorbance recorded at 680 nm for calculating biomass concentration from Equations (8)–(11) [21].
where A680 depicts the density of algae at 680 nm wavelength.
where, T represents time in days; X2 and X1 showed final and initial biomass concentration; T2 and T1 represent final and initial time, respectively.
Biomass concentration (g/L) = 0.657 A680 - 0.0841
Biomass productivity (g/L/d) = Biomass concentration (g/L)/T(d)
Specific growth rate (µ) = lnX2 − lnX1∕T2 − T1
Doubling time = ln2/µ
Lipid-sensitive fluorescent dye Nile red was used to visualize and estimate triacylglycerol (TAG) accumulation in microalgae at different stages [22]. Quantification of neutral lipid was performed in a black 96-well plate (Nunc maxisorp, US) in duplicates at each time interval (on the 1st, 5th, 9th, 13th, 18th, 23rd, 25th, and 30th day). About 500 µL culture was mixed with 1 µL of stock Nile Red (stock concentration) containing 499 µL DMSO solution. The sample was loaded on a black 96 well plate (Nunc maxisorp, US) and the fluorescence was recorded using a Synergid H1 spectra-fluorometer at an excitation wavelength of 530 nm and emission wavelength of 575 nm.
Microalgae pigment was determined by microplate reader Synergid H1 spectra-fluorometer on every alternate day, 200 µL culture loaded on 96 well plates (Nunc maxisorp, US) [23]. Pigment content was determined as chlorophyll a, chlorophyll b, and total carotenoid by Equations (12), (13) and (14) respectively.
Chl a (µg/mL) = 13.36 A664 − 5.19A648
Chl b (µg/mL) = 27.43 A648 − 8.12A664
Car (µg/mL) = (1000 A470 − 2.13Ca − 97.64Cb)/209
2.6. ROS Estimation:
In ethanol DCFH-DA was dissolved and 1 ml of the dissolved DCFH-DA was deacetylated by adding 0.01 M NaOH in dark to obtain DCFH. Microalga cells were harvested and washed with PBS followed by the resuspension of cell pellets in DCF-DA [24]. After 1 hour of incubation at 37°C in dark and cells were placed in the black 96 well plates with clear bottoms. Fluorescence intensity was measured at 485 nm excitation and 527 nm emission using Microplate reader Synergid H1 (BioTek, USA). Fluorescence is measured in terms of relative fluorescence unit (RFU).
2.5. Microscopic Visualization of Lipophilic Compounds
To determine lipid fluorescence intensities microalgae cells were stained with the fluorescent dye Nile Red (Sigma, 552/636), and the fluorescence intensity was measured to determine the presence of lipophilic compounds. 1 ml of microalgae cell culture was centrifuged (Eppendorf 5810R) at 7000 rpm for 5 min, and the pellets obtained were rinsed thrice with PBS. The pellet was dissolved in 1 mL of 20% DMSO before 1.5 g mL-1 of Nile Red dye was added. After 15 minutes, the mixture was incubated in the dark. The intracellular lipophilic compounds in algal cells were detected by an inverted fluorescence microscope (Nikon A1, Tokyo, Japan) at 552 nm excitation and 636 nm emission wavelength. The measurement of fluorescence potency in microalgal cells is determined by ImageJ software [25].
2.6. UPLC-Q-ToF-MS Analysis
Microalgal carotenoids were analyzed by the Acquity H class series UPLC system (Waters, Synapt XS HDMS) coupled with a quadrupole time-of-flight mass spectrometry (QToF). 5 µl sample was injected in Acquity UPLC C18 BEH column (2.1X50mm, 1.7 µm particle size, Water) consisting electron spray ES+ with 5 µl injecting volume at 0.25 ml/min flow rate. The mobile phase consists of 0.1% formic acid in water (A) and 0.1% formic acid in ACN solvent (B). Method initiated with 0min 90/10,2min 90/10,5min 80/20,10min 70/30,12min 50/50,14min 90/10 and so on. Electrospray ionization (ESI) acquisition was performed with the Auto MS/MS method in positive modes. For the mass spectrometer following parameters were used including desolvation gas 950L/h, cone Gas 30 L/H, desolvation temperature 450℃, source temperature 120℃, capillary voltage 3.22keV, cone voltage 50V, and collision energy 4ev. The gases used are N2 and Argon with the pressure of 6-7 bar and 5-6 bar respectively.
3. Results and Discussion
Freshwater algae belonging to the genus Monoraphidium sp. are found all over the globe and are noted for having a very extensive range of biotic communities [26]. Recently, MP has gained recognition as a possible biofuel feedstock because of its adaptability to a variety of environmental factors [27]. The potential of MP as a source of carotenoids, on the contrary side, has undergone less investigation.
3.1. Morphology and Growth Analysis
In order to maintain the culture conditions in the photoautotrophic mode, the BBM medium was used to analyze the biomass, lipid, and pigments production by MP. Figure 1 illustrates the morphometric analysis of MP in BBM medium by confocal microscopy. The microalga develops photo autotrophically for 15–30 days while absorbing light and ambient CO2. In combination with biomass production (mg/L), the quantity of lipids, carotenoids, and chlorophylls was periodically measured. At the late exponential phase of the development, the maximum value of chlorophyll a and b are recorded to be 12.7 and 8.6 respectively. This implies that while growth continues, the chlorophyll content rises for a period of time ultimately commencing to decline after the early stationary phase, which accounts for the end of the stationary phase. In contrast, in the late stationary phase, the cell biomass and bioactive compound accumulation were found higher.
The morphology of the microalgae MP was examined using confocal microscopy after being cultured in BBM media under photoautotrophic conditions. During the exponential phase, confocal images of axenic MP cultures were recorded and are displayed in Figure 1.
To determine the precise quantities of lipids, carbohydrates, and protein in MP, a biochemical examination was conducted as indicated in Figure 2. It was found that the percentages of lipid, carbohydrate and protein in MP cultivated on BBM medium were 18.5%, 42%, and 35.21%, correspondingly.
3.2 Regression Modeling and Statistical Analysis
The outcomes of improved production of biomass, lipids, and carotenoids under various abiotic stress scenarios were assessed and presented based on the design of the RSM-CCD. Design Expert was implemented to determine the anticipated values and actual values in Table 1. According to results computed using CCD design, the outcomes of augmented biomass, lipids, and carotenoids production under distinct abiotic stress scenarios are displayed in Table 1 and the yields of chlorophyll a and b obtained are provided in Table S1.

Table 1.
Optimization of a combination of nutrients and light by RSM-CCD matrix for the analysis of biomass, lipids, and carotenoids yield.
Table 1.
Optimization of a combination of nutrients and light by RSM-CCD matrix for the analysis of biomass, lipids, and carotenoids yield.
| Run | Factor A: N (mg/L) | Factor B: P+K (mg/L) | Factor C: S (mg/L) | Factor D : LI (µmolm-2s-1) | Factor E: PP (h) | Experimental Value | Anticipated Value | ||||
|---|---|---|---|---|---|---|---|---|---|---|---|
| Biomass Productivity (mg/L/d) |
Lipid Content (%) |
Total Carotenoid Yield (µg/ml) |
Biomass productivity (mg/L/d) | Lipid content (%) | Total Carotenoid yield (µg/ml) | ||||||
| 1 | 2500 | 250 | 70 | 137.5 | 12 | 24.5 | 13.1 | 3.18 | 34.27 | 18.31 | 4.98 |
| 2 | 2500 | 0 | 70 | 137.5 | 24 | 27.8 | 14.8 | 4.94 | 44.9 | 23.99 | 6.55 |
| 3 | 2500 | 500 | 70 | 137.5 | 24 | 54.9 | 29.3 | 12.2 | 50.26 | 26.85 | 7.35 |
| 4 | 2500 | 0 | 140 | 137.5 | 12 | 41.09 | 21.9 | 4.5 | 32.09 | 17.14 | 2.87 |
| 5 | 5000 | 250 | 70 | 137.5 | 0 | 11.3 | 6.04 | 0.78 | 24.05 | 12.85 | 2.168 |
| 6 | 5000 | 250 | 70 | 75 | 12 | 24.01 | 12.8 | 1.1 | 28.66 | 15.31 | 3.52 |
| 7 | 2500 | 250 | 140 | 75 | 12 | 23.28 | 12.4 | 3.5 | 26.08 | 13.93 | 5.09 |
| 8 | 5000 | 0 | 70 | 137.5 | 12 | 39.7 | 21.2 | 3.5 | 34.67 | 18.52 | 4.05 |
| 9 | 2500 | 250 | 0 | 200 | 12 | 76.4 | 40.8 | 8.07 | 42.47 | 22.69 | 7.34 |
| 10 | 2500 | 250 | 0 | 137.5 | 24 | 52.5 | 42.09 | 6.12 | 47.09 | 25.16 | 6.2 |
| 11 | 2500 | 250 | 140 | 137.5 | 24 | 45.9 | 24.5 | 7.02 | 48.08 | 25.68 | 7.7 |
| 12 | 0 | 250 | 70 | 137.5 | 24 | 34.8 | 18.6 | 6.7 | 44.5 | 23.78 | 3.91 |
| 13 | 2500 | 500 | 70 | 137.5 | 0 | 25.3 | 13.5 | 3.69 | 23.65 | 12.63 | 3.75 |
| 14 | 0 | 0 | 70 | 137.5 | 12 | 25.03 | 13.3 | 4.96 | 28.52 | 15.23 | 4.77 |
| 15 | 2500 | 500 | 0 | 137.5 | 12 | 29.1 | 15.5 | 6.14 | 36.46 | 19.48 | 5.89 |
| 16 | 0 | 250 | 0 | 137.5 | 12 | 30.8 | 16.4 | 6.18 | 30.7 | 16.4 | 6.19 |
| 17 | 0 | 250 | 140 | 137.5 | 12 | 24.8 | 13.2 | 4.5 | 31.69 | 16.93 | 3.95 |
| 18 | 2500 | 0 | 70 | 75 | 12 | 49.85 | 30.6 | 8.14 | 22.91 | 12.24 | 5.99 |
| 19 | 2500 | 250 | 70 | 200 | 0 | 27.6 | 14.78 | 2.6 | 29.65 | 15.84 | 3.13 |
| 20 | 2500 | 250 | 70 | 200 | 24 | 33.8 | 18.09 | 4.09 | 56.27 | 30.06 | 7.2 |
| 21 | 2500 | 500 | 70 | 75 | 12 | 17.5 | 9.39 | 3.01 | 28.27 | 15.1 | 3.61 |
| 22 | 2500 | 250 | 70 | 75 | 24 | 34.01 | 18.17 | 4.4 | 38.89 | 20.78 | 6.71 |
| 23 | 2500 | 250 | 0 | 75 | 12 | 24.5 | 13.1 | 5.43 | 25.09 | 13.41 | 4.5 |
| 24 | 0 | 500 | 70 | 137.5 | 12 | 37.8 | 20.2 | 6.8 | 33.88 | 18.1 | 5.37 |
| 25 | 5000 | 250 | 70 | 137.5 | 24 | 75.4 | 40.28 | 16.2 | 50.66 | 27.06 | 10.7 |
| 26 | 0 | 250 | 70 | 137.5 | 0 | 30.1 | 16.08 | 3.79 | 17.89 | 9.56 | 6.23 |
| 27 | 2500 | 500 | 70 | 200 | 12 | 55.73 | 29.7 | 6.87 | 45.64 | 24.38 | 7.5 |
| 28 | 2500 | 250 | 70 | 137.5 | 12 | 34.8 | 18.6 | 5.7 | 34.27 | 18.31 | 4.98 |
| 29 | 2500 | 0 | 0 | 137.5 | 12 | 27.15 | 14.5 | 5.13 | 31.1 | 16.61 | 5.95 |
| 30 | 5000 | 500 | 70 | 137.5 | 12 | 41.28 | 22.05 | 6.48 | 40.03 | 21.39 | 5.74 |
| 31 | 2500 | 0 | 70 | 137.5 | 0 | 12.08 | 6.45 | 1.74 | 18.29 | 9.77 | 2.26 |
| 32 | 2500 | 250 | 70 | 137.5 | 12 | 44.5 | 23.8 | 5.94 | 34.27 | 18.31 | 4.98 |
| 33 | 2500 | 500 | 140 | 137.5 | 12 | 37.5 | 20.08 | 7.93 | 37.45 | 20.01 | 5.22 |
| 34 | 2500 | 250 | 70 | 75 | 0 | 23.83 | 12.7 | 3.3 | 12.28 | 6.56 | 2.89 |
| 35 | 2500 | 250 | 140 | 137.5 | 0 | 8.5 | 4.54 | 1.2 | 21.46 | 11.47 | 3.815 |
| 36 | 2500 | 250 | 0 | 137.5 | 0 | 7.81 | 4.17 | 7.06 | 20.47 | 10.94 | 5.64 |
| 37 | 5000 | 250 | 140 | 137.5 | 12 | 34.2 | 18.3 | 3.01 | 37.85 | 20.22 | 4.14 |
| 38 | 0 | 250 | 70 | 75 | 12 | 25.1 | 13.4 | 4.73 | 22.51 | 12.03 | 6.08 |
| 39 | 2500 | 0 | 70 | 200 | 12 | 33.6 | 17.9 | 4.9 | 40.28 | 21.52 | 2.83 |
| 40 | 0 | 250 | 70 | 200 | 12 | 30.5 | 16.3 | 3.7 | 39.88 | 21.31 | 4.06 |
| 41 | 5000 | 250 | 70 | 200 | 12 | 32.04 | 17.1 | 4.9 | 46.04 | 24.6 | 6.27 |
| 42 | 2500 | 250 | 140 | 200 | 12 | 71.3 | 38.1 | 1.3 | 43.46 | 23.22 | 2.99 |
| 43 | 5000 | 250 | 0 | 137.5 | 12 | 30.4 | 16.2 | 3.9 | 36.86 | 19.69 | 5.65 |
Using RSM to perform regression analysis and curve fitting of the data, the relationship among responses (biomass, lipid, chlorophyll a, chlorophyll band total carotenoids) and factor variables such as Nitrogen (A), Phosphorous /Potassium(B), Sulphur (C), Light intensity (D)and photoperiod(E) were obtained, which was expressed by the polynomial equations presented in Table 2. The equation that was developed by the design expert appears in Table 2 with their corresponding Radj2 values.
Figure 3, Figure 4 and Figure 5, S1 and S2 depict a 3-D surface response plot of the association between factors and response value achieved. The fitted model appeared accurate and could offer recommendations for enhancing productivity employing suitable conditions, as illustrated in the 3-D surface response plot of RSM Design Expert software’s regression equation underwent residual and variance analysis to assess the efficacy of the selected model and the veracity of the anticipated results. Additional evidence should be provided to support the effects of N, P+K, S, LI, and PP on the productivity of biomass, lipid, chlorophylls, and carotenoids.
Table 3 shows that the model had an F value and p-value of responses in correspondence to factors influence. The greatest impact was produced by a combination of five distinct abiotic factors. The Radj2 coefficient represented the model’s dependability. The regression model and the actual values exhibited a strong correlation, as evidenced by the value of Radj2, and yet this model had a great chance of accurately predicting the outcome of the experimental setup. The test has great reliability and precision, as demonstrated by the coefficient of variation, reflecting the repeatability of the test, being considerably low. Overall consistency was significant, which showed that perhaps the experimental design had been effectively driven. In essence, the regression model has a successful track record.
3.2.1. Biomass Model
The Model F-value of 5.20 indicates that the model is statistically significant. There is barely a 0.10% probability that an F-value this large could arise owing to noise. Model terms are significant when their P-values are lower than 0.0500. The conceivable combinations of experiments are shown in Table 1, wherein the biomass is the primary response, based on the CCD paradigm and responses. Following the RSM combinations performed, we recorded the experimental data (Figure 3). The biomass ranged significantly from 7.8 to 75.4 mgL-1d-1 contingent on the nutrients of the medium and illuminance conditions. With a high-order polynomial regression equation, the linearly fitted model was obtained as depicted in Table 2 has been synched to the data and showed no significant lack of fit that can appropriately represent the interaction here between factors and response. The relevance of the linear models for biomass was evaluated employing analysis of variance (ANOVA), and thus the outcomes are reported in Table 2 and Table 3. Biomass is hugely affected by N (5000 mg L-1), P+K (250 mg L-1), S (70 mg L-1), LI (137.5 µmolm-2s-1), and PP (24 h). With a coefficient of 29.06, the correlation between predicted and actual values was remarkable. Furthermore, a 3-D response surface plot illustrates the effects of N, P+K, S, LI and PP individually or in combination on biomass concentration and adequately optimizes the verified variables. To boost biomass productivity, this study is one of the few to explore CCD utilizing numerous variables, including N, P+K, S, PP, and LI.
3.2.2. Lipids Model
The second response was total lipids content, and the highest order polynomial fitted model presented in Table 3 was achieved, with a distinctive linear regression equation appropriate for the data, and no significant lack of fit Radj2 of 0.3, implying that the experimental data were very well fitted to the linear model. Only statically meaningful terms with p-values less than 0.05 were selected for model calibration. The influence of N, P+K, S, PP and LI on lipids was characterized empirically using regression coefficients. The lipid content is governed by many parameters estimates, each of which has a favorable overall impact on the lipid content. The 3-D response surface plot with the contour map shown in Figure 4 demonstrates significant information that confirms whether an optimum stress condition boosts the lipids and enables them to attain their highest prevalence.
3.2.3. Chlorophyll a and b Model
In subsequent research on the chlorophylls, the quadratic and linear models for chlorophyll a and b, correspondingly, were constructed by RSM-CCD design experts. The model’s adequacy is demonstrated by the p-value of less than 0.05 for each model term. The significance of the model is increased by a lower p-value and a larger magnitude of the factors. The best-fitting model, according to the data, was quadratic and linear. The surface model shows that several actual data values are lower than predicted values and some are higher than projected values, as indicated in Table S1. Table 3 shows a coefficient of 10.72 for chlorophyll a and 3.38 for chlorophyll b. Moreover, the highest-order polynomial equations indicate that the models are substantial.
3.2.4. Carotenoids Model
Apart from chlorophylls, a total carotenoids investigation was indeed carried out, and the 2FI model emerged through a statistical analysis of the data. This paradigm states that each factor has a unique and distinct consequence on response. Radj2 of 0.31 and a p-value of 0.029 indicate the robustness of the models. The model is presumably remarkable given its Model F-value of 2.28. There is only a 2.99% probability that an F-value this large may arise owing to noise. The 3-D surface plot and contour lines revealed that the diverse circumstances had differential effects on the responses (Figure 5). Furthermore, the 3-D model shows the best model-fitted ranges N, P+K, S, LI, and PP.
3.2.5. Model Validation
MP was cultivated for 30 days to validate the results, and the values that were acquired are shown in Table 1. Quantification of biomass, lipids, chlorophylls, and carotenoids was also performed using spectrophotometric and gravimetric approaches. These findings confirmed the model’s applicability, and the experimental values corresponded with the predicted values.
3.3. Effect of Distinctive Abiotic Stresses on the Yield of Biomass, Lipids, Chlorophylls, and Carotenoids
MP showed a dynamic growth pattern in photoautotrophic (BBM) conditions, yielding a maximal of 28.3 mg L-1d-1 biomass productivity, 106 mg L-1 of lipids, and 3.76 µg mL-1 of total carotenoids during the stationary phase. On the contrary side, in optimized stress condition, the greatest biomass productivity was 75.4 mg L-1d-1, lipid production of 542.8 mg L-1, and total carotenoid production of 16.25 µg mL-1 were recorded on the 18th day after inoculation.
Abiotic stress variables have already been linked to direct effects on lipids and carotenoid content in prior findings [28]. In this study, a wide range of abiotic stressors were adjusted with an emphasis on boosting carotenoid synthesis while enhancing the ability to produce biomass and lipids levels. Carotenoids and lipids production is directly correlated with biomass production, irrespective of various external factors including light, nutrition, temperature, etc. As shown in Figure 6. N, P+K, S, LI, and PP promoted the accretion of biomass, carotenoids, and lipids. Aggrandizement of biomass, fatty acid, and carotenoid production emerges when several abiotic factors are combined as compared to the control. For D. salina amid illumination and nitrogen deprivation stress conditions, a concomitant rise in beta carotene and TAG accumulation has been reported [29]. Kaha et al., 2021 reported that Monoraphidium sp. SP03 has increased astaxanthin concentration under black light (0.476µg/mL biomass) than under control (0.363 µg/mL biomass) [30]. Nitrogen stress factor adjustment has been widely used to improve lipid formation in microalgae such as Chlorella Vulgaris and Scenedesmus sp. [31]. Therefore, nutrients and illumination stress constitute a feasible paradigm that can be employed in MP for industrial applications, as it triggers the synthesis of significant quantities of carotenoids and lipids. Recent investigation has focused on MP’s ability in the biofuel area, although the immense potential in the pharmacological and nutraceutical industries has largely gone untapped. The very first time the precise pharmacological potential of MP has indeed been articulated in this research, here to the best of our knowledge.
3.4. Visualization of Lipophilic Compounds via Confocal Microscopy
Carotenoids are lipophilic substances found both within and outside chloroplasts that can be visualized as red globular aggregates employing confocal microscopy and the Nile Red strain, as illustrated in Figure 7. Optimizing multiple stress conditions, Nile red staining and fluorescence examination revealed the presence of lipophilic compounds within a cell. In contrast to the control, fluorescence obtained reveals that the accumulation of intracellular lipid, carotenoid, and chlorophyll inside the optimized MP cells is higher as depicted in Figure 4.
The above findings reinforce our notion that the proportions of light and nutrients have a substantial impact on the aggregation of metabolites in MP. Usually, carotenoids are classified into two sorts including carotene (α carotene, β carotene, and lycopene) and phylloxanthin (astaxanthin, lutein, fucoxanthin, and zeaxanthin). Primary carotenoids are produced by the photosynthetic machinery in microalgae, while secondary carotenoids are produced when stressed cells are encountered [32]. Nutrient limitation improves carotenoid production for microalgae culture under a variety of abiotic stress conditions such as light intensity, salinity, and temperature [33].
3.5. Implication of Antioxidant Capacity under Multiple Abiotic Stresses
Microalgae under combinations of abiotic stress boosted ROS production to fend off the adverse consequences of the environment. A non-fluorescent cell-permeable probe termed DCFH-DA is transformed by cellular hydrogen peroxide or other peroxides into an extremely fluorescent compound known as DCF.
As illustrated in Figure 8, the internalized ROS generated as a result of multiple abiotic stimuli exhibits a significant elevation of ROS level in comparison to the control. MP developed a sophisticated pathway for evoked production of fatty acids and carotenoids to endure the adverse effects of these diverse abiotic stresses. It was ascertained that additional motile electrons in the light-induced electron transportation chain have been sequestrated to preclude the decrement of oxygen molecules for ROS formation, which inevitably prohibits the decrement of oxygen molecules from ROS generation [34]. The precise mechanism underlying this ROS formation remained unclear. A model for the concomitant production of carotenoids and TAG in microalgae was proposed by Kou et al. in 2020 [35]. They hypothesized that when microalgae are exposed to diverse abiotic stresses, critical genes in the carotenogenesis and lipogenesis pathways are triggered, culminating in the simultaneous evoked synthesis of carotenoids and TAGs, which are then deposited in lipid droplets. It was believed that augmented ROS may affect both pathways’ transcriptional regulation on exposure to abiotic stress. As a secondary messenger, ROS may indeed lead to oxidative stress when it is synthesized in overabundance. To counteract this, microalgae establish a complex mechanism involving the contemporaneous elicited production of carotenoids and TAGs, which subsequently reduces ROS levels [35]. According to this finding, the photoprotective function and light-harvesting complexes of carotenoids in the cell compartments both contribute to carotenoid damage by reducing singlet oxygen production and scavenging free radicals that are triggered by high light and nutrient deficiency. [36]. In D. salina, increasing the light intensity led to an increase in the production of β carotene [37].
3.6. Carotenoid Profiling by UPLC-Q-TOF-MS
The outcomes of the carotenoid identification process are presented in Table 4. To achieve precise quantification and structural insights into the carotenoids in the MP-derived carotenoids sample, UPLC-Q-TOF-MS was used. Astaxanthin, violaxanthin, lutein, cis-carotene, and beta-carotene were detected in the MP carotenoids samples with retention times of 28.07, 30.41, 31.76, 33.67, and 33.92 min., respectively. The existence of all these carotenoids in MP was corroborated by the mass spectrometry of the extracted compounds.
Figure 9.
UPLC-QTOF-MS mass spectra (ESI, positive ion mode) of (a) astaxanthin, (b) violaxanthin (c) lutein (d) Zeaxanthin (e) Beta carotene.
Figure 9.
UPLC-QTOF-MS mass spectra (ESI, positive ion mode) of (a) astaxanthin, (b) violaxanthin (c) lutein (d) Zeaxanthin (e) Beta carotene.
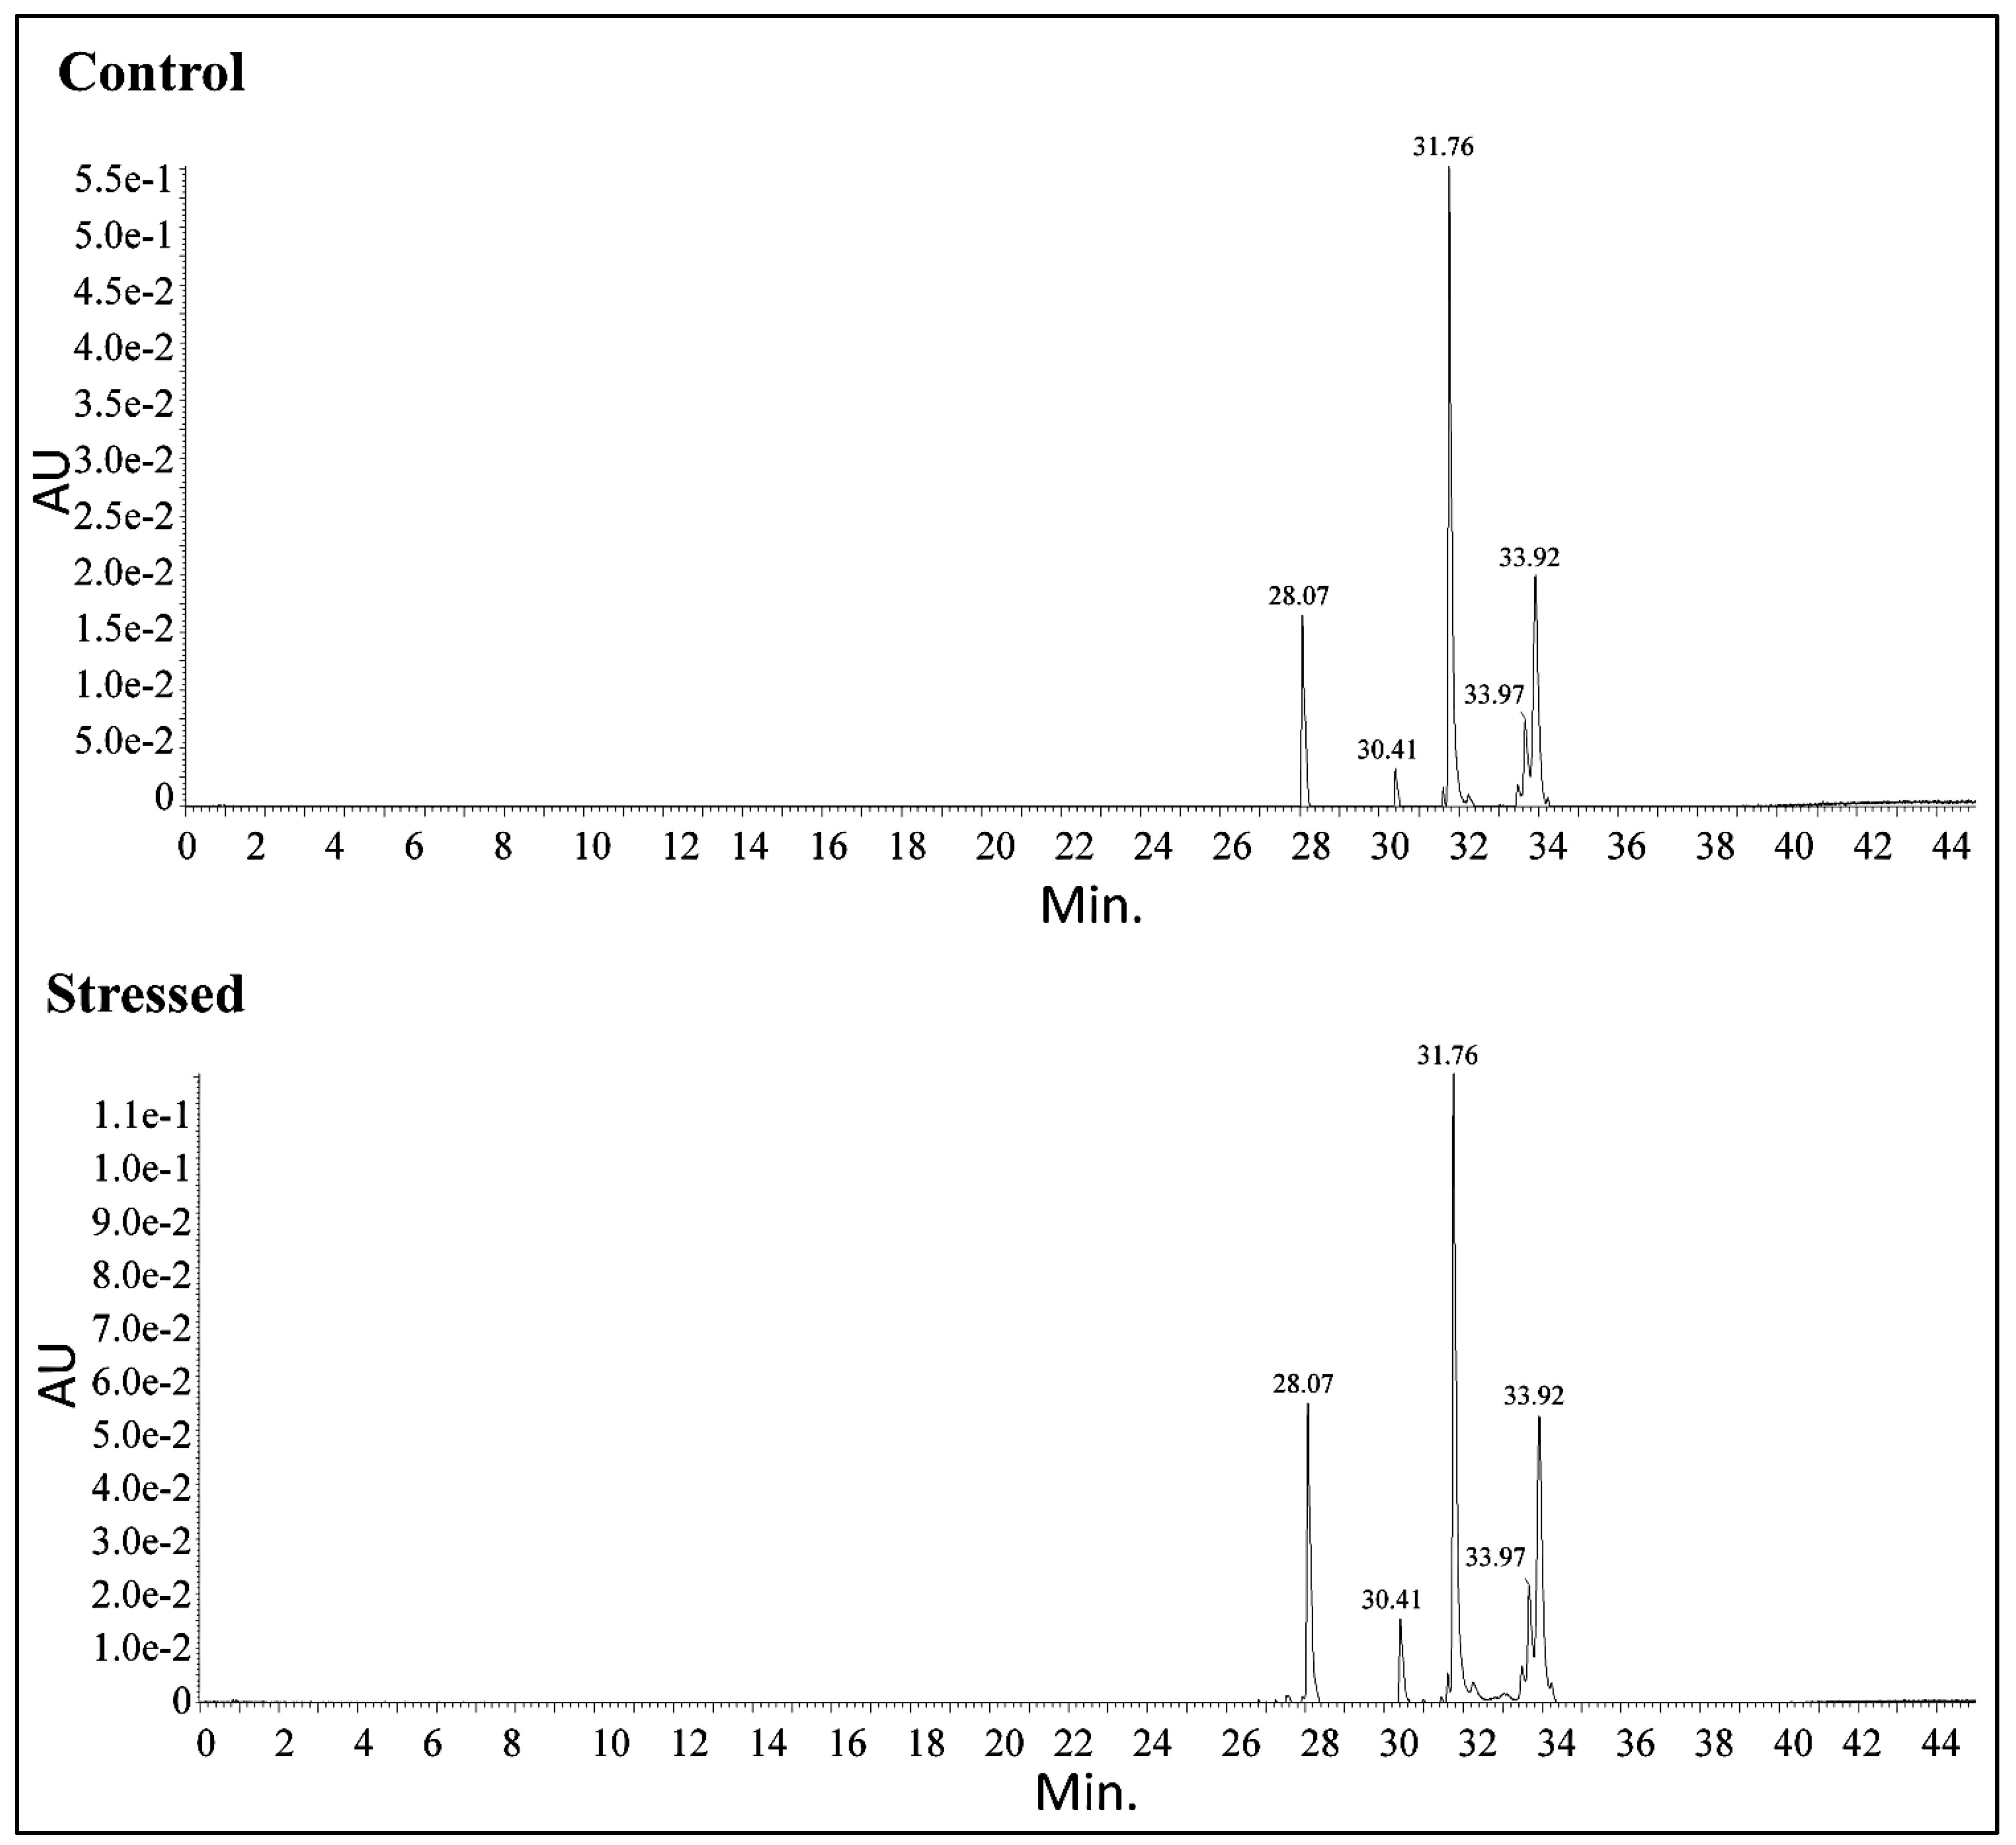
While astaxanthin and violaxanthin’s peak sizes have increased under stress conditions, it has been noted that the number of carotenoids acquired under control and stressful conditions are identical. Nonetheless, the lutein exhibits the longest peak in the resulting chromatogram. All carotenoids synthesized under optimal stress conditions are rising, although astaxanthin and violaxanthin display a substantial improvement of 1.19 and 1.34-fold, respectively. Although lutein declined by 1.32-fold under stress compared to control, all-cis- β carotene and β carotene additionally showed a modest rise of 1.07 and 1.08-fold, correspondingly. In a study conducted on T. striata CTP4 grown under intense heat and light duress, violaxanthin, beta carotene, and lutein concentrations were enhanced [38]. In addition to chlorophyll a and b, carotenoids such as carotene, violaxanthin, neoxanthin, and lutein are included in the Chlorophyceae [39]. A. quadricellulare PUMCC 5.1.1 yielded 47.0, 28.7, 15.5, and 14.0 μg β-carotene, lutein, astaxanthin, and canthaxanthin mg−1 dry biomass, respectively [40]. Lutein is a form of xanthophyll found in green microalgae such as S. almeriensis, Muriellopsis sp., and C. zofingiensis [41]. Numerous studies have revealed that astaxanthin is a valuable secondary carotenoid produced in abiotic/biotic stress situations [42]. Ankistrodesmus sp. convolutes grew in nitrogen and light stress were found to produce violaxanthin and astaxanthin, according to yet another investigation [43].
4. Conclusions
The outcomes of the optimization revealed that the production of lipids and carotenoids, which are crucial to the pharmaceutical and nutraceutical industries, becomes commercially conceivable in providing nutrition and illuminance stressors in combination. Many economically significant carotenoids, including astaxanthin, violaxanthin, lutein, cis-carotene, and beta-carotene, were isolated from MP. The optimum conditions to get maximal lipids and carotenoids from abiotic stress modulation were identified as 5000 mg L-1 N, 250 mg L-1 K:P, 70 mg L-1 S, 137.5 µmolm-2s-1 LI, and 24 h PP with a yield of 75.4 mg L-1d-1 biomass, lipid production of 542.8 mg L-1, and total carotenoid production of 16.25 µg mL-1. Modulation of numerous abiotic stress variables has a significant influence on carotenogenesis and lipogenesis in MP, yielding elevated amounts of carotenoids and lipids. Five distinct carotenoid compounds of commercial interest in the pharmaceutical and nutraceutical industries were detected employing UPLC-Q-TOF-MS. This research discloses that MP is a feasible option for commercial application in the food, feed, and healthcare industries due to its enormous ability to yield lipids and carotenoids in considerable amounts under optimal conditions.
Supplementary Materials
The following supporting information can be downloaded at the website of this paper posted on Preprints.org, Figure S1: 3-D surface and contour plots representing the interaction between the selected parameters on Chlorophyll a yield (µg ml-1), a) N with P+K, b) N with S, c) N with LI, d) N with PP, e) P+K with S, f) P+K with LI, g) P+K with PP, h) S with LI, i) S with PP, and j) LI with PP; Figure S2 3-D surface and contour plots representing the interaction between the selected parameters on Chlorophyll b yield (µg ml-1), a) N with P+K, b) N with S, c) N with LI, d) N with PP, e) P+K with S, f) P+K with LI, g) P+K with PP, h) S with LI, i) S with PP, and j) LI with PP; Table S1: Optimization of a combination of nutrients and light by RSM-CCD matrix for the analysis of Chlorophyll a and b.
Author Contributions
K.Y. is the first author and conducted all the experiments, recorded research observations, was responsible for data curation, analyzed the research data, and wrote the original draft. S.K. supervision, review, and editing of the draft. G.C.N. review and editing of the draft and funding acquisition. M.P.R. conceptualized this study, methodology, supervised and validation of the research work reviewed and edited the manuscript, resources, and funding acquisition. All authors have read and agreed to the published version of the manuscript.
Funding
Author MPR expresses her gratitude to Mission Innovation India Unit, Department of Biotechnology (MI-DBT), Ministry of Science & Technology, New Delhi (India) for financial support [file no.BT/PR31218/PBD/26/ 771/2019].
Institutional Review Board Statement
Not applicable.
Informed Consent Statement
Not applicable.
Data Availability Statement
Data are contained within the article.
Acknowledgments
The authors show their gratitude to the Amity Institute of Biotechnology for providing the necessary infrastructure and facilities for the research. The authors also acknowledge the Amity Institute of Microbial Technology for providing confocal microscopy. Authors show their gratitude to Panjab University, Chandigarh for providing UPLC-Q-TOF-MS facility.
Conflicts of Interest
The authors declare no conflict of interest.
References
- Kholany, M., Coutinho, J.A.P., Ventura, S.P.M. Carotenoid production from microalgae: The portuguese scenario. Mol. 2022, 27, 2540. [CrossRef]
- Cezare-Gomes, E. A., del Carmen Mejia-da-Silva, L., Pérez-Mora, L. S., Matsudo, M. C., Ferreira-Camargo, L. S., Singh, A. K., & de Carvalho, J. C. M. Potential of Microalgae Carotenoids for Industrial Application. Appl. Biochem. Biotechnol., 2019, 188, 602–634.
- Patil AD, Kasabe PJ, Dandge PB. Pharmaceutical and nutraceutical potential of natural bioactive pigment: Astaxanthin. Nat. prod. bioprospect. 2022, 12, 25.
- GRAS; www.fda.gov.
- Di Lena, G., Casini, I., Lucarini, M., & Lombardi-Boccia, G. Carotenoid profiling of five microalgae species from large-scale production. Food res. Int. 2019, 120, 810–818. [CrossRef]
- Kumar M, Sun Y, Rathour R, Pandey A, Thakur IS, Tsang DC. Algae as potential feedstock for the production of biofuels and value-added products: Opportunities and challenges. Sci. Total Environ. 2020, 716, 137116. [CrossRef] [PubMed]
- Tripathi S, Kairamkonda M, Gupta P, Poluri KM. Dissecting the molecular mechanisms of producing biofuel and value-added products by cadmium tolerant microalgae as sustainable biorefinery approach. J Chem. Eng. 2023, 454, 140068. [CrossRef]
- Riyazat Khadim S, Mohanta A, Singh P, Maurya P, Kumar Singh A, Kumar Singh A, Asthana RK. A Study on Dunaliella salina Under Selected Nutrient Manipulation with Reference to the Biomass, Lipid Content Along with Expression of ACCase and RuBisCO Genes. BioEnergy Res. 2022, 16, 1–6.
- Guardini Z, Dall’Osto L, Barera S, Jaberi M, Cazzaniga S, Vitulo N, Bassi R. High carotenoid mutants of Chlorella vulgaris show enhanced biomass yield under high irradiance. Plants. Plants 2021, 10, 911. [CrossRef]
- Mehariya S, Plöhn M, Leon-Vaz A, Patel A, Funk C. Improving the content of high value compounds in Nordic Desmodesmus microalgal strains. Biores. Technol. 2022, 359, 127445. [CrossRef]
- Hawkesford MJ, Cakmak I, Coskun D, De Kok LJ, Lambers H, Schjoerring JK, White PJ. Functions of macronutrients. In Marschner’s Mineral Nutrition of Plants. AP. 2023, 201, 281. [CrossRef]
- Liu T, Chen Z, Xiao Y, Yuan M, Zhou C, Liu G, Fang J, Yang B. Biochemical and morphological changes triggered by nitrogen stress in the oleaginous microalga Chlorella vulgaris. Microrg. 2022, 10, 566. [CrossRef]
- Zheng H, Wang Y, Li S, Nagarajan D, Varjani S, Lee DJ, Chang JS. Recent advances in lutein production from microalgae. Renew. Sustain. Energy Rev. 2022, 153, 111795. [CrossRef]
- Said Z, Nguyen TH, Sharma P, Li C, Ali HM, Ahmed SF, Van DN, Truong TH. Multi-attribute optimization of sustainable aviation fuel production-process from microalgae source. Fuel. 2022, 324, 124759. [CrossRef]
- Morales M, Aflalo C, Bernard O. Microalgal lipids: A review of lipids potential and quantification for 95 phytoplankton species. Biomass Bioenerg. 2021, 150, 106108. [CrossRef]
- Garcia-Caparros P, De Filippis L, Gul A, Hasanuzzaman M, Ozturk M, Altay V, Lao MT. Oxidative stress and antioxidant metabolism under adverse environmental conditions: A review. Bot. Rev 2021, 87, 421–466. [CrossRef]
- Bligh EG, Dyer WJ. A rapid method of total lipid extraction and purification. J. Biochem. Physiol. 1959, 37, 911–917. [CrossRef]
- Lowry OH, Rosebrough NJ, Farr AL, Randall RJ. Protein measurement with the Folin phenol reagent. JBC. 1951, 193, 265–275. [CrossRef]
- Miao XS, Bishay F, Chen M, Metcalfe CD. Occurrence of antimicrobials in the final effluents of wastewater treatment plants in Canada. ESTHAG 2004, 38, 3533–3541. [CrossRef]
- Khanra A, Vasistha S, Kumar S, Rai MP. Cultivation of microalgae on unhydrolysed waste molasses syrup using mass cultivation strategy for improved biodiesel. 3 Biotech. 2021, 11, 1–4.
- Zhang Q, Qu Q, Lu T, Ke M, Zhu Y, Zhang M, Zhang Z, Du B, Pan X, Sun L, Qian H. The combined toxicity effect of nanoplastics and glyphosate on Microcystis aeruginosa growth. Environ. Pollut. 2018, 243, 1106–1112. [CrossRef]
- Janchot K, Rauytanapanit M, Honda M, Hibino T, Sirisattha S, Praneenararat T, Kageyama H, Waditee-Sirisattha R. Effects of potassium chloride-induced stress on the carotenoids canthaxanthin, astaxanthin, and lipid accumulations in the green Chlorococcal microalga strain TISTR 9500. J. Eukaryot. Microbiol 2019, 66, 778–787. [CrossRef]
- Baskar, V., Safia, N., Sree Preethy, K., Dhivya, S., Thiruvengadam, M., & Sathishkumar, R. A comparative study of phytotoxic effects of metal oxide (CuO, ZnO and NiO) nanoparticles on in-vitro grown Abelmoschus esculentus. Plant Biosyst. 2021, 155, 374–383. [CrossRef]
- Li, X., Sun, H., Mao, X., Lao, Y., & Chen, F. Enhanced photosynthesis of carotenoids in microalgae driven by light-harvesting gold nanoparticles. ACS Sustain.Chem. Eng. 2020, 8, 7600–7608. [CrossRef]
- Agarwal, A., Singh, A., Banerjee, B. D., Rai, M. P., & Mukherjee, M. Exotic Hydrogel Matrix as an Efficient Platform for Sustainable Production of Biomass and Lipid from Chlorella Sorokiniana. ACS Applied Bio Mater. 2021, 4, 6304–6315. [CrossRef]
- Krienitz L, Bock C. Present state of the systematics of planktonic coccoid green algae of inland waters. Hydrobiologia. 2012, 698, 295–326. [CrossRef]
- Lakatos GE, Ranglová K, Bárcenas-Pérez D, Grivalský T, Manoel JC, Mylenko M, Cheel J, Nyári J, Wirth R, Kovács KL, Kopecký J. Cold-adapted culturing of the microalga Monoraphidium sp. in thin-layer raceway pond for biomass production. Algal Res. 2023, 69, 102926. [CrossRef]
- Kolackova M, Janova A, Dobesova M, Zvalova M, Chaloupsky P, Krystofova O, Adam V, Huska D. Role of secondary metabolites in distressed microalgae. Environmen. Res. 2023, 4, 115392. [CrossRef]
- Pick U, Zarka A, Boussiba S, Davidi L. A hypothesis about the origin of carotenoid lipid droplets in the green algae Dunaliella and Haematococcus. Planta. 2019, 249, 31–47. [CrossRef]
- Kaha, M., Iwamoto, K., Yahya, N. A., Suhaimi, N., Sugiura, N., Hara, H & Suzuki, K. (2021). Enhancement of astaxanthin accumulation using black light in Coelastrum and Monoraphidium isolated from Malaysia. Sci. rep. 2021, 11, 1–9.
- Tang C, Gao X, Hu D, Dai D, Qv M, Liu D, Zhu L. Nutrient removal and lipid production by the co-cultivation of Chlorella vulgaris and Scenedesmus dimorphus in landfill leachate diluted with recycled harvesting water. Biores. Technol. 2023, 369, 128496. [CrossRef]
- Duan X, Xie C, Hill DR, Barrow CJ, Dunshea FR, Martin GJ, Suleria HA. Bioaccessibility, Bioavailability and Bioactivities of Carotenoids in Microalgae: A Review. Food Rev. Int. 2023 Jan 14:1-30.
- Kaur M, Saini KC, Ojah H, Sahoo R, Gupta K, Kumar A, Bast F. Abiotic stress in algae: Response, signaling and transgenic approaches. J. Appl. Phycol. 2022, 34, 1843–1869. [CrossRef]
- Zhao, P., Lin, Z., Wang, Y., Chai, H., Li, Y., He, L., & Zhou, J. Facilitating effects of plant hormones on biomass production and nutrients removal by Tetraselmis cordiformis for advanced sewage treatment and its mechanism. Sci. Total Environ. 2019, 693, 133650. [CrossRef]
- Kou, Y., Liu, M., Sun, P., Dong, Z., & Liu, J. High light boosts salinity stress-induced biosynthesis of astaxanthin and lipids in the green alga Chromochloris zofingiensis. Algal Res. 2020, 50, 101976. [CrossRef]
- Gonçalves, V. D., Fagundes-Klen, M. R., Trigueros, D. E. G., Schuelter, A. R., Kroumov, A. D., & Módenes, A. N. Combination of Light Emitting Diodes (LEDs) for photostimulation of carotenoids and chlorophylls synthesis in Tetradesmus sp. Algal Res. 2019, 43, 101649. [CrossRef]
- Sun, X. M., Ren, L. J., Zhao, Q. Y., Ji, X. J., & Huang, H. Microalgae for the production of lipid and carotenoids: A review with focus on stress regulation and adaptation. Biotechnol. Biofuels 2018, 11, 1–16.
- Schüler LM, Bombo G, Duarte P, Santos TF, Maia IB, Pinheiro F, Marques J, Jacinto R, Schulze PS, Pereira H, Barreira L. Carotenoid biosynthetic gene expression, pigment and n-3 fatty acid contents in carotenoid-rich Tetraselmis striata CTP4 strains under heat stress combined with high light. Biores. Technol. 2021, 337, 125385. [CrossRef]
- Takaichi, S. Carotenoids in algae: Distributions, biosyntheses and functions. Mar. drug. 2011, 9, 1101–1118. [Google Scholar] [CrossRef] [PubMed]
- Singh DP, Khattar JS, Rajput A, Chaudhary R, Singh R. High production of carotenoids by the green microalga Asterarcys quadricellulare PUMCC 5.1. 1 under optimized culture conditions. PLoS ONE 2019, 14, e0221930. [CrossRef]
- Saha SK, Ermis H, Murray P. Marine microalgae for potential lutein production. Appl. Sci. 2020, 10, 6457. [CrossRef]
- Bouzroud S, El Maaiden E, Sobeh M, Merghoub N, Boukcim H, Kouisni L, El Kharrassi Y. Biotechnological Approaches to Producing Natural Antioxidants: Anti-Ageing and Skin Longevity Prospects. Int. J. Mol. Sci. 2023, 24, 1397. [CrossRef]
- ŞENER N, Demirel Z, İMAMOĞLU E, DALAY M. Optimization of culture conditions for total carotenoid amount using response surface methodology in green microalgae/Ankistrodesmus convolutus. Aquat. Sci. Eng. 2022, 37, 29–37. [CrossRef]
Figure 1.
Photomicrograph of MP (Scale bar: 10μm) derived from morphological attributes.
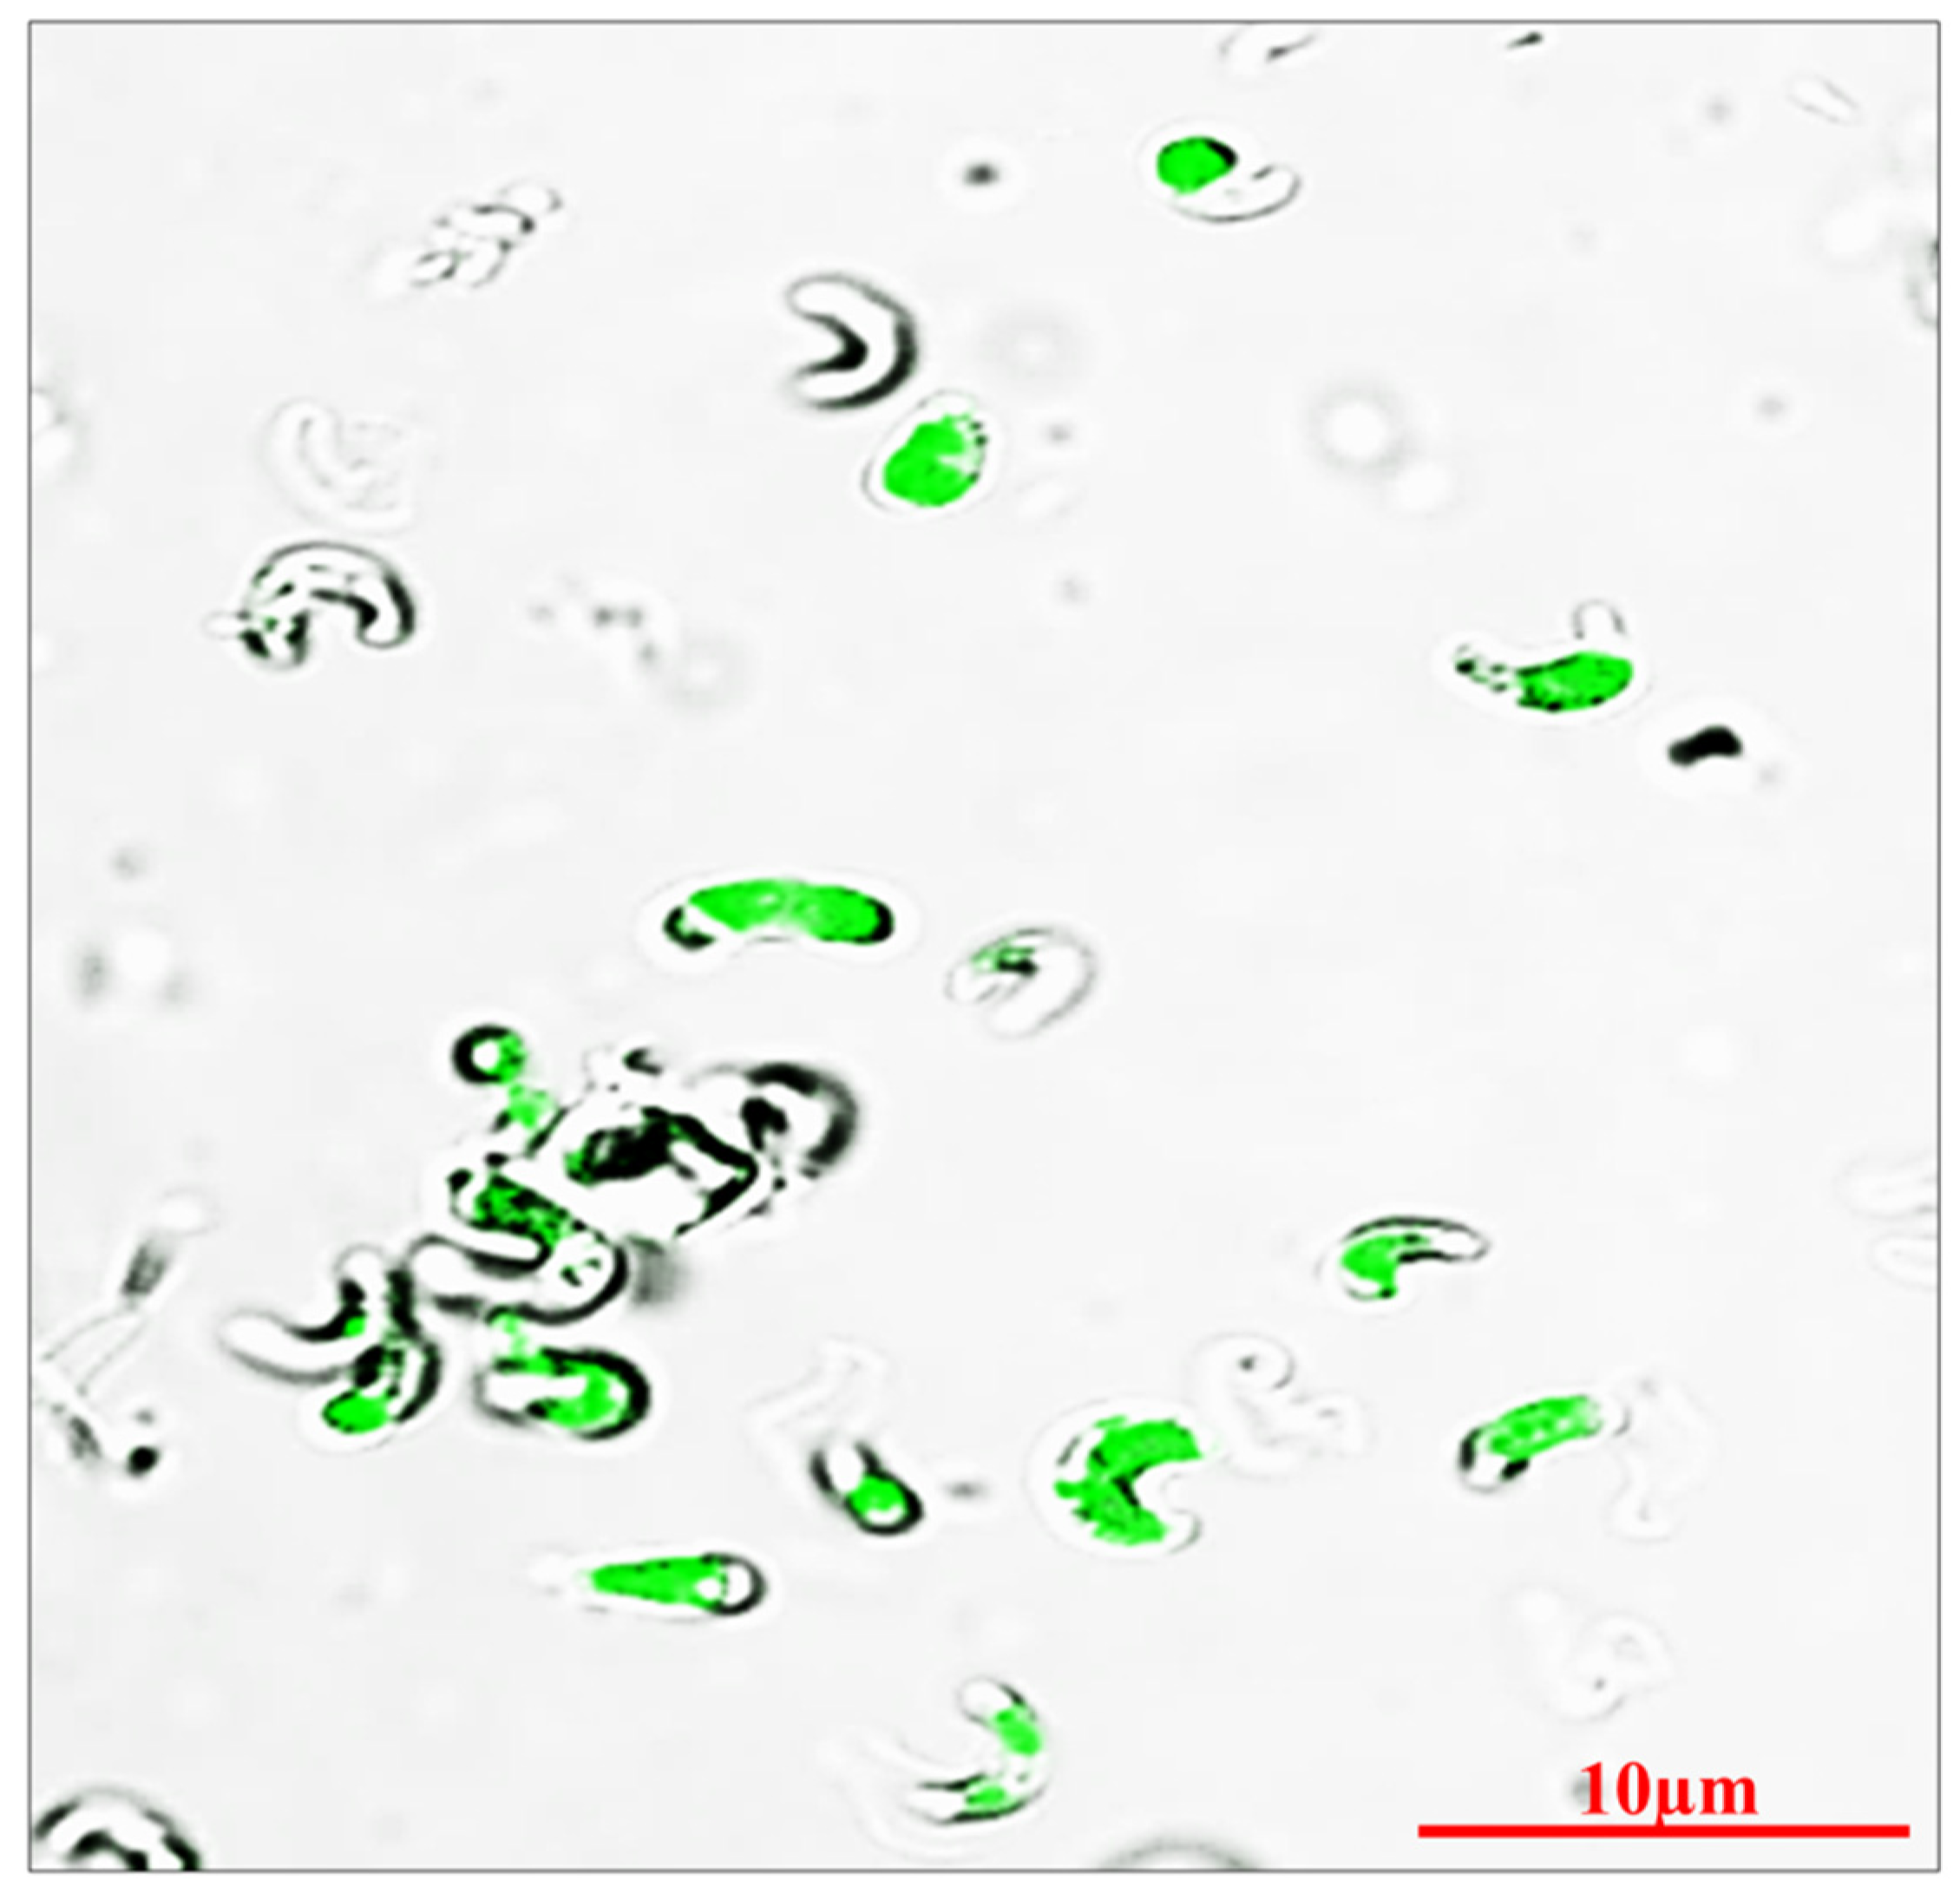
Figure 2.
Illustration of biochemical analysis of MP.
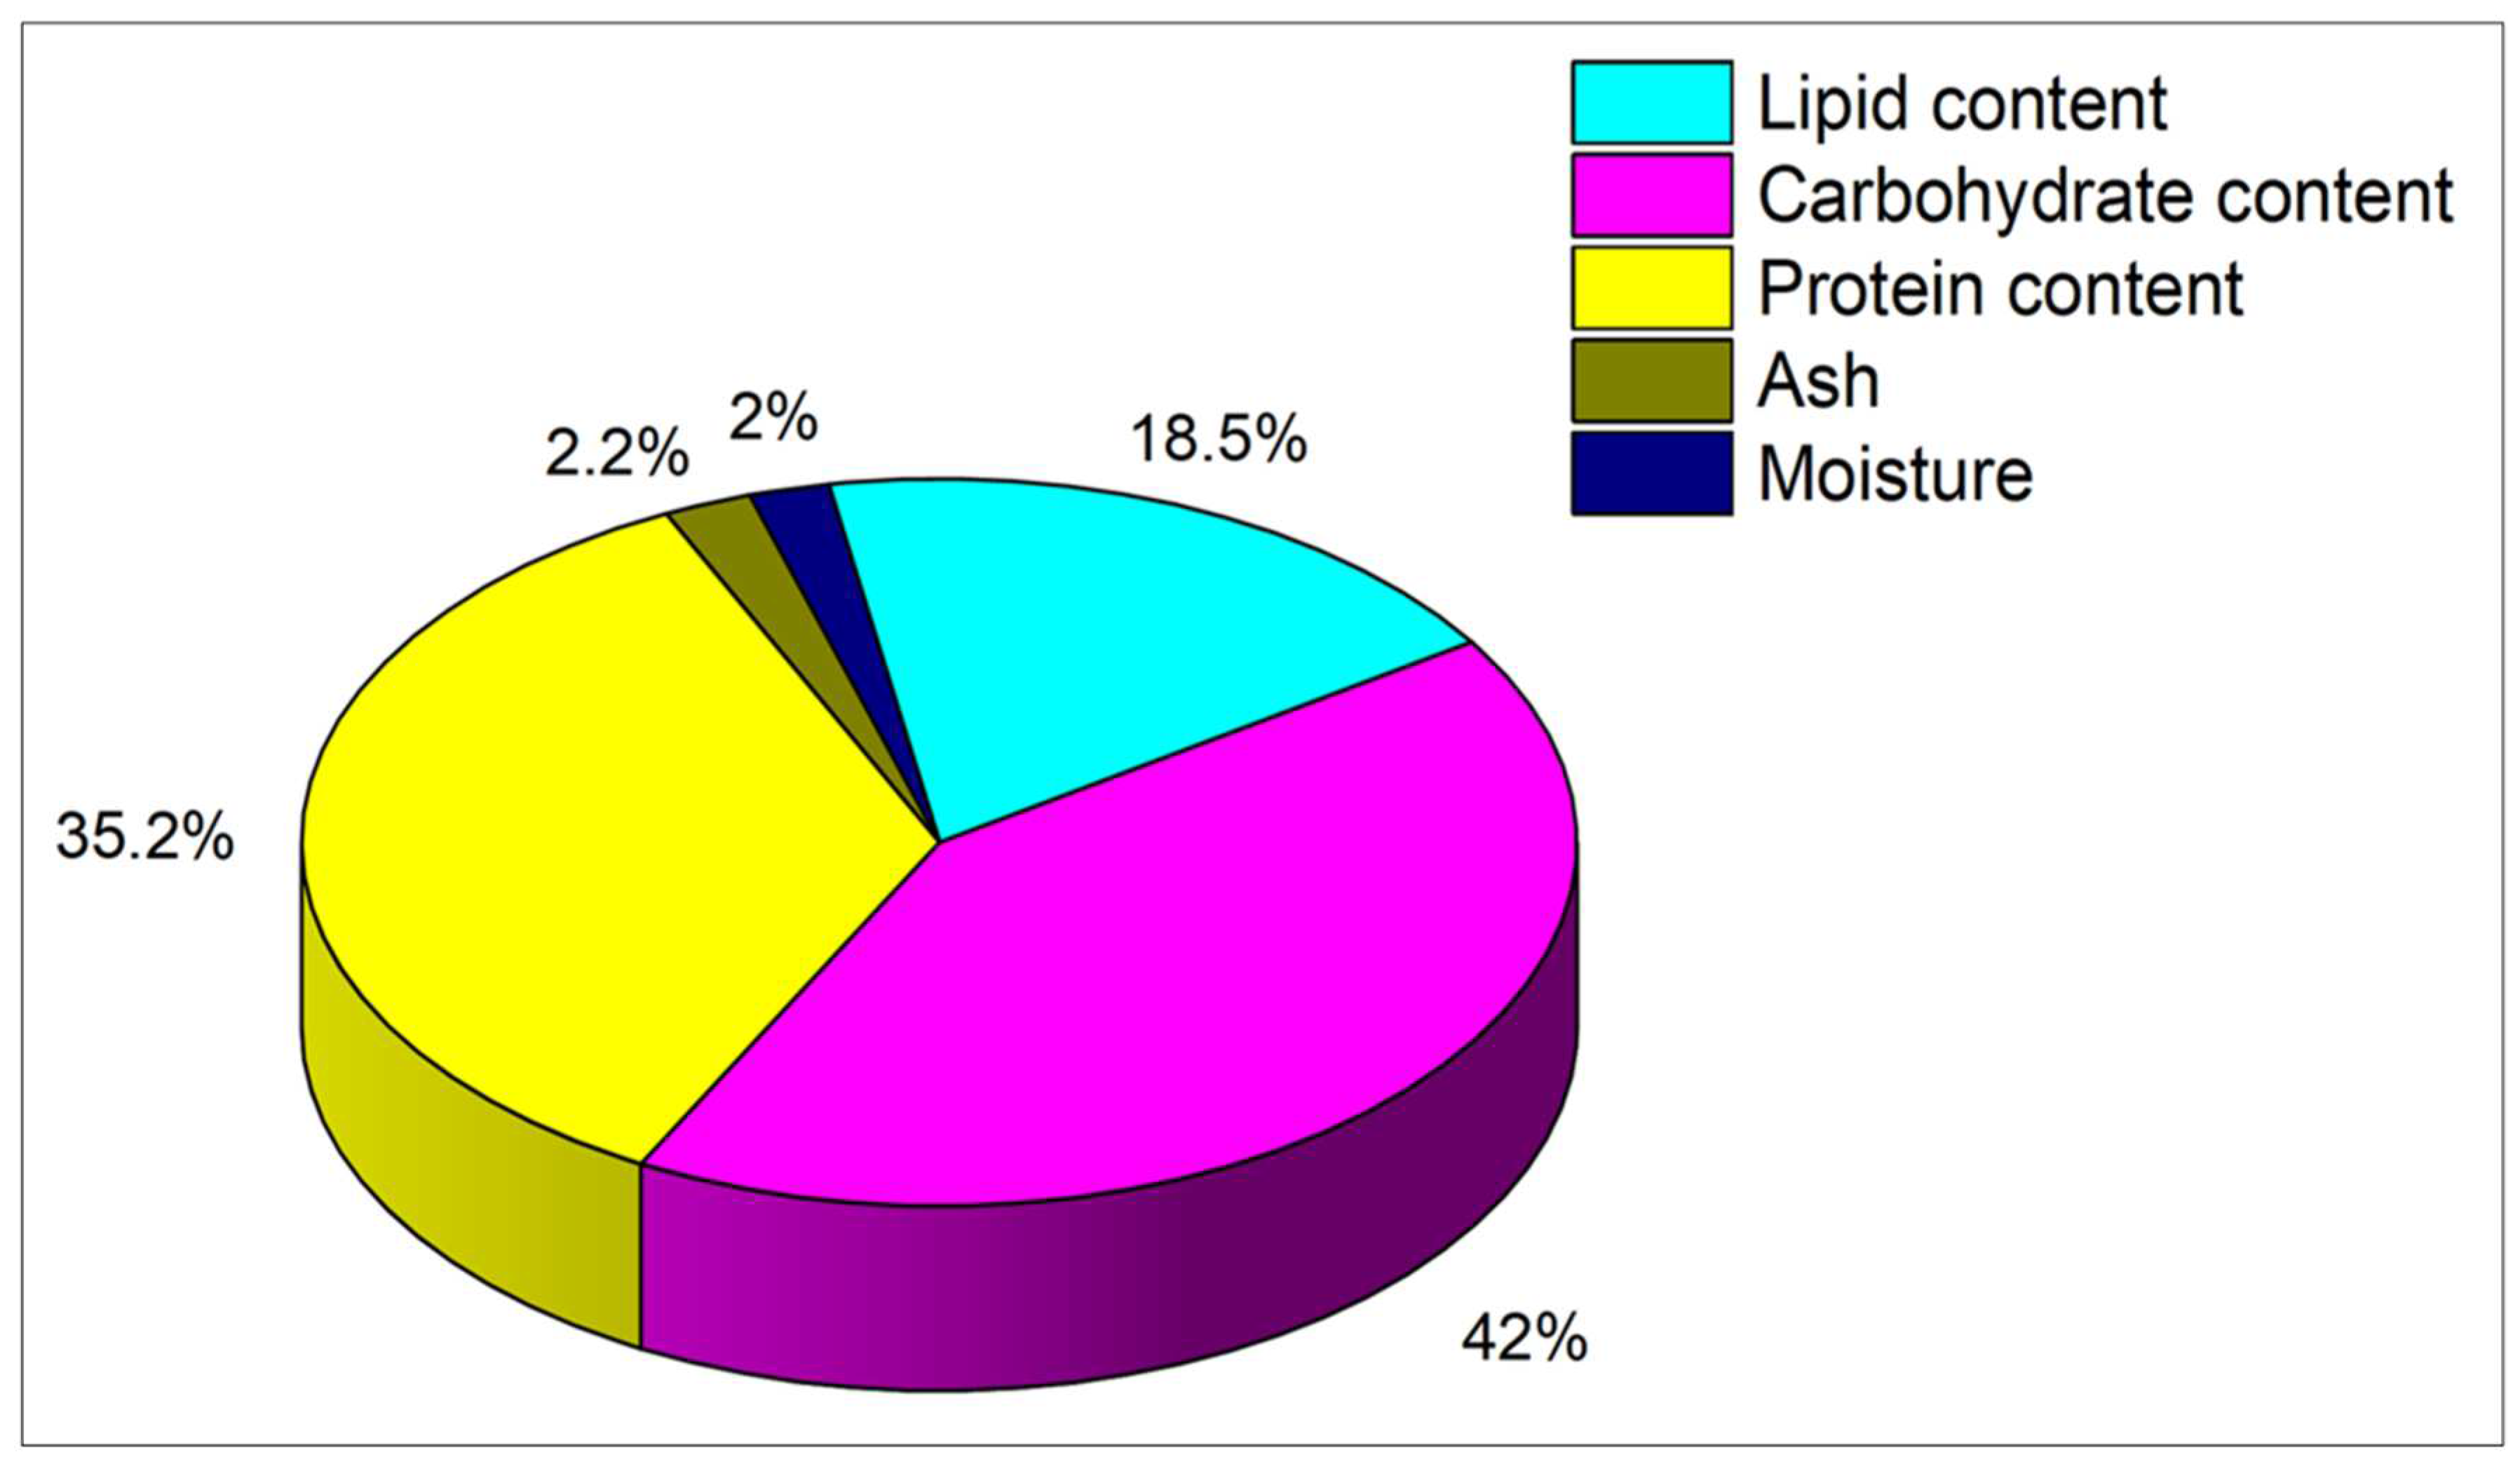
Figure 3.
3-D surface and contour plots representing the interaction between the selected parameters on biomass yields in mg L-1d-1, a) N with P+K, b) N with S, c) N with LI, d) N with PP, e) P+K with S, f) P+K with LI, g) P+K with PP, h) S with LI, i) S with PP, and j) LI with PP.
Figure 3.
3-D surface and contour plots representing the interaction between the selected parameters on biomass yields in mg L-1d-1, a) N with P+K, b) N with S, c) N with LI, d) N with PP, e) P+K with S, f) P+K with LI, g) P+K with PP, h) S with LI, i) S with PP, and j) LI with PP.
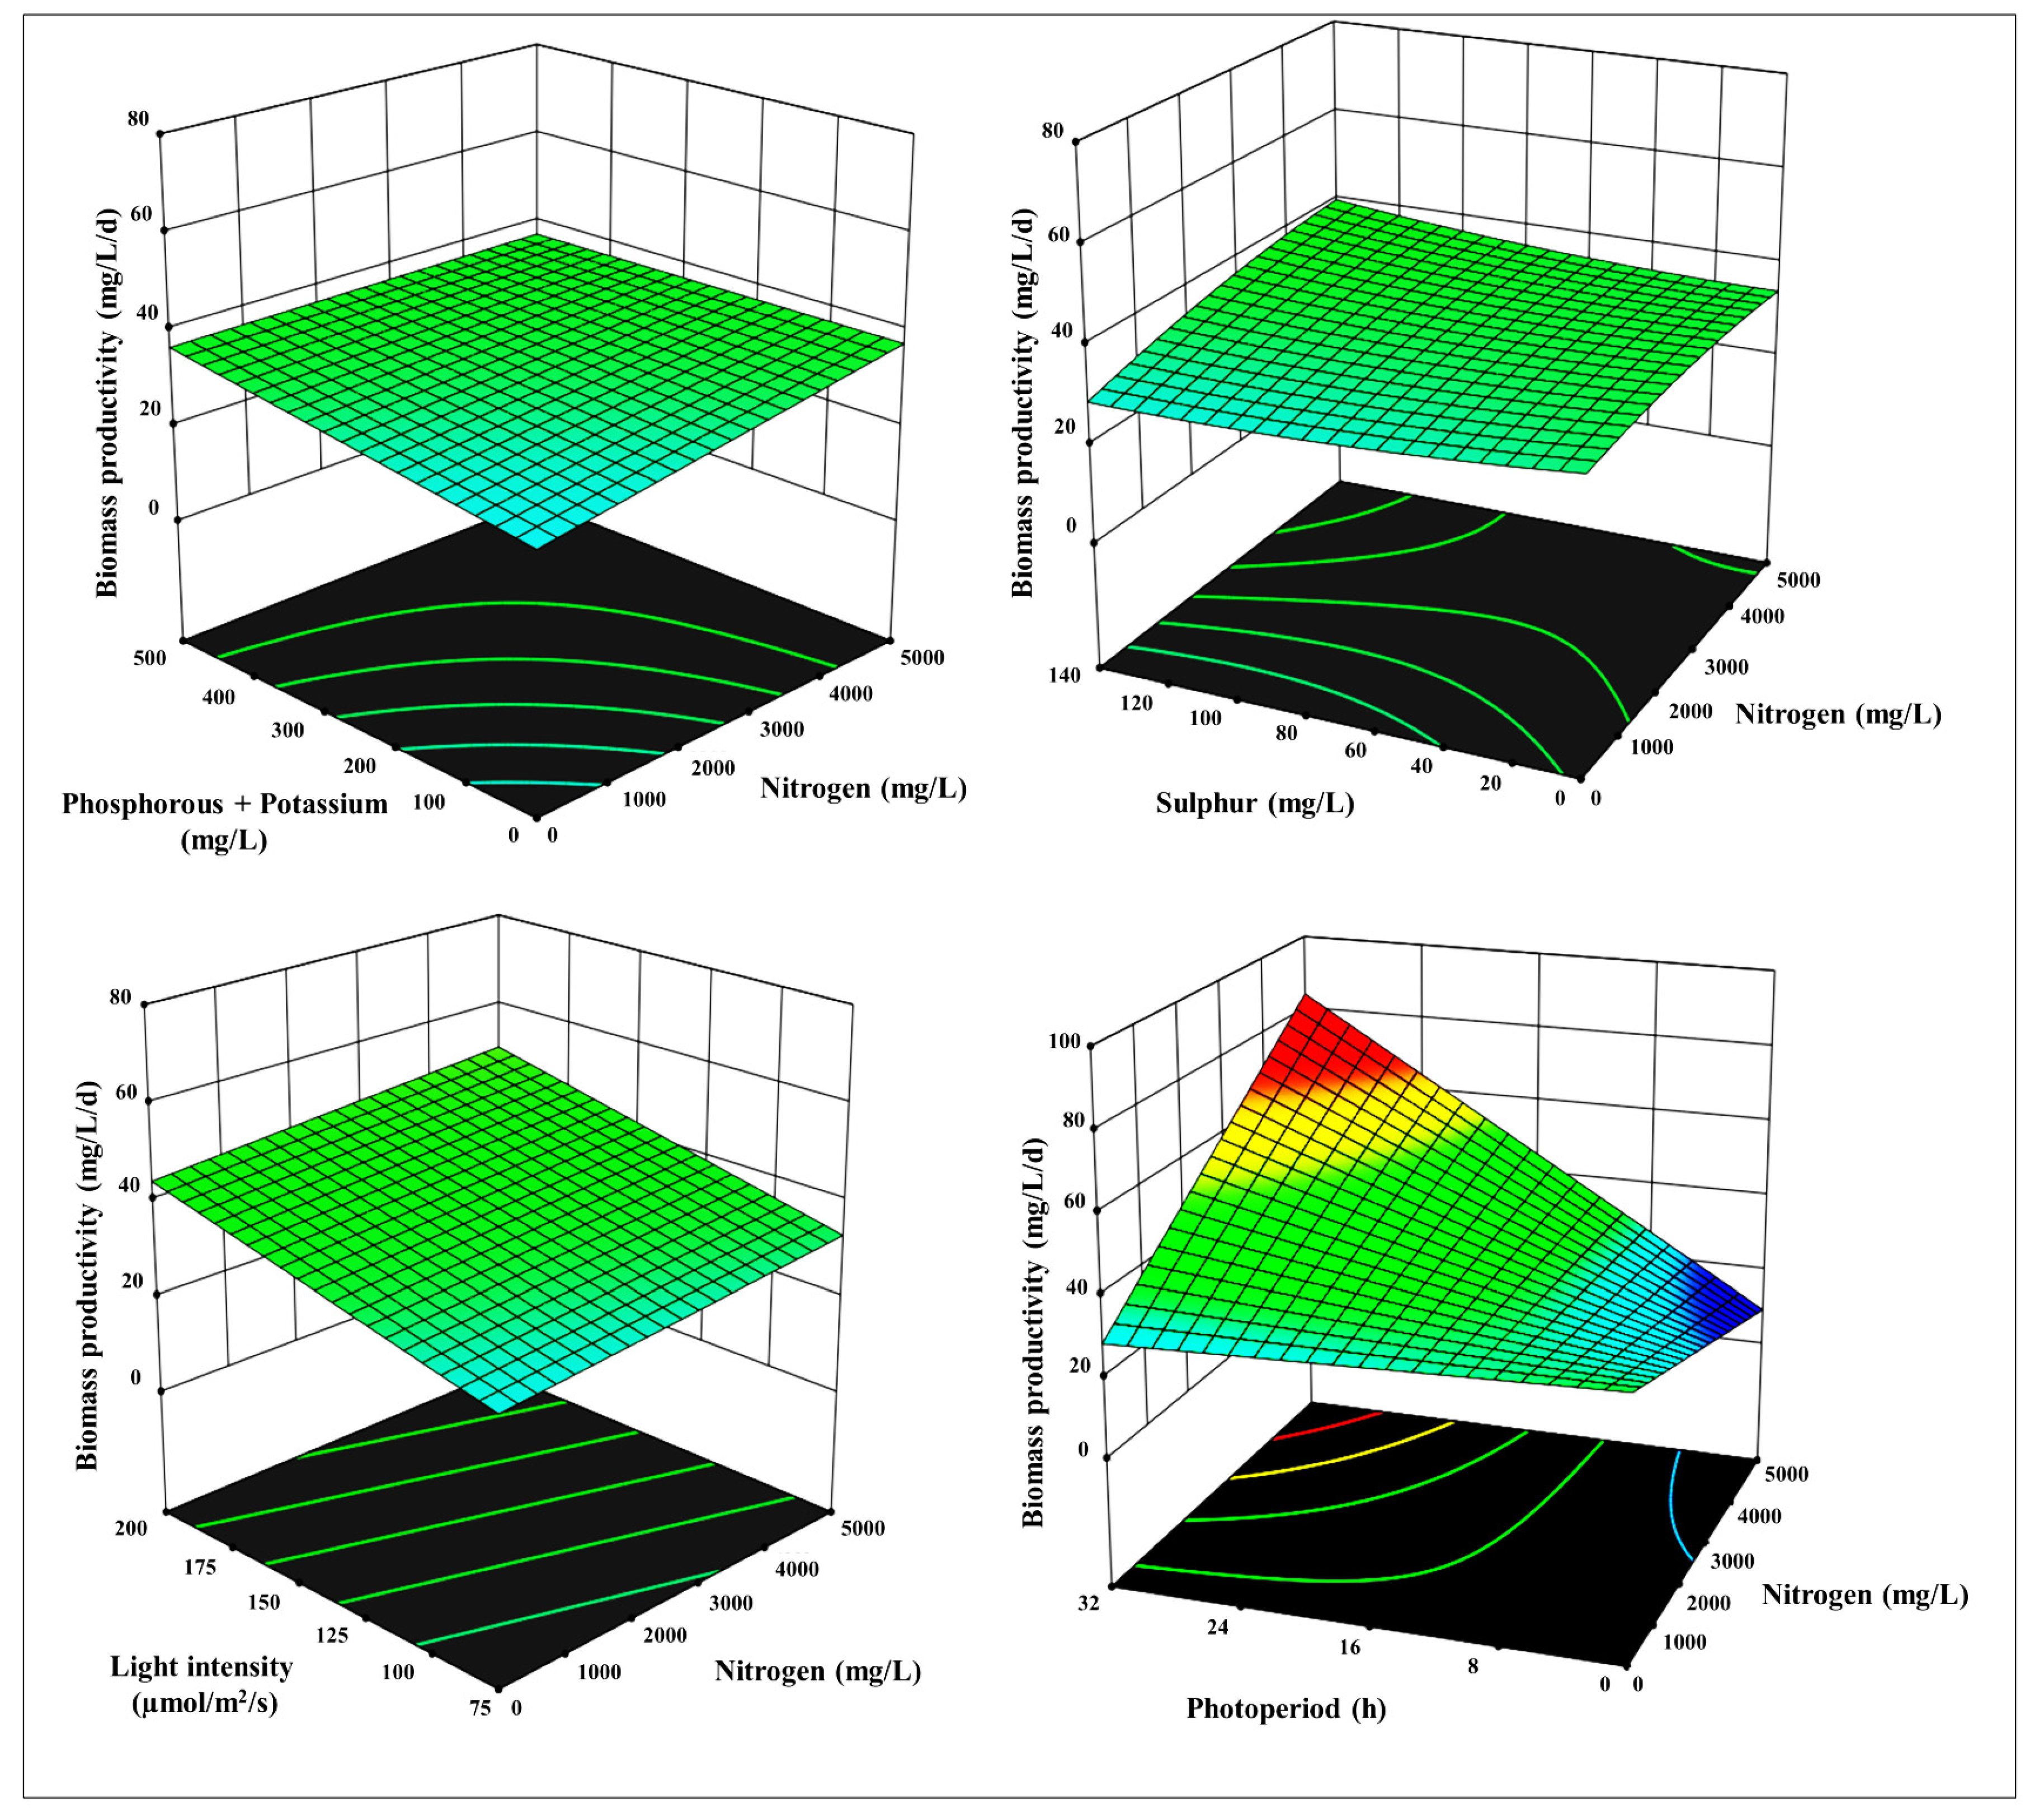
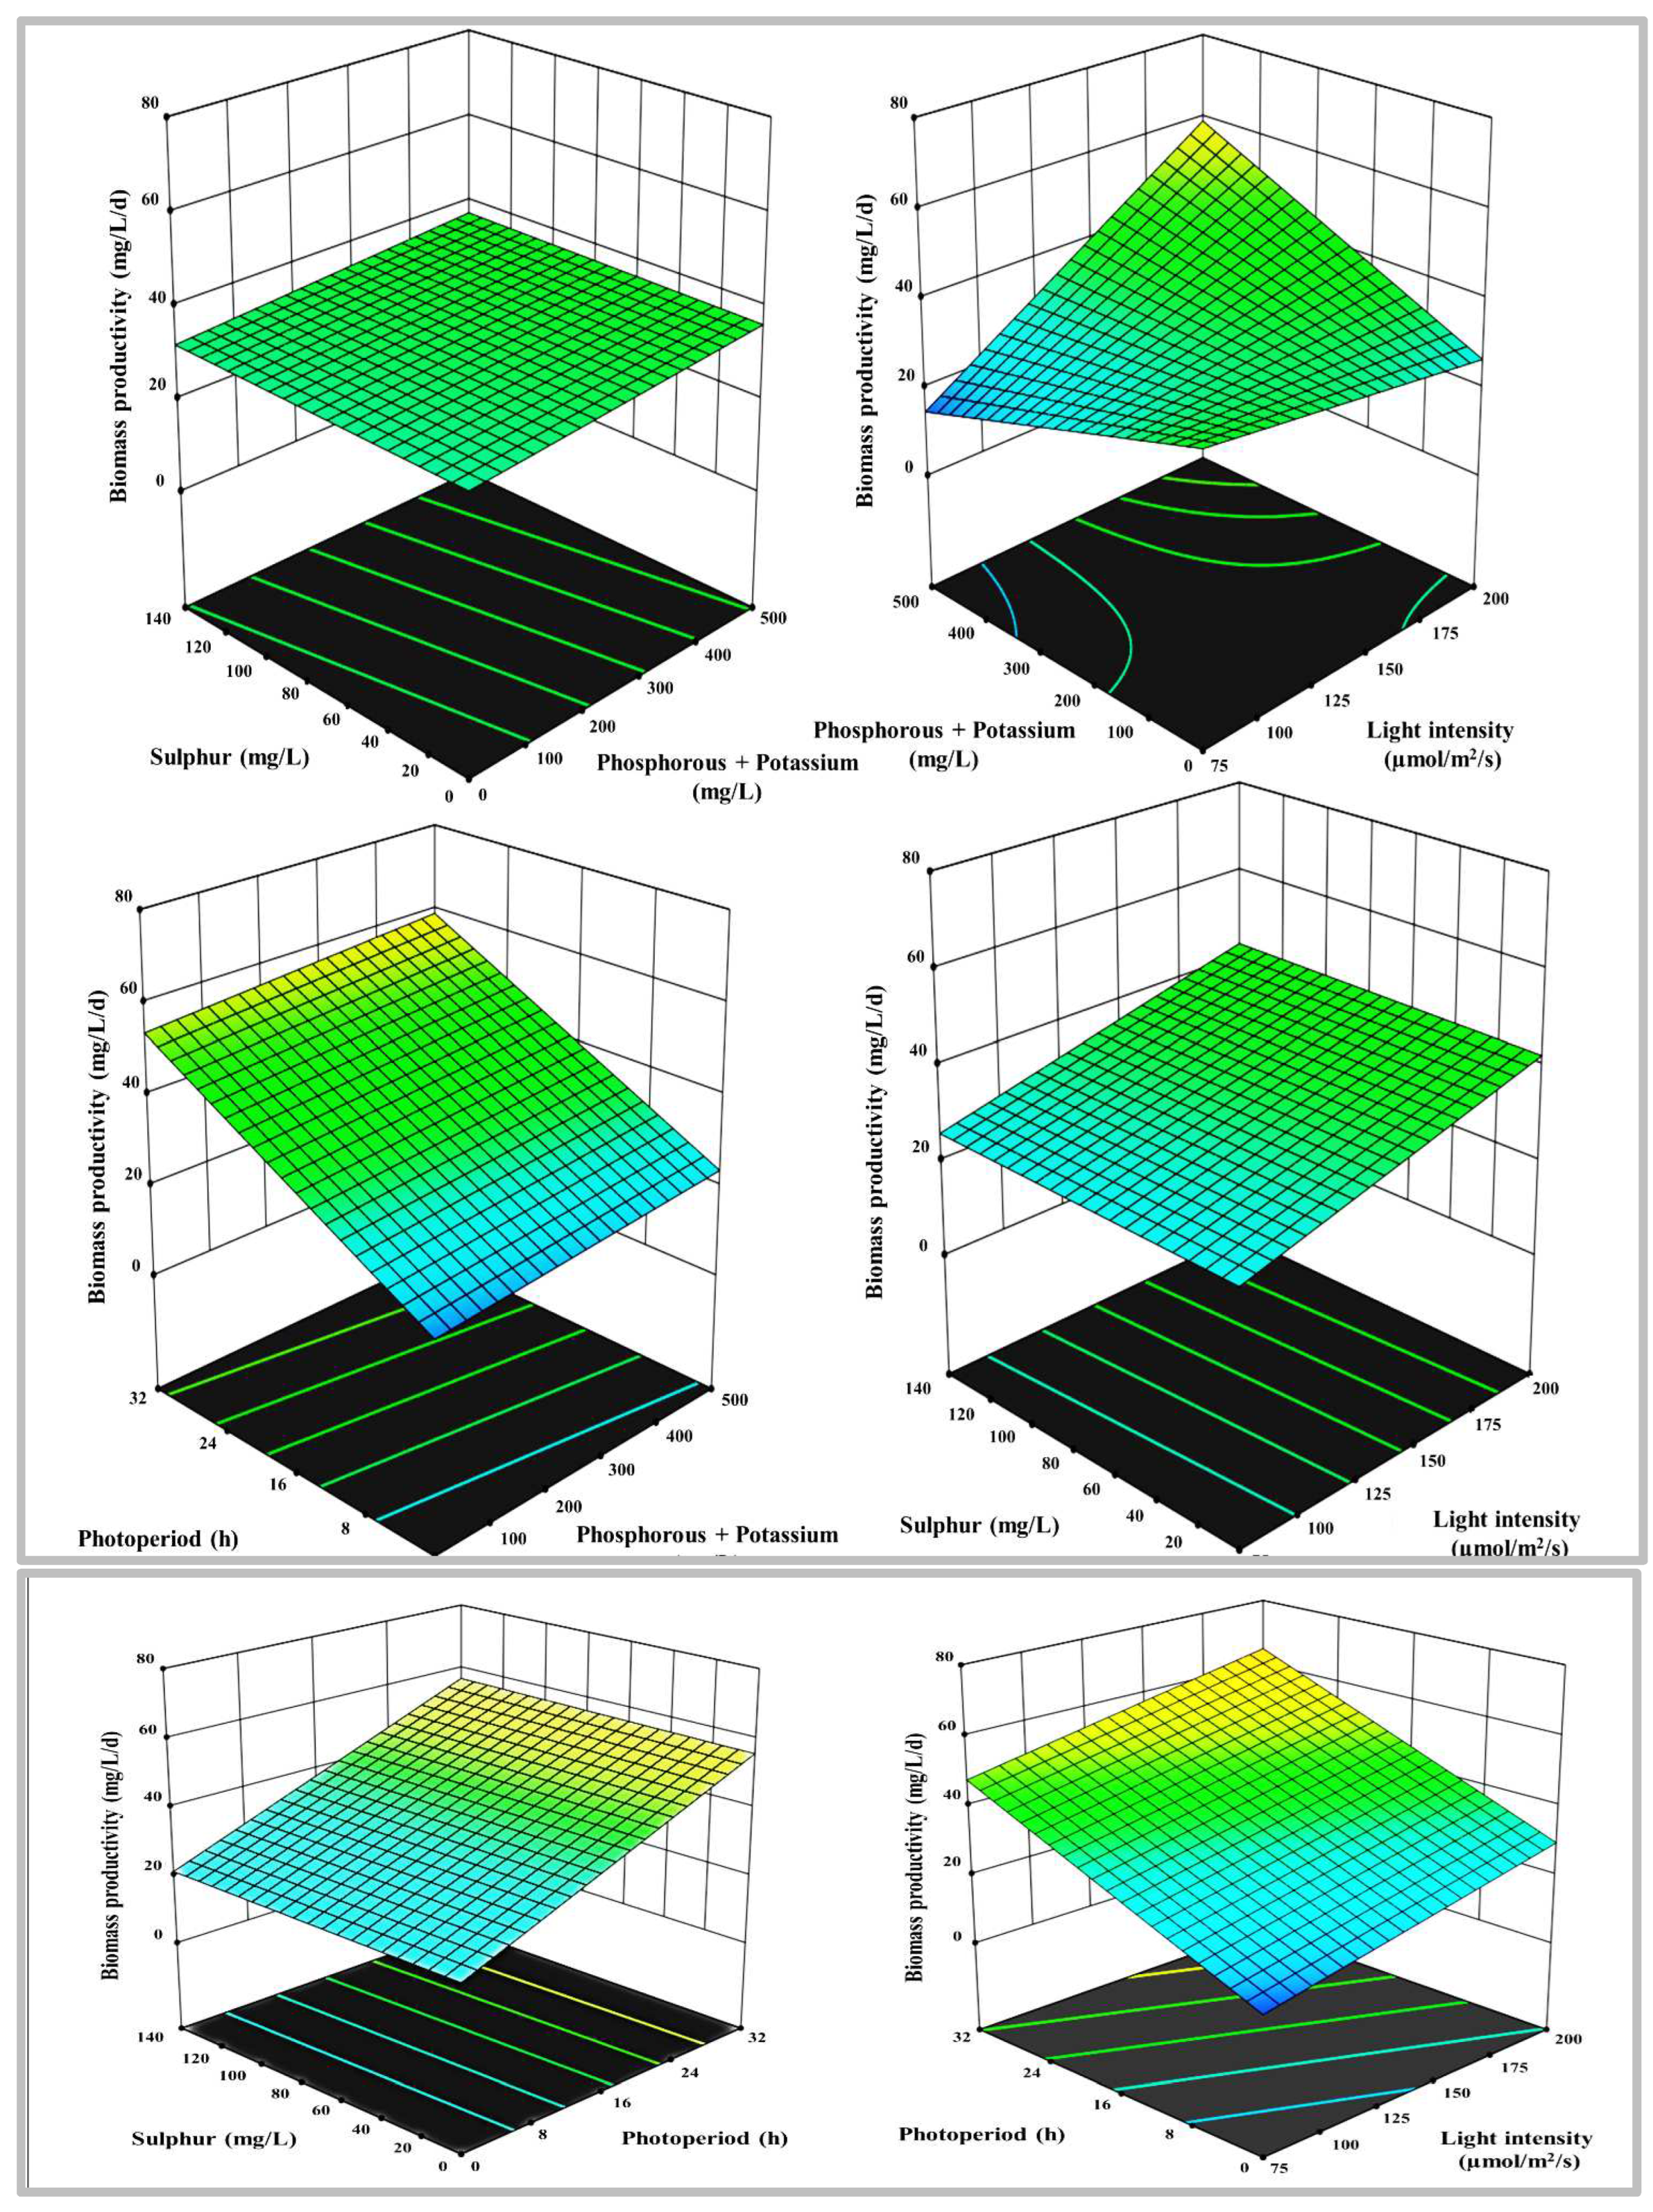
Figure 4.
3-D surface and contour plots representing the interaction between the selected parameters on lipid content in %, a) N with P+K, b) N with S, c) N with LI, d) N with PP, e) P+K with S, f) P+K with LI, g) P+K with PP, h) S with LI, i) S with PP, and j) LI with PP.
Figure 4.
3-D surface and contour plots representing the interaction between the selected parameters on lipid content in %, a) N with P+K, b) N with S, c) N with LI, d) N with PP, e) P+K with S, f) P+K with LI, g) P+K with PP, h) S with LI, i) S with PP, and j) LI with PP.
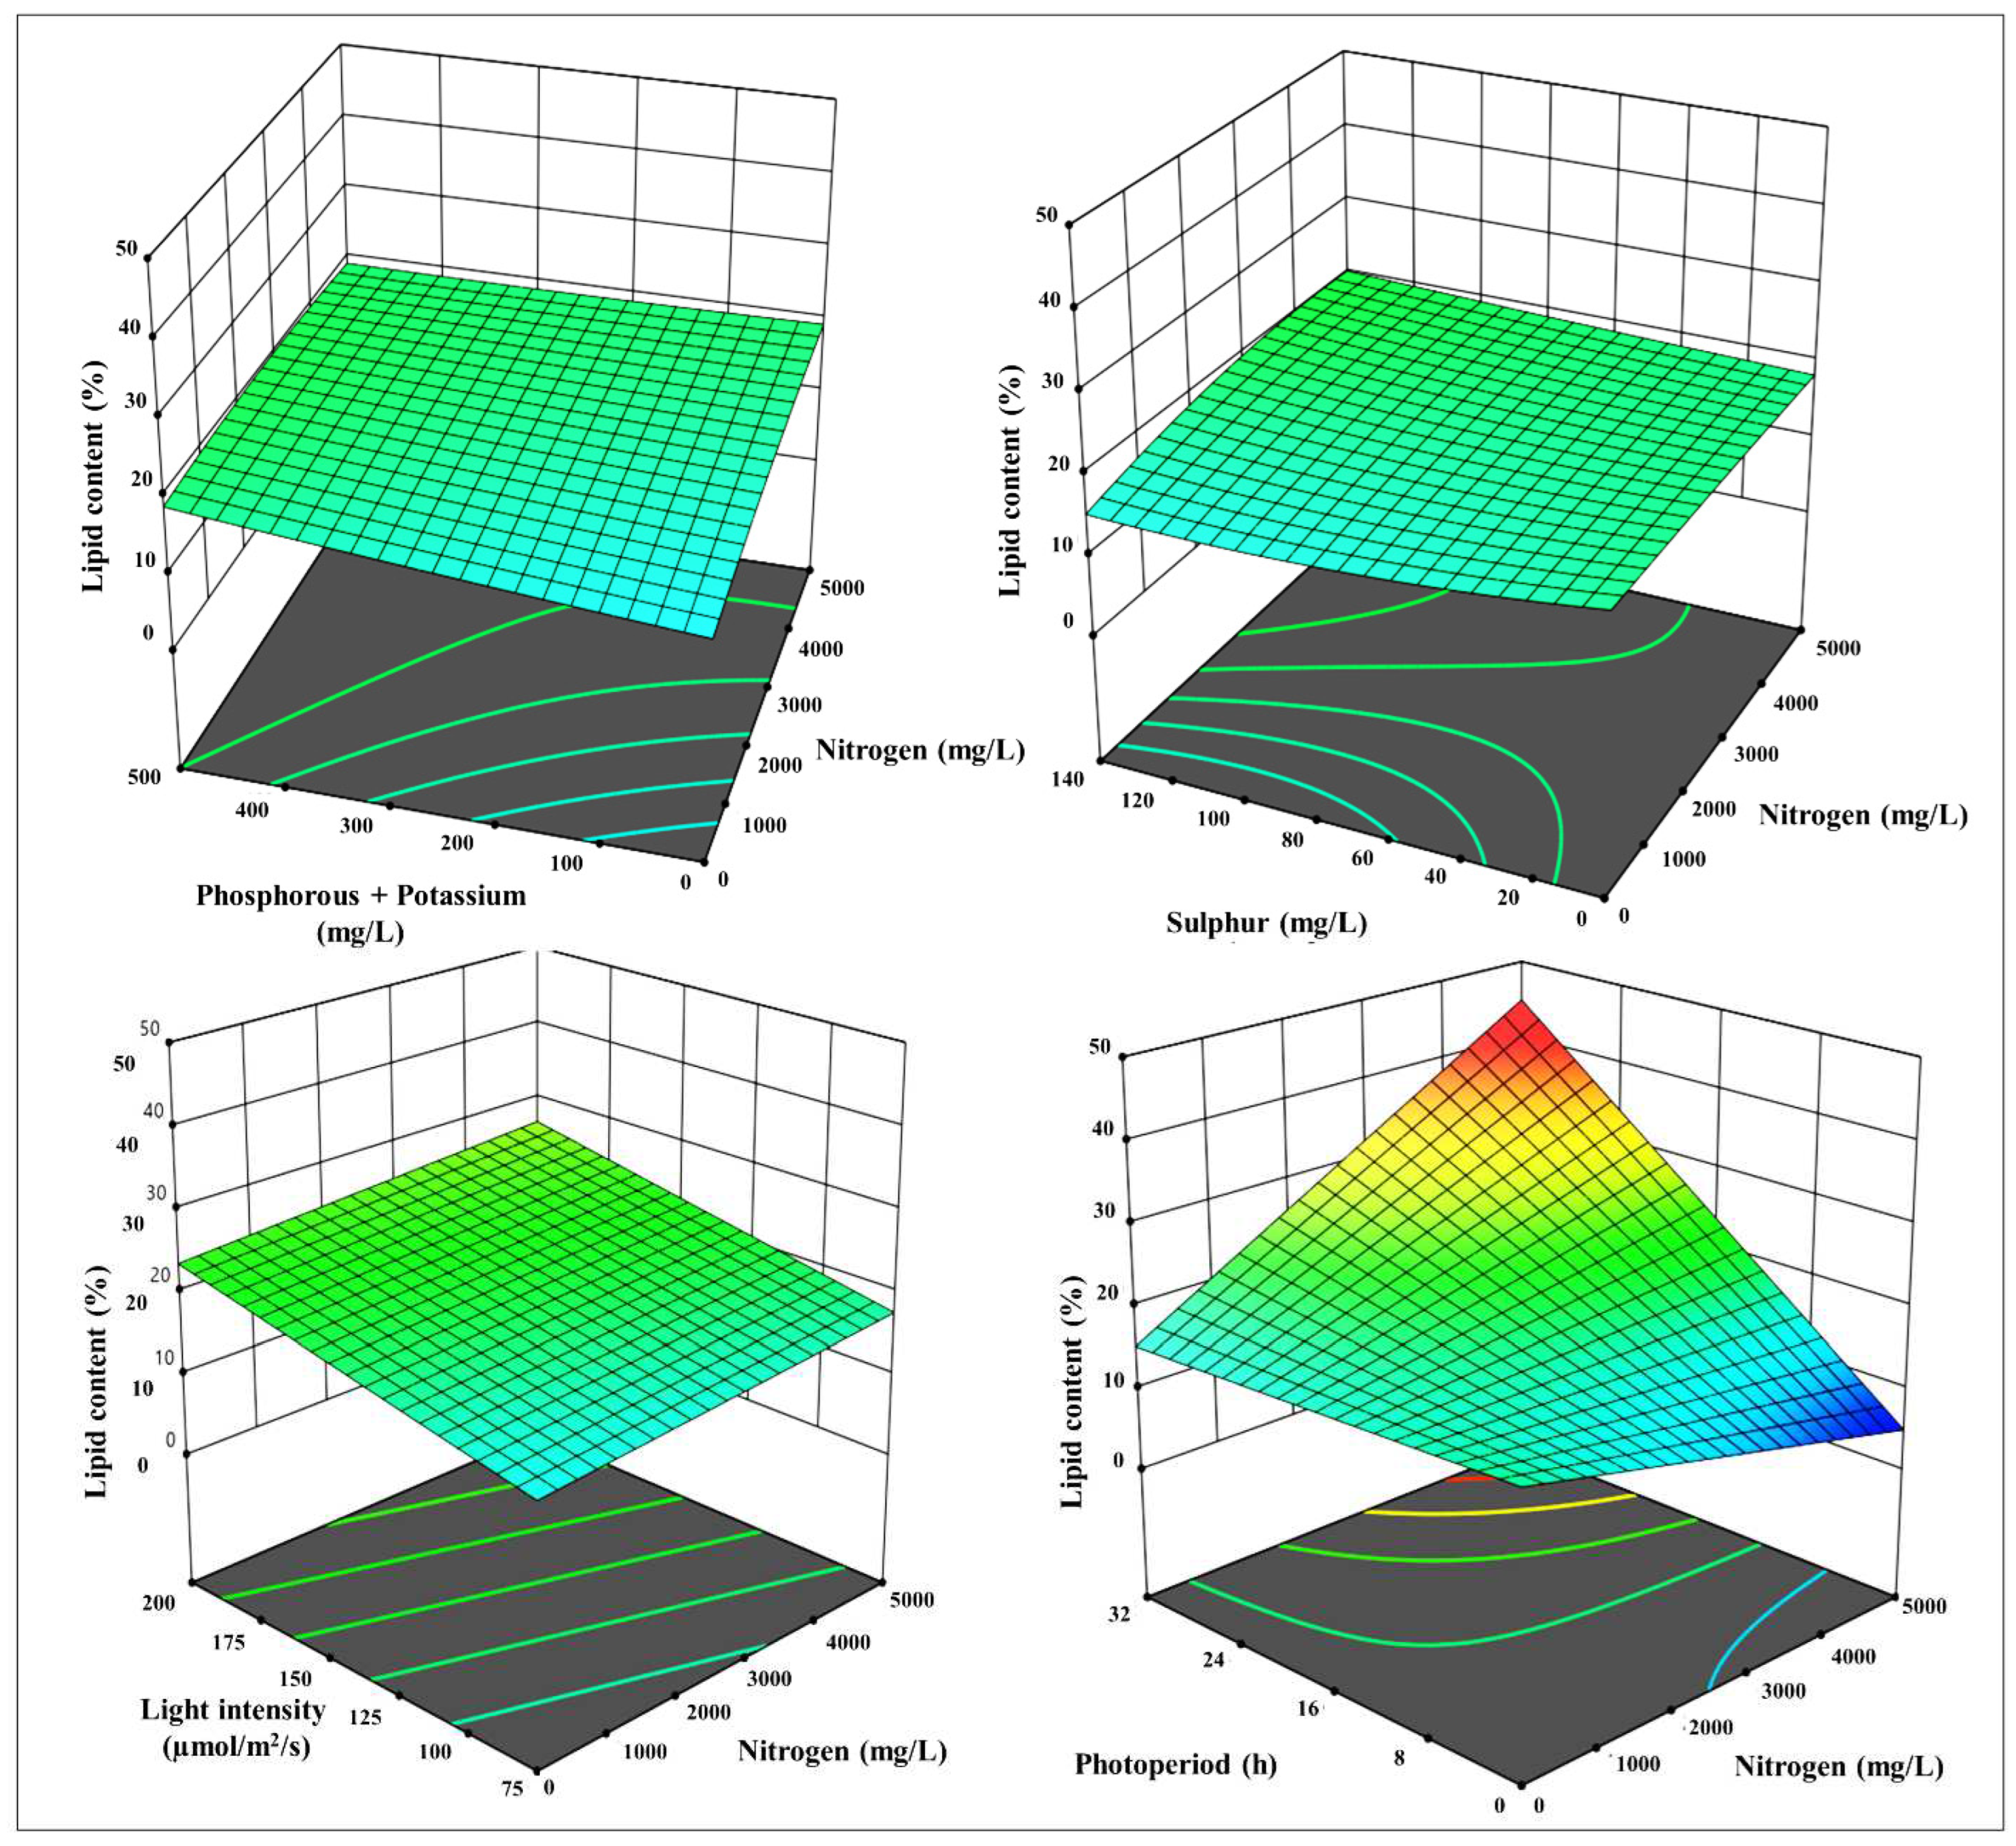
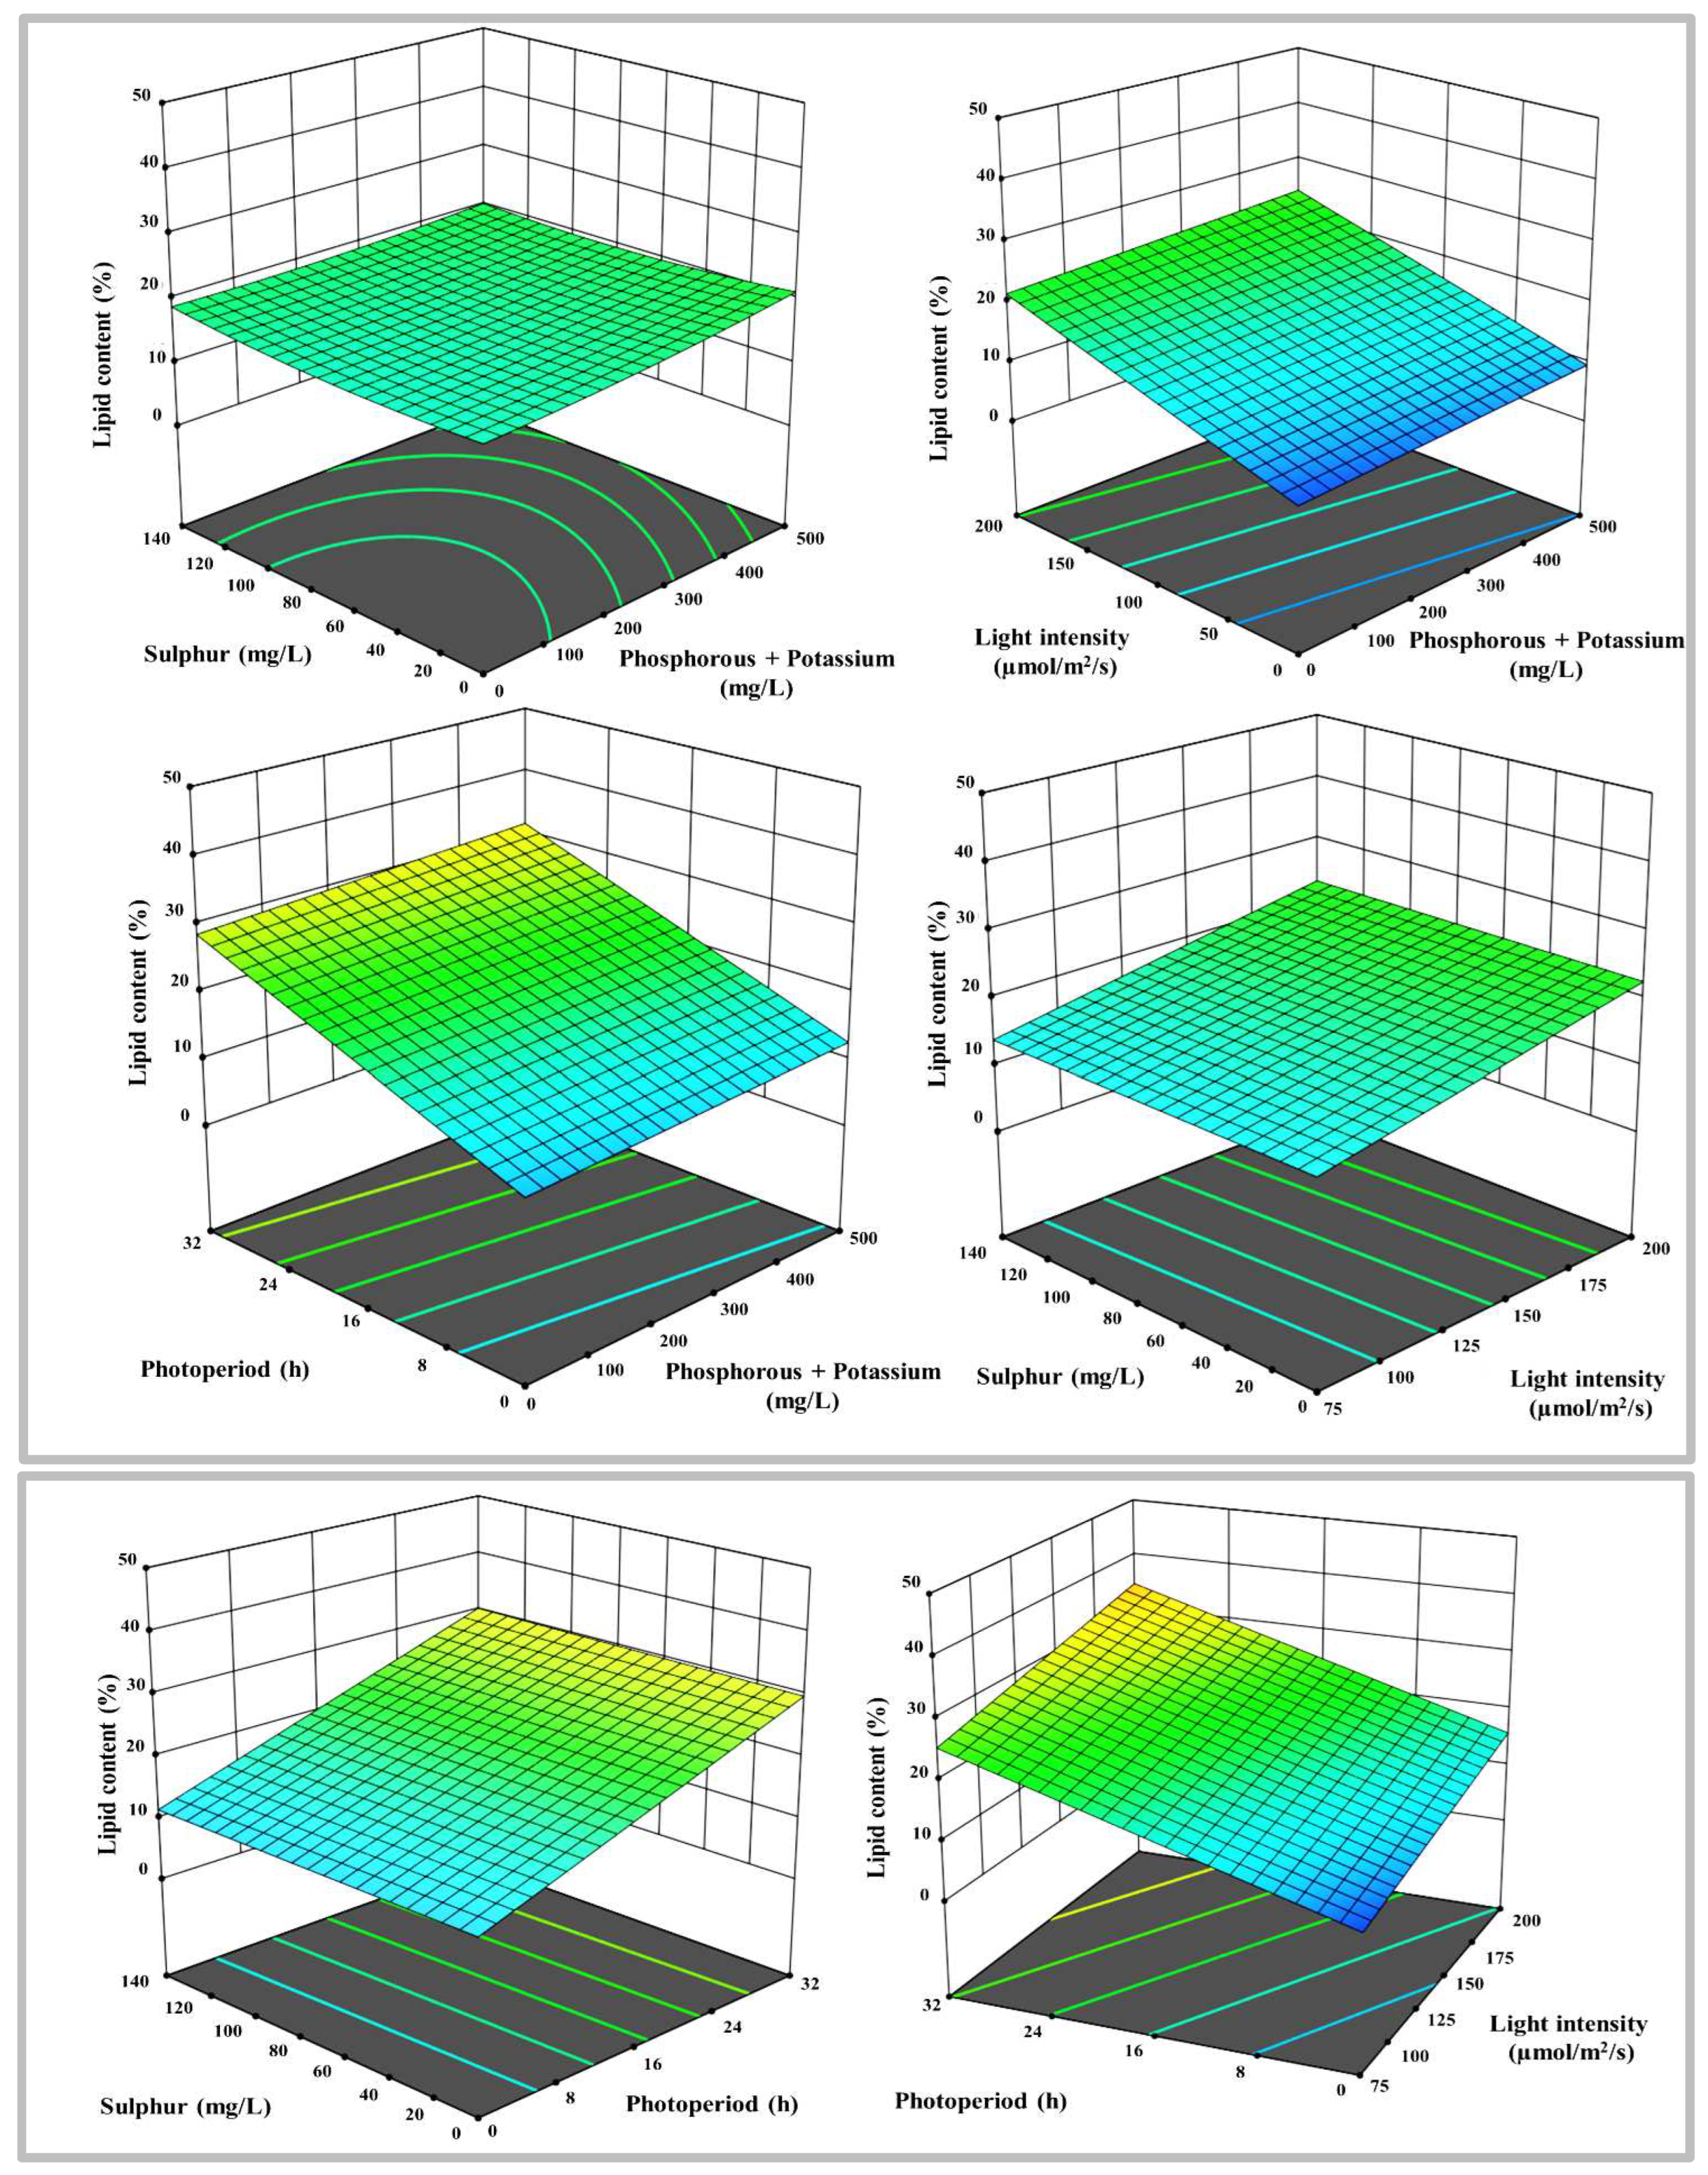
Figure 5.
3-D surface and contour plots representing the interaction between the selected parameters on total carotenoids yields in µg mL-1, a) N with P+K, b) N with S, c) N with LI, d) N with PP, e) P+K with S, f) P+K with LI, g) P+K with PP, h) S with LI, i) S with PP, and j) LI with PP.
Figure 5.
3-D surface and contour plots representing the interaction between the selected parameters on total carotenoids yields in µg mL-1, a) N with P+K, b) N with S, c) N with LI, d) N with PP, e) P+K with S, f) P+K with LI, g) P+K with PP, h) S with LI, i) S with PP, and j) LI with PP.
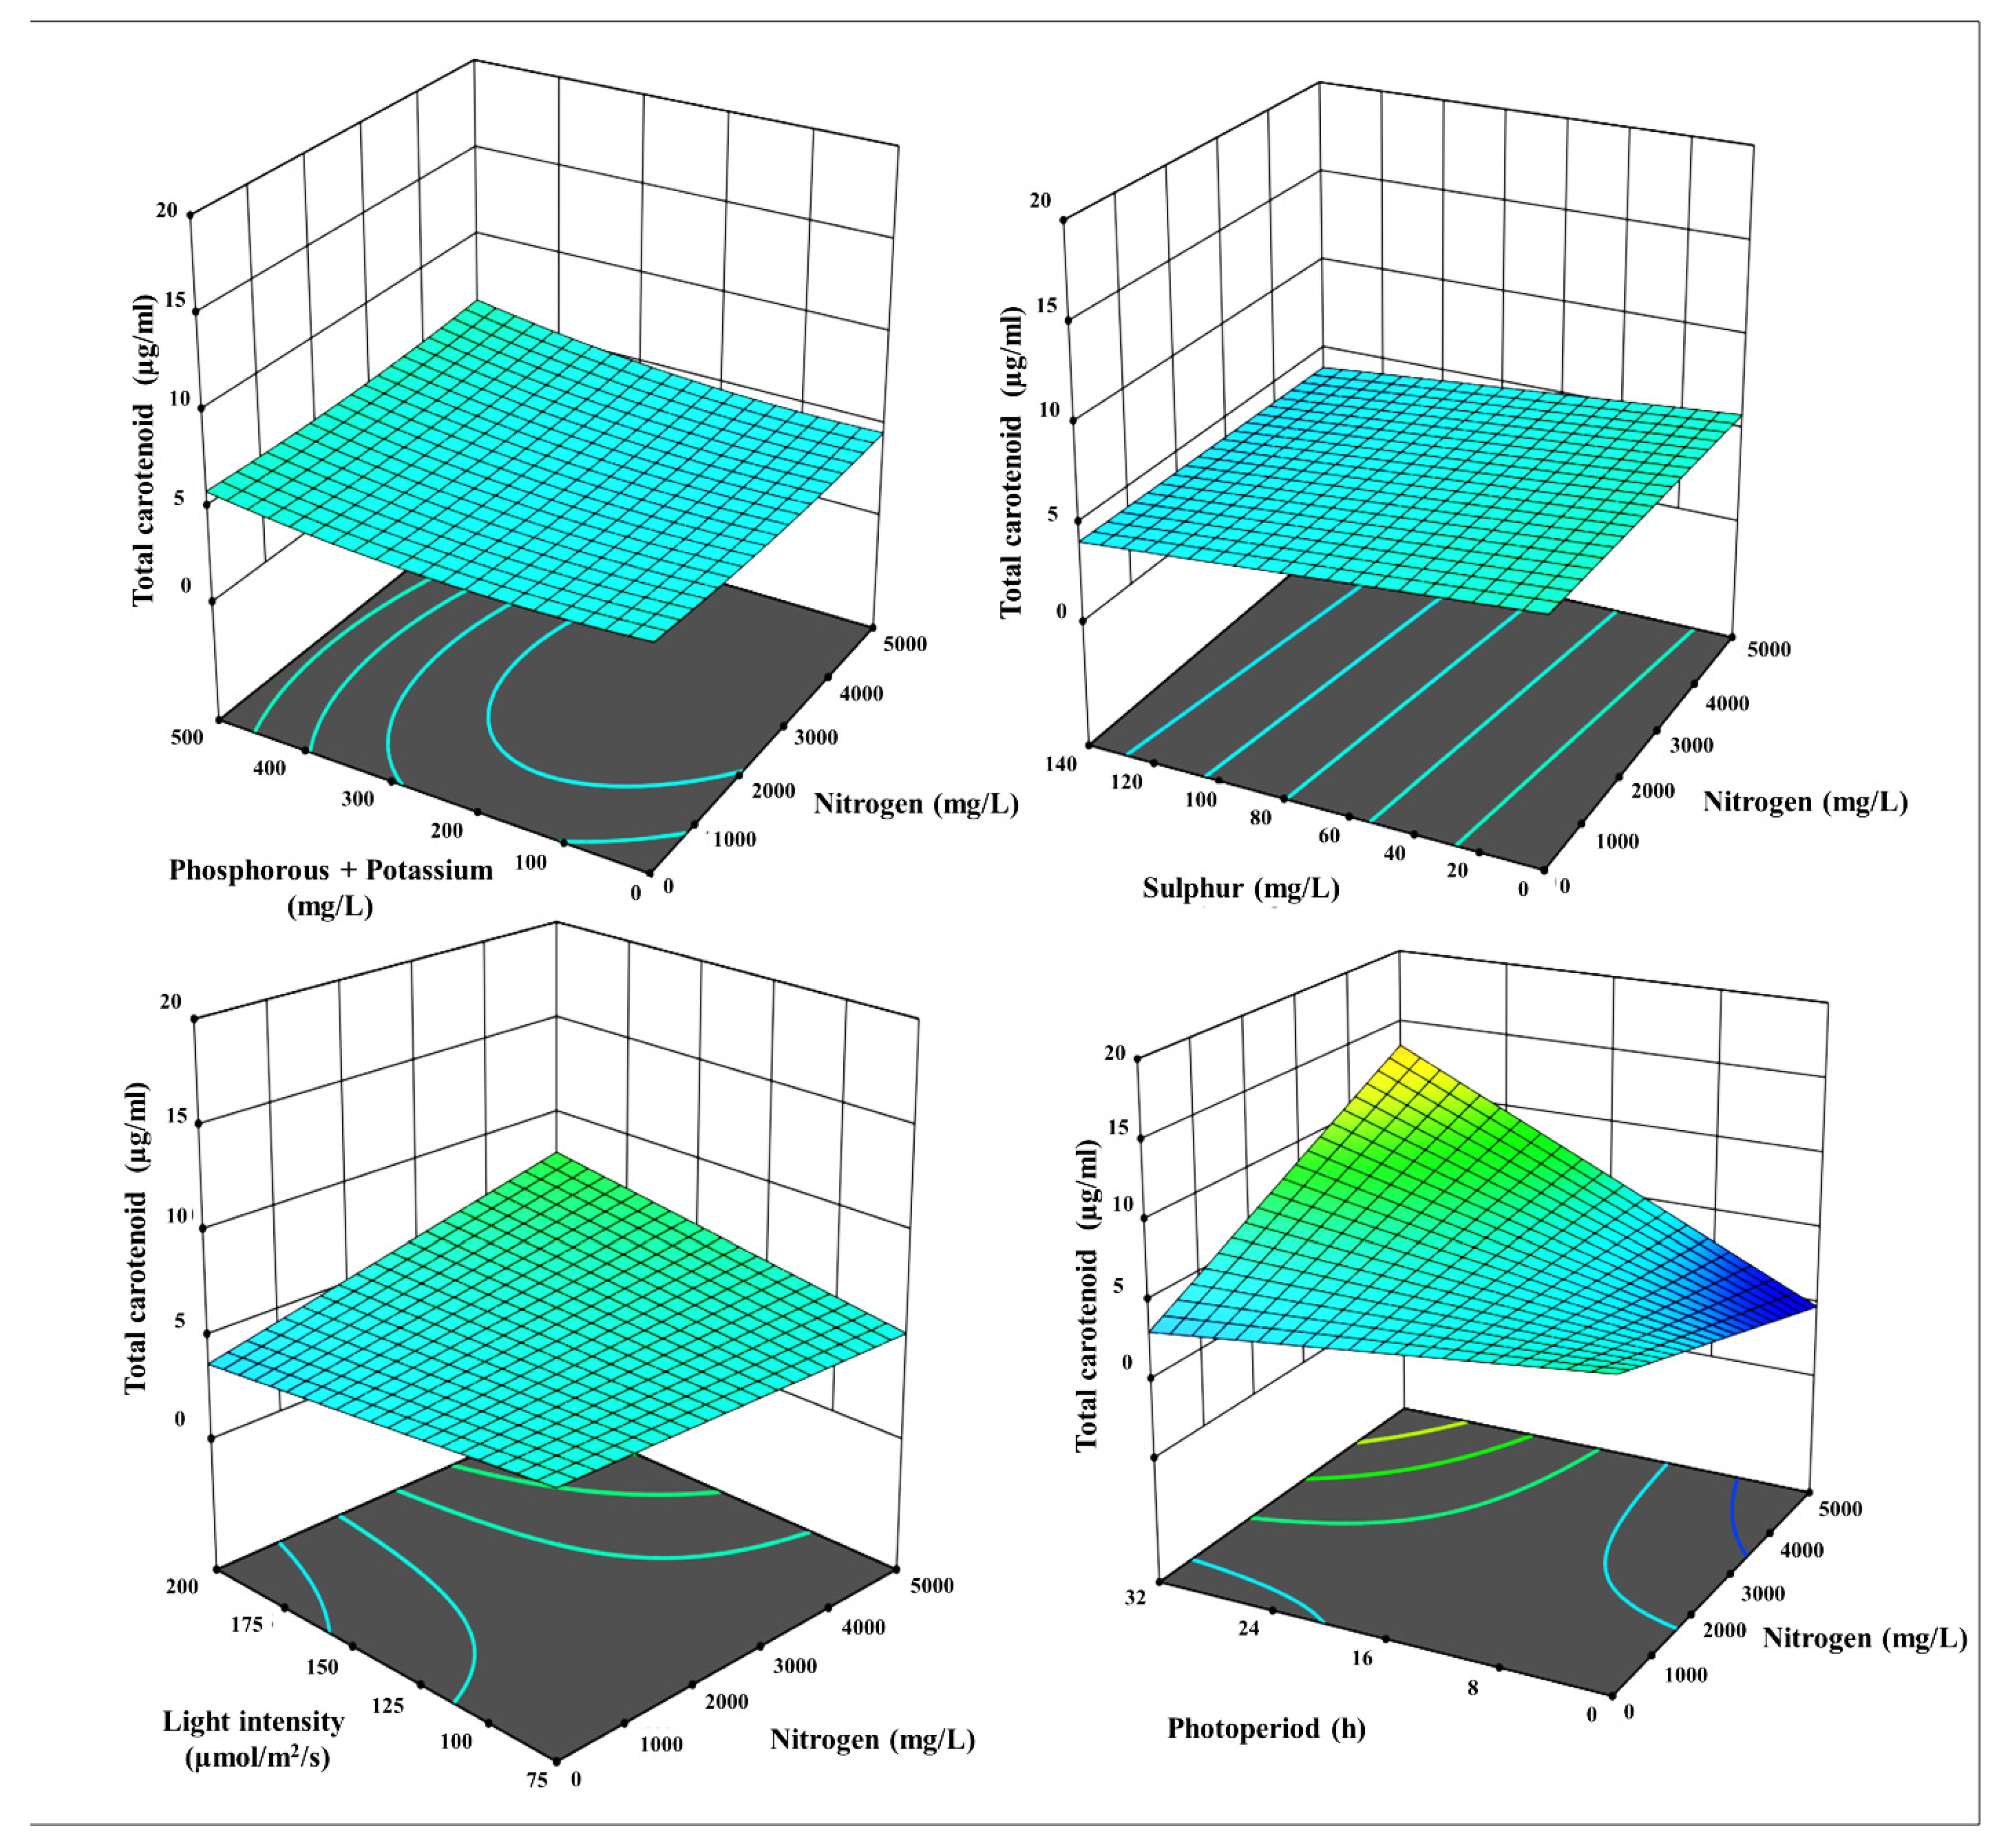
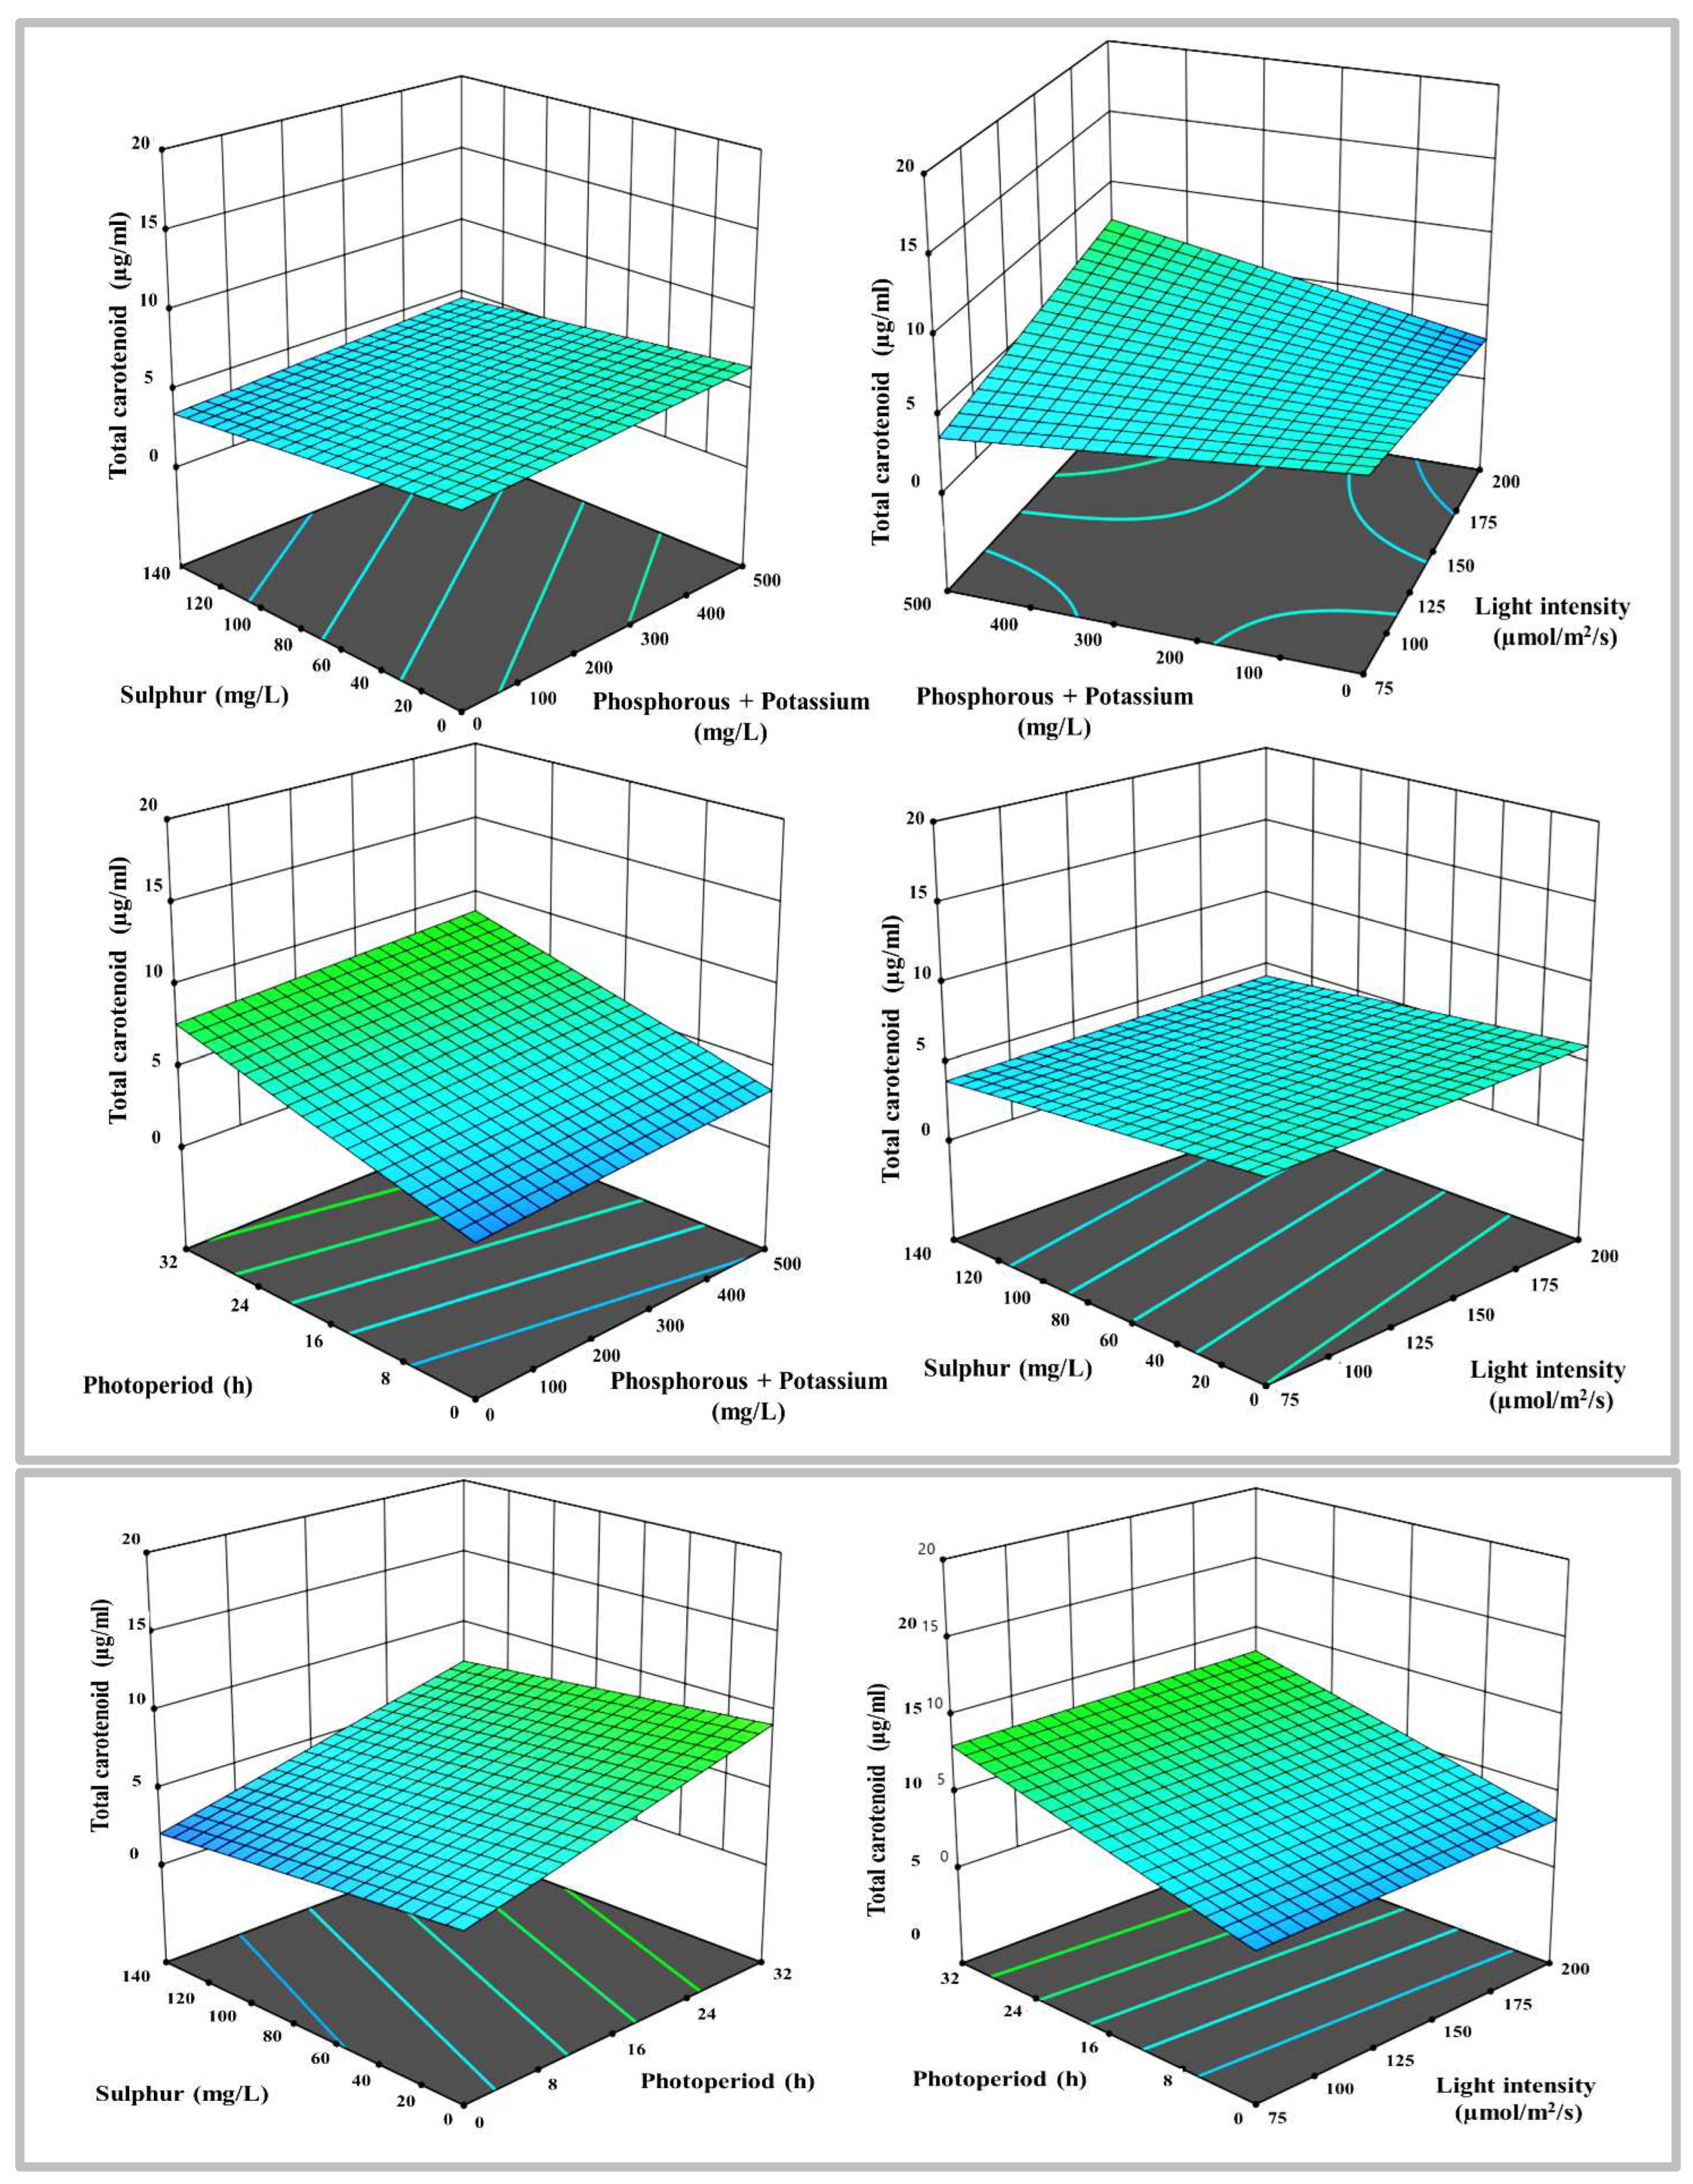
Figure 6.
Comparative growth kinetics of MP under control and optimized abiotic stress condition.
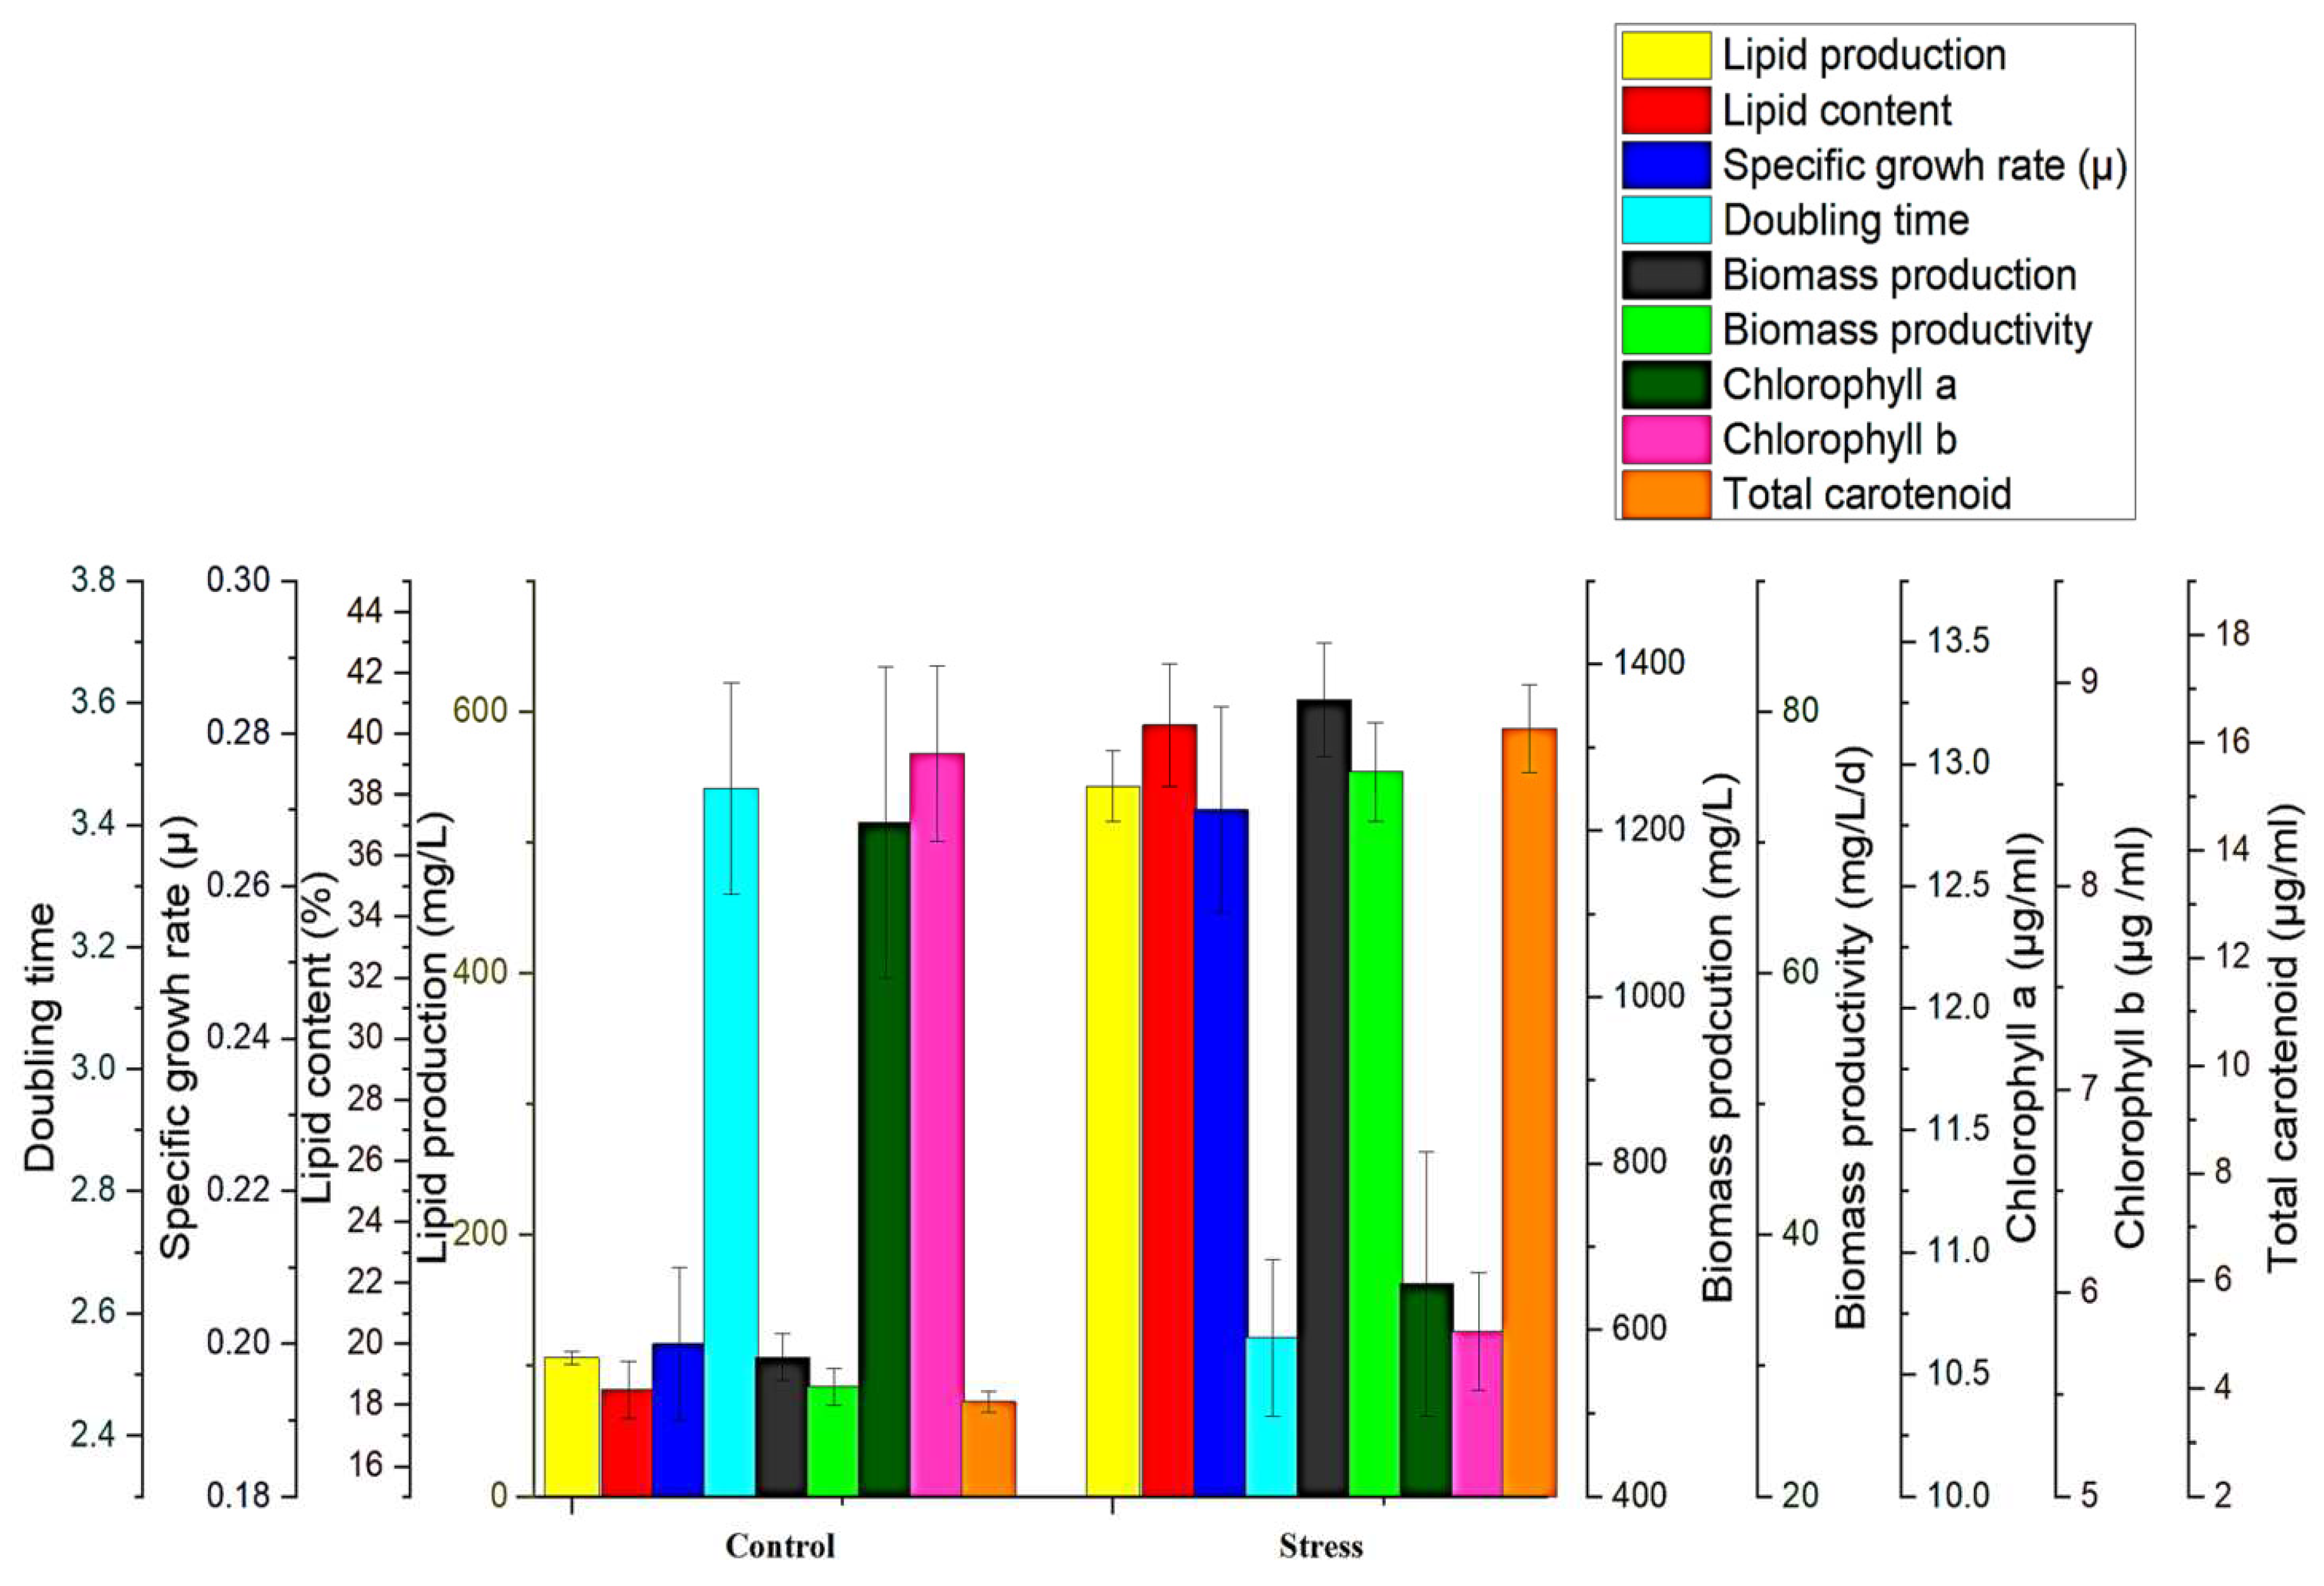
Figure 7.
Nile-Red-stained fluorescence microphotographs of MP that were examined at a magnification of 60X. The culture conditions were A) Control, BBM medium, and B) Optimized abiotic stresses. Dynamic duplex filters were applied to arbitrate the chlorophyll exhibited in A1, B1, and the lipid displayed in A3, and B3, with their respective green and red colors. The combination of red and green in A2, and B2, produces the color yellow.
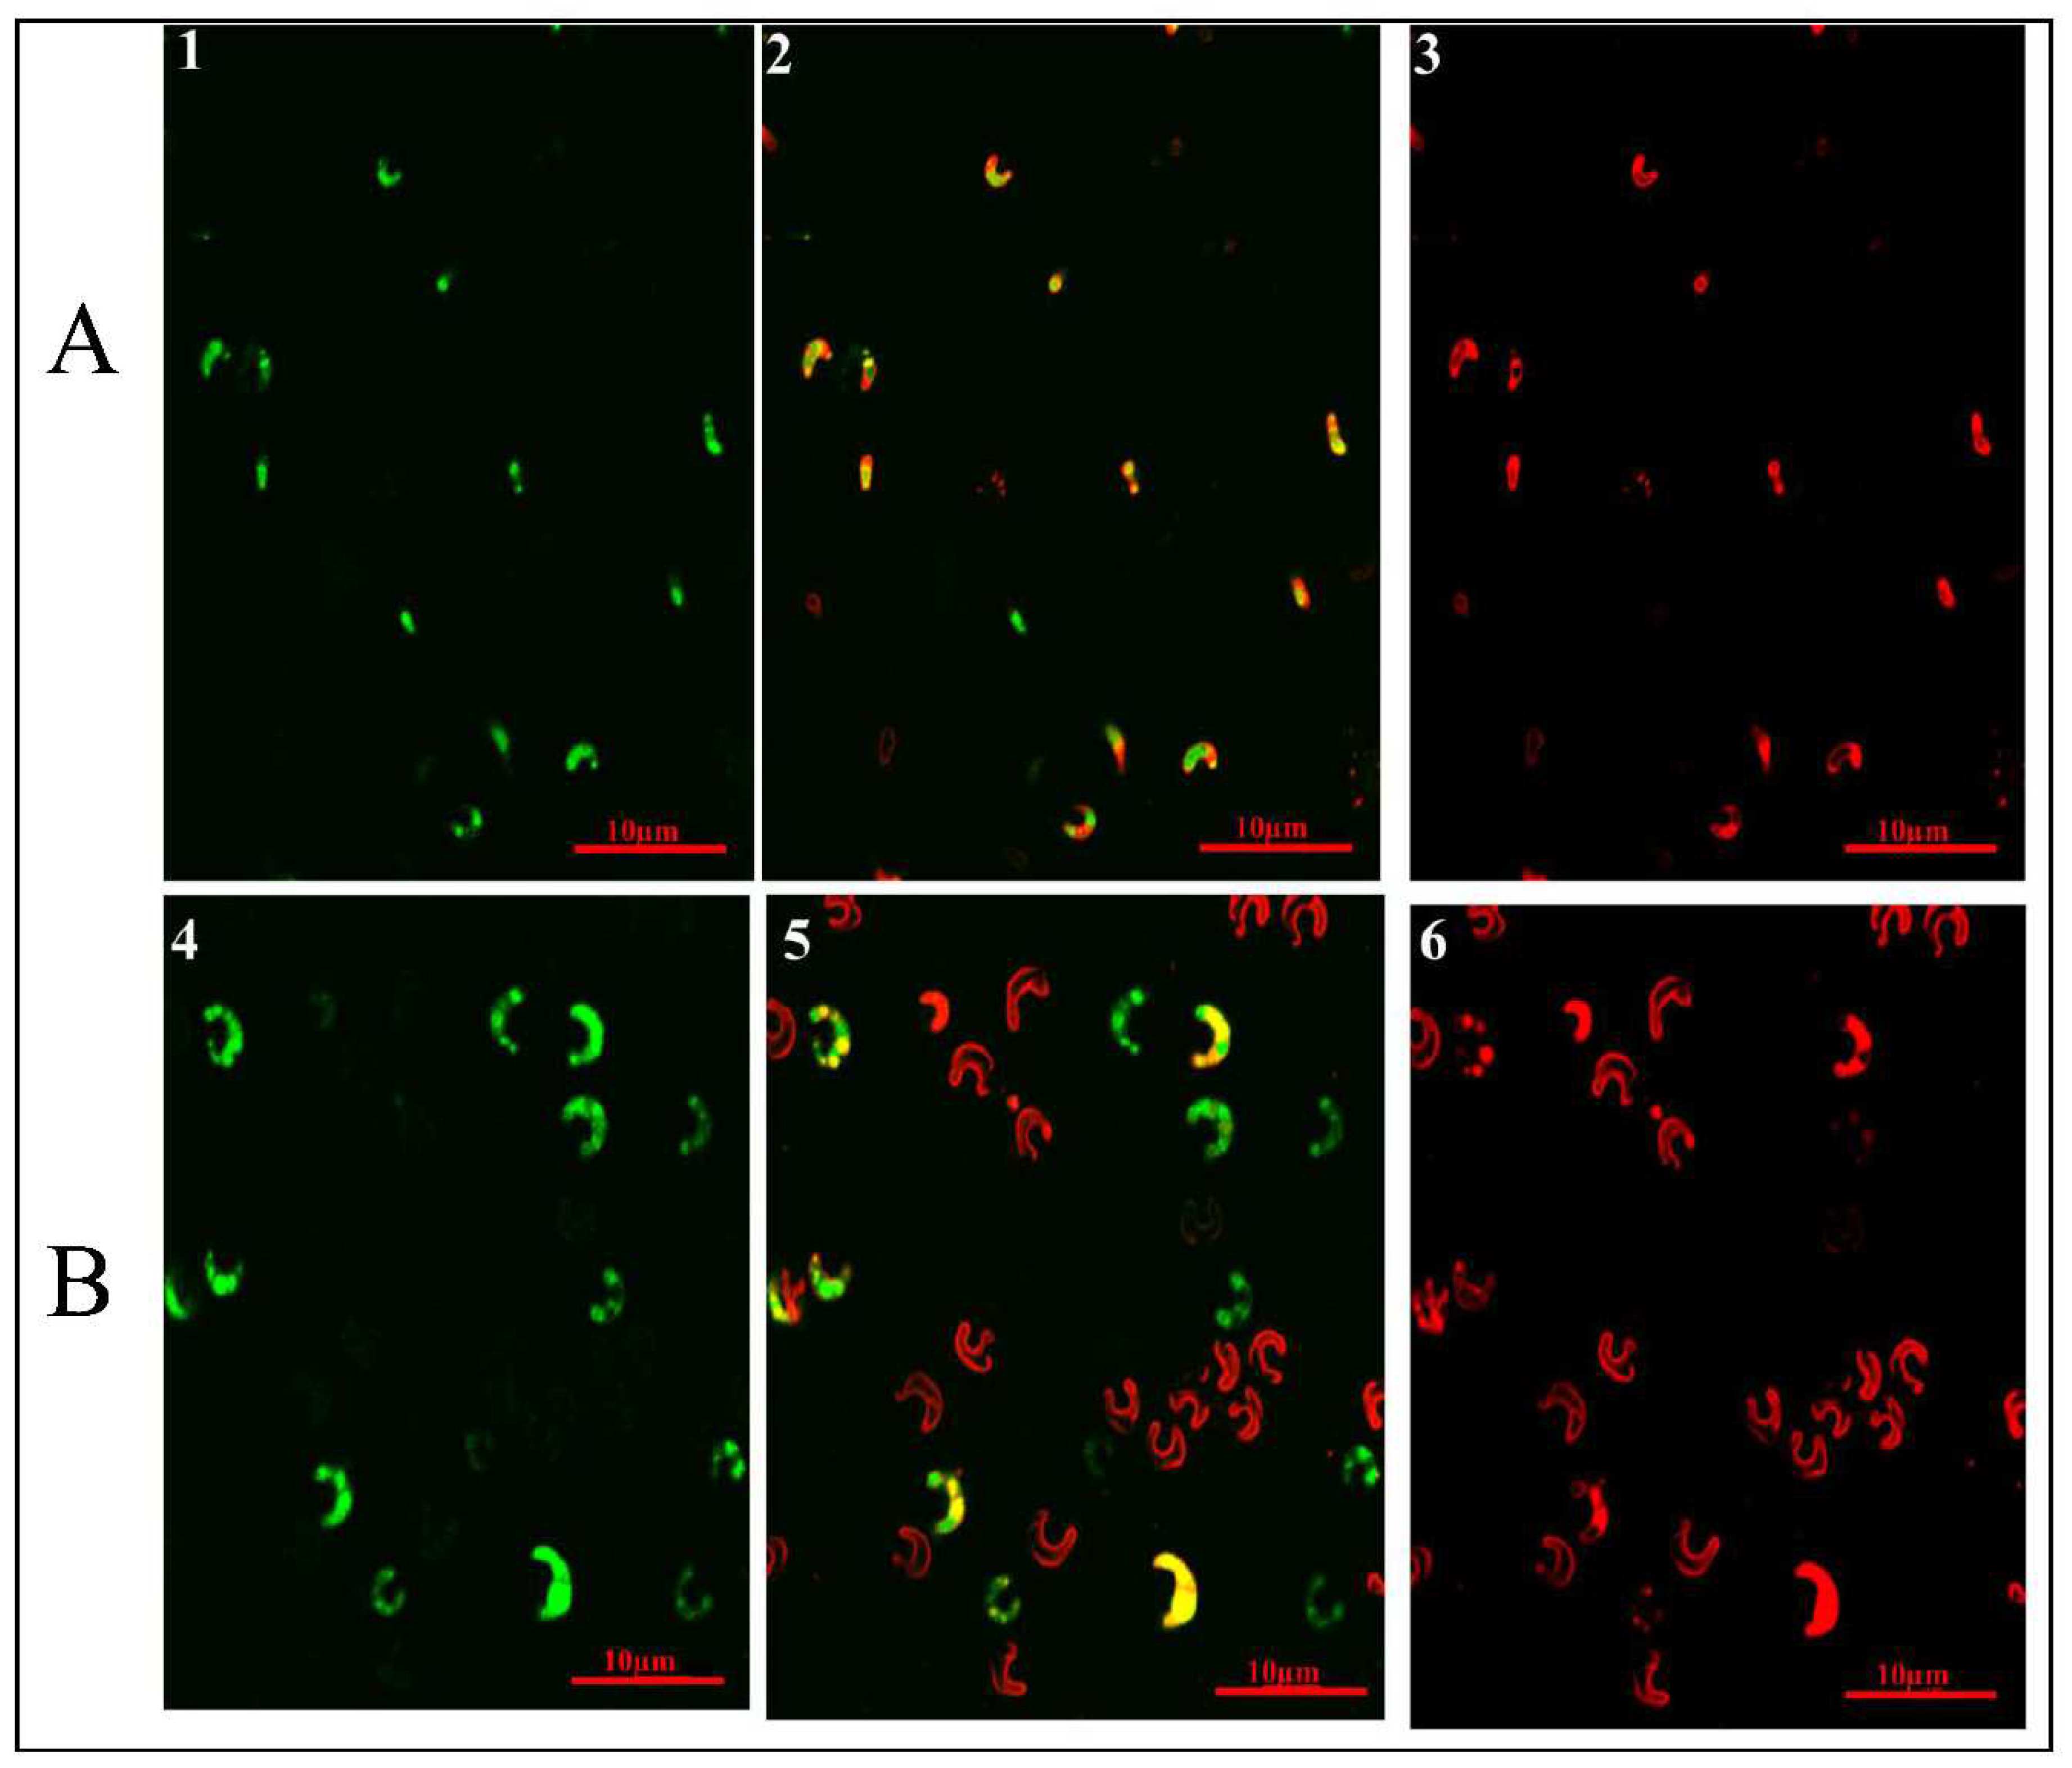
Figure 8.
Reactive oxygen species (ROS) assessment in MP amid multiple abiotic stress conditions.
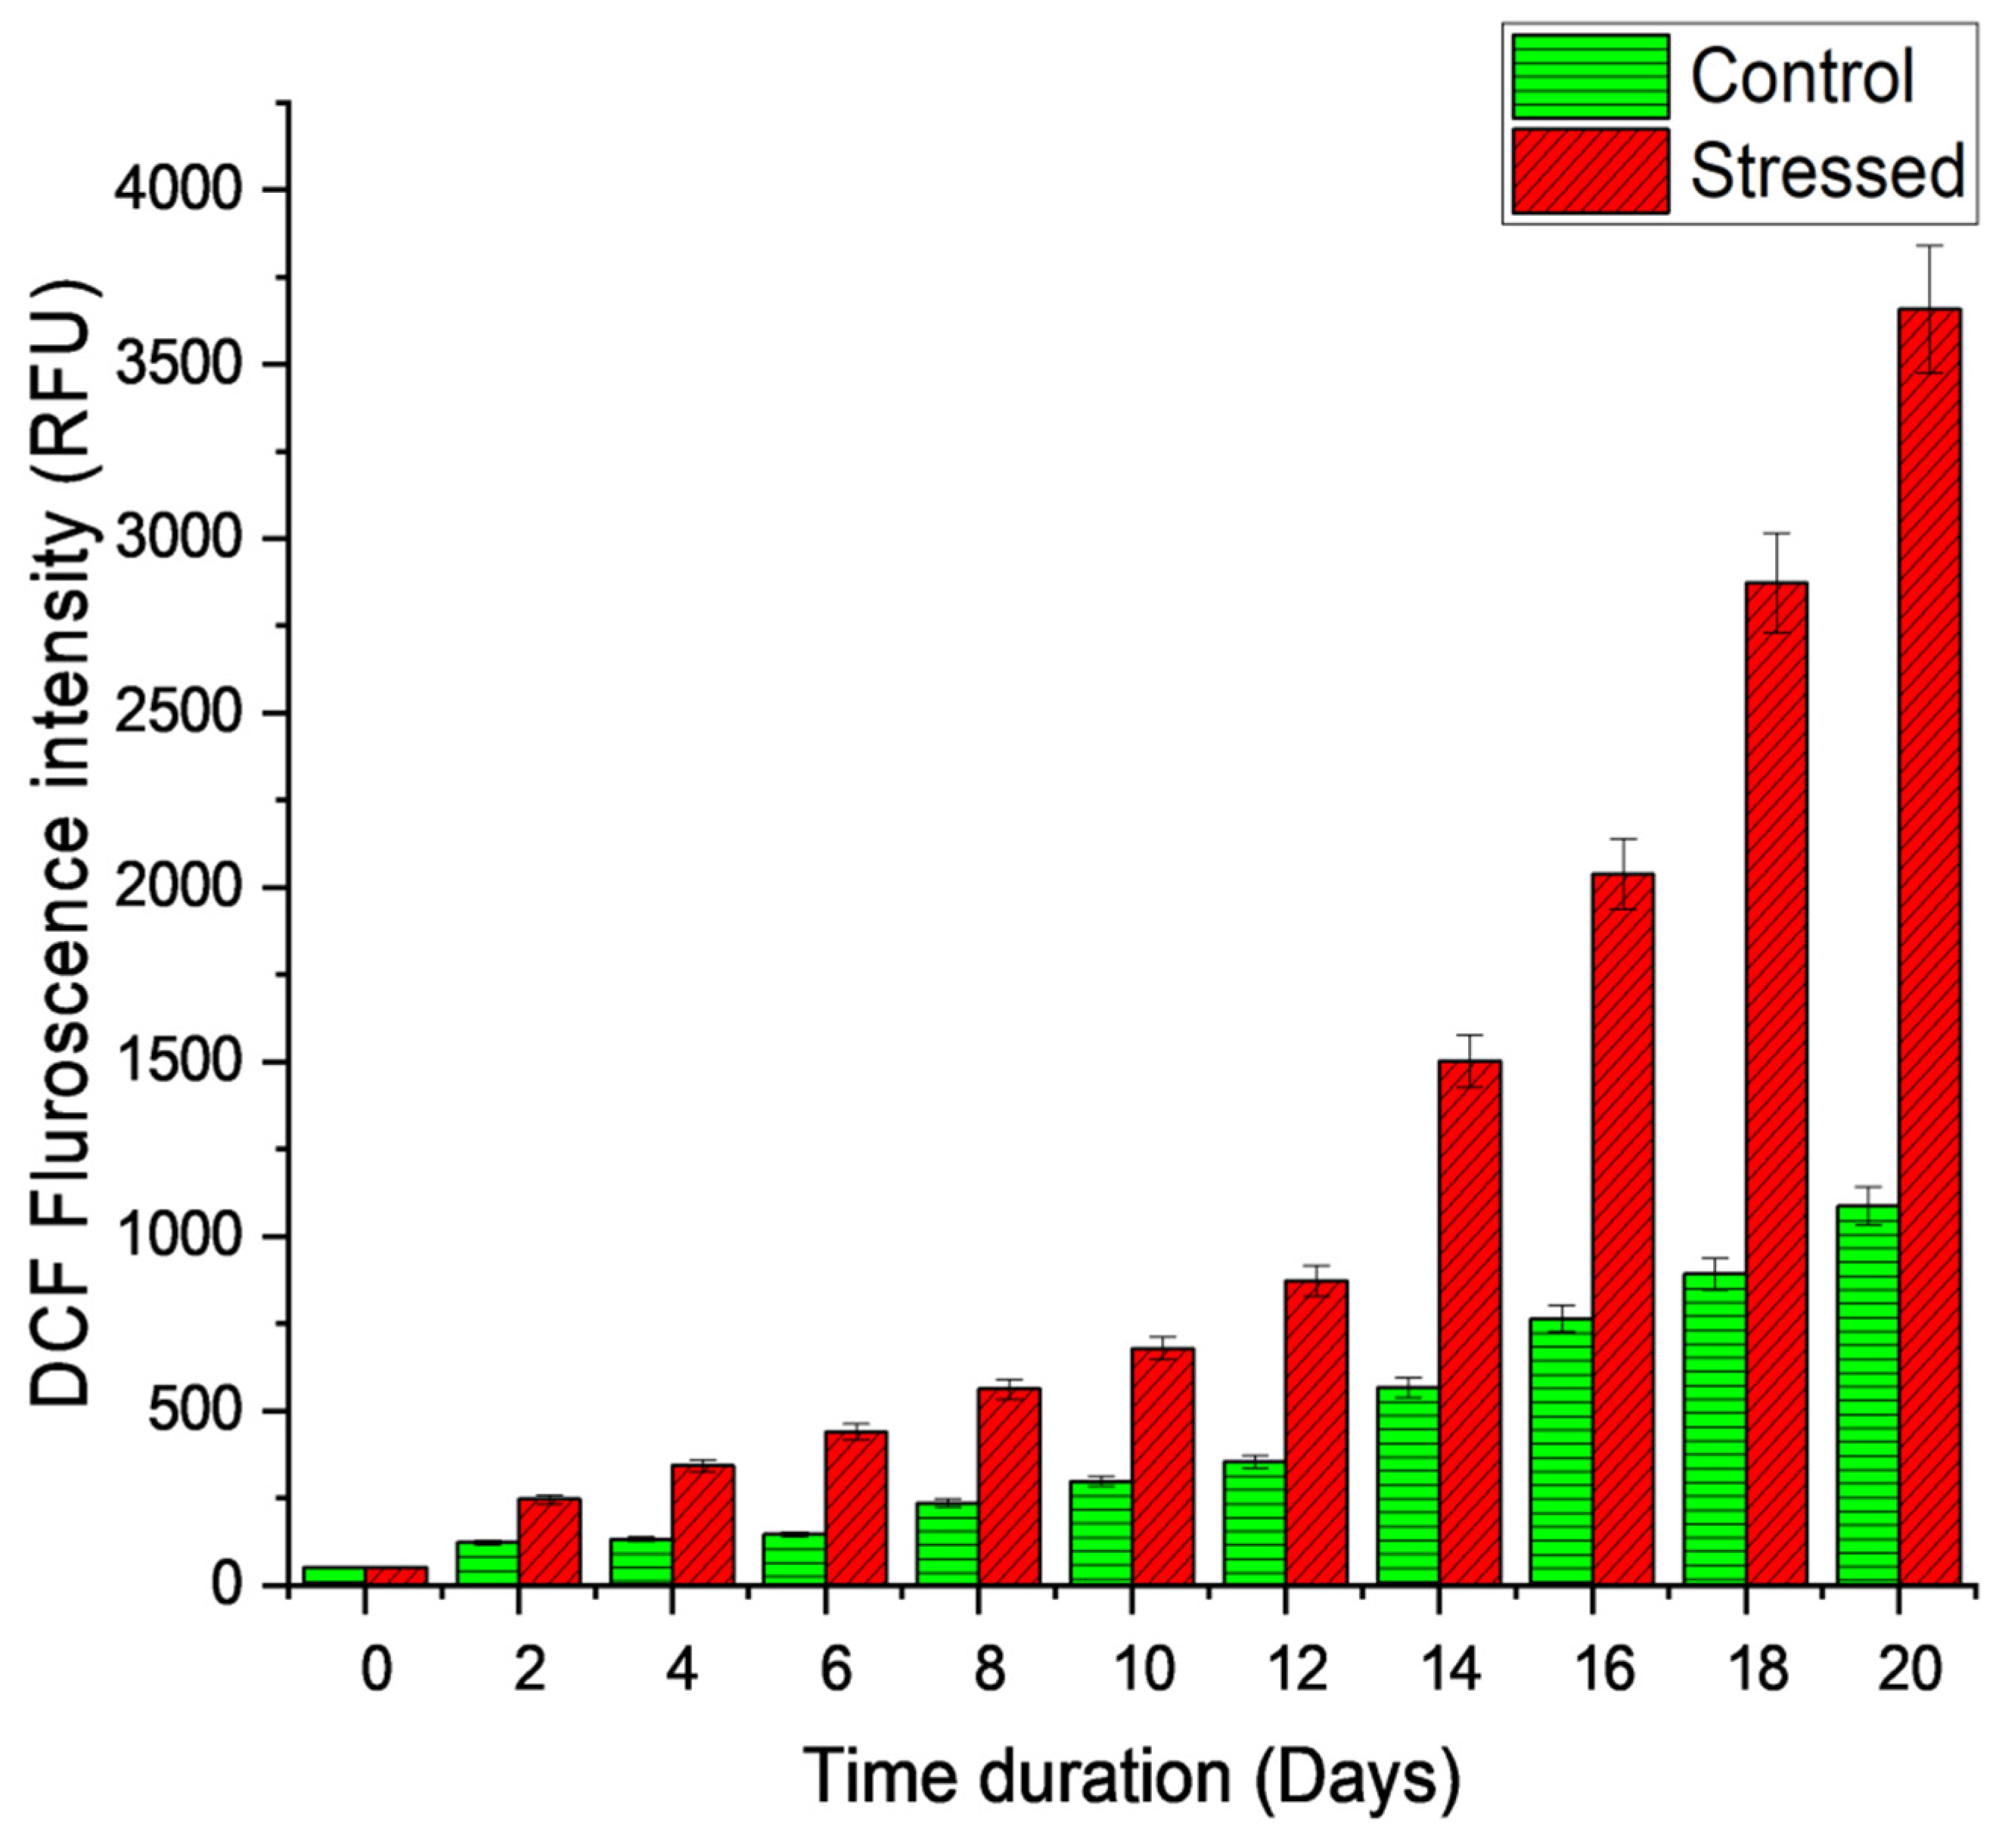
Table 2.
The best-fitted models and the corresponding Radj2 obtained from RSM-CCD for the biomass, lipids, and pigments production.
Table 2.
The best-fitted models and the corresponding Radj2 obtained from RSM-CCD for the biomass, lipids, and pigments production.
| Response | Model | Radj2 |
|---|---|---|
| Biomass productivity (mg.L-1.d-1) | = +38.71 +3.08XA+8.69 XB +2.68 XC +17.74XD+0.4950XE | 0.33 |
| Lipid content (%) | = +20.68 +1.64XA +4.64XB+1.43XC+9.48XD+0.2645XE | 0.41 |
| Chlorophyll a yield (µg.ml-1) | = +12.18 +0.0744XA+0.8357XB+0.6287XC+2.44XD-0.4549XE+0.6908XAB+0.9296 XAC+0.0032XAD+0.5578XAE+2.40XBC+0.4617XBD-0.9000XBE+0.4461XCD+0.4023XCE-0.2485XDE+0.1134XA²-0.1134XB²+0.6203XC²-6.10XD²+0.1341XE² | 0.82 |
| Chlorophyll b yield (µg.ml-1) | =+4.34+1.60XA+0.5636XB-0.3356XC+2.51XD+0.0567XE | 0.29 |
| Total Carotenoid yield (µg.ml-1) | =+4.87-0.8053XA-0.4848XB-0.1982XC+ 0.2919XD+1.94XE +0.2719XAB+0.1836XAC +1.91XAD +3.14XAE +0.6001XBC+2.82XBD-0.1718XBE-1.97XCD+1.69XCE+0.0983XDE | 0.31 |
Table 3.
Analysis of variance (ANOVA) for the proposed regression models.
| Response | Model term | Coefficient estimated | df | Standard error | Mean Square | F-value | p-value |
|---|---|---|---|---|---|---|---|
| Biomass | Intercepts | 29.06 | 1 | 2.75 | 862.17 | 5.20 | 0.0010 |
| A | 3.08 | 1 | 3.22 | 151.53 | 0.9135 | 0.3454 | |
| B | 2.68 | 1 | 3.22 | 114.96 | 0.6931 | 0.4105 | |
| C | 0.4950 | 1 | 3.22 | 3.92 | 0.0236 | 0.8786 | |
| D | 13.90 | 1 | 5.15 | 1207.42 | 7.28 | 0.0104 | |
| E | 13.31 | 1 | 3.22 | 2833.02 | 17.08 | 0.0002 | |
| Lipids | Intercepts | 15.53 | 1 | 1.47 | 246.07 | 5.20 | 0.0010 |
| A | 1.64 | 1 | 1.72 | 43.25 | 0.9135 | 0.3454 | |
| B | 1.43 | 1 | 1.72 | 32.81 | 0.6931 | 0.4105 | |
| C | 0.2645 | 1 | 1.72 | 1.12 | 0.0236 | 0.8786 | |
| D | 7.43 | 1 | 2.75 | 344.61 | 7.28 | 0.0104 | |
| E | 7.11 | 1 | 1.72 | 808.58 | 17.08 | 0.0002 | |
| Chlorophyll a | Intercepts | 10.72 | 1 | 0.7372 | 22.69 | 10.69 | < 0.0001 |
| A | -0.3409 | 1 | 0.5689 | 0.7621 | 0.3591 | 0.5551 | |
| B | -0.9199 | 1 | 0.5689 | 5.55 | 2.61 | 0.1201 | |
| C | 0.1472 | 1 | 0.5689 | 0.1421 | 0.0670 | 0.7982 | |
| D | 1.37 | 1 | 1.25 | 2.55 | 1.20 | 0.2848 | |
| E | 3.91 | 1 | 0.5689 | 100.41 | 47.32 | < 0.0001 | |
| AB | 0.9296 | 1 | 0.7284 | 3.46 | 1.63 | 0.2152 | |
| AC | 0.5578 | 1 | 0.7284 | 1.24 | 0.5865 | 0.4519 | |
| AD | 1.11 | 1 | 1.17 | 1.91 | 0.8995 | 0.3532 | |
| AE | 0.0024 | 1 | 0.7284 | 0.0000 | 0.0000 | 0.9974 | |
| BC | 0.4023 | 1 | 0.7284 | 0.6472 | 0.3050 | 0.5863 | |
| BD | 3.83 | 1 | 1.17 | 22.95 | 10.81 | 0.0034 | |
| BE | 0.3345 | 1 | 0.7284 | 0.4477 | 0.2109 | 0.6505 | |
| CD | -1.44 | 1 | 1.17 | 3.24 | 1.53 | 0.2296 | |
| CE | -0.1864 | 1 | 0.7284 | 0.1389 | 0.0655 | 0.8004 | |
| DE | 0.5540 | 1 | 1.17 | 0.4796 | 0.2260 | 0.6392 | |
| A² | 0.1134 | 1 | 0.5758 | 0.0823 | 0.0388 | 0.8457 | |
| B² | 0.6203 | 1 | 0.5758 | 2.46 | 1.16 | 0.2930 | |
| C² | 0.1341 | 1 | 0.5758 | 0.1151 | 0.0542 | 0.8180 | |
| D² | -0.2904 | 1 | 1.47 | 0.0823 | 0.0388 | 0.8457 | |
| E² | -3.43 | 1 | 0.5758 | 75.40 | 35.53 | < 0.0001 | |
| Chlorophyll b | Intercepts | 3.38 | 1 | 0.4599 | 20.92 | 4.53 | 0.0026 |
| A | 1.60 | 1 | 0.5375 | 41.11 | 8.89 | 0.0050 | |
| C | -0.3356 | 1 | 0.5375 | 1.80 | 0.3898 | 0.5362 | |
| E | 0.0567 | 1 | 0.5375 | 0.0514 | 0.0111 | 0.9166 | |
| B | 0.9018 | 1 | 0.8601 | 5.08 | 1.10 | 0.3012 | |
| D | 1.88 | 1 | 0.5375 | 56.56 | 12.23 | 0.0012 | |
| Total carotenoids | Intercept | 4.87 | 1 | 0.4612 | 10.62 | 2.28 | 0.0299 |
| A | -0.8053 | 1 | 0.8419 | 4.25 | 0.9148 | 0.3473 | |
| B | -0.4848 | 1 | 0.8419 | 1.54 | 0.3316 | 0.5695 | |
| C | -0.1982 | 1 | 0.8419 | 0.2575 | 0.0554 | 0.8157 | |
| D | 0.2919 | 1 | 0.8624 | 0.5324 | 0.1145 | 0.7376 | |
| E | 1.94 | 1 | 0.8419 | 24.57 | 5.29 | 0.0295 | |
| AB | 0.2719 | 1 | 1.08 | 0.2957 | 0.0636 | 0.8028 | |
| AC | 0.1836 | 1 | 1.08 | 0.1349 | 0.0290 | 0.8660 | |
| AD | 1.91 | 1 | 1.72 | 5.70 | 1.23 | 0.2779 | |
| AE | 3.14 | 1 | 1.08 | 39.36 | 8.47 | 0.0072 | |
| BC | 0.6001 | 1 | 1.08 | 1.44 | 0.3100 | 0.5823 | |
| BD | 2.82 | 1 | 1.72 | 12.42 | 2.67 | 0.1138 | |
| BE | -0.1718 | 1 | 1.08 | 0.1180 | 0.0254 | 0.8746 | |
| CD | -1.97 | 1 | 1.72 | 6.09 | 1.31 | 0.2624 | |
| CE | 1.69 | 1 | 1.08 | 11.41 | 2.46 | 0.1288 | |
| DE | 0.0983 | 1 | 1.72 | 0.0151 | 0.0032 | 0.9550 |
Table 4.
Carotenoids profiling by UPLC-Q-TOF-MS.
| S. No. | Retention Time | Compound | % Fraction | Molecular Mass | Molecular Formula | Abducts | Obtained mass | ||
|---|---|---|---|---|---|---|---|---|---|
| Control | Stressed | Control | Stressed | ||||||
| 1 | 28.07 | 28.07 | 7,8-Didehydroastaxanthin | 14.8 | 17.7 | 594.823 | C40H50O4 | M+K-2H | 631.31 |
| 2 | 30.41 | 30.41 | Violaxanthin | 3.61 | 4.85 | 600.870 | C40H56O4 | M-H | 599.413 |
| 3 | 31.76 | 31.76 | Lutein 5,6-epoxide | 45.12 | 33.93 | 584.871 | C40H56O3 | M-H | 583.41 |
| 4 | 33.67 | 33.67 | All-cis-β carotene | 7.62 | 8.19 | 536.873 | C40H56 | M-H | 599.411 |
| 5 | 33.92 | 33.92 | β carotene | 24.41 | 26.46 | 600.8 | C40H56O4 | M-H | 599.411 |
Disclaimer/Publisher’s Note: The statements, opinions and data contained in all publications are solely those of the individual author(s) and contributor(s) and not of MDPI and/or the editor(s). MDPI and/or the editor(s) disclaim responsibility for any injury to people or property resulting from any ideas, methods, instructions or products referred to in the content. |
© 2023 by the authors. Licensee MDPI, Basel, Switzerland. This article is an open access article distributed under the terms and conditions of the Creative Commons Attribution (CC BY) license (http://creativecommons.org/licenses/by/4.0/).
Copyright: This open access article is published under a Creative Commons CC BY 4.0 license, which permit the free download, distribution, and reuse, provided that the author and preprint are cited in any reuse.


