
Submitted:
21 May 2023
Posted:
23 May 2023
Read the latest preprint version here
Preprints on COVID-19 and SARS-CoV-2
Abstract
The COVID-19 pandemic has affected millions of people globally, with respiratory organs being strongly affected in individuals with comorbidities. Medical imaging-based diagnosis and prognosis have become increasingly popular in clinical settings to detect COVID-19 lung infections. Among various medical imaging modalities, ultrasound stands out as low-cost, mobile, and radiation-safe imaging technology. In this comprehensive review, we focus on ultrasound-based AI studies for COVID-19 detection that use public or private lung ultrasound datasets. We surveyed articles that used publicly available lung ultrasound datasets for COVID-19 and reviewed publicly available datasets and organize ultrasound-based AI studies per dataset. We analyzed and tabulated studies in several dimensions, such as data preprocessing, AI models, cross-validation, and evaluation criteria. In total, we reviewed 42 articles, where 28 articles used public datasets, and the rest used private data. Our findings suggest that ultrasound-based AI studies for the detection of COVID-19 have great potential for clinical use, especially for children and pregnant women. Our review also provides a useful summary for future researchers and clinicians who may be interested in the field.
Keywords:
COVID-19
; Deep learning
; Artificial Intelligence
; Ultrasound
; Review
1. Introduction
1.1. Coronavirus Disease 2019
The World Health Organization (WHO) declared the Coronavirus Disease 2019 (COVID-19) a global pandemic in early March 2020. Despite numerous preventive measures to slow the spread of this virus, more than 681 million cases and 6.81 million deaths have been reported globally to date [1]. This new coronavirus and common respiratory infections have been known to strongly affect the respiratory organs of the human body, particularly individuals with comorbidities such as chronic heart disease, diabetes, etc. [2,3]. As the number of infection cases refusing to eschew altogether with new variants becoming rampant, medical imaging-based diagnosis and prognosis have been becoming more popular in clinical settings over time, where various medical imaging modalities such as computed tomography (CT), X-ray, ultrasound, etc. have been used to detect COVID-19 lung infection [4,5,6].
1.2. Ultrasound in COVID-2019 Diagnosis
Medical imaging is undeniably the most important tool for the diagnosis and management of treatments in clinical settings [7]. Despite ultrasound being known to be a noisy imaging modality compared to various other imaging modalities with exceptional image quality (i.e., CT, magnetic resonance imaging (MRI), X-ray, etc.) [8], it stands out for being a low-cost, mobile, and, above all, non-ionizing medical imaging technology [9]. Because ultrasound is radiation-safe, it is the preferred imaging modality for children and pregnant women [10] and has been widely used in the detection and severity assessment of COVID-19 for the same patient group [11]. Lung infection due to COVID-19 can be seen and assessed in chest ultrasound images.
Typically, there are three major tasks that can be performed on lung ultrasound images for COVID-19 patient management, (i) detection of pneumonia infection in the lung (e.g., [12,13,14,15]), (ii) pneumonia type/severity classification (e.g., [16,17,18,19,20]), and (iii) segmentation of infection in the lung (e.g., [21]). There are usually three types of artifacts that can appear in a lung ultrasound image, such as A-lines, B-lines, and irregular pleural lines (see Figure 1) [22]. When ultrasound pulses reach the surface of the lung, healthy lungs exhibit horizontal lines parallel to the surface of the transducer, known as A-lines. On the other hand, a lung infected with pneumonia shows irregular pleural lines, as well as brightness in the lung (see Figure 2). On the contrary, COVID-19, a special kind of pneumonia, typically shows discreet vertical reverberation artifacts, known as B lines, which originate from the pleural surface (see Figure 1 and Figure 2) [18,19]. Based on the presence and appearance of these artifacts, pneumonia can be detected and classified as community-acquired pneumonia (CAP) and COVID-19, respectively. Finally, using segmentation, the spread of pneumonia can be estimated, which can be used for the severity scoring criteria for COVID-19 [23,24].
1.3. AI for Ultrasound-based COVID-2019 Management
To accelerate the detection and classification of CAP and COVID-19 in clinical settings, artificial intelligence (AI) algorithms [4,25,26,27] have recently been introduced and have shown great promise, which may lessen the burden of expert radiologists/clinicians to detect and assess the severity of pneumonia. Several studies recently reviewed these AI techniques used in COVID-19 detection and analysis in ultrasound [4,25,26,28,29,30,31,32]. Most of these review works have been performed between late 2019 and early 2022 and mainly focused on discussing AI techniques used in different ultrasound-based COVID-19 studies. However, AI methods require a sufficient volume of training data for optimal optimization of AI models to make clinically acceptable diagnostic decisions. In addition, the reproducibility of the reported accuracy in the existing studies mostly relies on access to the exact dataset that has been used in the studies. However, existing review articles did not emphasize studies based on the use of publicly accessible data, which could be a critical factor in the reproducibility of the accuracy reported. Furthermore, many existing reviews on AI-based COVID-19 detection in ultrasound are not comprehensive in covering all the works in the field.
1.4. Main Contributions
In this comprehensive review, we include ultrasound-based impacting AI COVID-19 studies that used a public data set or a private data set, or both. A summary of our contributions is the following:
- We exhaustively survey articles that used publicly available lung ultrasound datasets for COVID-19. To our knowledge, this survey is the first that is organized focusing on dataset accessibility.
- We list and review the publicly available lung ultrasound COVID-19 datasets and organize ultrasound-based AI studies per dataset.
- We analyze and tabulate studies in several dimensions, such as data preprocessing, AI models, cross-validation, and evaluation criteria.
- We summarize all reviewed works in a tabular fashion to facilitate an easier comparison among studies.
- Last by not least, we also include many ultrasound-based COVID-19 AI studies that used private lung ultrasound datasets to elucidate a clear picture of the field.
1.5. Search Strategy
We searched Google Scholar1 for all scholarly publications: peer-reviewed journal papers, papers published in the proceedings of conferences or workshops, and non-peer-reviewed pre-prints from January 2020 to December 2022. The search query was (COVID-19 ∣ corona virus disease) (detect* ∣ predict* ∣ class*) (ultrasound). We also included quality unpublished preprints. We selected an article if
- Its full text is available online or it is published in any of the common and well-known publications, which are usually accessible through an institutional subscription. In our case, we took help from fellow scientists working in top North American universities for accessing papers, if not accessible through our own institutional subscription.
- It used any form of artificial intelligence techniques (i.e., conventional machine learning or deep learning) for COVID-19 detection or analysis from lung ultrasound data.
- It used a publicly available lung ultrasound dataset of COVID-19.
- The hypothesis of the article is supported by its qualitative and quantitative results.
- The article maintained a minimum standard of quality (e.g., abstract or methodology section is not missing, no reference missing error, clear legends/axis titles in the figure, etc.)
In total, we have reviewed 42 articles in this study, where 28 articles used public datasets (exhaustively included) and the rest used private data (non-exhaustive).
1.6. Paper Organization
The remainder of the paper is organized as follows. Details of the datasets, the collection procedure of the ultrasound images, and the image processing techniques prior to the model building are presented in Section 1. An overview of the architecture of the AI models employed in the studies is presented in Section 3.1. Specific dataset-based studies with their methods and findings are tabulated and discussed in Section 4, Section 5, Section 6, and Section 7. Discussion and future work are described in Section 8. Finally, concluding remarks are presented in Section 9.
2. Input Data
Supervised learning using deep neural networks, a category of AI, has been extensively used for medical imaging applications in recent years [33]. Adequate training of deep models for medical data requires prohibitive amounts of annotated data at the image/pixel/voxel level. Using such deep models on ultrasound data for COVID-19 detection and analysis is also not an exception. Furthermore, it is also critical to have public access to such dataset as many research group lacks the clinical setup for data collection. In addition, reproducing a claimed performance by an AI method and possible future improvement greatly relies on access to the exact dataset. However, there are only a few publicly accessible lung ultrasound datasets available. In this section, we discuss such datasets and their attributes in detail.
2.1. Public Dataset
In Table 1, we list publicly accessible COVID-19 ultrasound datasets and their associated class labels. We briefly discuss each dataset below:
- POCUS: Born et al. [12,13] published and have been maintaining a lung ultrasound dataset, namely point-of-care ultrasound (POCUS), since 2020. This dataset initially contains a total of 261 lung ultrasound recordings by combining 202 videos and 59 still images collected from 216 patients. In this dataset, data from 92, 90, 73, and 6 are associated with COVID-19, healthy control, bacterial pneumonia, and viral pneumonia, respectively. These data were collected using either convex or linear probes. Each film in their dataset also comes with visual pattern-based expert annotation (e.g., B-Lines or consolidations).
- ICLUS-DB: Soldati et al. [24] published an internationally standardized acquisition protocol and four-level scoring schemes for lung ultrasound (LUS) in March 2020. This dataset contains 277 ultrasound videos (consisting of 58,924 frames) of 17 confirmed COVID-19, 4 suspected COVID-19, and 14 healthy subjects. These data were collected at various clinical centers in Italy using various ultrasound scanners by either linear or convex probes. To evaluate the progress of pathology, this data consortium defined a four-level scoring system ranging from 0 to 3. The presence of continuous pleural-line and horizontal A-lines indicates a healthy lung with a score 0. Score 1 is tagged for initial abnormality when alterations in the pleural line appear. Score 2 is more severe than 1 and is associated with small consolidations in the lung. Score 3 is the most severe grade, which is associated with the presence of a larger hyperechogenic area below the pleural surface (i.e., white lung).
- COVIDx-US: Ebadi et al. [34] published an open-access LUS benchmark dataset gathered from multiple sources in 2021. The dataset was assembled from a variety of sources (e.g., POCUS Atlas, GrepMed, Butterfly Network, and Life in the Fast Lane). This dataset (i.e., version 1.5) contains 242 videos (with 29,651 extracted images) corresponding to 71 COVID-19, 49 CAP, 94 non-pneumonia lung diseases, and 28 healthy classes.
2.2. Private Dataset
In contrast to the publicly accessible datasets described in Section 2.1, there were studies that used private datasets and some of these datasets are mentioned as available on request. However, these data sets have variations in terms of patient origin, hospital location, and data collection protocols. We list these datasets in Table 2 with the number of available samples and associated labels/classes. We also briefly summarize the imaging protocols and types of transducers used in those datasets below.
Regardless of the variation of ultrasound scanners, scanning areas on skin targeting the lung are typically similar across datasets. Durrani et al. [35] considered six distinctive scanning regions in their study. Panicker et al. [36] adopted the scan protocol of Soldati et al. [24] and also aimed at six acquisition points for data extraction. Quentin Muller et al. [37] scanned on ten thoracic sites in their study. Although video of the costophrenic region was excluded in [38], most studies followed a twelve-zone scanning protocol for the data acquisition process [21,39,40,41,42,43]. Furthermore, Mento et al. [44] used fourteen scanning areas, following the scan protocol of by Soldati et al. [24]. Another study [45] followed the scan protocol by Mento et al. [46] and Perrone et al. [47].
Variations in transducer types and frequency were also observed in the studies. For example, some studies used low-frequency (1–5 MHz) curved array [36,39,40,41] and phased array [35,38] transducers. On the other hand, Roshankhah et al. [45] used both linear and convex transducers in multi-sites with a wide range of center frequencies. Similarly, La Salvia et al. [42] used both linear and convex transducers with a frequency of 5 and 12 MHz, respectively, and Mento et al. [44] used 3.5 to 6.6 MHz in their study.
Figure 3 presents a pie-chart showing the percentage of articles, reviewed in this study, per lung ultrasound datasets.

Table 2.
List of private (non-accessible publicly) COVID-19 ultrasound datasets. Acronyms- N: number of samples, Tr: training, Va: validation, and Te: test.
Table 2.
List of private (non-accessible publicly) COVID-19 ultrasound datasets. Acronyms- N: number of samples, Tr: training, Va: validation, and Te: test.
| Sl. | Dataset | Year | N | Tr/Va/Te | Classes | Note |
|---|---|---|---|---|---|---|
| 1 | London Health Sciences Centre’s 2 tertiary hospitals (Canada) [38] | 2020 | (243 patients) 600 videos; 121,381 frames | ∼80/20 | COVID, Non-COVID, Hydrostatic Pulmonary Edema | - |
| 2 | ULTRACOV (Ultrasound in Coronavirus disease) [39] | 2022 | (28 COVID-19 patients) 3 sec video each | - | A-Lines, B-Lines, consolidations, and pleural effusions | Available upon request |
| 3 | Huoshenshan Hospital (Wuhan, China) [40] | 2021 | (31 patients) 1,527 images | - | Normal, septal syndrome, interstitial-alveolar syndrome, white lung | Source Link |
| 4 | Royal Melbourne Hospital (Australia) [35] | 2022 | (9 patients) 27 videos; 3,827 frames | - | Normal, consolidation/collapse | Available upon request |
| 5 | Ultrasound lung data [34] | 2021 | (300 patients) 1530 videos; 287,549 frames | 80/20 | A-line artifacts, B-line artifacts, presence of consolidation/pleural effusion | - |
| 6 | Huoshenshan Hospital (Wuhan, China) [41] | 2022 | (31 patients); 2,062 images | - | Normal, septal syndrome, interstitial-alveolar syndrome, white lung | Source Link |
| 7 | Fondazione IRCCS Policlinico San Matteo’s Emergency Department (Pavia, Italy) [42] | 2021 | (450 patients) 2,908 frames | 75/15/10 | A-lines with two B-lines, slightly irregular pleural line, artefacts in 50% of the pleura, damaged pleural line, visible consolidated areas, damaged pleura/irregular tissue | - |
| 8 | Third People’s Hospital of Shenzhen (China) [48] | 2020 | (71 COVID-19 patients) 678 videos; 6,836 images | - | A-line, B-line, pleural lesion, pleural effusion | - |
| 9 | Fondazione Policlinico Universitario Agostino Gemelli (Rome, Italy), Fondazione Policlinico San Matteo (Pavia, Italy) [44] | 2021 | (82 patients) 1,488 videos; 314,879 frames | - | 4 severity levels [24] | - |
| 10 | CHUV (Lausanne, Switzerland) [37] | 2020 | (193 patients) 1,265 videos; 3,455 images | 80/20 | True (experts’ approval), False (experts’ disapproval) | - |
| 11 | Various online sources [49] | 2022 | 792 images | - | COVID-19, healthy | - |
| 12 | Spain, India [36] | 2021 | (10 subjects) 400 videos, 5,000 images | - | A-lines, lack of A-lines, appearance of B-lines, confluent appearance of B-lines, appearance of C-lines | Available upon request |
| 13 | Private clinics (Lima, Peru) [50] | 2021 | 1,500 images | - | Healthy, COVID-19 | Available upon request |
| 14 | BresciaMed (Brescia, Italy), Valle del Serchio General Hospital (Lucca, Italy), Fondazione Policlinico Universitario A. Gemelli IRCCS (Rome, Italy), Fondazione Policlinico Universitario San Matteo IRCCS (Pavia, Italy), and Tione General Hospital (Tione, Italy) [45] | 2021 | (32 patients) 203 videos; 1,863 frames | 90/10 | Healthy, indentation of pleural line, discontinuity of the pleural line, white lung | - |
| 15 | Beijing Ditan Hospital (Beijing, China) [43] | 2021 | (27 COVID-19 patients) 13 moderate, 7 severe, 7 critical | - | Severe, non-severe | - |
| 16 | Cancer Center of Union Hospital, West of Union Hospital, Jianghan Cabin Hospital, Jingkai Cabin Hospital, Leishenshan Hospital [21] | 2021 | (313 COVID-19 patients) 10 second video from each | - | Normal, presence of 3-5 B-lines, ≥6 B-lines or irregular pleura line, fused B-lines or thickening pleura line, consolidation | - |
2.3. Data Pre-processing and Augmentation
Various image processing techniques are typically used before feeding the data to AI models. Image processing techniques include, but are not limited to, curve-to-linear conversion, image resizing, intensity normalization, standardization, augmentation, etc. In this section, we briefly discuss different image pre-processing techniques used in the reviewed articles.
2.3.1. Curve-to-linear Conversion
Acquired ultrasound videos and images using convex transducers are typically fan-shaped (i.e., narrower close to the probe surface, while wider at depth). In contrast, ultrasound videos and images that use linear transducers are usually rectangular in shape. Thus, harmonizing images acquired by convex and linear transducers requires the conversion of fan-shaped images to rectangular images. Therefore, various automatic built-in conversion techniques in the scanner, as well as external user-defined interpolation techniques [51], are typically used for this conversion task, and ultrasound-based COVID-19 AI studies are not an exception [16].
2.3.2. Image Resizing
Image resizing is the most common image pre-processing technique used for AI model training. Typically, ultrasound images come with various resolutions in terms of pixel count. On the other hand, AI models, especially deep learning models, typically require all input images to be of equal dimension. In addition, the larger input image dimension and the number of channels cause a higher computational overhead in the AI model optimization process. Therefore, AI studies often resize input images to a widely used common dimension across datasets. Most of the reviewed articles in this paper, for example, [37,49,50,52,53,54,55], etc., also used the common image dimension of 224×224 pixels as well-known computer vision deep learning models are typically designed to intake images of 224×224 pixels. However, other image dimensions are also found for ultrasound COVID-19 studies. For example, Karar et al. [56] resized all ultrasound images to 28×28 pixels to avoid a higher computational overhead. In addition, Mateu et al. [57], Durrani et al. [35], Muhammad and Hossain [58], and Gare et al. [15] resized their ultrasound images to 254×254, 806×550, 512×512, and 624×464 pixels, respectively.
2.3.3. Intensity Normalization
Intensity normalization is another common image pre-processing technique used in AI studies. This process ensures a common intensity range across images and datasets. In most cases, all image data are converted to a common intensity range of [0, 1], or [0, 255] [55], followed by mean subtraction and division by standard deviation [37,43,45,58,59].
2.3.4. Image Augmentation
Image augmentation is a widely used technique in AI studies, which is used to increase the number of training data, as well as increase the variation and diversity in the appearance of an image. one of the most prevalent steps that have been executed in most of the studies. Various conventional (as in Hussain et al. [60]) and learning-based data augmentation [61] techniques are present in the literature. Conventional image augmentation techniques such as random rotation, horizontal and vertical flipping, histogram equalization, random image shifting, zooming in and out, and/or a combination of these operations, etc., are more prevalent in AI studies, and articles in this review (e.g., Born et al. [12], Gare et al. [15], Roy et al. [20], Arntfield et al. [38], La Salvia et al. [42], Nabalamba [49], Rojas-Azabache et al. [50], Muhammad and Hossain [58], Adedigba and Adeshina [59]) mostly adopted this type of augmentation.
2.3.5. Other Image Processing Techniques
Apart from the common image pre-processing techniques discussed above, there are other processes that are often used in ultrasound AI studies. Ultrasound images are known to be a noisy modality [62]. Therefore, ultrasound-based studies often use noise reduction filters for pre-processing of images [18], such as circular averaging filter [63], median filter [64], non-linear diffusion filter [65], contrast-limited adaptive histogram equalization (CLAHE) [66], etc.
Ebadi et al. [34] performed several pre-processing operations to make resulting ultrasound images in COVIDx-US2 dataset easily usable to AI models. They cropped video frames into rectangular windows to remove the background or visible text from the image periphery. Any video frame with a moving pointer on it was also ignored when frames were extracted to use as images.
3. AI in Ultrasound COVID-2019 Studies
The accuracy of identifying COVID-19 infection and assessing its severity is based primarily on the expertise of clinicians, which is often difficult and time-consuming. To overcome this limitation, AI approaches have been widely used in recent years. AI approaches used in COVID-19 ultrasound studies can be categorized into conventional machine learning and deep learning approaches. Conventional machine learning approaches (e.g., support vector machine (SVM), linear regression, etc.) typically require hand-engineering of features, which are often difficult to define optimally [60]. Overcoming this limitation, deep learning using convolutional neural networks (CNN) has exploded in popularity throughout the last decade. There are various CNN architectures, which have been widely used on natural image and medical image-based classification and segmentation tasks. However, medical imaging data are often very difficult to collect, which results in a small training data cohort. To overcome this limitation, deep learning on medical imaging often leverages the transfer learning strategy, where the deep model is pre-trained on a much larger natural image dataset and then finetuned on the smaller medical data. This transfer learning strategy is also used in many articles (for example, Nabalamba [49], Rojas-Azabache et al. [50], Diaz-Escobar et al. [67], Al-Jumaili et al. [68], Barros et al. [69]) we reviewed in this study. In addition, many studies in this review (for example, Born et al. [12], Diaz-Escobar et al. [67]) used cross-validation techniques to avoid overfitting.
3.1. AI Models
In Table 3, we list the articles reviewed in this study and the corresponding AI methods used by those articles. We also mark in the table whether a study used conventional machine learning or deep learning or both. We see in the table that only two studies used conventional machine learning approaches (see rows 12 and 40 of Table 3) approaches and two studies combined conventional machine learning and deep learning (see rows 2 and 14 of Table 3). Except for these two studies, all other studies we reviewed used deep learning approaches. This tendency to prefer deep learning approaches over conventional machine learning approaches is motivated by the fact that deep learning models are capable of learning optimal feature representation by themselves without requiring manual intervention and the availability of more complex and powerful computation facilities. In Figure 4, we organized all the reviewed articles in terms of the type of AI model and configuration. We also describe different types of AI models, used by state-of-the-art US COVID-19 studies in the following sections.
3.1.1. Convolutional Neural Networks (CNN)
SqueezeNet, MobileNetV2, VGG-16, VGG-19, ResNet-18, ResNet-50, ResNet-152V2, DenseNet-201, InceptionV3, GoogleNet, NasNetMobile: CNNs are deep learning models specifically designed for image processing tasks. They consist of convolutional layers that extract features from input images and pooling layers that downsample the feature maps. These models typically include building blocks such as convolutional filters, activation functions (e.g., ReLU), pooling layers (e.g., MaxPooling), and fully connected layers for classification. Convolution layers apply a set of learnable filters to the input data. Each filter performs a convolution operation, which involves sliding across the input and computing dot products with local regions. This process helps extract important visual features, such as edges, textures, and patterns. Pooling layers, on the other hand, downsample the spatial dimensions of the feature maps generated by convolutional layers. They reduce the computational complexity and extract the most important information by summarizing groups of values in the feature maps. The most common type of pooling is max pooling, which selects the maximum value within each pooling region. Furthermore, fully connected layers connect every neuron from the previous layer to the subsequent layer, similar to traditional neural networks. Fully connected layers are responsible for the final classification or regression task, combining the extracted features to make predictions. Most of the articles we reviewed in this study used different types of CNNs, for example, SqueezeNet [59], MobileNetV2 [59], VGG-16 [12,49,74], VGG-19 [49,66], ResNet-18 [37,42,68], ResNet-50 [42,68], ResNet-152V2 [66], DenseNet-201 [66], InceptionV3 [73], GoogleNet [68], and NasNetMobile [66,68].
3.1.2. Recurrent Neural Networks (RNN)
RNNs are a type of neural network that can process sequential data by capturing temporal dependencies. They are commonly used for tasks involving sequential inputs or outputs, such as natural language processing and time series analysis. RNNs have recurrent connections that allow information to flow from one time step to the next. This enables the network to maintain a memory of previous inputs and utilize that information to make predictions or analyze the current input. At each time step, an RNN produces an output based on the current input and the hidden state from the previous time step. The hidden state serves as the network’s memory, storing information about previous inputs. It is updated and passed along to the next time step, allowing the network to learn and capture long-term dependencies in the sequence. RNNs can be “unfolded” in time, creating a series of interconnected layers that correspond to each time step. This unfolding helps visualize the flow of information through the network and enables the application of backpropagation through time, a training algorithm that adjusts the network’s weights based on the sequence of inputs and desired outputs. One of the articles we reviewed in this study used RNN [73].
3.1.3. COVID-Net
COVID-Net US, COVID-Net US-X: These architectures are specifically developed for the detection and diagnosis of COVID-19 from medical imaging, particularly chest X-ray images. COVID-Net US is a CNN architecture designed for the classification of chest X-ray images to detect COVID-19 cases. It has been trained on a large dataset of X-ray images and is capable of distinguishing COVID-19 from other respiratory conditions. The architecture of COVID-Net US includes convolutional layers for feature extraction, pooling layers for downsampling, and fully connected layers for classification. COVID-Net US-X is an extended version of COVID-Net US with improved performance and capabilities. It incorporates advancements such as additional layers, refined architecture, or enhanced training techniques to enhance the accuracy and reliability of COVID-19 detection from chest X-ray images. Two articles we reviewed in this study used COVID-Net US [77] and COVID-Net US-X [79].
MiniCOVIDNet: It is a compact and efficient neural network architecture designed for COVID-19 detection from chest X-ray images. It is specifically developed to provide a smaller model that can be deployed on resource-constrained devices or in scenarios where computational efficiency is important. The architecture of MiniCOVIDNet typically includes convolutional layers, pooling layers, and fully connected layers, aiming to accurately classify X-ray images as COVID-19 positive or negative while minimizing computational requirements. One of the articles we reviewed in this study used MiniCOVIDNet [72].
3.1.4. Long Short-Term Memory (LSTM)
LSTM is a type of RNN architecture that addresses the vanishing gradient problem of traditional RNNs and is capable of capturing long-term dependencies in sequential data. LSTMs are widely used in various tasks involving sequential data, such as natural language processing, speech recognition, and time series analysis. The key feature of LSTM networks is their memory cell, which allows them to retain information over long sequences and selectively forget or update that information. LSTMs achieve this through a set of gates, including an input gate, a forget gate, and an output gate. These gates regulate the flow of information and enable the LSTM to remember or forget specific information based on the context. One of the articles we reviewed in this study used LSTM [18].
Xception-LSTM: Xception-LSTM refers to a specific model architecture that combines the Xception CNN with an LSTM layer. Xception is a deep CNN architecture that was proposed as an extension of the Inception architecture. It introduces a novel concept called "depthwise separable convolutions" to reduce the number of parameters and computations required by traditional convolutions. Another article we reviewed in this study used Xception-LSTM [69].
3.1.5. Hidden Markov Model (HMM)
HMM and Viterbi Algorithm are both fundamental concepts in the field of probabilistic modeling and sequential data analysis. One of the articles we reviewed in this study used both HMM and Viterbi Algorithm [16].
Hidden Markov Model: An HMM is a statistical model that represents a system with unobservable (hidden) states and observable outputs. It is a generative model that assumes the underlying system can be modeled as a Markov process, where the current state depends only on the previous state. However, the actual state is not directly observable, and instead, it emits observable symbols or outputs. HMMs have been widely used in various applications such as speech recognition, natural language processing, bioinformatics, and pattern recognition.
Viterbi Algorithm: The Viterbi Algorithm, on the other hand, is an efficient dynamic programming algorithm used to find the most likely sequence of hidden states in a Hidden Markov Model. Given a sequence of observations, the Viterbi Algorithm computes the optimal sequence of hidden states that maximizes the probability of the observations. It takes into account both the transition probabilities between states and the emission probabilities of observations from the states. The algorithm iteratively computes the most likely path by considering the accumulated probabilities at each time step, resulting in the most probable sequence of hidden states.
3.1.6. Support Vector Machine (SVM)
SVM is a popular supervised machine learning algorithm used for classification and regression tasks. SVM is known for its ability to handle both linear and non-linear data by finding an optimal hyperplane that separates different classes or predicts the continuous target variable. In the case of classification, SVM aims to find the best decision boundary that maximally separates different classes in the input feature space. This decision boundary is determined by a subset of training samples called support vectors. SVM works by mapping the input data into a higher-dimensional feature space using a kernel function, which allows the algorithm to find a hyperplane that effectively separates the classes. The choice of the kernel function, such as linear, polynomial, or radial basis function (RBF), affects the SVM’s ability to handle complex patterns and non-linear relationships. In the case of regression, SVM aims to find a hyperplane that best fits the data while minimizing the error between the predicted and actual target values. The SVM regression algorithm aims to find a balance between fitting the data closely and controlling the complexity of the model to avoid overfitting. Several articles we reviewed in this study used SVM [16,40,43,68].
3.1.7. Decision Tree
A decision tree is a supervised machine-learning algorithm that is commonly used for classification and regression tasks. It is a flowchart-like structure where internal nodes represent feature tests, branches represent the outcomes of those tests, and leaf nodes represent the predicted class or value. The decision tree algorithm recursively splits the data based on different features to create a tree-like model that can make predictions. At each internal node, a decision is made based on the values of a particular feature, and the data is split into subsets accordingly. This splitting process continues until a stopping criterion is met, such as reaching a maximum tree depth or a minimum number of samples at a node. During training, the decision tree algorithm determines the optimal splits by evaluating different feature and split point combinations based on certain criteria, such as Gini impurity or information gain. The goal is to create splits that result in homogeneous subsets with respect to the target variable. Once the decision tree is trained, it can be used to make predictions by traversing down the tree based on the feature values of an unseen sample. The path followed through the tree leads to a leaf node, which provides the predicted class for classification tasks or the predicted value for regression tasks. Decision trees are popular due to their interpretability and simplicity. They can handle both categorical and numerical features and can capture non-linear relationships between features and the target variable. However, decision trees are prone to overfitting, especially when the tree becomes too complex. Techniques like pruning and ensemble methods, such as random forests, are often used to mitigate overfitting and improve the performance of decision trees. One of the articles we reviewed in this study used MiniCOVIDNet [40].
3.1.8. Generative Adversarial Networks (GAN)
GAN is a class of machine learning models that consists of two neural networks, namely the generator and the discriminator, which are trained together in a competitive setting. The generator network takes random noise as input and generates synthetic samples, such as images, based on that noise. The objective of the generator is to generate samples that resemble real data as closely as possible. On the other hand, the discriminator network takes both real samples from the dataset and synthetic samples from the generator as input and aims to classify them correctly as real or fake. The discriminator’s objective is to distinguish between real and generated samples accurately. During training, the generator and discriminator are trained in alternating steps. The generator tries to fool the discriminator by generating realistic samples, while the discriminator aims to improve its ability to distinguish real from fake samples. This back-and-forth training process creates a competitive dynamic, where the generator improves its ability to generate realistic samples, and the discriminator becomes more adept at discriminating between real and fake samples.
AC-GAN: Auxiliary Classifier GAN (AC-GAN) is an extension of the GAN framework that includes an auxiliary classifier in addition to the discriminator. The auxiliary classifier is a separate network that is trained to predict additional class labels or attributes associated with the generated samples. This helps in controlling the generated samples to have specific attributes or belong to specific classes. The addition of the auxiliary classifier in AC-GAN allows for more control over the generated samples and enables the generation of samples conditioned on specific attributes or classes. It has been used in various applications, including image synthesis, text-to-image generation, and image-to-image translation, where the generation process can be guided by specific attributes or class labels. One of the articles we reviewed in this study used a semi-supervised GAN and AC-GAN [56].
3.1.9. Spatial Transformer Network (STN)
STN is a type of neural network module that can be integrated into deep learning architectures to enable the spatial transformation of input data. The purpose of the STN network is to learn spatial transformations, such as rotations, translations, scaling, and cropping, that can be applied to input images or feature maps. The key idea behind the STN network is to introduce a spatial transformer module that can learn to automatically align and transform input data to improve the overall performance of the model. The module consists of three main components- (i) Localization Network: The localization network takes the input data and learns to predict the parameters of the spatial transformation. It typically consists of convolutional and fully connected layers that extract features and output the transformation parameters, such as translation, rotation, and scaling. (ii) Grid Generator: The grid generator takes the predicted transformation parameters from the localization network and generates a set of sampling grid points. These grid points define how the input data should be transformed to align with the desired output. (iii) Sampler: The sampler takes the input data and the generated grid points and performs the spatial transformation. It applies interpolation techniques, such as bilinear interpolation, to sample the input data at the grid points and produce the transformed output. By incorporating the STN network into a larger neural network architecture, the model can learn to automatically adjust and align the input data to improve performance. The STN module can be trained end-to-end with the rest of the network using backpropagation, allowing the model to learn the appropriate spatial transformations for the given task. Several articles we reviewed in this study used Transformer or STN [20,44,55].
Reg-STN: Reg-STN stands for Regression Spatial Transformer Network. It is an extension of the STN that incorporates regression-based localization instead of classification-based localization. One of the articles we reviewed in this study used Reg-STN [35].
3.1.10. UNet
UNet is a convolutional neural network architecture that was specifically designed for biomedical image segmentation but has since been applied to various other domains. It consists of an encoder-decoder structure with skip connections. The encoder part gradually reduces the spatial dimensions while capturing hierarchical features, and the decoder part upsamples the feature maps and recovers the spatial resolution. The skip connections help in preserving fine-grained details by concatenating feature maps from the encoder to the corresponding decoder layers. UNet has been widely used for tasks such as medical image segmentation, cell segmentation, and more. Several articles we reviewed in this study used UNet[15,20,21,44,45].
UNet++: UNet++ is an extension of the UNet architecture that aims to further enhance the segmentation performance. It introduces a nested and densely connected skip pathway structure. In UNet++, each encoder block is connected to all corresponding decoder blocks through skip connections, creating a more extensive and interconnected network. This architecture allows for better information flow and feature reuse across different scales, leading to improved segmentation accuracy and boundary delineation. One of the articles we reviewed in this study used Reg-UNet++ [20].
LUSNet: LUSNet (Lung Ultrasound Net) is a specific implementation of the UNet-like network architecture designed for lung ultrasound image segmentation. It incorporates the UNet framework with modifications tailored for lung ultrasound images. LUSNet leverages the inherent characteristics of lung ultrasound images, such as the presence of artifacts, pleural lines, and specific structures like A-lines and B-lines, to perform accurate segmentation. By adopting the UNet architecture to the unique properties of lung ultrasound images, LUSNet aims to provide reliable segmentation for various lung-related applications, including disease diagnosis and monitoring. One of the articles we reviewed in this study used LUSNet [36].
3.1.11. Few-shot Learning
Few-shot learning is a machine learning paradigm that addresses the problem of learning from limited labeled data. In traditional machine learning approaches, a large amount of labeled data is typically required to train a model effectively. However, in real-world scenarios, collecting and annotating large datasets can be time-consuming, expensive, or impractical. Few-shot learning aims to overcome this limitation by enabling models to learn new concepts or tasks with only a few labeled examples. It focuses on the ability of a model to generalize and adapt to new classes or tasks based on a small amount of labeled data, often referred to as the “support set.” The key idea in few-shot learning is to leverage prior knowledge or information learned from related tasks or classes to facilitate learning on new tasks or classes with limited examples. This is achieved through various techniques such as meta-learning, where the model learns to quickly adapt to new tasks based on its previous experience, or by using generative models to synthesize additional training examples. One of the articles we reviewed in this study used Few-shot learning [54].
3.1.12. Transfer Learning
Transfer learning is a machine learning technique that involves leveraging knowledge learned from one task or domain to improve performance on another related task or domain. In transfer learning, a pre-trained model that has been trained on a large dataset and a related task is used as a starting point for a new task. The idea is that the pre-trained model has learned general features and representations that can be useful for the new task, even if the specific classes or labels are different. By using transfer learning, the model can benefit from the knowledge and representations learned from the large pre-training dataset, which can save training time and improve performance, especially when the target dataset is limited or the target task is challenging.
Reverse Transfer Learning: Reverse transfer learning, on the other hand, is a less commonly used term and refers to the process of transferring knowledge or models from a target domain or task back to the source domain or task. It involves utilizing the information or insights gained during the target task and applying them to improve the performance of the original source model or task. In reverse transfer learning, the experience and knowledge gained from the target domain or task are used to enhance the performance or update the source model. This can be particularly useful when the target task provides new insights or data that can benefit the original source task or when there is a feedback loop between the target and source tasks. One of the articles we reviewed in this study used Reverse transfer learning [15].
3.1.13. Other Architectures
Saab transform-based successive subspace learning model: It refers to a specific approach for feature extraction and dimensionality reduction in image processing and computer vision tasks. It is based on a series of transformations called the Successive Subspace Learning (SSL) framework, with the Saab transform being one of the key components. The Saab transform is a non-linear transformation that aims to capture discriminative and compact representations of image features. It operates on local image patches and applies a series of operations, including patch-wise mean removal, PCA (Principal Component Analysis), and non-linear transformation using sigmoid functions. These operations are performed successively to obtain a hierarchical representation of the input image.
Non-local channel attention ResNet: It refers to a variant or modification of the ResNet architecture that incorporates non-local channel attention mechanisms. It aims to enhance the representation power of ResNet models by introducing non-local operations that capture long-range dependencies across channels. In the context of the “Non-local channel attention ResNet,” the term “non-local” refers to the inclusion of non-local operations within the ResNet architecture. Non-local operations are designed to model relationships between spatial or temporal positions in an image or sequence, capturing dependencies that extend beyond local regions. The “channel attention” component refers to the specific attention mechanism applied to the channels or feature maps within the ResNet. Attention mechanisms help the network focus on relevant information by assigning importance weights to different channels or feature maps. This allows the model to selectively emphasize or suppress certain channels during feature extraction, enhancing its ability to capture important patterns or details. One of the articles we reviewed in this study used Non-local channel attention ResNet [41].
The Multi-symptom multi-label (MSML) network: MSML network refers to a neural network architecture designed to address the problem of multi-label classification in the context of medical diagnosis. In medical diagnosis, patients may exhibit multiple symptoms simultaneously, and it is important to accurately predict the presence or absence of various medical conditions or diseases based on these symptoms. The MSML network is specifically designed to handle this scenario by taking into account multiple symptoms as inputs and predicting multiple labels as outputs. It is a type of deep learning architecture that combines techniques from multi-label classification and deep neural networks. The MSML network typically consists of multiple layers of interconnected neurons, including input layers, hidden layers, and output layers. The input layer receives the symptom information as input features, which are then processed through the hidden layers to extract relevant patterns and representations. Finally, the output layer produces predictions for multiple medical conditions or diseases associated with the given symptoms. One of the articles we reviewed in this study used MSML network [48].
Model Genesis: “Model Genesis” refers to a specific deep learning architecture designed for medical image analysis tasks. It is an automated framework that aims to generate high-quality medical image segmentation models using a combination of deep convolutional neural networks (CNNs) and genetic algorithms. The concept behind Model Genesis is to leverage the power of genetic algorithms to automatically search and optimize the architecture and hyperparameters of a CNN for a given medical image segmentation task. The genetic algorithm explores a population of potential CNN architectures, evaluates their performance on a specific objective function (such as accuracy or Dice coefficient), and evolves the population over successive generations to improve the model’s performance. The genetic algorithm in Model Genesis operates by using principles inspired by natural selection and evolution. It applies genetic operators such as mutation, crossover, and selection to create new CNN architectures from existing ones, gradually improving their fitness and convergence toward an optimal solution. By integrating genetic algorithms into the architecture search process, Model Genesis aims to automate the design of CNN models for medical image segmentation tasks, reducing the need for manual architecture design and hyperparameter tuning. This approach can potentially save time and effort for researchers and practitioners in the medical imaging field, allowing them to focus more on the analysis and interpretation of medical images. One of the articles we reviewed in this study used Model Genesis [20].
Kinetics-I3D: Kinetics-I3D refers to a deep learning model that combines the concept of the Inflated 3D CNN (I3D) with the Kinetics dataset. The I3D model is an extension of the popular 2D CNN architecture, adapted to handle spatiotemporal information in videos. It achieves this by performing 3D convolutions, which consider both spatial and temporal dimensions of video frames. The Kinetics dataset, on the other hand, is a large-scale video dataset designed for action recognition. It contains millions of labeled video clips from a wide range of human actions and activities. Kinetics-I3D takes advantage of the Kinetics dataset to pre-train the I3D model on a large amount of video data. This pretraining allows the model to learn rich spatiotemporal representations from the videos, capturing motion and temporal dependencies. One of the articles we reviewed in this study used Kinetics-I3D [52].
3.2. Loss Functions
A classification model can be defined as , where the AI model is parameterized by a set of parameters and an input image x is assigned to the most probable class . Given a training set of ultrasound images and their ground truth class , training a classification model consists of finding the model parameters that minimize loss , such as:
Therefore, the choice of the appropriate loss function is important, and we briefly discuss the loss functions used in the articles reviewed in this study.
3.2.1. Cross-entropy Loss
Training an AI model on a binary decision-making task (e.g., COVID-19 vs. CAP, or COVID-19 vs. healthy, etc.) usually utilizes binary cross-entropy or simply cross-entropy loss defined as:
The cross-entropy loss appears in the majority of ultrasound COVID-19 AI studies (e.g., Born et al. [12,13], Gare et al. [15], Che et al. [17], Frank et al. [19], Perera et al. [55], Diaz-Escobar et al. [67]).
3.2.2. Categorical Cross-entropy
Categorical cross-entropy works on multiclass (more than two classes; e.g., COVID-19 vs. CAP vs. Healthy) classification problems. This loss is typically used in an AI model when the model must select one or more categories among numerous possible categories/classes. This loss can be defined as:
Like cross-entropy loss, categorical cross-entropy loss also appears in many ultrasound COVID-19 AI studies (e.g., Karar et al. [53], Sadik et al. [66], Barros et al. [69]).
3.2.3. L1 Loss
L1 loss, also known as mean absolute loss, is typically used when an AI model is tasked to predict a continuous value (e.g., the distance between two landmarks, optimal location for lung scanning using ultrasound, etc.). It is defined as:
where and are the ground truth and predicted continuous values, respectively. Al-Zogbi et al. [70] used this loss function to train their deep model to predict landmarks for optimal ultrasound scanning.
3.2.4. Focal Loss
The focal loss is a dynamically scaled cross-entropy loss and is used when there is a class in the training data. Focal loss incorporates a modulating term in the conventional cross-entropy loss so that it can emphasize learning from difficult data samples that lead to misclassification more often. This loss is defined as:
where controls the weight of different samples and transforms Eq. 6 into a binary cross-entropy loss. Awasthi et al. [72] used focal loss in their ultrasound-based COVID-19 study.
3.2.5. Soft Ordinal (SORD) Loss
When output classes are independent of each other, their relative order in the loss calculation during deep model training does not matter. This scenario allows using one-hot encoding, i.e., setting all wrong classes to be infinitely far from the true class. However, there exists a soft order among classes in an ordinal regression scenario, where certain categories are more correct than others with respect to the true label Diaz and Marathe [14] (i.e., a true class is no longer infinitely far from false classes, resulting in a continuity among classes). For these continuously related classes, Roy et al. [20] introduced a modified cross-entropy, called soft ordinal (SORD) loss, defined as:
where is the set of possible soft-valued classes, n is a possible ground truth soft value, is a user-defined distance (e.g., weighted square distance) between scores/levels, is the deep model, and is the i-th input data.
3.3. Evaluation Criteria
The effectiveness of a predictive model is measured by an evaluation metric. This often entails building a model on a dataset, testing it on a holdout dataset that was not used during training, and comparing the predictions to the holdout dataset’s expected values. The metrics compare the actual class label to the predicted class label for the classification problems. The different studies reviewed in this article used different types of evaluation criteria, which we briefly discuss below. We also clarify a few key acronyms that are typically used to define different evaluation criteria here.
- True Positive (TP): A result that is positive as both the actual value and expected value.
- True Negative (TN): A result that is negative as both the actual value and expected value.
- False Positive (FP): A false positive occurs when a projected outcome is indicated as being positive when it is actually negative.
- False Negative (FN): A false negative occurs when a projected outcome is indicated as being negative when it is actually positive.
3.3.1. Precision
The ratio of accurate positive predictions and all positive predictions is known as precision. Precision is the proportion of true positives to all predicted positives, which is defined as:
3.3.2. Recall
Recall, also known as Sensitivity, estimates the ratio of the number of predicted positive samples and the actual number of positive samples, which is defined as:
3.3.3. Specificity
Specificity is the complement of Sensitivity, which estimates the ratio of the number of predicted negative samples and the actual number of negative samples. It is defined as:
3.3.4. Accuracy
The proportion of accurately predicted samples among all predictions is known as accuracy, which is defined as:
3.3.5. F1–score
The weighted average of precision and recall is the F1-score. This metric is generally more beneficial than accuracy, especially if there is an uneven class distribution. F1-score is defined as:
3.3.6. Intersection over Union (IoU)
IoU is typically used in segmentation accuracy estimation, which is the ratio of overlap between the bounding box around a predicted object and the bounding box around the ground truth object mask. It can be defined as:
3.3.7. Sørensen–Dice coefficient
Sørensen–Dice coefficient, or simply Dice, is another common metric used in segmentation accuracy estimation, which is defined as:
4. Studies using POCUS Dataset
We discussed the POCUS dataset [12] in Section 2.1, which can be used in making breakthroughs in the diagnosis, monitoring, and reporting of COVID-19 pneumonia in patients. This dataset contains COVID-19 (35%), bacterial pneumonia (28%), viral pneumonia (2%), and healthy (35%) classes.
4.1. Studies
In Table 4, we summarize studies that used the POCUS dataset to develop and evaluate AI methods. Al-Jumaili et al. [68] utilized a set of pre-trained CNN models, namely ResNet-18, ResNet-50, GoogleNet, and NASNet-Mobile, to extract the features from the images. These features are then fed to an SVM classifier to classify the images into COVID-19, CAP, and healthy classes. A regression task was performed by Al-Zogbi et al. [70], who employed DenseNet to approximate the position of the ultrasound probe in the desired scanning areas of the torso. Almeida et al. [71] investigated a lightweight neural network, MobileNets, in the context of computer-aided diagnostics and classified ultrasound videos among abnormal, B-lines, mild B-lines, severe B-lines, consolidations, and pleural thickening classes. Awasthi et al. [72] also focused on lightweight networks that can operate on mobile or embedded devices to enable rapid bedside detection without additional infrastructure. Their method classified ultrasound images into COVID-19, CAP, and healthy classes. Barros et al. [69] proposed a CNN-LSTM hybrid model for the classification of lung ultrasound videos among COVID-19, bacterial pneumonia, and healthy classes. The extraction of the spatial feature was performed by CNNs, while the time dependency was established using the LSTM module. Born et al. published three consecutive articles [12,13,74] using POCOVID-Net, VGG-16, and Model-genesis, respectively, to classify lung ultrasound images into COVID-19, CAP, and healthy classes. Several pre-trained neural networks such as VGG-19, InceptionV3, Xception, and RestNet-50 have been fine-tuned on the lung ultrasound image by Diaz-Escobar et al. [67] to detect COVID-19 in the lung ultrasound test data. Gare et al. [15] used reverse transfer learning in a U-Net, where weights were pre-trained for segmentation and then transferred for the COVID-19, CAP, and Healthy ultrasound image classification task. In order to address the need for a less complex, power efficient, and less expensive solution to screen lung ultrasound images and monitor lung status, Hou et al. [75] introduced a Saab transform-based subspace learning model to find the A-line, B-line, and consolidation in lung ultrasound data. Karar et al. [53] introduced a lightweight deep model, COVID-LWNet, to make an efficient CNN-based system for classifying lung ultrasound images into COVID-19, bacterial pneumonia, and healthy classes. In addition, Karar et al. [56] proposed a generative adversarial network (GAN) to perform the same task on ultrasound images. Few-shot learning is a machine learning framework, where a machine learning model is trained with supervision using a few training samples. Karnes et al. [54] used the few-shot learning on the POCUS dataset and classified test images into COVID-19, CAP, and healthy classes. A few other approaches also used state-of-the-art CNNs [58,66] or transformers [55] to classify lung ultrasound images into COVID-19, CAP, and healthy classes.
4.2. Evaluation
Studies using POCUS dataset reported impressive results across various metrics and methodologies. For instance, Al-Jumaili et al. [68] achieved accuracy, precision, and F1-score of above 99%. Awasthi et al. [72] developed a power and memory-efficient network that attained an impressive highest accuracy of 83.2%. Among pre-trained models, Diaz-Escobar et al. [67] found that the InceptionV3 model had the highest accuracy of 89.1% and ROC-AUC of 97.1%. In semantic segmentation, Gare et al. [15] reported high scores for various metrics, including mIoU (0.957), accuracy (0.849), precision (0.885), recall (0.925), and F1-score (0.897). Saab transform-based successive subspace learning model was reported to have an accuracy of 0.96 by Hou et al. [75]. Additionally, modified AC-GAN (accuracy: 99.45%) outperformed semi-supervised GAN (accuracy: 99%) in a study by Karar et al. [56], while MnasNet achieved the best accuracy of 99% among six pre-trained networks. Muhammad and Hossain [58] obtained high scores for accuracy, precision, and recall (91.8%, 92.5%, and 93.2%, respectively) with a fusion-based less complex CNN architecture. Real-time mass COVID-19 testing by Perera et al. [55] resulted in over 90% accuracy, while spectral mask enhancement (SpecMEn) improved the accuracy score of DenseNet-201 from 89.5% to 90.4% in a study by [66].
5. Studies using ICLUS-DB Dataset
We discussed the Italian COVID-19 Lung Ultrasound dataset (ICLUS) in Section 2.1, which can also be used in making breakthroughs in the diagnosis, monitoring, and reporting of COVID-19 pneumonia in patients. This resource may enable AI in the identification of the disease’s progress, rate, and response to treatment, facilitating more effective and personalized patient care. This dataset contains lung ultrasound data with different COVID-19 severity scores, defined as score 0: Continuous A-line (34% of the total data), score 1: alteration in A-line (24% of the total data), score 2: small consolidation (32% of the total data), and score 3: large consolidation (10% of the total data). The following table (Table 5) summarizes the literature on the detection of COVID-19 through the use of the ICLUS-DB dataset.
5.1. Studies
In Table 5, we summarize studies that used the ICLUS-DB dataset [24] to develop and evaluate AI methods. Carrer et al. [16] proposed an automatic and unsupervised method to locate the pleural line using the hidden Markov model (HMM) and Viterbi Algorithm (VA). Afterward, the localized pleural line is used in a supervised support vector machine (SVM) for classifying the lung ultrasound image into COVID-19 severity scores 0-3. Che et al. [17] extracted local phase and radial symmetry features from lung ultrasound images, which were then fed to a multi-scale residual CNN to classify the image between COVID-19 and non-COVID classes. Dastider et al. [18] incorporated a long-short-term-memory (LSTM) module in DenseNet-201 to predict the COVID severity between 0 and 3 in lung ultrasound images. Frank et al. [19] incorporated domain-based knowledge such as anatomical features, and pleural and vertical artifacts in conventional CNNs (i.e., ResNet-18, ResNet-101, VGG-16, MobileNetV2, MobileNetV3, and DeepLabV3++) to detect the severity of COVID-19 in lung ultrasound images. Roy et al. [20] trained several benchmark CNN models such as U-Net, U-Net++, DeepLabV3, and model genesis, incorporating spatial transformer networks (STNs) to simultaneously predict COVID-19 severity scores as well as localize pathological artifacts in a weakly-supervised way in the lung ultrasound images. In a unique study, [76] evaluated the performance of AI deep models in COVID-19 severity scoring by varying the image resolution and gray-level intensity of lung ultrasound images.
5.2. Evaluation
Studies that used the ICLUS-DB, as summarized in Table 5, reported impressive results across various metrics. Carrer et al. [16] reported an accuracy of 88% and 94% for lung ultrasound images acquired with the convex and linear probes, respectively, when they used SVM in detecting pleural line alterations due to COVID-19. Che et al. [17] reported an accuracy of 95.11% and an F1-score of 96.70% in predicting the COVID-19 severity scores in lung ultrasound. Other studies mostly predicted the COVID-19 severity scores [0, 3] using the ICLUS-DB lung ultrasound dataset as summarized in Table 5. For example, accuracy in severity scoring is reported to be 67.7-79.1%, 93%, 96%, and 82.3% by Dastider et al. [18], Frank et al. [19], Roy et al. [20], and Khan et al. [76].
6. Studies using COVIDx-US Dataset
The COVIDx-US is another large public dataset (discussed in Section 2.1) that has been thoroughly reviewed, analyzed, and validated with the aim of developing and assessing AI models and algorithms [34]. Table 6 summarizes existing deep learning approaches that used this dataset for COVID-19 identification and characterization in lung ultrasound images.
6.1. Studies
We summarize studies that used the COVIDx-US dataset to develop and evaluate AI methods in Table 6. Adedigba and Adeshina [59] used computation and memory efficient SqueezeNet and MobileNetV2 to classify lung ultrasound images in COVID-19, CAP, normal, and other classes. Using a hybrid network consisting of the InceptionV3 model to extract spatial information and recurrent neural network (RNN) for extracting temporal features, Azimi et al. [73] did binary classification of lung ultrasound images into COVID-19 and non-COVID classes. MacLean et al. [77] proposed a deep neural network, COVID-Net US, leveraging a generative synthesis process that finds an optimal macro-architecture design in classifying lung ultrasound images into COVID-19 and non-COVID classes. Furthermore, MacLean et al. [78] used ResNet to classify lung ultrasound images into one of the four lung ultrasound severity scores (i.e., 0, 1, 2, 3). Zeng et al. [79] proposed an improved COVID-Net US network, called COVID-Net US-X, that leveraged a projective transformation-based augmentation to transform linear probe data to better resemble convex probe data. This approach performed binary classification of lung ultrasound images into COVID-19 and non-COVID classes.
6.2. Evaluation
The COVIDx-US dataset was used to implement various models, whose performance is illustrated by various evaluation metrics in Table 6. The models implemented by Adedigba and Adeshina [59] achieved high levels of accuracy (99.74%), precision rate (99.58%), and recall (99.39%). Meanwhile, Azimi et al. [73]’s hybrid network attained an overall accuracy of 94.44% and learned to categorize COVID-19 as a binary classification problem. MacLean et al. [77]’s deep model achieved an area-under-the-curve (AUC) of over 0.98 while reducing architectural and computational complexity and inference times significantly. The ResNet implemented by MacLean et al. [78] achieved a total accuracy of 69.2% with varying sensitivity values for different classes. Among all the models, the MobileNet and SqueezeNet variations of CNN performed the best on this dataset, with Zeng et al. [79] achieving a gain of 5.1% in test accuracy and 13.6% in AUC.
7. Studies using Private Dataset
Several studies have utilized privately owned datasets, which are not publicly available as mentioned in Section 2.2. However, some of these datasets’ primary sources, such as hospitals, clinics, and online repositories, have overlapped with those of public data. Although some private dataset links could not be traced due to lack of availability in the papers, some can be accessed by sending a request for use (for example, Durrani et al. [35], Camacho et al. [39], Rojas-Azabache et al. [50]).
Table 7.
A summary of studies that used private datasets. ✗ indicates either absent or not discussed in the article.
Table 7.
A summary of studies that used private datasets. ✗ indicates either absent or not discussed in the article.
| Studies | AI | Loss | Results | Cross-validation | Augmentation/ | Prediction | Code |
|---|---|---|---|---|---|---|---|
| models | pre-processing | Classes | |||||
| Arntfield et al. [38] | Xception | Binary Cross Entropy | ROC-AUC: 0.978 | ✗ | Random zooming in/out by ≤10%, horizontal flipping, horizontal stretching/contracting by ≤20%, vertical stretching/contracting (≤5%), and bi-directional rotation by | Hydrostatic pulmonary edema (HPE), onn-COVID acute respiratory distress syndrome (ARDS), COVID-19 ARDS | Available |
| Chen et al. [40] | 2-layer NN, SVM, Decision Tree | ✗ | Accuracy: 87% | k=5 | Curve-to-linear conversion | Score 0: Normal, Score 1: Septal syndrome, Score 2: Interstitial-alveolar syndrome, Score 3: White lung syndrome | ✗ |
| Durrani et al. [35] | CNN, Reguralized STN (Reg-STN) | SORD | Accuracy: 89%, PR-AUC: 73% | k=10 | Replacing overlays, resizing to 806×550 pixels | Consolidation present, consolidation absent | ✗ |
| Ebadi et al. [52] | Kinetics-I3D | Focal loss | Accuracy: 90% Precision: 95% | k=5 | ✗ | A-line (normal), B-line, Consolidation and/or pleural effusion | ✗ |
| Huang et al. [41] | Non-local Channel Attention ResNet | Cross-entropy | Accuracy: 92.34%, F1-score: 92.05%, Precision: 91.96% Recall: 90.43%, | ✗ | Resizing to 300×300 pixels | Score 0: normal, Score 1: septal syndrome, Score 2: interstitial-alveolar syndrome, Score 3: white lung syndrome | Available |
| La Salvia et al. [42] | ResNet-18, ResNet-50 | Cross-entropy | F1-score: 98% | ✗ | Geometric, filtering, random centre cropping, and colour transformations | Severity Score: 0, 0*, 1, 1*, 2, 2*, 3 | ✗ |
| Liu et al. [48] | Multi-symptom multi-label (MSML) network | Cross-entropy | Accuracy: 100% (with 14.7% data) | ✗ | Random rotation (up to 10 degrees) and horizontal flips | A-line, B-line, Pleural lesion, Pleural effusion | ✗ |
| Mento et al. [44] | STN, U-Net, DeepLabV3+ | ✗ | Agreement between AI scoring and expert scoring 85.96% | ✗ | ✗ | Expert scores: 0, 1, 2, 3 | ✗ |
| Quentin Muller et al. [37] | ResNet-18 | Cross-entropy | Accuracy (Val): 100% | ✗ | Resizing to 349×256 | Ultrasound frames with (positive) and without (negative) clinical predictive value | ✗ |
| Nabalamba [49] | VGG-16, VGG-19, ResNet | Binary cross-entropy | Accuracy: 98%, Recall: 1, Precision: 96%, F1-score: 97.82%, ROC-AUC: 99.9% | ✗ | Width and height shifting, random zoom within 20%, brightness variations within [0.4, 1.3], rotation up to 10 degrees | COVID-19, Healthy | ✗ |
| Panicker et al. [36] | LUSNet (U-Net based CNN) | Categorical cross-entropy | Accuracy: 97%, Sensitivity: 93%, Specificity: 98% | k=5 | Generation of local phase and shadow back scatter product images | Classes: 1, 2, 3, 4, 5 | Available |
| Roshankhah et al. [45] | U-Net | Categorical cross-entropy | Accuracy: 95% | ✗ | Randomly cropping and rotating the frames | Severity Score: 0, 1, 2, 3 | ✗ |
| Wang et al. [43] | SVM | ✗ | ROC-AUC: 0.93, Sensitivity: 0.93, Specificity: 0.85 | ✗ | ✗ | Non-severe, severe | ✗ |
| Xue et al. [21] | UNet (with modality alignment contrastive learning of representation (MA-CLR)) | Dice, cross-entropy | Accuracy: 75% (4-level) 87.5% (binary) | ✗ | Affine transformations (translation, rotation, scaling, shearing), reflection, contrast change, Gaussian noise, and Gaussian filtering | Severity score: 0, 1, 2, 3 | ✗ |
7.1. Studies
Arntfield et al. [38] highlighted the need for collaborative research involving multi-center for the discrepancy in results between the model and people, which shows the presence of hidden biomarkers within ultrasound images. In addition, they trained Xception neural network to classify lung ultrasound images into hydrostatic pulmonary edema (HPE), non-COVID acute respiratory distress syndrome (ARDS), and COVID-19 ARDS. Chen et al. [40] employed a 2-layer NN to extract image features, which were subsequently used in an SVM and decision tree algorithm for predicting lung ultrasound scores between 0 to 3 (i.e., score 0: normal, score 1: septal syndrome, score 2: interstitial-alveolar syndrome, and score 3: white lung syndrome). Durrani et al. [35] used an autonomous deep learning-based technique to detect consolidation/collapses in lung ultrasound images. A CNN and Reg-STN-based model has been used with a SORD cross-entropy loss function. A fast and dependable interpretation of lung ultrasound images without preprocessing or frame-by-frame analysis was presented by Ebadi et al. [52]. They proposed a two-stream inflated 3D CNN, referred to as Kinetics-I3D, to detect A-line (normal), B-line, Consolidation and/or pleural effusion in lung ultrasound images. Huang et al. [41] proposed a non-local channel attention ResNet to facilitate extraction of the dependencies between distant pixels and stressing specific key channels. Their method classified lung ultrasound images into four scores (i.e., score 0: normal, score 1: septal syndrome, score 2: interstitial-alveolar syndrome, and score 3: white lung syndrome). La Salvia et al. [42] used ResNet-18 and ResNet-50 to perform a seven-way classification of lung ultrasound images. Classes include score 0: A-lines, score 0*: A-lines not defined, score 1: an irregular or damaged pleural line along with visible vertical artifacts, score 1*: pleural line not defined, score 2: broken pleural line with either small or broad consolidated areas with wide vertical artifacts below (white lung), score 2*: broken pleural line not defined, and score 3: dense and broadly visible white lung with or without larger consolidations. Liu et al. [48] proposed a novel multi-symptom multi-label (MSML) network incorporating a semi-supervised two-stream active learning strategy, which detected A-line, B-line, pleural lesion, and pleural effusion in lung ultrasound images. In a different type of study, Mento et al. [44] estimated the agreement of the COVID-19 severity scores predicted by deep models (i.e., STN, U-Net, and DeepLabV3+) to the expert scores. Quentin Muller et al. [37] used a pre-trained ResNet-18 to automate the selection of clinically meaningful and predictive image frames from lung ultrasound videos that have high clinical predictive value. Nabalamba [49] used three pre-trained deep learning models (i.e., VGG-16, VGG-19, and ResNet) to detect COVID-19 from lung ultrasound images. Panicker et al. [36] designed a U-Net for lung ultrasound image analysis, called LUSNet, which is trained to classify ultrasound images into five classes of increasing severity of regions. They have followed the rectification of the ultrasound images to make them agnostic to the type of probe employed and to restrict unwanted edge effects, particularly in the case of convex and sector probes. In a typical abnormal lung ultrasound image, B-line artifacts appear, which often evolve into white lung patterns in the more severe cases. Exploiting these anatomical changes, Roshankhah et al. [45] used the U-Net-based segmentation approach to automatically stage the progression of COVID-19. While most AI approaches for COVID-19 detection and analysis adopted deep learning techniques, Wang et al. [43] extracted hand-engineered features such as thickness and roughness of the pleural line, and the accumulated with an acoustic coefficient of B lines, which were subsequently used in an SVM to classify lung ultrasound images into severe and non-severe cases. Xue et al. [21] performed a comprehensive study using the features from lung ultrasound data and clinical information in supervised attention-based multiple instance learning (DSA-MIL) modules to classify lung ultrasound images into four severity grades.
7.2. Evaluation
Various metrics have been used to evaluate the performance of methods that used private datasets. Arntfield et al. [38] were able to distinguish between COVID-19 (AUC = 1.0), non-COVID (AUC = 0.934), and HPE (AUC = 1.0) with high AUCs, whereas Physicians’ performance for COVID-19, non-COVID, and HPE detection had AUCs of 0.697, 0.704, and 0.967, respectively. Camacho et al. [39] achieved high agreement between the expert and algorithm for detecting B-Lines (88.0%), consolidations (93.4%), and pleural effusion (99.7%), and moderate agreement for the individual video score (72.8%). Chen et al. [40] performed a comparison of performance by CNN, SVM, and Decision Tree models, where the CNN performed the best, achieving 87% accuracy over traditional machine learning models. In the study of Durrani et al. [35], the video-based supervised learning method outperformed a fully supervised frame-based method in terms of PR-AUC, with scores of 73.34 and 60.08, respectively. Using a classification model originally developed for recognizing human action, Ebadi et al. [52] achieved high accuracy (90%) and average precision (95%). Using a non-local channel attention ResNet, [41] achieved superior performance compared to conventional ResNet, VGG, and other networks, with an accuracy of 92.34% and F1-score of 92.05%. Liu et al. [48] reported 100% accuracy for regional classification by training only 14.7% of the data, with comparable performance in sensitivity (92.38%) and specificity (100%). Nabalamba [49] also achieved an accuracy of 98%, along with other high metrics (precision of 95.74, recall of 1.00, F1-score of 97.82%, and ROC-AUC of 99.99%) for the classification of patients at high risk of clinical deterioration and patients at low risk. Similarly, Mento et al. [44] showed a high percentage of agreement (85.96%) for the classification of patients at high risk of clinical deterioration and patients at low risk with that by expert radiologists. Quentin Muller et al. [37] employed a transfer learning-based approach that achieved high validation accuracy (99.74%) for data with varying brightness levels. Using deep learning approaches, higher accuracy of 97% and 95% are also reported in COVID-19 detection in ultrasound by Panicker et al. [36] and Roshankhah et al. [45], respectively. Wang et al. [43] on the other hand, used an SVM classifier that achieved a good binary classification performance between severe and non-severe cases (sensitivity = 0.93, specificity = 0.85, ROC-AUC = 0.93). By combining lung ultrasound data and clinical information in a multiple instance learning framework, Xue et al. [21] were able to categorize patients’ clinical severity into four groups with 75% accuracy and into severe/non-severe groups with 87.5% accuracy.
8. Discussion and Future Works
We began this survey with 874 initial search-yielded articles on the topic of COVID-19 detection using AI on ultrasound from google scholar. After several filtering phases as discussed in Section 1.5, we reviewed a total of 42 lung ultrasound studies that focused on COVID-19 detection or analysis using AI. However, we could not review an additional 14 papers that satisfied our inclusion criteria except that we could access that full-text due to not having institutional subscriptions to journals that were published. Nonetheless, some of the key observations that can be noted from this review are as follows:
8.1. COVID-19 Severity Assessment
Ultrasound can be helpful in COVID severity assessment in patients as supported by the studies in the survey [16,17,18,19,20]. COVID-19 primarily affects the respiratory system, causing pneumonia and acute respiratory distress syndrome (ARDS). Lung ultrasound can detect these lung abnormalities earlier than chest X-rays and provide detailed information on the extent and severity of lung involvement [80]. It can also help differentiate COVID-19 pneumonia from bacterial or viral pneumonia (i.e., CAP). Overall, ultrasound is a safe and non-invasive imaging modality that can provide valuable information for the assessment and management of COVID-19 in patients, especially pregnant women, and children. It can help detect early lung involvement, monitor disease progression, and guide clinical decision-making.
8.2. Data Partition for Benchmarking
Although numerous publicly available datasets are available, studies have reported varying degrees of quantitative accuracy in detecting, segmenting, and assessing the severity of COVID-19 independently. Without replicating the results of a particular study that used a publicly available ultrasound dataset, it is impossible to make a fair comparison of methodological performance. However, this issue of complexity can be resolved by partitioning a specific portion of a publicly available dataset for quantitative validation across studies. This benchmark dataset can then be used for model validation and quantitative accuracy comparison.
8.3. Public Sharing of Code
We found in this review that there are very few studies shared their AI model implementations publicly (e.g., [12,18,20,69,73]). However, sharing code publicly is crucial for COVID-19 detection and analysis using AI for several reasons. Firstly, it promotes transparency and reproducibility of research, allowing other researchers to build upon existing work and improve upon it. This collaborative approach accelerates the progress of scientific discovery and facilitates the development of more accurate and reliable AI models for COVID-19 detection and analysis. Secondly, sharing code publicly enables easier evaluation and comparison of different AI models. This allows researchers to identify the most effective and accurate models for COVID-19 detection and analysis, and to make improvements where necessary. Thirdly, public code sharing promotes the wider adoption of AI models for COVID-19 detection and analysis. By making code publicly available, researchers and healthcare professionals can access and implement AI models in their own settings, improving the accuracy and speed of COVID-19 diagnosis and treatment. Public code sharing plays a critical role in advancing research in COVID-19 detection and analysis using AI, promoting collaboration and transparency, facilitating evaluation and comparison of models, and accelerating the development and adoption of accurate and reliable AI models for COVID-19 detection and analysis.
8.4. Description of Image Pre-processing/augmentation
We also observed in our review that many articles did not properly document their pre-processing and/or augmentation pipeline of ultrasound images. However, not only for ultrasound images but for any computer vision AI studies, it is essential to describe all the image preprocessing and augmentation methods clearly for several reasons. Firstly, the quality of the input data is crucial for the accuracy of the AI model. Preprocessing methods such as resizing, cropping, filtering, and normalization can significantly impact the quality of the input data, and therefore, the performance of the AI model. Providing a clear description of these methods allows other researchers to understand how the data was processed and to replicate the methods in their own research. Secondly, augmentation techniques such as rotation, flipping, and shearing are commonly used to increase the diversity of the data and improve the robustness of the AI model. However, the choice of augmentation methods and the degree of augmentation can impact the performance of the AI model. Providing a clear description of the augmentation methods enables other researchers to understand how the data was augmented and to replicate the methods in their own research. Thirdly, clear documentation of image preprocessing and augmentation methods allows for the reproducibility of the research. Reproducibility is critical for scientific progress and allows for the validation and comparison of AI models across different studies and datasets. Thus, providing a clear description of image preprocessing and augmentation methods in AI-based COVID-19 detection and analysis on lung ultrasound is crucial for ensuring the accuracy and reproducibility of the research, facilitating the comparison of different AI models, and promoting scientific progress.
8.5. Potential Future Work
Based on the observation in this review, we foresee several research directions, which can be pursued in the future:
- Developing a standardized protocol for ultrasound-based severity assessment of COVID-19: The studies in the survey highlight the potential of ultrasound in assessing the severity of COVID-19. However, there is a need to develop a standardized protocol for ultrasound-based severity assessment to ensure consistency across studies and to facilitate comparisons between different AI models. This protocol should include standardized imaging techniques, imaging parameters, and diagnostic criteria.
- Integration of ultrasound with other imaging modalities: While ultrasound is a useful tool for COVID-19 assessment, it has some limitations, such as limited penetration depth and difficulty in imaging certain structures. Future work can focus on combining ultrasound with other imaging modalities, such as CT or MRI (if available), to provide a more comprehensive assessment of COVID-19.
- Integrating AI models for early detection and monitoring of COVID-19: Ultrasound can detect early lung involvement and monitor disease progression in COVID-19 patients. Future work can focus not only on developing but also integrate AI models in clinical settings that can accurately detect COVID-19 at an early stage and monitor disease progression over time, enabling timely intervention and better patient outcomes.
- Comparison of AI models using benchmark datasets: As highlighted in the discussion, there is a need for benchmark datasets for quantitative accuracy comparison of different AI models. Future work can focus on developing benchmark datasets and using them to compare the performance of different AI models for COVID-19 detection and analysis.
- Integration of AI models into clinical practice: The potential of AI models for COVID-19 detection and analysis is vast, but their integration into clinical practice is still limited. Future work can focus on developing user-friendly and interpretable AI models that can be easily integrated into clinical workflows, improving the accuracy and speed of COVID-19 diagnosis and treatment.
- Exploration of novel pre-processing and augmentation techniques: The quality of input data is crucial for the accuracy of AI models. Future work can focus on exploring novel pre-processing and augmentation techniques for ultrasound images to improve the quality of input data and the performance of AI models. These techniques can include advanced filtering, contrast enhancement, or more sophisticated augmentation methods.
- Integration of clinical and imaging data: AI models for COVID-19 detection and analysis can benefit from the integration of clinical and imaging data. Future work can focus on developing AI models that can integrate clinical and imaging data to provide a more comprehensive assessment of COVID-19 and its impact on patients.
9. Conclusions
In this comprehensive review, we provide a comprehensive survey of ultrasound-based AI COVID-19 studies that have used publicly available and private lung ultrasound datasets. The main contributions of this review are the exhaustive survey of articles that used publicly available lung ultrasound datasets for COVID-19, the listing and review of publicly available lung ultrasound COVID-19 datasets, and the organization of ultrasound-based AI studies per dataset. Additionally, this review analyzes and tabulates studies in several dimensions, such as data preprocessing, AI models, cross-validation, and evaluation criteria, and summarizes all reviewed works in a tabular fashion to facilitate an easier comparison among studies. The search strategy employed in this study was comprehensive, and we reviewed 42 articles in total, with 28 articles using public datasets and the rest using private data. We only selected articles that met our criteria, which included full-text availability, the use of any form of AI technique for COVID-19 detection or analysis from lung ultrasound data, the use of publicly available lung ultrasound dataset of COVID-19, the hypothesis of the article being supported by its qualitative and quantitative results, and the maintenance of a minimum standard of quality. This review provides insights into the current state of ultrasound-based AI COVID-19 studies and serves as a valuable resource for researchers interested in this field. The findings of this study can aid in the development of more accurate and efficient AI models for COVID-19 detection and diagnosis using lung ultrasound data, ultimately improving patient care and outcomes.
References
- Worldometer. COVID-19 CORONAVIRUS PANDEMIC, 2023. Available online: https://www.worldometers.info/coronavirus/ (accessed on 13 March 2023).
- Huang, C.; Wang, Y.; Li, X.; Ren, L.; Zhao, J.; Hu, Y.; Zhang, L.; Fan, G.; Xu, J.; Gu, X.; et al. Clinical features of patients infected with 2019 novel coronavirus in Wuhan, China. The lancet 2020, 395, 497–506. [Google Scholar] [CrossRef]
- Stokes, E.K.; Zambrano, L.D.; Anderson, K.N.; Marder, E.P.; Raz, K.M.; Felix, S.E.B.; Tie, Y.; Fullerton, K.E. Coronavirus disease 2019 case surveillance—United States, january 22–may 30, 2020. Morbidity and Mortality Weekly Report 2020, 69, 759. [Google Scholar] [CrossRef] [PubMed]
- Wang, J.; Yang, X.; Zhou, B.; Sohn, J.J.; Zhou, J.; Jacob, J.T.; Higgins, K.A.; Bradley, J.D.; Liu, T. Review of Machine Learning in Lung Ultrasound in COVID-19 Pandemic. Journal of Imaging 2022, 8, 65. [Google Scholar] [CrossRef]
- Dong, D.; Tang, Z.; Wang, S.; Hui, H.; Gong, L.; Lu, Y.; Xue, Z.; Liao, H.; Chen, F.; Yang, F.; et al. The role of imaging in the detection and management of COVID-19: a review. IEEE reviews in biomedical engineering 2020, 14, 16–29. [Google Scholar] [CrossRef] [PubMed]
- Qian, X.; Wodnicki, R.; Kang, H.; Zhang, J.; Tchelepi, H.; Zhou, Q. Current ultrasound technologies and instrumentation in the assessment and monitoring of COVID-19 positive patients. IEEE transactions on ultrasonics, ferroelectrics, and frequency control 2020, 67, 2230–2240. [Google Scholar] [CrossRef] [PubMed]
- Willemink, M.J.; Koszek, W.A.; Hardell, C.; Wu, J.; Fleischmann, D.; Harvey, H.; Folio, L.R.; Summers, R.M.; Rubin, D.L.; Lungren, M.P. Preparing medical imaging data for machine learning. Radiology 2020, 295, 4–15. [Google Scholar] [CrossRef] [PubMed]
- Park, H.J.; Jang, H.Y.; Kim, S.Y.; Lee, S.J.; Won, H.J.; Byun, J.H.; Choi, S.H.; Lee, S.S.; An, J.; Lim, Y.S. Non-enhanced magnetic resonance imaging as a surveillance tool for hepatocellular carcinoma: comparison with ultrasound. Journal of hepatology 2020, 72, 718–724. [Google Scholar] [CrossRef] [PubMed]
- Yuan, J.; Ye, D.; Chen, S.; Chen, H. Therapeutic ultrasound-enhanced immune checkpoint inhibitor therapy. Frontiers in Physics 2021, 9, 636985. [Google Scholar] [CrossRef]
- Prentice, R.; Wright, E.K.; Flanagan, E.; Ross, A.L.; Bell, S.J. The Use of Fecal Calprotectin and Intestinal Ultrasound in the Evaluation and Management of Stricturing Crohn’s Disease in Pregnancy. Inflammatory Bowel Diseases 2022, 28, e13–e16. [Google Scholar] [CrossRef]
- Allinovi, M.; Parise, A.; Giacalone, M.; Amerio, A.; Delsante, M.; Odone, A.; Franci, A.; Gigliotti, F.; Amadasi, S.; Delmonte, D.; et al. Lung ultrasound may support diagnosis and monitoring of COVID-19 pneumonia. Ultrasound in medicine & biology 2020, 46, 2908–2917. [Google Scholar]
- Born, J.; Brändle, G.; Cossio, M.; Disdier, M.; Goulet, J.; Roulin, J.; Wiedemann, N. POCOVID-Net: automatic detection of COVID-19 from a new lung ultrasound imaging dataset (POCUS). arXiv 2020, arXiv:2004.12084. [Google Scholar]
- Born, J.; Wiedemann, N.; Cossio, M.; Buhre, C.; Brändle, G.; Leidermann, K.; Goulet, J.; Aujayeb, A.; Moor, M.; Rieck, B.; et al. Accelerating detection of lung pathologies with explainable ultrasound image analysis. Applied Sciences 2021, 11, 672. [Google Scholar] [CrossRef]
- Diaz, R.; Marathe, A. Soft labels for ordinal regression. In Proceedings of the IEEE/CVF conference on computer vision and pattern recognition; 2019; pp. 4738–4747. [Google Scholar]
- Gare, G.R.; Schoenling, A.; Philip, V.; Tran, H.V.; Bennett, P.d.; Rodriguez, R.L.; Galeotti, J.M. Dense pixel-labeling for reverse-transfer and diagnostic learning on lung ultrasound for COVID-19 and pneumonia detection. 2021 IEEE 18th International Symposium on Biomedical Imaging (ISBI); IEEE, 2021; pp. 1406–1410. [Google Scholar]
- Carrer, L.; Donini, E.; Marinelli, D.; Zanetti, M.; Mento, F.; Torri, E.; Smargiassi, A.; Inchingolo, R.; Soldati, G.; Demi, L.; et al. Automatic pleural line extraction and COVID-19 scoring from lung ultrasound data. IEEE Transactions on Ultrasonics, Ferroelectrics, and Frequency Control 2020, 67, 2207–2217. [Google Scholar] [CrossRef] [PubMed]
- Che, H.; Radbel, J.; Sunderram, J.; Nosher, J.L.; Patel, V.M.; Hacihaliloglu, I. Multi-feature multi-scale CNN-derived COVID-19 classification from lung ultrasound data. 2021 43rd Annual International Conference of the IEEE Engineering in Medicine & Biology Society (EMBC); IEEE, 2021; pp. 2618–2621. [Google Scholar]
- Dastider, A.G.; Sadik, F.; Fattah, S.A. An integrated autoencoder-based hybrid CNN-LSTM model for COVID-19 severity prediction from lung ultrasound. Computers in Biology and Medicine 2021, 132, 104296. [Google Scholar] [CrossRef] [PubMed]
- Frank, O.; Schipper, N.; Vaturi, M.; Soldati, G.; Smargiassi, A.; Inchingolo, R.; Torri, E.; Perrone, T.; Mento, F.; Demi, L.; et al. Integrating domain knowledge into deep networks for lung ultrasound with applications to COVID-19. IEEE transactions on medical imaging 2021, 41, 571–581. [Google Scholar] [CrossRef] [PubMed]
- Roy, S.; Menapace, W.; Oei, S.; Luijten, B.; Fini, E.; Saltori, C.; Huijben, I.; Chennakeshava, N.; Mento, F.; Sentelli, A.; et al. Deep learning for classification and localization of COVID-19 markers in point-of-care lung ultrasound. IEEE transactions on medical imaging 2020, 39, 2676–2687. [Google Scholar] [CrossRef] [PubMed]
- Xue, W.; Cao, C.; Liu, J.; Duan, Y.; Cao, H.; Wang, J.; Tao, X.; Chen, Z.; Wu, M.; Zhang, J.; et al. Modality alignment contrastive learning for severity assessment of COVID-19 from lung ultrasound and clinical information. Medical image analysis 2021, 69, 101975. [Google Scholar] [CrossRef] [PubMed]
- Soldati, G.; Demi, M.; Smargiassi, A.; Inchingolo, R.; Demi, L. The role of ultrasound lung artifacts in the diagnosis of respiratory diseases. Expert review of respiratory medicine 2019, 13, 163–172. [Google Scholar] [CrossRef]
- Castelao, J.; Graziani, D.; Soriano, J.B.; Izquierdo, J.L. Findings and prognostic value of lung ultrasound in COVID-19 pneumonia. Journal of Ultrasound in Medicine 2021, 40, 1315–1324. [Google Scholar] [CrossRef]
- Soldati, G.; Smargiassi, A.; Inchingolo, R.; Buonsenso, D.; Perrone, T.; Briganti, D.F.; Perlini, S.; Torri, E.; Mariani, A.; Mossolani, E.E.; et al. Proposal for international standardization of the use of lung ultrasound for patients with COVID-19: a simple, quantitative, reproducible method. Journal of Ultrasound in Medicine 2020, 39, 1413–1419. [Google Scholar] [CrossRef]
- Siddiqui, M.A.; Ali, M.A.; Deriche, M. On the Early Detection of COVID19 using Advanced Machine Learning Techniques: A Review. 2021 18th International Multi-Conference on Systems, Signals & Devices (SSD); IEEE, 2021; pp. 1–7. [Google Scholar]
- Mondal, M.R.H.; Bharati, S.; Podder, P. Diagnosis of COVID-19 using machine learning and deep learning: a review. Current Medical Imaging 2021, 17, 1403–1418. [Google Scholar]
- Hussain, M.A.; Mirikharaji, Z.; Momeny, M.; Marhamati, M.; Neshat, A.A.; Garbi, R.; Hamarneh, G. Active deep learning from a noisy teacher for semi-supervised 3D image segmentation: Application to COVID-19 pneumonia infection in CT. Computerized Medical Imaging and Graphics 2022, 102, 102127. [Google Scholar] [CrossRef] [PubMed]
- Zhao, L.; Lediju Bell, M.A. A review of deep learning applications in lung ultrasound imaging of COVID-19 patients. BME Frontiers 2022, 2022. [Google Scholar] [CrossRef] [PubMed]
- Alzubaidi, M.; Zubaydi, H.D.; Bin-Salem, A.A.; Abd-Alrazaq, A.A.; Ahmed, A.; Househ, M. Role of deep learning in early detection of COVID-19: Scoping review. Computer methods and programs in biomedicine update 2021, 1, 100025. [Google Scholar] [CrossRef] [PubMed]
- Liu, J. Review of Deep Learning-based Approaches for COVID-19 Detection. 2021 2nd International Conference on Computing and Data Science (CDS); IEEE, 2021; pp. 366–371. [Google Scholar]
- Gudigar, A.; Raghavendra, U.; Nayak, S.; Ooi, C.P.; Chan, W.Y.; Gangavarapu, M.R.; Dharmik, C.; Samanth, J.; Kadri, N.A.; Hasikin, K.; et al. Role of artificial intelligence in COVID-19 detection. Sensors 2021, 21, 8045. [Google Scholar] [CrossRef]
- Ulhaq, A.; Born, J.; Khan, A.; Gomes, D.P.S.; Chakraborty, S.; Paul, M. COVID-19 control by computer vision approaches: A survey. Ieee Access 2020, 8, 179437–179456. [Google Scholar] [CrossRef] [PubMed]
- Wynants, L.; Van Calster, B.; Collins, G.S.; Riley, R.D.; Heinze, G.; Schuit, E.; Bonten, M.M.; Dahly, D.L.; Damen, J.A.; Debray, T.P.; et al. Prediction models for diagnosis and prognosis of COVID-19: systematic review and critical appraisal. bmj 2020, 369. [Google Scholar] [CrossRef]
- Ebadi, A.; Xi, P.; MacLean, A.; Florea, A.; Tremblay, S.; Kohli, S.; Wong, A. COVIDx-US: An Open-Access Benchmark Dataset of Ultrasound Imaging Data for AI-Driven COVID-19 Analytics. Frontiers in Bioscience-Landmark 2022, 27, 198. [Google Scholar] [CrossRef]
- Durrani, N.; Vukovic, D.; van der Burgt, J.; Antico, M.; van Sloun, R.J.; Canty, D.; Steffens, M.; Wang, A.; Royse, A.; Royse, C.; et al. Automatic Deep Learning-Based Consolidation/Collapse Classification in Lung Ultrasound Images for COVID-19 Induced Pneumonia. 2022. [Google Scholar] [CrossRef] [PubMed]
- Panicker, M.R.; Chen, Y.T.; Narayan, K.V.; Kesavadas, C.; Vinod, A. An Approach Towards Physics Informed Lung Ultrasound Image Scoring Neural Network for Diagnostic Assistance in COVID-19. arXiv 2021, arXiv:2106.06980. [Google Scholar]
- Quentin Muller, M.; Aleandro Eccel, M.; Arnaud Robert, M. Extracting high value lung ultrasound images from video for the diagnosis and prognosis of COVID-19. EPFL Project Report 2020. [Google Scholar]
- Arntfield, R.; VanBerlo, B.; Alaifan, T.; Phelps, N.; White, M.; Chaudhary, R.; Ho, J.; Wu, D. Development of a deep learning classifier to accurately distinguish COVID-19 from look-a-like pathology on lung ultrasound. medRxiv 2020. [Google Scholar]
- Camacho, J.; Muñoz, M.; Genovés, V.; Herraiz, J.L.; Ortega, I.; Belarra, A.; González, R.; Sánchez, D.; Giacchetta, R.C.; Trueba-Vicente, Á.; et al. Artificial Intelligence and Democratization of the Use of Lung Ultrasound in COVID-19: On the Feasibility of Automatic Calculation of Lung Ultrasound Score. International Journal of Translational Medicine 2022, 2, 17–25. [Google Scholar] [CrossRef]
- Chen, J.; He, C.; Yin, J.; Li, J.; Duan, X.; Cao, Y.; Sun, L.; Hu, M.; Li, W.; Li, Q. Quantitative analysis and automated lung ultrasound scoring for evaluating COVID-19 pneumonia with neural networks. IEEE Transactions on Ultrasonics, Ferroelectrics, and Frequency Control 2021, 68, 2507–2515. [Google Scholar] [CrossRef]
- Huang, Q.; Lei, Y.; Xing, W.; He, C.; Wei, G.; Miao, Z.; Hao, Y.; Li, G.; Wang, Y.; Li, Q.; et al. Evaluation of pulmonary edema using ultrasound imaging in patients with COVID-19 pneumonia based on a non-local Channel attention ResNet. Ultrasound in Medicine & Biology 2022, 48, 945–953. [Google Scholar]
- La Salvia, M.; Secco, G.; Torti, E.; Florimbi, G.; Guido, L.; Lago, P.; Salinaro, F.; Perlini, S.; Leporati, F. Deep learning and lung ultrasound for COVID-19 pneumonia detection and severity classification. Computers in biology and medicine 2021, 136, 104742. [Google Scholar] [CrossRef]
- Wang, Y.; Zhang, Y.; He, Q.; Liao, H.; Luo, J. A semi-automatic ultrasound image analysis system for the grading diagnosis of COVID-19 pneumonia. arXiv 2021, arXiv:2111.02676. [Google Scholar]
- Mento, F.; Perrone, T.; Fiengo, A.; Smargiassi, A.; Inchingolo, R.; Soldati, G.; Demi, L. Deep learning applied to lung ultrasound videos for scoring COVID-19 patients: A multicenter study. The Journal of the Acoustical Society of America 2021, 149, 3626–3634. [Google Scholar] [CrossRef]
- Roshankhah, R.; Karbalaeisadegh, Y.; Greer, H.; Mento, F.; Soldati, G.; Smargiassi, A.; Inchingolo, R.; Torri, E.; Perrone, T.; Aylward, S.; et al. Investigating training-test data splitting strategies for automated segmentation and scoring of COVID-19 lung ultrasound images. The Journal of the Acoustical Society of America 2021, 150, 4118–4127. [Google Scholar] [CrossRef]
- Mento, F.; Perrone, T.; Macioce, V.N.; Tursi, F.; Buonsenso, D.; Torri, E.; Smargiassi, A.; Inchingolo, R.; Soldati, G.; Demi, L. On the impact of different lung ultrasound imaging protocols in the evaluation of patients affected by coronavirus disease 2019: how many acquisitions are needed? Journal of Ultrasound in Medicine 2021, 40, 2235–2238. [Google Scholar] [CrossRef]
- Perrone, T.; Soldati, G.; Padovini, L.; Fiengo, A.; Lettieri, G.; Sabatini, U.; Gori, G.; Lepore, F.; Garolfi, M.; Palumbo, I.; et al. A new lung ultrasound protocol able to predict worsening in patients affected by severe acute respiratory syndrome coronavirus 2 pneumonia. Journal of Ultrasound in Medicine 2021, 40, 1627–1635. [Google Scholar] [CrossRef]
- Liu, L.; Lei, W.; Wan, X.; Liu, L.; Luo, Y.; Feng, C. Semi-supervised active learning for COVID-19 lung ultrasound multi-symptom classification. 2020 IEEE 32nd International Conference on Tools with Artificial Intelligence (ICTAI); IEEE, 2020; pp. 1268–1273. [Google Scholar]
- Nabalamba, I. Machine learning-aided classification of COVID-19 in lung Ultrasound Images. PhD thesis, Makerere University, 2022. [Google Scholar]
- Rojas-Azabache, C.; Vilca-Janampa, K.; Guerrero-Huayta, R.; Núñez-Fernández, D. Detection of COVID-19 Disease using Deep Neural Networks with Ultrasound Imaging. arXiv 2021, arXiv:2104.01509. [Google Scholar]
- Bottenus, N.; Üstüner, K.F. Acoustic reciprocity of spatial coherence in ultrasound imaging. IEEE transactions on ultrasonics, ferroelectrics, and frequency control 2015, 62, 852–861. [Google Scholar] [CrossRef]
- Ebadi, S.E.; Krishnaswamy, D.; Bolouri, S.E.S.; Zonoobi, D.; Greiner, R.; Meuser-Herr, N.; Jaremko, J.L.; Kapur, J.; Noga, M.; Punithakumar, K. Automated detection of pneumonia in lung ultrasound using deep video classification for COVID-19. Informatics in Medicine Unlocked 2021, 25, 100687. [Google Scholar] [CrossRef] [PubMed]
- Karar, M.E.; Reyad, O.; Abd-Elnaby, M.; Abdel-Aty, A.H.; Shouman, M.A. Lightweight transfer learning models for ultrasound-guided classification of COVID-19 patients. Computers, Materials and Continua 2021, 2295–2312. [Google Scholar] [CrossRef]
- Karnes, M.; Perera, S.; Adhikari, S.; Yilmaz, A. Adaptive Few-Shot Learning PoC Ultrasound COVID-19 Diagnostic System. 2021 IEEE Biomedical Circuits and Systems Conference (BioCAS); IEEE, 2021; pp. 1–6. [Google Scholar]
- Perera, S.; Adhikari, S.; Yilmaz, A. Pocformer: A lightweight transformer architecture for detection of COVID-19 using point of care ultrasound. 2021 IEEE International Conference on Image Processing (ICIP); IEEE, 2021; pp. 195–199. [Google Scholar]
- Karar, M.E.; Shouman, M.A.; Chalopin, C. Adversarial neural network classifiers for COVID-19 diagnosis in ultrasound images. Computers, Materials and Continua 2021, 1683–1697. [Google Scholar]
- Mateu, M.; Montiel, J.O.; Escalante-Ramírez, B. COVID-19 detection from lung ultrasound images. Optics, Photonics and Digital Technologies for Imaging Applications VII. SPIE 2022, 12138, 75–83. [Google Scholar]
- Muhammad, G.; Hossain, M.S. COVID-19 and non-COVID-19 classification using multi-layers fusion from lung ultrasound images. Information Fusion 2021, 72, 80–88. [Google Scholar] [CrossRef]
- Adedigba, A.P.; Adeshina, S.A. Deep Learning-based Classification of COVID-19 Lung Ultrasound for Tele-operative Robot-assisted diagnosis. 2021 1st International Conference on Multidisciplinary Engineering and Applied Science (ICMEAS); IEEE, 2021; pp. 1–6. [Google Scholar]
- Hussain, M.A.; Amir-Khalili, A.; Hamarneh, G.; Abugharbieh, R. Segmentation-free kidney localization and volume estimation using aggregated orthogonal decision CNNs. International Conference on Medical Image Computing and Computer-Assisted Intervention; Springer, 2017; pp. 612–620. [Google Scholar]
- Momeny, M.; Neshat, A.A.; Hussain, M.A.; Kia, S.; Marhamati, M.; Jahanbakhshi, A.; Hamarneh, G. Learning-to-augment strategy using noisy and denoised data: Improving generalizability of deep CNN for the detection of COVID-19 in X-ray images. Computers in Biology and Medicine 2021, 136, 104704. [Google Scholar] [CrossRef]
- Pal, S.K.; Bhardwaj, A.; Shukla, A. A Review on Despeckling Filters in Ultrasound Images for Speckle Noise Reduction. 2021 International Conference on Advance Computing and Innovative Technologies in Engineering (ICACITE); IEEE, 2021; pp. 973–978. [Google Scholar]
- de Araujo, A.F.; Constantinou, C.E.; Tavares, J.M.R. Smoothing of ultrasound images using a new selective average filter. Expert Systems with Applications 2016, 60, 96–106. [Google Scholar] [CrossRef]
- Hussain, M.A.; Anas, E.M.A.; Alam, S.K.; Lee, S.Y.; Hasan, M.K. Direct and gradient-based average strain estimation by using weighted nearest neighbor cross-correlation peaks. IEEE transactions on ultrasonics, ferroelectrics, and frequency control 2012, 59, 1713–1728. [Google Scholar] [CrossRef] [PubMed]
- Hussain, M.A.; Shourov, R.M.; Khan, S.N. Towards real-time 3D geometric nonlinear diffusion filter and its application to CT and MR imaging. 2015 18th International Conference on Computer and Information Technology (ICCIT); IEEE, 2015; pp. 462–467. [Google Scholar]
- Sadik, F.; Dastider, A.G.; Fattah, S.A. SpecMEn-DL: spectral mask enhancement with deep learning models to predict COVID-19 from lung ultrasound videos. Health Information Science and Systems 2021, 9, 28. [Google Scholar] [CrossRef]
- Diaz-Escobar, J.; Ordóñez-Guillén, N.E.; Villarreal-Reyes, S.; Galaviz-Mosqueda, A.; Kober, V.; Rivera-Rodriguez, R.; Lozano Rizk, J.E. Deep-learning based detection of COVID-19 using lung ultrasound imagery. PLOS ONE 2021, 16, 1–21. [Google Scholar] [CrossRef] [PubMed]
- Al-Jumaili, S.; Duru, A.D.; Uçan, O.N. COVID-19 Ultrasound image classification using SVM based on kernels deduced from Convolutional neural network. 2021 5th International Symposium on Multidisciplinary Studies and Innovative Technologies (ISMSIT); IEEE, 2021; pp. 429–433. [Google Scholar]
- Barros, B.; Lacerda, P.; Albuquerque, C.; Conci, A. Pulmonary COVID-19: Learning Spatiotemporal Features Combining CNN and LSTM Networks for Lung Ultrasound Video Classification. Sensors 2021, 21. [Google Scholar] [CrossRef] [PubMed]
- Al-Zogbi, L.; Singh, V.; Teixeira, B.; Ahuja, A.; Bagherzadeh, P.S.; Kapoor, A.; Saeidi, H.; Fleiter, T.; Krieger, A. Autonomous Robotic Point-of-Care Ultrasound Imaging for Monitoring of COVID-19-Induced Pulmonary Diseases. Frontiers in Robotics and AI 2021, 68. [Google Scholar] [CrossRef]
- Almeida, A.; Bilbao, A.; Ruby, L.; Rominger, M.B.; López-De-Ipiña, D.; Dahl, J.; ElKaffas, A.; Sanabria, S.J. Lung ultrasound for point-of-care COVID-19 pneumonia stratification: computer-aided diagnostics in a smartphone. First experiences classifying semiology from public datasets. 2020 IEEE International Ultrasonics Symposium (IUS), 2020, pp. 1–4. [CrossRef]
- Awasthi, N.; Dayal, A.; Cenkeramaddi, L.R.; Yalavarthy, P.K. Mini-COVIDNet: Efficient Lightweight Deep Neural Network for Ultrasound Based Point-of-Care Detection of COVID-19. IEEE Transactions on Ultrasonics, Ferroelectrics, and Frequency Control 2021, 68, 2023–2037. [Google Scholar] [CrossRef]
- Azimi, H.; Ebadi, A.; Song, J.; Xi, P.; Wong, A. COVID-Net UV: An End-to-End Spatio-Temporal Deep Neural Network Architecture for Automated Diagnosis of COVID-19 Infection from Ultrasound Videos. arXiv 2022, arXiv:2205.08932. [Google Scholar]
- Born, J.; Wiedemann, N.; Brändle, G.; Buhre, C.; Rieck, B.; Borgwardt, K.M. Accelerating COVID-19 Differential Diagnosis with Explainable Ultrasound Image Analysis. CoRR 2020, abs/2009.06116. [Google Scholar]
- Hou, D.; Hou, R.; Hou, J. Interpretable Saab Subspace Network for COVID-19 Lung Ultrasound Screening. 2020 11th IEEE Annual Ubiquitous Computing, Electronics & Mobile Communication Conference (UEMCON); 2020; pp. 0393–0398. [Google Scholar] [CrossRef]
- Khan, U.; Mento, F.; Giacomaz, L.N.; Trevisan, R.; Smargiassi, A.; Inchingolo, R.; Perrone, T.; Demi, L. Deep Learning-Based Classification of Reduced Lung Ultrasound Data From COVID-19 Patients. IEEE Transactions on Ultrasonics, Ferroelectrics, and Frequency Control 2022, 69, 1661–1669. [Google Scholar] [CrossRef]
- MacLean, A.; Abbasi, S.; Ebadi, A.; Zhao, A.; Pavlova, M.; Gunraj, H.; Xi, P.; Kohli, S.; Wong, A. Covid-net us: A tailored, highly efficient, self-attention deep convolutional neural network design for detection of COVID-19 patient cases from point-of-care ultrasound imaging. In Domain Adaptation and Representation Transfer, and Affordable Healthcare and AI for Resource Diverse Global Health; Springer, 2021; pp. 191–202. [Google Scholar]
- MacLean, A.; Ebadi, A.; Florea, A.; XI, P.; Wong, A. An Initial Study into the Feasibility of Deep Learning-Based COVID-19 Severity Classification using Point-of-Care Ultrasound Imaging. Journal of Computational Vision and Imaging Systems 2021, 7, 31–33. [Google Scholar]
- Zeng, E.Z.; Florea, A.; Wong, A. COVID-Net US-X: Enhanced Deep Neural Network for Detection of COVID-19 Patient Cases from Convex Ultrasound Imaging Through Extended Linear-Convex Ultrasound Augmentation Learning, 2022. [CrossRef]
- Martinez Redondo, J.; Comas Rodriguez, C.; Pujol Salud, J.; Crespo Pons, M.; Garcia Serrano, C.; Ortega Bravo, M.; Palacin Peruga, J.M. Higher accuracy of lung ultrasound over chest X-ray for early diagnosis of COVID-19 pneumonia. International Journal of Environmental Research and Public Health 2021, 18, 3481. [Google Scholar] [CrossRef] [PubMed]
| 1 | |
| 2 |
Figure 1.
Demonstration of different types of lines that may appear in lung ultrasound images. A-lines are marked with blue, B-lines are marked with yellow, and the pleural line is marked with green [12].
Figure 1.
Demonstration of different types of lines that may appear in lung ultrasound images. A-lines are marked with blue, B-lines are marked with yellow, and the pleural line is marked with green [12].
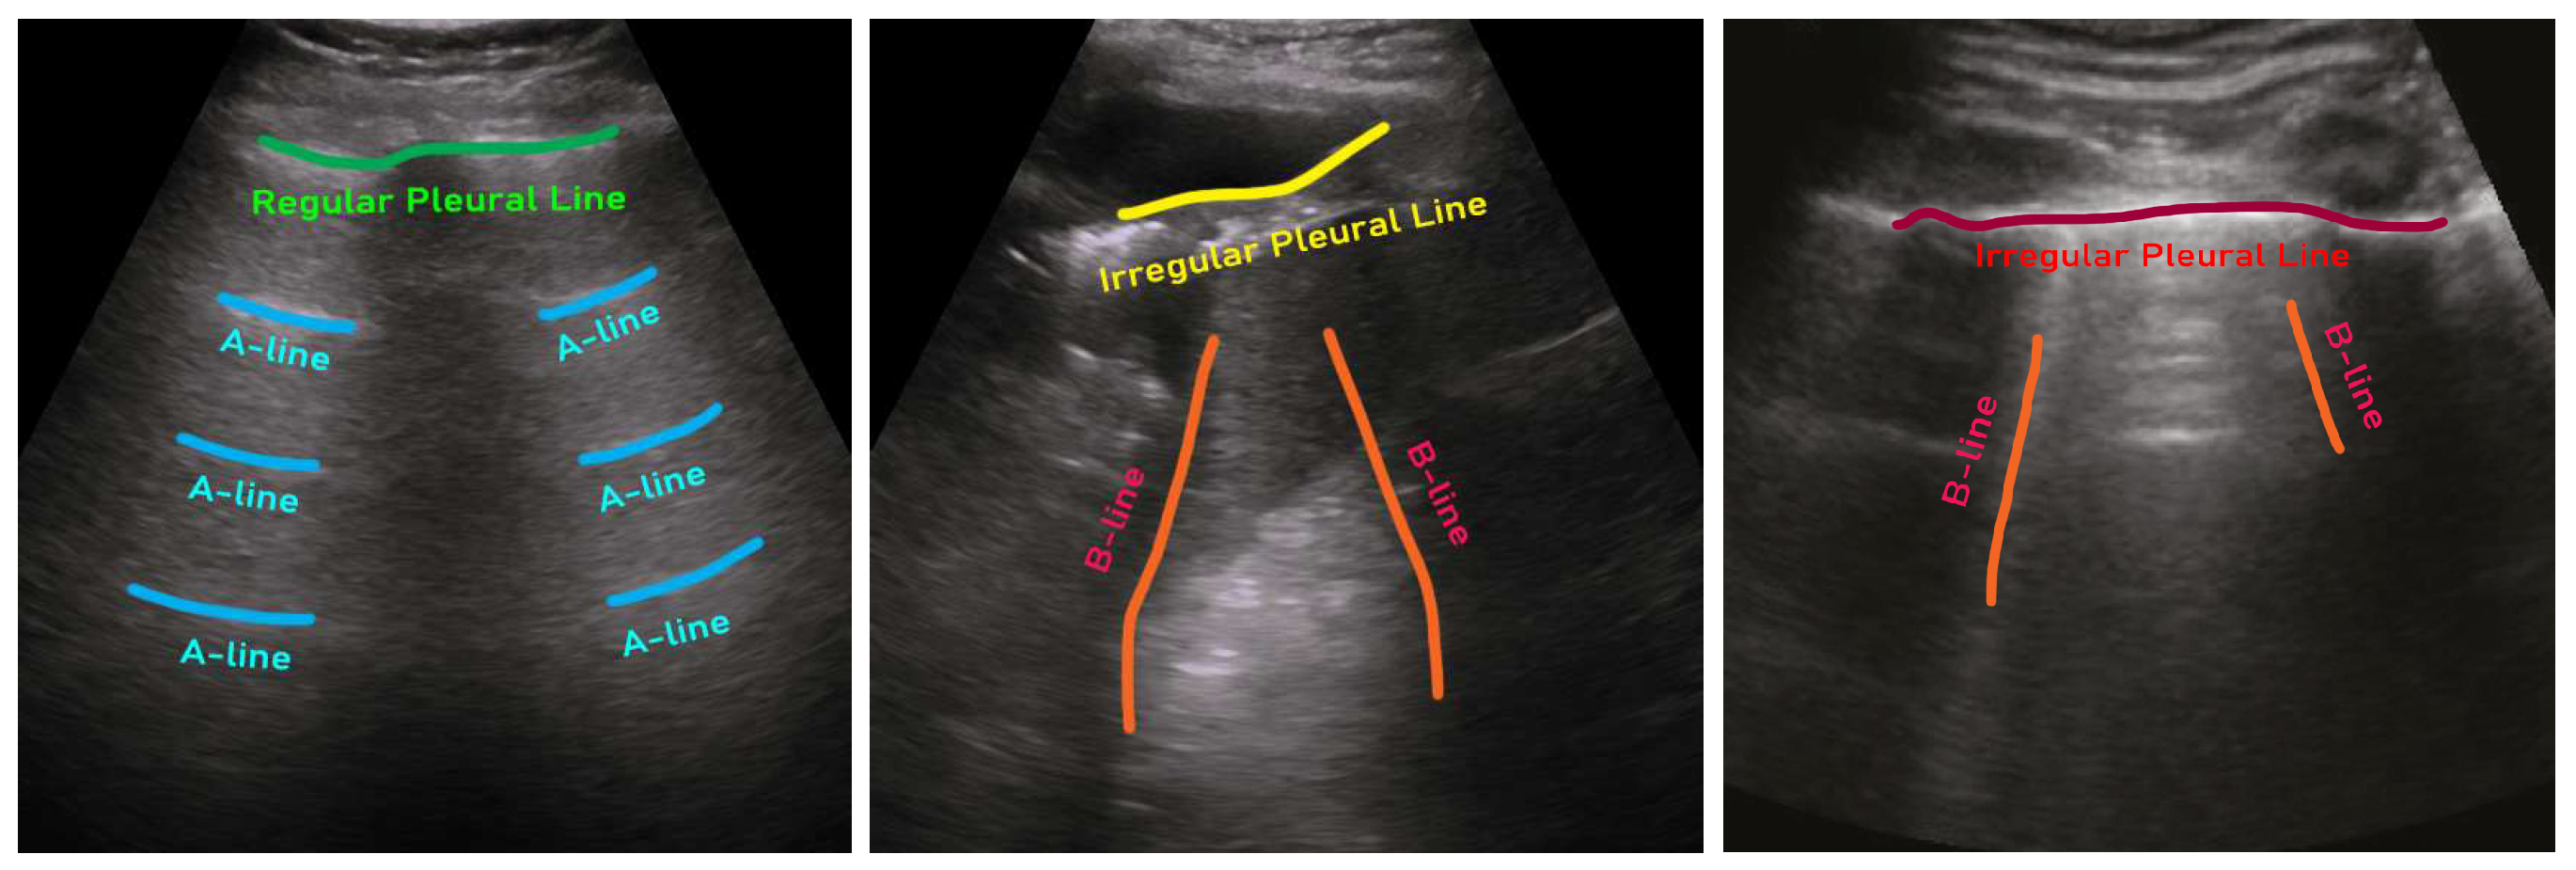
Figure 2.
Example ultrasound images of a healthy lung (left), community-acquired pneumonia (CAP)-infected lung (middle), and COVID-19-infected lung (right) [12].
Figure 2.
Example ultrasound images of a healthy lung (left), community-acquired pneumonia (CAP)-infected lung (middle), and COVID-19-infected lung (right) [12].
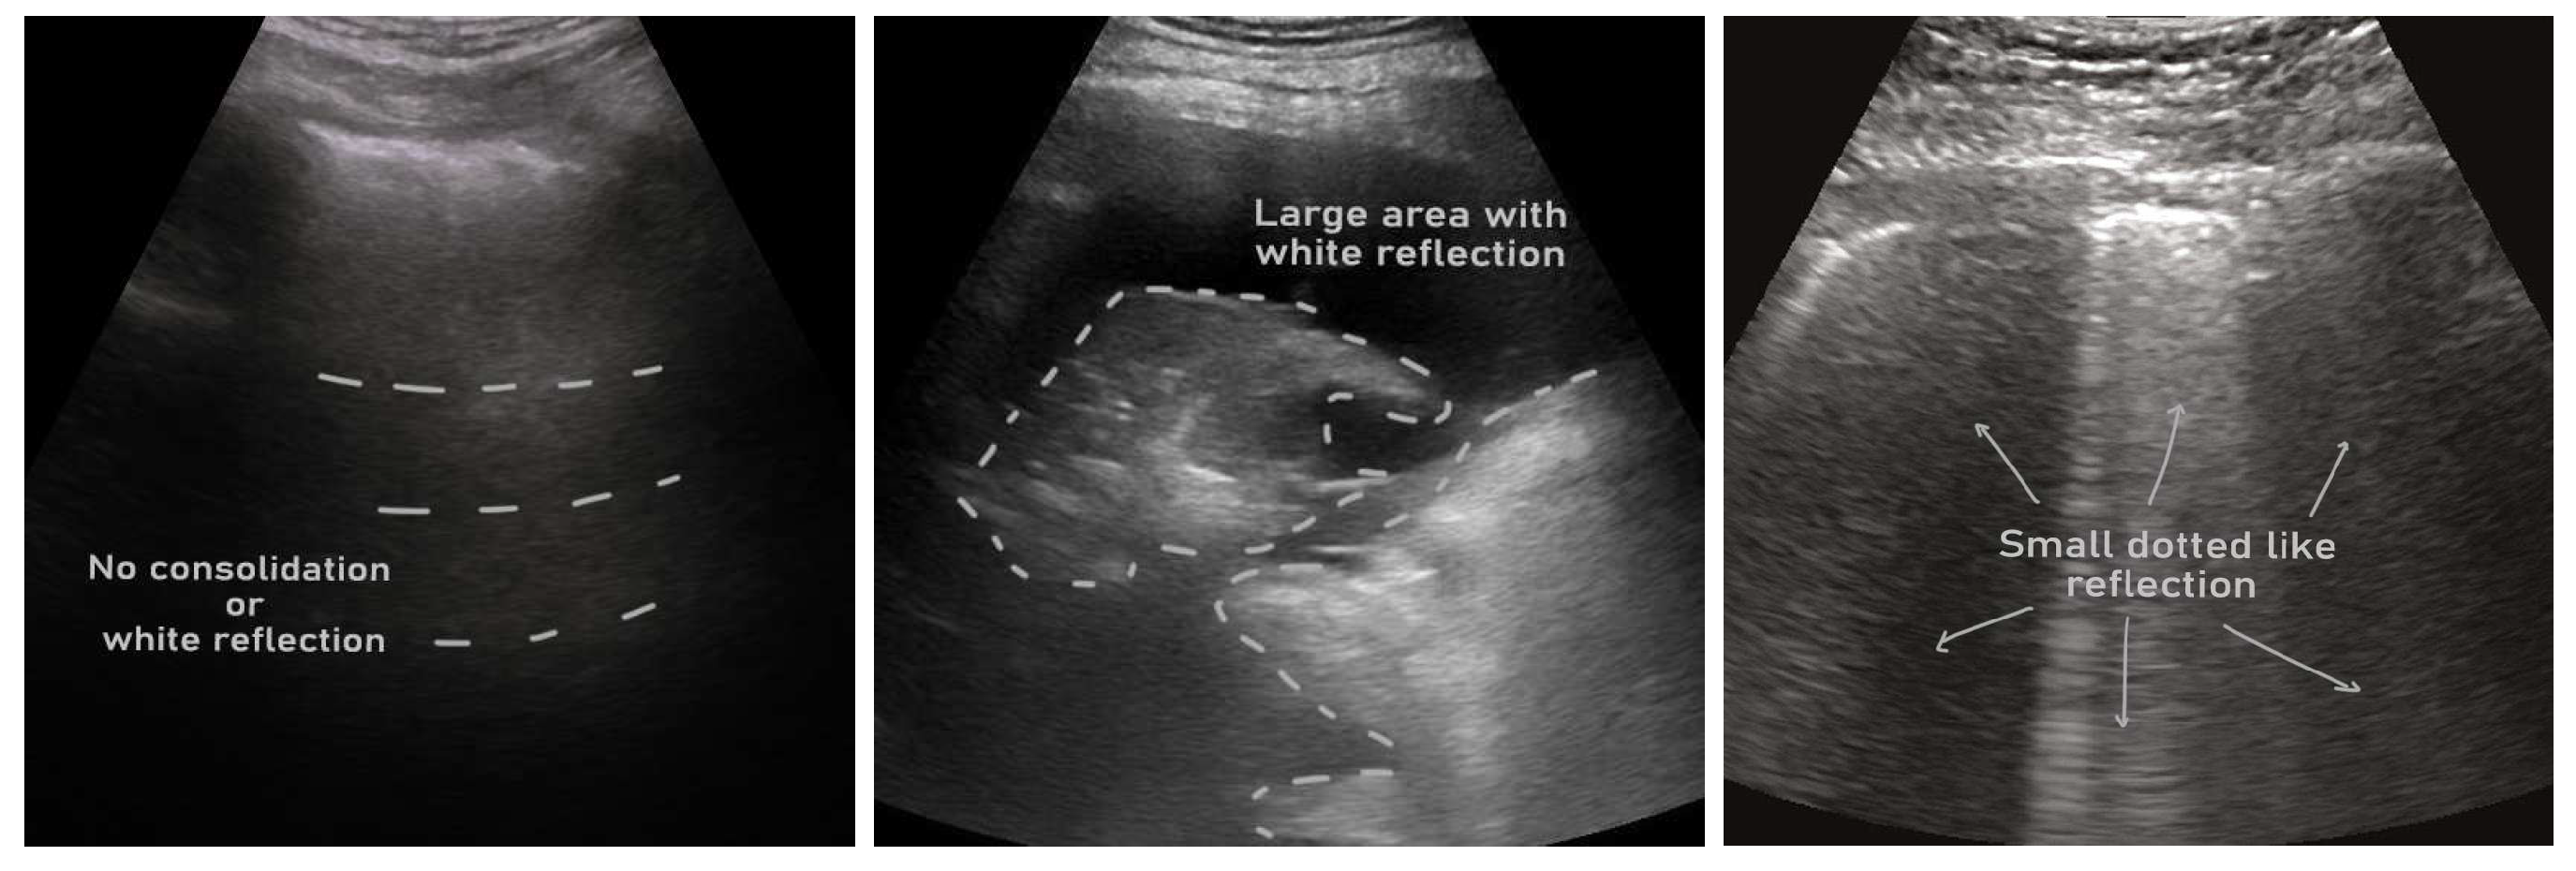
Figure 3.
A pie-chart showing the percentage of reviewed articles in this study per lung ultrasound datasets.
Figure 3.
A pie-chart showing the percentage of reviewed articles in this study per lung ultrasound datasets.
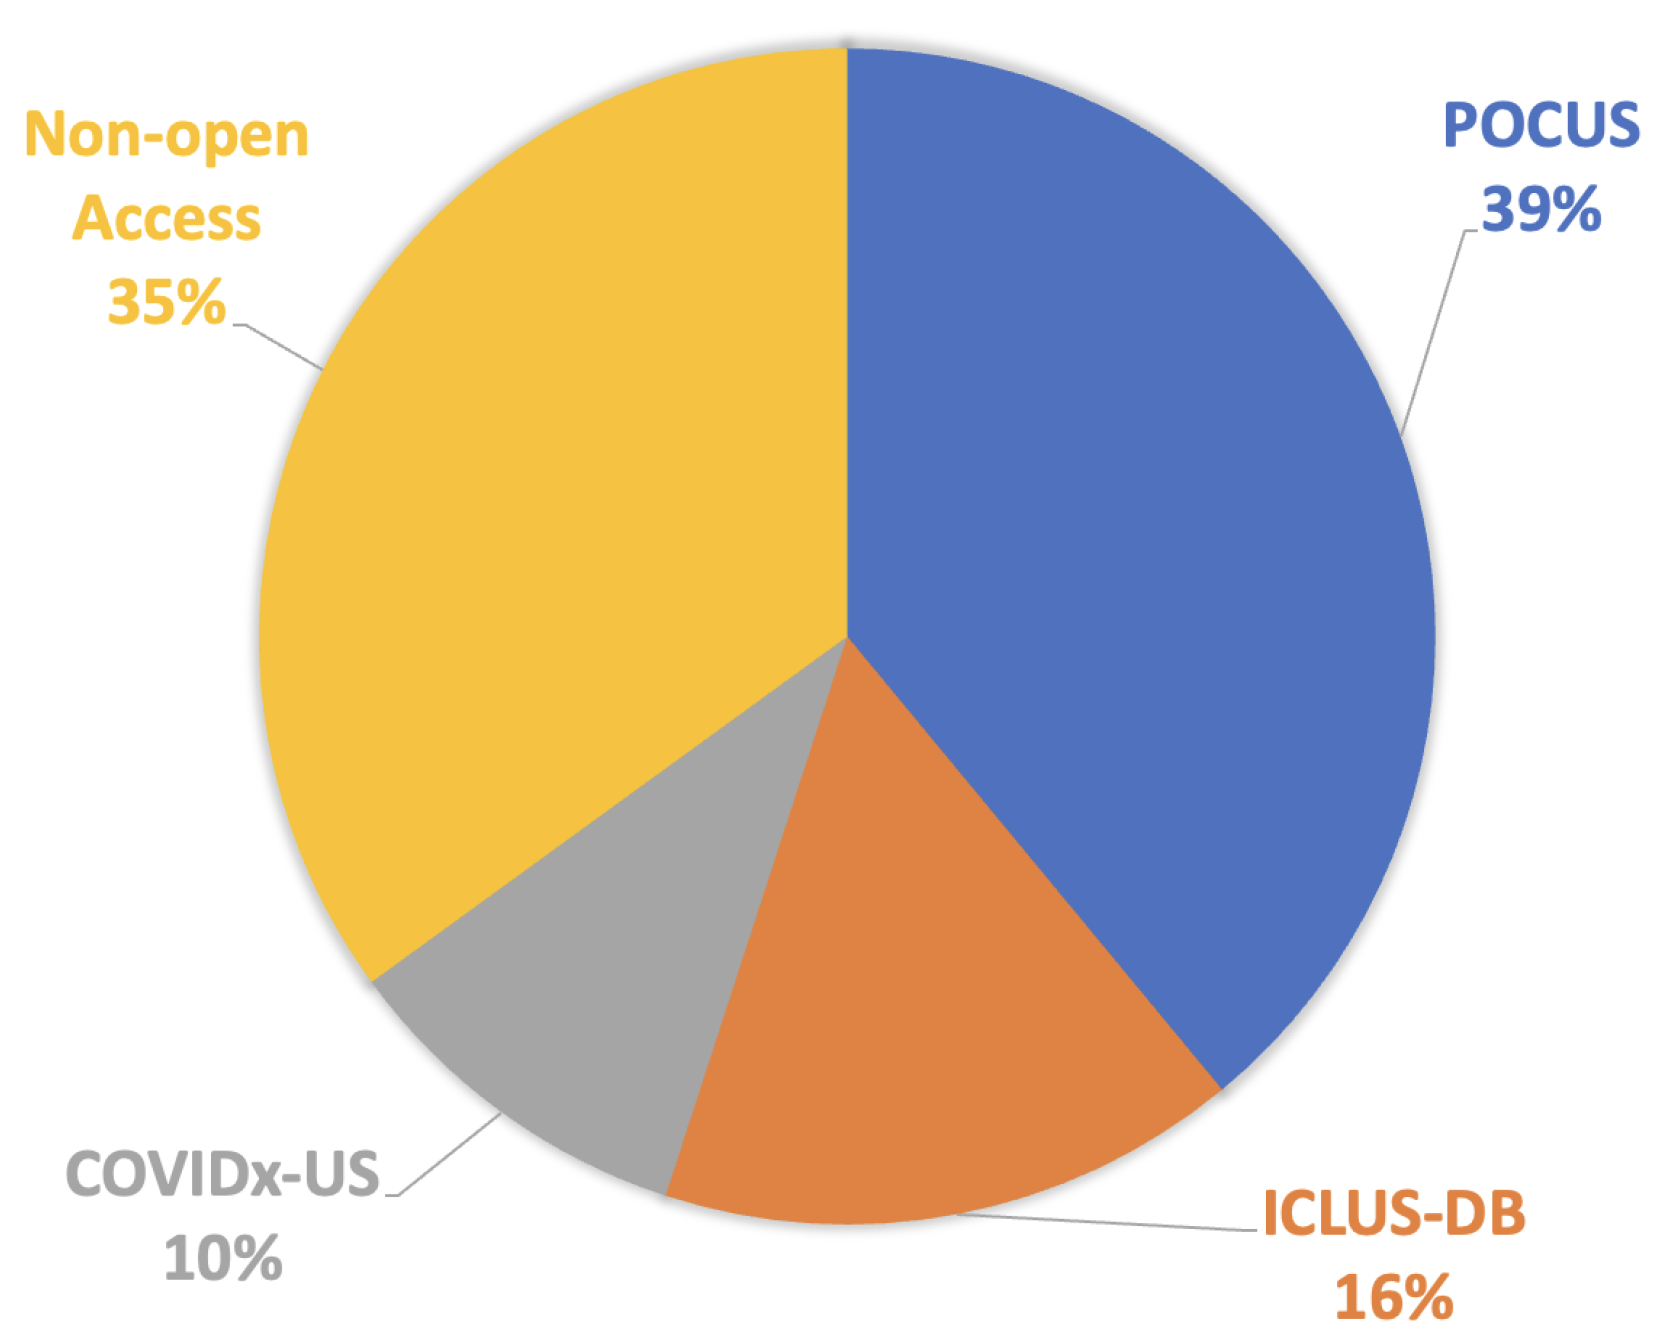
Figure 4.
Organization of reviewed articles in terms of the AI model types and configurations.
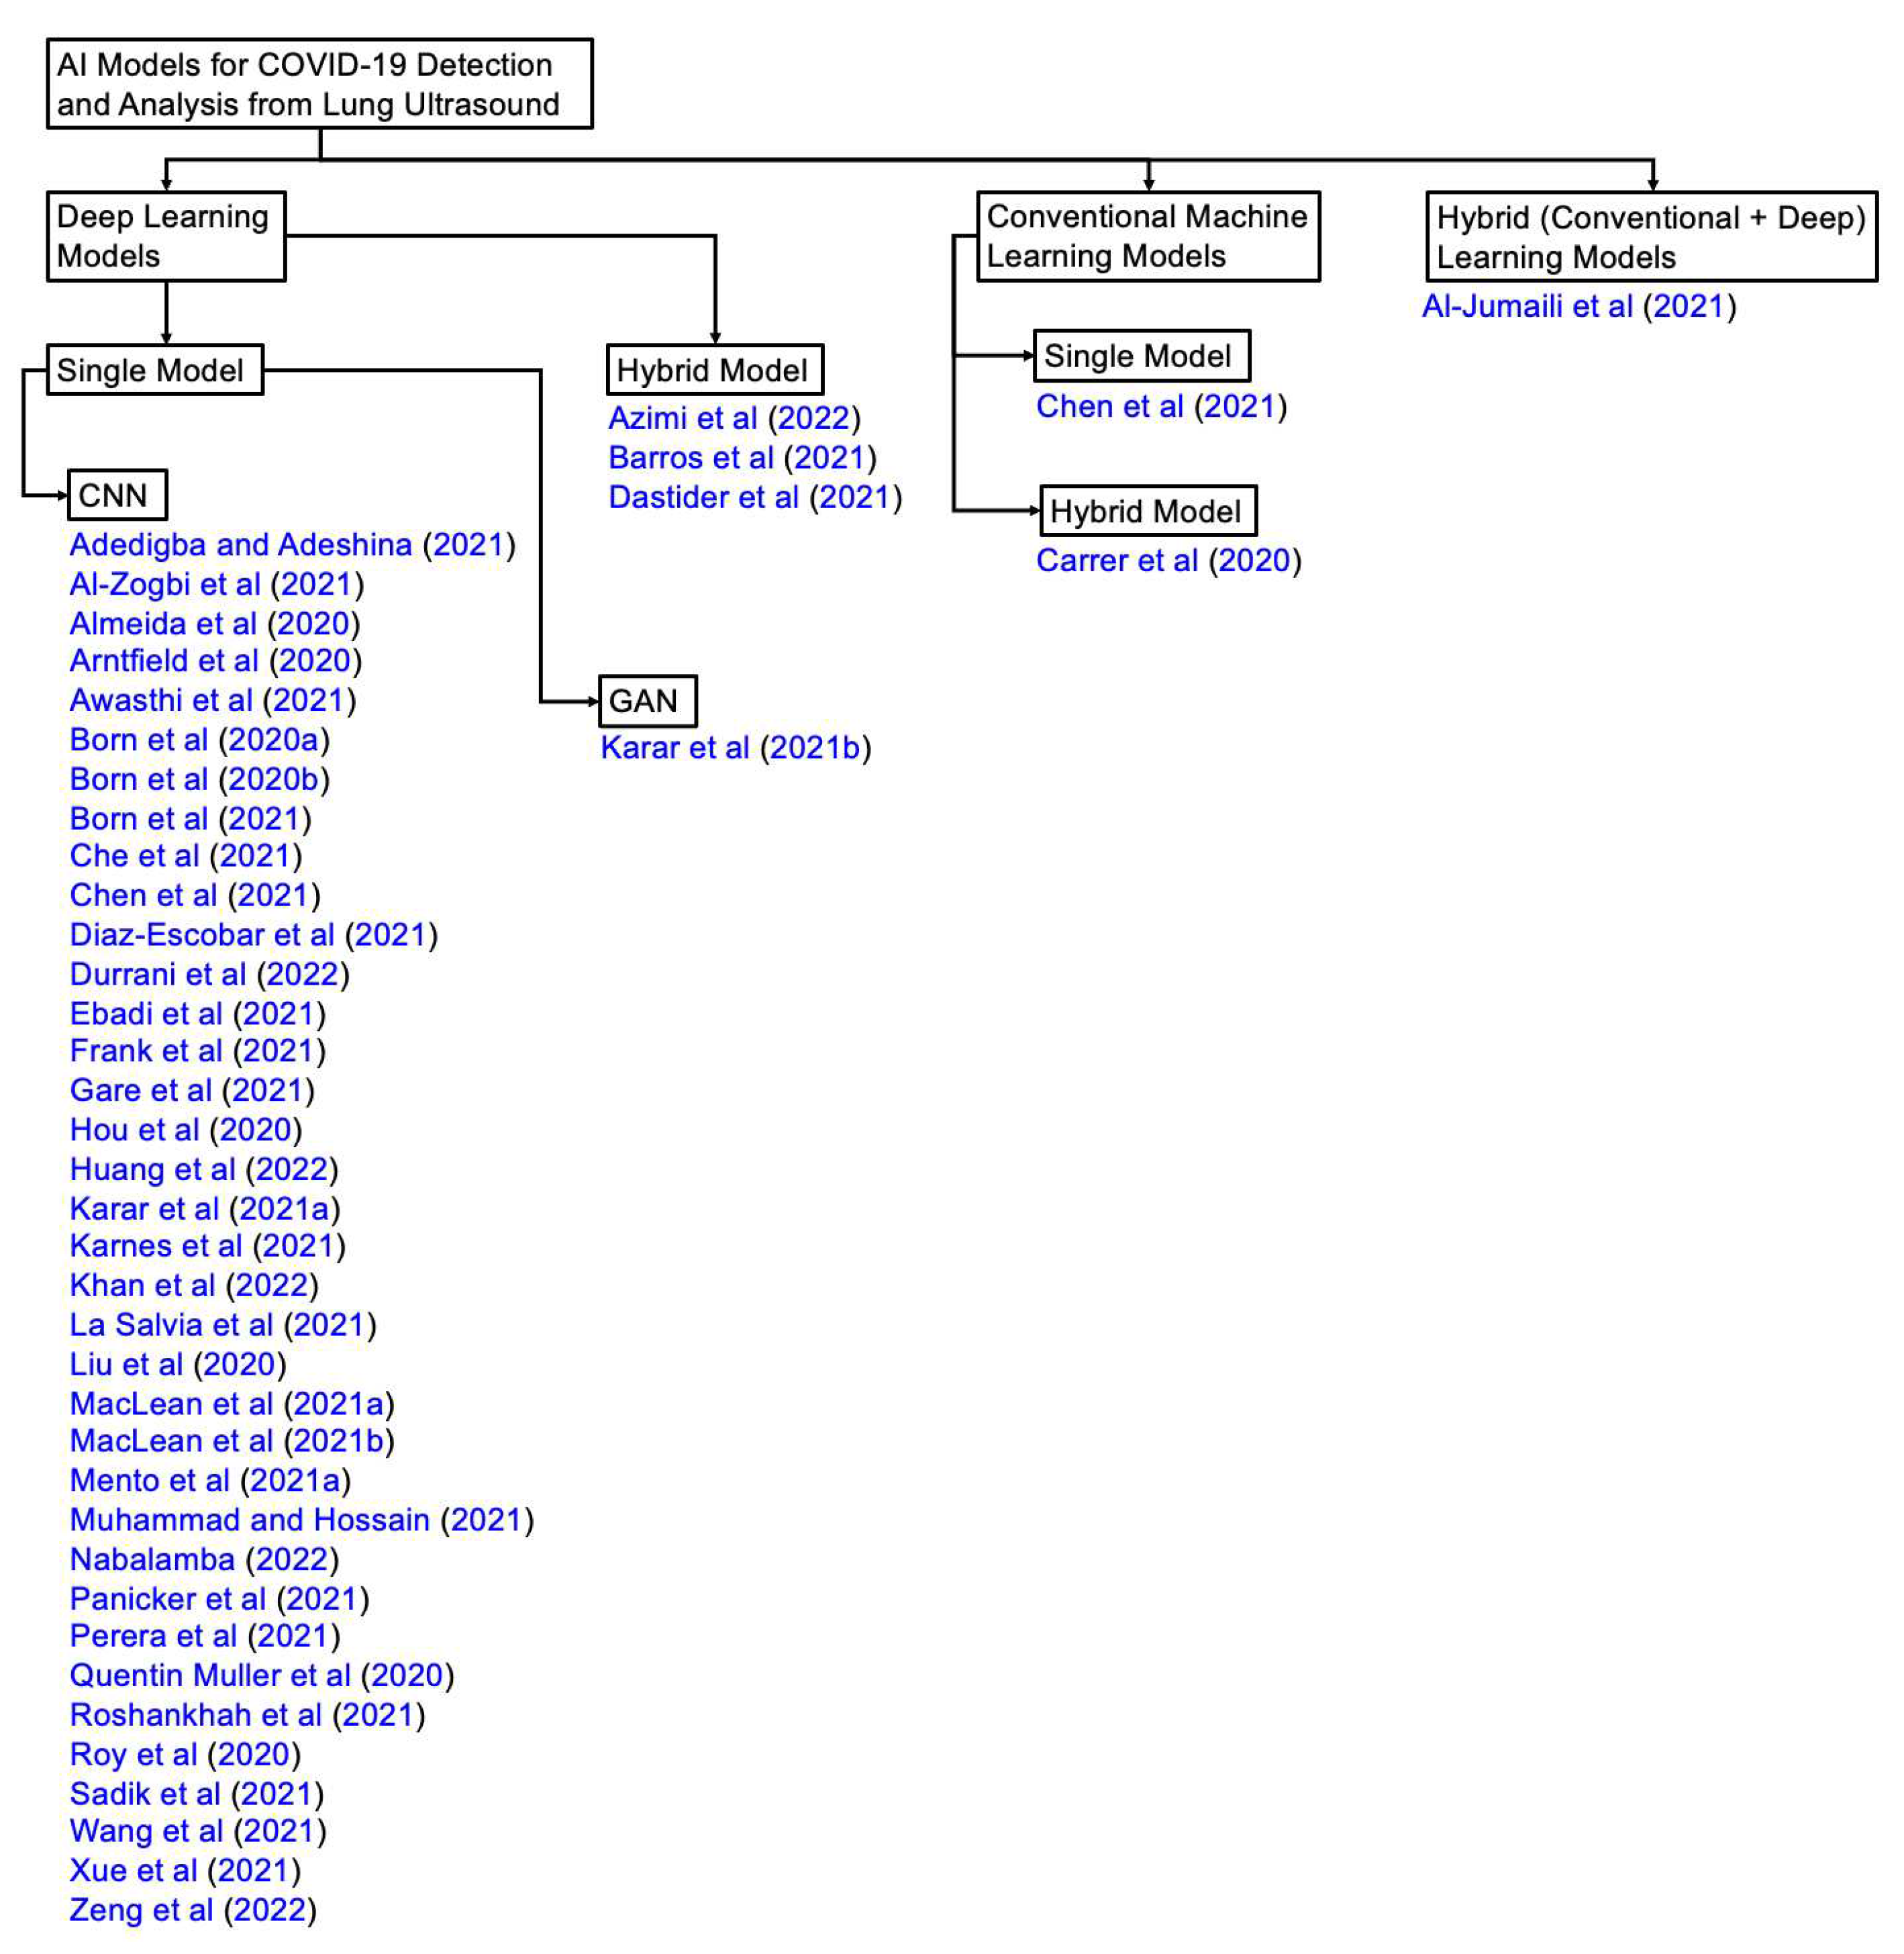
Table 1.
List of publicly accessible COVID-19 ultrasound datasets.
| Sl. | Dataset | Year | Number of Samples | Class Distribution | Note |
|---|---|---|---|---|---|
| 1 | POCUS | 2020 | (216 patients) 202 videos 59 images | COVID-19 (35%) Bacterial Pneumonia (28%) Viral Pneumonia (2%) Healthy (35%) | Link1 |
| 2 | ICLUS-DB | 2020 | (35 patients) 277 videos 58,924 frames | Score 0: Continuous A-line (34%) Score 1: Alteration in A-line (24%) Score 2: Small consolidation (32%) Score 3: Large consolidation (10%) | Link2 |
| 3 | COVIDx-US | 2021 | 242 videos 29,651 images | COVID-19 (29%) CAP (20%) non-pneumonia diseases (39%) Healthy (12%) | Link3 |
Table 3.
A list of the articles reviewed in this study and the corresponding AI methods used by those articles. Acronyms- Sl.: serial, CM: conventional machine learning, DL: deep learning, RNN: recurrent neural network, SVM: support vector machine, LSTM: long short-term memory, STN: spatial transformer network, GAN: generative adversarial network
| Sl. | Studies | AI Methods | CM | DL |
|---|---|---|---|---|
| 1 | Adedigba and Adeshina [59] | SqueezeNet, MobileNetV2 | ✗ | ✓ |
| 2 | Al-Jumaili et al. [68] | ResNet-18, RestNet-50, NASNetMobile, GoogleNet, SVM | ✓ | ✓ |
| 3 | Al-Zogbi et al. [70] | DenseNet | ✗ | ✓ |
| 4 | Almeida et al. [71] | MobileNet | ✗ | ✓ |
| 5 | Arntfield et al. [38] | Xception | ✗ | ✓ |
| 6 | Awasthi et al. [72] | MiniCOVIDNet | ✗ | ✓ |
| 7 | Azimi et al. [73] | InceptionV3, RNN | ✗ | ✓ |
| 8 | Barros et al. [69] | Xception-LSTM | ✗ | ✓ |
| 9 | Born et al. [12] | VGG-16 | ✗ | ✓ |
| 10 | Born et al. [74] | VGG-16 | ✗ | ✓ |
| 11 | Born et al. [13] | VGG-16 | ✗ | ✓ |
| 12 | Carrer et al. [16] | Hidden Markov Model, Viterbi Algorithm, SVM | ✓ | ✗ |
| 13 | Che et al. [17] | Multi-scale Residual CNN | ✗ | ✓ |
| 14 | Chen et al. [40] | 2-layer NN, SVM, Decision tree | ✓ | ✓ |
| 15 | Diaz-Escobar et al. [67] | InceptionV3, VGG-19, ResNet-50, Xception | ✗ | ✓ |
| 16 | Dastider et al. [18] | Autoencoder-based Hybrid CNN-LSTM | ✗ | ✓ |
| 17 | Durrani et al. [35] | Reg-STN | ✗ | ✓ |
| 18 | Ebadi et al. [52] | Kinetics-I3D | ✗ | ✓ |
| 19 | Frank et al. [19] | ResNet-18, MobileNetV2, DeepLabV3++ | ✗ | ✓ |
| 20 | Gare et al. [15] | Reverse Transfer Learning on UNet | ✗ | ✓ |
| 21 | Hou et al. [75] | Saab transform-based SSL, CNN | ✗ | ✓ |
| 22 | Huang et al. [41] | Non-local channel attention ResNet | ✗ | ✓ |
| 23 | Karar et al. [53] | MobileNet, ShuffleNet, MENet, MnasNet | ✗ | ✓ |
| 24 | Karar et al. [56] | A semi-supervised GAN, a modified AC-GAN | ✗ | ✓ |
| 25 | Karnes et al. [54] | Few-shot learning using MobileNet | ✗ | ✓ |
| 26 | Khan et al. [76] | CNN | ✗ | ✓ |
| 27 | La Salvia et al. [42] | ResNet-18, ResNet-50 | ✗ | ✓ |
| 28 | Liu et al. [48] | Multi-symptom multi-label (MSML) network | ✗ | ✓ |
| 29 | MacLean et al. [77] | COVID-Net US | ✗ | ✓ |
| 30 | MacLean et al. [78] | ResNet | ✗ | ✓ |
| 31 | Mento et al. [44] | STN, U-Net, DeepLabV3+ | ✗ | ✓ |
| 32 | Muhammad and Hossain [58] | CNN | ✗ | ✓ |
| 33 | Nabalamba [49] | VGG-16, VGG-19, ResNet | ✗ | ✓ |
| 34 | Panicker et al. [36] | LUSNet (a U-Net like network for ultrasound images) | ✗ | ✓ |
| 35 | Perera et al. [55] | Transformer | ✗ | ✓ |
| 36 | Quentin Muller et al. [37] | ResNet-18 | ✗ | ✓ |
| 37 | Roshankhah et al. [45] | U-Net | ✗ | ✓ |
| 38 | Roy et al. [20] | STN, U-Net, U-Net++, DeepLabv3, Model Genesis | ✗ | ✓ |
| 39 | Sadik et al. [66] | DenseNet-201, ResNet-152V2, Xception, VGG-19, NasNetMobile | ✗ | ✓ |
| 40 | Wang et al. [43] | SVM | ✓ | ✗ |
| 41 | Xue et al. [21] | U-Net | ✗ | ✓ |
| 42 | Zeng et al. [79] | COVID-Net US-X | ✗ | ✓ |
Table 4.
A summary of studies that used the POCUS dataset. ✗ indicates either absent or not discussed in the article, and ✓ indicates present but not discussed in the article.
Table 4.
A summary of studies that used the POCUS dataset. ✗ indicates either absent or not discussed in the article, and ✓ indicates present but not discussed in the article.
| Studies | AI | Loss | Results | Cross-validation | Augmentation/ | Prediction | Code |
|---|---|---|---|---|---|---|---|
| models | Pre-processing | Classes | |||||
| Al-Jumaili et al. [68] | ResNet-18, RestNet-50, NASNetMobile, GoogleNet, SVM | Categorical cross-entropy | Accuracy: 99% | k=5 | ✗ | COVID-19, CAP, Healthy | ✗ |
| Al-Zogbi et al. [70] | DenseNet | L1 | Mean Euclidean error 14.8±7.0 mm | ✗ | ✗ | - | ✗ |
| Almeida et al. [71] | MobileNet | Categorical cross-entropy | Accuracy: 95-100% | ✗ | ✗ | Abnornal, B-lines, Mild B-lines, Severe B-lines, Consolidations, Pleural thickening | ✗ |
| Awasthi et al. [72] | Modified MobileNet, CNN, and other lightweight models | Focal loss | Accuracy 83.2% | k=5 | ✗ | COVID-19, CAP, Healthy | ✗ |
| Barros et al. [69] | POCOVID-Net, DenseNet, ResNet, NASNet, Xception-LSTM | Categorical cross-entropy | Accuracy: 93%, Sensitivity: 97% | k=5 | ✗ | COVID-19, Bacterial Pneumonia, Healthy | Available |
| Born et al. [12] | POCOVID-Net | Categorical cross-entropy | AUC: 0.94, Accuracy: 0.89, Sensitivity: 0.96, Specificity: 0.79, F1-score: 0.92 | k=5 | Rotations of up to 10°; Horizontal and vertical flipping; Shifting up to 10% of the image height or width | COVID-19, CAP, Healthy | ✗ |
| Born et al. [74] | VGG-16 | Categorical cross-entropy | Sensitivity: 0.98±0.04, specificity: 0.91±0.08 | k=5 | Horizontal and vertical flips, rotations up to 10° and translations of up to 10% | COVID-19, CAP, Healthy | ✗ |
| Born et al. [13] | Frame based: VGG-16 Video-based: Models Genesis | Categorical cross-entropy | Sensitivity: 0.90±0.08, specificity: 0.96±0.04 | k=5 | Resizing to 224×224 pixels; Horizontal and vertical flips; Rotation up to 10°; Translations of up to 10% | COVID-19, CAP, Healthy | Available |
| Diaz-Escobar et al. [67] | InceptionV3, ResNet-50, VGG-19, Xception | Cross-entropy | Accuracy: 89.1%, ROC-AUC: 97.1% | k=5 | Rotations (10°), horizontal and vertical flips, shifts (10%), and zoom (zoom range of 20%) | COVID-19, non-COVID | ✗ |
| Gare et al. [15] | U-Net (reverse-transfer learning; segmentation to classification) | Cross-entropy | mIoU: 0.957±0.002, Accuracy: 0.849, Precision: 0.885, Recall: 0.925, F1-score: 0.897 | k=3 | Left-to-right flipping; Scaling grey image pixels; | COVID-19, CAP, Healthy | ✗ |
| Hou et al. [75] | Saab transform based successive subspace CNN model | Categorical cross-entropy | Accuracy: 0.96 | ✗ | Saab transformation | A-line, B-line, Consolidation | ✗ |
| Karar et al. [53] | MobileNets, ShuffleNets, MENet, MnasNet | Categorical cross-entropy | Accuracy: 99% | ✓ | Grayscale conversion | COVID-19, Bacterial Pneumonia, Healthy | ✗ |
| Karar et al. [56] | A semi-supervised GAN, and a modified AC-GAN with auxiliary classifier | Min-Max loss: special form of cross-entropy | Accuracy: 91.22% | ✓ | Grayscale conversion | COVID-19, CAP, Healthy | ✗ |
| Karnes et al. [54] | Few-shot learning (FSL) visual classification algorithm | Mahalanobis distances | ROC-AUC > 85% | k=10 | ✗ | COVID-19, CAP, Healthy | Available upon request |
| Muhammad and Hossain [58] | CNN | Categorical cross-entropy | Accuracy 91.8%, Precision 92.5%, Recall 93.2% | k=5 | Reflection around x- and y-axes; Rotation by [-20°, +20°]; Scaling by a factor [0.8, 1.2] | COVID-19, CAP, Healthy | ✗ |
| Sadik et al. [66] | DenseNet-201, ResNet-152V2, Xception, VGG-19, NasNetMobile | Categorical cross-entropy | Accuracy: 0.906 (with SpecMEn), F1-score: 0.90 | ✓ | Contrast-Limited Adaptive Histogram Equalization | COVID-19, CAP, Healthy | ✗ |
| Perera et al. [55] | Transformer | Categorical cross-entropy | Accuracy: 93.9% | ✓ | ✗ | COVID-19, CAP, Healthy | ✗ |
Table 5.
A summary of studies that used the ICLUS-DB dataset. ✗ indicates either absent or not discussed in the article, and ✓ indicates present but not discussed in the article.
Table 5.
A summary of studies that used the ICLUS-DB dataset. ✗ indicates either absent or not discussed in the article, and ✓ indicates present but not discussed in the article.
| Studies | AI | Loss | Results | Cross-validation | Augmentation/ | Prediction | Code |
|---|---|---|---|---|---|---|---|
| models | pre-processing | Classes | |||||
| Carrer et al. [16] | HMM, VA, SVM | ✗ | Accuracy: 88% (convex probe) 94% (linear probe) | k=10 | ✗ | Severity Score (0, 1, 2, 3) | ✗ |
| Che et al. [17] | Multi-scale residual CNN | Cross-entropy | Accuracy: 95.11%, F1-score: 96.70% | k=5 | Generation of local phase filtered and radial symmetry transformed images | COVID-19, non-COVID | ✗ |
| Dastider et al. [18] | Autoencoder-based Hybrid CNN-LSTM | Categorical cross-entropy | Accuracy: 67.7% (convex probe) 79.1% (linear probe) | k=5 | Rotation, horizontal and vertical shift, scaling, horizontal and vertical flips | Severity Score (0, 1, 2, 3) | Available |
| Frank et al. [19] | ResNet-18, ResNet-101, VGG-16, MobileNetV2, MobileNetV3, DeepLabV3++ | SORD, cross-entropy | Accuracy: 93%, F1-Score: 68.8% | ✗ | Affine transformations, rotation, scaling, horizontal flipping, random jittering | Severity Score (0, 1, 2, 3) | ✗ |
| Roy et al. [20] | Spatial Transformer Network (STN), U-Net, U-Net++, DeepLabV3, Model Genesis | SORD, cross entropy | Accuracy: 96%, F1-score: 61±12%, Precision: 70±19%, Recall: 60±7% | k=5 | ✓ | Severity Score (0, 1, 2, 3) | Available |
| Khan et al. [76] | Pre-trained CNN from [20] | SORD, cross-entropy | Agreement-based scoring (82.3%) | ✗ | ✗ | Severity Score (0, 1, 2, 3) | ✗ |
Table 6.
A summary of studies that used the COVIDx-US dataset. ✗ indicates either absent or not discussed in the article.
Table 6.
A summary of studies that used the COVIDx-US dataset. ✗ indicates either absent or not discussed in the article.
| Studies | AI | Loss | Results | Cross-validation | Augmentation/ | Prediction | Code |
|---|---|---|---|---|---|---|---|
| models | pre-processing | Classes | |||||
| Adedigba and Adeshina [59] | SqueezeNet, MobileNetV2 | Categorical cross-entropy | Accuracy: 99.74%, Precision: 99.58%, Recall: 99.39% | ✗ | Rotation, Gaussian blurring, random zoom, random lighting, random warp | COVID-19, CAP, Normal, Other | ✗ |
| Azimi et al. [73] | InceptionV3, RNN | Cross-entropy | Accuracy: 94.44% | ✗ | Padding | Positive (COVID-19), Negative (non-COVID-19) | Available |
| MacLean et al. [77] | COVID-Net US | Cross-entropy | ROC-AUC: 0.98 | ✗ | ✗ | Positive (COVID-19) Negative (non-COVID-19) | Available |
| MacLean et al. [78] | ResNet | Categorical cross-entropy | Accuracy: 0.692 | ✗ | ✗ | Lung ultrasound severity score (0, 1, 2, 3) | ✗ |
| Zeng et al. [79] | COVID-Net US-X | Cross-entropy | Accuracy: 88.4%, AUC: 93.6% | ✗ | Random projective augmentation | Positive (COVID-19) Negative (non-COVID-19) | ✗ |
Disclaimer/Publisher’s Note: The statements, opinions and data contained in all publications are solely those of the individual author(s) and contributor(s) and not of MDPI and/or the editor(s). MDPI and/or the editor(s) disclaim responsibility for any injury to people or property resulting from any ideas, methods, instructions or products referred to in the content. |
© 2023 by the authors. Licensee MDPI, Basel, Switzerland. This article is an open access article distributed under the terms and conditions of the Creative Commons Attribution (CC BY) license (http://creativecommons.org/licenses/by/4.0/).
Copyright: This open access article is published under a Creative Commons CC BY 4.0 license, which permit the free download, distribution, and reuse, provided that the author and preprint are cited in any reuse.


