
Submitted:
03 March 2023
Posted:
06 March 2023
You are already at the latest version
Abstract
Cream cheese presents a favorable environment for the growth of pathogenic and spoilage microorganisms. The antimicrobial and antioxidant effects of plant extracts are well known, but their use is limited because they affect the physicochemical and sensory characteristics of products. Encapsulation presents an option to limit or prevent these changes. The paper presents the composition of individual polyphenols (HPLC–DAD-ESI-MS) from basil extracts (BE) with significant antioxidant activity (644.75±21.37 mM Trolox/g DW) and inhibitory effect against strains of Staphylococcus aureus, Geobacillus stearothermophilus, Bacillus cereus, Candida albicans, Enterococcus faecalis, Escherichia coli, and Salmonella Abony. The basil extract was encapsulated in sodium alginate (Alg) using the drop technique. The encapsulation efficiency of microencapsulated basil extract (MBE) was 78.59±0.01%. SEM and FTIR analyzes demonstrated the existence of weak physical interactions between the components. In the optimal concentration range of 0.6-0.9% MBE determined the inhibition of the post-fermentation process and the improvement of the degree of water retention. This led to the improvement of the textural parameters of the cream cheese, contributing to the extension of the shelf life of the product by 7 days. The influence of storage period and MBE concentration on texture parameters, pH and sensory analysis (overall acceptability) were evaluated by mutual information analysis.
Keywords:
microencapsulated basil extract
; antimicrobial activity
; cream cheese
; quality
; shelf life.
1. Introduction
A growing demand for safe, natural and synthetic preservative-free food products leads researchers to develop new alternatives and sustainable approaches for food preservation [1]. Cheeses are dairy products widely consumed throughout the world as part of a regular diet and are valued for their high content of proteins, fats, mineral (especially calcium) and vitamins [2]. Cream cheese is a fresh soft cheese used as an ingredient in many food applications [3]. Due to the high moisture content and a favorable pH, cream cheese is considered an optimal environment for the growth of pathogenic and spoilage microorganisms [4]. The addition of preservatives is one of the most used methods of ensuring the antimicrobial stability of cheeses [5]. Effective replacement of preservatives (e.g., sorbates, nitrites, etc.) is the focus of various studies, recently reviewed [6]. Extracts and essential oils from aromatic plants have attracted the attention of the scientific community regarding their safety as natural ingredients as well as their wide application in the food industry [3,5,7,8,9]. Basil extract is characterized by high antioxidant and antimicrobial activity [9,10], contributing to reducing the population of pathogenic microorganisms and to the expansion of shelf life of perishable food products [11]. Direct addition of aromatic plants to food products is the most common method applied in industry [12]. However, their use is still limited in food products because they can negatively affect the sensory and physicochemical characteristics of the products [13], they can interact with the components in food matrix [14], as well as they are unstable to variations in pH, temperature, presence of light, etc. [15]. Moreover, the utility of bioactive compounds is, indispensably, related to their bioavailability [16]. Microencapsulation is considered an effective technology that ensures higher stability of bioactive compounds during the manufacture of cheeses, preserving their antioxidant and antimicrobial activity throughout the products’ shelf life [17,18]. Recently, it has been reported about the functional activity of bioactive compounds from plant extracts encapsulated in various dairy products, especially cheeses and yogurts [19,20,21,22]. Therefore, the objective of this work was to evaluate the antioxidant and antimicrobial activity of basil extract, the efficiency of its microencapsulation, as well as the effect of the addition of microencapsulated basil extract on the sensory, physicochemical and textural properties of cream cheese during its shelf life.
2. Results and Discussion
2.1. Total Polyphenol Content and Antioxidant Activity of Basil Extract
The total polyphenol content (TPC) determined from the basil extract (BE) was 26.18±0.21 mg gallic acid equivalent (GAE)/g dry weight (DW). Comparing the result obtained with the one from the literature, it was found that they are comparable. Thus, Nguyen et al. [23] determined in basil leaves the TPC of 29.60 mg GAE/g DW. The TPC depending on the varieties and the part of plant from which the extract was obtained varied between 2.30-7.11 mg GAE/g fresh weight (FW) [24]. Also, the TPC from basil collected from different regions of the world varied between 2086-25593 mg GAE/100 g DW [25].
Individual polyphenolic compounds in BE were identified using the high-performance liquid chromatography equipped with photodiode array detection-mass (HPLC–DAD-ESI-MS) method (Table 1).
As shown in Table 1, a total of nine phenolic compounds were detected in BE. The compounds were assigned to phenolic acids (methyl-rosmarinate, rosmarinic acid, rosmadial, carnosol, dehydrodiferulic acid and chicoric acid) and to flavonoids (luteolin-glucoside, querectin-rutinoside and epigallocatechin). In terms of quantification, methyl-rosmarinate and rosmarinic acid, proved to be the most abundant in the studied BE (17.08 mg/g DW and 13.81 mg/g DW respectively). The results obtained in this study are in agreement with other studies [26,27,28], where rosmarinic acid is reported to be the most represented phenolic acid in basil. BE showed chicoric acid and dehydrodiferulic acid values of 1.3 mg/g DW and 3.1 mg/g DW, respectively. Ghasemzadeh et al. [29] identified the ferulic acid content was 3.29 mg/100 g dry material in sweet basil leaf extracts. Khatib et al. [28] reported higher values of chicoric acid in Moroccan sweet basil (9.1 mg/g dry extract) and a lower content of carnasol (3.2 mg/g dry extract) compared to our results.
Regarding flavonoids, luteolin-glucoside (0.85 mg/g DW), querectin-rutinoside (0.75 mg/g DW) and epigallocatechin (0.72 mg/g DW) were detected in BE. The content of quercetin and catechin in sweet basil leaf extracts reported in studies by Ghasemzadeh et al. [29] was 2.73 and 2.61 mg/100 g dry material, luteolin was not identified. Discrepancies between the levels of phenolic compounds in basil extracts reported in the literature may occur due to different cultivation and post-harvest conditions, as well as different cultivars and methods of obtaining BE. For the BE antioxidant capacity determination, the linear equation of the standard calibration curve: y = 0.1784x + 0.0094 (R2 = 0.9994) was used. The antioxidant capacity of the BE, expressed as Trolox equivalents, was 644.75 mM Trolox/g DW. Other authors found 19.91 mM Trolox/g DW in 80% methanol basil extract [30], 162.16 mM Trolox/g DW in water basil extract [28], 492.22 mM Trolox/g DW in 96% ethanol basil extract [31].
2.2. Antibacterial Activity of Basil Extract
Originally, the in vitro antibacterial activity of BE against microorganisms was qualitatively assessed by the presence or absence of zones of inhibition. The extract exhibited antibacterial activity against Gram-positive, Gram-negative bacteria and yeast. A potent inhibitory effect was demonstrated against strains of Staphylococcus aureus, Geobacillus stearothermophilus, Bacillus cereus, and Candida albicans, with diameters of inhibition zones ranging from 11.0 to 26.3 mm, as shown in Table 2. A lower inhibitory effect was recorded against Enterococcus faecalis, Escherichia coli, and Salmonella Abony strains, with the diameter of the zone of inhibition equal 8.3 mm.
The results of the study on the minimum inhibitory concentration (MIC) and minimum bactericidal concentration (MBC) values of the BE are presented in Table 2. MIC for strains of Staphylococcus aureus, Geobacillus stearothermophilus, and Acinetobacter baumannii were 11.2 mg/mL, and for Bacillus cereus, Escherichia coli, and Candida albicans – 22.5 mg/mL. Antimicrobial inhibitory activity in higher concentrations was recorded on strains of Enterococcus faecalis and Salmonella Abony – 45.0 mg/mL.
The BE showed a bactericidal and fungicidal effect at a concentration of 22.5 mg/mL on the bacteria Bacillus cereus, Geobacillus stearothermophilus and the yeast Candida albicans. The bacteria Staphylococcus aureus, Escherichia coli, Salmonella Abony, and Acinetobacter baumannii were killed at concentrations of 45.0 mg/mL, and Enterococcus faecalis - 90.0 mg/mL. The blind control did not inhibit the growth of the tested bacteria.
Antimicrobial resistance is a serious threat to human health worldwide. The development of new antimicrobials has slowed dramatically since the golden age of their discovery in the 1950s. The costs of researching and developing a new antibiotic, until bringing it to market, are high and the return on investment is low. To counter the lack of new antibacterial, as well as the rise of antibiotic resistance, plants could represent a potential solution. Plants produce a variety of secondary metabolites, which play a major role in how they adapt to their environment, providing them with effective defense mechanisms to combat pests and pathogens. In addition, plants provide great biodiversity, with the most recent estimates placing the total number of plant species at approximately 374,000, of which approximately 290,000 plant species have countless unstudied secondary metabolites [32]. In this field, certain natural compounds of vegetable origin, such as essential oils, alkaloids, lectins, polypeptides, flavones, flavanols, coumarins, terpenoids and tannins, have emerged as potential therapeutic tools.
Currently, among the most known and studied mechanisms of action of antimicrobial agents are related to a wide variety of bacterial targets and processes, such as inhibition of protein synthesis, inhibition of metabolic pathways, interference with cell wall synthesis, inhibition of deoxyribonucleic acid (DNA) and ribonucleic acid (RNA) synthesis, but also the lysis of the bacterial membrane. The most common and studied mechanisms of bacterial resistance to antibacterial agents are antibiotic modification by enzymes, antibiotic inactivation, and expression of efflux pumps [33].
Various studies have demonstrated and reported that many plant extracts have antimicrobial properties [34,35,36]. Plant extracts, due to their antibacterial, antifungal, antioxidant and anticarcinogenic properties, can be used as natural additives in many foods, and the use of plant extracts can improve food safety and overall microbial quality [37,38].
In this study, the BE exhibited potential activity against some of the representative foodborne pathogenic bacteria such as Bacillus cereus, Staphylococcus aureus, Escherichia coli, and Salmonella Abony. Antibacterial activities of plant extracts have also been reported in other studies [39,40].
The reported results from different studies are difficult to compare, probably because of the different methods of testing bacterial strains and sources of antimicrobial samples used. A previous study showed that the methanolic extract of Ocimum basilicum L. from Turkey weakly inhibited the growth of bacterial strains from the genera Bacillus, Escherichia and Staphylococcus with inhibition zones of 7–12 mm, while only Acinetobacter was strongly inhibited (17 mm) [41].
2.3. Microencapsulated Basil Extract Characterization
The basil extract was encapsulated in sodium alginate (Alg) using the drop technique. Physicochemical parameters of the obtained microencapsulated basil extract (MBE) were: moisture - 6.21±0.08%, swelling index - 87.4±0.4% and solubility - 22.1±1.1%. The scanning electron microscope (SEM) images of the MBE are presented in Figure 1.
SEM analysis showed that MBE had a rough surface. Similar results were obtained, also by other authors [42,43].
The characteristic absorption peaks of Alg (Figure 2) can be assigned as follow: 3434 cm-1 (stretching vibrations of -OH groups), 2924 and 2855 cm-1 (asym. and sym. stretching peaks of CH2 groups), 1624 and 1416 cm-1 (asym. and sym. stretching peaks of COO- salt groups), 1301 cm-1 (C–O stretching), 1173 and 1124 cm-1 (C–C stretching), 1095 and 1031 cm-1 (stretching of groups C-O and C–O–C in mannuronic and guluronic units, respectively) [44], 946 cm-1 (C–O stretching of pyranosyl ring and the C–O stretching with contributions from C–C–H and C–O–H deformation), 818 cm-1 (C-O vibration of groups in α-configuration of the glucuronic units) [45].
The Fourier-Transform Infrared (FTIR) spectrum of BE (Figure 2) showed the characteristic vibrational bands at 3395 cm-1 (phenolic O-H); 2923 and 2851 cm-1 (alkane C-H); 1728 cm-1 (carbonyl -C=O), 1615 cm-1 (alkene -C=C-), 1518 cm-1 (aromatic -C=C-), 1377 cm-1 (alkane –C-H), 1265 cm-1 (ether C-O-C), 1154 and 1103 cm-1 (alcohol -C-O), and 622 cm-1 (C-Cl) [46].
The FTIR spectrum of MBE (Figure 2) shows wider absorption bands of lower intensity, but the characteristic vibrational bands of both components can be found in the spectrum, slightly shifted. Thus, the –C=O stretching is shifted from 1728 cm-1 to 1740 cm-1, the –C=C- of extract and –COO- vibration of alginate shifted from 1615 cm-1 and 1624 cm-1, respectively to 1629 cm-1. The vibrational bands of BE from 1103 and 1072 cm-1 were shifted and appear as a broad band with maxima at 1086 cm-1.
The changes identified in the MBE mixture spectrum compared to the spectra of its components, Alg and BE, can be attributed to the existence of weak physical interactions between the components. Therefore, by encapsulating basil extract with sodium alginate as the coating material, the formed microcapsules can serve as polyphenol carriers for food.
The encapsulation efficiency of MBE was 78.59±0.01%, which is considered high efficiency. According to the studies carried out by Tomé et al. [47], encapsulation efficiency of hydroethanolic extracts of basil, parsley, rosemary, thyme, chervil varied from 68.24% to 93.39%, with higher results for rosemary. The high encapsulation efficiency of MBE demonstrates the formation of stable interactions between the reactive sites of Alg and BE.
2.4. Cream Cheese Fortified with Microencapsulated Basil Extract Characterization
2.4.1. Physicochemical Analysis of the Cream Cheese Fortified with Microencapsulated Basil Extract
The physicochemical parameters of cream cheese fortified with MBE on the first day of storage are presented in Table 3.
Physicochemical parameters of cream cheese were not insignificantly influenced by the addition of MBE. Increasing MBE concentration in cream cheese led to a slight decrease in moisture, protein and fat content in the ranges 65.68-64.91%, 5.82-5.73% and 23.04-22.72%, respectively. The sodium alginate in the MBE composition led to the retention of free water and, respectively, to a decrease in the moisture content of the cream cheese samples. The positive effect of hydrocolloids on water retention in Labneh cheese fortified with alginate-encapsulated pepper extracts was also observed by Balabanova et al. [48]. A similar behavior was previously reported in cottage cheeses with microencapsulated fennel extract [20], soft cheese supplemented with encapsulated olive phenolic compounds [19] and ultrafiltered cheese with encapsulated plant phenolic extracts [21].
2.4.2. Evolution of the Cream Cheese Fortified with Microencapsulated Basil Extract Characteristics during Storage
Sensory properties of the cream cheese fortified with MBE, including appearance, texture, odor, taste, and overall acceptability, were evaluated during the 28-day storage period at 4°C, and the results are shown in Table 4.
The appearance of the CC on the first day of storage was characterized by a homogeneous, slightly yellowish paste, without whey removal, in the case of cream cheese fortified with MBE –uniform distribution of microcapsules in the cream cheese mass. All cream cheese samples were rated 5.00 points. The texture of CC, as well as that fortified with MBE on the first day of storage, was characterized by a fine, creamy paste. The addition of 1.2% MBE gave the cream cheese a lingering smell and taste of basil that intensified during storage, leading to a drop in the taste score to 4.20.
On the 21st day, the taste of CC and 0.3%CCMBE became slightly sourer and as a result the accumulated overall acceptance was 4.83 and 4.15 points, respectively. And on the 28th day of storage, the texture of these samples became slightly softer and at the taste level a slightly rancid taste appeared as a result of the chemical and oxidative reactions of the lipids. In the case of the 0.6%CCMBE and 0.9%CCMBE samples, no changes in sensory quality were observed during the 28 days of storage. The addition of MBE, at concentrations higher than 0.3%, had a favorable impact on the storage stability of cream cheese compared to CC. This fact is due to the stability and gradual release of polyphenolic compounds from microcapsules with antioxidant and antimicrobial effect in cheeses [38].
According to the results of the sensory analysis, the optimal concentration of MBE in the cream cheese is in the range of 0.6-0.9%, an addition of 0.3% MBE to the cream cheese does not ensure sufficient stability of the product during storage, and when the concentration of MBE increases above 0.9% appears a residual taste of basil even from the first day of storage. These findings are consistent with those of the study by Azarashkan et al. [49], in which it was shown that the fortification of ricotta cheese with nano-encapsulated broccoli sprout extract had no significant effect on the texture, color and smell of the cheeses on the first day. And research on the effect of the fortification of white soft cheese white olive polyphenols capsules [19] and ultrafiltered cheese white red beet, broccoli, and spinach leaf phenolic extracts encapsulated by complex coacervation [21] noted that the fortified samples obtained higher overall acceptance compared to the control sample.
The pH values of cream cheese fortified with MBE, during the 28-day storage period at 4°C, are shown in Table 5.
According to the data presented in Table 5, the addition of MBE slightly reduced the pH of the cheese cream samples analyzed on the first day of storage. CC had the highest pH, while the addition of MBE led to a decrease in pH from 5.35 in the case of 0.3%CCMBE to 5.26 in the case of 1.2%CCMBE. The decrease in pH in cream cheese samples with the addition of MBE occurs as a result of the gradual release of phenolic acids from BE, a fact also confirmed by the research carried out by Hala et al. [50].
Subsequently, during the storage period, the pH of the CC sample as well as the cream cheese with MBE decreased gradually. Although the initial pH of the CC sample was higher than that of the CCMBE samples, at the end of storage the pH was lower than that of the rest of the samples. On the 28th day of storage, the pH values of the cream cheese varied between 5.12 (CC) and 5.20 (1.2%CCMBE). The addition of MBE in cream cheese samples from 0.6 to 1.2% inhibited the post-fermentation process during storage, the pH decrease being more evident in CC. Therefore, MBE prevents the development of microorganisms during storage, which demonstrates their preservation potential. Similarly, Weragama et al. [3] observed that untreated cream cheese showed lower pH values compared to samples of cream cheeses fortified with dried curry leaves (Murraya koenigii L.) powder during storage. Azarashkan et al. [49] reported that the pH value of the samples of ricotta cheese with nano-encapsulated broccoli sprout extract was higher than that of the control. In the study by Balabanova et al. [48], the incorporation of pepper extracts encapsulated in Labneh cheese did not show a significant effect on the pH of the samples.
Texture profile analysis (TPA) is determined by the type of cheese and corresponds to its sensory characteristics [51]. Table 6 shows the texture parameters (hardness, springiness, cohesiveness, adhesiveness and gumminess) of the cream cheese analyzed during the 28-day storage period at 4°C.
The chemical composition of cheeses is one of the important factors affecting their textural properties [19]. Another factor that affects the textural properties of cheeses is pH. In this sense, Soodam et al. [51] determined that curd obtained by coagulation under the action of chymosin at pH 6.5 was harder than that obtained at pH 6.1. In this study, increasing the concentration of MBE addition in cream cheese led to a slight reduction in protein, fat, and pH value and as a result decreased hardness and adhesiveness of fortified cream cheese, ranging from 1914.1 g (CC) to 1439.8 g (1.2%CCMBE) and from 2252.0 g⋅s (CC) to 1648.4 g⋅s (1.2%CCMBE), respectively. Along with the increase in MBE concentration in cream cheese, an increase in cohesiveness and gumminess was also found from 0.462% (CC) to 0.568% (1.2%CCMBE) and from 884.3% (CC) to 1009.9% (1.2%CCMBE). The addition of MBE to the cream cheese did not influence the springiness of the analyzed cream cheese. Similar results were also obtained when fortifying ricotta cheese with nano-encapsulated broccoli sprout extract [49], low-fat cut cheese with nanoemulsion-based edible coatings containing oregano essential oil and mandarin fiber [52] and fresh cheese with microcapsules or nanoemulsions with Opuntiaoligacantha [53].
During the 28-day storage, the hardness and adhesiveness of the analyzed cheese cream registered an essential increase, and the cohesiveness and gumminess of the samples gradually decreased, with the exception of the CC sample which, on the 28th day of storage, registered a deterioration of the parameters of texture. The improvement in texture parameters of the fortified cream cheese samples is probably due to the better water-holding capacity in the cream cheese fortified with MBE samples compared to the cream cheese without addition. Texture parameters, except springiness, were influenced by increasing MBE concentration in the samples. During the 28-day storage period, in the case of the 0.9%CCMBE sample, the hardness and adhesiveness increased from 1891.2g to 3225.6g and from 2134.5 g⋅s to 3841.4 g⋅s, respectively. But cohesiveness and gumminess decreased from 0.534% to 0.247% and from 935.7% to 819.3%, respectively.
In general, the texture parameters of the cream cheese samples with the addition of MBE correlated with their sensory properties (Table 4) and their pH values (Table 5). The addition of 0.6-0.9% MBE in the cream cheese determined the inhibition of the post-fermentation process, the improvement of the degree of water retention and the textural parameters of the cream cheese, thus contributing to the extension of the shelf life of the cream cheese by 7 days, compared to the control sample.
The 1.2%CCMBE sample demonstrated high textural parameters, however, from a sensory point of view, it was rated low due to too pronounced basil taste. An addition of 0.3%MBE to the cream cheese does not ensure sufficient stability of the product during the 28 days of storage.
Therefore, the sodium alginate-based microcapsules ensured stability of the polyphenolic and bioactive compounds of the basil extract and, in this way, led to the controlled release of the functional compounds from the cream cheese during the storage period.
2.5. Mathematical Modeling
The measure of influence of the storage period and concentrations of MBE added to the cream cheese samples on the texture parameters, the pH values and the sensory analysis (overall acceptability) were evaluated by analysis of mutual information. This mathematical modeling method was also applied in the study of the influence of storage days and the concentration of apple powder on the textural parameters and the general acceptability of yogurt, for 20 days [54]. The study of the influence of physicochemical quality indicators on the textural characteristics of dry-aged beef, for 35 days and different quantities of sea buckthorn and rose hip on the quality of flour products was also evaluated by applying analysis of mutual information [55,56,57]. Figure 3 demonstrates the mutual analysis of the influence of storage days on the textural parameters (adhesiveness, cohesiveness, hardness, gumminess, springiness), the pH and the overall acceptability of cream cheese samples.
As shown in Figure 3, the storage period of the cream cheese samples with different concentrations of MBE addition did not essentially influence the overall acceptability (0.078 bits), the texture parameter (springiness – 0.023 bits) and the pH (0.001 bits). The highest information analysis values for texture characteristics were obtained for the hardness (0.422 bits), followed by the cohesiveness (0.348 bits), the adhesiveness (0.311 bits) and the gumminess (0.125 bits).
Figure 4 demonstrates the effects of the different concentrations of MBE that were added to the cream cheese samples on the pH, the overall acceptability and on the textural parameters.
Figure 4 shows that the concentration of the MBE added to the samples essentially influenced the pH (0.659 bits), the textural parameter- gumminess (0.416 bits) and the overall acceptability of the cream cheese (0.331 bits). In the case of the other textural characteristics (adhesiveness, cohesiveness, hardness and springiness) the influence of concentration of the MBE was not essential.
3. Materials and Methods
3.1. Materials
The plant material used in this study consisted of leaves collected from the plants of basil (Ocimum basilicum L.) harvested during August 2022 from AromeNature, Peticeni commune, Calarasi, Republic of Moldova (47°14′10″N 28°12′31″E). Basil leaves were dried at 60 ± 1°C and stored in dark packages at room temperature until extraction. Milk containing 3.8% fat, 3.1% protein and 4.5% lactose, according to the information on the label, was purchased from JLC, Republic of Moldova. Freeze-dried, direct vat set (FD-DVS) starter culture contains de Lactococcus lactis subsp. lactis and Lactococcus lactis subsp. cremoris (CHOOZIT MA 14 LYO, Danisco, France). Coagulant (Marzyme XT 850 IMCU, Danisco, France). Folin–Ciocalteu reagent, sodium carbonate (Na2CO3) and DPPH (2,2′- diphenyl–picrylhydrazyl), calcium chloride, sodium alginate were purchased from Merck (Darmstadt, Germany), gallic acid equivalent (GAE) were acquired from Sigma-Aldrich (Darmstadt, Germany), absolute ethanol and methanol were supplied from Chimopar (Bucharest, Romania). Acetonitrile, HPLC-gradient and the ultrapure water was produced with a Direct-QR 3 UV Water Purification System, Merck (Darmstadt, Germany). The pure standard of chlorogenic acid (>98% HPLC), luteolin (>99% HPLC), gallic acid (>99% HPLC) and cyanidin (>99% HPLC), were purchased from Sigma (USA). All reagents used in this study were of analytical grade.
3.2. Extraction and Characterization of Basil Extract
3.2.1. Preparation Basil Extract
In order to obtain the hydroalcoholic extract of basil, a mixture of the dry plant and 60% v/v ethanol in a ratio of 1:10 was sonicated in an Elma Ultrasonic bath (Transsonic T 310 at 35 kHz and installed power of 95 W) for 30 minutes at room temperature. Finally, the mixture was centrifuged for 10 minutes at 7000 rpm, filtered and stored at 4°C until further analysis.
3.2.2. Total Polyphenol Content
The obtained extract was characterized in terms of the TPC according to the Folin-Ciocalteu method [58]. First, 5 mL of double distilled water, 1 mL of extract and 0.5 mL of Folin-Ciocalteu reagent were added to a 10 mL graduated flask. The mixture was stirred, then left to stand for 3 minutes, and then 1.5 mL of Na2CO3 (5 g/L) was added. After filling the flask up to 10 mL with double distilled water, it was kept for 16 min at 50°C (in a water bath), then allowed to cool to room temperature. After cooling, the absorbance of the mixture was read against the control sample (double distilled water) at 765 nm using a UV-VIS T80 spectrophotometer (PG Instruments Limited, Leicestershire, UK). The calculation of the TPC was made with the help of the standard curve of gallic acid equivalent (GAE), drawn for the interval 0.002 - 0.8 mg/mL. The results were expressed in mg gallic acid equivalent per g of dried weight (DW) of BE (mg GAE/g DW).
3.2.3. HPLC-DAD-ESI-MS Analysis of Polyphenols
Analysis was carried out using an Agilent HP-1200 liquid chromatograph equipped with a quaternary pump, autosampler, DAD detector and MS-6110 single quadrupole API-electrospray detector (Agilent Technologies, CA, USA). The positive ionization mode was applied to detect the phenolic compounds; different fragmentor, in the range 50-100 V, were applied. The column was an Eclipse XDB-C18 (5 μm; 4.5x150 mm i.d.) from Agilent. The mobile phase was (A) water acidified by acetic acid 0.1% and (B) acetonitrile acidified by acetic acid 0.1%. The following multistep linear gradient was applied: start with 5% B for 2 min; from 5% to 90% of B in 20 min, hold for 4 min at 90% B, then 6 min to arrive at 5% B. Total time of analysis was 30 min, flow rate 0.5 ml/min and oven temperature 25±0.5 °C. Mass spectrometric detection of positively charged ions was performed using the Scan mode. The applied experimental conditions were: gas temperature 350 °C, nitrogen flow 7 l/min, nebulizer pressure 35 psi, capillary voltage 3000 V, fragmentor 100 V and m/z 120-1200. Chromatograms were recorded at wavelength λ = 280, 340, and 520 nm and data acquisition was done with the Agilent ChemStation software. The content of specific polyphenols was determined by comparison of retention times and peaks with the ones from the chromatogram of a synthetic mix containing the standards listed in Table 7.
3.2.4. Antioxidant Activity
The antioxidant activity by reaction with DPPH radical was determined according to slightly modified method of Brand-Williams et al. [59]. Thus, the antioxidant activity of the basil extract was determined by adding 0.001 mL extract to 3.9 mL of DPPH radical solution (0.005 g/200 mL methanol), respectively 3.9 mL methanol (control). The mixtures were left to stand in the dark for 10 minutes, then the absorbance at 515 nm was read with the UV-VIS T80 spectrophotometer (PG Instruments Limited, Leicestershire, UK). The results were calculated from the Trolox calibration curve, drawn for concentrations in the range of 0.004 - 3.2 mM, and the results were expressed in mM Trolox /g DW.
3.2.5. Antimicrobial Activity
For this analysis and for the preparation of microencapsulated basil extract, BE was used from which the alcohol was evaporated in a Heidolph Rotavapor (Heidolph Instruments GmbH & Co, Schwabach, Germany) at a temperature of 40°C and a pressure of 175 mbar.
Test Microorganisms
Microorganisms used for antimicrobial assay contain Gram-positive bacteria: Staphylococcus aureus ATCC 25923, Bacillus cereus ATCC 11778, Enterococcus faecalis ATCC 19433, Geobacillus stearothermophilus ATCC 7953, Gram-negative bacteria: Escherichia coli ATCC 25922, Acinetobacter baumannii ATCC® BAA-747, Salmonella Abony NCTC 6017, and yeast Candida albicans ATCC 10231. Standard bacterial cultures were offered by the Discipline of Microbiology and Immunology, Nicolae Testemitanu State University of Medicine and Pharmacy (Chisinau, Republic of Moldova).
Agar Well Diffusion Method
For the quality antimicrobial activity screening of the studied biologic compounds the well method was used, which is standardized for microbial activity control and proposed by the CLSI standard (Clinical&Laboratory Standards Institute). Wells with a diameter of 6±0.1 mm were made on Müeller-Hinton agar plates and the distances between neighboring wells and to the edge of the plate were equal. The plates were inoculated with a sterile swab moistened with microbial suspension according to the 0.5 Mac Farland turbidity standard. Equal volumes of tested compound and solution of positive control were introduced into the formed wells. To minimize differences caused by the time intervals at which the test compounds were applied, the plates were left at room temperature for 1-2 hours, then thermostated at 37°C for 24-48 hours. The total inhibition area diameter for microbial culture growth (including the wells diameter) was measured with the digital caliper at a 0,1 mm accuracy [60,61].
Minimal Inhibitory Concentration and Minimum Bactericidal Concentration
The method of two-fold dilution is a quantitative method for determining the MIC, that is the minimum quantitative value capable of suppressing the growth of microorganisms. To determine the MIC, for each derivative, a discontinuous concentration gradient was created in tubes with Müeller-Hinton broth. Then, 100μL of bacterial suspension corresponding to 0.5 McFarland turbidity standard was added to each tube. The tubes were incubated at the cardinal temperature for the growth, of the tested species. This was followed by the determination of the MIC value by macroscopic examination of the tubes in order to test the presence or absence of growth of tested microorganisms. The lowest concentration in the tube in which the visible growth of the culture was inhibited represents the MIC value (µg/mL) for the tested compound. In the other tubes and in the control tube, the turbidity of the medium is attested as a result of the multiplication of microorganisms. This method also permitted the determination of the MBC value for the tested compound. For determination of MBC, from each dilution were subcultured on Müeller-Hinton agar plates and subsequent incubation of the plates and riding of the results. The MBC value is given by the lowest concentration of the tested compound that reduces the number of colonies on the plate by up to 99.9%. All assays were performed in triplicate [62].
3.3. Preparation and Characterization of Microencapsulated Basil Extract
3.3.1. Preparation Microencapsulated Basil Extract
Microencapsulated basil extract (MBE) in sodium alginate were done according to a slightly modified method of Rijo et al. [63]. Thus, a mixture of sodium alginate (0.6 g) and ultrapure water (20 mL) was stirred on a plate at 40°C for 1 h and 400 rpm. After cooling to room temperature, 10 mL of BE were added with stirring, continuing the stirring for another 10 minutes. The resulting solution was added to a 0.2 M CaCl2 solution using a syringe. The addition of the mixture was carried out under continuous stirring, in a time interval of 20 min. The stirring continued for another 15 minutes, after which the beads were washed three times with ultrapure water and then lyophilized.
3.3.2. Physicochemical Analysis
3.3.3. Scanning Electron Microscope
The scanning electron microscope (SEM) Hitachi SU8230 (Hitachi, Tokyo, Japan) was used for the morphological examination of the samples.
3.3.4. Fourier-Transform Infrared Spectroscopy
FTIR spectra were recorded using a FT/IR-6100 FTIR spectrometer (JASCO International CO., LTD., Tokyo, Japan) in the 4000 to 400 cm-1 spectral range, with 4 cm-1 resolution by the KBr pellet technique. Each sample has been dispersed in about 300 mg of anhydrous KBr mixed an agate mortar. The pellets were obtained by pressing the mixture into an evacuated die. The spectra were collected and analyzed with Jasco Spectra Manager v.2 software.
3.3.5. Encapsulation Efficiency
The encapsulation efficiency of the MBE was determined according to Machado et al. [66]. Accordingly, 2.5 mg of beads and 5 mL of sodium citrate (3% w/v) were sonicated for 30 minutes. In the end, it was centrifuged for 30 minutes at 14,000 rpm and TPC in the supernatant was determined in as described in Section 3.2.2. The encapsulation efficiency (%) was determined using to the following formula:
where: is the total polyphenols content of BE used for encapsulation and is the total polyphenols content of supernatant (i.e., non-encapsulated polyphenols).
3.4. Preparation and Characterization of Cream Cheese with Microencapsulated Basil Extract
3.4.1. Preparation Cream Cheese with Microencapsulated Basil Extract
Standardized milk with 3.8% fat content was pasteurized at 63–68°C for 30 minutes and cooled to 30–32°C. Later, 5 DCU/100 L milk of mesophilic starter culture CHOOZIT MA 14 LYO and 0.05% v/v coagulant Marzyme XT 850 IMCU were added to the milk. The milk was mixed and coagulated for 2.0-2.5 hours until a firm curd was formed. The curd was cut, mixed and dehydrated in lavsan bags for 1 hour. Afterwards, the cheese was removed from the bags and cooled to 6-10°C. To obtain the cream cheese, the cheese was pasted with salt (0.7% w/w) and different levels of MBE (0.3%, 0.6%, 0.9%, and 1.2%, relative to the cream cheese). Cream cheese samples were stored in sterilized airtight containers at 4°C until further analysis.
3.4.2. Physicochemical Analysis
Fat content was determined by gravimetric methods [67]. Moisture content was determined by ISO 5534:2004 [68]. Protein content was determined by Kjeldahl methods [69]. The pH was measured with a Titrator SI Analytics TitroLine® 5000 (Xylem Analytics, Letchworth, UK), at 20°C. Physicochemical properties, except of pH, were determined only on the first day of storage.
3.4.3. Sensory Analysis
The sensory analysis of the cream cheese samples was determined using the 5-points scoring scale, according to ISO 22935-3:2009 [70], by a panel of 11 assessors who were selected according to ISO 8586:2012 [71]. Appearance, texture, odor, and taste were evaluated. In scoring each property, the numerical discrete interval scale was used, as follows: 5 points-no deviation from the pre-established sensory specification; 4 points-minimal deviation from the pre-established sensory specification; 3 points-noticeable deviation from the pre-established sensory specification; 2 points-considerable deviation from the pre-established sensory specification, and 1 point-very considerable deviation from the pre-established sensory specification. Sensory properties of the cream cheese must correspond to the quality requirements for milk and dairy products [72] (Table 8).
Overall acceptability of the cream cheese samples was expressed by the total score given by the panel of assessors. To calculate the total score, the average scores per sensory property were added and divided by the number of sensory properties. The sensory analysis of the cream cheese samples was determined at different storage periods (1, 7, 14, 21 and 28 days).
3.4.4. Texture Profile Analysis
Texture Profile Analysis (TPA) of the cream cheese samples were analyzed with a TA. HD Plus C Texture Analyzer (Stable Micro Systems, Godalming, UK), according to Popescu et al. [54]. Textural parameters were determined on the 1st, 7th, 14th, 21th, and 28th days.
3.5. Mathematical Modeling
The MATLAB program (MathWorks, Inc., Natick, MA, USA) was applied to the information analysis in order to determine the influence of storage time and concentrations on textural parameters, pH and general acceptability of cream cheese samples. Names of textural parameters, pH and overall acceptability are shown in the rectangles of the graph. The mutual information values, measured in bits, are indicated on the graph arrows. The more pronounced the influence of storage time and concentrations of MBE addition on textural parameters, pH and overall acceptability, the higher the bit value [73].
3.6. Statistical Analysis
All calculations were performed using Microsoft Office Excel 2007 (Microsoft, Red-mond, WA, USA). Data obtained in this study are presented as mean values ± the stand-ard error of the mean, calculated from three parallel experiments. The comparison of av-erage values was based on the one-way analysis of variance (ANOVA), according to Tuk-ey’s test, at a significance level of p ≤ 0.05, using the Staturphics program, Centurion XVI 16.1.17 (Statgraphics Technologies, Inc., The Plains, VA, USA).
4. Conclusions
It was established that BE has an important content of phenolic compounds (26.18±0.21 mg GAE/g DW), especially methyl-rosmarinate, rosmarinic acid, rosmadial, carnosol, dehydrodiferulic and chicoric acids, as well as flavonoids (luteolin- glucoside, querectin-rutinoside and epigallocatechin). The extract shows important antioxidant activity - 644.75±21.37 mM Trolox/g DW and inhibitory effect against strains of Staphylococcus aureus, Geobacillus stearothermophilus, Bacillus cereus, Candida albicans, Enterococcus faecalis, Escherichia coli, and Salmonella Abony. MICs were determined, ranging from 11.2 mg/mL for strains of Staphylococcus aureus, Geobacillus stearothermophilus, and Acinetobacter baumannii to 45.0 mg/mL for Enterococcus faecalis and Salmonella Abony. BE demonstrated a bactericidal and fungicidal effect on the bacteria Bacillus cereus, Geobacillus stearothermophilus, Staphylococcus aureus, Escherichia coli, Salmonella Abony and Acinetobacter baumannii and the yeast Candida albicans.
Microencapsulation of BE in sodium alginate allowed obtaining MBE with a rough surface and the following characteristics: moisture - 6.21±0.08%, swelling index - 87.4±0.4% and solubility - 22.1± 1.1%. FTIR spectroscopy of MBE compared to the spectra of its components, Alg and BE, demonstrated the existence of weak physical interactions between the components. The encapsulation efficiency of MBE was 78.59±0.01%, which shows that the formed microcapsules can serve as polyphenol carriers for food.
Physicochemical parameters of cream cheese with added MBE indicate a slight decrease in moisture, protein and fat content. The sodium alginate in the MBE composition led to the retention of free water and, respectively, a decrease in the moisture content of the cream cheese. Sensory properties of cream cheese fortified with MBE, including appearance, texture, odor, taste, and overall acceptability, were evaluated during a 28-day storage period at 4°C. The optimal concentration of MBE in cream cheese is in the range of 0.6-0.9%.
The addition of MBE initially led to a decrease in pH from 5.35 to 5.26. The decrease in pH in cream cheese samples with the addition of MBE occurred as a result of the release of phenolic acids from BE. But at the end of storage (28 days) the pH of the samples with added MBE was higher than that of the control samples, which confirms the preservation potential of MBE due to the inhibition of microorganisms.
The texture parameters (hardness, springiness, cohesiveness, adhesiveness and gumminess) of the cream cheese during the storage period were analyzed. The addition of MBE did not influence the springiness of the cream cheese. Increasing the concentration of MBE led initially to a slight reduction in protein and fat, to a decrease in the hardness and adhesiveness of the fortified cream cheese, but also to an increase in cohesiveness and gumminess. After 28 days of storage, the hardness and adhesiveness of cream cheese showed an essential increase, and the cohesiveness and gumminess of the samples gradually decreased. The improvement in texture parameters is probably due to the better water holding capacity of the cream cheese fortified with MBE compared to the control cream cheese. Textural parameters, except for springiness, were influenced by increasing MBE concentration in the samples.
The texture parameters of the cream cheese samples with the addition of MBE correlated with the sensory properties and the pH evolution. The addition of 0.6-0.9% MBE in cream cheese determined the inhibition of the post-fermentation process, the improvement of the degree of water retention and the textural parameters of the cream cheese, thus contributing to the extension of the shelf life of the product by 7 days, compared to the control sample. Microcapsules based on sodium alginate ensured the stability of the polyphenolic and bioactive compounds of the basil extract and led to the controlled release of the functional compounds from the cream cheese during the storage period.
The measure of influence of storage period and concentrations of MBE added to cream cheese samples on texture parameters, pH values and sensory analysis (overall acceptability) were evaluated by mutual information analysis. The analysis of the mutual influence of the textural parameters (adhesiveness, cohesiveness, hardness, gumminess, springiness), pH and the overall acceptability of the cream cheese samples demonstrated that the storage period of the samples with different concentrations of MBE addition did not essentially influence overall acceptability and pH, being moderately influenced by texture parameters. The concentration of MBE influenced in particular the pH, the textural parameter - gumminess and the overall acceptability of the product.
Author Contributions
Conceptualization, L.P., D.C., I.L., I.K., A.C., A.G.-M., G.B., A.P. and R.S.; methodology, L.P., D.C., I.L., I.K., A.C., A.G.-M., G.B. and A.P.; investigation, L.P., D.C., I.L., I.K., A.C., G.B. and A.P.; resources, L.P., I.L., I.K., A.C. and D.C.; data curation, L.P., I.L., I.K., A.C., A.G.-M., G.B. and R.S.; writing—original draft preparation, L.P., D.C., I.L., I.K., A.C., A.G.-M., G.B., A.P. and R.S.; writing—review and editing, L.P., I.L., A.G.-M., G.B., A.P. and R.S.; visualization, L.P., A.G.-M., G.B. and R.S.; supervision, R.S.; project administration, R.S.; funding acquisition, R.S. All authors have read and agreed to the published version of the manuscript.
Funding
This research was funded by the Moldova State Project no. 20.80009.5107.09, “Improvement of food quality and safety by biotechnology and food engineering”.
Institutional Review Board Statement
Not applicable.
Informed Consent Statement
Not applicable.
Data Availability Statement
No new data were created or analyzed in this study. Data sharing is not applicable to this article.
Acknowledgments
This work was supported by Moldova State project 20.80009.5107.09 “Improvement of food quality and safety by biotechnology and food engineering”, running at Technical University of Moldova and the Programme 1 - Development of the National Research and Development System, Subprogramme 1.2 - Institutional Performance - Funding Projects for Excellence in RDI, Contract No. 37PFE/30.12.2021 (Romania).
Conflicts of Interest
The authors declare no conflict of interest.
References
- Moula Ali, M.A.; Sant’Ana, A.S.; Bavisetty, S.C.B. Sustainable preservation of cheese: Advanced technologies, physicochemical properties and sensory attributes. Trends in Food Science & Technology 2022, 129, 306–326. [Google Scholar] [CrossRef]
- Costa, M.J.; Maciel, L.C.; Teixeira, J.A.; Vicente, A.A.; Cerqueira, M.A. Use of edible films and coatings in cheese preservation: Opportunities and challenges. Food Research International 2018, 107, 84–92. [Google Scholar] [CrossRef] [PubMed]
- Weragama, D.; Weerasingha, V.; Jayasumana, L.; Adikari, J.; Vidanarachchi, J.K.; Priyashantha, H. The physicochemical, microbiological, and organoleptic properties and antioxidant activities of cream cheeses fortified with dried curry leaves (Murraya koenigii L.) powder. Food Sci Nutr. 2021, 9, 5774–5784. [Google Scholar] [CrossRef] [PubMed]
- Monnet, C.; Landaud, S.; Bonnarme, P.; Swennen, D. Growth and adaptation of microorganisms on the cheese surface. FEMS Microbiology Letters 2014, 263, 1–9. [Google Scholar] [CrossRef] [PubMed]
- Popescu, L. Effects of natural bioactive compounds on microbial safety and quality of dairy products. Journal of Engineering Science 2021, 2, 147–158. [Google Scholar] [CrossRef] [PubMed]
- Nájera, A.I.; Nieto, S.; Barron, L.J.R.; Albisu, M.A. Review of the preservation of hard and semi-hard cheeses: quality and safety. Int J Environ Res Public Health 2021, 18, 9789. [Google Scholar] [CrossRef] [PubMed]
- Christaki, S.; Moschakis, T.; Kyriakoudi, A.; Biliaderis, C.G.; Mourtzinos, I. Recent advances in plant essential oils and extracts: Delivery systems and potential uses as preservatives and antioxidants in cheese. Trends in Food Science & Technology 2021, 116, 264–278. [Google Scholar] [CrossRef]
- Tarchoune, I.; Sgherri, C.; Izzo, R.; Lachaâl, M.; Navari-Izzo, F.; Ouerghi, Z. Changes in the antioxidative systems of Ocimum basilicum L. (cv. Fine) under different sodium salts. Acta Physiol. Plant 2012, 34, 1873–1881. [Google Scholar] [CrossRef]
- Romano, R.; De Luca, L.; Aiello, A.; Pagano, R.; Di Pierro, P.; Pizzolongo, F.; Masi, P. Basil (Ocimum basilicum L.) leaves as a source of bioactive compounds. Foods 2022, 11, 3212. [Google Scholar] [CrossRef] [PubMed]
- Leri, M.; Scuto, M.; Ontario, M.L.; Calabrese, V.; Calabrese, E.J.; Bucciantini, M.; Stefani, M. Healthy effects of plant polyphenols: Molecular mechanisms. Int. J. Mol. Sci. 2020, 21, 1250. [Google Scholar] [CrossRef] [PubMed]
- Fratianni, F.; Nazzaro, F.; Marandino, A.; Fusco, M.R.; Coppola, R.; Feo, V.D.; Martino, L.D. Biochemical composition, antimicrobial activities, and anti–quorum-sensing activities of ethanol and ethyl acetate extracts from Hypericum connatum Lam. (Guttiferae). J. Med. Food 2013, 16, 454–459. [Google Scholar] [CrossRef] [PubMed]
- Eghbal, N.; Liao, W.; Dumas, E.; Azabou, S.; Dantigny, P.; Gharsallaoui, A. Microencapsulation of natural food antimicrobials: methods and applications. Appl. Sci. 2022, 12, 3837. [Google Scholar] [CrossRef]
- Nwabor, O.F.; Singh, S.; Marlina, D.; Voravuthikunchai, S.P. Chemical characterization, release, and bioactivity of Eucalyptus camaldulensis polyphenols from freeze-dried sodium alginate and sodium carboxymethyl cellulose matrix. Food Quality and Safety 2020, 4, 203–212. [Google Scholar] [CrossRef]
- Haratifar, S.; Corredig, M. Interactions between tea catechins and casein micelles and the impact on renneting functionality. Food Chem. 2014, 143, 27–32. [Google Scholar] [CrossRef]
- Massounga Bora, A.F.; Ma, S.; Li, X.; Liu, L. Application of microencapsulation for the safe delivery of green tea polyphenols in food systems: review and recent advances. Food Res Int. 2018, 105, 241–249. [Google Scholar] [CrossRef] [PubMed]
- Soltanzadeh, M.; Peighambardoust, S.H.; Ghanbarzadeh, B.; Mohammadi, M.; Lorenzo, J.M. Chitosan nanoparticles as a promising nanomaterial for encapsulation of pomegranate (Punica granatum L.) peel extract as a natural source of antioxidants. Nanomaterials 2021, 11, 1439. [Google Scholar] [CrossRef] [PubMed]
- Gouvea, F.D.S.; Rosenthal, A.; Ferreira, E.H.D.R. Plant extract and essential oils added as antimicrobials to cheeses: a review. Ciência Rural 2017, 47, e20160908. [Google Scholar] [CrossRef]
- Saikia, S.; Mahnot, N.K.; Mahanta, C.L. Optimisation of phenolic extraction from Averrhoa carambola pomace by response surface methodology and its microencapsulation by spray and freeze drying. Food Chemistry 2015, 171, 144–152. [Google Scholar] [CrossRef] [PubMed]
- Farrag, A.F.; Zahran, H.; Al-Okaby, M.F.; El-Sheikh, M.M.; Soliman, T.N. Physicochemical properties of white soft cheese supplemented with encapsulated olive phenolic compounds. Egyptian Journal of Chemistry 2020, 63, 2921–2931. [Google Scholar] [CrossRef]
- Caleja, C.; Ribeiro, A.; Barros, L.; Barreira, J.C.M.; Antonio, A.L.; Oliveira, M.P.P.; Barreiro, M.F.; Ferreira, I.C.F.R. Cottage cheeses functionalized with fennel and chamomile extracts: Comparative performance between free and microencapsulated forms. Food Chemistry 2016, 199, 720–726. [Google Scholar] [CrossRef]
- Soliman, T.N.; Mohammed, D.M.; El-Messery, T.M.; Elaaser, M.; Zaky, A.A.; Eun, J.-B.; Shim, J.-H.; El-Said, M.M. Microencapsulation of plant phenolic extracts using complex coacervation incorporated in ultrafiltered cheese against AlCl3-induced neuroinflammation in rats. Front. Nutr. 2022, 9, 929977. [Google Scholar] [CrossRef] [PubMed]
- El-Messery, T.M.; El-Said, M.M.; Shahein, N.M.; El-Din, H.F.; Farrag, A. Functional yoghurt supplemented with extract orange peel encapsulated using coacervation technique. Pak J Biol Sci PJBS. 2019, 22, 231–238. [Google Scholar] [CrossRef] [PubMed]
- Nguyen, V.T.; Nguyen, N.Q.; Thi, N.Q.N.; Thi, C.Q.N.; Truc, T.T.; Nghi, P.T.B. Studies on chemical, polyphenol content, flavonoid content, and antioxidant activity of sweet basil leaves (Ocimum basilicum L.). IOP Conf. Ser.: Mater. Sci. Eng. 2021, 1092, 012083. [Google Scholar] [CrossRef]
- Prinsi, B.; Morgutti, S.; Negrini, N.; Faoro, F.; Espen, L. Insight into composition of bioactive phenolic compounds in leaves and flowers of green and purple basil. Plants (Basel) 2019, 9, 22. [Google Scholar] [CrossRef] [PubMed]
- Aburigal, Y.A.A.; Mirghani, M.E.S.; Elmogtaba, E.Y.; Sirible, A.A.M.; Hamza, N.B.; Hussein, I.H. Total phenolic content and antioxidant capacity of basil (Ocimum basilicum L.) leaves from different locations. Int. Food Res. J. 2017, 24 (Suppl), S378–S381. [Google Scholar]
- Zaman, G.; Farooq, U.; Bajwa, M.N.; Jan, H.; Shah, M.; Ahmad, R.; Andleeb, A.; Drouet, S.; Hano, C.; Abbasi, B.H. Effects of yeast extract on the production of phenylpropanoid metabolites in callus culture of purple basil (Ocimum Basilicum L. var purpurascens) and their in-vitro evaluation for antioxidant potential. Plant Cell, Tissue and Organ Culture, 2022, 150, 543–553. [Google Scholar] [CrossRef]
- Romano, R.; De Luca, L.; Aiello, A.; Pagano, R.; Di Pierro, P.; Pizzolongo, F.; Masi, P. Basil (Ocimum basilicum L.) Leaves as a Source of Bioactive Compounds. Foods 2022, 11, 3212. [Google Scholar] [CrossRef] [PubMed]
- Khatib, S.; Harnafi, M.; Touiss, I.; Bekkouch, O.; Milenkovic, D.; Amrani, S.; Harnafi, H. HPLC–DAD profiling of a phenolic extract from Moroccan sweet Basil and its application as oxidative stabilizer of sunflower oil. Chemical Papers 2021, 75, 1907–1917. [Google Scholar] [CrossRef]
- Ghasemzadeh, A.; Ashkani, S.; Baghdadi, A.; Pazoki, A.; Jaafar, H.Z.E.; Rahmat, A. Improvement in Flavonoids and Phenolic Acids Production and Pharmaceutical Quality of Sweet Basil (Ocimum basilicum L.) by Ultraviolet-B Irradiation. Molecules 2016, 21, 1203. [Google Scholar] [CrossRef]
- Vlaicu, P.A.; Untea, A.E.; Turcu, R.P.; Saracila, M.; Panaite, T.D.; Cornescu, G.M. Nutritional composition and bioactive compounds of basil, thyme and sage plant additives and their functionality on broiler thigh meat quality. Foods 2022, 11, 1105. [Google Scholar] [CrossRef] [PubMed]
- Chulova, M.N.; Vrancheva, R.Z.; Stoyanova, M.A.; Pavlov, A.I. Antioxidant activity and phenolic profile of extracts of basil. Scientific Works of University of Food Technologies 2016, 63, 178–186. [Google Scholar]
- Willis, K.J. State of the world’s plants 2017. Report; Royal Botanics Gardens Kew: London, England,, 2017; 100p, ISBN 9781842466476. [Google Scholar]
- Khameneh, B.; Iranshahy, M.; Soheili, V.; Bazzaz, B.S.F. Review on plant antimicrobials: a mechanistic viewpoint. Antimicrob Resist Infect Control 2019, 8, 118, eCollection 2019. [Google Scholar] [CrossRef] [PubMed]
- Ghendov-Mosanu, A.; Cojocari, D.; Balan, G.; Patras, A.; Lung, I.; Soran, M.-L.; Opriş, O.; Cristea, E.; Sturza, R. Chemometric Optimization of Biologically Active Compounds Extraction from Grape Marc: Composition and Antimicrobial Activity. Molecules 2022, 27, 1610. [Google Scholar] [CrossRef] [PubMed]
- Ghendov-Moșanu, A.; Cojocari, D.; Balan, G.; Sturza, R. Antimicrobial activity of rose hip and hawthorn powders on pathogenic bacteria. Journal of Engineering Science 2018, 25, 100–107. [Google Scholar] [CrossRef]
- Sandulachi, E.; Cojocari, D.; BALAN, G.; Popescu, L.; Ghendov-Moșanu, A.; Sturza, R. Antimicrobial effects of berries on Listeria monocytogenes. Food and Nutrition Sciences 2020, 11, 873–886. [Google Scholar] [CrossRef]
- Macari, A.; Sturza, R.; Lung, I.; Soran, M.-L.; Opris, O.; Balan, G.; Ghendov-Mosanu, A.; Vodnar, D.C.; Cojocari, D. Antimicrobial effects of basil, summer savory and tarragon lyophilized extracts in cold storage sausages. Molecules 2021, 26, 6678. [Google Scholar] [CrossRef] [PubMed]
- Sturza, R.; Sandulachi, E.; Cojocari, D.; Balan, G.; Popescu, L.; Ghendov-Mosanu, A. Antimicrobial properties of berry powders in cream cheese. Journal of Engineering Sciences 2019, 3, 125–136. [Google Scholar] [CrossRef]
- Deba, F.; Xuan, T.D.; Yasuda, M.; Tawata, S. Chemical composition and antioxidant, antibacterial and antifungal activities of the essential oils from Bidens pilosa Linn. var. Radiata. Food Control 2008, 19, 346–352. [Google Scholar] [CrossRef]
- Inouye, S.; Uchida, K.; Takizawa, T.; Yamaguchi, H.; Abe, S. Evaluation of the effect of terpenoid quinones on Trichophyton mentagrophytes by solution and vapor contact. J Infect Chemother 2006, 12, 100–104. [Google Scholar] [CrossRef] [PubMed]
- Adigüzel, A.; Medine, G.; Meryem, B.; Hatice, U.T.C.; Fikrettin, A.; Üsa, K. Antimicrobial effects of Ocimum basilicum (Labiatae) extract. Turk. J. Biol. 2005, 29, 155–160. [Google Scholar]
- Petchsomrit, A.; Sermkaew, N.; Wiwattanapatapee, R. Effect of alginate and surfactant on physical properties of oil entrapped alginate bead formulation of curcumin. Int. J. Pharm. Pharm. Sci. 2013, 7, 864–868. [Google Scholar]
- Yang, N.; Wang, R.; Rao, P.; Yan, L.; Zhang, W.; Wang, J.; Chai, F. The fabrication of calcium alginate beads as a green sorbent for selective recovery of Cu(II) from metal mixtures. Crystals 2019, 9, 255. [Google Scholar] [CrossRef]
- Sarker, B.; Papageorgiou, D.G.; Silva, R.; Zehnder, T.; Gul-E-Noor, F.; Bertmer, M.; Kaschta, J.; Chrissafis, K.; Detscha, R.; Boccaccini, A.R. Fabrication of alginate–gelatin crosslinked hydrogel microcapsules and evaluation of the microstructure and physico-chemical properties. J. Mater. Chem. B 2014, 2, 1470–1482. [Google Scholar] [CrossRef] [PubMed]
- Derkach, S.R.; Voron’ko, N.G.; Sokolan, N.I.; Kolotova, D.S.; Kuchina, Y.A. Interactions between gelatin and sodium alginate: UV and FTIR studies. J. Dispers. Sci. Technol. 2019, 41, 1–9. [Google Scholar] [CrossRef]
- Sukardi; Pulungan, M.H.; Purwaningsih, I.; Sita, P.F. Extraction of phenolic compounds from basil (Ocimum americanum L.) leaves with pretreatment using pulsed electric field (PEF). IOP Conf. Ser.: Earth Environ. Sci. 2020, 475, 012056. [Google Scholar] [CrossRef]
- Tomé, A.C.; da Silva, F.A. Alginate based encapsulation as a tool for the protection of bioactive compounds from aromatic herbs. Food Hydrocolloids for Health 2022, 2, 100051. [Google Scholar] [CrossRef]
- Balabanova, T.; Petkova, N.; Ivanova, M.; Panayotov, N. Design of Labneh cheese fortified with alginate-encapsulated pepper (Capsicum annuum) extracts. Emirates Journal of Food and Agriculture 2020, 32, 559–566. [Google Scholar] [CrossRef]
- Azarashkan, Z.; Motamedzadegan, A.; Saraei, A.G.-H.; Biparva, P.; Rahaiee, S. Investigation of the physicochemical, antioxidant, rheological, and sensory properties of ricotta cheese enriched with free and nano-encapsulated broccoli sprout extract. Food Sci Nutr. 2022, 10, 4059–4072. [Google Scholar] [CrossRef] [PubMed]
- Hala, M.; Ebtisam, E.; Sanaa, I.; Badran, M.; Marwa, A.; Said, M. Manufacture of low fat UF-soft cheese supplemented with rose- mary extract (as natural antioxidant). Journal of American Science 2010, 6, 570–579. [Google Scholar]
- Soodam, K.; Ong, L.; Powell, I.B.; Kentish, S.E.; Gras, S.L. Effect of rennet on the composition, proteolysis and microstructure of reduced-fat Cheddar cheese during ripening. Dairy Science & Technology 2015, 95, 665–686. [Google Scholar] [CrossRef]
- Artiga-Artigas, M.; Acevedo-Fani, A.; Martín-Belloso, O. Improving the shelf life of low-fat cut cheese using nanoemulsion- based edible coatings containing oregano essential oil and mandarin fiber. Food Control 2017, 76, 1–12. [Google Scholar] [CrossRef]
- Pérez-Soto, E.; Cenobio-Galindo, A.D.J.; Espino-Manzano, S.O.; Franco-Fernández, M.J.; Ludeña-Urquizo, F.E.; Jiménez-Alvarado, R.; Zepeda-Velázquez, A.P.; Campos-Montiel, R.G. The addition of microencapsulated or Nanoemulsified bioactive compounds influences the antioxidant and antimicrobial activities of a fresh cheese. Molecules 2021, 26, 2170. [Google Scholar] [CrossRef] [PubMed]
- Popescu, L.; Ceșco, T.; Gurev, A.; Ghendov-Mosanu, A.; Sturza, R.; Tarna, R. Impact of apple pomace powder on the bioactivity, and the sensory and textural characteristics of yogurt. Foods 2022, 11, 3565. [Google Scholar] [CrossRef] [PubMed]
- Bulgaru, V.; Popescu, L.; Netreba, N.; Ghendov-Mosanu, A.; Sturza, R. Assessment of quality indices and their influence on the texture profile in the dry-aging process of beef. Foods 2022, 11, 1526. [Google Scholar] [CrossRef] [PubMed]
- Ghendov-Mosanu, A.; Cristea, E.; Patras, A.; Sturza, R.; Padureanu, S.; Deseatnicova, O.; Turculet, N.; Boestean, O.; Niculaua, M. Potential application of hippophae rhamnoides in wheat bread production. Molecules 2020, 25, 1272. [Google Scholar] [CrossRef] [PubMed]
- Ghendov-Mosanu, A.; Cristea, E.; Patras, A.; Sturza, R.; Niculaua, M. Rose Hips, a valuable source of antioxidants to improve gingerbread characteristics. Molecules 2020, 25, 5659. [Google Scholar] [CrossRef] [PubMed]
- Ivanova, V.; Stefova, M.; Chinnici, F. Determination of the polyphenol contents in Macedonian grapes and wines by standardized spectrophotometric methods. J. Serb. Chem. Soc. 2010, 75, 45–59. [Google Scholar] [CrossRef]
- Brand-Williams, W.; Cuvelier, M.E.; Berset, C. Use of a free radical method to evaluate antioxidant activity. LWT―Food Sci. Technol. 1995, 28, 25–30. [Google Scholar] [CrossRef]
- Magaldi, S.; Mata-Essayag, S.; de Capriles, C.H. Well diffusion for antifungal susceptibility testing. Int. J. Infect. Dis. 2004, 8, 39–45. [Google Scholar] [CrossRef] [PubMed]
- Valgas, C.; De Souza, S.M.; Smânia, E.F.A. Screening methods to determine antibacterial activity of natural products. Braz. J. Microbiol. 2007, 38, 369–380. [Google Scholar] [CrossRef]
- M07-A10 Methods for Dilution Antimicrobial Susceptibility Tests for Bacteria that Grow Aerobically. Approved Standard, 10th ed. Clinical and Laboratory Standards Institute: Wayne, PA, USA, 2015.
- Rijo, P.; Matias, D.; Fernandes, A.S.; Simões, M.F.; Nicolai, M.; Reis, C.P. Antimicrobial plant extracts encapsulated into polymeric beads for potential application on the skin. Polymers 2014, 6, 479–490. [Google Scholar] [CrossRef]
- Nwabor, O.F.; Singh, S.; Marlina, D.; Voravuthikunchai, S.P. Chemical characterization, release, and bioactivity of Eucalyptus camaldulensis polyphenols from freeze-dried sodium alginate and sodium carboxymethyl cellulose matrix. Food Quality and Safety 2020, 4, 203–212. [Google Scholar] [CrossRef]
- Surini, S.; Nursatyani, K.; Ramadon, D. Gel formulation containing microcapsules of grape seed oil (Vitis vinifera L.) for skin moisturizer. Journal of Young Pharmacists 2018, 10, 41. [Google Scholar] [CrossRef]
- Machado, A.R.; Silva, P.M.P.; Vicente, A.A.; Souza-Soares, L.A.; Pinheiro, A.C.; Cerqueira, M.A. Alginate Particles for Encapsulation of Phenolic Extract from Spirulina sp. LEB-18: Physicochemical Characterization and Assessment of In Vitro Gastrointestinal Behavior. Polymers 2022, 14, 4759. [Google Scholar] [CrossRef] [PubMed]
- ISO 1211:2010|IDF 1:2010; Milk—Determination of Fat Content—Gravimetric Method (Reference Method). International Organization for Standardization: Geneva, Switzerland, 2010.
- ISO 5534:2004|IDF 4:2004; Cheese and processed cheese - Determination of the total solids content (Reference method). International Organization for Standardization: Geneva, Switzerland, 2004.
- ISO 8968-1:2014|IDF 20-1:2014; Milk and milk products - Determination of nitrogen content - Part 1: Kjeldahl principle and crude protein calculation. International Organization for Standardization: Geneva, Switzerland, 2014.
- ISO 22935-3:2009|IDF 99-3:2009; Milk and Milk Products—Sensory Analysis—Part 3: Guidance on a Method for Evaluation of Compliance with Product Specifications for Sensory Properties by Scoring. International Organization for Standardization: Geneva, Switzerland, 2009.
- ISO 8586:2012; Sensory Analysis—General Guidelines for the Selection, Training and Monitoring of Selected Assessors and Expert Sensory Assessors. International Organization for Standardization: Geneva, Switzerland, 2012.
- Decision of the Government of the Republic of Moldova No. 158 of 07.03.2019 Regarding the Approval of the Quality Requirements for Milk and Dairy Products. 2019. Available online: https://www.legis.md/cautare/getResults?doc_id=113282&lang=ro (accessed on 1 February 2023).
- Paninski, L. Estimation of entropy and mutual information. Neural Comput. 2003, 15, 1191–1253. [Google Scholar] [CrossRef]
Figure 1.
SEM micrographs of the microencapsulated basil extract sample (a, b).
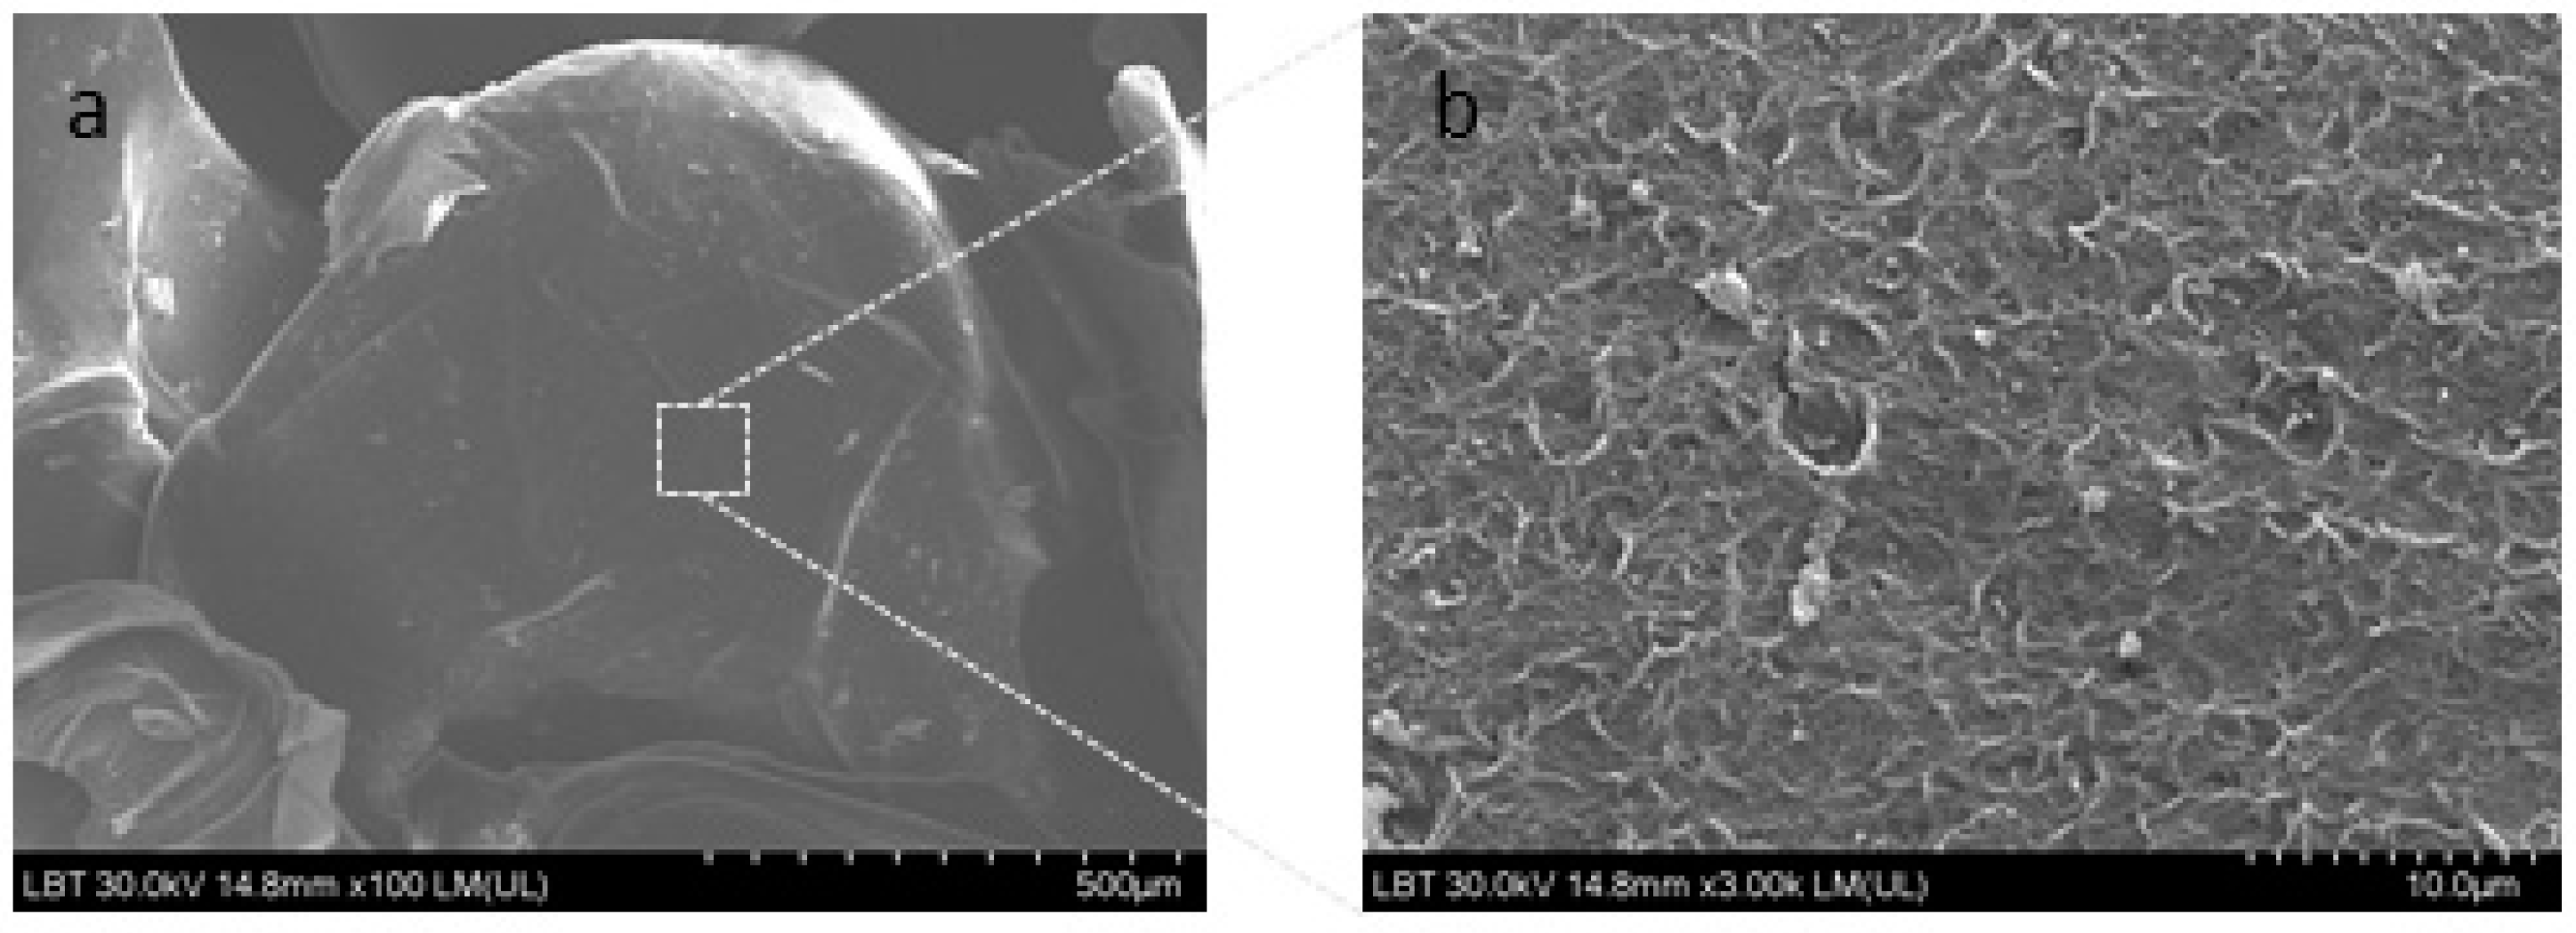
Figure 2.
The FTIR spectra of sodium alginate (Alg), basil extract (BE) and microencapsulated basil extract (MBE), 4000-400 cm-1 spectral domain, 2700-1800 cm-1 splitted.
Figure 2.
The FTIR spectra of sodium alginate (Alg), basil extract (BE) and microencapsulated basil extract (MBE), 4000-400 cm-1 spectral domain, 2700-1800 cm-1 splitted.
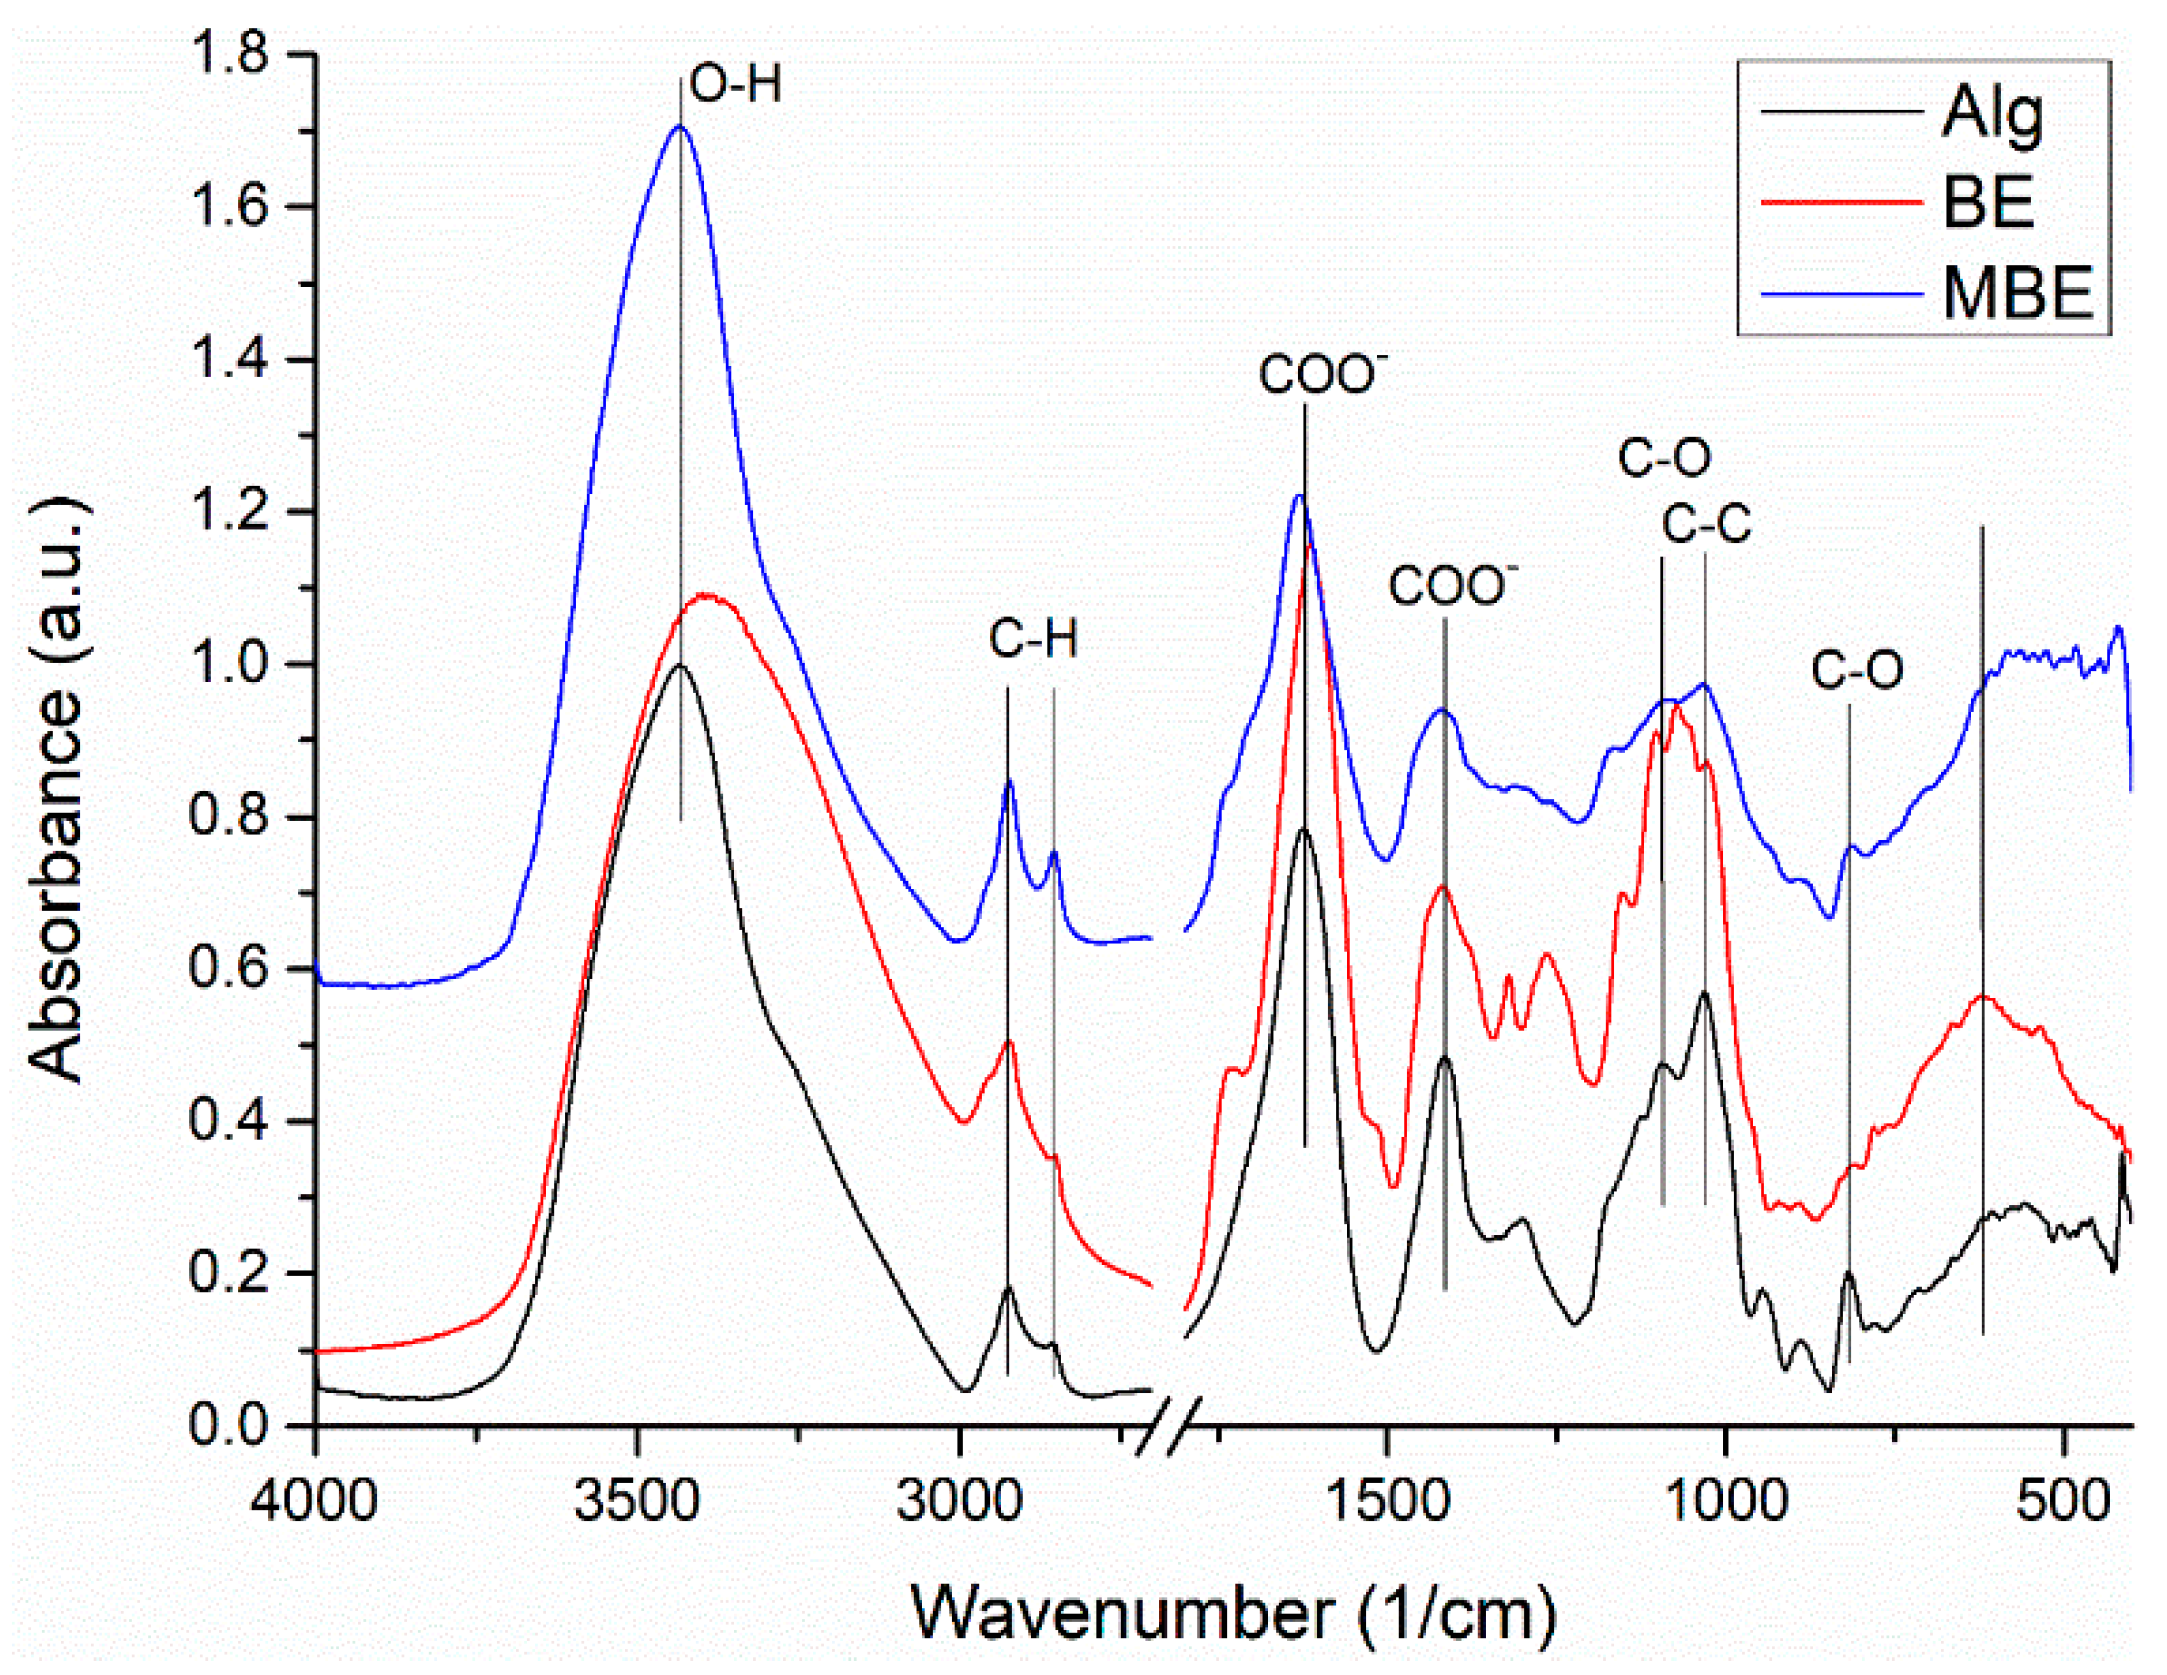
Figure 3.
The informational analysis of the influence of storage days on the textural parameters, the pH and on the overall acceptability of cream cheese samples.
Figure 3.
The informational analysis of the influence of storage days on the textural parameters, the pH and on the overall acceptability of cream cheese samples.
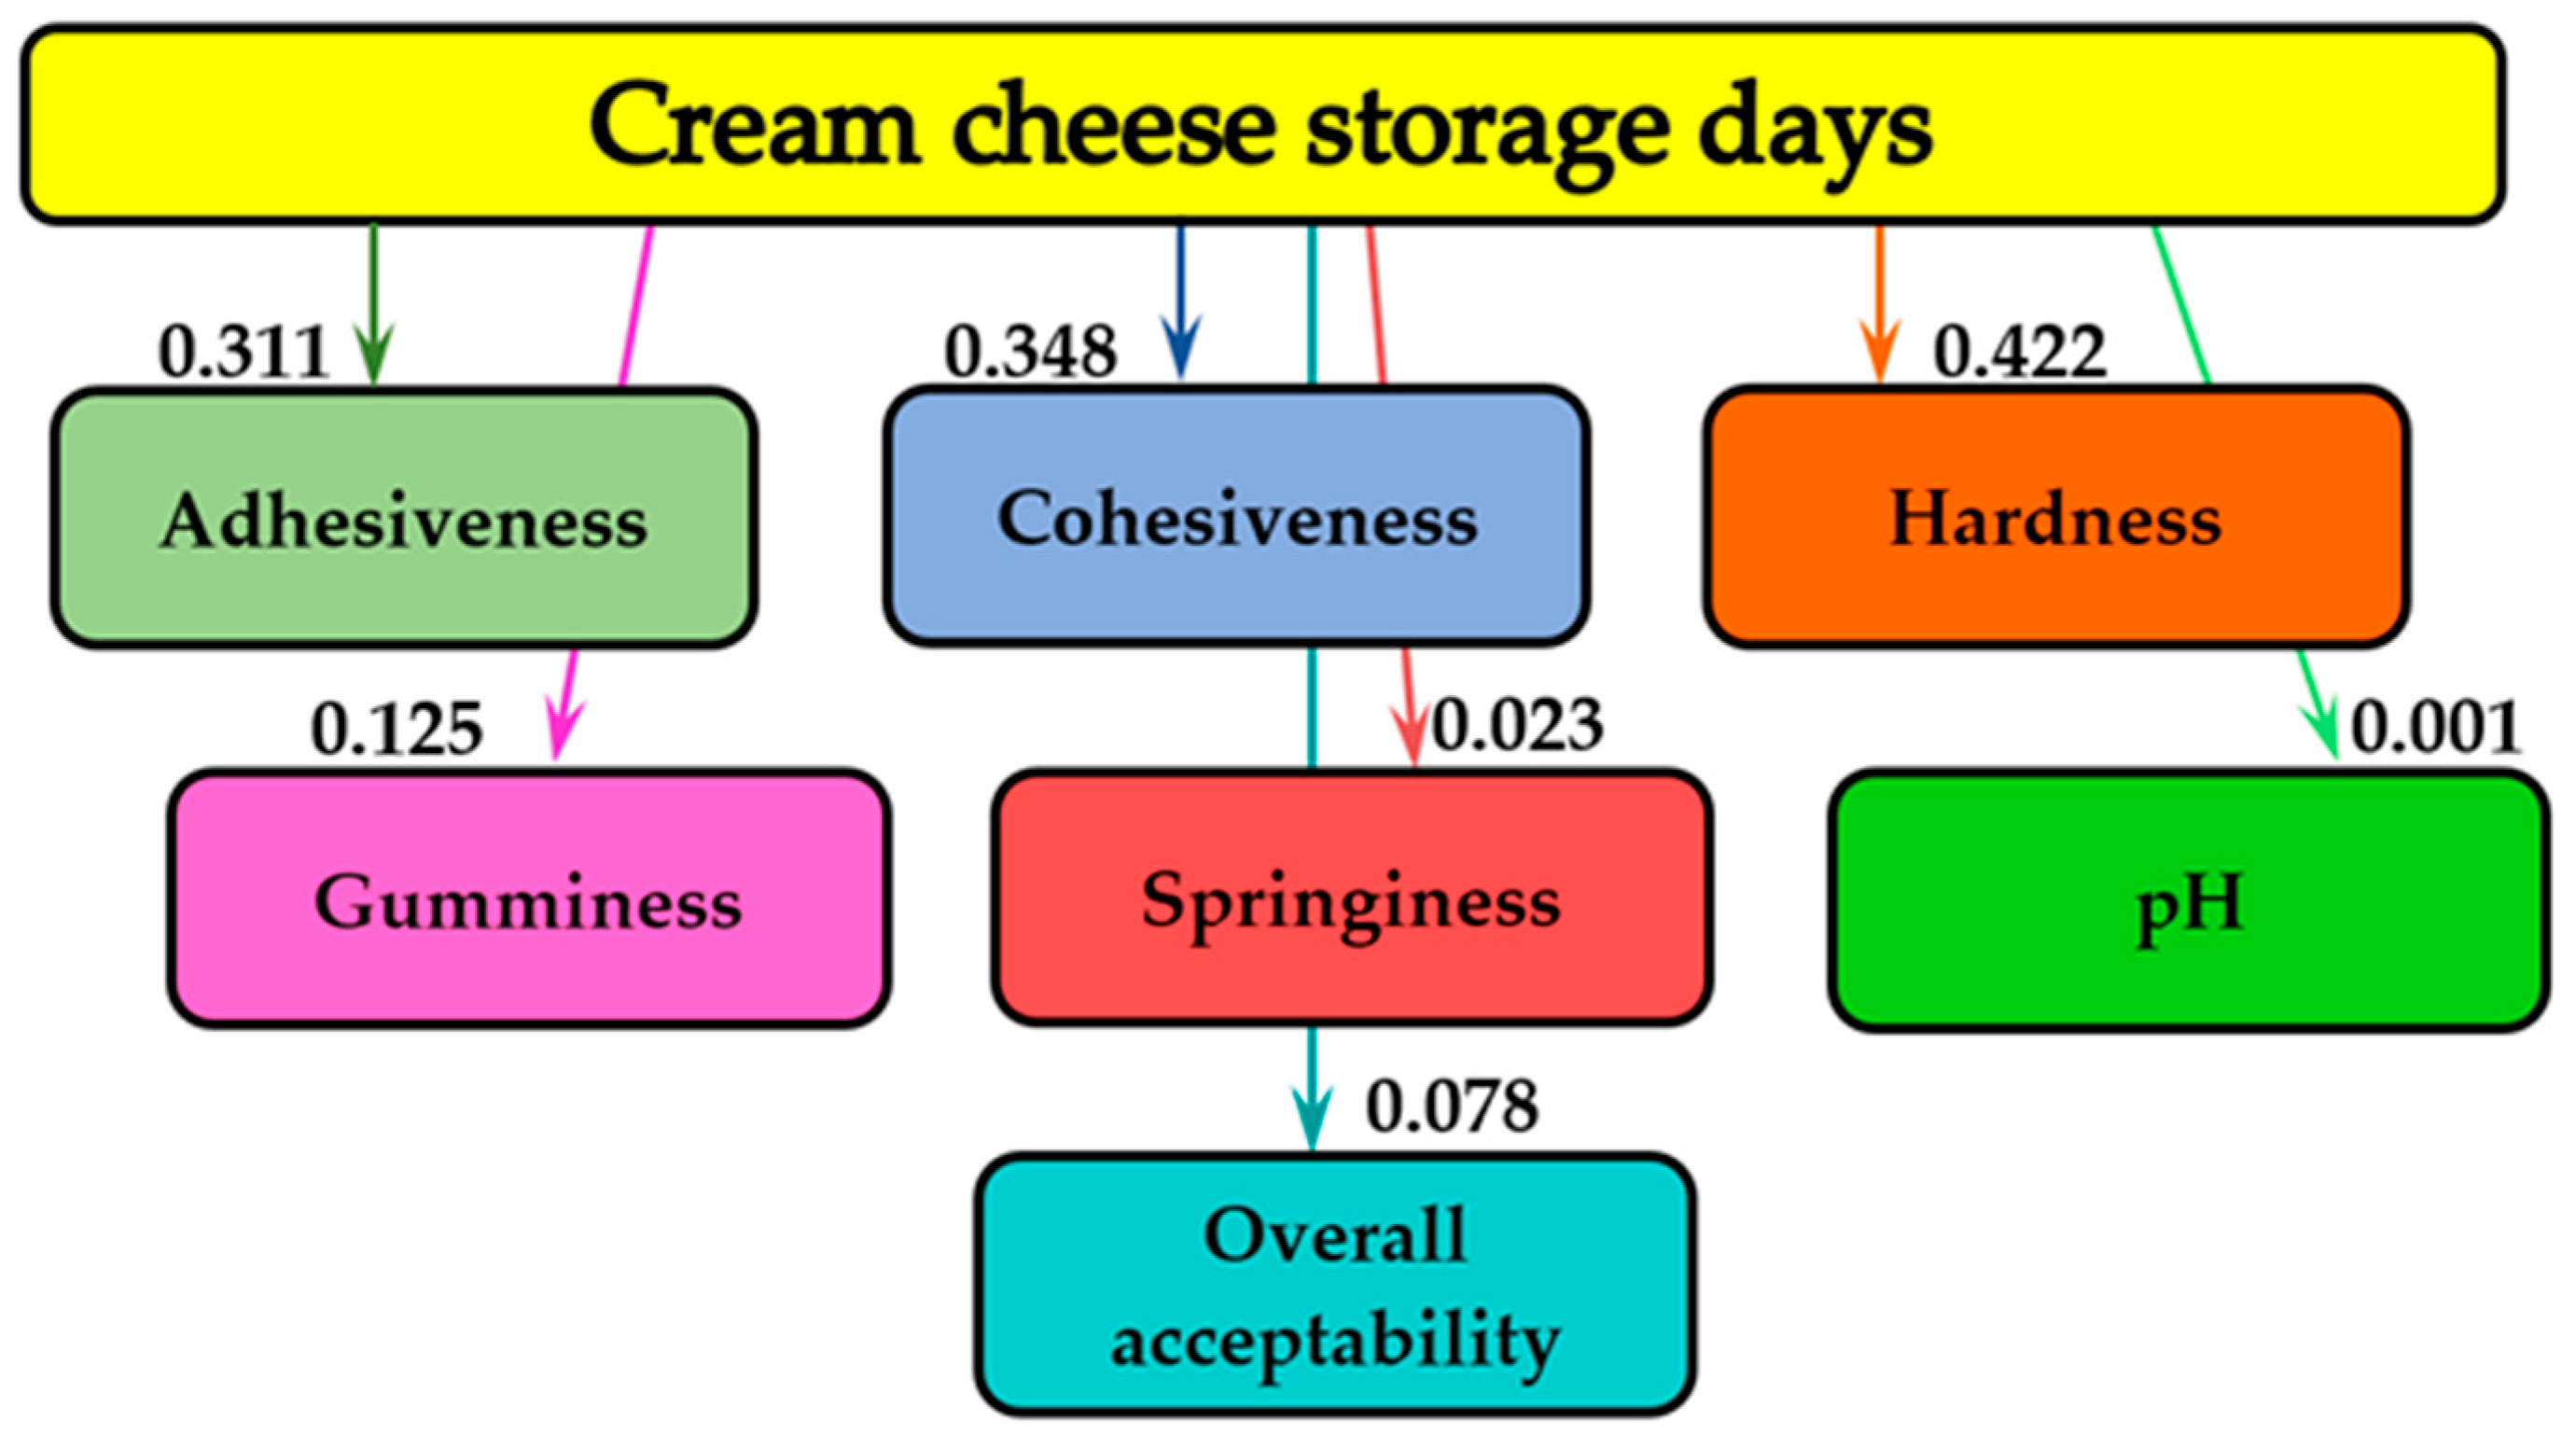
Figure 4.
The informational analysis for the influence of concentration of the MBE added on the textural parameters, the pH and on the overall acceptability of cream cheese samples.
Figure 4.
The informational analysis for the influence of concentration of the MBE added on the textural parameters, the pH and on the overall acceptability of cream cheese samples.
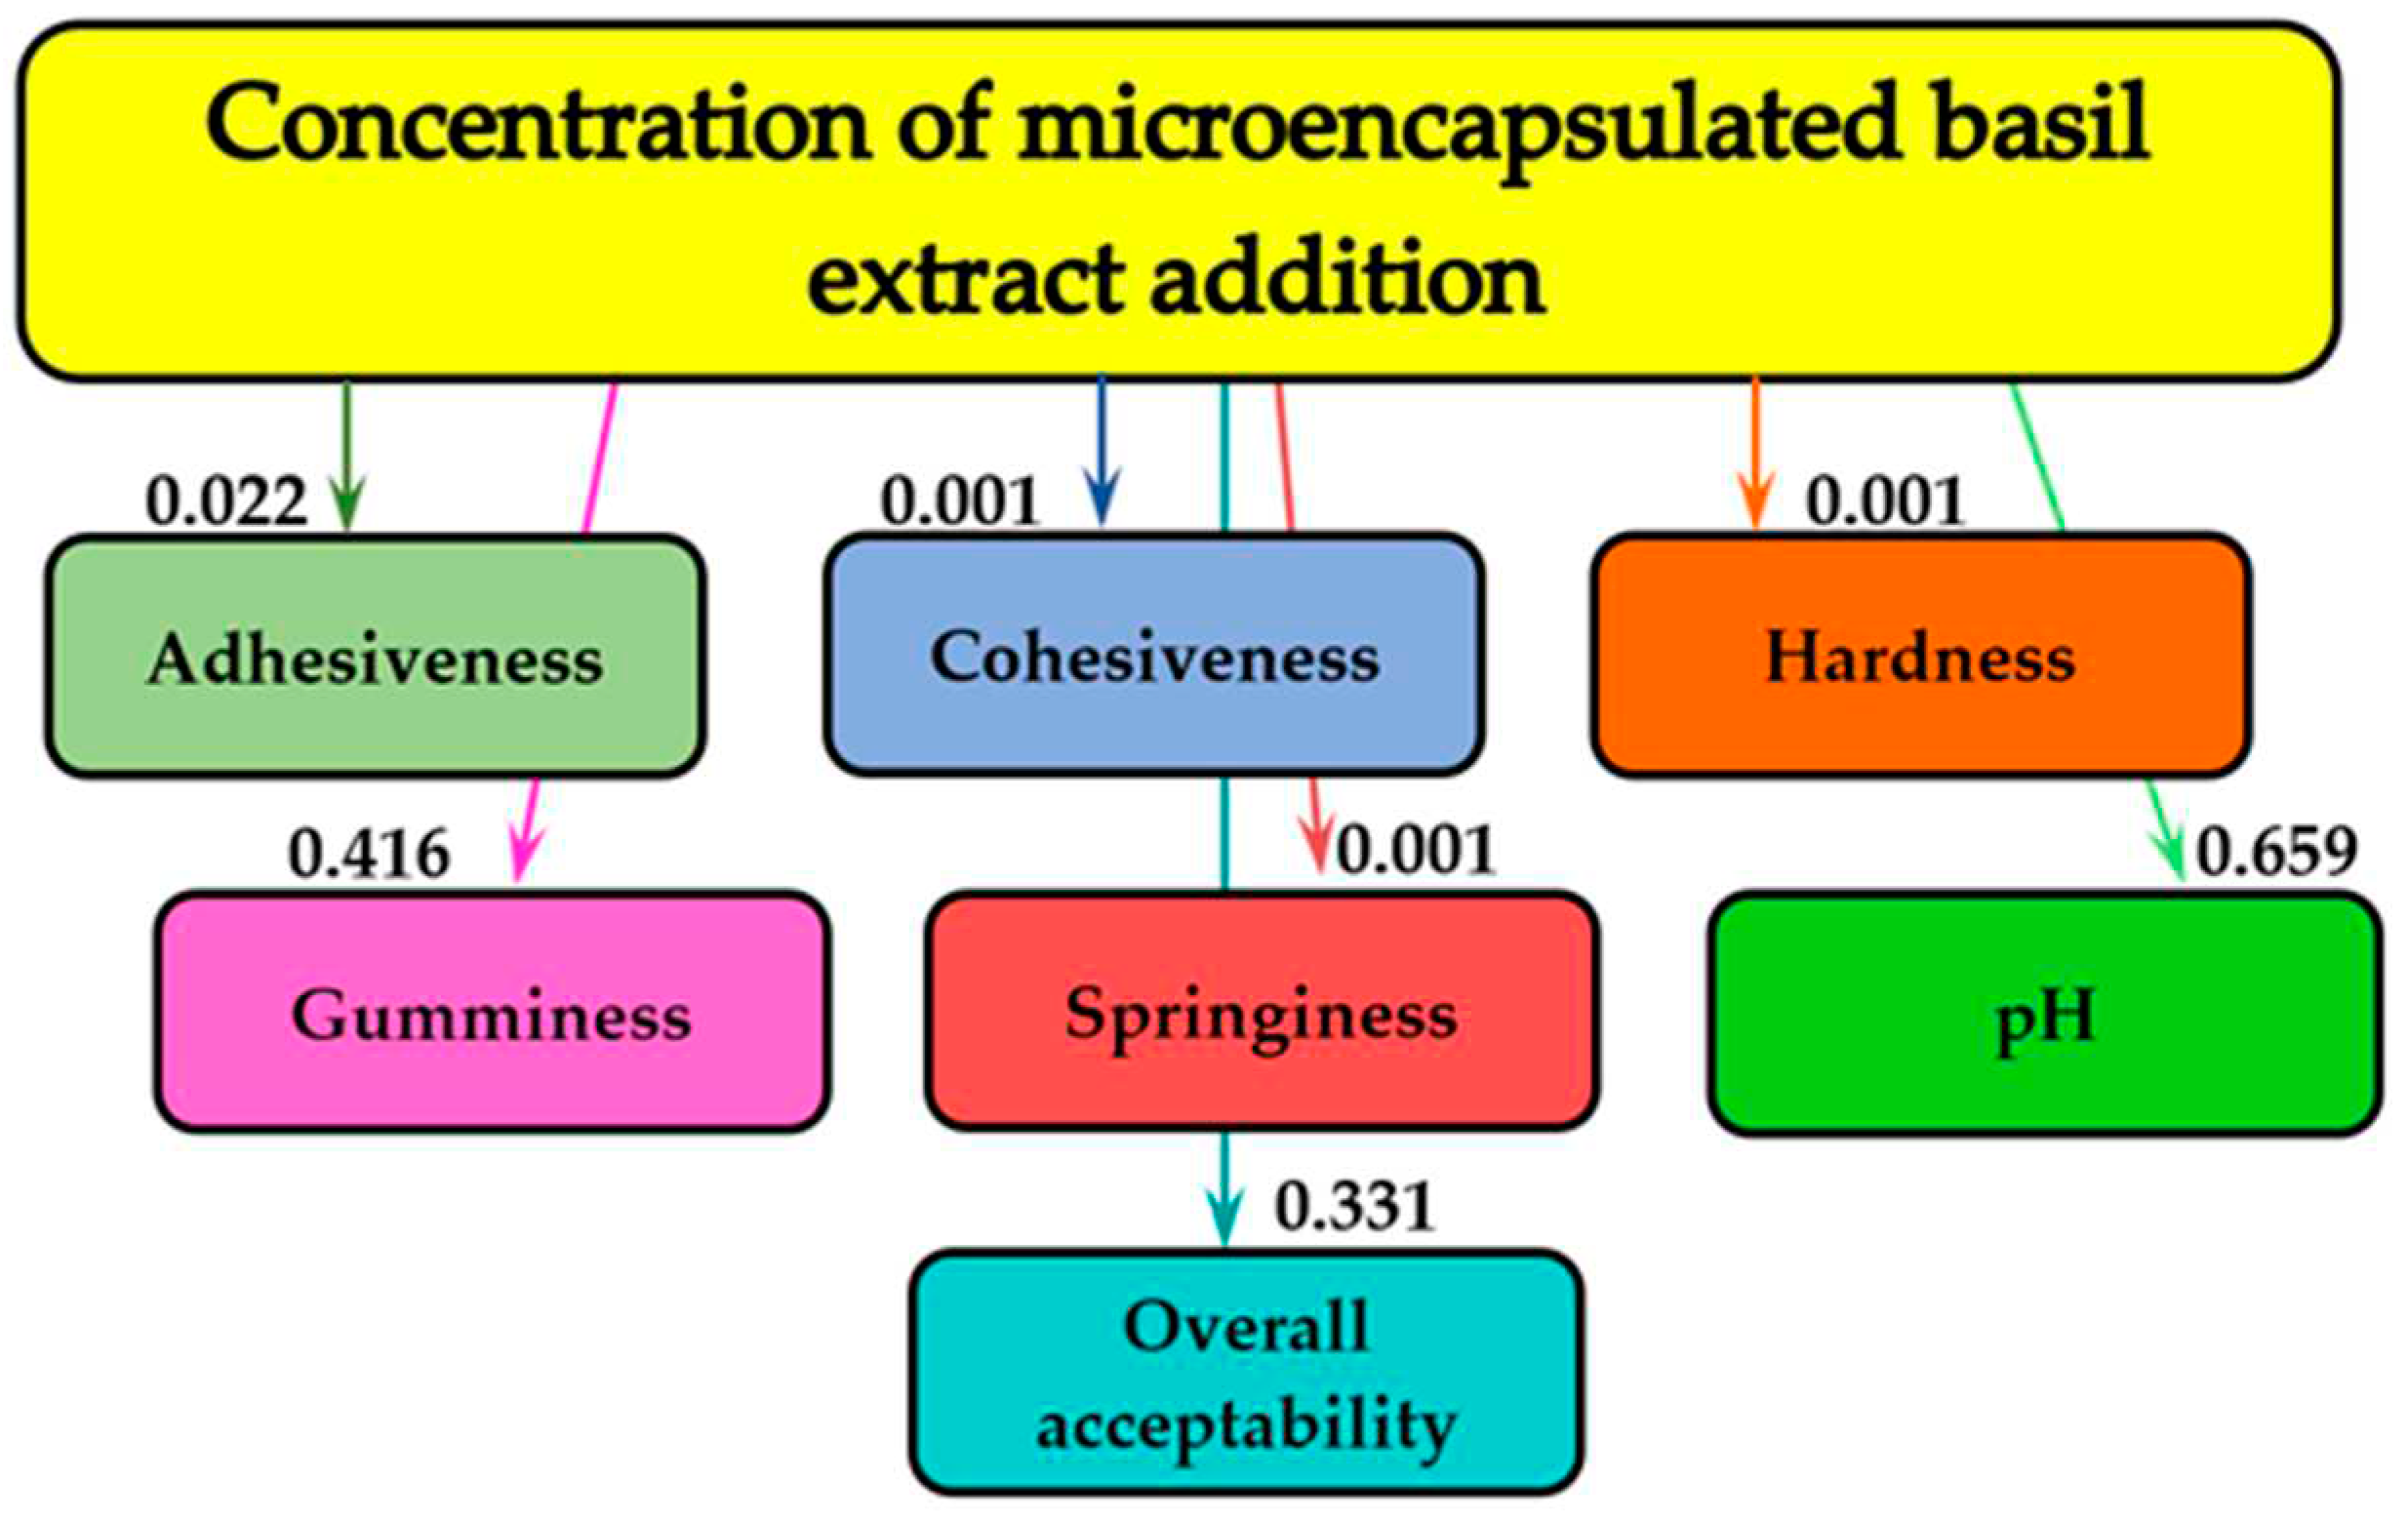

Table 1.
The content of total and individual polyphenols and the antioxidant activity of basil extract used for experiments.
Table 1.
The content of total and individual polyphenols and the antioxidant activity of basil extract used for experiments.
| Indices | Quantity |
|---|---|
| Total Polyphenol Content (Folin–Ciocalteu), mg GAE/g DW | 26.18±0.21 |
| Epigallocatechin, mg/g DW | 0.72±0.09 |
| Chicoric acid, mg/g DW | 1.30±0.13 |
| Querectin-rutinoside, mg/g DW | 0.75±0.02 |
| Luteolin-glucoside, mg/g DW | 0.85±0.05 |
| Dehydrodiferulic acid, mg/g DW | 3.10±0.26 |
| Rosmarinic acid, mg/g DW | 13.81±0.57 |
| Methyl-rosmarinate, mg/g DW | 17.08±0.39 |
| Carnosol, mg/g DW | 4.78±0.06 |
| Rosmadial, mg/g DW | 6.45±0.01 |
| Not identified | 8.46±0.17 |
| DPPH Antioxidant activity, mM Trolox /g DW | 644.75±21.37 |
Values in the table represent the means of three replicated trials ± standard deviation.
Table 2.
Antimicrobial activity of the basil extract against bacteria and yeast strains.
| Test strains | Zone of inhibition (mm) * | Basil extract, mg/mL | |
|---|---|---|---|
| MIC | MBC/MFC | ||
| Gram-pozitive bacteria | |||
| Bacillus cereus | 11.0±0.5 b | 22.5±1.5 b | 22.5±1.5 a |
| Enterococcus faecalis | 8.3±0.5 a | 45.0±0.0 c | 90.0±0.0 c |
| Staphylococcus aureus | 26.3±0.1 e | 11.2±0.6 a | 45.0±1.3 b |
| Geobacillus stearothermophilus | 15.3±0.5 d | 11.2±1.0 a | 22.5±1.0 a |
| Gram-negative bacteria | |||
| Escherichia coli | 8.3±0.5 a | 22.5±1.3 b | 45.0±1.7 b |
| Acinetobacter baumannii | 12.0±0.6 b,c | 11.2±0.8 a | 45.0±1.5 b |
| SalmonellaAbony | 8.3±0.4 a | 45.0±0.0 c | 45.0±2.0 b |
| Yeast | |||
| Candida albicans | 11.0±0.7 b | 22.5±1.0 b | 22.5±1.3 a |
* Diameter of inhibition zone; MIC - minimum inhibitory concentration; MBC- minimum bactericidal concentration; MFC - minimum fungicide concentration. Values in the table represent the means of three replicated trials ± standard deviation. Different letters (a–c) designate statistically different results (p≤ 0.05).
Table 3.
Physicochemical parameters of cream cheese fortified with microencapsulated basil extract.
| Parameters | Samples | ||||
|---|---|---|---|---|---|
| CC | 0.3%CCMBE | 0.6%CCMBE | 0.9%CCMBE | 1.2%CCMBE | |
| Moisture, % | 65.68±0.02 e | 65.50±0.01 d | 65.31±0.02 c | 65.11±0.03 b | 64.91±0.03 a |
| Protein content, % | 5.82±0.0 e | 5.78±0.0 d | 5.77±0.01 c,d | 5.75±0.01 b,c | 5.73±0.01 a,b |
| Fat content, % | 23.04±0.0 e | 22.93±0.01 d | 22.86±0.01 c | 22.79±0.01 b | 22.72±0.02 a |
CC - cream cheese without microencapsulated basil extract; CCMBE – cream cheese with microencapsulated basil extract. Values in the table represent the means of three replicated trials ± standard deviation. Different letters (a–e) designate statistically different results (p≤ 0.05).
Table 4.
Sensory properties (score) evolution of cream cheese fortified with microencapsulated basil extract, during storage.
Table 4.
Sensory properties (score) evolution of cream cheese fortified with microencapsulated basil extract, during storage.
| Sensory Properties | Storage Period, day | Samples | ||||
|---|---|---|---|---|---|---|
| CC | 0.3%CCMBE | 0.6%CCMBE | 0.9%CCMBE | 1.2%CCMBE | ||
| Appearance | 1 | 5.00±0.0 b | 5.00±0.0 b | 5.00±0.0 b | 5.00±0.0 b | 5.00±0.0 b |
| 7 | 5.00±0.0 b | 5.00±0.0 b | 5.00±0.0 b | 5.00±0.0 b | 5.00±0.0 b | |
| 14 | 5.00±0.0 b | 5.00±0.0 b | 5.00±0.0 b | 5.00±0.0 b | 5.00±0.0 b | |
| 21 | 5.00±0.0 b | 5.00±0.0 b | 5.00±0.0 b | 5.00±0.0 b | 5.00±0.0 b | |
| 28 | 3.53±0.01 a | 3.60±0.1 a | 5.00±0.0 b | 5.00±0.0 b | 5.00±0.0 b | |
| Texture | 1 | 5.00±0.0 c | 5.00±0.0 c | 5.00±0.0 c | 5.00±0.0 c | 5.00±0.0 c |
| 7 | 5.00±0.0 c | 5.00±0.0 c | 5.00±0.0 c | 5.00±0.0 c | 5.00±0.0 c | |
| 14 | 5.00±0.0 c | 5.00±0.0 c | 5.00±0.0 c | 5.00±0.0 c | 5.00±0.0 c | |
| 21 | 5.00±0.0 c | 5.00±0.0 c | 5.00±0.0 c | 5.00±0.0 c | 5.00±0.0 c | |
| 28 | 4.42±0.01 a | 4.69±0.01 b | 5.00±0.0 c | 5.00±0.0 c | 5.00±0.0 c | |
| Odor | 1 | 5.00±0.0 e | 5.00±0.0 e | 5.00±0.0 e | 5.00±0.0 e | 4.62±0.02 d |
| 7 | 5.00±0.0 e | 5.00±0.0 e | 5.00±0.0 e | 5.00±0.0 e | 4.50±0.01 c | |
| 14 | 5.00±0.0 e | 5.00±0.0 e | 5.00±0.0 e | 5.00±0.0 e | 4.42±0.01 b,c | |
| 21 | 5.00±0.0 e | 5.00±0.0 e | 5.00±0.0 e | 5.00±0.0 e | 4.12±0.01 a | |
| 28 | 4.48±0.1 b | 4.62±0.01 d | 5.00±0.0 e | 5.00±0.0 e | 4.10±0.01 a | |
| Taste | 1 | 5.00±0.0 h | 5.00±0.0 h | 5.00±0.0 h | 5.00±0.0 h | 4.20±0.01 e |
| 7 | 5.00±0.0 h | 5.00±0.0 h | 5.00±0.0 h | 5.00±0.0 h | 4.18±0.01 d,e | |
| 14 | 5.00±0.0 h | 5.00±0.0 h | 5.00±0.0 h | 5.00±0.0 h | 4.10±0.02 d | |
| 21 | 4.32±0.01 f | 4.56±0.01 g | 5.00±0.0 h | 5.00±0.0 h | 4.00±0.01 c | |
| 28 | 3.60±0.02 a,b | 3.68±0.01 b | 5.00±0.0 h | 5.00±0.0 h | 4.00±0.01 c | |
| Overall acceptance | 1 | 5.00±0.0 h | 5.00±0.0 h | 5.00±0.0 h | 5.00±0.0 h | 4.71±0.01 d,e |
| 7 | 5.00±0.0 h | 5.00±0.0 h | 5.00±0.0 h | 5.00±0.0 h | 4.67±0.01 d,e | |
| 14 | 5.00±0.0 h | 5.00±0.0 h | 5.00±0.0 h | 5.00±0.0 h | 4.63±0.01 d | |
| 21 | 4.83±0.01 f | 4.89±0.01 g | 5.00±0.0 h | 5.00±0.0 h | 4.53±0.01 c | |
| 28 | 4.01±0.01 a | 4.15±0.01 b | 5.00±0.0 h | 5.00±0.0 h | 4.53±0.01 c | |
Values in the table represent the means of three replicated trials ± standard deviation. Different letters (a–h) designate statistically different results (p≤ 0.05).
Table 5.
pH value evolution of cream cheese fortified with microencapsulated basil extract, during storage.
Table 5.
pH value evolution of cream cheese fortified with microencapsulated basil extract, during storage.
| Storage Period, days | Samples | ||||
|---|---|---|---|---|---|
| CC | 0.3%CCMBE | 0.6%CCMBE | 0.9%CCMBE | 1.2%CCMBE | |
| 1 | 5.41±0.0 h | 5.35±0.01 g | 5.31±0.01 f | 5.30±0.02 e,f | 5.26±0.01 d |
| 7 | 5.41±0.0 h | 5.34±0.01 g | 5.30±0.01 e,f | 5.28±0.01 d,e | 5.24±0.02 c,d |
| 14 | 5.35±0.01 g | 5.31±0.01 f | 5.30±0.01 e,f | 5.27±0.02 d,e | 5.21±0.01 b,c |
| 21 | 5.24±0.01 c,d | 5.27±0.01 d,e | 5.28±0.01 d,e | 5.26±0.01 d | 5.21±0.01 b,c |
| 28 | 5.12±0.01 a | 5.19±0.01 b | 5.27±0.01 d,e | 5.25±0.01 c,d | 5.20±0.01 b |
Values in the table represent the means of three replicated trials ± standard deviation. Different letters (a–h) designate statistically different results (p≤ 0.05).
Table 6.
Texture parameters evolution of cream cheese fortified with microencapsulated basil extract, during storage.
Table 6.
Texture parameters evolution of cream cheese fortified with microencapsulated basil extract, during storage.
| Texture Parameters | Storage Period, day | Samples | ||||
|---|---|---|---|---|---|---|
| CC | 0.3%CCMBE | 0.6%CCMBE | 0.9%CCMBE | 1.2%CCMBE | ||
| Hardness, g | 1 | 1914.1±43.5 b | 1914.8±34.1 b | 1913.5±28.6 b | 1891.2±10.2 b | 1439.8±42.3 a |
| 7 | 2951.8±60.2 e | 2568.8±25.2 d | 2476.1±25.4 d | 2405.1±27.8 c | 1960.9±52.3 b | |
| 14 | 4123.5±32.5 h,i | 2807.2±19.7 e | 2637.3±32.5 d | 2506.9±31.5 d | 2034.01±39.6 b | |
| 21 | 4180.3±22 i | 3254.3±26.8 f | 2962.4±31.6 e | 2960.8±26.8 e | 2502.2±44.3 d | |
| 28 | 2424.6±17.4 c | 3512.01±35.6 g | 3280.9±18.8 f | 3225.6±34.4 f | 3016.9±36.8 e,f | |
| Springiness, % | 1 | 1.001±0.0001 b | 1.000±0.0001 a | 1.000±0.0001 a | 1.002±0.0001 c | 1.000±0.0001 a |
| 7 | 1.000±0.0001 a | 1.001±0.0001 b | 1.000±0.0001 a | 1.001±0.0001 b | 1.002±0.0001 c | |
| 14 | 1.001±0.0001 b | 1.001±0.0001 b | 1.001±0.0001 b | 1.002±0.0001 c | 1.000±0.0001 a | |
| 21 | 1.001±0.0001 b | 1.001±0.0001 b | 1.001±0.0001 b | 1.001±0.0001 b | 1.000±0.0001 a | |
| 28 | 1.001±0.0001 b | 1.001±0.0001 b | 1.001±0.0001 b | 1.001±0.0001 b | 1.001±0.0001 b | |
| Cohesiveness, % | 1 | 0.462±0.008 h | 0.476±0.004 i | 0.489±0.009 i | 0.534±0.004 j | 0.568±0.002 k |
| 7 | 0.214±0.005 b,c | 0.295±0.004 d | 0.315±0.007 e | 0.390±0.004 g | 0.386±0.006 f,g | |
| 14 | 0.148±0.006 a | 0.241±0.007 c | 0.313±0.009 e | 0.360±0.009 f | 0.367±0.008 f | |
| 21 | 0.199±0.007 b | 0.204±0.009 b | 0.245±0.006 c | 0.282±0.006 d | 0.307±0.005 e | |
| 28 | 0.327±0.007 e | 0.202±0.005 b | 0.210±0.005 b,c | 0.247±0.005 c | 0.279±0.007 d | |
| Adhesiveness, g⋅s | 1 | 2252.0±26.7 c,d | 2217.0±31.2 c | 2216.2±29.7 c | 2134.5± 26.3 c | 1648.3±35.4 a |
| 7 | 3589.8±30.2 h | 3048.8±25.7 f | 2914.6±32.3 f | 2772.6± 34.7 e | 2276.0±18.0 d | |
| 14 | 4833.9±5.2 k | 3175.4± 34.8 g | 3104.8±24.8 f,g | 2821.7± 29.8 e,f | 2336.0±22.4 d | |
| 21 | 4903.0±18.6 k | 3895.1± 28.6 i | 3606.3±27.5 h | 3125.6±25.5 f,g | 2841.6±32.6 e,f | |
| 28 | 1929.6±35.6 b | 4079.9±31.9 j | 3916.5±31.7 i | 3841.4± 31.3 i | 3318.4±25.1 g | |
| Gumminess, % | 1 | 884.3±6.7 i | 888.8±10.2 i | 897.8±9.7 i | 935.7±10.9 j | 1009.9±7.6 l |
| 7 | 631.7±8.5 a,b | 756.9±11.3 e | 757.8±9.6 e | 927.2± 9.6 j | 980.0±11.5 k,l | |
| 14 | 618.5±8.6 a,b | 673.7±9.1 c | 752.6±9.4 e | 902.5±11.7 i,j | 923.7± 10.5 j | |
| 21 | 611.9±9.2 a | 663.9± 10.6 b,c | 725.8± 11.5 d,e | 834.9±9.2 g,h | 899.1± 11.3 i | |
| 28 | 792.8±10.1 f | 634.9±11.9 a,b | 717.1±10.1 d | 819.3±10.3 g | 843.4± 12.4 g,h | |
Values in the table represent the means of three replicated trials ± standard deviation. Different letters (a–l) designate statistically different results (p≤ 0.05).
Table 7.
Polyphenols used as standards in HPLC analysis of basil extract.
| Compound | Max absorbtion, nm | Retention time, min | m/z [M+H]+ |
Polyphenol Classes |
|---|---|---|---|---|
| Epigallocatechin | 280 | 13.17 | 306 | Flavavol |
| Chicoric acid | 330 | 14.38 | 475 | Hydroxycinnamic acid |
| Querectin-rutinoside | 355, 260 | 15.73 | 611 | Flavonol |
| Luteolin-glucoside | 350, 260 | 16.14 | 449 | Flavone |
| Dehydrodiferulic acid | 330 | 19.34 | 386, 194 | Hydroxycinnamic acid |
| Rosmarinic acid | 330 | 20.09 | 360 | Hydroxycinnamic acid |
| Methyl-rosmarinate | 330 | 22.39 | 375 | Hydroxycinnamic acid |
| Carnosol | 330, 270 | 23.17 | 331 | Phenolic terpene |
| Rosmadial | 330 | 23.56 | 345 | Phenolic terpene |
| Not identified | 270 | 24.75 | 624, 249 |
Table 8.
Sensory characteristics of the cream cheese.
| Sensory properties | Description |
|---|---|
| Appearance | Soft, creamy, clean, without curdling, white to slightly yellow color in the case of plain cream cheese, or characteristic of the added ingredients in the case of flavored cream cheese. |
| Texture | Fine, creamy paste |
| Odor | Characteristic odor of lactic fermentation in the case of plain cream cheese, and the specific odor of the used ingredients in the case of flavored cream cheese, without any foreign odor. |
| Taste | Characteristic of lactic fermentation in the case of plain cream cheese, or specific to the used ingredients in the case of flavored cream cheese, without any foreign taste. |
Disclaimer/Publisher’s Note: The statements, opinions and data contained in all publications are solely those of the individual author(s) and contributor(s) and not of MDPI and/or the editor(s). MDPI and/or the editor(s) disclaim responsibility for any injury to people or property resulting from any ideas, methods, instructions or products referred to in the content. |
© 2023 by the authors. Licensee MDPI, Basel, Switzerland. This article is an open access article distributed under the terms and conditions of the Creative Commons Attribution (CC BY) license (http://creativecommons.org/licenses/by/4.0/).
Copyright: This open access article is published under a Creative Commons CC BY 4.0 license, which permit the free download, distribution, and reuse, provided that the author and preprint are cited in any reuse.


