Preprint
Article

Novel Data Analyses Explain the Birth-Cohort Phenomenon of Peptic Ulcers

Altmetrics

Downloads

255

Views

128

Comments

0

A peer-reviewed article of this preprint also exists.

This version is not peer-reviewed

Submitted:

06 February 2023

Posted:

13 February 2023

Read the latest preprint version here

Alerts
Abstract
Background: The birth-cohort phenomenon of peptic ulcers has remained an unresolved mystery for 60 years since it was first reported in 1962. Currently, peptic ulcers are widely studied as an infectious disease caused by Helicobacter pylori, but this etiology cannot explain this phenomenon. A recently published etiological theory identified peptic ulcers as a psychosomatic disease triggered by psychological stress. This new theory addresses all the characteristics, observations/phenomena, controversies, and mysteries of the disease in a series of 6 articles. Methods: In this fourth article of the series, all the possible causes of peptic ulcers collected from literatures were classified into 3 categories, and the mortality rates caused by these categories were superposed to reproduce the fluctuation curves in the birth-cohort phenomenon. Results: The fluctuation curves in the birth-cohort phenomenon were successfully reproduced, with all the details of the phenomenon elucidated. Psychological stress induced by the First World War accounted for the increasing mortality rates in the early 1910s. The high mortality rates between 1910s and 1940s were maintained by a succession of crucial events that led to extensive psychological stress in the population. The end of the Second World War and continuous improvements in living conditions explained the fall in the early 1950s and afterwards. Conclusions: The birth-cohort phenomenon cannot be fully understood unless peptic ulcers are considered a psychosomatic disease triggered by psychological stress. A full explanation of the birth-cohort phenomenon exemplifies the application of a brand-new methodological concept, superposition mechanism, which can be universally applied to understand any life phenomenon and human disease.
Keywords: 
Subject: Medicine and Pharmacology  -   Dermatology

Introduction

The birth-cohort phenomenon of peptic ulcers (including duodenal and gastric ulcers) was first reported by Susser and Stein in 1962, [1] and amended in 2002. [2] They found that the mortality rates of gastric ulcers in England and Wales increased at the beginning of the 20th century, reached a peak and then began to fall in the early 1950s. [1,2] They also found that the trends for duodenal ulcers were similar but followed approximately five years behind.[1,2] Susser and Stein hypothesized that each generation has carried its own particular risk of bearing ulcers throughout adult life and the fluctuations in the mortality rates of peptic ulcers represented a birth-cohort phenomenon.[1,2] Subsequent analyses from Western Europe, North America, and Asia have confirmed the presence of this cohort pattern.[3,4,5,6] Although 13 etiological theories have been proposed to explain the pathogenesis of peptic ulcers over the past 3 centuries,[7] the mechanism underneath the birth-cohort phenomenon has never been fully understood.
In 1987, Marshall proposed that peptic ulcers are an infectious disease caused by the infection of Helicobacter pylori (H. pylori). As a result, currently peptic ulcers are widely believed to be an infectious disease caused by H. pylori,[8] but this etiology is controversial and how the bacterium leads to ulceration is unknown.[9,10,11,12,13] The etiological theory of peptic ulcers based on H. pylori infection was designated as Theory of H. pylori.[7] Unfortunately, Theory of H. pylori cannot explain most of the 15 characteristics and 81 observations/phenomena of peptic ulcers,[7] including 30 of the 36 observations/phenomena associated with the bacterium itself. Marshall himself could not explain the birth-cohort phenomenon of peptic ulcers.[14] Starting from Theory of H. pylori, Sonnenberg proposed a mathematical model to explain the birth-cohort phenomenon in 2006.[15] However, this model overlooked the facts that the H. pylori prevalence in gastric ulcers did not reach 50%,[16,17,18] and 20-30% of duodenal ulcer patients could be H. pylori-negative.[13,19] Moreover, this model failed to explain ‘the trends for duodenal ulcers were similar to gastric ulcers but followed ~5 years behind’, along with several other obvious defects.[15] In addition, Sonnenberg’s explanation cannot be used to elucidate the other epidemiological mysteries on peptic ulcers, such as the seasonal variation[20,21] and African enigma,[22,23] as well as many other characteristics and observations/phenomena of the disease. Thus, the birth-cohort phenomenon of peptic ulcers has remained an unresolved mystery for 60 years.[2,14,24,25]
To address these challenges, a recently published Complex Causal Relationship (CCR)[26] was applied to analyze the existing data, resulting in the birth of a new etiological theory, Theory of Nodes.[27,28,29] In this new theory, peptic ulcers were identified as a psychosomatic disease triggered by psychological stress, whereas H. pylori plays a secondary role in only the late phase of peptic ulcerations.[27,28,29] Encouragingly, this etiology explains all the 15 major characteristics and 81 observations/phenomena of peptic ulcers in a series of 6 articles (Supplemental Table S1). In the first three articles of the series, 14 mahjor characteristics and 71 observations/phenomena of peptic ulcers, which have never been fully understood before, have been explicitly elucidated.[27,28,29] This article is the fourth one, focusing exclusively on the 72nd observation/phenomenon, the birth-cohort phenomenon of peptic ulcers. Since the fluctuation curves are the most important feature of this phenomenon,[1,2] this retroactive analysis will deliberate on elucidating the mechanism of the fluctuation curves. Despite two different diseases,[25,30] gastric and duodenal ulcers share similar mechanism of the birth-cohort phenomena. Thus, herein only the fluctuation curves of gastric ulcer are explored. In addition, how ‘the trends for duodenal ulcer are similar to gastric ulcer, but followed ~5 years behind’[1,2] is also elucidated.

Methods

Based on the etiology identified in the first article of the series,[28] 5 steps were taken to elucidate the birth-cohort phenomenon of peptic ulcers. First, all the possible stressors collected from literatures were classified based on their features. Second, the mortality rates caused by each category were superposed in two ways to analyze the trends of annual mortality rates in an ideal/hypothetical scenario. Third, the superposition was repeated to analyze the real scenario studied by Susser and Stein.[1,2] A fluctuation curve of gastric ulcer in the birth-cohort phenomena was thereby reproduced. Fourth, the rise and fall in the fluctuation curves of the birth-cohort phenomenon was elucidated, along with other details. Lastly, ‘the trends for duodenal ulcer were similar to gastric ulcer but followed ~5 years behind’ was explicated.

Results

Interestingly, the fluctuation curves in the birth-cohort phenomenon were very similar to the curves in an irregular region, of which Isaac Newton calculated the area using calculus in the 17th century. Herein similar analytical methods, differentiation and integration, were iterated to elucidate the birth-cohort phenomenon of peptic ulcers.

1. Classification of the stressors causing peptic ulcers

In Theory of Nodes, peptic ulcers are a psychosomatic disease triggered by psychological stress. In a specific region or population, there are always a proportion of individuals who are genetically predisposed to peptic ulcers, and due to past life experiences/ psychosomatic factors, many of them have developed hyperplasia and hypertrophy of gastrin and parietal cells in their stomach,[28] or have formed a negative life view in their mind [27]. Thus, this proportion of individuals is ready-to-ulcerate individuals and may become ulcer patients if psychological stress is induced for any reason. In that case, the mortality and morbidity rates of peptic ulcers are heavily impacted by stressors, including family, social, natural environmental factors and personality traits.[28] Herein all the possible stressors in the literatures are classified into three categories according to their features (Table 1). Clinical misdiagnosis occurs at a certain frequency,[31,32] but was more commonly seen in the early 20th century because diagnostics were not as advanced as they are today. Misdiagnosis increases the overall mortality rate of gastric ulcer and affects the statistical results, thereby is regarded as the first category of stressors in this analysis. The second category is termed common events, which include everyday life and social events,[33,34,35] struggling with personality disorders,[36,37] and social or natural environmental factors.[38,39,40] Common events arise at a certain rate and thus cause relatively consistent mortality rates from year to year. For example, in a particular population, there are always a proportion of individuals facing divorce, unemployment, or conflicts with neighbours or family members. The third category is referred to as crucial events, which happen sporadically and last for an indeterminate amount of time, leading to an uneven mortality rate. For example, a war[41] or an economic crisis[42,43] arises unpredictably, and is resolved in a period of time. Another example is natural disasters such as tsunamis or earthquakes,[44,45] which have short duration, but their effects may be felt long-term. All the three categories may cause their respective mortality rates of peptic ulcers.
Table 1. Classification of Stressors.
Category Stressors Features
Clinical Misdiagnosis 1. Commonly seen in the 20th century. 1. Occurs at a certain frequency.
2. Causes a relatively consistent mortality.
3. The mortality caused by misdiagnosis fluctuates slightly.
Common Events 1. Common social events: unemployment, divorce, poverty, family and neighbourhood conflicts, etc.
2. Struggling with personality disorders: immaturity, negative perception, hypochondriasis, dependency, impulsivity, etc.
3. Environment factors: seasonal alterations, working environment, urbanisation etc.
1. Occur at a certain frequency.
2. Cause a relatively consistent mortality.
3. The mortality caused by common events fluctuates slightly.
Crucial Events 1. Wars: worldwide or local wars, massacres, religious conflicts, etc.
2. Crucial economic or social crises, political movements etc.
3. Natural disasters: earthquake, tsunamis, typhoon, flood, or landslides, etc.
1. Happen sporadically and lasts for a limited period of time.
2. Leads to an uneven mortality rate.
3. The mortality caused by crucial events fluctuates markedly.

2. The vertical superposition of the mortality rates of gastric ulcers

To calculate the area, Newton first differentiated the irregular region into many infinitesimal rectangles and calculated the area of each infinitesimal rectangle separately. Similarly, to elucidate the birth-cohort phenomenon of peptic ulcers, Theory of Nodes first differentiated the fluctuation curve into many single years and calculate the annual mortality rates independently.
The CCR dictates that a complex phenomenon is usually the result of additive effects caused by multiple individual factors and therefore, a methodological concept, Superposition Mechanism, is derived to elucidate life phenomena and human diseases[28]. This concept directed Theory of Nodes to superpose the 3 mortality rates caused by misdiagnosis, common events, and crucial events in a given year. The annual mortality rates of gastric ulcers were calculated by the formula MAnnual Mortality = ∑Misdiagnose + ∑Common Events + ∑Crucial Events as shown in Figure 1, in which each bar is a vertical sum of the mortality rates on an annual basis of a hypothetical scenario. The calculation of the annual mortality rates by this method was defined as the vertical superposition.

3. The horizontal superposition to determine the trends of mortality rates over time

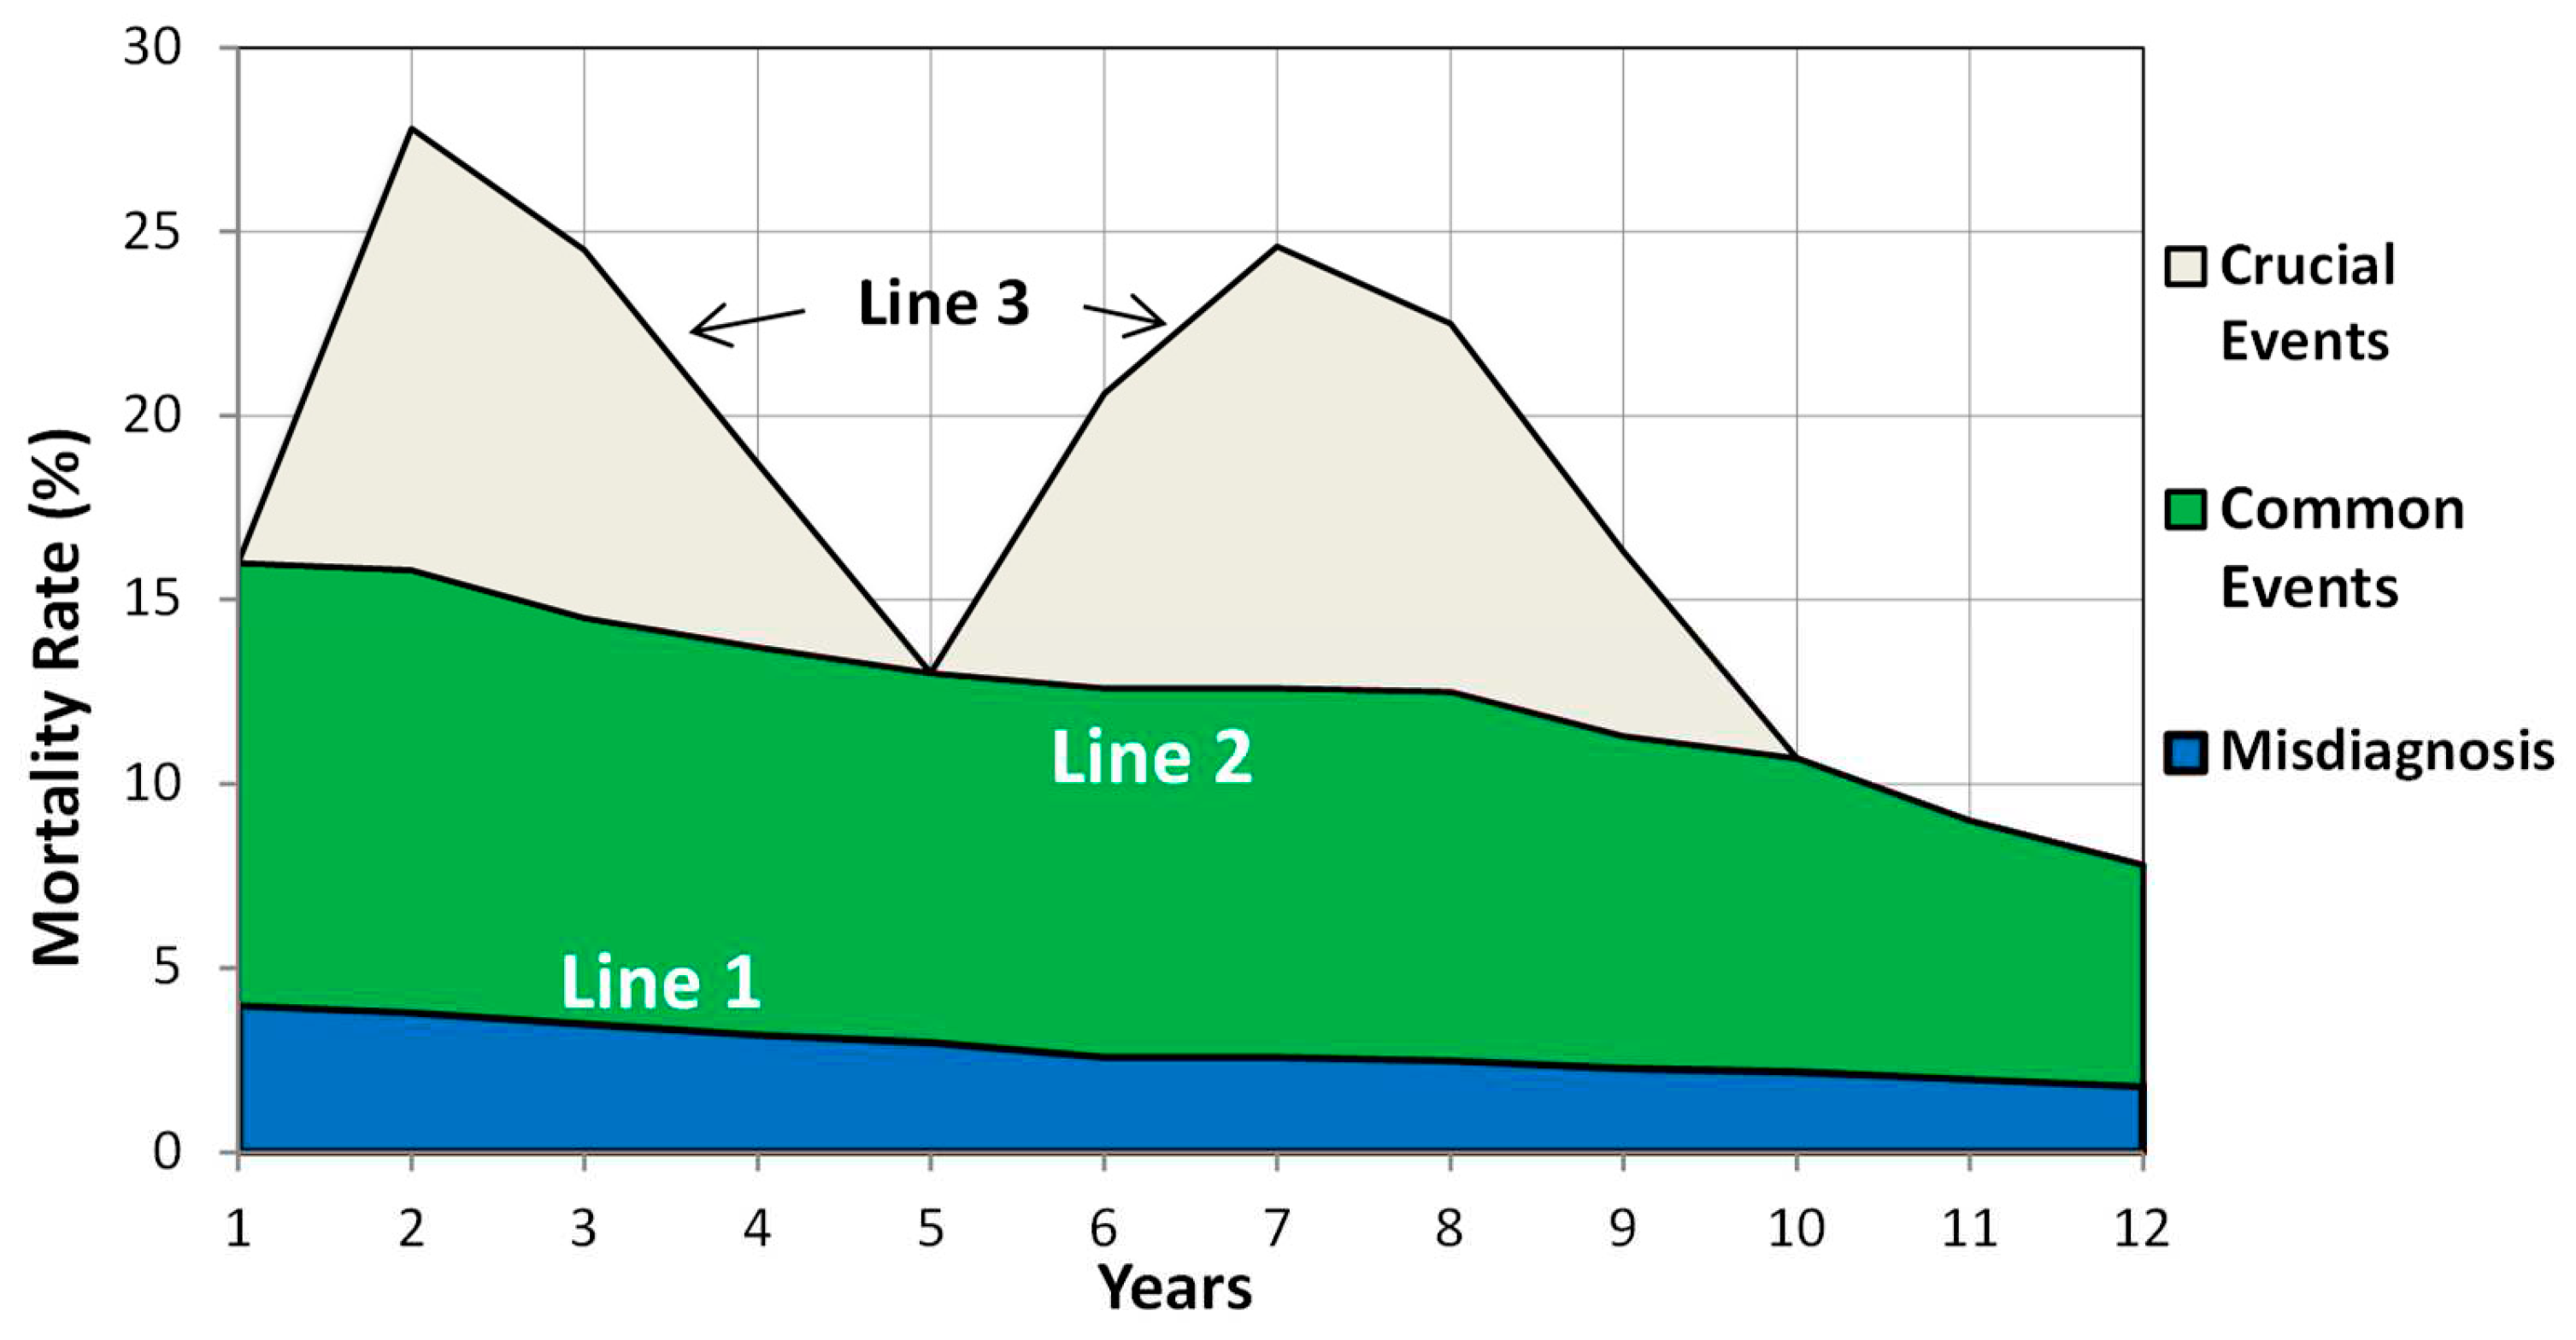
Second, once the areas of all the infinitesimal rectangles were calculated, Newton integrated all of them to restore the original irregular region and thus accurately quantitated the area of the irregular region. Similarly, once all the annual mortality rates were calculated, Theory of Nodes integrated all these values in a chronological order to reflect the temporal trend in the mortality rates of gastric ulcers by a fluctuation curve as shown in Figure 2. This way of data integration is termed horizontal superposition in Theory of Nodes. Alternatively, Figure 2 can also be derived simply by converting the bar graph Figure 1 into a line graph to demonstrate a trend over time in the annual mortality rates of gastric ulcers.

4. Overlapping of fluctuation curves due to a succession of crucial social events.

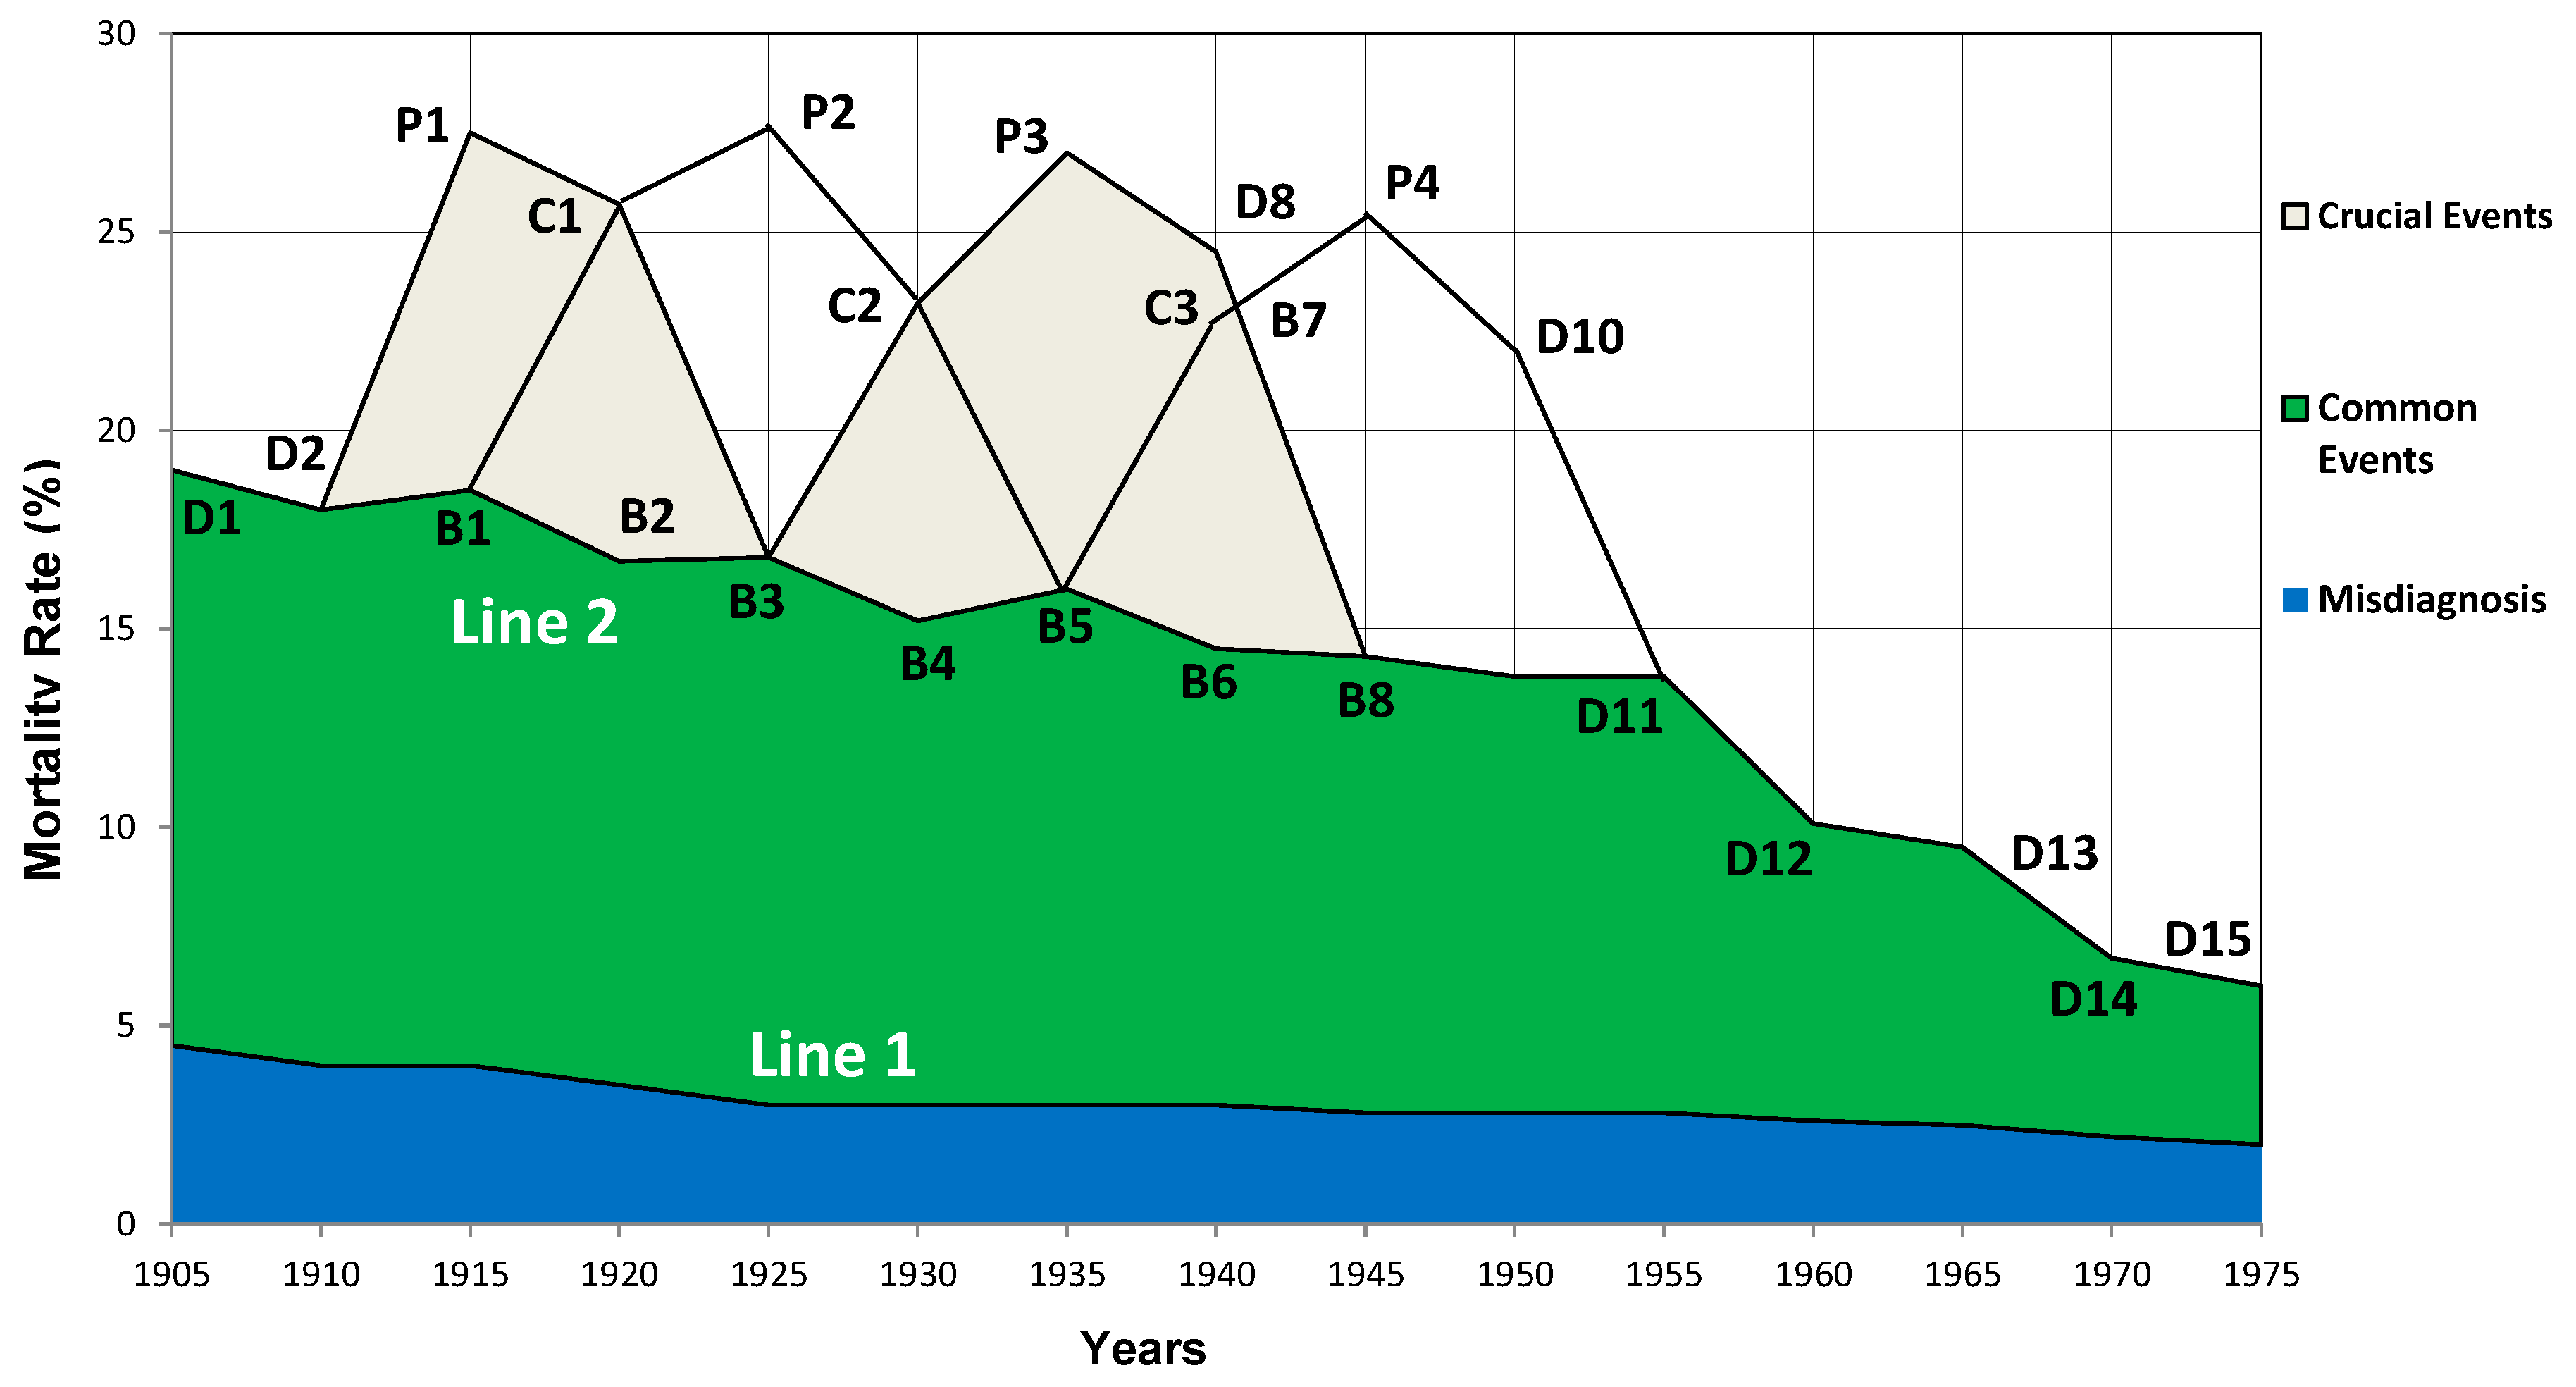
Figure 1 and Figure 2 represent an ideal scenario. However, the reality is usually much more complicated. For instance, in the early 20th century, most European countries were affected by the First World War (1914-1918), rebuilding after the war, the unemployment caused by economic crisis in the 1930s and the Second World War (1939-1945). As a result, from the 1910s to the 1940s, at least four crucial events occurred successively in many European countries, including England and Wales, where the data was collected by Susser and Stein for the birth-cohort phenomenon.[1,2] The fluctuation curves caused by these individual crucial events overlapped as illustrated in Figure 3.

5. The mortality rates cause by a succession of crucial social events

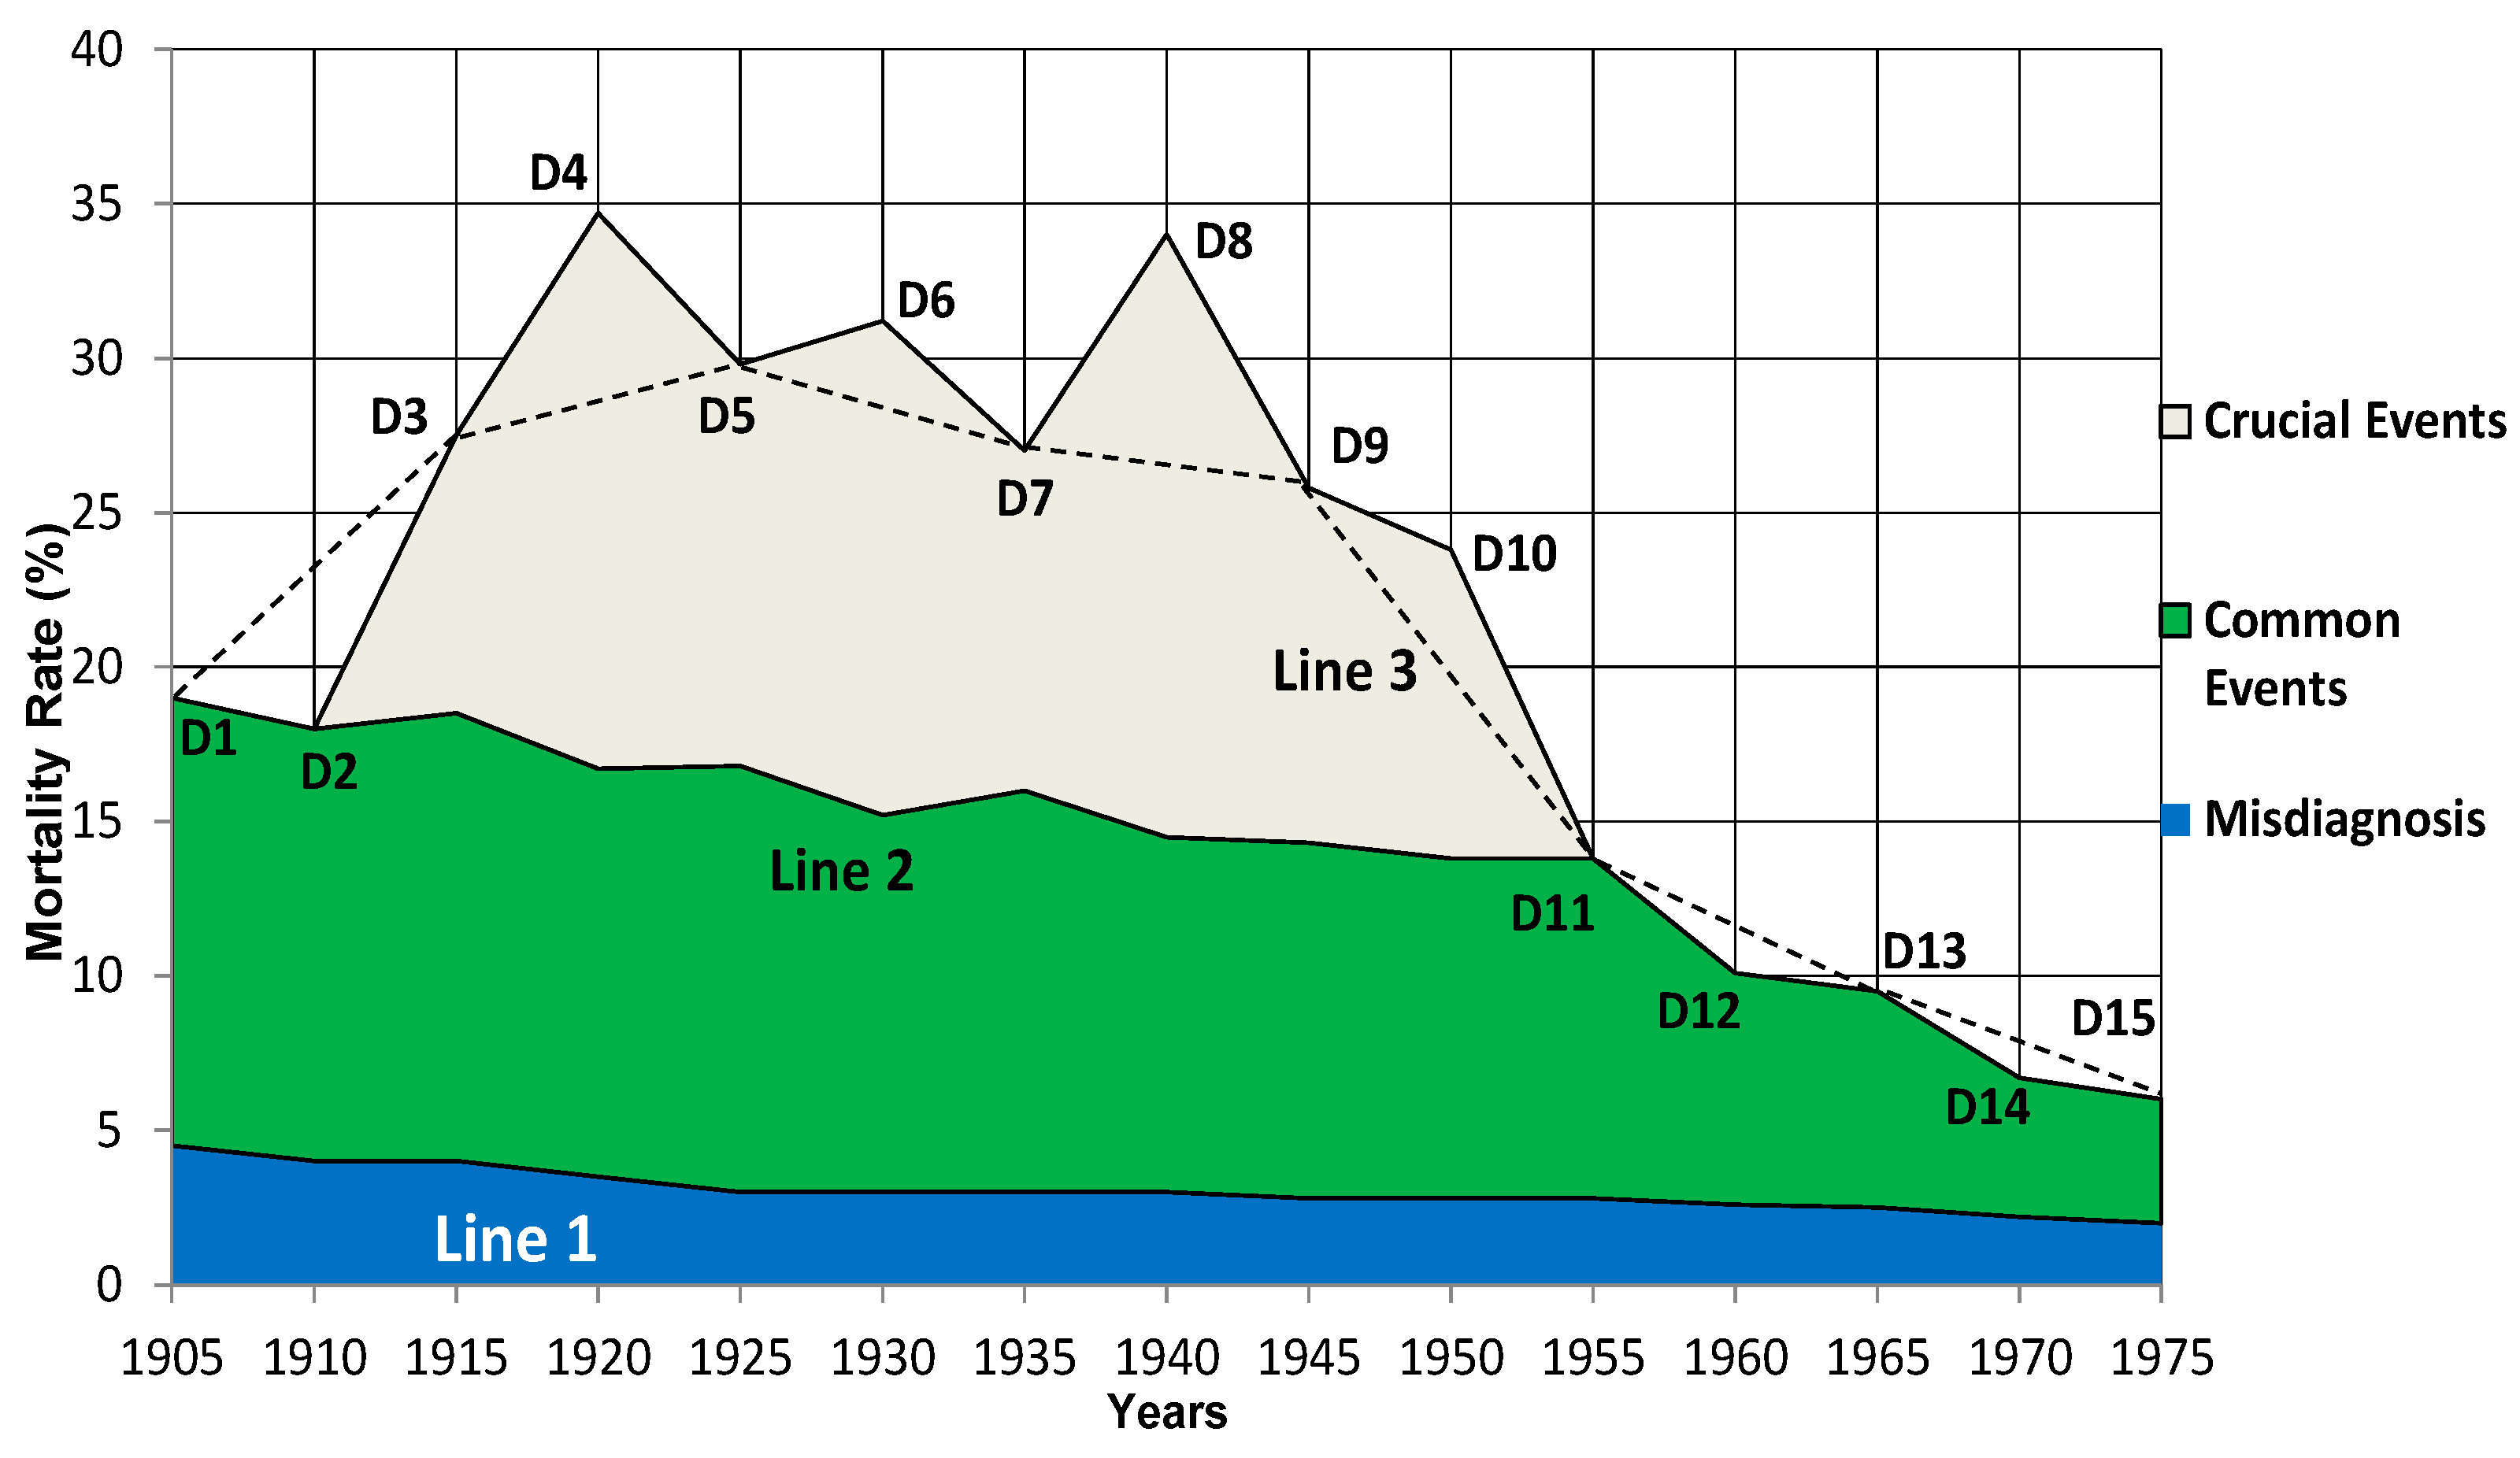
In the case of a succession of crucial events, the vertical superposition/differentiation in Figure 1 was repeated to calculate the annual mortality rates of gastric ulcers from 1905 to 1975. If there were two crucial events in a given year, the mortality rates caused by crucial events was calculated by the formula M Crucial Events = ∑Crucial Event 1 + ∑Crucial Event 2. Assume this scenario: in 1915, the mortality rate as a result of the First World War was 9%, but there are no effects from rebuilding, thus the total mortality rate caused by crucial events in this year is 9%. In 1920, the mortality rate of peptic ulcers caused by the First World War was 9% and by rebuilding after the war was 9%, so the total mortality rate by crucial events is 9%+9% =18%. The total mortality rates of gastric ulcers caused by crucial events are calculated similarly for all the other years. Subsequently, the annual mortality rate of each year was calculated using the formula: MAnnual Mortality = ∑Misdiagnose + ∑Common Events + ∑Crucial Event 1 + ∑Crucial Event 2. Then the horizontal superposition/integration described in Figure 2 was iterated to formulate a theoretical fluctuation curve for every five years from 1905 to 1975 as shown in Figure 4.
However, overestimation occurred when vertical superposition was applied to calculate the mortality rates caused by two crucial events. In 1920, 1930 and 1940, individuals might experience two crucial events and become ulcer patients, but could also become patients if they experienced only one of the two events. Thus, a proportion of patients might have been counted twice, causing extremely high overall mortality rates in 1920 (D4), 1930 (D6) and 1940 (D8) in Figure 4. These analyses suggest that, it was a succession of crucial events from the start of the First World War to the end of the Second World War that maintained the high mortality rate of gastric ulcers.

6. Reproduction of the mortality fluctuation curves of the birth-cohort phenomena

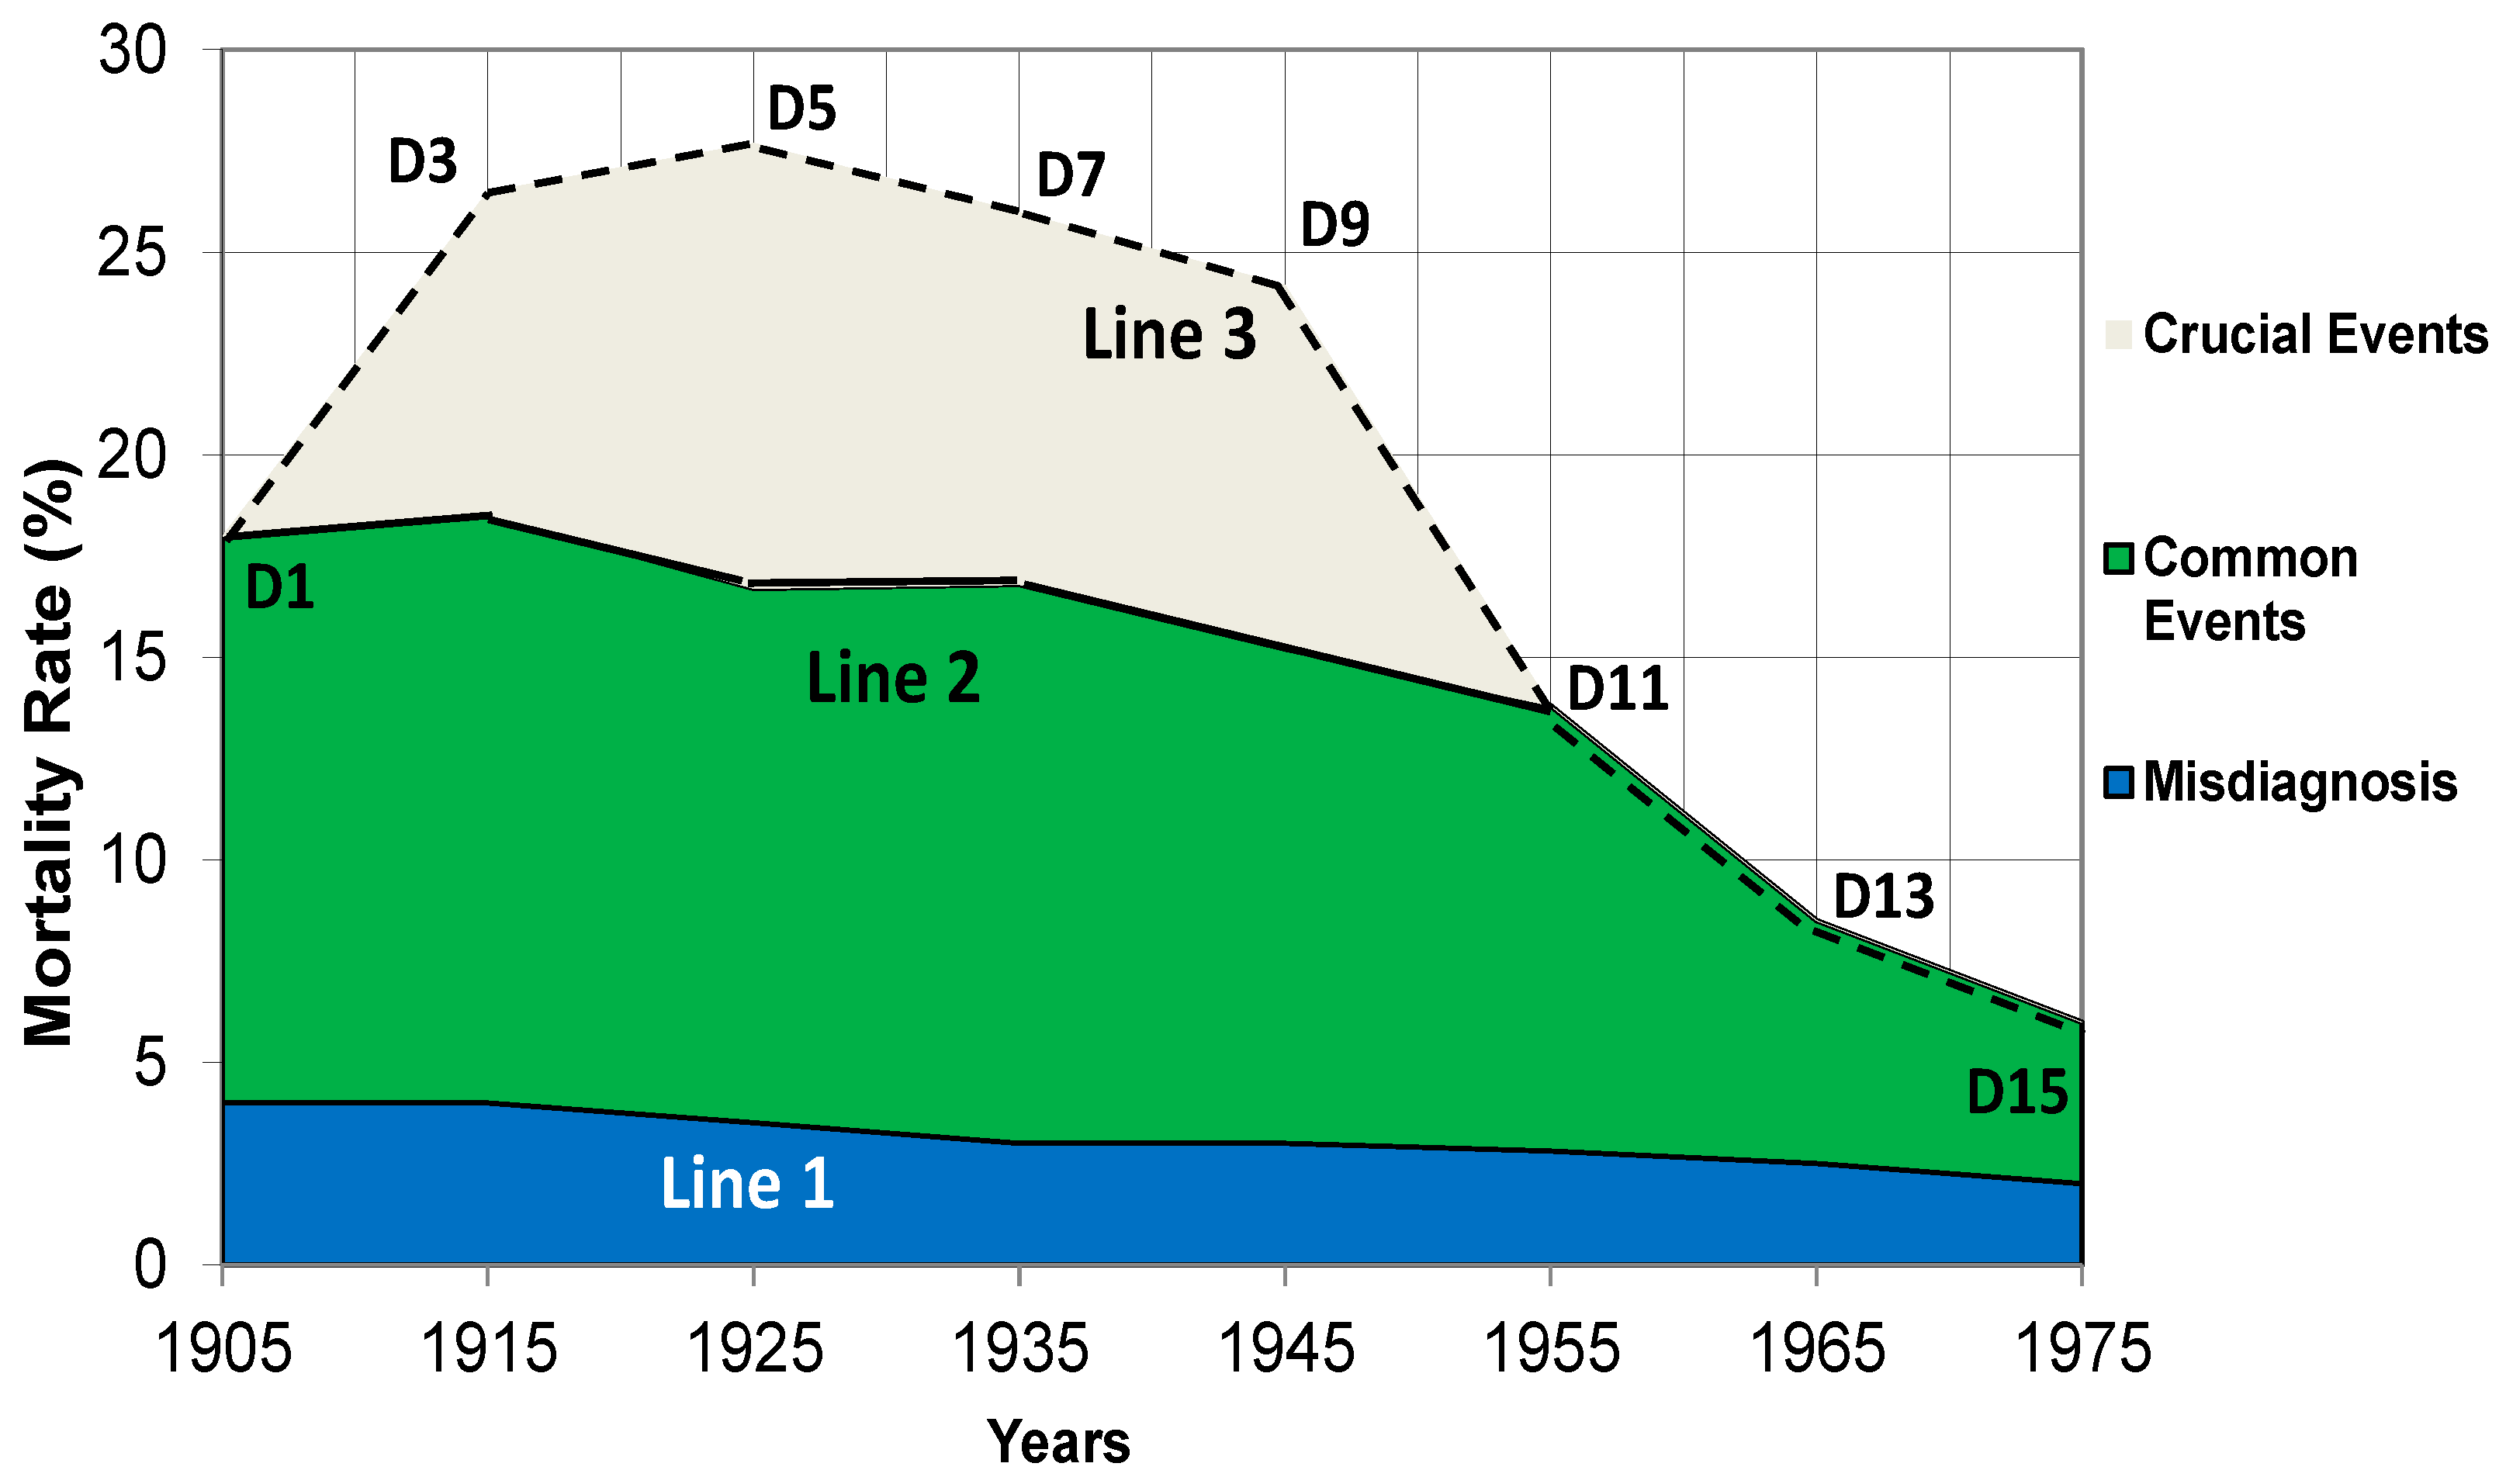
Fortunately, Susser and Stein did not investigate the mortality rates in the years 1910, 1920, 1930, 1940, 1950, 1860, and 1970. After the data for these years was removed from the theoretical curve, one fluctuation curve in the birth-cohort phenomena observed by Susser and Stein was reproduced as shown in Figure 5. Notably, the data analyses presented herein are applicable to all the age-groups in the birth-cohort phenomena of peptic ulcers. In addition, the methodologies described above can be applied to explain various parameters of peptic ulcers, such as the morbidity rates, perforation rates, hospitalization rates and disability pension rates. These parameters are all inter-related and are affected by misdiagnosis, common events and crucial events. Therefore, the fluctuation curves for all these parameters follow similar temporal trends.
In Susser and Stein’s study, data was collected every 10 years whereas this study analyzed 5-year intervals. By removing the years not investigated in their report from this study (1910, 1920, 1930, 1940, 1950, 1860, 1970) in Figure 4, the dashed Line 3 presented herein reproduced Susser and Stein’s fluctuation curves in the birth-cohort phenomenon of gastric ulcers.

7. Understanding the birth-cohort phenomenon of gastric ulcers

Line 3 in Figure 5 suggests that once gastric ulcer is considered a psychosomatic disease triggered by psychological stress, the fluctuation curves observed by Susser and Stein can be reproduced, especially the curves for the 25~34 age group who experienced the greatest effects from crucial events.[1,2] In fact, this analysis is applicable to all the age-groups observed by Susser and Stein: the older the age, the more complex social experiences and thereby the more susceptible to gastric ulcers. This statement elucidated Susser and Stein’s finding in 1962 that ‘the risk of death from both gastric and duodenal ulcers can be seen to rise steadily with age’.[1,2]
Figure 5 explicitly elucidated the rise and fall in the mortality rates of gastric ulcers observed by Susser and Stein. The start of the First World War in 1914 accounted for the sharp rise in mortality rates of gastric ulcers in the early 20th century. The continuing trend of increase in perforated gastric ulcers until the early 1950s was maintained by a succession of multiple crucial events. The decrease in annual mortality rates in the early 1950s was due to the end of the Second World War, and the continuing decline in the late 1950s was a result of sustained improvements in living conditions and the sociopolitical environment. The start and end of crucial events explain the slope observed at 1905-1915 (the First World War) and 1945-1955 (the Second World War). The generation born around 1885, especially the males, were in their 20s~30s when the First World War broke out in 1914. They experienced all the crucial events from 1914 to the early 1950s in their adult life, and were most probably the direct participants, executors and/or victims. This statement supports Susser and Stein’s finding in 1962 of ‘for gastric ulcer in males the generation born around 1885 carried the highest risk’.[1,2] Figure 5 also confirmed Susser and Stein’s speculation ‘the timing of the First World War and the unemployment of the 1930s roughly fit the fluctuations and the cohorts with the highest peptic ulcer death rates’.[1,2]

8. The delayed occurrence of duodenal ulcers

Susser and Stein reported that the trends for duodenal ulcers were similar to gastric ulcers, but followed ~5 years behind in the birth-cohort phenomenon.[1,2] Theory of H. pylori could not explain the delayed occurrence of duodenal ulcers.[14,15] In Theory of Nodes, heredity, secondary stressors derived from crucial events, and the hyperplasia and hypertrophy of gastrin and parietal cells in the stomach, explained the delayed occurrence of duodenal ulcers in the birth-cohort phenomenon.
The importance of genetic factors in peptic ulcers has been emphasized by clinical observations.[46] In Theory of Nodes, individuals susceptible to gastric and duodenal ulcers belong to two genetically different populations.[27,28] As a result, although both populations experienced the same crucial events, the individuals with gastric ulcer predisposition may develop gastric ulcers, whereas the individuals with duodenal ulcer predisposition may develop duodenal ulcers. However, stressors for gastric ulcers, such as wars, unemployment, financial crisis, catastrophe, loss of family members, and divorce, which are usually short term and acute, directly cause gastric ulcers during or right after the crucial events. In contrast, duodenal ulcers are caused by the secondary stressors derived from crucial events, such as laborious work, poor work/living environments, lower social status, or strained family relations, which are usually long-term and chronic, cannot cause duodenal ulcers right away due to the chronic psychopathological process for the hypersecretion of duodenal ulcers. As a response to chronic stressors, it takes ~5 years to induce the hyperplasia and hypertrophy of gastrin and parietal cells in the stomach,[47,48] which in turn result in the hypersecretion of gastric acid and eventually, duodenal ulcers. On the other hand, unlike the easy-to-simulate acute stress that induces gastric ulcers,[49,50] the chronic stress that induces duodenal ulcer is difficult to duplicate in labs. Consequently, all stress-induced ulcers in animal models are gastric ulcers,[46] further supporting the temporal differences between gastric and duodenal ulcers.[27]
The fluctuation curves of duodenal ulcers in the birth-cohort phenomenon were dominated by the rise and fall of the mortality rates from the individuals who had a hereditary predisposition to duodenal ulcers and were impacted by the secondary stressors derived from crucial events. Thus, despite experiencing the same crucial events, a proportion of individuals developed gastric ulcers right away, causing increased mortality rates immediately, whereas another proportion of individuals developed duodenal ulcers ~5 years later. As a result, the trends for duodenal ulcer incidence were similar to gastric ulcers, but followed approximately five years behind in the birth-cohort phenomenon.

Discussion

Despite 13 etiological theories being proposed,[7] the birth-cohort phenomenon of peptic ulcers has never been fully understood before since it was first reported in 1962. In contrast, guided by the CCR, Theory of Nodes identified the etiology of peptic ulcers, and employed one of the CCR’s accompanying methodological concept, Superposition Mechanism, to fully elucidate the underlying mechanism of this 60-year-old mystery. Theory of Nodes attributed the success to a definite etiology with effective analytical methods, the superposition mechanism.
Unequivocally, an etiological theory proposing the correct cause of peptic ulcers should be able to explain all the characteristics and observations/phenomena of the disease.[7] However, Theory of H. pylori cannot face the challenges of almost all the 15 characteristics and 81 observations/phenomena of peptic ulcers,[7] indicating H. pylori infection may not be the cause of peptic ulcers. Interestingly, herein Theory of Nodes elucidated the birth-cohort phenomenon of peptic ulcers without taking H. pylori into consideration, further suggesting that the infection of this bacterium is not the cause of the disease.[28] Instead, ‘a causal relationship between H. pylori and peptic ulcers’[51,52,53] might be an illusion in medicine. Thus, it is not surprising that Marshall and Sonnenberg could not fully explain this phenomenon,[14,15] along with all the other 15 characteristics and 75 observations/phenomena of peptic ulcers.
In fact, the birth-cohort phenomenon reported by Susser and Stein in 1962 has implicated the true cause of peptic ulcers, as they speculated that stress caused by ‘the First World War and the unemployment in 1930s roughly fit the fluctuation curves’.[1,2] However, modern medical doctors rarely attribute the origin of a disease to the invisible, intangible, and incorporeal abstract stress. Instead, they get used to attribute the cause of disease to visible, tangible, and corporeal concrete essence (structural abnormalities) of the human body, such as gene mutations, infectious microbes or other aberrant biological molecules. As a result, Susser and Stein’s finding was not supported by the mainstream of etiological concepts in modern medicine for 60 years. In contrast, despite leading to many controversies,[9,10,11,12,13] H. pylori perfectly matched the etiological concepts of modern medicine and thus, the infection of the bacterium was widely believed to be the cause of peptic ulcers soon after the discovery in 1982.[52,54,55] Consequently, the pathogenesis of peptic ulcers remains elusive for many decades.
Guided by the CCR, Theory of Nodes identified that ‘peptic ulcers are not an infectious disease cause by H. pylori infection, but a psychosomatic disease triggered by stress’.[28] Starting from this etiology, Theory of Nodes pinpointed the valuable historical data and classified all the possible causes of peptic ulcers into 3 categories, making a full understanding of the birth-cohort phenomenon possible. This etiology is also the key to fully elucidating 14 major characteristics and 71 observations/phenomena of peptic ulcers in the first three articles of the series (Supplementary Table S2-S6)[27,28,29]. Apparently, without the CCR, modern medical scientists do not have a benchmark to identify the cause of peptic ulcers, making almost all the 15 major characteristics and 81 observations/phenomena unresolved mysteries for centuries. Similarly, without the CCR, the etiologies of the vast majority of diseases remain unknown in modern medicine. The foregone result is that no disease can be fully understood, and most characteristics and observations/phenomena of any disease ‘remain unknown’ or ‘need more studies’[28]. Therefore, a full understanding of the birth-cohort phenomenon of peptic ulcers implicates that the CCR should be widely applied to explore any life phenomenon and human disease.
The application of a new methodological concept, superposition mechanism, is another key to fully elucidating the birth-cohort phenomenon. Even though Psychosomatic Theory and Stress Theory highlighted the driving roles of personality traits and/or social/natural events in 1950, the birth-cohort phenomenon of peptic ulcers has remained a mystery for 60 years, indicating that the correct etiology alone is far not enough to elucidate this phenomenon. The CCR dictates that the abstract essence is the driving force of any phenomena in the universe, and all the complex life phenomena and human diseases are driven by multiple abstract essences by superposition mechanism. Reasoning backward from this mechanism suggests that the curves in the birth-cohort phenomena of peptic ulcers can be differentiated into multiple ‘annual mortality rates’, which can be further differentiated into the individual mortality rates caused by many single stressors, and an integration of these mortality rates should be able to reflect the epidemiological pattern of peptic ulcers, the birth-cohort phenomenon. Following this train of thought, Theory of Nodes collected all the possible stressors from literatures, counted the annual mortality rates by all the individual stressors, and then superpose them to reproduce the fluctuation curves in the birth-cohort phenomenon. Hence, the superposition mechanism originated from the CCR is indispensable to elucidate the birth-cohort phenomenon. Unfortunately, without the CCR, the concept ‘superposition mechanism’ has never come into being before. As a result, even though Psychosomatic Theory and Stress Theory emphasized the important roles of personality traits and social events in peptic ulcers in 1950,[7] the birth-cohort phenomenon still remained unexplained. Consequently, both theories could not be credited to have discovered the true cause of peptic ulcers in modern medicine.
Notable, superposition mechanism can be widely applied to elucidate the mechanism of any phenomenon in the universe, especially for complex life phenomena and human diseases. In fact, the parallelogram law of forces in physics proposed in Newton’s second law in 1687[56] has exemplified the application of superposition mechanism. Modern medical research can be divided into an 8-level structural hierarchy: society, individual (the human body), system, organ, tissue, cell, organelle, and biomolecule. Interestingly, the superposition mechanism can be applied to all the 8 levels, leading to ground-breaking insights of life phenomena and human diseases. In Theory of Nodes, superposition mechanism was flexibly applied 3 times to 3 different levels and thus, it fully elucidated all the 15 characteristics and 81 observations/phenomena of peptic ulcers within a series of 6 articles. The first application was to the organ level, where 5 etiological theories in history were superposed/integrated into one single theory to illustrate a complete pathological process of peptic ulcerations,[28] thereby giving the birth to Theory of Nodes. The second application was to the molecular level, where the corrosive intensity of each of the local aggressive factors in the stomach was superposed into the total corrosive intensity.[28] As a result, the roles of gastric acid, H. pylori, and NSAIDs in peptic ulcers were fully elucidated, as well as all the clinical observations/phenomena associated with the disease. The third application in this fourth article is the most representative at the societal level, where the individual mortality rates were superposed to reproduce the fluctuation curves. Significantly, superposition mechanism is also the key methodological concept for a full understanding of another epidemiological observation in the fifth article of the series, seasonal variation, which has remained an unresolved mystery for more than 90 years in modern medicine. It is worth mentioning that the pre-applications of the superposition mechanism have painted two complete pictures of the pathogenesis of cancer and AIDS. All these stories suggests that superposition mechanism is universally applicable to elucidating any life phenomenon and human disease.

Conclusion

Starting from the etiology ‘peptic ulcers are a psychosomatic disease triggered by psychological stress’, Theory of Nodes applied superposition mechanism to the birth-cohort phenomenon of peptic ulcers. The start of the First World War account for the increase in the mortality rate of peptic ulcers, a succession of crucial events maintained the high mortality rates, and the end of the Second World War and continuous improvements in living conditions and sociopolitical environment explained the fall in the early 1950s and afterwards. The long-term and chronic hyperplasia and hypertrophy of gastrin and parietal cells in the stomach determine the trends for duodenal ulcer were similar to gastric ulcers, but followed five years behind. A full understanding of the birth-cohort phenomenon of peptic ulcers suggests that the wide application of the CCR with its accompanying superposition mechanism may lead to ground-breaking insights into any life phenomenon and human disease.

Supplementary Materials

The following supporting information can be downloaded at the website of this paper posted on Preprints.org. The supplemental material includes 6 tables as attached.

Data Availability Statement

All the supporting data in this article are published papers or books, or in the online methods or supplementary files.

Conflict of Interest

The author has no conflict of interest to report.

References

  1. Susser M, Stein Z. Civilization and Peptic Ulcer. Lancet. 1962;279(7221):116-119. [CrossRef]
  2. Susser M, Stein Z. Civilization and peptic ulcer*. Int J Epidemiol. 2002;31(1):13-17. [CrossRef]
  3. Westbrook JI, Rushworth RL. The epidemiology of peptic ulcer mortality 1953-1989: A birth cohort analysis. Int J Epidemiol. 1993;22(6):1085-1092. [CrossRef]
  4. Sonnenberg A, Müller H, Pace F. Birth-cohort analysis of peptic ulcer mortality in Europe. J Chronic Dis. 1985;38(4):309-317. [CrossRef]
  5. Thors H, Svanes C, Thjodleifsson B. Trends in peptic ulcer morbidity and mortality in Iceland. J Clin Epidemiol. 2002;55(7):681-686. http://www.ncbi.nlm.nih.gov/pubmed/12160916.
  6. Sonnenberg A. Occurrence of a Cohort Phenomenon in Peptic Ulcer Mortality From Switzerland. Gastroenterology. 1984;86(3):398-401. [CrossRef]
  7. Dong SXM, Chang CCY, Rowe KJ. A collection of the etiological theories, characteristics, and observations/phenomena of peptic ulcers in existing data. Data Br. 2018;19:1058-1067. [CrossRef]
  8. Quan C, Talley NJ. Management of peptic ulcer disease not related to Helicobacter pylori or NSAIDs. Am J Gastroenterol. 2002;97(12):2950-2961. [CrossRef]
  9. Ford AC, Talley NJ. Head to Head: Does Helicobacter pylori really cause duodenal ulcers? Yes. BMJ. 2009;339(aug14 1):b2784. [CrossRef]
  10. Hobsley M, Tovey FI, Bardhan KD, Holton J. Head to Head: Does Helicobacter pylori really cause duodenal ulcers? No. BMJ. 2009;339(aug14 1):b2788. [CrossRef]
  11. Record CO, Rubin PC. Controversies in Management: Helicobacter pylori is not the causative agent. BMJ. 1994;309(6968):1571-1572. [CrossRef]
  12. Kate V, Ananthakrishnan N, Tovey FI. Is Helicobacter pylori Infection the Primary Cause of Duodenal Ulceration or a Secondary Factor? A Review of the Evidence. Gastroenterol Res Pract. 2013;2013:1-8. [CrossRef]
  13. Tovey FI, Hobsley M. Review: is Helicobacter pylori the primary cause of duodenal ulceration? J Gastroenterol Hepatol. 1999;14(11):1053-1056. [CrossRef]
  14. Marshall B. Commentary: Helicobacter as the ‘environmental factor’ in Susser and Stein’s cohort theory of peptic ulcer disease. Int J Epidemiol. 2002;31(1):21-22. [CrossRef]
  15. Sonnenberg A. Causes underlying the birth-cohort phenomenon of peptic ulcer: analysis of mortality data 1911–2000, England and Wales. Int J Epidemiol. 2006;35(4):1090-1097. [CrossRef]
  16. Jones MP. The role of psychosocial factors in peptic ulcer disease: Beyond Helicobacter pylori and NSAIDs. J Psychosom Res. 2006;60(4):407-412. [CrossRef]
  17. Freston JW. Role of proton pump inhibitors in non-H. pylori-related ulcers. Aliment Pharmacol Ther. 2001;15(s2):2-5. [CrossRef]
  18. Kato S, Nishino Y, Ozawa K, et al. The prevalence of Helicobacter pylori in Japanese children with gastritis or peptic ulcer disease. J Gastroenterol. 2004;39(8):734-738. [CrossRef]
  19. Elitsur Y, Lawrence Z. Non-Helicobacter pylori related duodenal ulcer disease in children. Helicobacter. 2001;6(3):239-243. [CrossRef]
  20. Kanotra R, Ahmed M, Patel N, et al. Seasonal Variations and Trends in Hospitalization for Peptic Ulcer Disease in the United States: A 12-Year Analysis of the Nationwide Inpatient Sample. Cureus. 2016;8(10):1-14. [CrossRef]
  21. Sonnenberg A, Wasserman IH, Jacobsen SJ. Monthly variation of hospital admission and mortality of peptic ulcer disease: A reappraisal of ulcer periodicity. Gastroenterology. 1992;103(4):1192-1198. [CrossRef]
  22. Rauws EAJJ, Tytgat GNJJ. Helicobacter pylori in duodenal and gastric ulcer disease. Baillieres Clin Gastroenterol. 1995;9(3):529-547. [CrossRef]
  23. Holcombe C. Helicobacter pylori: the African enigma. Gut. 1992;33(4):429-431. [CrossRef]
  24. Smith GD, Susser E. Zena Stein, Mervyn Susser and epidemiology: observation, causation and action. Int J Epidemiol. 2002;31(1):34-37. [CrossRef]
  25. Susser M. Peptic Ulcer: Rise and Fall. Christie DA, Tansey EM (eds). Wellcome Witnesses to Twentieth Century Medicine. Vol.14, 2002. London: The Wellcome Trust Centre for the History of Medicine, 2002, £10.00 ISBN: 0-85484-084-2. Int J Epidemiol. 2003;32(4):674-675. [CrossRef]
  26. Dong SXM, Chang CCY. Philosophical Principles of Life Science. Taipei: Wunan Culture Enterprise; 2012.
  27. Dong SXM. A Novel Psychopathological Model Explains the Pathogenesis of Gastric Ulcer. J Ment Heal Clin Psychol. 2022;6(3):13-24. [CrossRef]
  28. Dong SXM. The hyperplasia and hypertrophy of gastrin and parietal cells induced by chronic stress explain the pathogenesis of duodenal ulcer. J Ment Heal Clin Psychol. 2022;6(3):1-12. [CrossRef]
  29. Dong SXM. Painting a complete picture of peptic ulcers. Jounral Ment Heal Clin Psychol. 2022;6(3):32-43. [CrossRef]
  30. Damon A, Polednak AP. Constitution, genetics, and body form in peptic ulcer: A review. J Chronic Dis. 1967;20(10):787-802. [CrossRef]
  31. Magon P. Abdominal epilepsy misdiagnosed as peptic ulcer pain. Indian J Pediatr. 2010;77(8):916-916. [CrossRef]
  32. Kitchin DR, Lubner MG, Menias CO, Santillan CS, Pickhardt PJ. MDCT diagnosis of gastroduodenal ulcers: key imaging features with endoscopic correlation. Abdom Imaging. 2015;40(2):360-384. [CrossRef]
  33. Salleh MR. Life event, stress and illness. Malays J Med Sci. 2008;15(4):9-18. http://www.ncbi.nlm.nih.gov/pubmed/22589633.
  34. Feldman M, Walker P, Green JL, Weingarden K. Life events stress and psychosocial factors in men with peptic ulcer disease: a multidimensional case-controlled study. Gastroenterology. 1986;91(6):1370-1379. [CrossRef]
  35. Compas BE. Stress and life events during childhood and adolescence. Clin Psychol Rev. 1987;7(3):275-302. [CrossRef]
  36. Mcintosh JH, Nasiry RW, Frydman M, Waller SL, Piper DW. The Personality Pattern of Patients with Chronic Peptic Ulcer. Scand J Gastroenterol. 1983;18(7):945-950. [CrossRef]
  37. Schuster J-P, Limosin F, Levenstein S, Le Strat Y. Association Between Peptic Ulcer and Personality Disorders in a Nationally Representative US Sample. Psychosom Med. 2010;72(9):941-946. [CrossRef]
  38. Ellard K, Beaurepaire J, Jones M, Piper D, Tennant C. Acute and chronic stress in duodenal ulcer disease. Gastroenterology. 1990;99(6):1628-1632. [CrossRef]
  39. Kennedy DP, Adolphs R. Stress and the city. Nature. 2011;474(7352):452-453. [CrossRef]
  40. Kurata JH, Haile BM. Epidemiology of peptic ulcer disease. Clin Gastroenterol. 1984;13(2):289-307. http://www.ncbi.nlm.nih.gov/pubmed/6378441.
  41. Riley ID. Perforated peptic ulcer in war-time. Lancet. 1942;243:485. [CrossRef]
  42. Dragstedt LR, Ragins H, Dragstedt LR, Evans SO. Stress and Duodenal Ulcer. Ann Surg. 1956;144(3):450-463. [CrossRef]
  43. Sonnenberg A, Müller H, Pace F. Birth-cohort analysis of peptic ulcer mortality in Europe. J Chronic Dis. 1985;38(4):309-317. [CrossRef]
  44. Hikichi T, Sato M, Watanabe K, et al. Peptic Ulcers in Fukushima Prefecture Related to the Great East Japan Earthquake, Tsunami and Nuclear Accident. Intern Med. 2018;57(7):915-921. [CrossRef]
  45. Aoyama N, Kinoshita Y, Fujimoto S, et al. Peptic Ulcers After the Hanshin-Awaji Earthquake: Increased Incidence of Bleeding Gastric Ulcers. Am J Gastroenterol. 1998;93(3):311-316. [CrossRef]
  46. Glavin GB, Murison R, Overmier JB, et al. The neurobiology of stress ulcers. Brain Res Rev. 1991;16(3):301-343. [CrossRef]
  47. Ganguli PC, Pearse AGE, Polak J, Elder JB, Hegarty M. Antral-Gastrin-Cell hyperplasia in peptic ulcer disease. Lancet. 1974;303(7858):583-586. [CrossRef]
  48. McGuigan JE, Harty RF, Maico DG. The role of gastrin in duodenal ulcer. Trans Am Clin Climatol Assoc. 1981;92:199-207. http://www.ncbi.nlm.nih.gov/pubmed/6116307.
  49. Starcke K, Wiesen C, Trotzke P, Brand M. Effects of Acute Laboratory Stress on Executive Functions. Front Psychol. 2016;7(MAR):1-8. [CrossRef]
  50. Brouwer A-M, Hogervorst MA. A new paradigm to induce mental stress: the Sing-a-Song Stress Test (SSST). Front Neurosci. 2014;8(8 JUL):1-8. [CrossRef]
  51. Linda R, Ransohoff DF. Is helicobacter pylori a cause of duodenal ulcer? A methodologic critique of current evidence. Am J Med. 1991;91(6):566-572. [CrossRef]
  52. Walsh JH, Peterson WL. The Treatment of Helicobacter pylori Infection in the Management of Peptic Ulcer Disease. Wood AJJ, ed. N Engl J Med. 1995;333(15):984-991. [CrossRef]
  53. Arkkila P. Eradication of Helicobacter pylori improves the healing rate and reduces the relapse rate of nonbleeding ulcers in patients with bleeding peptic ulcer. Am J Gastroenterol. 2003;98(10):2149-2156. [CrossRef]
  54. Marshall BJ, Goodwin CS, Warren JR, et al. Prospective double-blind trial of duodenal ulcer relapse after eradication of Campylobacter pylori. Lancet (London, England). 1988;2(8626-8627):1437-1442. [CrossRef]
  55. Sivri B. Review Article: Trends in peptic ulcer pharmacotherapy. Fundam Clin Pharmacol. 2004;18(1):23-31. [CrossRef]
  56. Newton I, Shapiro AE. The Principia: Mathematical Principles of Natural Philosophy. Phys Today. 2000. [CrossRef]
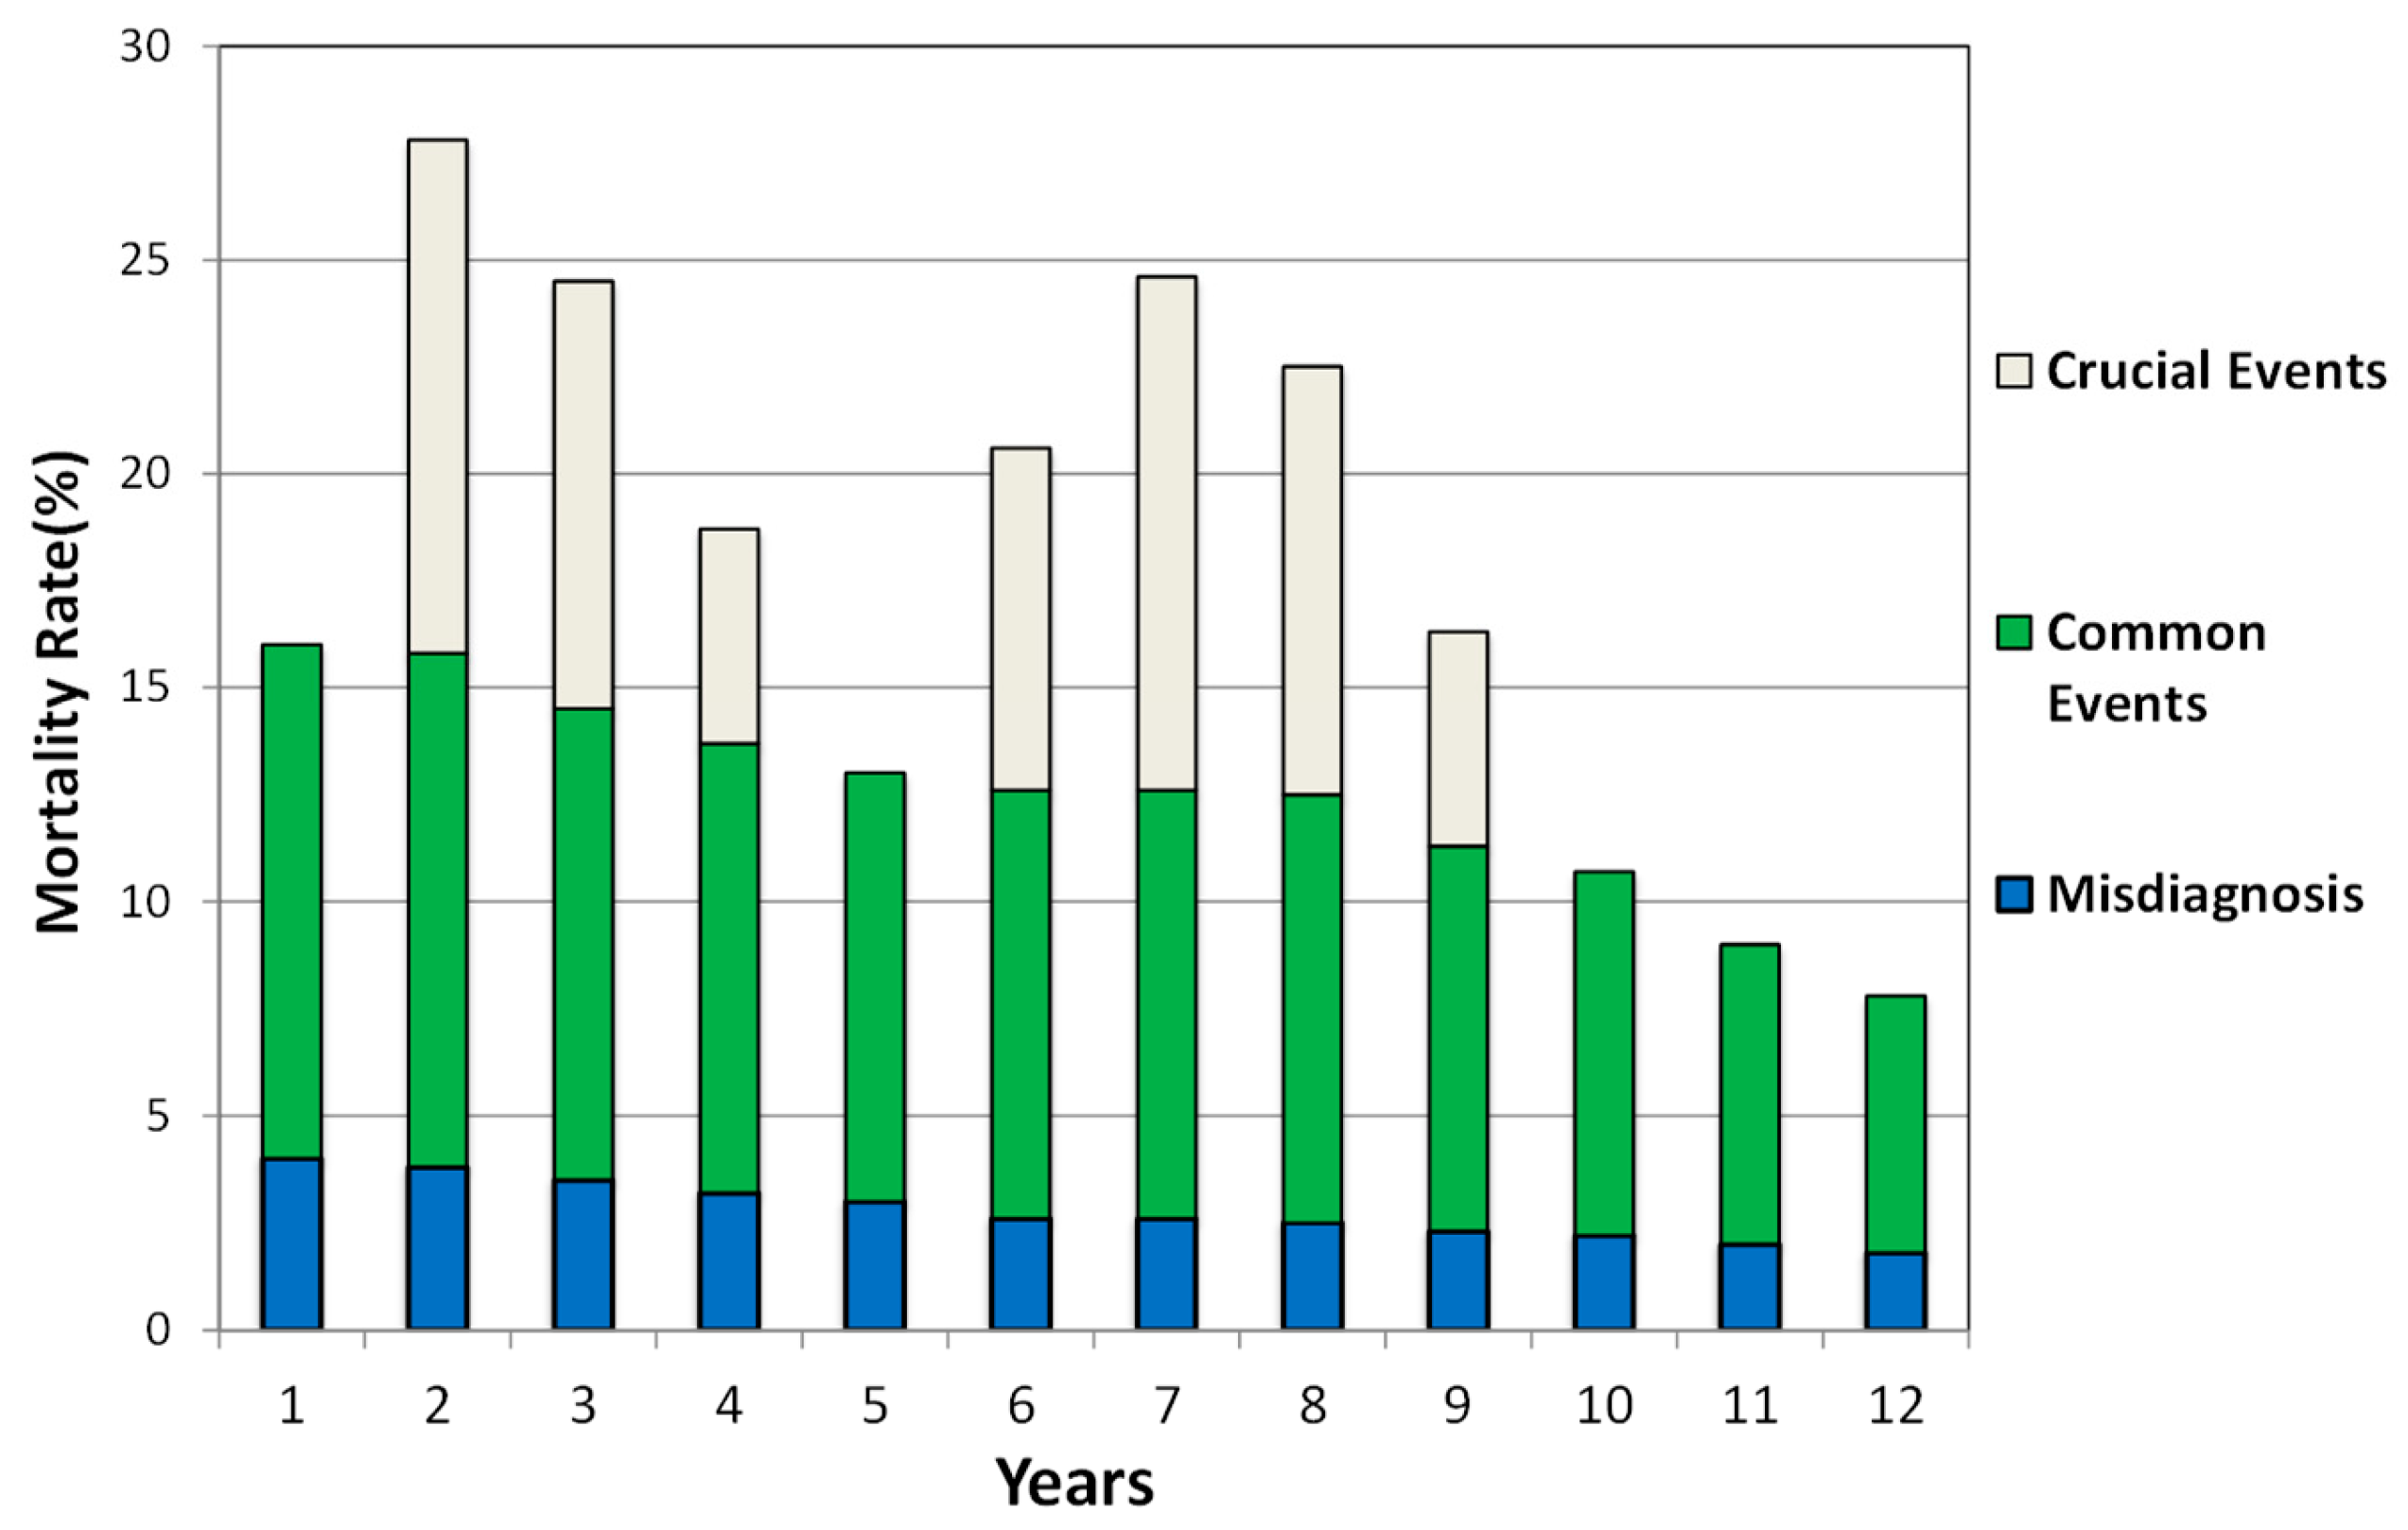
Figure 1. Vertical superposition of the mortality rate of gastric ulcers. This figure represents an ideal/hypothetical scenario with three categories of stressors. The annual mortality rate is the sum of the mortality rates caused by misdiagnosis (blue), common events (green) and crucial events (light yellow) in a given year. In the first year, misdiagnosis and common events cause the annual mortality rate. In the second year, stress induced by a sudden outbreak of a war markedly increases the annual mortality rate. The war ends in the third year, leading to a sharp decrease in the mortality rate in the fourth year. In the absence of the effects of the war in the fifth year, the annual mortality rate is caused solely by misdiagnosis and common events. When an economic crisis occurs in the sixth year, the annual mortality rate increases markedly again and peaks in the seventh year. When the economy is restored gradually in the eighth and ninth years, the annual mortality rates decrease accordingly. Due to the peaceful environment and potential medical advancement in the tenth year and afterwards, the annual mortality rates caused by misdiagnosis and common events decline gradually.
Preprints 68342 g001
Figure 2. Horizontal superposition of the mortality rates of gastric ulcers. This figure illustrates the same scenario as that in Figure 1 but in the format of a line graph. Line 1 is the temporal trend of the mortality rates solely caused by misdiagnosis; Line 2 is the temporal trend of the sum of mortality rates caused by misdiagnosis and common events; Line 3 is the temporal trend of the overall sum of mortality rates (annual mortality rates) caused by misdiagnosis, common events and crucial events. The peaks in Line 3 occur after the beginning of a crucial event and the decline indicates that the negative impacts of the crucial event are diminishing. In the absence of the negative effects of crucial events, Line 2 and Line 3 coincide after the tenth year. Because Lines 1 & 2 fluctuate only slightly, the fluctuation of Line 3 is primarily due to the rise and fall of mortality rates caused by crucial events.
Preprints 68342 g002
Figure 3. Overlapping of the fluctuation curves caused by a succession of crucial events. England and Wales experienced at least 4 crucial events successively between the 1910s and the 1940s. Line 1 and Line 2 are the temporal trends as described in Figure 1. Curve D2-P1-C1-B3 is the fluctuation curve caused solely by the First World War; curve B1-C1-P2-C2-B5 is caused solely by rebuilding after the war; curve B3-C2-P3-D8-B8 is caused solely by the economic crisis and curve B5-C3-P4-D10-D11 is caused solely by the Second World War and rebuilding after the war. P1, P2, P3 and P4 are the peaks of these curves. Overlapping areas of the crucial events are B1-C1-B3-B2, B3-C2-B5-B4 and B5-C3-B7-B8-B6.
Preprints 68342 g003
Figure 4. Fluctuation curve of mortality rates caused by a succession of crucial events. Line 1 and Line 2 are identical to those in Figure 3. The solid line from D1 to D15 (D1D2D3……D13D14D15) is a theoretical fluctuation curve on a five-year basis from 1905 to 1975. However, Susser and Stein’s birth-cohort study was on a 10-year basis from 1905 to 1975, of which the fluctuation curves could be produced by joining the points D1-D3-D5-D7-D9-D11-D13-D15 as illustrated by the dashed Line 3. D3 has the same value as P1 in Figure 3. Similarly, D5=P2, D7=P3, D9=P4 and points D1, D11, D13, D14 and D15 are identical to Figure 3.
Preprints 68342 g004
Figure 5. Reproduction of the fluctuation curve for the mortality rates from 1905 to 1975.
Preprints 68342 g005
Disclaimer/Publisher’s Note: The statements, opinions and data contained in all publications are solely those of the individual author(s) and contributor(s) and not of MDPI and/or the editor(s). MDPI and/or the editor(s) disclaim responsibility for any injury to people or property resulting from any ideas, methods, instructions or products referred to in the content.
Copyright: This open access article is published under a Creative Commons CC BY 4.0 license, which permit the free download, distribution, and reuse, provided that the author and preprint are cited in any reuse.
Prerpints.org logo

Preprints.org is a free preprint server supported by MDPI in Basel, Switzerland.

Subscribe

© 2024 MDPI (Basel, Switzerland) unless otherwise stated