
Submitted:
30 January 2023
Posted:
30 January 2023
You are already at the latest version
Abstract
The overcrowding of high-rise buildings in the city adversely affects the wind environment by changing the air currents in the surrounding areas. In particular, extreme climate phenomena caused by climate change are stronger and more frequent, causing social damages in cities. To comprehensively better understand the wind properties around high-rise buildings, actual filed measurement is necessary to determine the environment assessment of wind effect. We performed the on-site measurement on LCT residential complex regions (411.6m tall) with highly concentrated high-rise buildings in coastal city Busan, South Korea under extreme weather conditions such as typhoon invasions to determine wind fluid characteristics. In the field monitoring, five anemometers were installed to analyze the wind environment around high-rise buildings when typhoon 'Hinnamnor' invaded. Compared to the nearby weather station operated by KMA(Korea Meteorological Administration), the gust was 3.7 times stronger and the max 1 min-mean wind speed was 3.1 times stronger, and the characteristics of the downward wind and the canyon wind were shown depending on the location characteristics of the point. Turbulence intensity decreased as the wind speed increased and converged to a certain value. Likewise, the gust factor also decreased as the wind speed increased and converged to 2.0, which is considered to be the parameter that best represents the intensity of the instantaneous gust caused by the skyscraper wind effect.
Keywords:
Field measurement
; Typhoon
; High-rise building
; Strong wind
1. Introduction
In recent years, many cities worldwide, in particular, those with high-rise buildings have been increased and affected by strong winds. Though indicative of economic wealth, high-rise buildings in cities also exert adverse impacts on the safety, living environment quality, and socio-economic well-being of urban populations [1,2,3,4]. For example, wind strikes high-rise buildings, creating strong winds and eddies around buildings, called skyscraper wind. The skyscraper wind effect grows stronger with extreme weather events, such as typhoons, which have intensified under global climate change. Skyscraper wind generates gusts that threaten safety of pedestrians and buildings due to flying debris. Therefore, skyscraper wind has been considered a new issue in cities. Although social and environmental awareness of skyscraper wind is still lacking in South Korea despite a recent overcrowding of high-rise buildings, many countries, such as the United States, United Kingdom, Canada, the Netherlands, and Japan, have issued standards for its multi-dimensional impact assessments [5,6,7,8,9]. Many studies have been carried out to analyze and predict the characteristics of skyscraper wind as well as to determine its effects on society. For example, Razak et al. performed large-eddy simulations (LES) of airflows around various types of block arrays to estimate the pedestrian wind environment [10]. Kwon et al. performed computational fluid dynamic (CFD) simulations by employing user defined functions (UDFs) to reconstruct the real wind environment under extreme weather events [11]. By using CFD simulations, Kheyari and Dalui quantified interference effects depending on the various shapes and sizes of a building and its surrounding interference and orientation [12]. Similarly, Mou et al. simulated the wind pressure distributions around squared-shaped tall buildings [13]. Based on CFD simulations, Zheng et al. modeled the influences of surrounding buildings with different heights, densities, and arrangements on the target building [14]. In the literature, few studies have analyzed skyscraper wind effects in response to the different shapes and arrangements of buildings via LES and CFD simulations. Uncertainties associated with unstable turbulences and low accuracy of boundary conditions, in particular, under extreme weather conditions such as typhoons, may significantly reduce the accuracy and precision of LES and CFD simulations to reconstruct the actual wind environment. Thus, continuous field measurements to represent actual weather and geographic information are needed to quantify and predict the influence of skyscraper wind generated by high-rise building. In this study, we carried out field measurements with five anemometers at LCT residential complex in the coastal urban area in Busan, South Korea and analyzed monitoring of the gust factors and turbulence intensity dependent on wind speed, which represents the intensity of the instantaneous gust caused by the skyscraper wind effect.
2. Materials and Methods
2.1. Research period
Figure 1 shows the path of Hinnamnor, the 11th typhoon in 2022. It developed into a typhoon in the southern sea of Japan on August 28th, and when it landed on Jeju Island on the evening of September 5, the central pressure was 940 hpa, the lowest central pressure measured by Korean Meteorological Administration (KMA). The center of the typhoon passed right through the study area. When approaching the research site, the central pressure maintained 950 hpa and the maximum instantaneous wind speed was approximately 40 m/s. It then escaped to the East Sea and disappeared at 21:00, September 6. Therefore, in this study, we analyzed the data for 48 hours from 00:00 on September 5, 2022 to 00:00 on September 7, 2022, when the research site was affected by the typhoon.
2.2. Research site
The research site was selected as the vicinity of LCT residential complex, located in Haeundae-gu, Busan, a coastal city in South Korea (Figure 2). To observe the skyscraper wind, it was necessary to measure the wind speed and direction affected by the concentrated high-rise buildings. The LCT residential complex consists of three buildings: Landmark Tower, A Tower, and B tower. In the area around the LCT are buildings with a significantly lower height, where local strong winds or scattered winds blow. Since LCT is located in a coastal area vulnerable to storm and flood damage, its skyscraper winds frequently damage the surrounding areas. LCT Landmark Tower is currently the second tallest building in Korea with a height of 411.6 m (Figure 2). Since the construction of the LCT residential complex, adverse effects such as damaged buildings, flying debris, and noise have continuously occurred in its neighboring areas.
2.3. Main observation points
Before installing anemometers to investigate the skyscraper wind enhanced by the typhoon, we investigated the vicinity of the LCT residential complex in order to design the sampling strategy to best measure and infer the wind characteristics. We concluded that roadsides to be necessary points to observe the effect of the skyscraper wind because, as the wind passes between the buildings and the road corners, wind direction and speed change from one road to another. In addition, we selected the main and secondary entrances for pedestrians using the residential and commercial complex as observation points. The locations of the main observation points are shown in Figure 3.
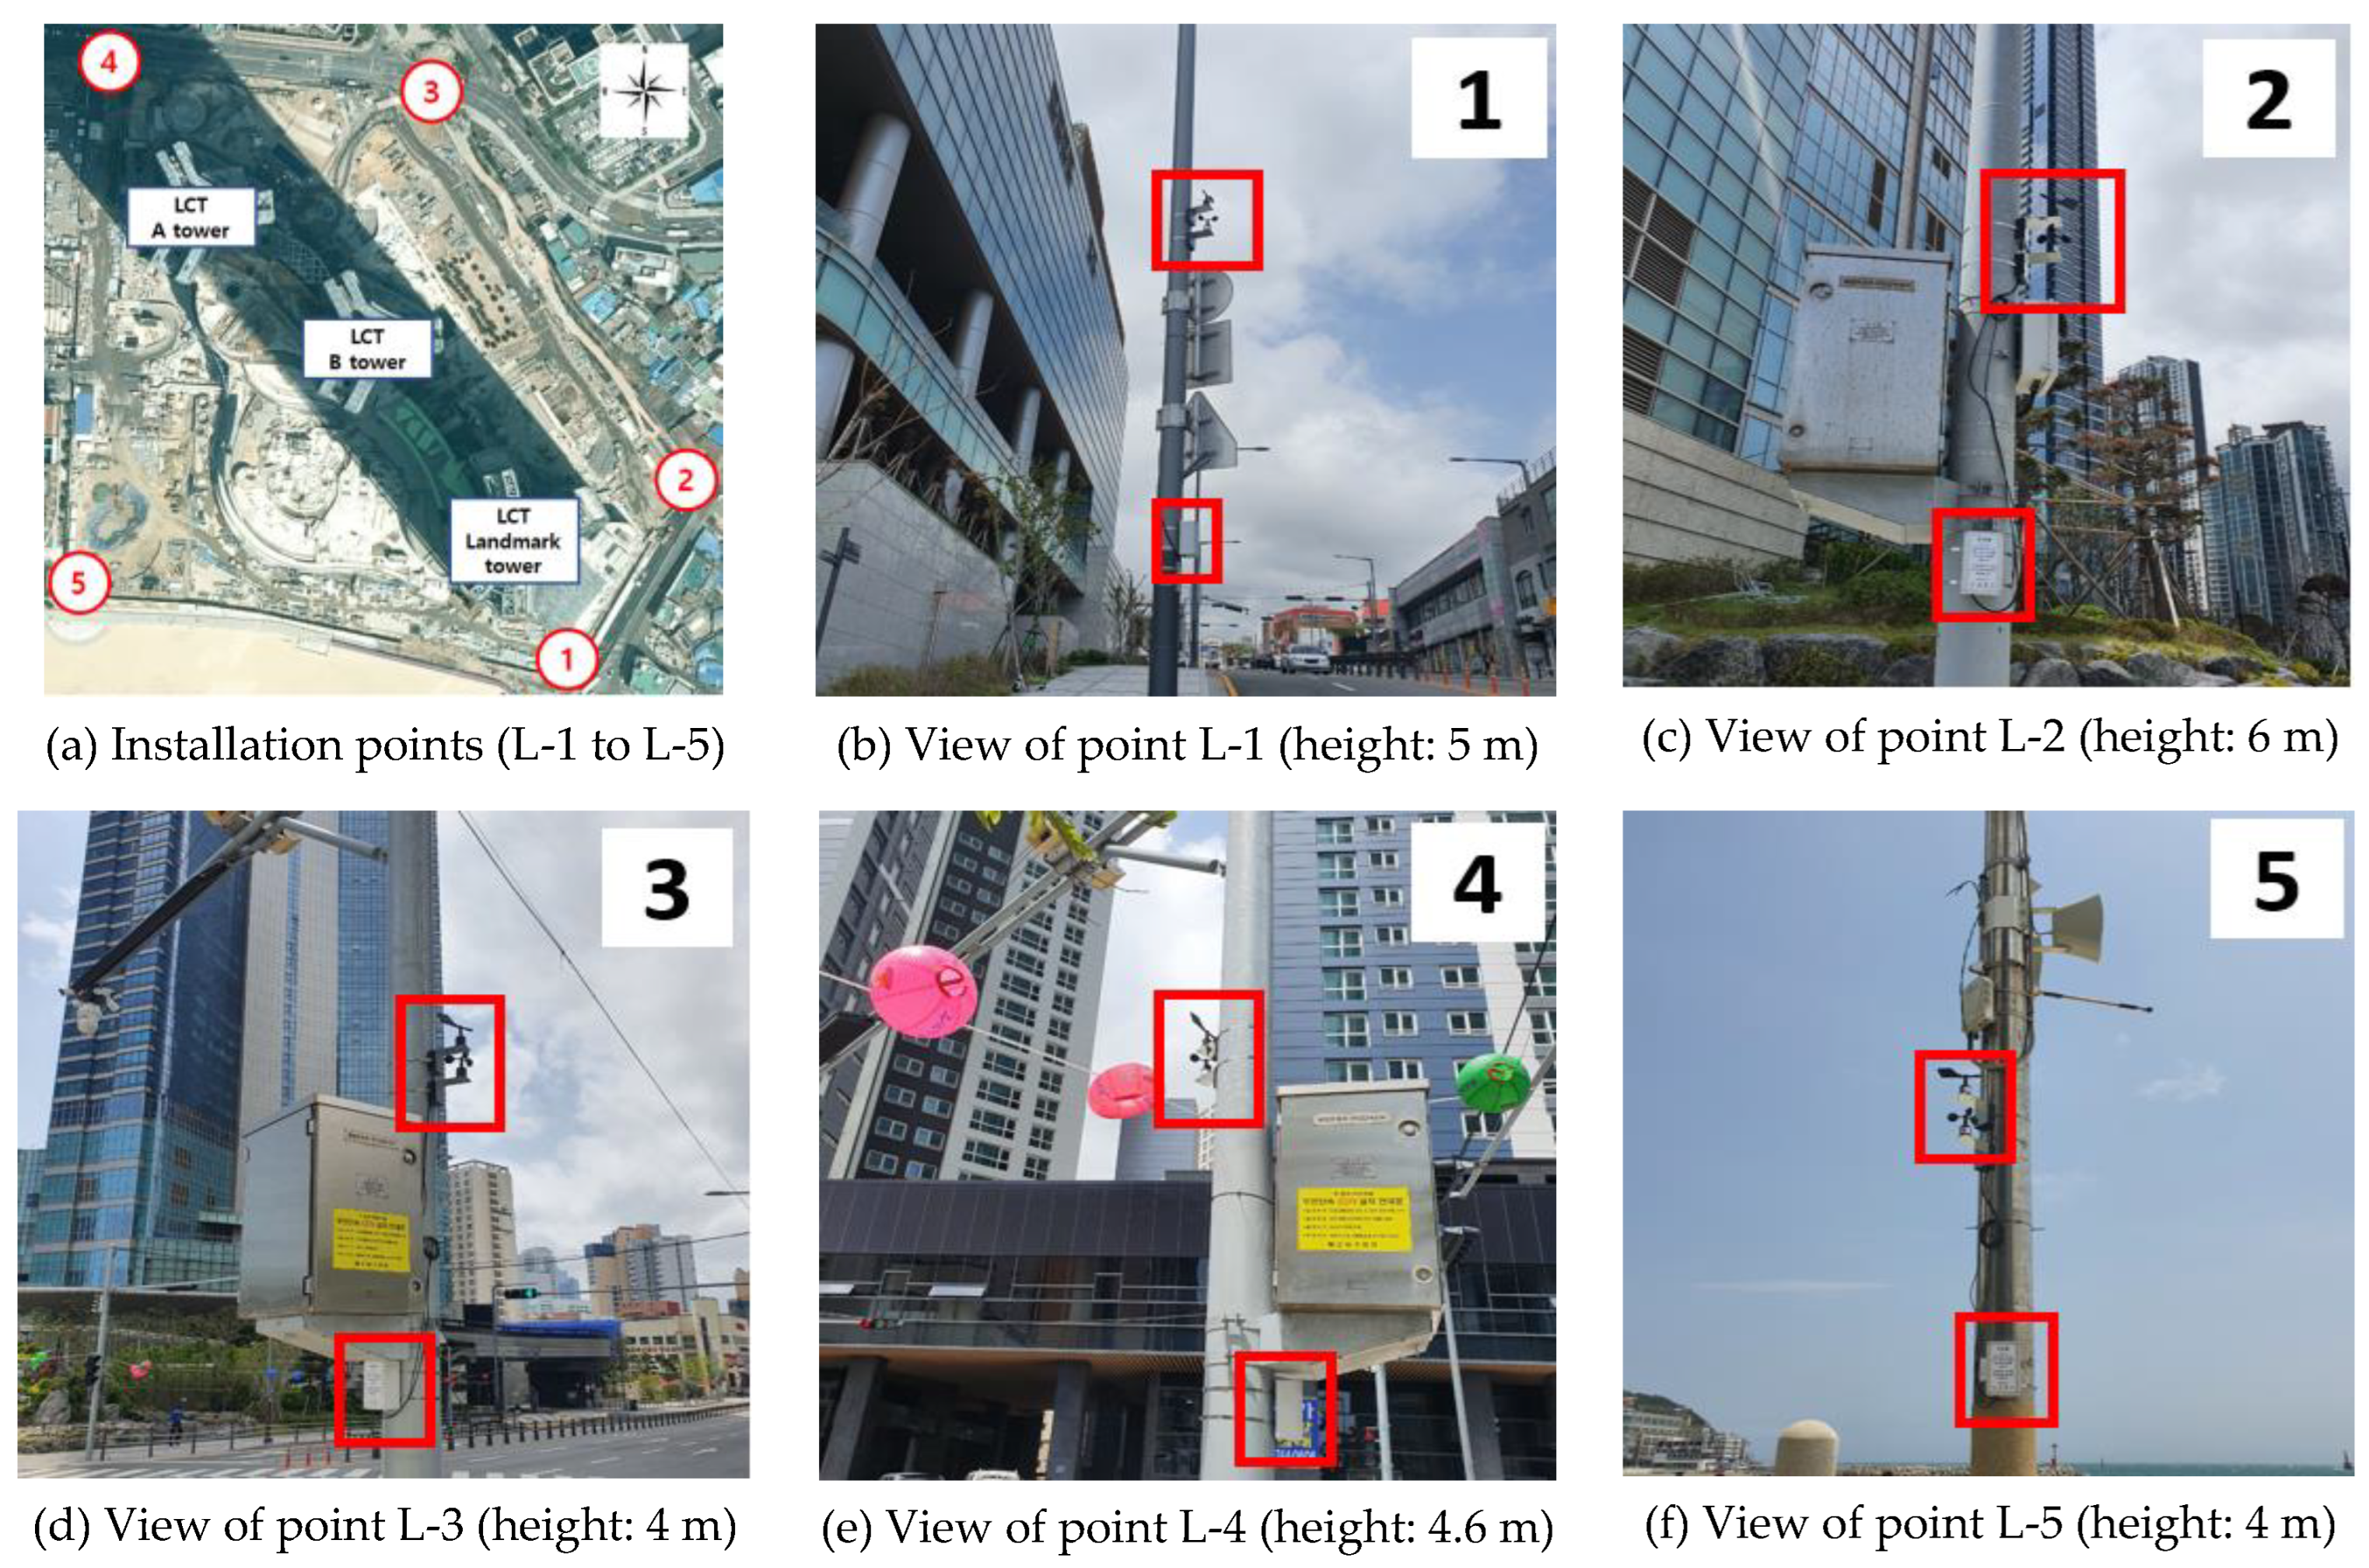
Out of the 20 field measurement points, we selected five points to install the anemometers. The points were selected as the points where strong winds flow from the open sea (L-1, L-5), the points where the strong wind speed was measured (L-1, L-2 and L-3) and intersection occurred (L-2, L-3, L-4) (Figure 4).
2.4. Monitering anemometers
Five anemometers were installed at a height of 4.0 to 8.0 m in consideration of the field conditions (Figure 4). In general, measuring equipment should be more than 1m away from the mast to minimize disturbance, but local governments suggested installing supporters as short as possible to prevent damages caused by strong winds. We utilized the anemometers (ARCO-SERIAL model) (Figure 5) according to ‘Standard Specification for Automatic Meteorological Observation Equipment’ of KMA [15]. Their related specifications are shown in Table 1. L-1, L-2, and L-4, located on the side of the LCT residential complex, are expected to be affected by downward winds and separated winds. L-3 is expected to be affected by canyon winds when southerly winds blew and separated winds from the Landmark Tower and B Tower when southeast winds blew. L-5 was expected to receive the uninterrupted sea breeze and the canyon winds blowing from the northeast.
Figure 4.
Field measurement points around the LCT residential complex. (a) Locations of the installation points. (b)–(f) Views of points L-1 to L-5, respectively.
Figure 4.
Field measurement points around the LCT residential complex. (a) Locations of the installation points. (b)–(f) Views of points L-1 to L-5, respectively.
The anemometer recorded four data reading per second [15]. The last 240 data readings collected for one minute were averaged to calculate the 1-min mean wind directions and wind speeds.
Figure 5.
Anemometer configuration.
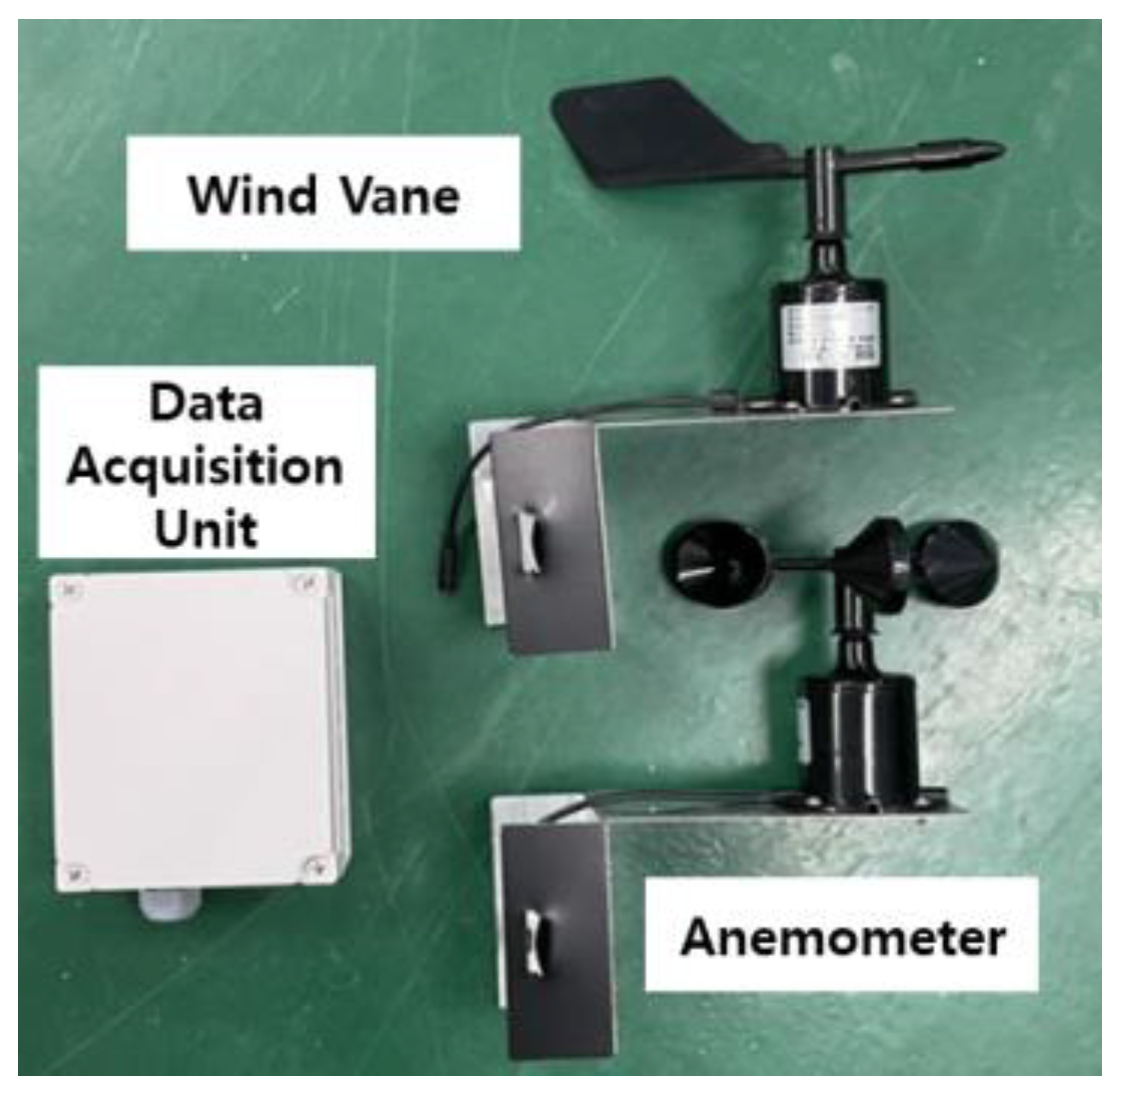

Table 1.
Specifications of anemometers.
| Wind Speed | Range | 0~ 70 m/s |
| Accuracy | ± 2% | |
| Resolution | 0.1 m/s | |
| Wind direction | Range | 0 ~ 360˚ |
| Accuracy | ± 1˚ | |
| Resolution | 1˚ |
2.5. Haeundae meteorological observatory
The Haeundae Meteorological Observatory Auto Weathering System (AWS) in Haeundae, operated by KMA, is located 1.8 km northwest of the research site (Figure 6). This nearest reference station (AWS) was selected as a control point to compare and analyze the effects of the skyscraper wind. The LCT residential complex is directly exposed to the sea breeze, whereas AWS is located relatively inland, suggesting that the wind speed is expected to be relatively low.
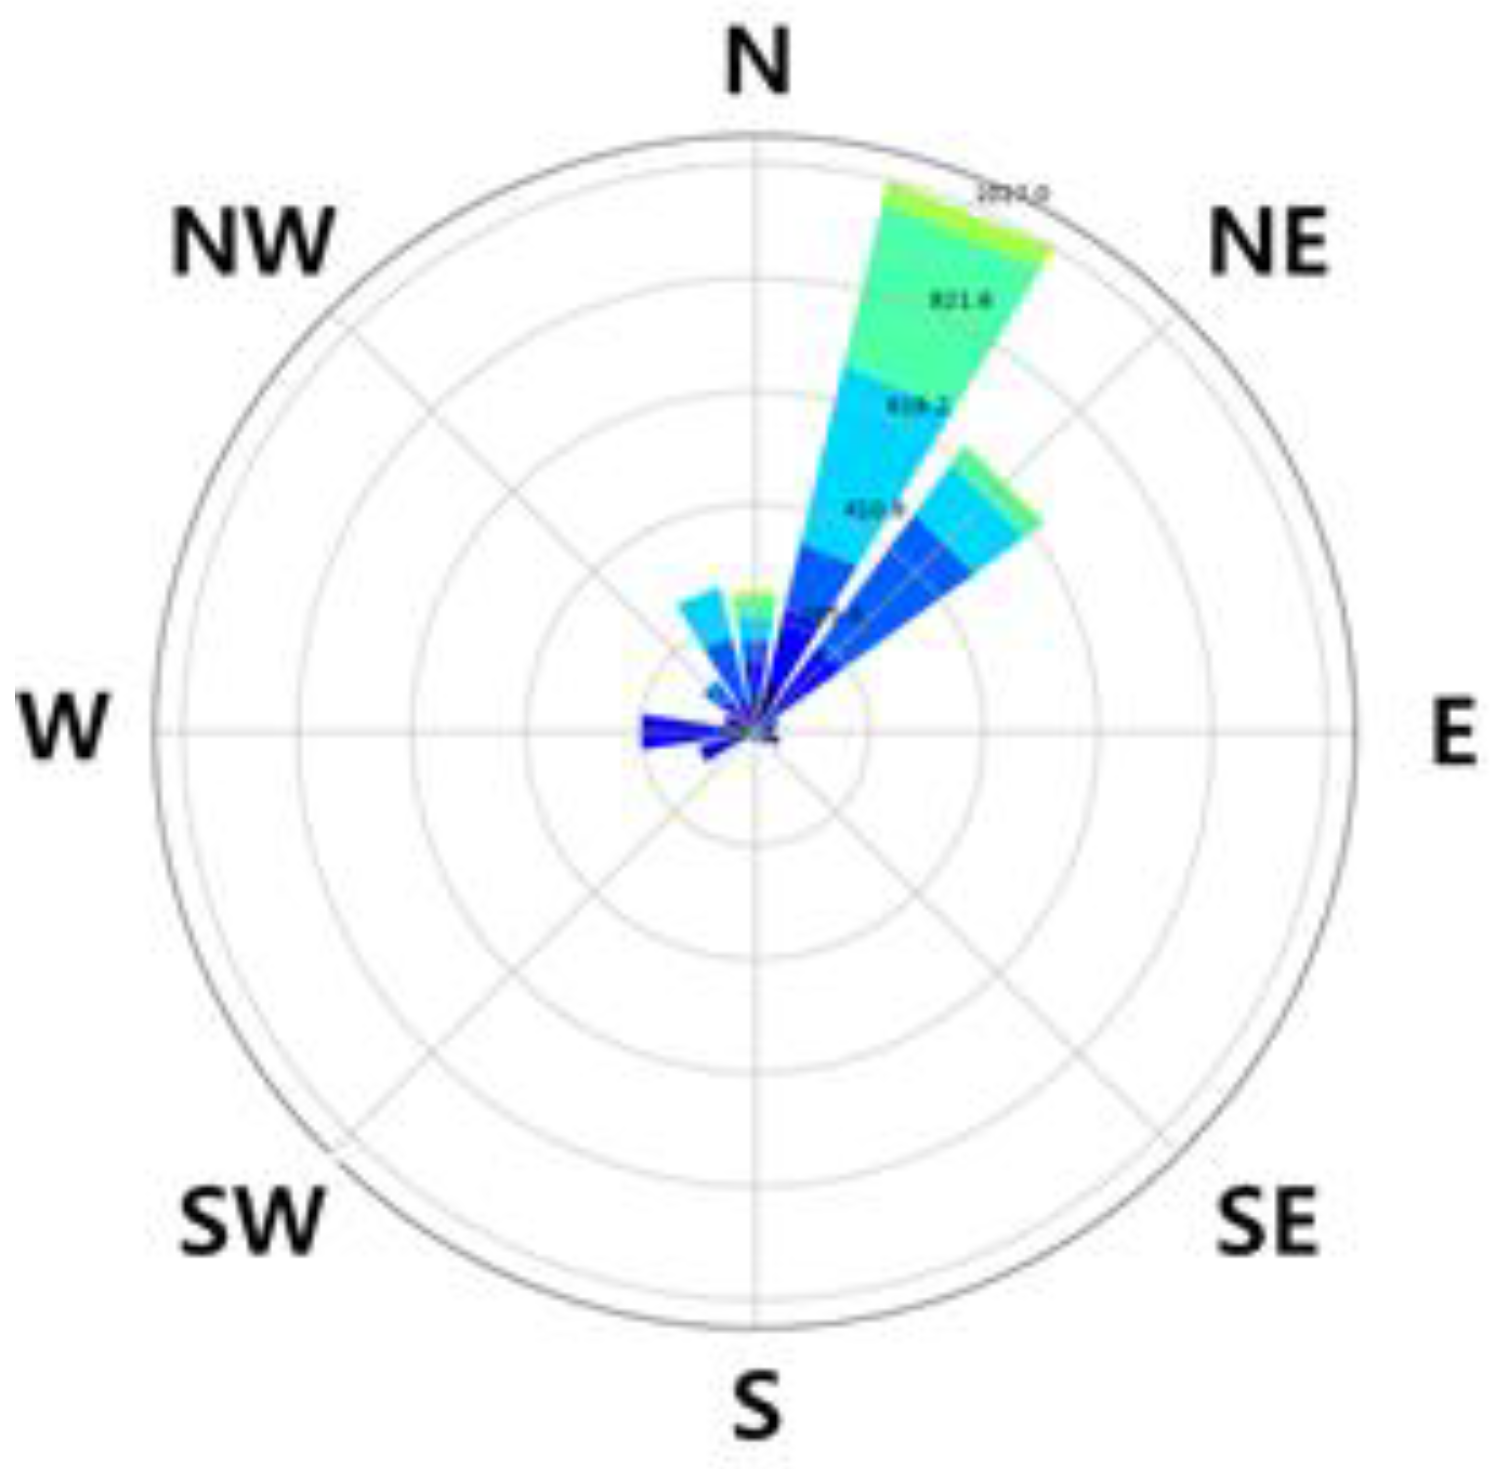
AWS provides 1 min-mean data of wind speed and wind direction with the shortest period of time series data and daily maximum gust as statistical data . Using the data for the research period, we presented the windrose diagram with 1-min mean data in Figure 7. The main wind directions were north-northeast (38%) and northeast (24%), while the max 1 min-mean wind speed was 12.3 m/s (NNE), lower than the maximum wind speed of the typhoon.
Figure 6.
Locations of the study site & AWS.
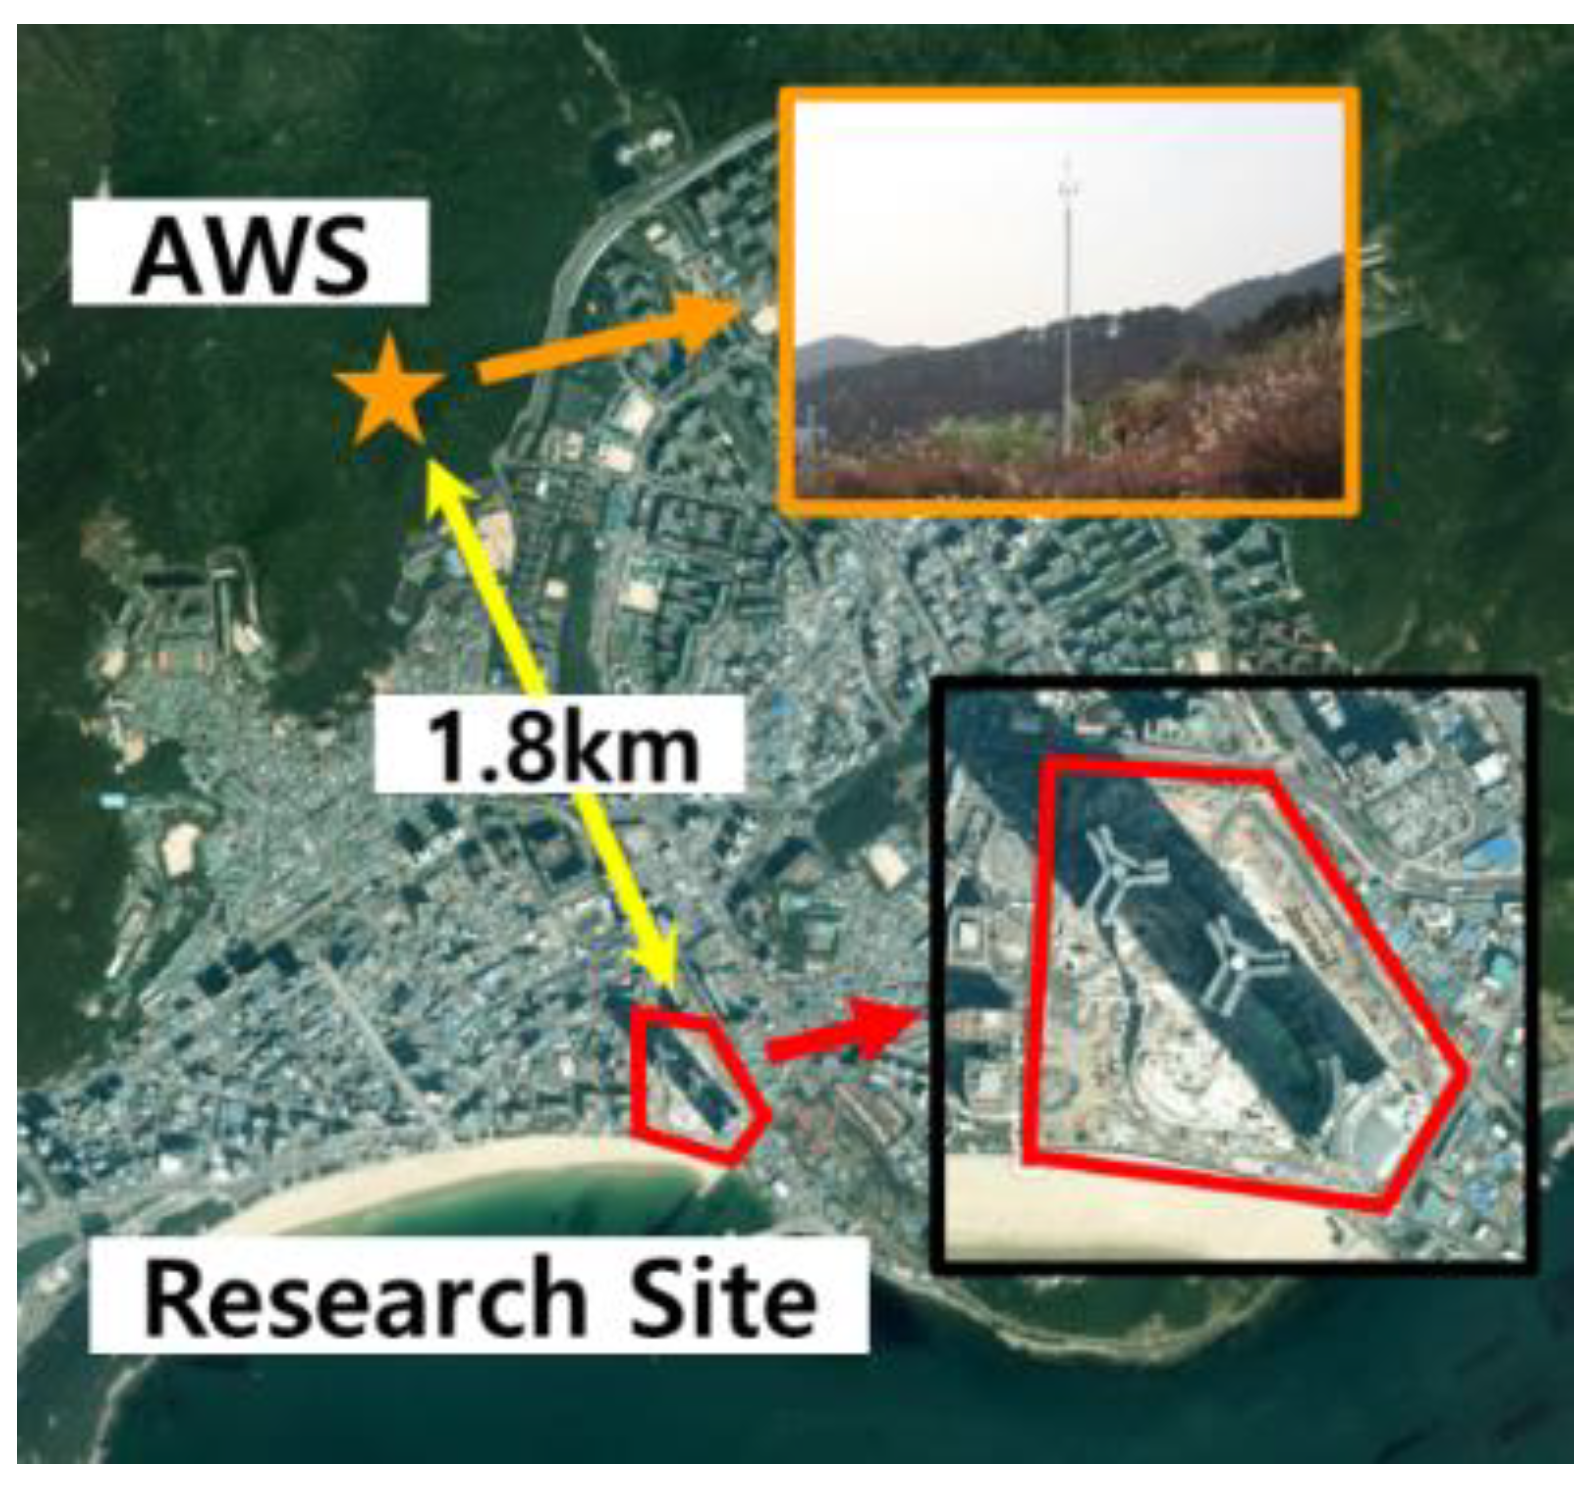
Figure 7.
Windrose at AWS.
3. Results
Based on a comparison of wind speed from AWS and those from the anemometers, we estimated the rate of increase in wind speed for the area adjacent to LCT residential complex, and quantified the fluctuation of the skyscraper wind by introducing the Beaufort wind scale, turbulence intensity and gust factor.
3.1. Mean and maximum wind speeds and directions
Figure 8 shows a time series comparison of the 1-minute average wind speed () at AWS ( ), the reference station, and at the five points(
 ) (L-1 to L-5). In addition, the wind speed and wind direction when the wind speed was the highest at each point were shown in more detail. The statistical distribution of wind at each point was visualized using the windrose diagram in Figure 9. Data were averaged after missing data, outliers, and data exceeding the measurable wind speed range (>70 m/s) were removed. As the center of the typhoon passes through the research site, the data shows the characteristics of a steep descent after reaching the peak wind speed. Table 2 shows the wind speed and wind direction for the max peak gusts, the max 1 min-mean wind speeds, and the max 10 min-mean wind speeds (the most frequently used) at each point. The relatively strong winds were observed at L-1, L-2 and L-3.
), the reference station, and at the five points() (L-1 to L-5). In addition, the wind speed and wind direction when the wind speed was the highest at each point were shown in more detail. The statistical distribution of wind at each point was visualized using the windrose diagram in Figure 9. Data were averaged after missing data, outliers, and data exceeding the measurable wind speed range (>70 m/s) were removed. As the center of the typhoon passes through the research site, the data shows the characteristics of a steep descent after reaching the peak wind speed. Table 2 shows the wind speed and wind direction for the max peak gusts, the max 1 min-mean wind speeds, and the max 10 min-mean wind speeds (the most frequently used) at each point. The relatively strong winds were observed at L-1, L-2 and L-3.
Table 2.
Mean wind speeds and peak gusts at each point (L-1 to L-5 and AWS).
| Point |
Max Peak Gust (m/s) |
Wind direction | Max1 min-mean wind speed (m/s) | Wind direction | Max10 min-mean wind speed (m/s) | Wind direction | |||
| L-1 | 44.19 | 10.1° | N | 26.52 | 10.0° | N | 22.57 | 33.3° | NNE |
| L-2 | 40.80 | 226.3° | SW | 28.48 | 228.3° | SW | 25.05 | 233.1° | SW |
| L-3 | 55.53 | 147.8° | SSE | 38.39 | 147.2° | SSE | 29.49 | 152.3° | SSE |
| L-4 | 45.68 | 238.8° | WSW | 18.31 | 235.3° | SW | 13.75 | 238.9° | WSW |
| L-5 | 21.03 | 56.0° | NE | 11.35 | 74.7° | ENE | 9.1 | 212.8° | SSW |
| AWS | 15.20 | 81.6° | E | 12.30 | 7.7° | N | 10.11 | 10.5° | N |
Figure 8.
Comparison of 1 min-mean wind speeds over time (LCT residential complex vs AWS) for (a)–(e) L-1 to L-5 () vs AWS ().
) vs AWS ().
Figure 8.
Comparison of 1 min-mean wind speeds over time (LCT residential complex vs AWS) for (a)–(e) L-1 to L-5 () vs AWS ().
) vs AWS ().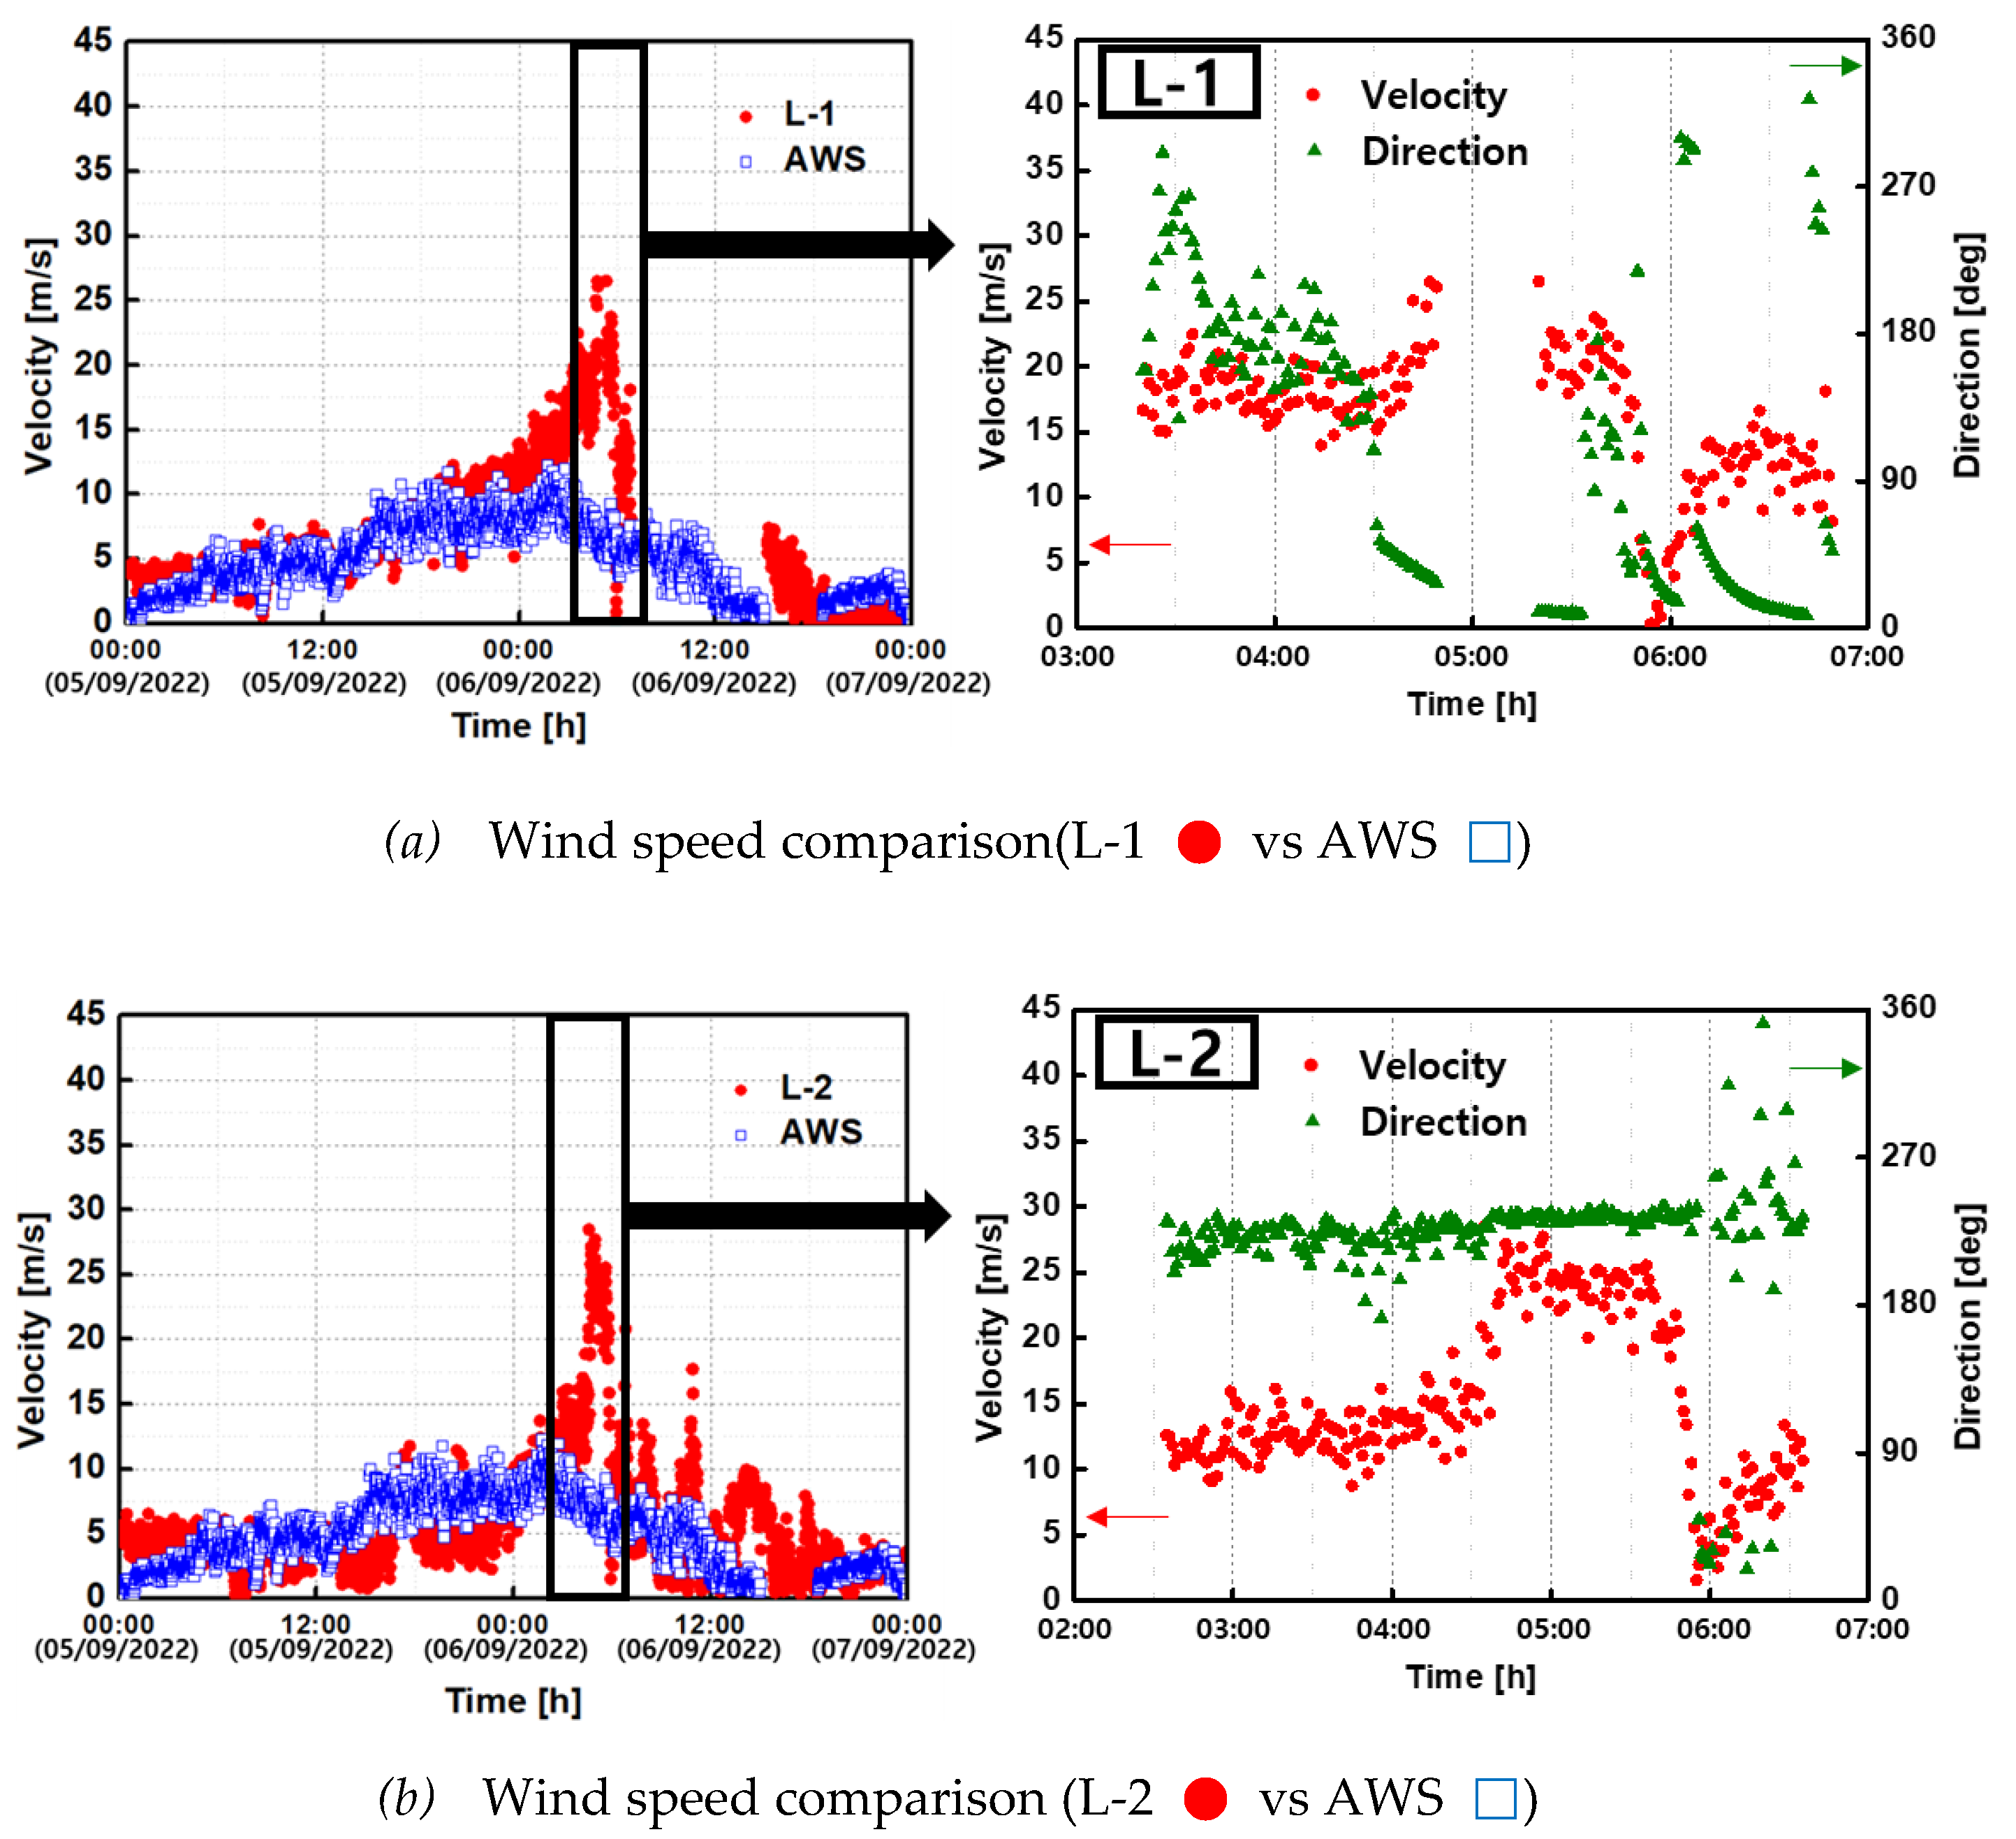
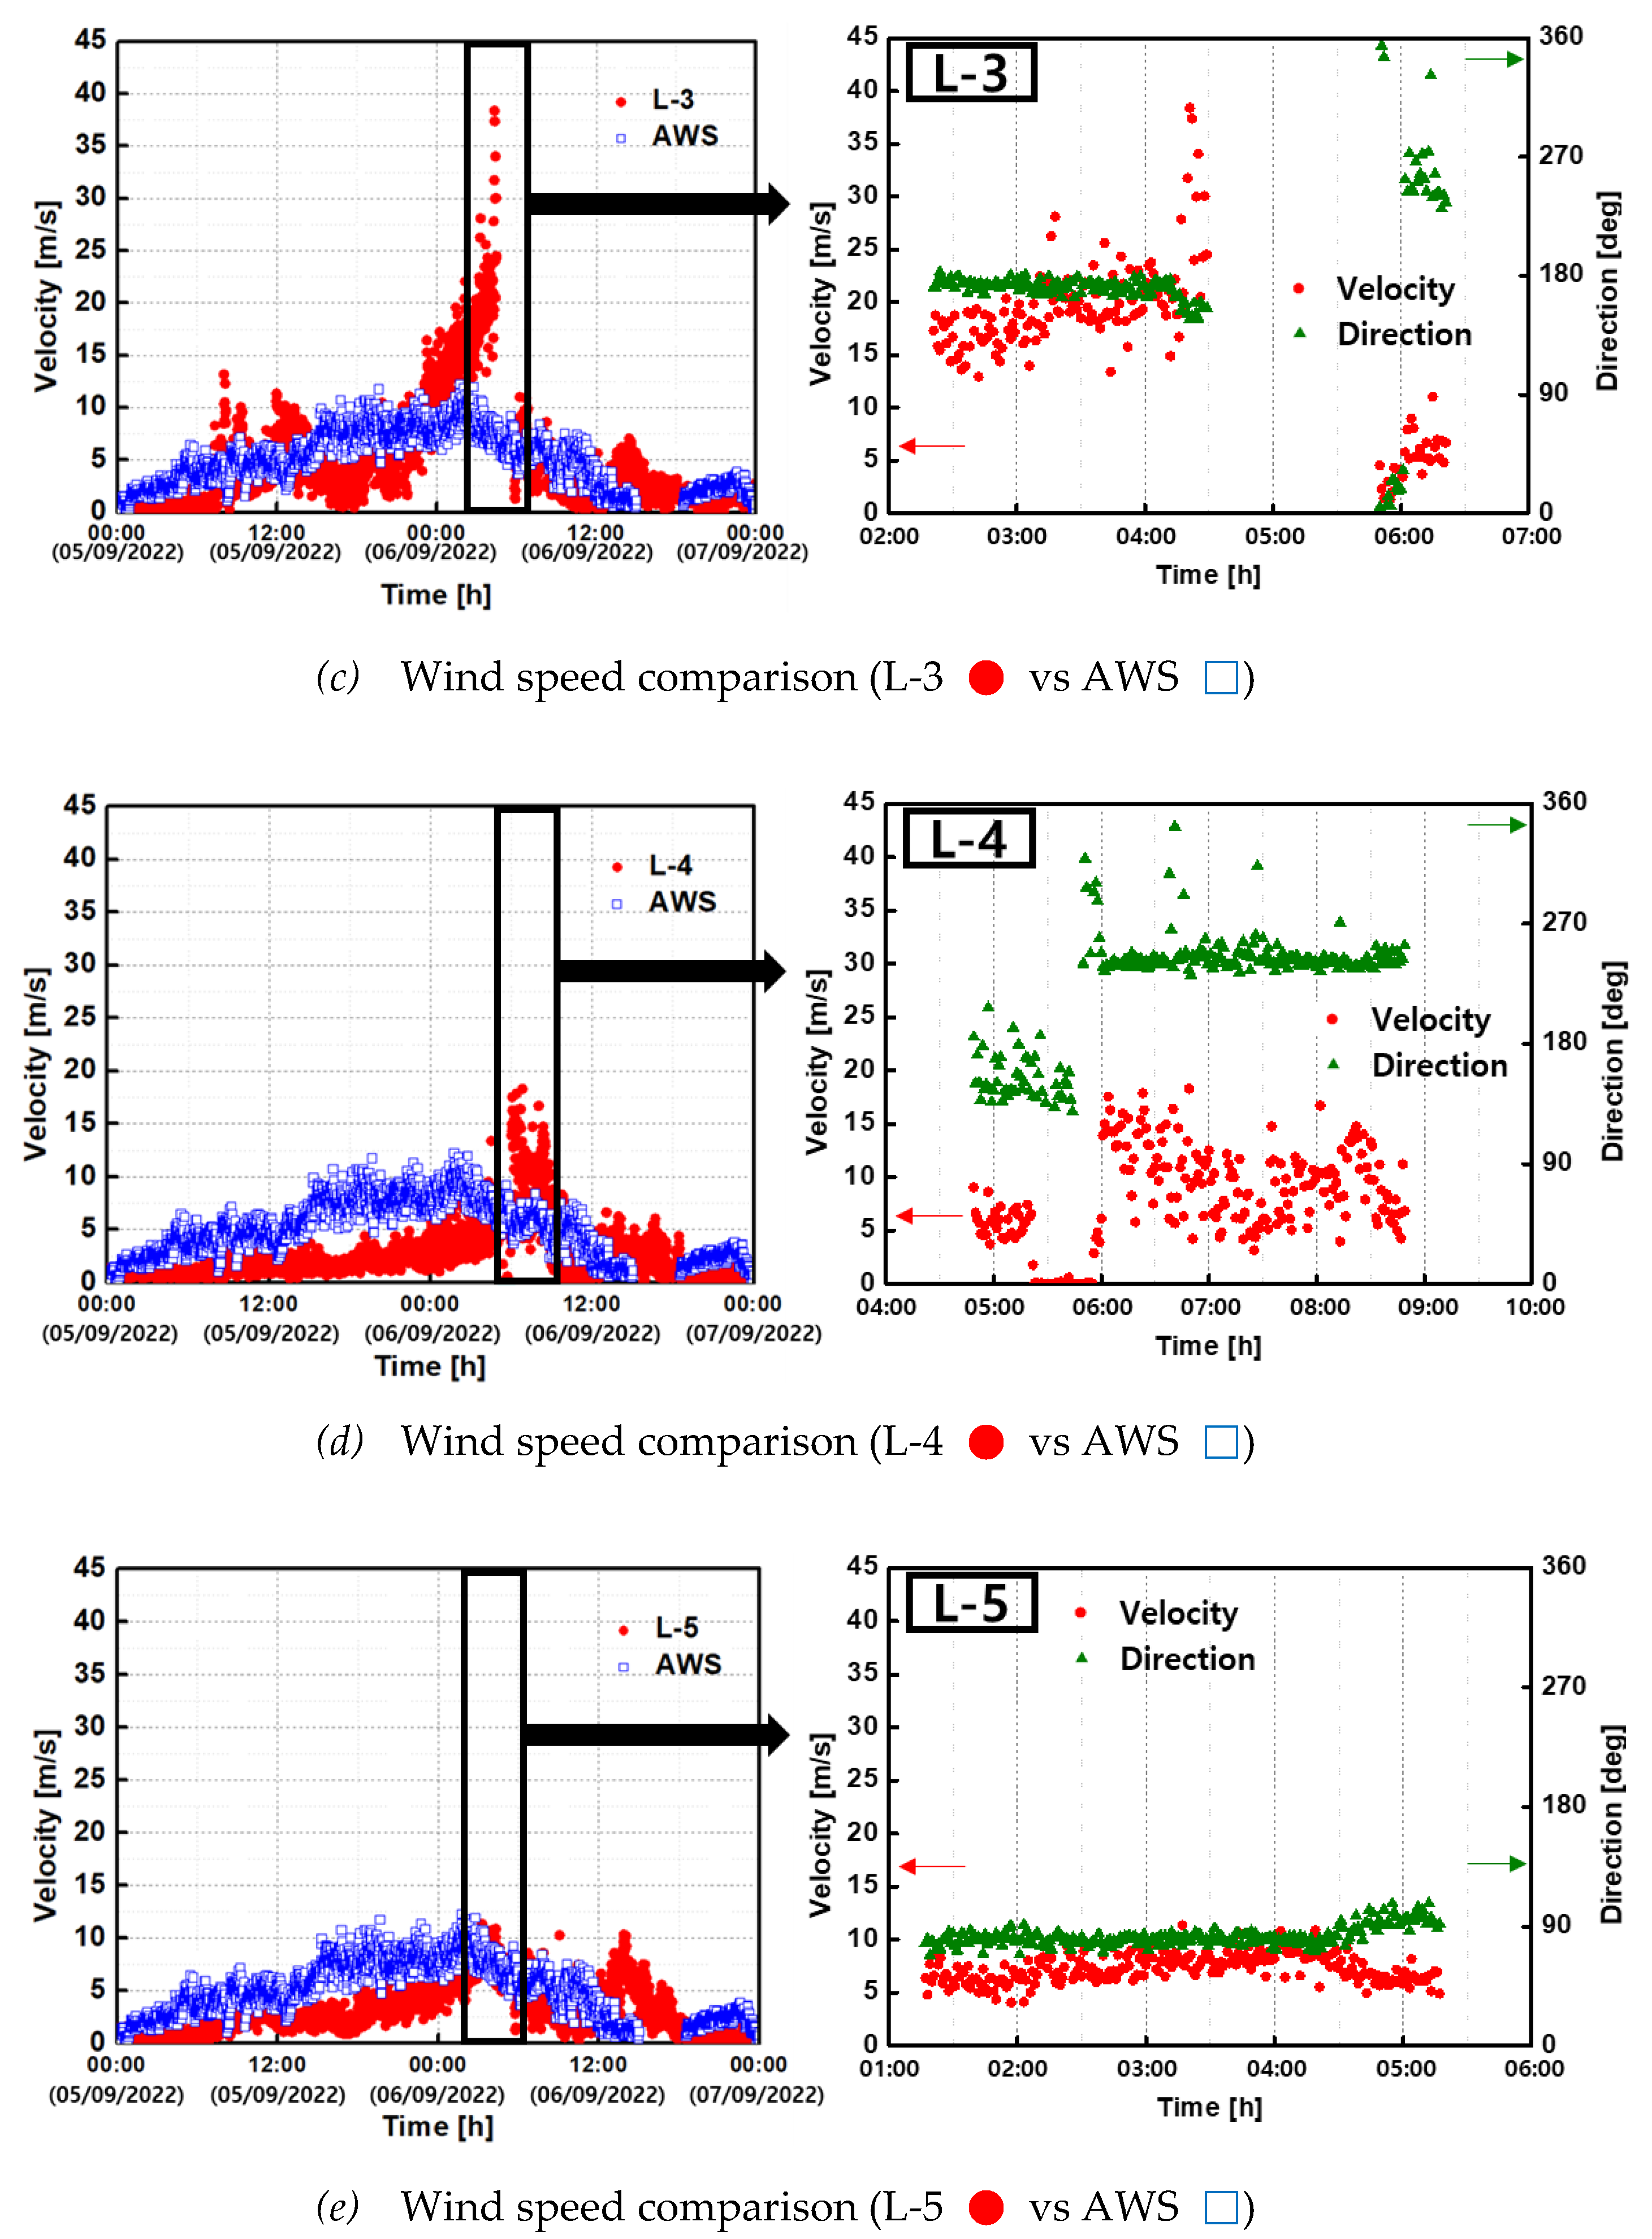
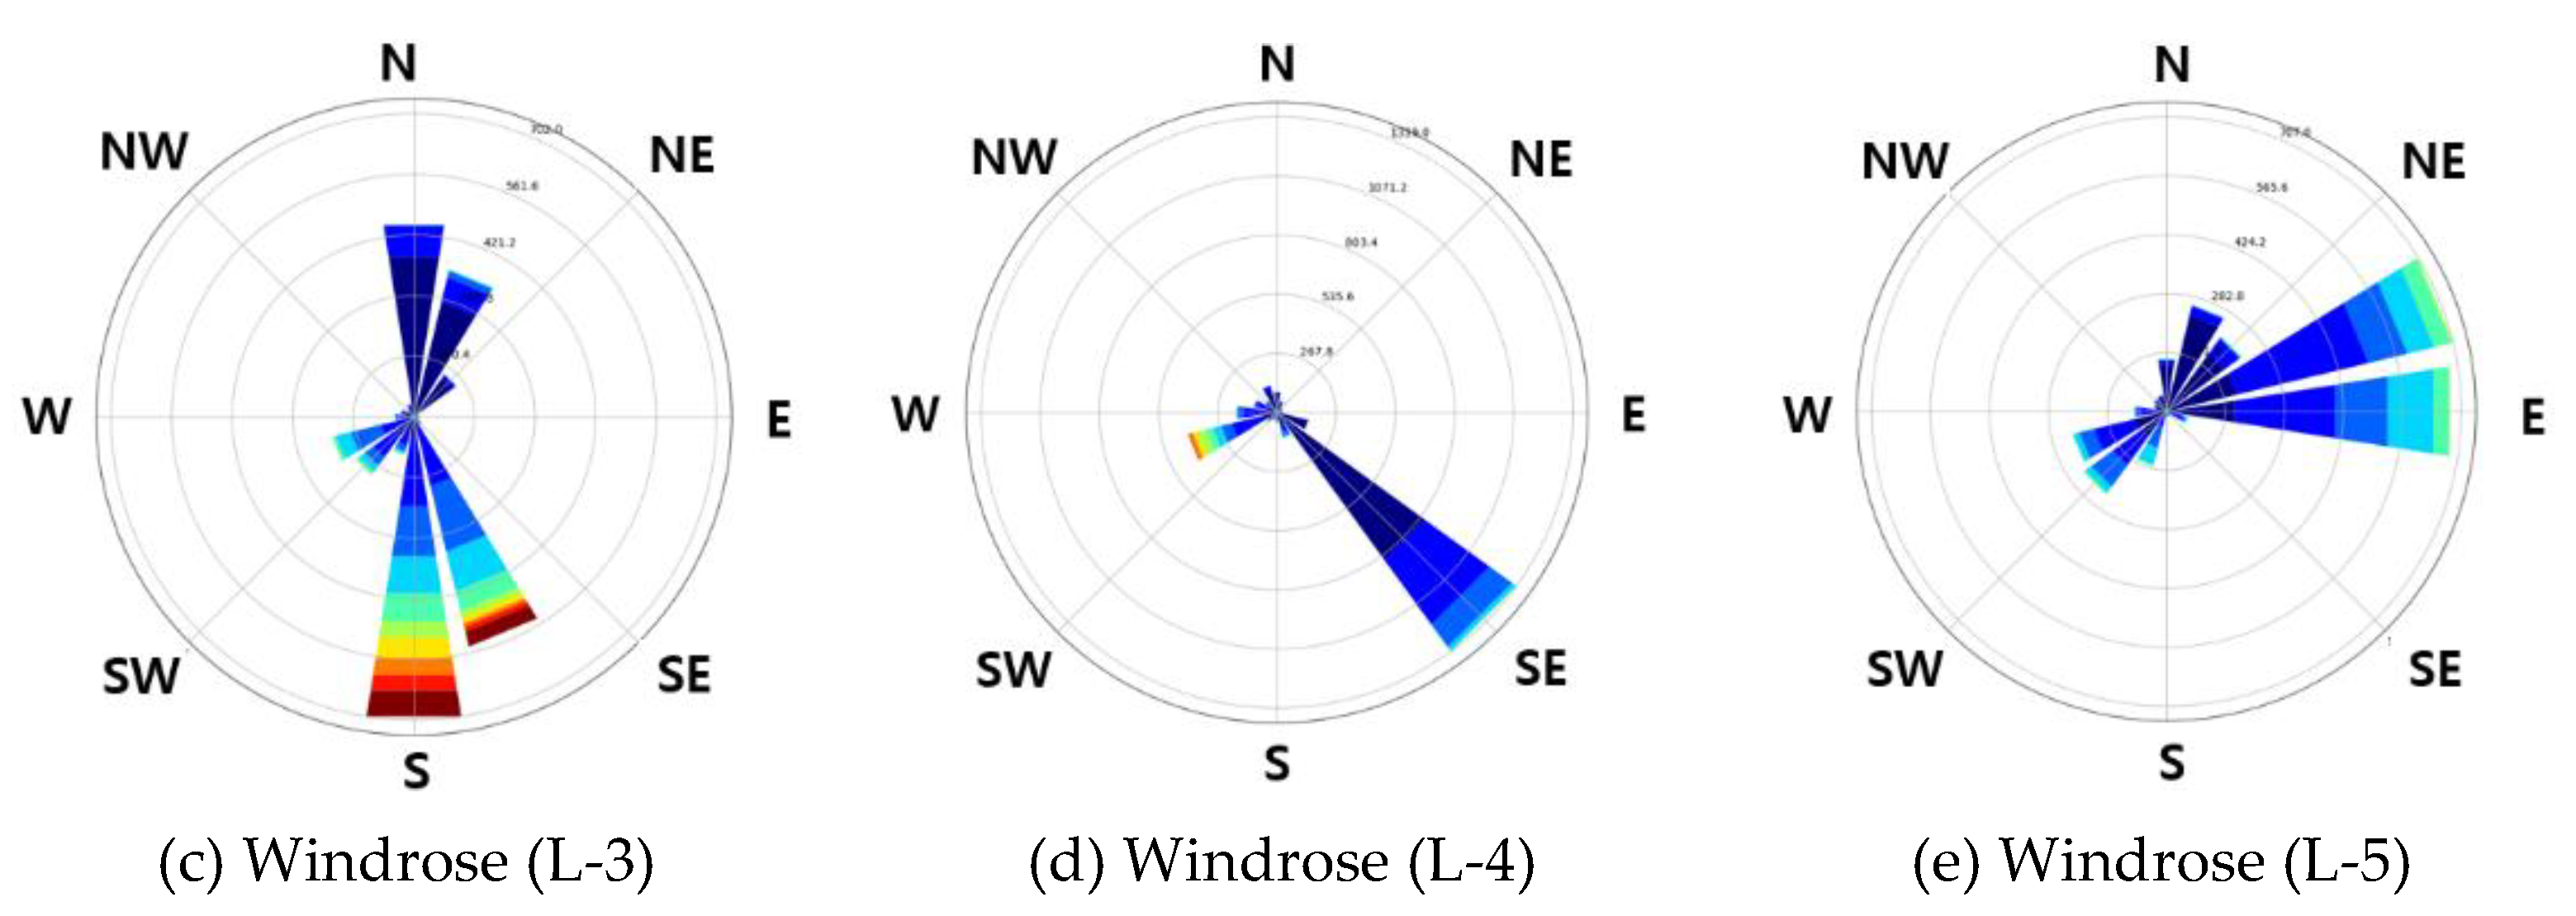
Figure 9.
Windrose at each point (a)–(e) L-1 to L-5, respectively.
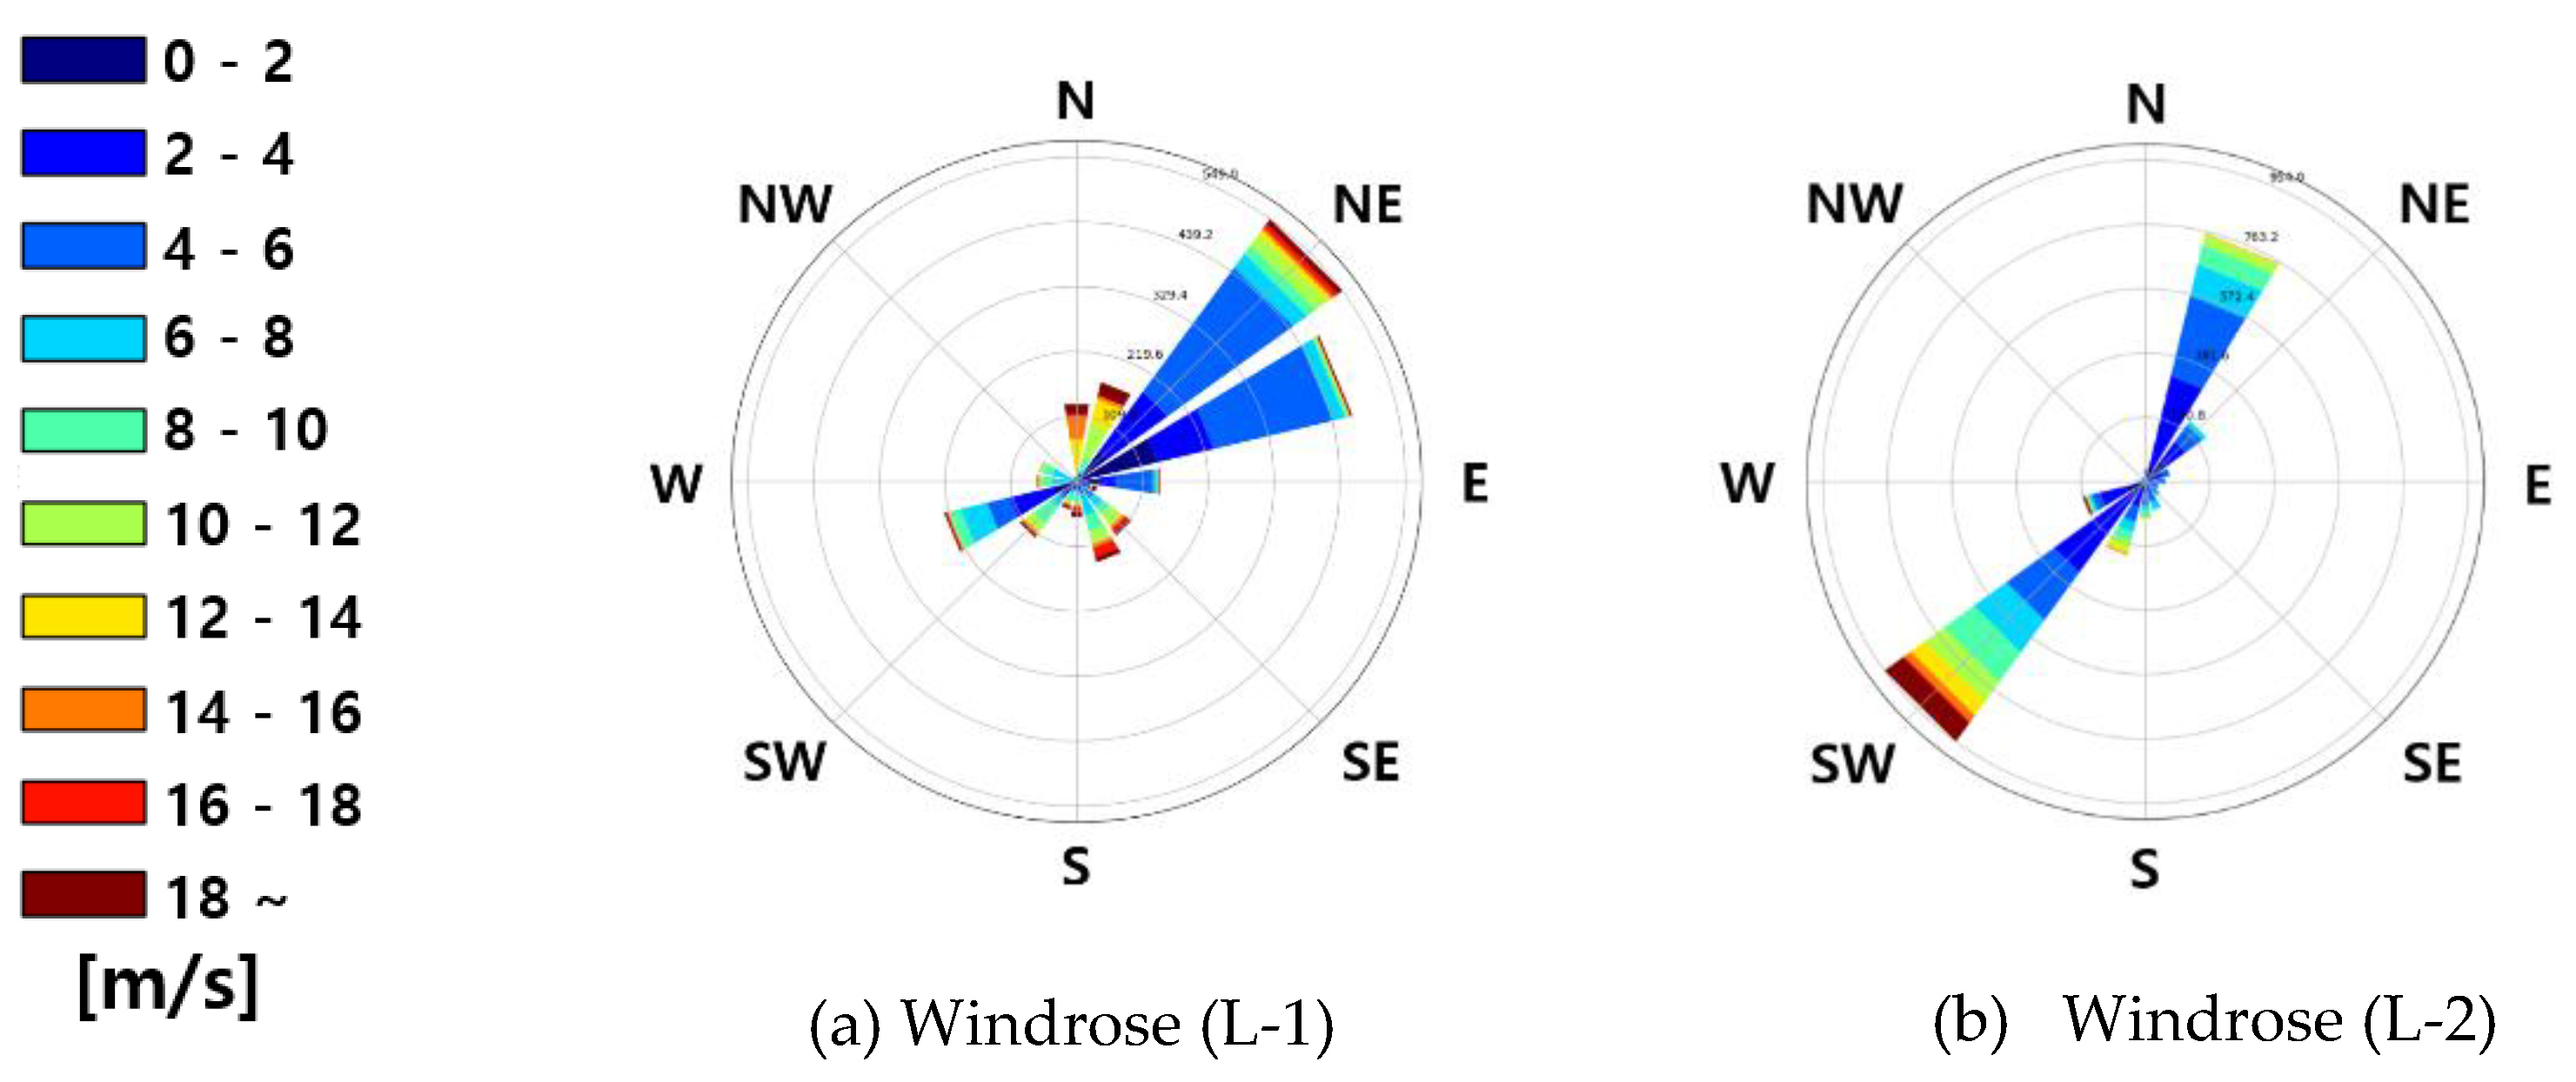
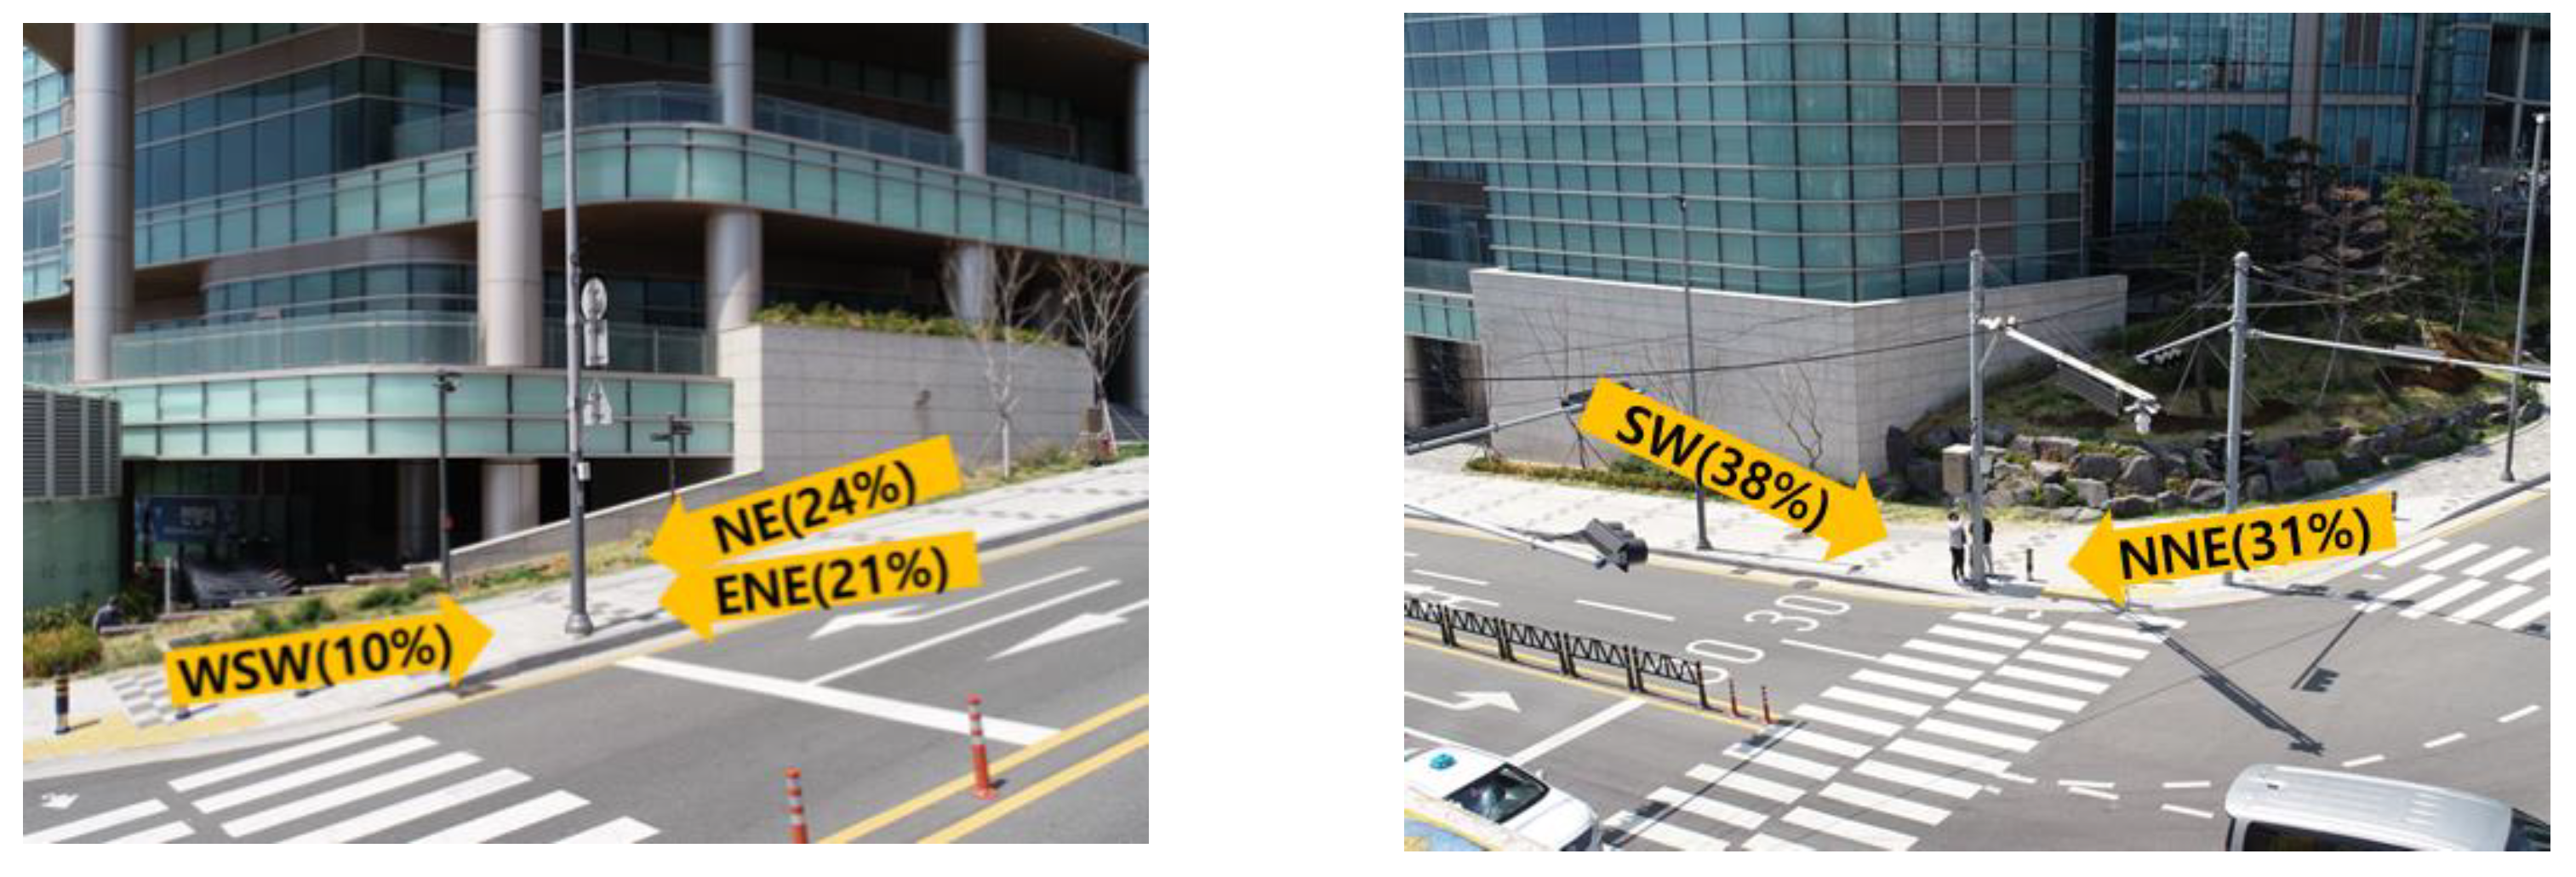
L-1 was installed at the eastern corner of the LCT residential complex, with its wind direction concentrated in northeast (24%), east-northeast (21%), and west-southwest (10%). Due to the spatiotemporal characteristics of L-1, this pattern appeared to be caused by separated winds that blew parallel to the side of the LCT residential complex (Figure 10). Max peak gust and max 1 min-mean wind speed were 26.52 m/s (N) and 44.19 m/s (N), respectively, which were 2.9 times and 2.2 times stronger than the wind speed at AWS.
Due to the same spatiotemporal characteristics as L-1, L-2 was concentrated in a specific wind direction by the separated wind which led to a stronger wind speed in the main direction (Figure 9 and Figure 10). The max peak gust and max 1 min-mean wind speed at L-2 were 40.80 m/s (SW) and 28.48 m/s (SW), respectively, whice were 2.7 and 2.3 times stronger than the wind speed of AWS.
Figure 10.
Main wind direction for L-1(left) and L-2(right).
L-3 was installed at the intersection on the north side of the LCT residential complex. The canyon wind passing between three buildings located in the south showed that the southerly wind was significantly stronger than the northerly wind, with a significant effect on the increase in wind speed (Figure 9 and Figure 11). At this point, the strongest wind was observed in this typhoon event, and the max peak gust and max 1 min-mean wind speed were 55.53 m/s (SSE) and 38.39 m/s (SSE), respectively, which were 3.7 and 3.1 times stronger than the wind speed at AWS.
Figure 11.
Main wind direction for L-3(left) and L-4(right)
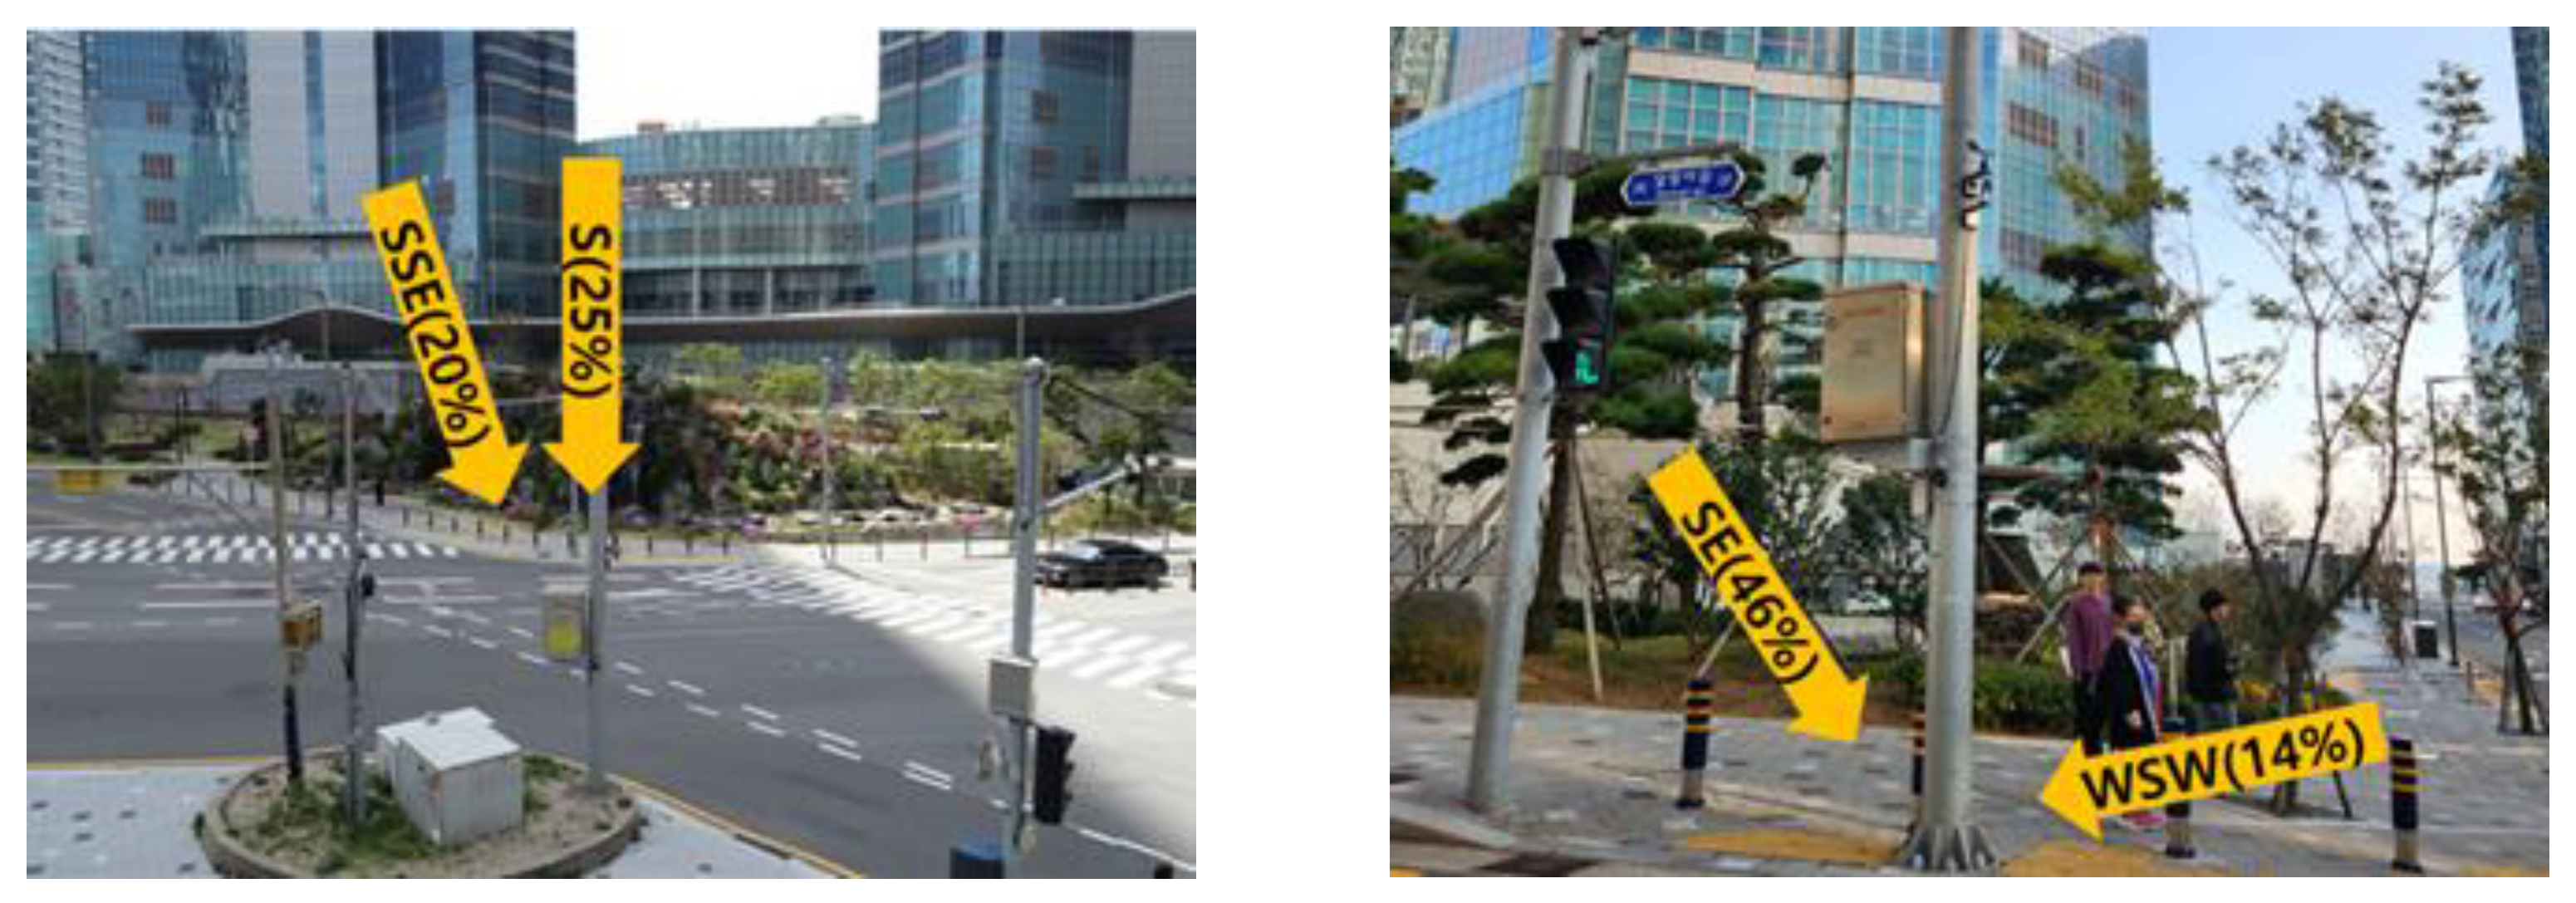
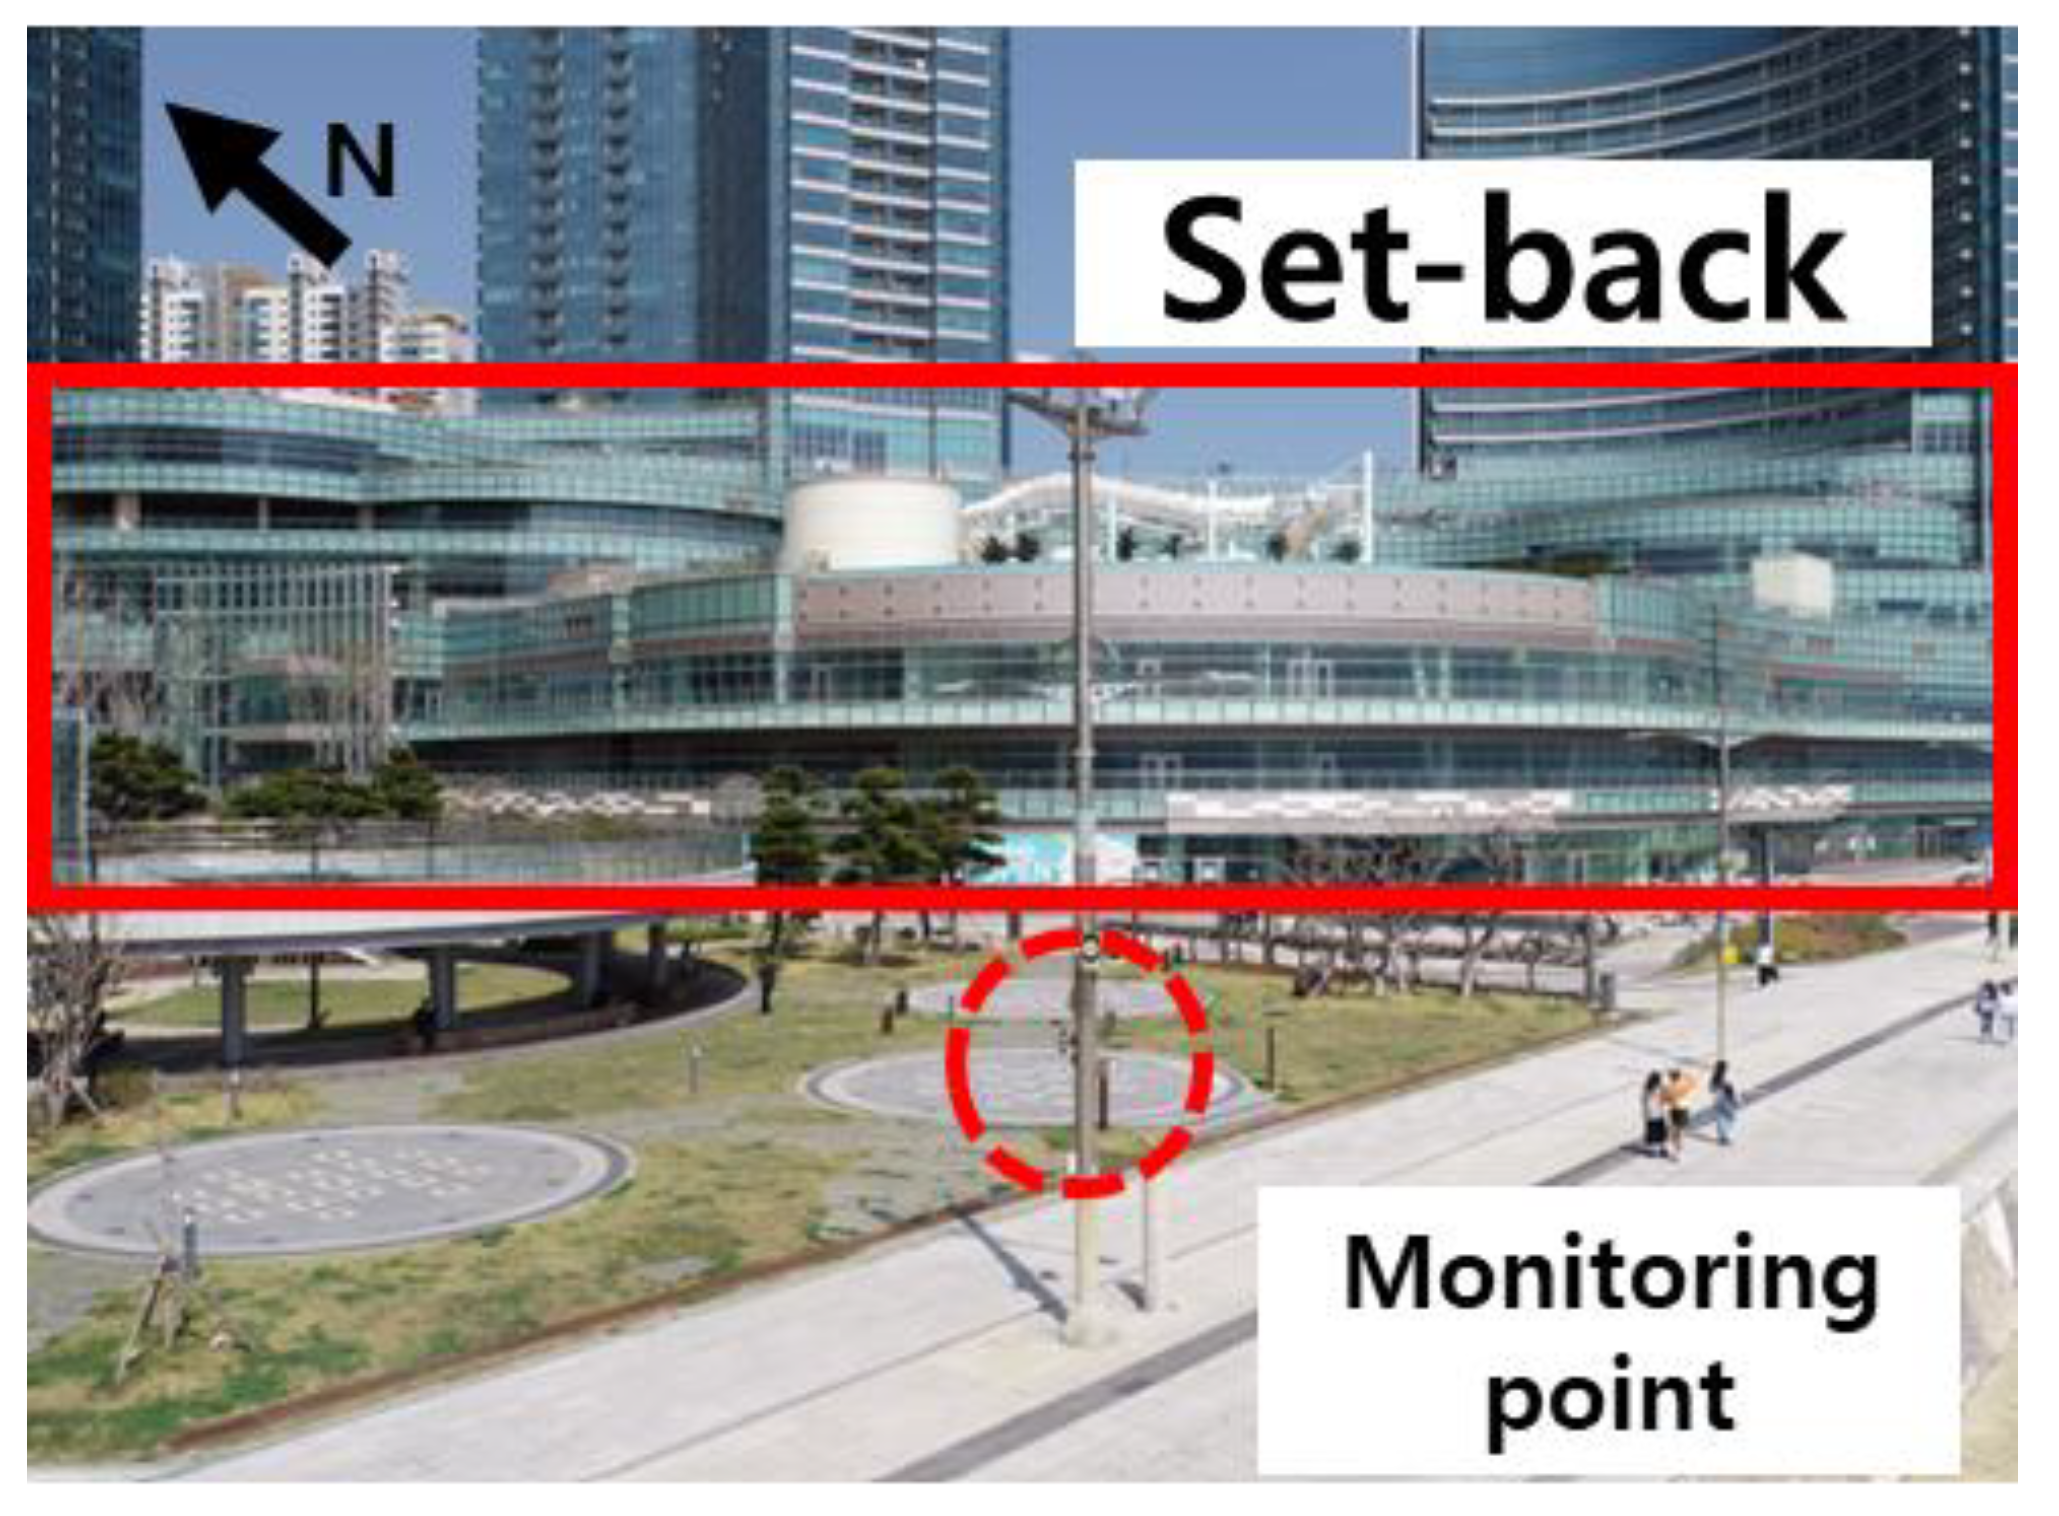
On the other hand, lower wind speeds were observed at L-4 and L-5 than at L-1, L-2 and L-3. The main wind direction at L-4 was southeast. The reduction in the wind speed was attributed to the effects of trees located on the windward side of the area, where the skyscraper winds were expected. After the center of the typhoon passed, strong winds were observed from the southwest winds blowing along the narrow road. Since L-5, in the southern part of the LCT residential complex, was located on the opposite side of L-3, strong northerly winds were expected. However, the lowest wind speed was observed at L-5, similar to that of AWS, which was not affected by skyscraper wind. In Toronto, Canada, a set-back structure shape is recommended to reduce skyscraper winds caused by high-rise buildings [16]. On the south side of the LCT residential complex, buildings have a set-back shape, thus the skyscraper wind was alleviated. This in turn warrants an in-depth research on the set-back structure shape that mitigates the skyscraper wind.
Figure 12.
Buildings with a set-back structure shape on the south side of the LCT residential complex.
Figure 12.
Buildings with a set-back structure shape on the south side of the LCT residential complex.
3.2. Beaufort Wind Scale
In Section 3.1., we analyzed the relative strength of the wind speed based on the comparison of the wind speeds at the five points with that observed at AWS. Here, we also analyzed the strength of wind speed in absolute values through the Beaufort Wind Scale, devised by the World Meteorological Organization (WMO) in Table 3. The strength of the wind speed was divided into 13 grades.
At AWS, winds of grades 0-6 blew. The most frequent wind speed grade was moderate breeze (grade 4) (27.09%), while the maximum wind speed was strong breeze (grade 6) (0.82%). At L-1, L-2 and L-3, grade 10 (storm), 10 (storm) and 12 (Hurricane) appeared, respectively. The range of grade 10 or higher was strong enough to be described as ‘uprooting trees and causing great damage to buildings’. At L-1, L-2 and L-3, the wind speed frequency was above grade 6 (10.8 m/s), higher than that at AWS. The frequency of wind speed in the range of grade 4 and 5 (5.5 ~ 10.8 m/s) was higher at AWS than that at the five points. . In other words; the skyscraper wind grew more pronounced when the mass flux rose above a certain wind speed. At L-4, the maximum wind speed grade was grade 8 (gale, 0.1%), while the most frequent wind speed grade was 1 (light air). This in turn indicated that the overall wind speed was low, while strong winds blew temporarily. L-5 generally showed a low Beaufort number.
Figure 13.
Frequency of Beaufort numbers at each point for LCT (a)–(e) L-1 to L-5 ( ), respectively, vs AWS (
 ).
).
), respectively, vs AWS ().
Figure 13.
Frequency of Beaufort numbers at each point for LCT (a)–(e) L-1 to L-5 (), respectively, vs AWS ().
), respectively, vs AWS ().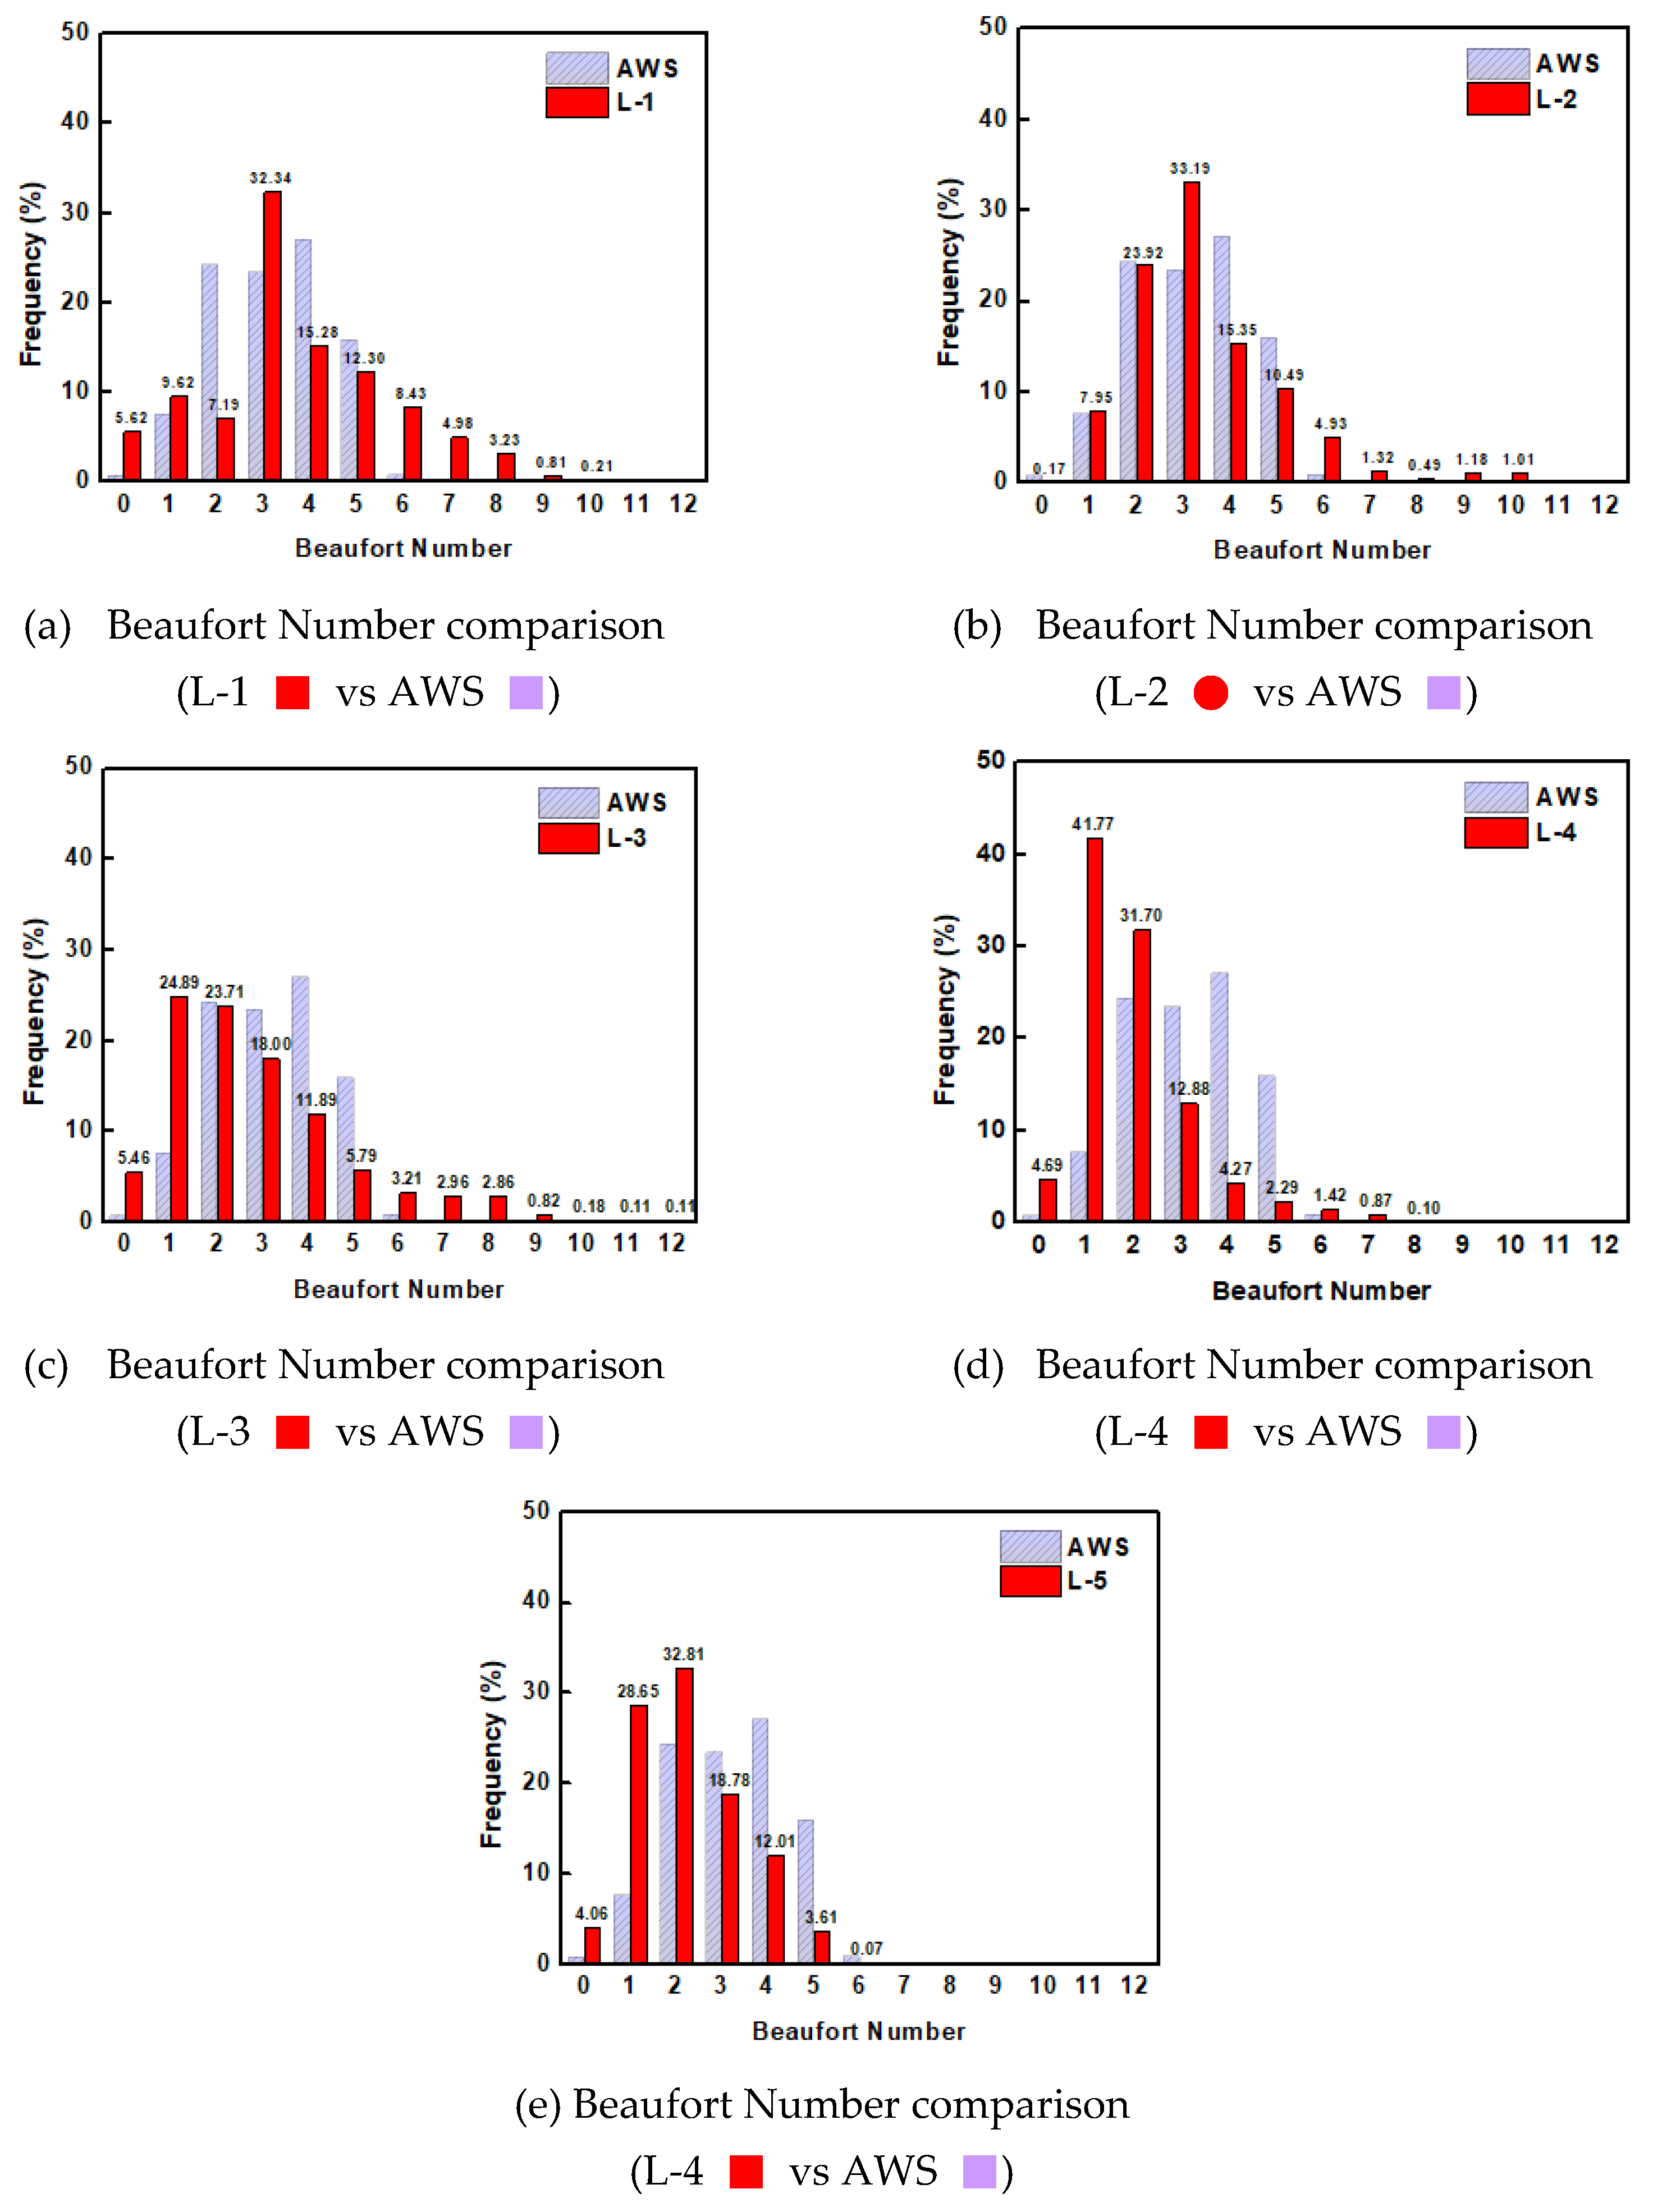
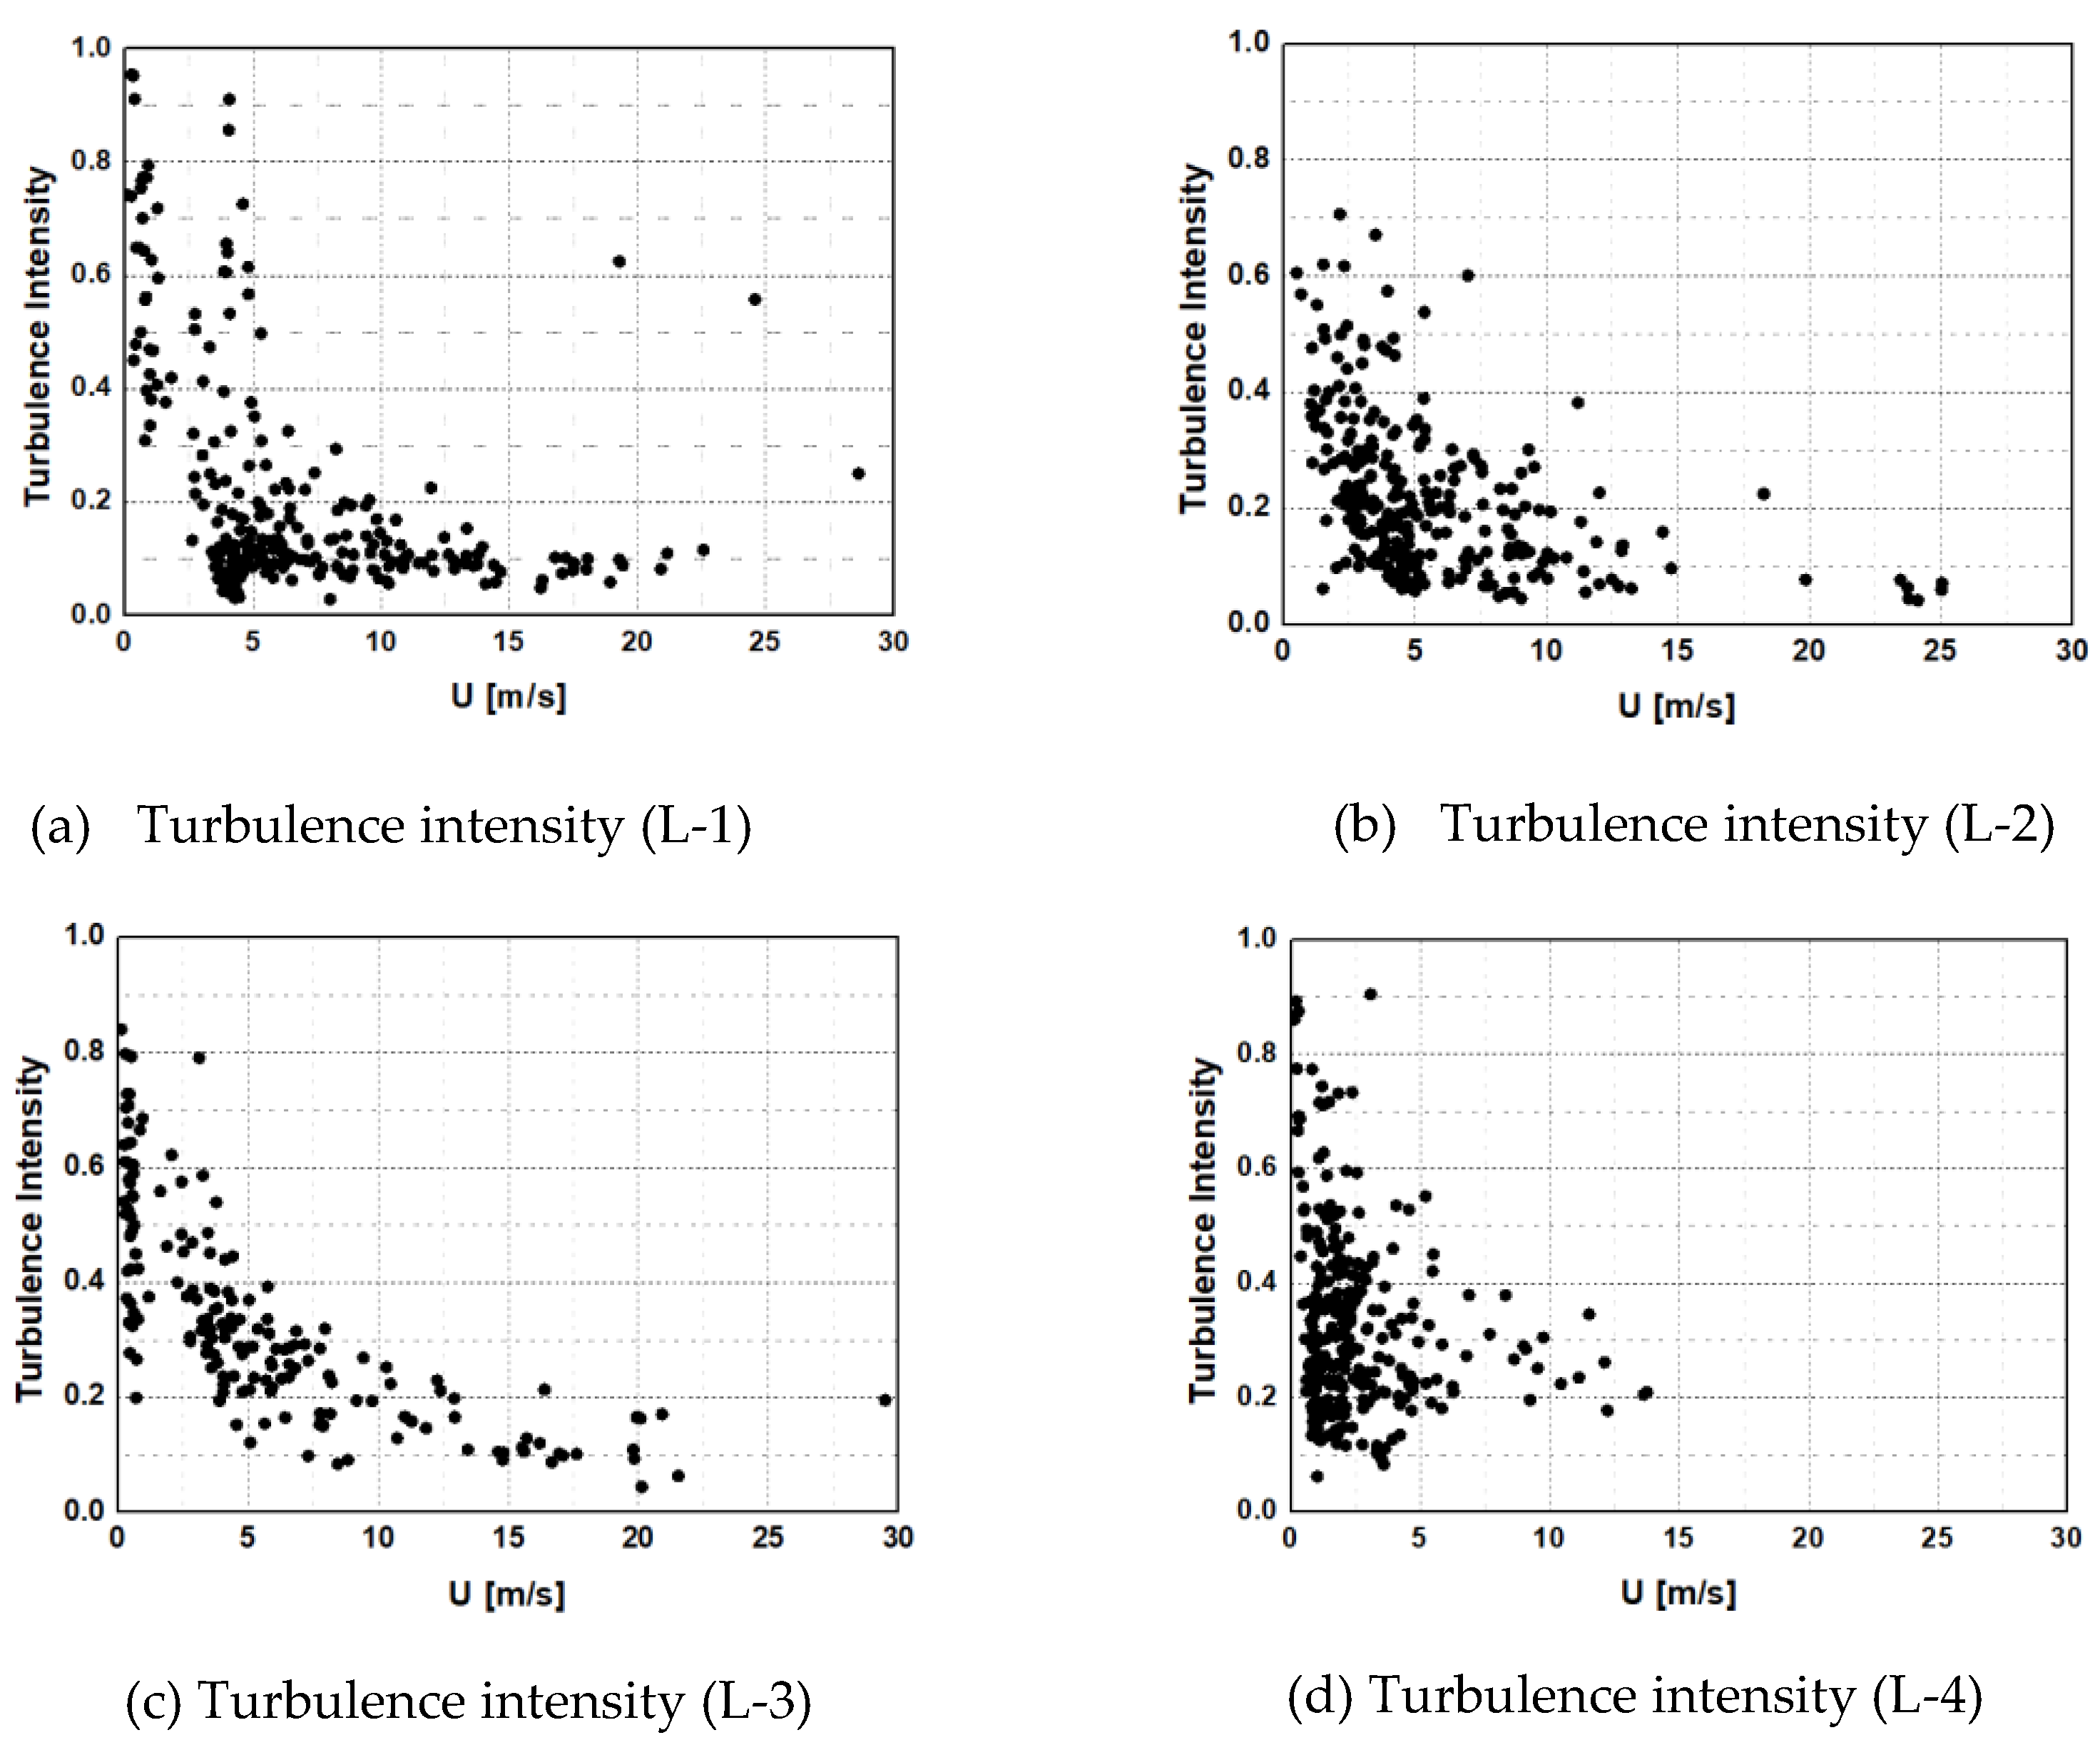
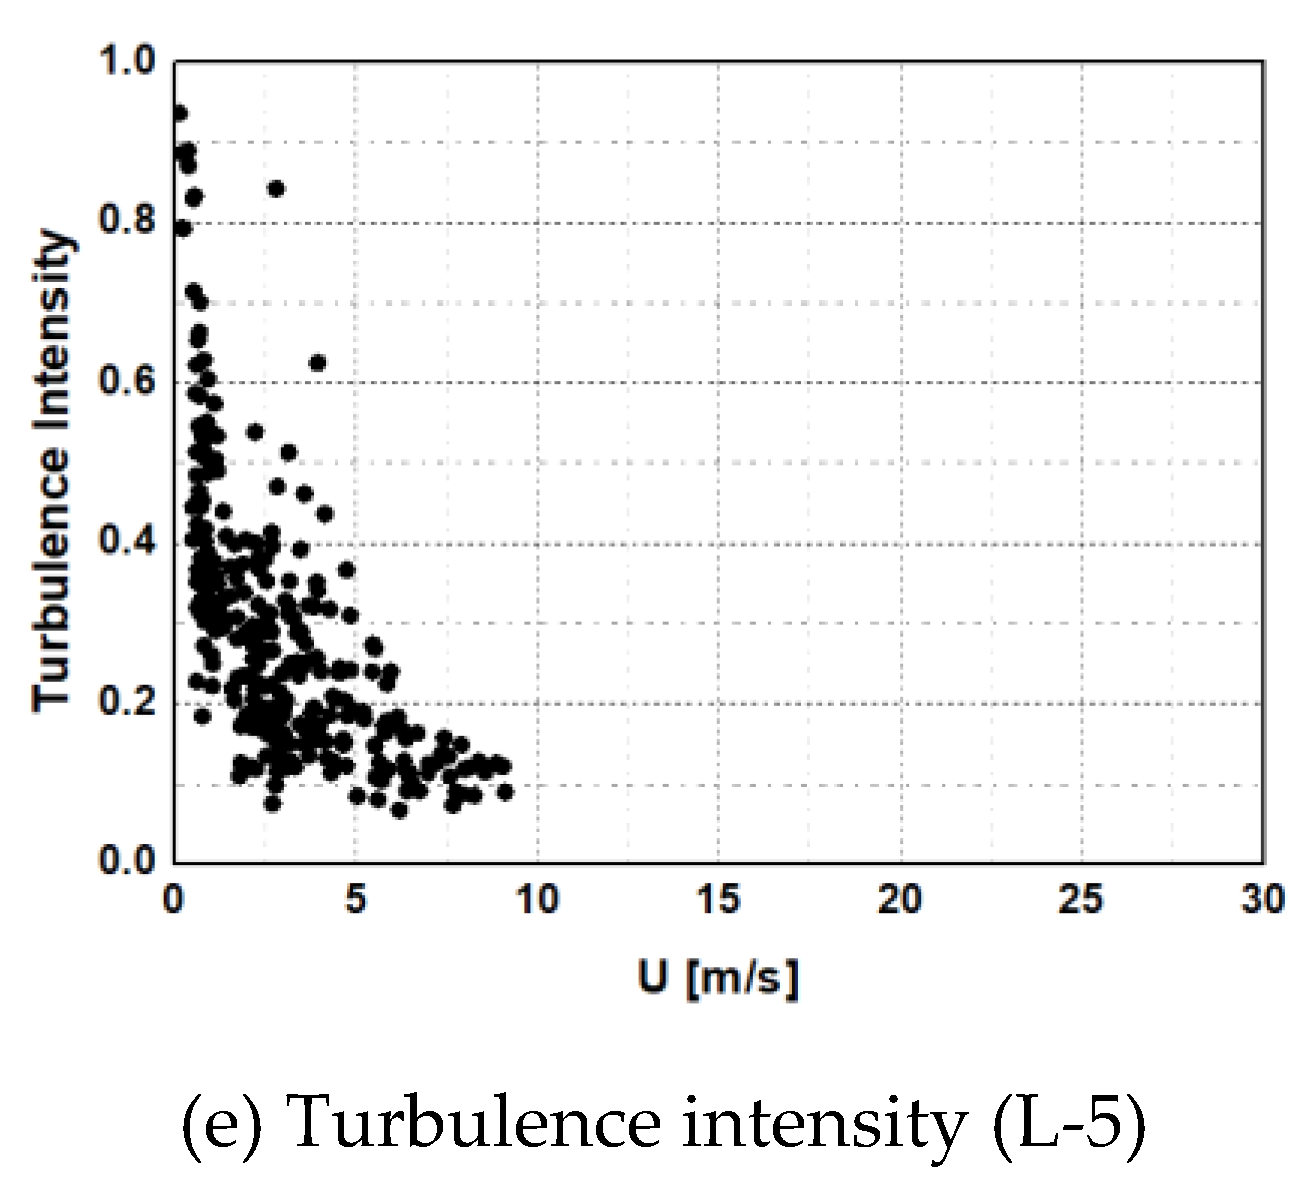
3.3. Turbulence intensity
We also analyzed the wind fluctuation characteristics observed at the five points. Overall, wind showed a spatiotemporally irregular distribution. In the atmospheric boundary layer, the air does not flow uniformly due to the roughness of the ground surface or the frictional effect of structures, and the fluctuation characteristics, such as the formation of vortices, increase. In particular, as the study site was a single high-rise building surrounded by low-rise buildings, the airflow was very unstable [17]. Turbulence intensity (), which represents the wind fluctuation characteristics, is defined as the ratio of standard deviation () of the wind speed to the mean wind speed () as follows:
Figure 14 shows the relationship between mean wind speed and turbulence intensity at each point. In line with previous studies, the turbulence intensity fell as the mean wind speed rose, and converged above a certain wind speed [18,19].
When the wind speed was low, the frictional force acted more strongly than the inertial wind force, rendering the airflow unstable, and thus, the turbulence intensity rose up to 0.95. However, when the wind speed was above 10 m/s, the range of turbulence intensity converged to 0.1–0.2 as the inertial wind force was increased by the high wind speed. The strong turbulence intensity even at the high wind speed was observed when the center of the typhoon, a windless zone, passed through the study site.
Figure 14.
Variations of turbulence intensity with mean speed for (a)–(e) L-1 to L-5, respectively.
3.4. Gust factor
Exterior materials falling off buildings and structural damage to buildings are mainly caused by momentary gusts of winds, which can cause additional secondary damage and adversely affect the wind environment for pedestrians. Gust factor () is defined as the ratio of the maximum instantaneous wind speed () to the mean wind speed () as follows:
In general, a short interval of 1-5 sec is used for the maximum instantaneous wind speed evaluation time (), while an interval of 5-10 min is used for the average wind speed evaluation time (T). In this paper, we set to 3 sec and T to 10 min. Since the maximum instantaneous wind speed varied depending on topography, surrounding area structures (e.g., shape, type, and height), and wind speed, may differ for each location. America Society of Civil Engineers (ASCE) suggests a ratio of 3 sec-mean wind speed to 10 min-mean wind speed of 1.43 as a conversion factor according to the measurement time of wind speed [20]. In addition, Ishizaki (1977) presented the results according to the evaluation time of the instantaneous wind speed at 10 m above the ground on flat land, as shown in Table 4 [21].
Shuyang et al. (2009) evaluated when Typhoon Maemi invaded Miyakojima, Japan, and reported that it converged to 1.6 regardless of wind speed [22]. Although the overall wind speed was increased by the skyscraper wind effect, it is considered to be the parameter that best represents the characteristics of skyscraper wind, which causes damage by momentarily generating strong gusts.
In the research area, as the wind speed increases, decreases and tended to converge to a certain value, in line with the trend of turbulence intensity (Figure 14 and Figure 15). In the wind speed range higher than 5 m/s, was found to converge to about 2.0 at all points. This in turn indicated that a gust at least twice as strong as the average wind speed was blowing. On the other hand, where the average wind speed is lower than 5 m/s, the gust factor had high volatility and appeared up to 9.17, but most of them are insignificant due to the low average wind speed.
4. Summary and conclusions
The study site was selected as the vicinity of the LCT residential complex. We measured the wind direction and speed via anemometers installed at five locations, to determine the skyscraper wind behavior during Typhoon Hinnamnor. The skyscraper wind varied depending on the spatiotemporal characteristics of the study site, such as complex interactions among temperature, air pressure, building characteristics (e.g., arrangement and shape) in the vicinity, and landscaping. Gust and maximum 1 min-mean wind speed were up to 3.7 and 3.1 times stronger than those measured at AWS, a nearby reference station, respectively. At AWS, the Beaufort number was up to 6, whereas the highest grade of 12 was observed in the vicinity of the LCT residential complex. This indicated that the wind speed was increased by the skyscraper wind effect. The turbulence intensity reached a maximum of 0.95 at low wind speed and declined as the wind speed increased, converging to a range of 0.1-0.2. Also, the wind speed rose, the gust factor dropped. Regardless of the spatiotemporal characteristics of the five points, in the wind speed range higher than 5 m/s, it converged to about 2.0 at all points, resulting in a gust twice as strong as the mean wind speed at all points. These results suggest that, when constructing high-rise buildings, it is necessary to consider that the gust is twice as strong as the average wind speed due to high fluctuation. In addition to mitigate the skyscraper wind effects, it would be helpful to plant trees or apply set-back shape by predicting wind conditions. Furthermore, this study provides actionable insights into accurate simulations of drivers, patterns, and impacts of skyscraper wind and associated vulnerable areas under extreme weather conditions. In a future study, CFD simulations of spatiotemporally varying skyscraper wind effects and wind tunnel experiments for their validation will be performed.
Institutional Review Board Statement
Not applicable.
Informed Consent Statement
Not applicable.
Data Availability Statement
Not applicable.
Acknowledgments
This research was supported by a grant (20011068) of Regional Customized Disaster-Safety R&D Program funded by Ministry of Interior and Safety (MOIS, Korea). This research was supported by 2021 BK21 FOUR Program of Pusan National University
Conflicts of Interest
The authors declare no conflict of interest.
References
- Hwang, H.S.; Park, J.S. Research on Optimum Design Method for Fire Protection System of Super Tall Building. Korean Institute of Fire Science & Engineering 2004, 51, 156. [Google Scholar]
- Blocken, B.; Carmeliet, J. Pedestrian Wind Environment around Buildings: Literature Review and Practical Examples. Journal of Building Physics 2004, 28, 107–159. [Google Scholar] [CrossRef]
- Blocken, B.; Stathpoulos, T.; Beeck, J.P.A.J. Pedestrian-level Wind Conditions around Buildings: Review of Wind-tunnel and CFD Techniques and Their Accuracy for Wind Comfort Assessment. Building and Environment 2016, 100, 50–81. [Google Scholar] [CrossRef]
- Mittal, H.; Sharma, A.; Gairola. A Review on the Study of Urban Wind at the Pedestrian Level around Buildings. Journal of Building Engineering, 2018, 18, 154–163. [Google Scholar] [CrossRef]
- National Environmental Policy Act (NEPA), Environmental Impact Assessment (EIA) in the United States, United States, 1969.
- Kamei, I.; Maruta, E. Study on Wind Environmental Problems Caused around Buildings in Japan. Journal of Wind Engineering and Industrial Aerodynamics 1979, 4, 307–331. [Google Scholar] [CrossRef]
- Yoshie, R.; Mochida, A.; Tominaga, Y.; Kataoka, H.; Harimoto, K.; Nozu, T.; Shirasawa, T. Cooperative Project for CFD Prediction of Pedestrian Wind Environment in the Architectural Institute of Japan. Journal of Wind Engineering and Industrial Aerodynamics 2007, 95, 1551–1578. [Google Scholar] [CrossRef]
- Leung, D.Y.C.; Yang, Y. Wind Energy Development and its environmental impact: A review. Renewable and Sustainable Energy Reviews 2012, 16, 1031–1039. [Google Scholar] [CrossRef]
- Steele, A. An Environmental Impact Assessment of the Proposal to build a Wind Farm at Langdon Common in the North Pennines, UK. Environmentalist, 1991, 11, 195–212. [Google Scholar] [CrossRef]
- Razak, A.A.; Hagishima, A.; Ikegaya, N.; Tanimoto, J. Analysis of air flow over building arrays for assessment of urban wind environ ment. Building and Environment 2013, 59, 56–65. [Google Scholar] [CrossRef]
- Kwon, Y.; Kim, J.; Kwon, S. Analyzing the Impact of Skyscraper wind in Coastal Areas. Journal of Coastal Research 2021, 114, 266–270. [Google Scholar] [CrossRef]
- Kheyari, P.; Dalui, S.K. Estimation of Wind Load on a Tall Building under Interference Effects: A Case Study. Jordan Journal of Civil Engineering 2015, 9, 84–101. [Google Scholar]
- M, B.; He, B.J.; Zhao, D.X.; Chau, K.W. Numerical Simulation of the effects of building dimensional variation on wind pressure distribution. Engineering Applications of Computational Fluid Mechanics 2017, 11, 293–309. [Google Scholar] [CrossRef]
- Zheng, S.; Wang, Y.; Zhai, Z.; Xue, Y.; Duanmu, L. Characteristics of Wind Flow around a Target Building with Different Surrounding Building Layers predicted by CFD Simulation. Building and Environment, 2021, 201. [Google Scholar] [CrossRef]
- Korea Meteorological Admission. Standard Specification for Automatic Weather Observation Equipment. 2018.
- Tall Building Design Guidelines, City of Toronto, Canada, 2013.
- Elton, H.; Florian, N.; Ani, P. The Wind Flow Effects and High-rise Buildings in Urban Spatial Morphology. Proceedings of the 1st International Forum on Architecture and Urbanism, Tirana, Albania, 14-16, December 2017.
- Tamura, Y.; Shimada, K.; Hibi, K. Wind Response of a Tower (Typhoon Observation at the Nagasaki Huis Ten Bosch Domtoren). J. Wind Eng. Ind. Aerodyn. 1993, 50, 309–318. [Google Scholar] [CrossRef]
- Ishizaki, H. Wind Profiles, Turbulence Intensities and Gust Factors for Design in Typhoon-prone Regions. J. Wind Eng. Ind. Aerodyn. 1983, 13, 55–66. [Google Scholar] [CrossRef]
- ASCE 7-10. Minimum Design Loads for Buildings and Other Structures, American Society of Civil Engineers: Reston, Virginia, USA, 2010.
- Ishizaki, H. Wind-resistant engineering, Asakura: Tokyo, Japan, 1977; pp.27.
- Shuyang, C.; Yukio, T.; Naoshi, K.; Mamoru, S.; Ikuo, N.; Yutaka, M. Wind characteristics of a strong typhoon, J. Wind Eng. Ind. Aerodyn. 2009, 97, 11–21. [Google Scholar] [CrossRef]
Figure 1.
Spatiotemporal path of Typhoon Hinnamnor in relation to the study site.
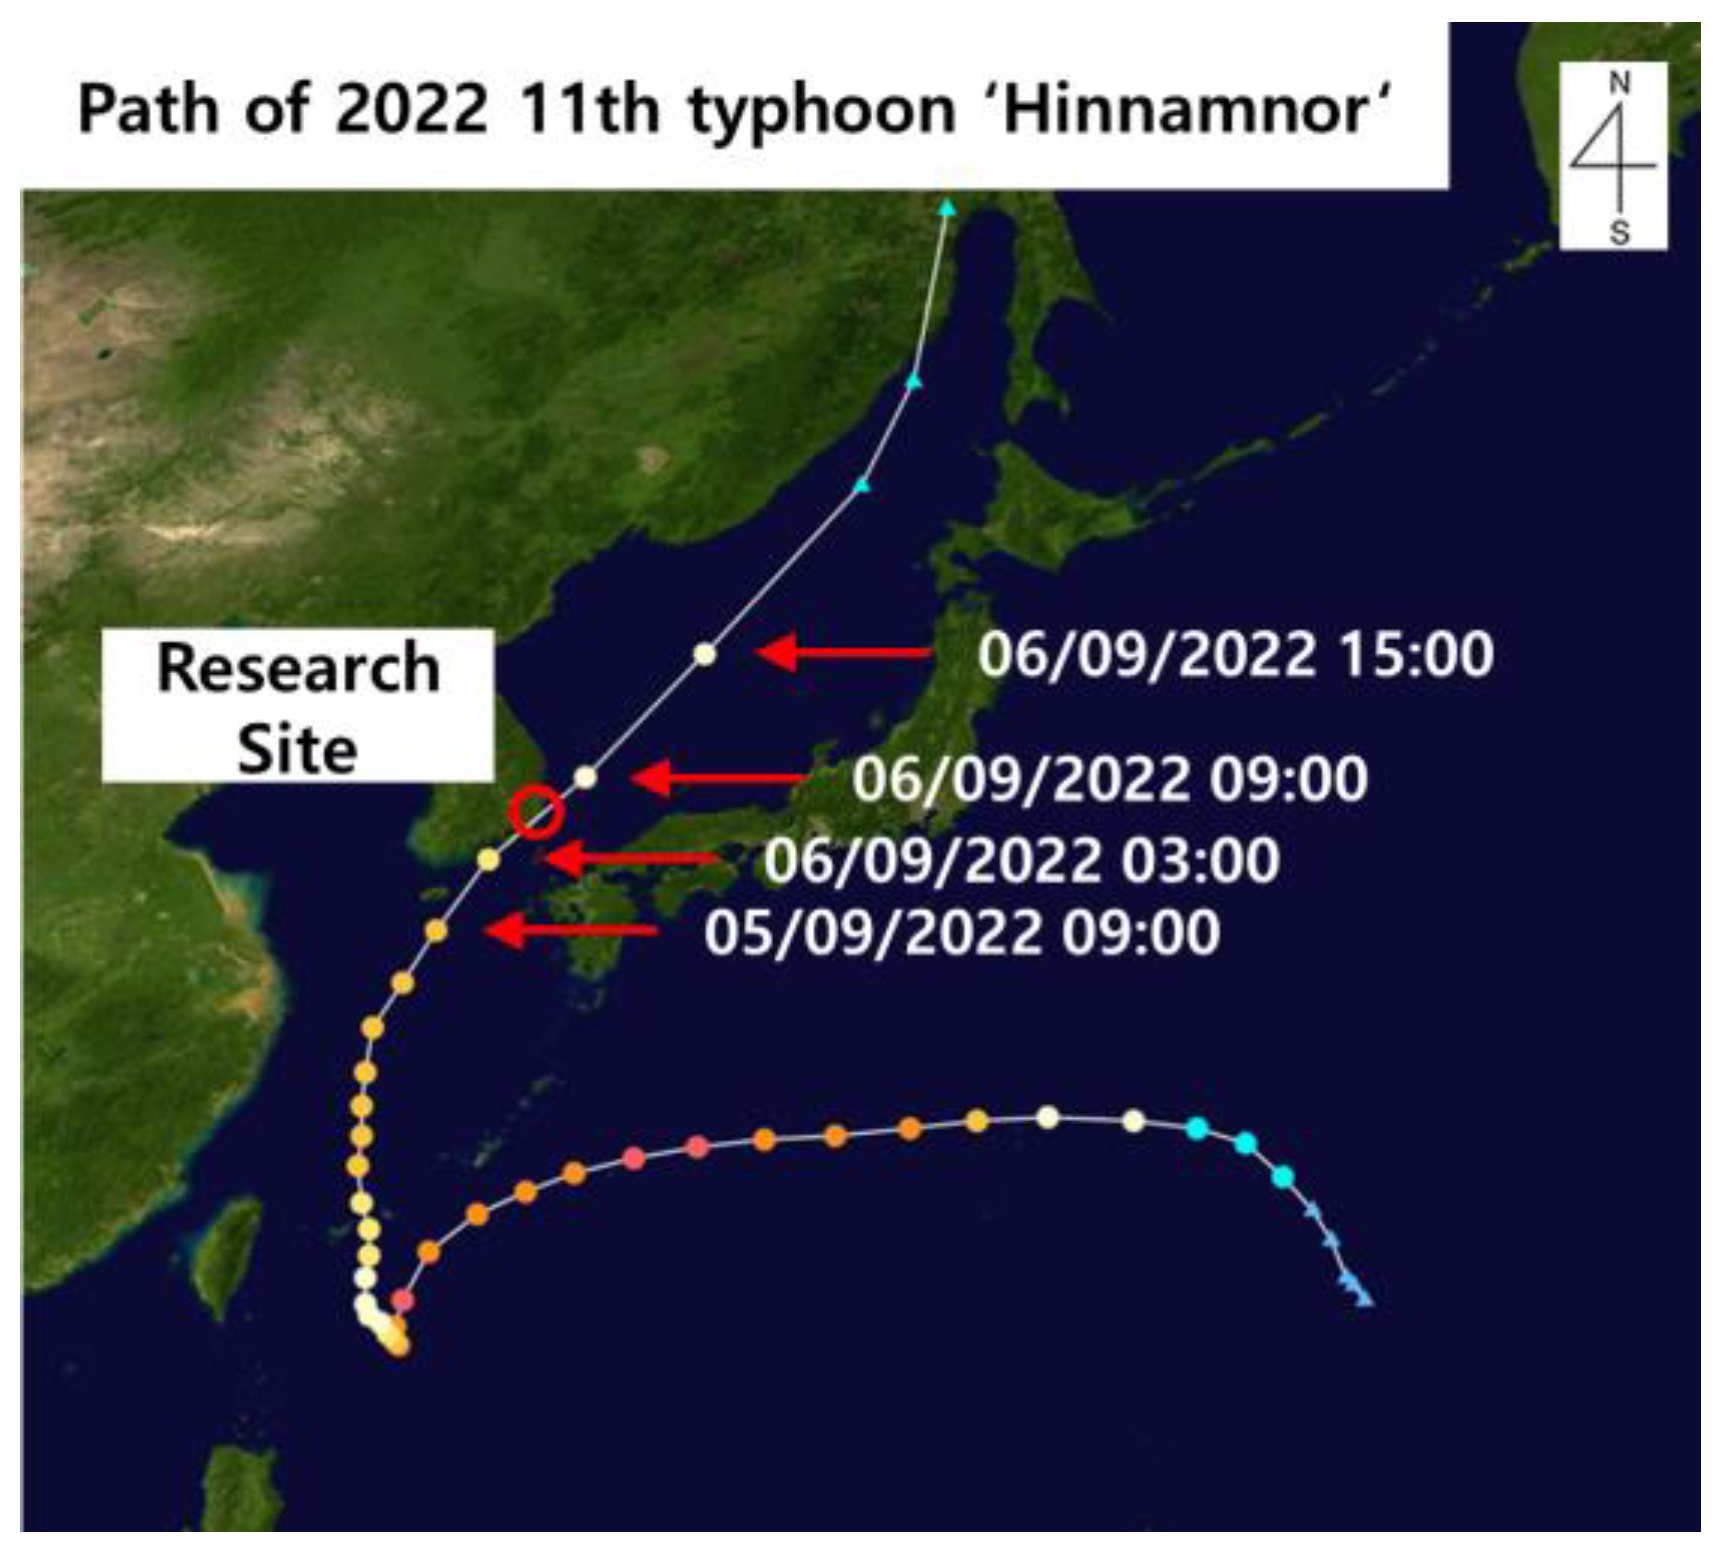
Figure 2.
Geographical location and surrounding area of the LCT residential complex (self taken).
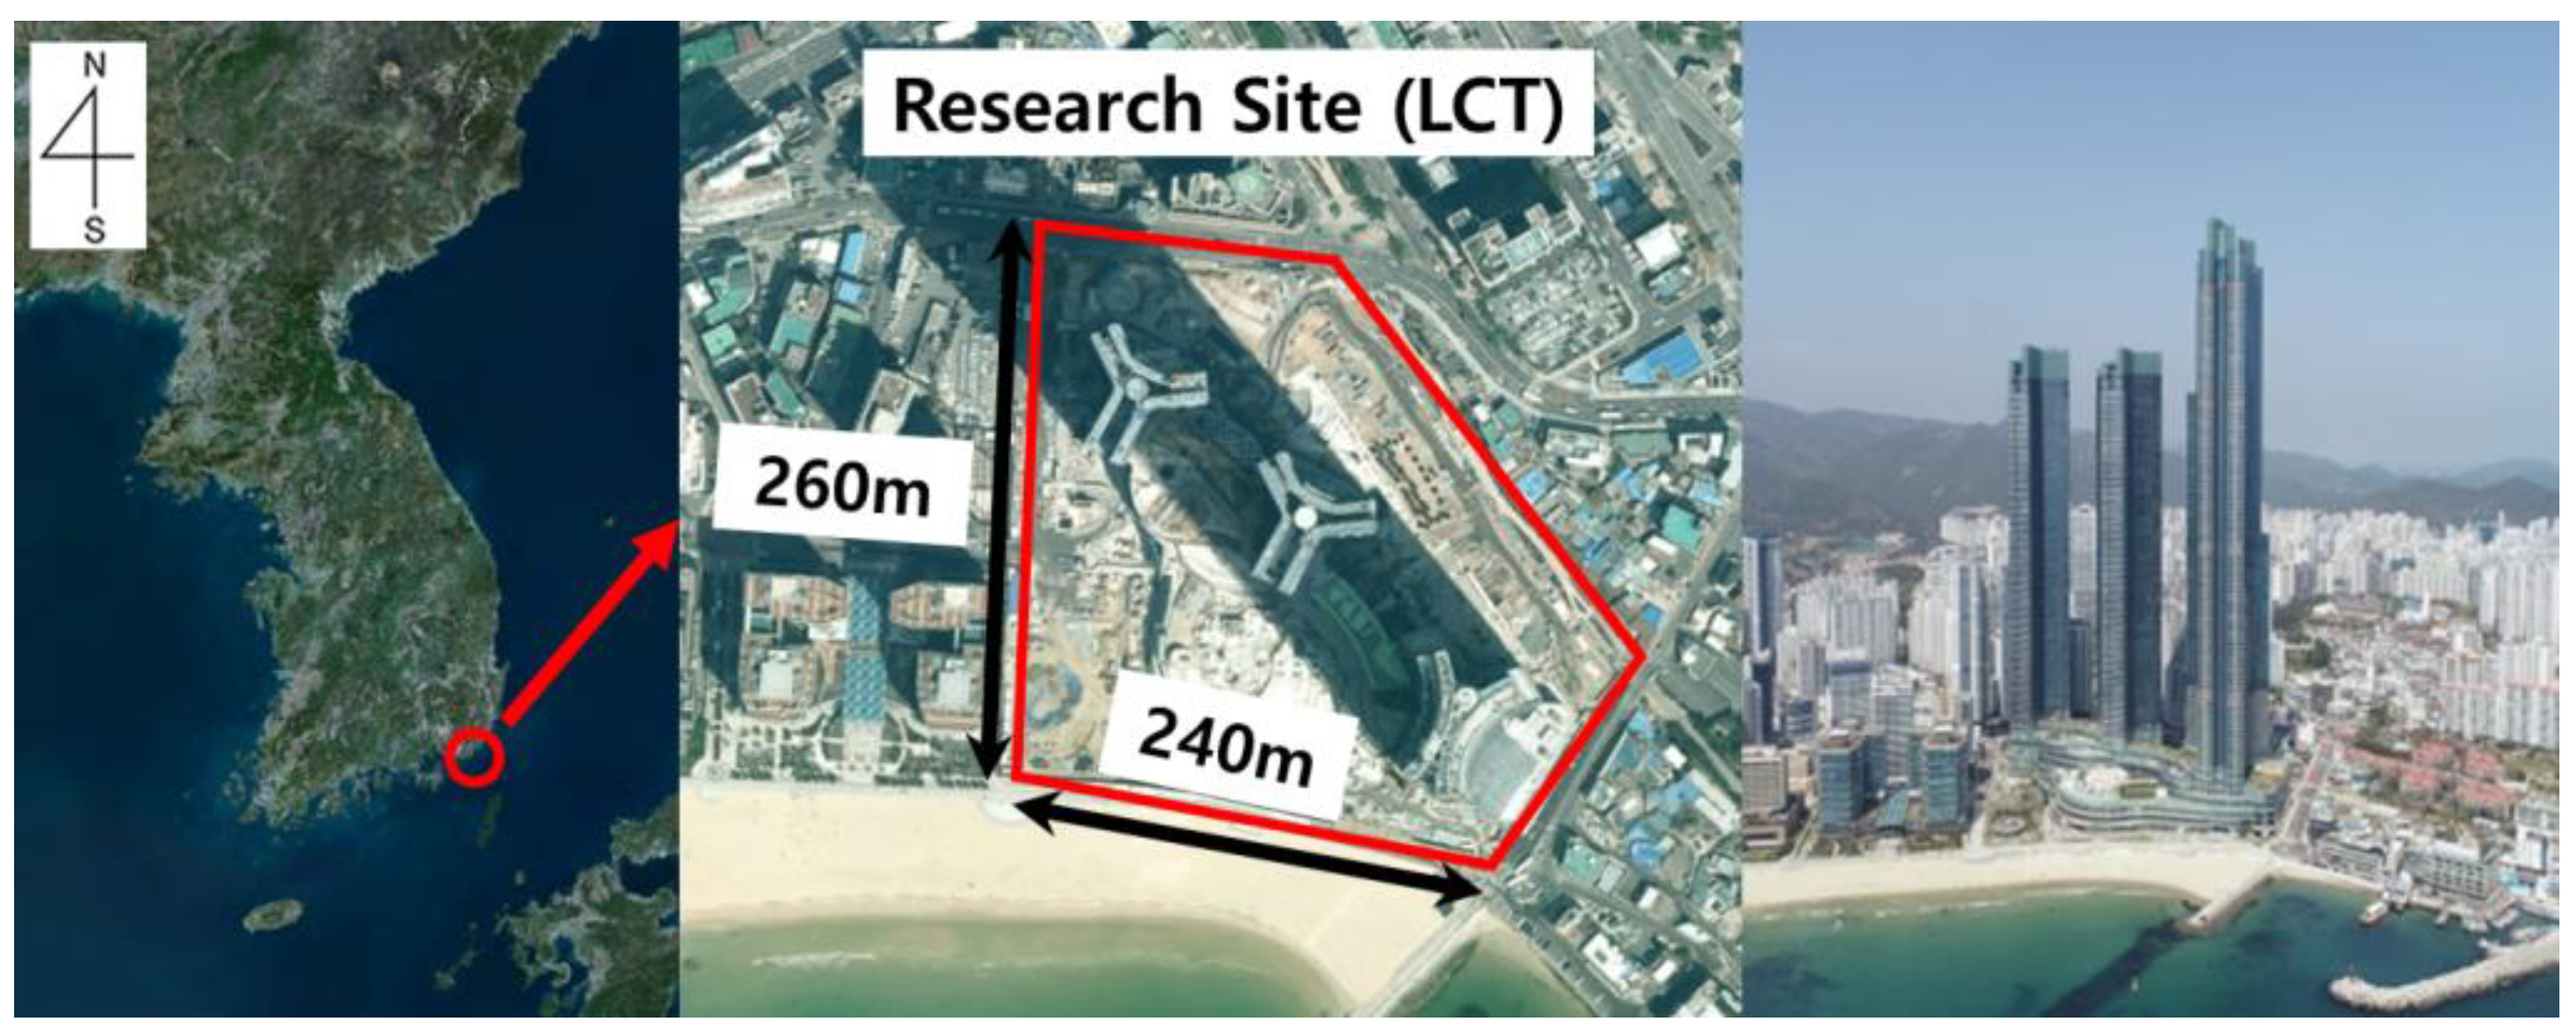
Figure 3.
Field measurement points around LCT residential complex
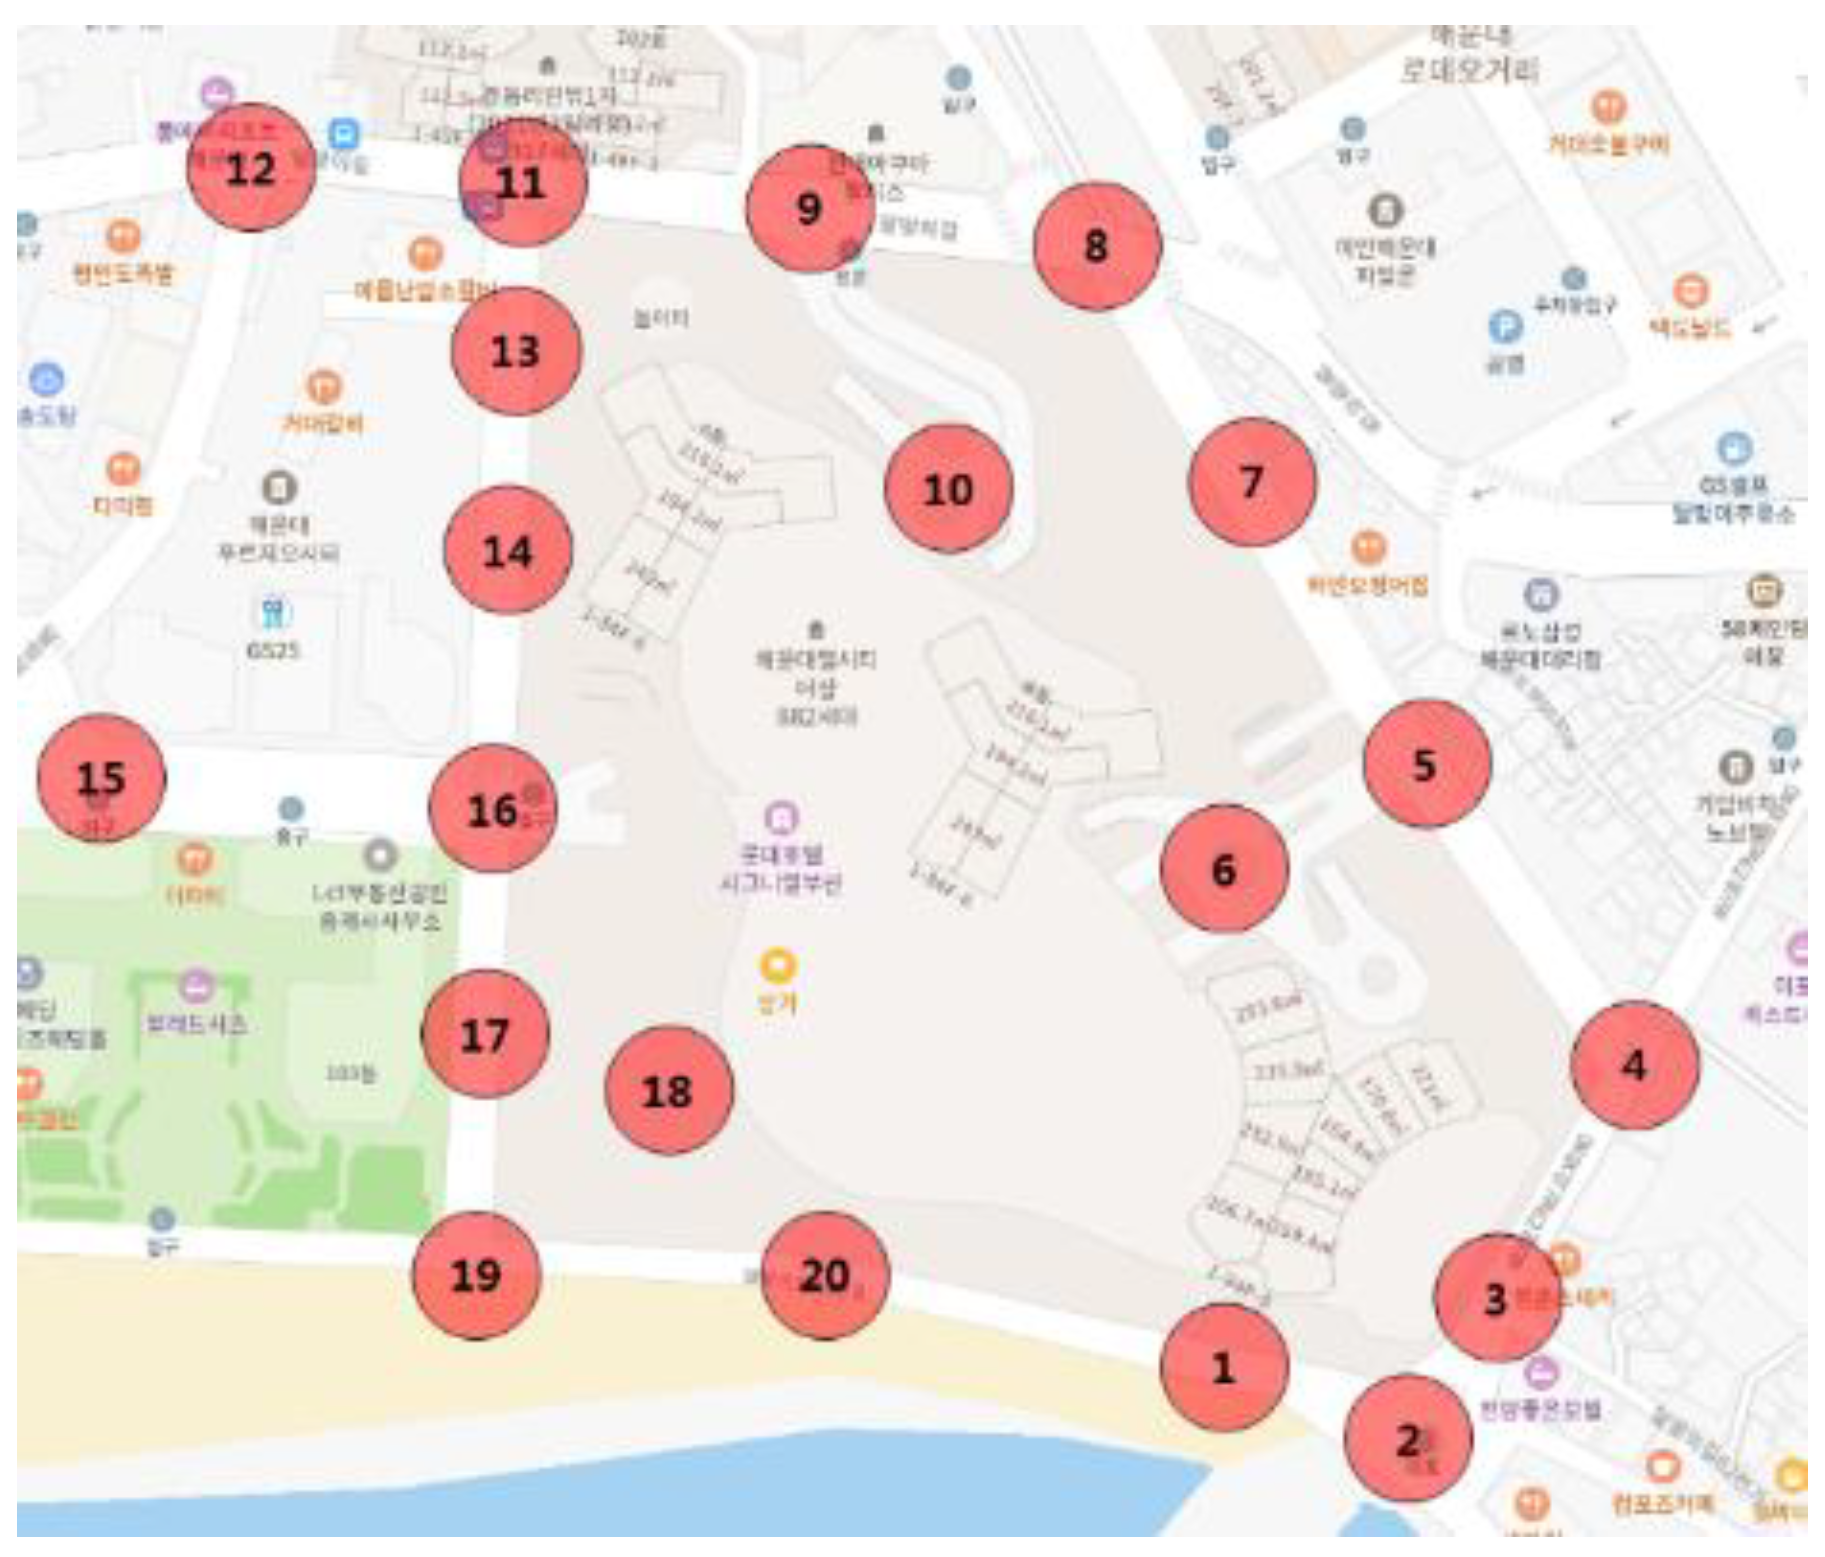
Figure 15.
Variation of gust factor with mean wind speed. Values of gust factor for (a) L-1, (b) L-2, (c) L-3, (d) L-4, and (e) L-5 are shown.
Figure 15.
Variation of gust factor with mean wind speed. Values of gust factor for (a) L-1, (b) L-2, (c) L-3, (d) L-4, and (e) L-5 are shown.
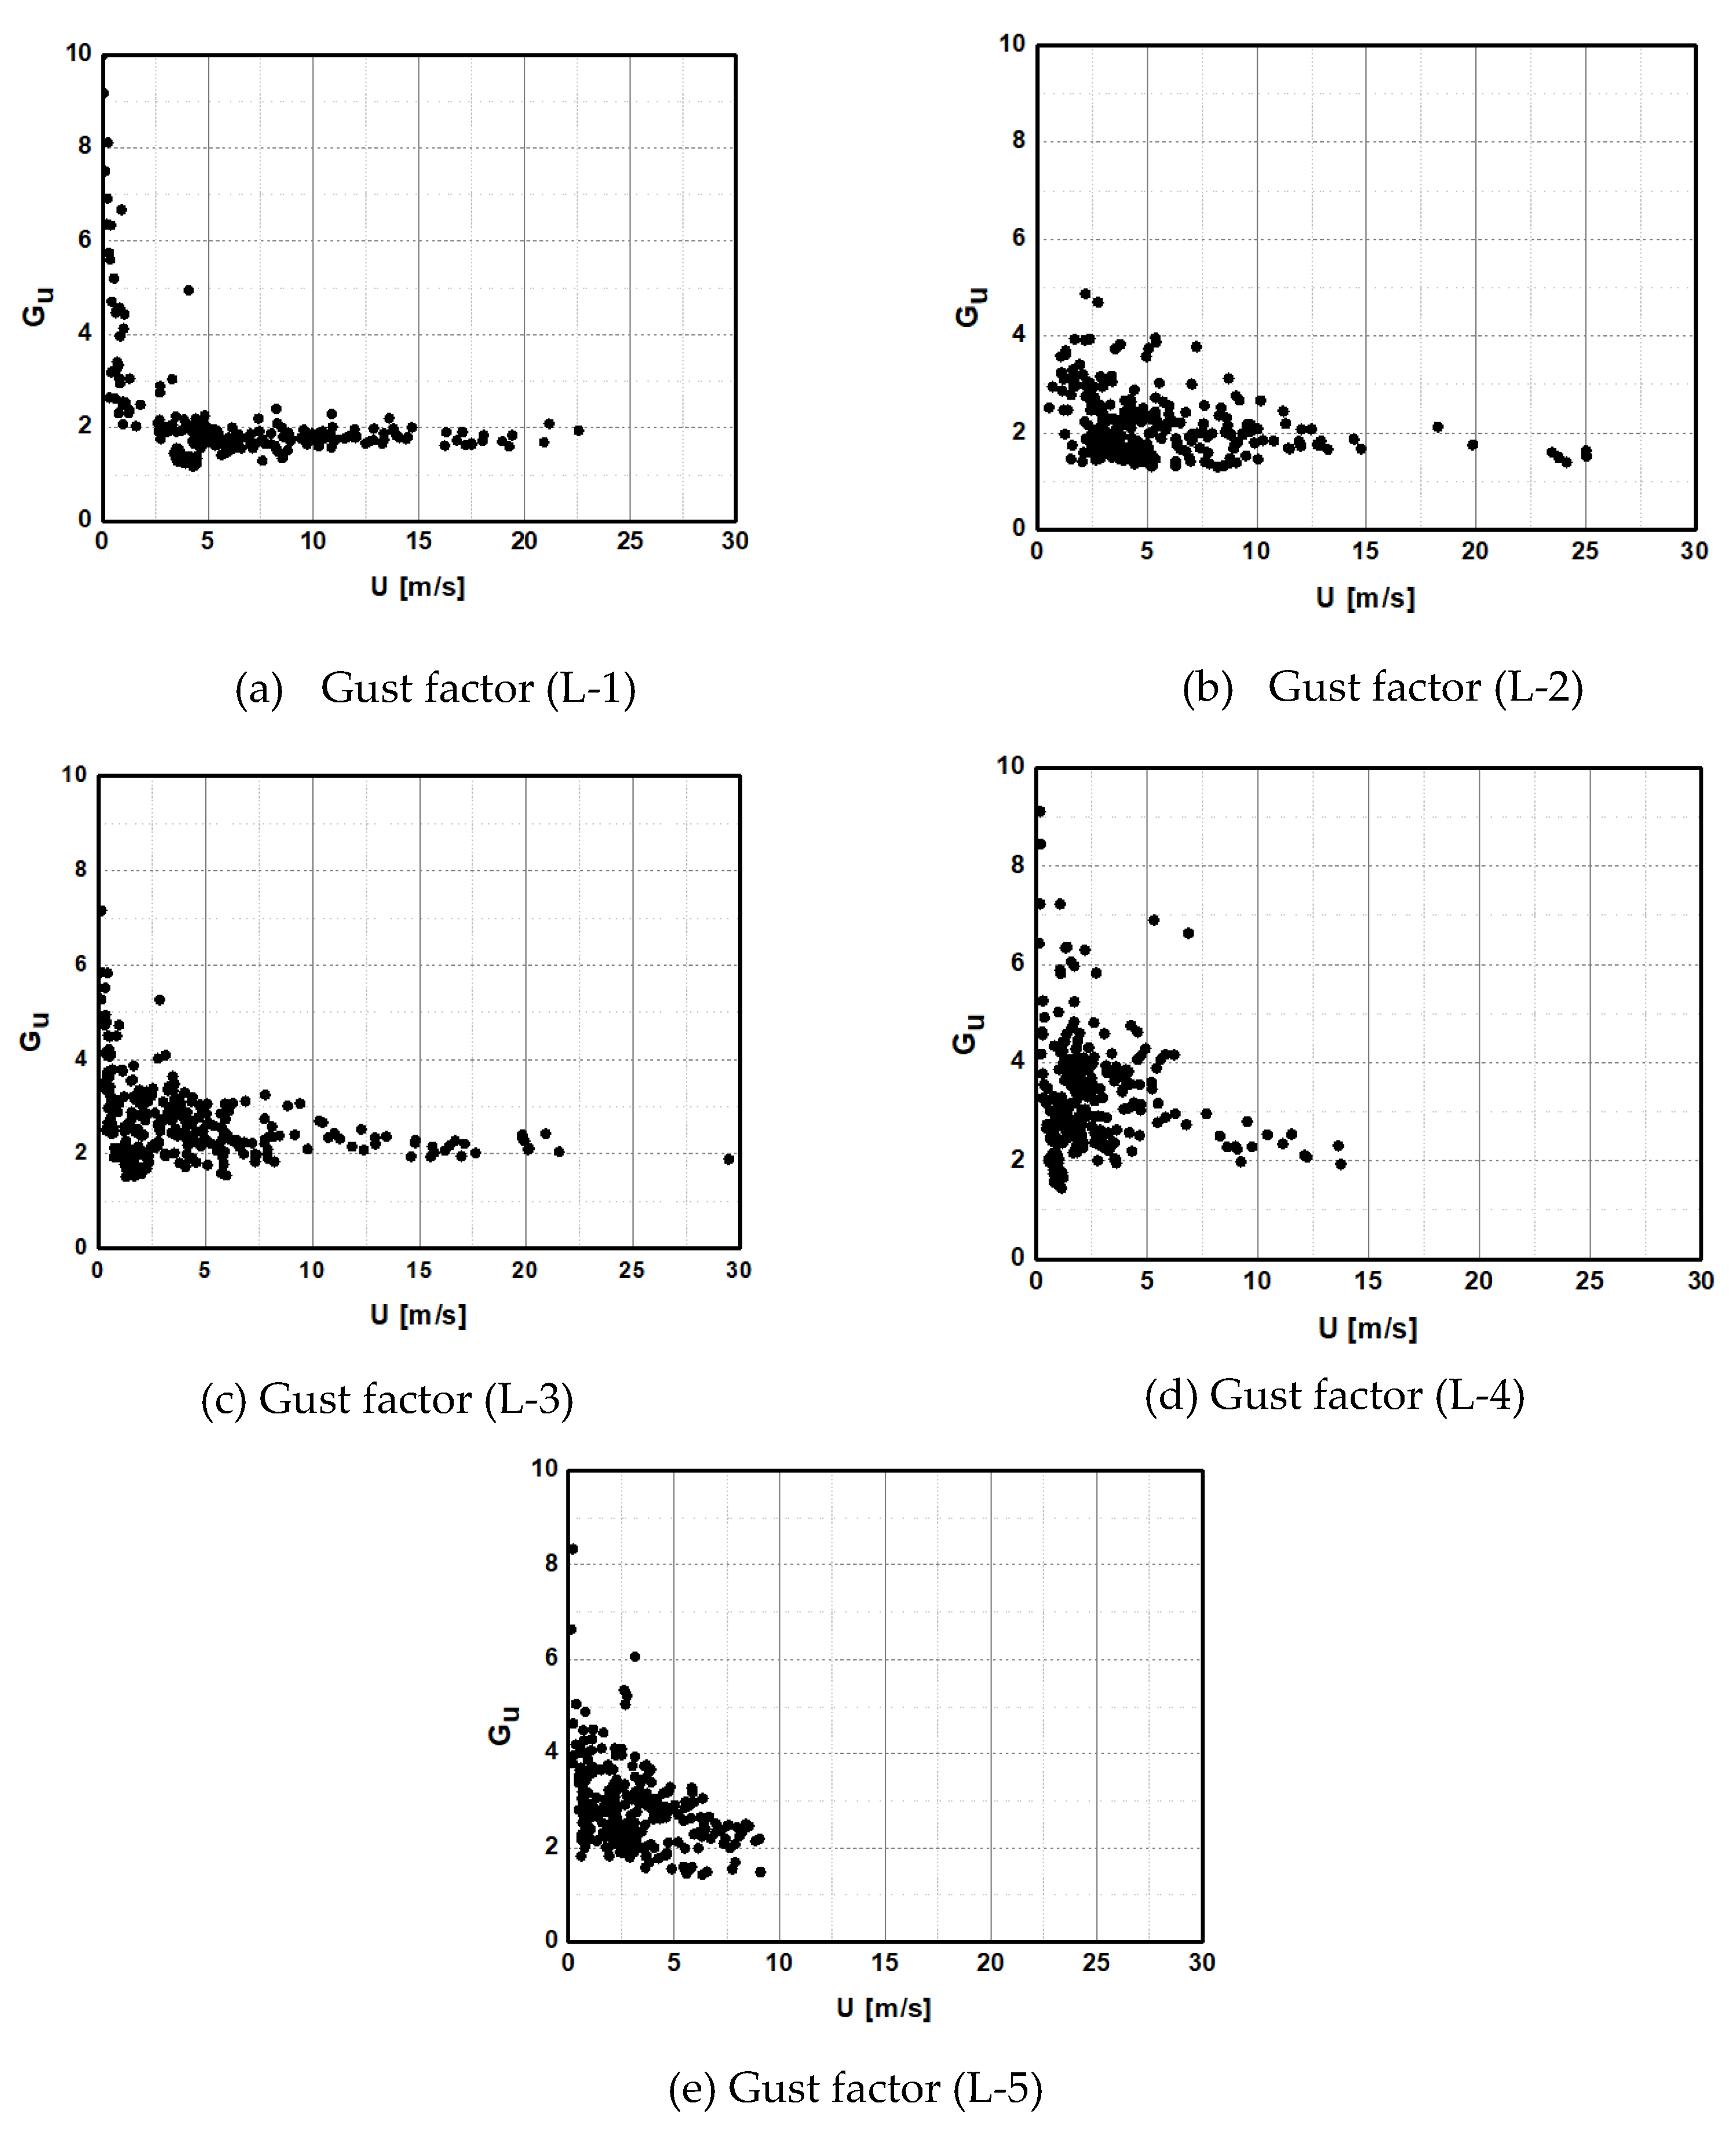
Table 3.
Beaufort Wind Scale.
| Beaufort Number | Description | Wind speed (m/s) |
| 0 | Calm | 0 ~ 0.2 |
| 1 | Light air | 0.3 ~ 1.5 |
| 2 | Light breeze | 1.6 ~ 3.3 |
| 3 | Gentle breeze | 3.4 ~ 5.4 |
| 4 | Moderate breeze | 5.5 ~ 7.9 |
| 5 | Fresh breeze | 8.0 ~ 10.7 |
| 6 | Strong breeze | 10.8 ~ 13.8 |
| 7 | Near gale | 13.9 ~ 17.1 |
| 8 | Gale | 17.2 ~ 20.7 |
| 9 | Severe gale | 20.8 ~ 24.4 |
| 10 | Storm | 24.5 ~ 28.4 |
| 11 | Violent storm | 28.5 ~ 32.6 |
| 12 | Hurricane | 32.7 ~ |
Table 4.
The relationship between evaluation time of instantaneous wind speed and .
| Evaluation time | 1 | 5 ~ 10 | 30 |
| 1.5 ~ 1.7 | 1.3 | 1.2 |
Disclaimer/Publisher’s Note: The statements, opinions and data contained in all publications are solely those of the individual author(s) and contributor(s) and not of MDPI and/or the editor(s). MDPI and/or the editor(s) disclaim responsibility for any injury to people or property resulting from any ideas, methods, instructions or products referred to in the content. |
© 2023 by the authors. Licensee MDPI, Basel, Switzerland. This article is an open access article distributed under the terms and conditions of the Creative Commons Attribution (CC BY) license (http://creativecommons.org/licenses/by/4.0/).
Copyright: This open access article is published under a Creative Commons CC BY 4.0 license, which permit the free download, distribution, and reuse, provided that the author and preprint are cited in any reuse.


