Submitted:
25 January 2023
Posted:
30 January 2023
Read the latest preprint version here
Abstract
The second-order factor effect of burner optical ports and Edge inter-matrices (EIM) and the first one of pressure on soot formation process and behaviour of premixed sooting-flame in a high-pressure burner are numerically investigated here. Three-dimensional CFD simulations of a premixed flame C2H4/air at p = 1.01 and 10 bar using one-step chemistry approach are first performed to justify satisfied predictability of prospective axisymmetric bi-dimensional (2D) and one- dimensional (1D) simulations. The justified 2D-simulation approach shows the generation of an axial vorticity around the EIM and axial multi-vorticities due to the high expansion rate of burnt gases at the high-pressure of 10 bar. This leads to the development of axial multi-sooting zones, which are manifested experimentally by visible luminous soot streaks, and to boosting soot formation conditions of relatively low-temperature field, < 1800 K, and high-mixing rate of gases in combustion around and above the EIM location. Nevertheless, tolerable effect on the axial soot volume fraction (fV) profile, fV < 3%, is manifested only at high heights above burner of the atmospheric sooting-flame C2H4/air phi = 2.1 and early at the high-pressure 10 bar of this flame, fV < 10%. Enhancing the combustion process reactivity by decreasing the rich equivalence ratio of fuel/air mixture and/or rising the pressure results prior formation of soot precursors which shifts the sooting zone upstream.
Keywords:
CFD simulation
; flat flame
; high-pressure burner
; soot formation
; premixed flame
1. Introduction
In many cases experimental data can be collected with high spatial resolution providing multi-dimensional information about important parameters such as temperature, species concentration, and soot particle properties. The prediction of these data implementing detailed and even an appropriate reduced chemistry is still very expensive in term of calculation time using 3D-simulation of combustion processes. Therefore, the validation of 1D and/or at least 2D-simulations for an experimental reactor, here an enclosed high-pressure burner, is a crucial step for the efficient exploitation of their predicted results.
Enclosed burners are often used to study species and particles formation at high- and low-pressure conditions in laboratory. This supports the development of detailed mechanisms and thermophysical models that descript this formation in function of fuel/additive/air mixture and operating conditions.
To study the effect of pressure on soot formation several enclosed burner designs were employed [1,2,3,4,5,6,7]. Generally, these burners are often equipped with multi-optical ports allowing flame investigation using various optical diagnostic techniques. Furthermore, the laminar premixed flat flame concept is frequently used to conduct combustion evaluation in laboratory flames. The burner design must be able to stabilise such flame and to maintain a laminar fuel/air mixture flow to generate a steady flame that approaches a quasi-one- dimensional reacting flow as those of McKenna burner [8,9,10,11,12,13,14]. The latter consist generally of a circular sintered bronze or stainless-steel plug through which a mixture of fuel and oxidizer flows. To decrease the external disturbance of surrounding air diffusion and heat transfer on a studied sooting-flame, two approaches are often employed. The more common one is by shielding the target sooting-flame by an inert-gas coflow at relatively high velocity near to those of the hot burned gases [15]. The second one, which is more efficient to limit the heat transfer with the surrounding, is the protection of the target sooting-flame by another well selected co-annular flame, which is often a slightly fuel-rich non-sooting methane/air flame [1,2,3,4,5,6]. Therefore, the inner matrix of target sooting-flame is surrounded by a co-annular one to envelop the shielding coflow of an inert gas or other premixed non-sooting flame mixture. A co-annular edge of about 2 mm of thickness separates generally the matrices, referred to here as Edge inter-matrices (EIM), which affects indeed the homogeneity of the radial profiles of gas temperature and concentration of species and soot especially at low Heights Above the Burner (HABs).
In sooting-flames, the partial pyrolysis of a parent fuel under fuel-rich conditions leads to the formation of soot precursors such as acetylene and benzene, leading to the formation of polycyclic aromatic hydrocarbons (PAHs). This process is often described based on gas-phase chemical kinetics mechanisms that provide species input to modeling the subsequent soot formation. The species growth eventually leads to soot inception/nucleation – one of the least understood steps in soot formation. The coalescence process occurs when a particle unites with another one. Adding soot precursors to a particle leads to a grows-up of the particle surface. The agglomeration process is the union of several of these previously formed particles. Detailed studies of soot nucleation in rich premixed flames have been done by Desgroux et al. [10,16,17]. This process occurs close to the flame front. At sub-atmospheric pressure, the zone of incipient soot formation is further enlarged and therefore easier to spatially resolve experimentally. Premixed low-pressure flame reactors are also often used to investigate the synthesis of nanoparticles [18,19,20].
Since most of the industrial applications of combustion occur at high-pressures, it is important to understand the effect of pressure on soot formation using numerical and experimental studies. The impact of pressure on soot concentration is still not fully understood. Studies such that of Gu et al. [21] and of Liu et al. [40] realise that the pressure increasing enhances all the soot formation processes (precursors forming, nucleation, coalescence and agglomeration processes) and thus the final soot volume fraction (fV) showed an approximate power-law relation with pressure. The pressure exponent for laminar premixed ethylene/air flame is found to be in the range of 1.4–2 depending to pressure and to HAB [6,7,22,23]. At this point, it is important to note that Heidermann et al. [7] attributed the appearance of luminous soot streaks in high-pressure sooting-flames to the non-planarity and inhomogeneity of the burner matrix.
Temperature is known to have a strong influence on soot formation, resulting in specific temperature regimes that promote or reduce soot formation. The temperature influence on the soot yield is especially strong at the low- and high-temperature threshold of the so-called bell-shaped curve that describes the soot yield as a function of temperature [24,25]. In the early soot formation zone, where the flame temperature is low, small aromatics and PAHs are formed in larger amounts, but the low-temperature hinders the reactive inception of these species and aliphatic radicals to condense into first nuclei [26]. At higher temperatures, oxidation is very active in the secondary oxidation zone of the flame, thus destroying PAHs that are then not available for formation of larger species. Consequently, soot inception is reduced and only particularly stable structures such as graphene are formed [27,28]. In the intermediate temperature range, the temperature is ideal for the formation of PAHs and their transformation to soot particles [24].
As the aim of this work is to investigate the second order effect of burner optical ports and EIM and the first one of pressure on the soot formation evaluation and premixed sooting-flame behaviour, especially that of the appearance of luminous soot streaks in high-pressure sooting-flames, we first investigate by 3D-simulations the ability to justify 2D- and/or 1D-simulations to predict the centerline profiles of gas temperature, species and soot concentration and particle size for the investigation of laminar premixed sooting-flames in an enclosed high-pressure burner. 2D- and 1D-simulation predictions of ethylene/air sooting-flames data conducted using the same enclosed burner by Mi et al. [6] are then performed as a demonstration study. Afterword, the justified 2D-simulation approach is implemented to investigate the target effects of EIM and pressure on sooting-flame evaluation and behaviour. The highest pressure, 10 bar, experimentally investigated by Mi et al. [6] is chosen for the high-pressure study in order to obtain a distinct effect of pressure on the sooting-flame compared to atmospheric pressure.
2. Simulation conditions and approaches
To study soot formation of premixed fuel/air flames in the pressure range 1.01 – 30 bar, a high-pressure burner and its infrastructure has built at the Institute for Combustion and Gas Dynamics (IVG) of Duisburg-Essen university [2,4,5,6]. It consists, Figure 1, of a central burner with a diameter of 20 mm of a sintered stainless-steel plate (Siperm® R10, 10 mm thick), which is surrounded by a second burner with an outer diameter of 56 mm made of a sintered bronze disc (Siperm® B40, 22 mm thick) in which a copper cooling coil is embedded. The two burner matrices are surrounded by a ring of sintered bronze (Siperm® B40, 5 mm thick) through which is flown an air or dry nitrogen coflow to further stabilize the flame towards buoyancy effects and cool the exhaust gases by dilution. It also cools four thin quartz windows installed in the window ports close to the burner to avoid contact of keep hot exhaust gases and soot deposition off the outer quartz windows (19.5 mm thick) taking the pressure load. The burner housing is made from a solid block of stainless steel with a bore of 90 mm. The three burner matrices are kept at 300 K using a thermostat water flow. The burner housing and window flanges are cooled with water to keep the temperature at ~343 K.
As this enclosed burner, shown in Figure 1, equipped with four windows for the in-situ laser diagnostic measurements, which could affect the axisymmetric of the fields of gas flow, temperature and concentration of species and soot. 3D-simulations of the critical atmospheric nucleation flame [29] of ethylene/air ϕ = 1.77 are carried out to justify reasonable prediction of prospective 2D- and 1D-simulations for the prediction of this burner data. The CFD simulations are executed applying the laminar premixed flame approach of the Computational Fluid Dynamic Software Fluent under Ansys [30] with implementing the mech domain and boundary conditions presented in Figure 2. The inlet temperature of unburnt gas is set at 300 K and the lateral boundary condition equates the burner housing wall to the fixed temperature of 323 K. For the 3D-simulations, the one-step chemistry approach is adopted for the combustion of the inner target flame of ethylene/air mixture at its atmospheric near-threshold of sooting-flame ϕ = 1.77 [29] and of the co-flame of slightly rich methane/air ϕ = 1.2. As part of this justification of sufficiently enough good prediction of 2D- and 1D-simulations, the predicted cross-sectional distributions along windows (Win) and inter-windows (Int-win) axes of burner, shown in Figure 2, of gas temperature and radial gas velocity are compared and analysed. Considering the diffusion influence of the surrounding coflow species on the temperature and formed species fields of target flame mixture, tracer gases (1.e-5 in mole fraction) of acetylene as a soot precursor and hydrogen as a high diffusivity species and as an important species in the soot formation process are injected within the premixed fuel/air mixtures of the inner and outer flames, respectively. Their predicted mole fraction cross-sectional distributions are also compared and analysed.
For the demonstration study of 1D- and 2D-simulations predictivity and especially afterwards for the investigation of pressure and EIM effects on soot formation evaluation and flame behaviour, the measured fV using three-pass extinction in laminar premixed C2H4/air sooting-flames at pressure 1.01 and 10 bar for ϕ = 2.1 and at only 1.01 bar for ϕ = 2.34 by Mi et al. [6] using this burner is selected. The 2D-simulation is accomplished by Fluent under Ansys [30] with implementing the P-1 model to estimate the thermal radiation, the Moss–Brookes approach considering acetylene and ethylene as soot precursors [31] to predict the soot formation and the reduced mechanism of Luo et al. [32] for ethylene/methane mixtures combustion. Two soot formation models are available in Fluent because of their limited computational cost. Both the semi-empirical two-equation Moss-Brookes model considering acetylene and ethylene as soot precursors [31] and the Frenklach method of moments [33] were tested. The Moss-Brookes model was then adopted for its better prediction of the flame conditions investigated in this work. The effects of EIM and pressure on the soot formation evaluation and flame behaviour are investigated using this 2D-simulation approach. As the detailed chemistry mechanism of Saggese et al. [34] is still computationally very expensive to be used even in 2D-simulation, its relatively high performance is exploited here using 1D-simulation implementing the simulated centerline temperature profiles from the 2D-simulation. This 1D-simulation is performed using flat flame with a specified temperature profile approach of the software package Cantera [35] with switching off the energy equation. The temperature of burner housing is fixed at 343 K. The inlet velocities of the cold fuel/air mixtures of both target flame of C2H4/air ϕ = 2.1 and 3.34 and co-flame of CH4/air ϕ = 1.2 are set to 8 cm/s at 300 K and that of surrounded air coflow is set to 6 cm/s at 300 K (cf. Figure 2; inner burner, outer burner and coflow, respectively). All the simulations are performed at 1.01 and 10 bar.
3. Results and discussion
3.1. Justifying 2D- and 1D-simulation
Figure 3 presents a comparison between the temperature cross-sectional distributions along windows and inter-windows axes of burner for the both studied pressure 1.01 and 10 bar. The temperature field along the windows axis of burner is modestly cooler, < 50 K, than that along the inter-windows axis. This difference is due to the nearest low-temperature boundary condition of fixed temperature 343 K of burner housing wall along the inter-windows axis of burner. This relatively low-difference in temperature between the both cross-sectional axes is a reasonable justification for prospective axisymmetric 2D-simulation. Obviously, the temperature increases with pressure and the burned gas temperature of the slightly rich co-flame of methane/air ϕ = 1.2 (outer flame) is higher than that of the nucleation flame of ethylene/air ϕ = 1.77 (inner target flame). Figure 4 shows the significant influence of pressure on the centerline profiles of gas temperature and the temperature increase as a function of HAB of flames conducted in the studied enclosed burner without a stagnation plate of flame stabilization.
Similarly, comparable cross-sectional distributions of radial gas flow velocity are observed along windows and inter-windows axes of burner (cf. Figure 2) for the both studied pressure 1.01 and 10 bar, as shown in Figure 5, with slightly more non-homogeneity in the distribution of radial gas flow velocity along the windows axis which is affected by the holes of the burner windows. This is another reasonable justification for prospective axisymmetric 2D-simulations. An almost homogenous distribution of radial velocity is detected for the gas flow above the inner matrix of ethylene/air target flame with radial gas flow velocity in order of 5 mm/s, as shown in Figure 5. Furthermore, low percentage of radial to centerline flow velocity, < 0.5%, is predicted in Figure 6 for the both studied pressures. The two observations above show that it is practical to consider a one-dimensional flow of burnt gas, especially near the central axis of the burner.
Figure 7 presents a global flow map of tracer gases (1.e-5 in mole fraction) of acetylene and hydrogen injected into the premixed fuel/air mixtures of the inner and outer flames, respectively. For the both studied pressures, the flow map of the outer flame shows significant tracer species diffusion into the 20 mm diameter zone of the inner target flame, especially at high HABs. Furthermore, an important heat transfer takes place between the relatively cold burner housing wall and shielding coflow of air, at 343 and 300 K, respectively, and the hot burnt gas of both flames (cf. Figure 3). These lateral species diffusion and heat transfer will indeed affect the combustion process and consequently the fields of gas temperature, formed species concentration and size and volume fraction of soot in the target flame. Therefore, the 1D-simulation of such an enclosed burner and flame configuration of a target flame shielded by a non-sooting co-flame would only be justifiable by implementing an experimental or a predicted centerline profile of temperature from 2D-simulation and switching-off the energy equation in this 1D-simulation.
3.2. Demonstration study
As a demonstration study of the predictability of 1D- and 2D-simulation approaches described in paragraph 2, the experimental data of Mi et al. [6] of measured fV using three-pass extinction in laminar premixed C2H4/air flames at pressure 1.01 and 10 bar for ϕ = 2.1 and at only 1.01 bar for ϕ = 2.34 is selected. A comparison between the experimental data and the 2D-simulation (2D-Sim) prediction of fV in function of HAB of these premixed C2H4/air flame conditions is presented in Figure 8. Despite the agreement in trend and in sequence order between the predicted data using Moss-Brookes model of soot formation and that measured by the three-pass extinction diagnostic, it’s clear that this model strongly overestimates the experimental data. Therefore, the prediction of this model could be used to obtain an overview of sooting-flames evaluation. Figure 9 presents the expected behaviour of the centerline temperature profiles predicted by the 2D-simulation of the studied flame conditions. At fixed pressure, here is the atmospheric pressure, as far as the flame becomes richer the flame temperature decreases and the temperature increases as a function of HAB for the both equivalence ratios. For fixed equivalence ratio ϕ = 2.1, the temperature increases as a function of pressure, here from 1.01 to 10 bar. Figure 10 shows a comparison between the experimental and the predicted centerline fV profiles using Cantera’s 1D-simulation and implementing the detailed mechanism of Saggese et al. [34] and the predicted centerline temperature profiles by the 2D-simulation, shown in Figure 9. The 1D-simulation predicts well the fV of leaner condition ϕ = 2.1 at atmospheric pressure. Nevertheless, and especially for high HABs, this simulation overestimates all the experimental data of the relatively high sooting conditions at 10 and 1.1 bar of ϕ = 2.1 and 2.34, respectively. The agreement in trend and in the order of magnitude of the predicted fV with the experimental data are much better than that predicted by Moss-Brookes model of the 2D-simulation.
This adequate agreement in evolution trend of the fV centerline profiles with respect to the experimental data of the 1D and 2D-simulation, presented in Figure 8 and Figure 10, could therefore be exploited in the following paragraph to investigate the effect of EIM and pressure on the evaluation and behaviour of sooting-flame.
3.3. Pressure and edge inter-matrices effect
CFD Simulation is indeed necessary to investigate numerically this EIM effect on soot formation process. Therefore, 2D-Simulations of the flame configuration and conditions, of premixed target flame C2H4/air at ϕ = 2.1 and 2.34 and p = 1.01 and 10 bar shielded by a co-flame CH4/air at ϕ = 1.2, are executed. A comparison between the predicted temperature and soot cross-section distributions of these flames is presented in Figure 11. At atmospheric pressure, the richer flame ϕ = 2.34 shows an expected lower gas temperature of about 30 K regarding that of the leaner one ϕ = 2.1, as shown in Figure 11a. As seen in Figure 11b, these atmospheric flames of ϕ = 2.1 and 2.34 produce fV in the ranges of 1-7 and 2-10 ppm, respectively. The effect of pressure on temperature and soot production of the target flame ϕ = 2.1 is presented in Figures 11c-d. They show that increasing the pressure from 1.01 to 10 bar, the gas temperature increases up to 200 K and fV increases from 1-7 ppm at atmospheric pressure to 50-300 ppm at 10 bar, with an expansion of the axial distribution of soot and a reduction of the radial one. The soot formation of the leaner atmospheric flame of ϕ = 2.1 starts earlier than that of the richer flame of ϕ = 2.34, as shown in Figure 11b. This refers to the higher reactivity of this leaner flame producing prior soot precursors and this also is applied to the earliest soot formation at the high-pressure combustion of 10 bar, as seen in Figure 11d. Increasing the pressure from atmospheric pressure to 10 bar at fixed inlet velocity of 8 cm/s of unburned gas implements a significant increase in the injected fuel mass flow rate from 12 to 119 gr/s/m2. This results in an increase in flame temperature and sooting zone length and a decrease in width as observed in Figures 11c and d, respectively. The effect of EIM between the inner target flame and co-flame manifests obviously in the temperature cross-sectional distribution of the atmospheric flames at only low HABs, < 10 mm, as shown in Figures 11a and c. The zone around the EIM location shows relatively lower gas temperature than its lateral zones, < 1800 K. The co-flame of methane/air shows a significant higher temperature, > 2000 K, than the target flame of ethylene/air at the high-pressure of 10 bar.
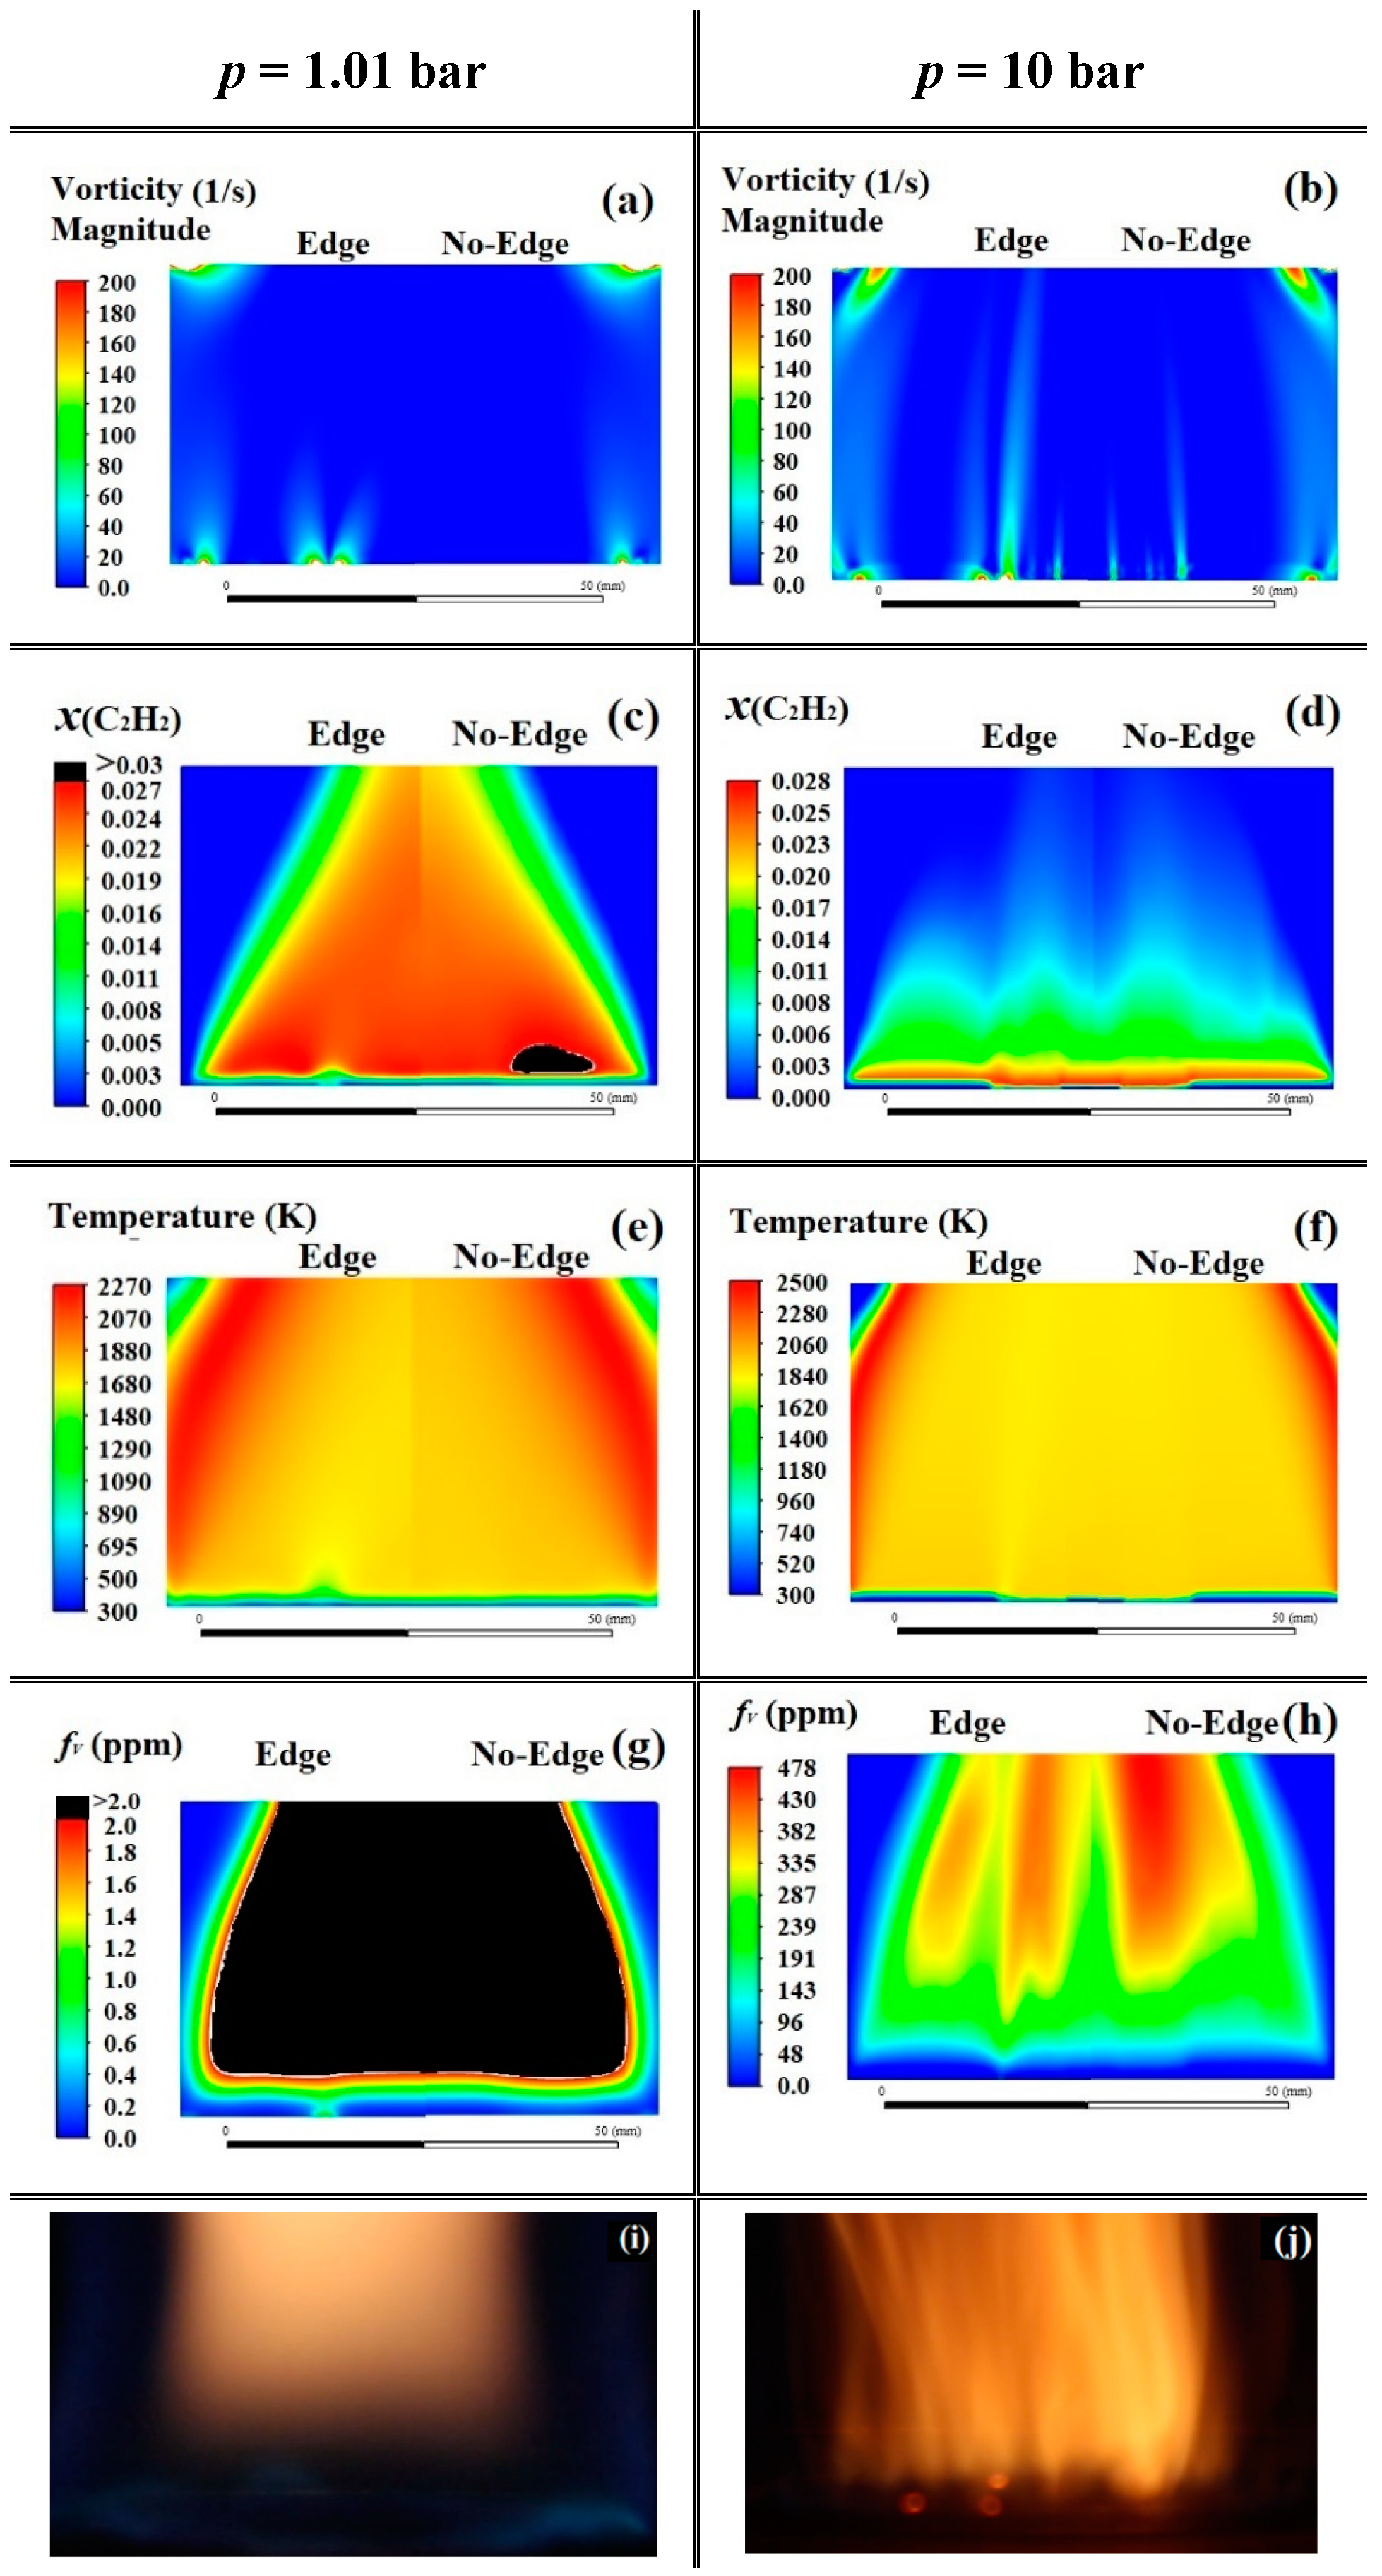
To quantify this EIM effect, the atmospheric target flame C2H4/air of ϕ = 2.1 at 8 cm/s (TF) of a 56 mm diameter burner matrix shielded by an air coflow at 6 cm/s (CF) is simulated by 2D-Simulation. Two target flame configurations are executed. The first one consists in injecting the C2H4/air mixture of ϕ = 2.1 using a 56 mm matrix, and the second one uses two co-annual matrices of 20 and 56 mm separated by a 2 mm thick edge. A comparison between the radial profiles of temperature, fV and mole fraction of acetylene as soot precursor and OH radical as soot oxidiser is plotted in Figure 12 at 5 and 20 mm HABs. At HAB 20 mm, the radial profiles of temperature, fV and mole fraction of acetylene and OH radical are almost identical with and without EIM, Figures 12a-b and 12c-d, respectively. At the low HAB 5 mm, relatively modest differences are detected between the radial profiles of temperature, acetylene and OH radical with and without EIM. These modest differences are only observed around and above the edge location. The radial profiles of fV for the both studied HABs don’t show any significant change. As we are also interested in this work in soot formation evaluation, it would be interesting to explore this effect on the centerline profile of fV. Figure 13 presents therefore a comparison between the centerline fV profiles predicted by the 2D-simulation of the ethylene/air flame ϕ = 2.1 at p = 1.01 and 10 bar with and without EIM. At atmospheric pressure, the EIM effect only manifests itself for high HABs, from 17 mm, by a slight increase in fV for the edge case. The relative lower gas temperature, < 1800 K, observed in the area around the edge location compared to its surroundings may be an explanation to this modest increase in soot yield. This is due to the known inhabit role of high temperature field, exceed 1800 K [24,25,36], and the boosting one, around 1700 K, on soot formation. This increase in fV of the EIM effect demonstrates obviously at earlier HABs, from 3 mm, for the high-pressure flame of 10 bar. To investigate the behaviour of the premixed sooting-flame C2H4/air ϕ = 2.1 with and without EIM at atmospheric pressure and at the high-pressure of 10 bar, a comparison between the cross-sectional distributions of vorticity magnitude, acetylene mole fraction, fV and gas temperature as a function of pressure and for the both cases with and without EIM, is presented in Figures 14a-h. For comparison with similar experimental flame behaviour, photos of this premixed sooting-flame C2H4/air ϕ = 2.1 but of 20 mm in diameter, shielded by a non-sooting flame of methane/air ϕ = 1.2 of 56 mm in diameter at pressure 1.01 and 10 bar are added as shown in Figure 14i-j.
The development of vorticity around the EIM, shown in Figure 14a, which is the tendency of a fluid particle to rotate or circulate at a particular point, results in improved fuel/air distribution and mixing [37]. The latter affects the reactivity of mixture in combustion and subsequently the rate of species and heat production. At high-pressure, the combustion of the premixed sooting-flame generates axial multi- vorticities due to the thermal expansion effects in the flame [38,39] as observed in Figure 14b. The high heat-release rate of mixture under compression leads to large changes in density of the combustion flow (high expansion rate) which generate vorticities. The generation of axial multi-vorticities at high-pressure leads to axial multi-inhomogeneities in species production as shown in Figures 14d and 14h for acetylene and soot, respectively, and observed experimentally as seen in Figure 14j. Therefore, the luminous soot streaks observed in in Figure 14j and by Heidermann et al. [7] are the results of the axial multi-vorticities generation at high-pressure premixed sooting-flame. As the axial edge-vorticity also occurs in an atmospheric flame and is the greatest at high-pressure, as shown in Figures 14a-b, the formation of acetylene and soot arises downwards in the area above the edge location, as observed in Figures14c-d and 14g-h. The 56 mm diameter atmospheric flame C2H4/air generates higher concentration of acetylene using a single burner matrix (No-Edge) compared to using two matrices separated by an edge, as shown in Figure 14c. The enhanced gas mixing due to the axial edge-vorticity, in the case of two coaxial-flames C2H4/air separated by an edge, results in a more homogenous distribution of this soot precursor, as demonstrated for high HABs in Figure 14c. This affects the temperature field, seen in Figure 14e, and subsequently the soot formation process and the spatial distribution of soot. At high-pressure, the maximum concentration of acetylene is mainly in the vicinity of the burner matrix; this soot precursor is rapidly consumed by the formation of soot and oxidation under these conditions of high reactivity compared to the atmosphere. The cooling effect of axial edge-vorticity on the temperature distribution is evident for both the atmospheric and the high-pressure flames, but the temperature distribution is more homogenous when there is no EIM, as seen in Figures 14e-f. The increase in mixing and then formation and distribution of soot due to the axial edge-vorticity, especially at high-pressure flame, results in higher centerline fV profile for the EIM case compared to the non-Edge case, especially for high HABs, as shown in Figure 13.
4. Conclusions
A three-dimensional CFD simulation using a one-step chemistry approach is carried out to investigate the ability to justify reasonably good predictivity of 1D- and 2D-simulation of an enclosed burner (cf. Figure 1), designed to study high-pressure premixed sooting-flame shielded by reactive and/or non-reactive coflows. It is shown that the four thin quartz windows installed flush with the burner inner wall have no significant effect on the cross-sectional distributions of temperature and radial flow along windows and inter-windows axes of burner. The latter justifies 2D axisymmetric simulation for the data prediction of this burner. Nevertheless, a significant diffusion of surrounding species is observed in the investigated sooting-flame mixture. The latter and the heat transfer with the enclosed burner wall and shielding coflows will indeed affect the fields of gas temperature, formed species concentration and size and volume fraction of soot. Therefore, the 1D-simulation of such enclosed burner and flame configuration is only justifiable by implementing an experimental or predicted centerline profile of temperature from CFD simulation with switching off the energy equation.
A demonstration study to validate the predictability of proposed 1D- and 2D-simulation approaches is carried out on the experimental fV data conducted by Mi et al. [6] using the same burner simulated above. The fV are measured using three-pass extinction in laminar premixed flames C2H4/air at pressure 1.01 and 10 bar for ϕ = 2.1 and at only 1.01 bar for ϕ = 2.34. The Moss-Brookes model of soot formation implemented in Fluent’s 2D-simulation strongly overestimates the experimental data by retaining its order of magnitude trend and sequence. The implemented detailed chemistry of Saggese et al. [34] and the centerline temperature profiles, predicted by the 2D-simulation, in Cantera‘s 1D-simulation predict the experimental data relatively well, especially for the atmospheric flame ϕ = 2.1 at all HABs and only at low HABs of the other investigated flames.
The trend adequate evolution of the boosted fV centerline profiles of the 2D-simulation with respect to the experimental data is then exploited to investigate the effect of pressure and EIM on soot formation evaluation and the behaviour of target premixed flames C2H4/air ϕ = 2.1 and 2.34 at p = 1.01 and 10 bar. For low HABs, < 10 mm, relatively modest differences are only observed, with and without edge, around and above the edge location between the radial profiles of temperature, acetylene as soot precursor and OH radical as soot oxidiser. The radial and centerline profiles of fV show, only at high pressure and HABs, relatively higher tolerable fV with edge compared to the case without edge.
The occurrence of axial-vorticity due to the EIM and axial multi-vorticities due to the thermal expansion effect in high-pressure premixed sooting-flame improves the burnt gas distribution and mixing. This then locally affects the reactivity of mixture in combustion generating axial-inhomogeneities in the fields of temperature and formed species and soot. These axial multi-zones of soot are manifested as luminous soot streaks observed in the high-pressure premixed sooting-flame.
The higher reactivity of the atmospheric flame ϕ = 2.1 compared to that of ϕ = 2.34 and the high-pressure flame ϕ = 2.1 at 10 bar compared to the atmospheric pressure one shows a sooting zone closer to the burner matrix of these more reactive flames than for the less reactive flames. This refers to the prior formation of soot precursors of the high reactive flames.
Increasing the pressure, while maintaining a fixed inlet velocity of unburnt gases, leads to a significant increase in the mass flow rate of fuel/air injected into the combustion process, resulting in a longer and smaller soot zone compared to low pressure.
These modelling observations indeed require experimental validation and further study to explore the effect of pressure, equivalence ratio and entry velocity on the location, shape and behaviour of the sooting-zone of premixed flame.
Acknowledgments
Financial support by the German Research Foundation (DFG) within the project “Soot nucleation in low-sooting high-pressure flames: Experiment and modeling” (No. 439059510) is gratefully acknowledged.
References
- M. Hofmann, W.G. Bessler, C. Schulz, H. Jander, Laser-induced incandescence for soot diagnostics at high pressures, Appl. Optics 42 (2003) 2052-2062.
- M. Hofmann, H. Kronemayer, B. Kock, H. Jander, C. Schulz, Laser-induced incandescence and multi-line NO-LIF thermometry for soot diagnostics at high pressures, In European Combustion Meeting, Louvain-la-Neuve, Belgium2005.
- M.S. Tsurikov, K.P. Geigle, V. KrÜGer, Y. Schneider-KÜHnle, W. Stricker, R. LÜCkerath, R. Hadef, M. Aigner, Laser-based investigation of soot formation in laminar premixed flames at atmospheric and elevated pressures, Combust. Sci. Technol. 177 (2005) 1835-1862.
- M. Leschowski, T. Dreier, C. Schulz, An automated thermophoretic soot sampling device for laboratory-scale high-pressure flames, Rev. Sci. Instrum. 85 (2014) 045103.
- M. Leschowski, T. Dreier, C. Schulz, A Standard Burner for High Pressure Laminar Premixed Flames: Detailed Soot Diagnostics, Zeitschrift für Physikalische Chemie, 2015, pp. 781-805.
- X. Mi, A. Saylam, T. Endres, C. Schulz, T. Dreier, Near-threshold soot formation in premixed flames at elevated pressure, Carbon 181 (2021) 143-154.
- T. Heidermann, H. Jander, H. Gg. Wagner, Soot particles in premixed C2H4–air-flames at high pressures (P=30–70 bar), Phys. Chem. Chem. Phys. 1 (1999) 3497-3502.
- F. Migliorini, S. De Iuliis, F. Cignoli, G. Zizak, How “flat” is the rich premixed flame produced by your McKenna burner?, Combust. Flame 153 (2008) 384-393.
- R. Hadef, K.P. Geigle, W. Meier, M. Aigner, Soot characterization with laser-induced incandescence applied to a laminar premixed ethylene–air flame, International Journal of Thermal Sciences 49 (2010) 1457-1467.
- P. Desgroux, X. Mercier, B. Lefort, R. Lemaire, E. Therssen, J.F. Pauwels, Soot volume fraction measurement in low-pressure methane flames by combining laser-induced incandescence and cavity ring-down spectroscopy: Effect of pressure on soot formation, Combust. Flame 155 (2008) 289-301.
- P. Desgroux, A. Faccinetto, X. Mercier, T. Mouton, D. Aubagnac Karkar, A. El Bakali, Comparative study of the soot formation process in a “nucleation” and a “sooting” low pressure premixed methane flame, Combust. Flame 184 (2017) 153-166.
- P. Desgroux, C. Betrancourt, X. Mercier. Development of highly sensitive quantitative measurements of nascent soot particles in flames by coupling cavity-ring-down extinction and laser induced incandescence for improving the understanding of soot nucleation process. In: editor^editors. OSA Technical Digest. In Laser Applications to Chemical, Security and Environmental Analysis; 2018/06/25 2018; Orlando, Florida: Optical Society of America. p. LTu5C.1.
- S. Bejaoui, S. Batut, E. Therssen, N. Lamoureux, P. Desgroux, F. Liu, Measurements and modeling of laser-induced incandescence of soot at different heights in a flat premixed flame, Appl. Phys. B 118 (2015) 449-469.
- Holthuis & Associates, The McKenna Flat Flame Burner, P.O. Box 1531, Sebastopol, CA 95473.
- C. Kim, F. Xu, P. Sunderland, A. El-Leathy, G. Faeth. Soot formation and oxidation in laminar flames. In: editor^editors. 44th AIAA Aerospace Sciences Meeting and Exhibit; 2006. p. 1508.
- T. Mouton, X. Mercier, M. Wartel, N. Lamoureux, P. Desgroux, Laser-induced incandescence technique to identify soot nucleation and very small particles in low-pressure methane flames, Appl. Phys. B 112 (2013) 369-379.
- D. Aubagnac-Karkar, A. El Bakali, P. Desgroux, Soot particles inception and PAH condensation modelling applied in a soot model utilizing a sectional method, Combust. Flame 189 (2018) 190-206.
- G. Skandan, Y.J. Chen, N. Glumac, B.H. Kear, Synthesis of oxide nanoparticles in low pressure flames, Nanostructured Materials 11 (1999) 149-158.
- C. Weise, A. Faccinetto, S. Kluge, T. Kasper, H. Wiggers, C. Schulz, I. Wlokas, A. Kempf, Buoyancy induced limits for nanoparticle synthesis experiments in horizontal premixed low-pressure flat-flame reactors, Combustion Theory and Modelling 17 (2013) 504-521.
- A.M. Pennington, H. Halim, J. Shi, B.H. Kear, F.E. Celik, S.D. Tse, Low-pressure flame synthesis of carbon-stabilized TiO2-II (srilankite) nanoparticles, Journal of Aerosol Science 156 (2021) 105775.
- M. Gu, F. Liu, J.-L. Consalvi, Ö.L. Gülder, Effects of pressure on soot formation in laminar coflow methane/air diffusion flames doped with n-heptane and toluene between 2 and 8 atm, Proc. Combust. Inst. 38 (2021) 1403-1412.
- H. Böhm, C. Feldermann, T. Heidermann, H. Jander, B. Lüers, H.G. Wagner, Soot formation in premixed C2H4-air flames for pressures up to 100 bar, Symposium (International) on Combustion 24 (1992) 991-998.
- H. Böhm, D. Hesse, H. Jander, B. Lüers, J. Pietscher, H.G.G. Wagner, M. Weiss, The influence of pressure and temperature on soot formation in premixed flames, Symposium (International) on Combustion 22 (1989) 403-411.
- Ciajolo, A. D'Anna, R. Barbella, A. Tregrossi, A. Violi, The effect of temperature on soot inception in premixed ethylene flames, Symposium (International) on Combustion 26 (1996) 2327-2333.
- K. Ishii, N. Ohashi, A. Teraji, M. Kubo. Soot formation in hydrocarbon pyrolysis behind reflected shock waves. In: editor^editors. Proc. 22nd Int. Colloquium on the Dynamics of Explosions and Reactive Systems; 2009. p.
- G. Prado, J. Lahaye, Physical Aspects of Nucleation and Growth of Soot Particles, in: D.C. Siegla, G.W. Smith (Eds.), Particulate Carbon: Formation During Combustion, Springer US, Boston, MA, 1981, pp. 143-175.
- R. Whitesides, M. Frenklach, Detailed Kinetic Monte Carlo Simulations of Graphene-Edge Growth, The Journal of Physical Chemistry A 114 (2010) 689-703.
- P. Fortugno, S. Musikhin, X. Shi, H. Wang, H. Wiggers, C. Schulz, Synthesis of freestanding few-layer graphene in microwave plasma: the role of oxygen, Carbon 186 (2021) 560-573.
- H. Bladh, N.-E. Olofsson, T. Mouton, J. Simonsson, X. Mercier, A. Faccinetto, P.-E. Bengtsson, P. Desgroux, Probing the smallest soot particles in low-sooting premixed flames using laser-induced incandescence, Proc. Combust. Inst. 35 (2015) 1843-1850.
- ANSYS® Academic Research Mechanical, Release 20.0.
- S.J. Brookes, J.B. Moss, Predictions of soot and thermal radiation properties in confined turbulent jet diffusion flames, Combust. Flame 116 (1999) 486-503.
- Z. Luo, T. Lu, J. Liu, A reduced mechanism for ethylene/methane mixtures with excessive NO enrichment, Combust. Flame 158 (2011) 1245-1254.
- M. Frenklach, Method of moments with interpolative closure, Chemical Engineering Science 57 (2002) 2229-2239.
- Saggese, S. Ferrario, J. Camacho, A. Cuoci, A. Frassoldati, E. Ranzi, H. Wang, T. Faravelli, Kinetic modeling of particle size distribution of soot in a premixed burner-stabilized stagnation ethylene flame, Combust. Flame 162 (2015) 3356-3369.
- R.L.S. David G. Goodwin, Harry K. Moffat, and Bryan W. Weber, Cantera: An object-oriented software toolkit for chemical kinetics, thermodynamics, and transport processes, https://www.cantera. [CrossRef]
- T.S. Wang, R.A. Matula, R.C. Farmer, Combustion kinetics of soot formation from toluene, Symposium (International) on Combustion 18 (1981) 1149-1158.
- Y. Zhang, Y. Huang, F. Wang, Y. Wu, Y. Xiao. Influence of Multi-Source Vortex Structure on the Mixing of Fuel/Air. In: editor^editors. 2010 Asia-Pacific Power and Energy Engineering Conference; 28-31 March 2010 2010. p. 1-4.
- N. Chakraborty, Influence of Thermal Expansion on Fluid Dynamics of Turbulent Premixed Combustion and Its Modelling Implications, Flow, Turbulence and Combustion 106 (2021) 753-848.
- Denet, V. Bychkov, Low vorticity and small gas expansion in premixed flame, Combust. Sci. Technol. 177 (2005) 1543-1566.
- P. Liu, C. Chu, I. Alsheikh, S.R. Gubba, S. Saxena, O. Chatakonda, J.W. Kloosterman, F. Liu, W.L. Roberts, Soot production in high pressure inverse diffusion flames with enriched oxygen in the oxidizer stream. Combustion and Flame, 2022. 245: p. 112378.
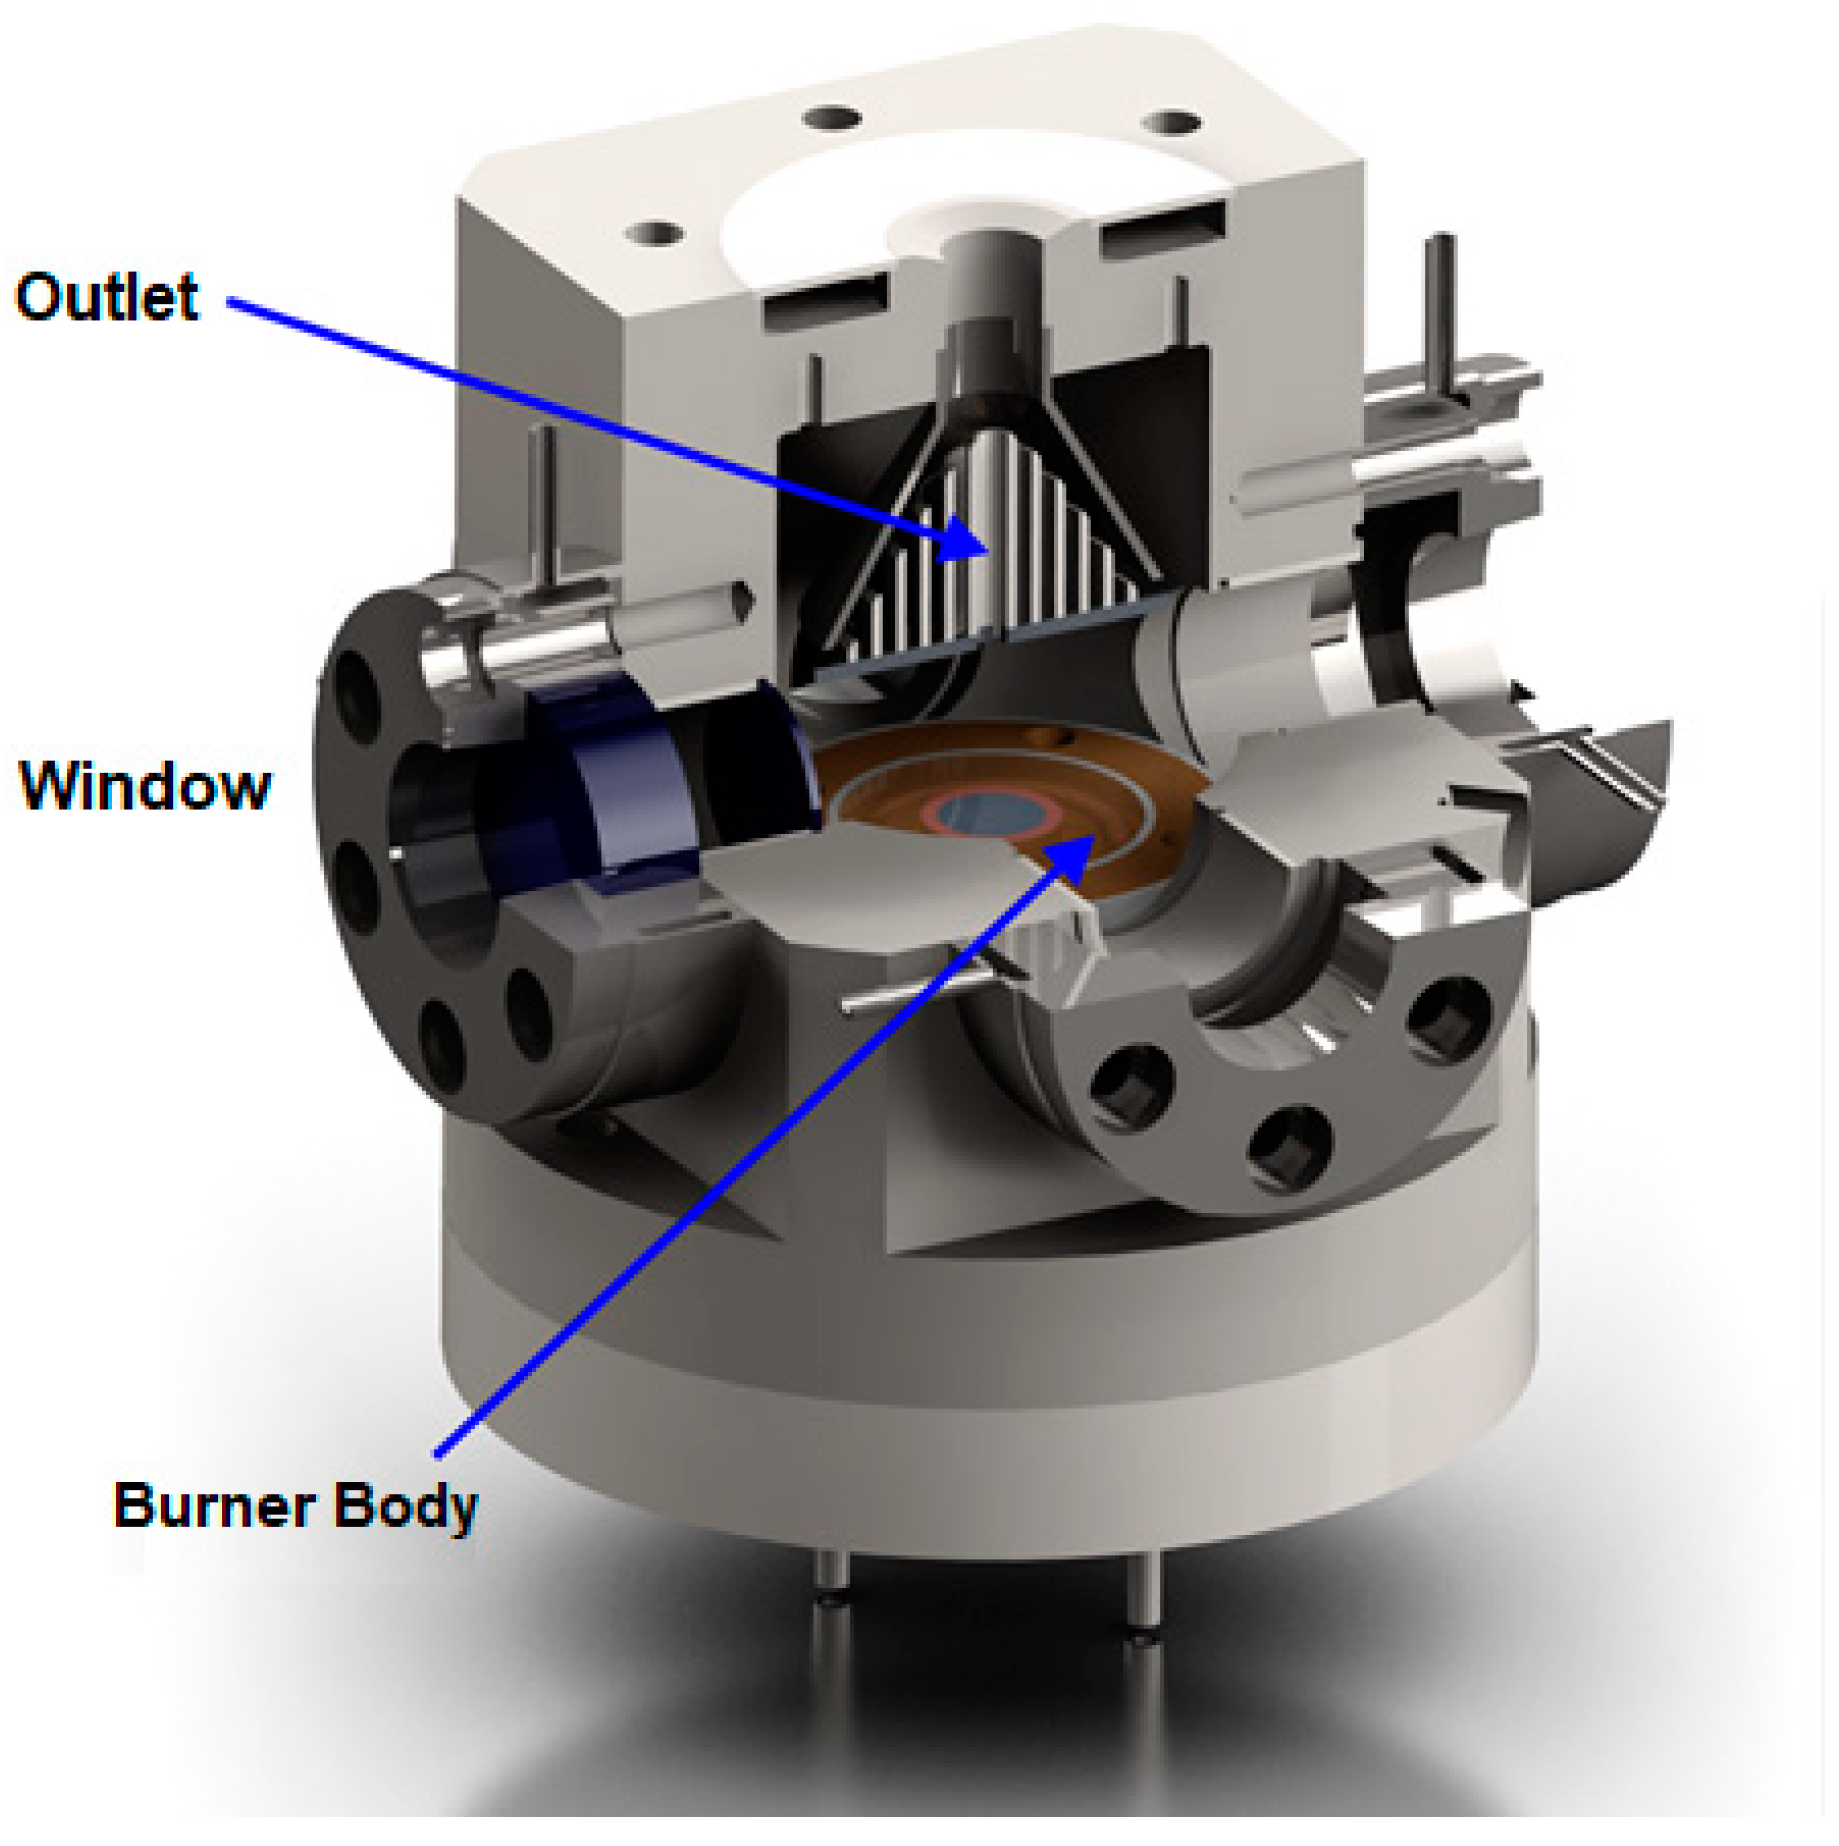
Figure 2.
3D of mech domain and boundary conditions and the 2D section of the enclosed burner inner volume.
Figure 2.
3D of mech domain and boundary conditions and the 2D section of the enclosed burner inner volume.
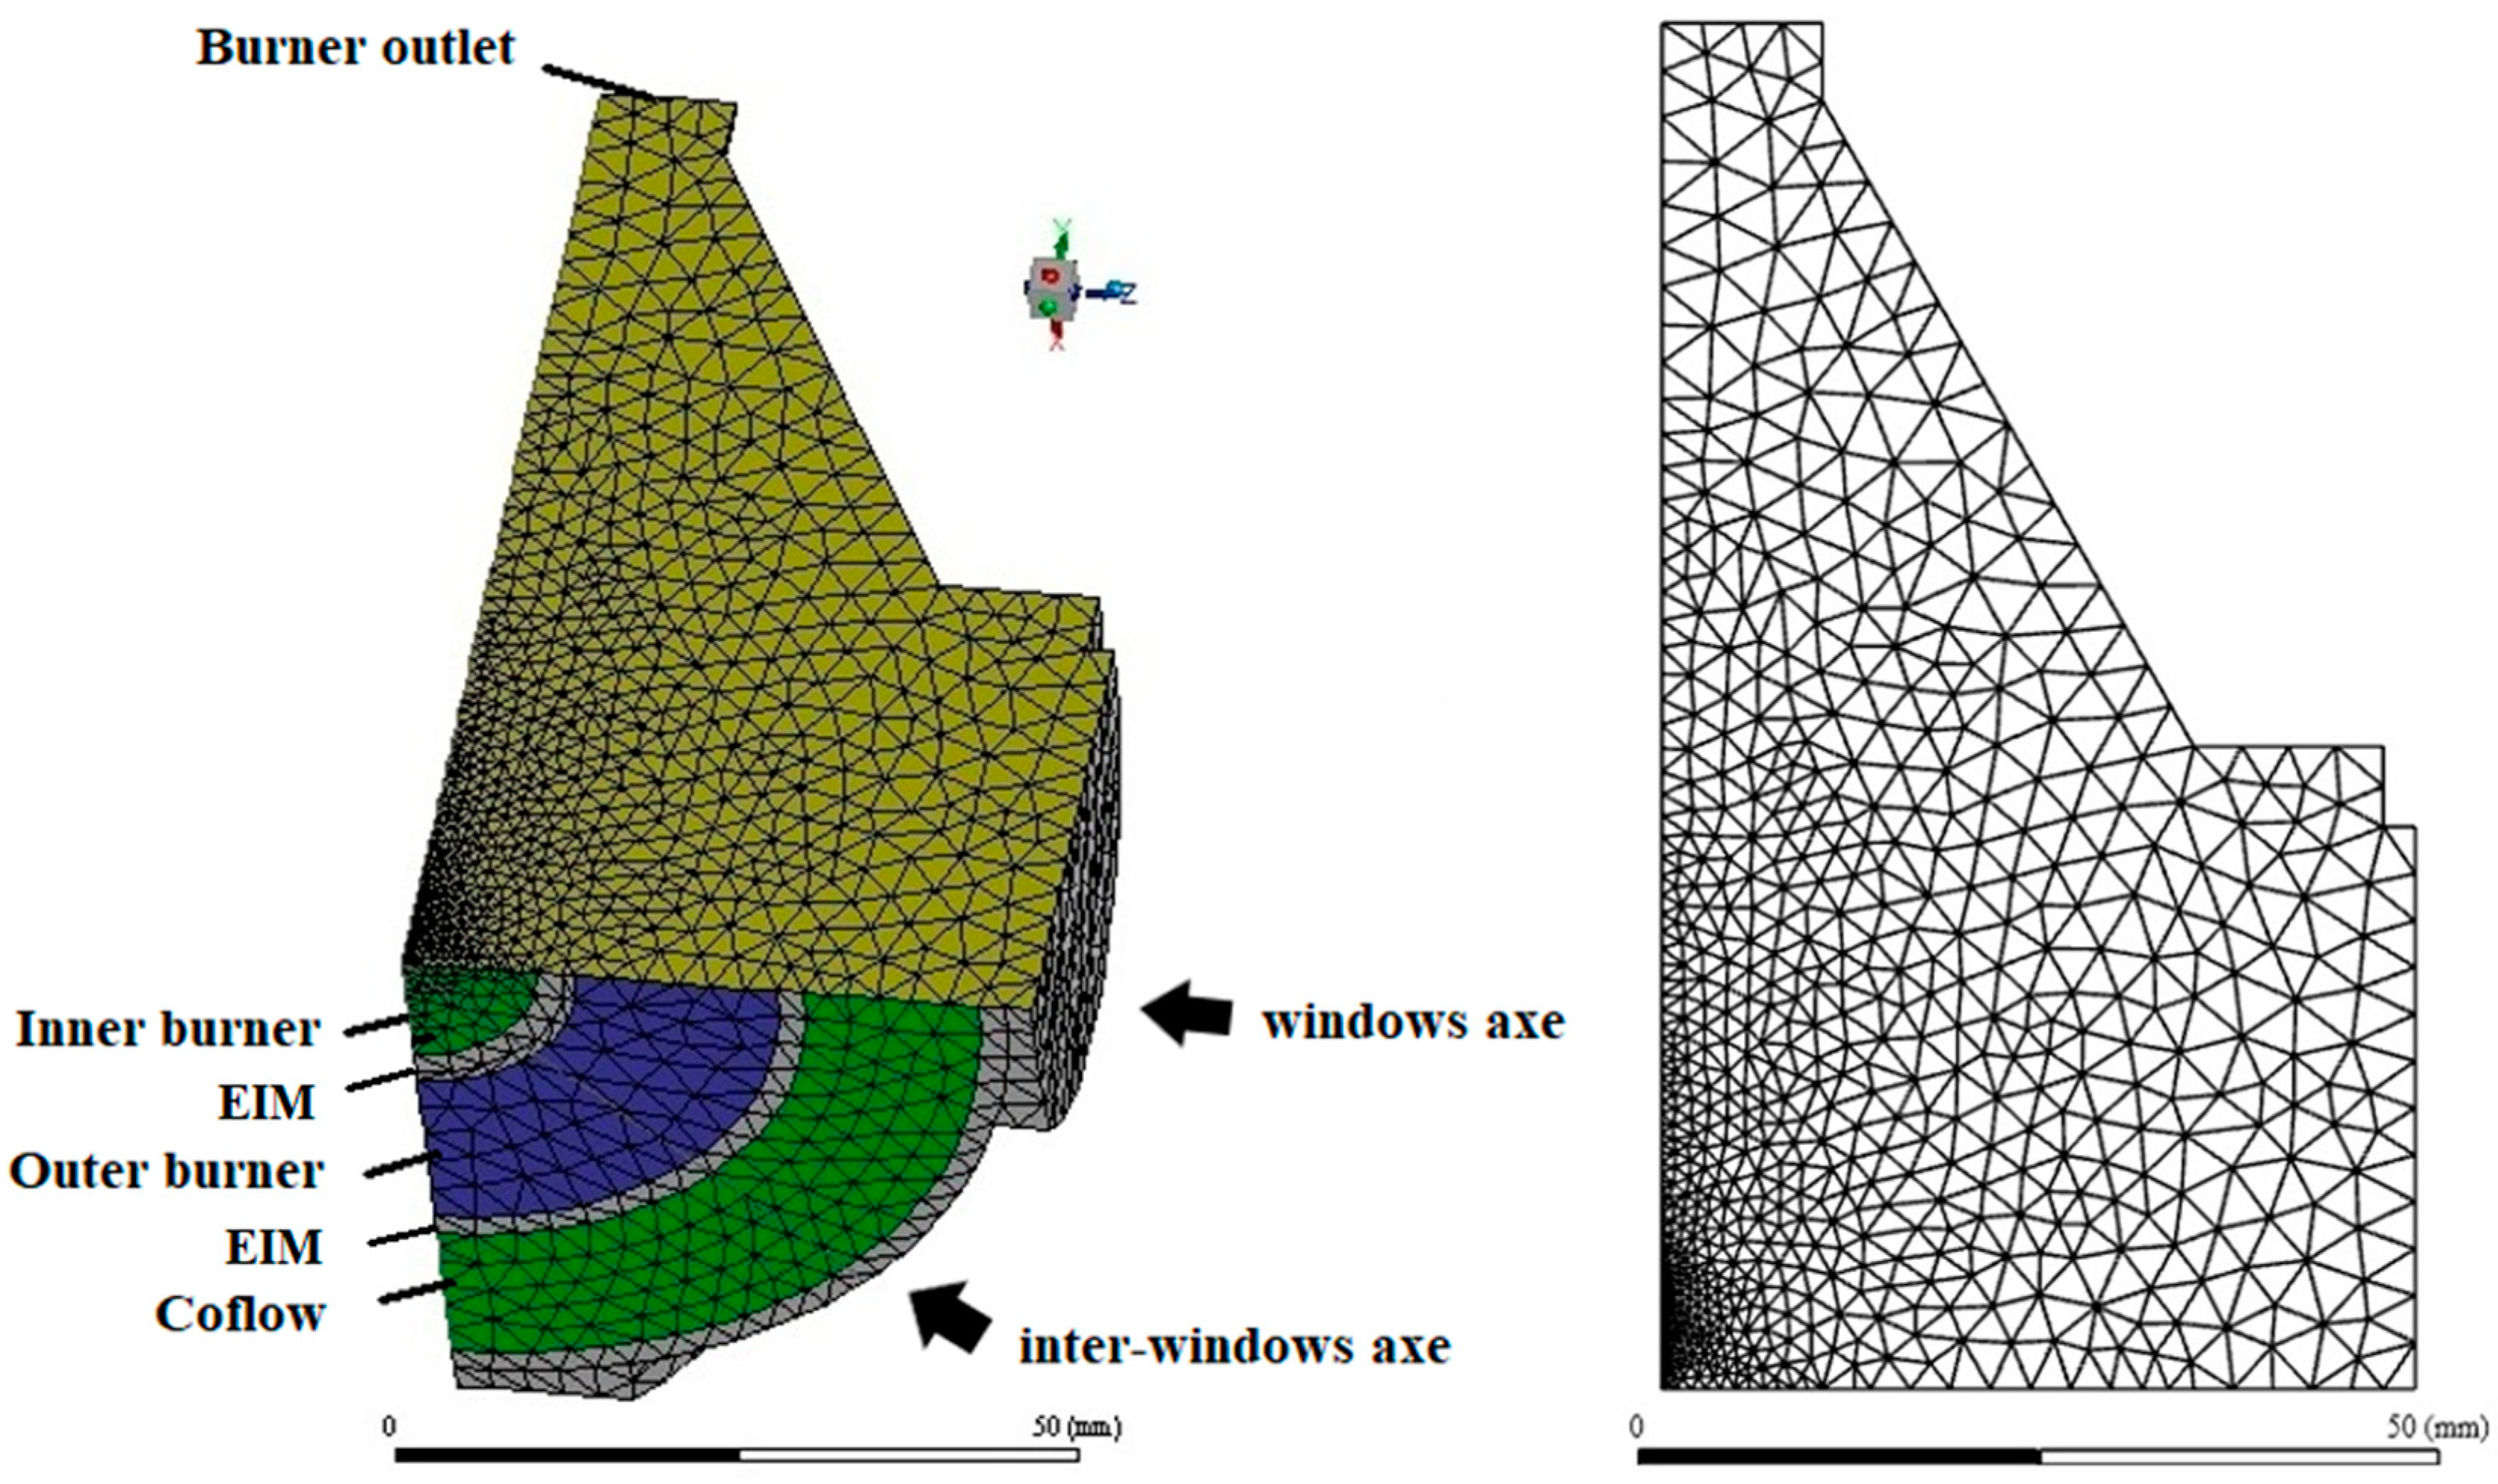
Figure 3.
Temperature cross-sectional distributions (K) along windows (Win) and inter-windows (Int-win) axes of burner of premixed flame C2H4/air ϕ = 1.77 at atmospheric pressure (a) and 10 bar (b).
Figure 3.
Temperature cross-sectional distributions (K) along windows (Win) and inter-windows (Int-win) axes of burner of premixed flame C2H4/air ϕ = 1.77 at atmospheric pressure (a) and 10 bar (b).
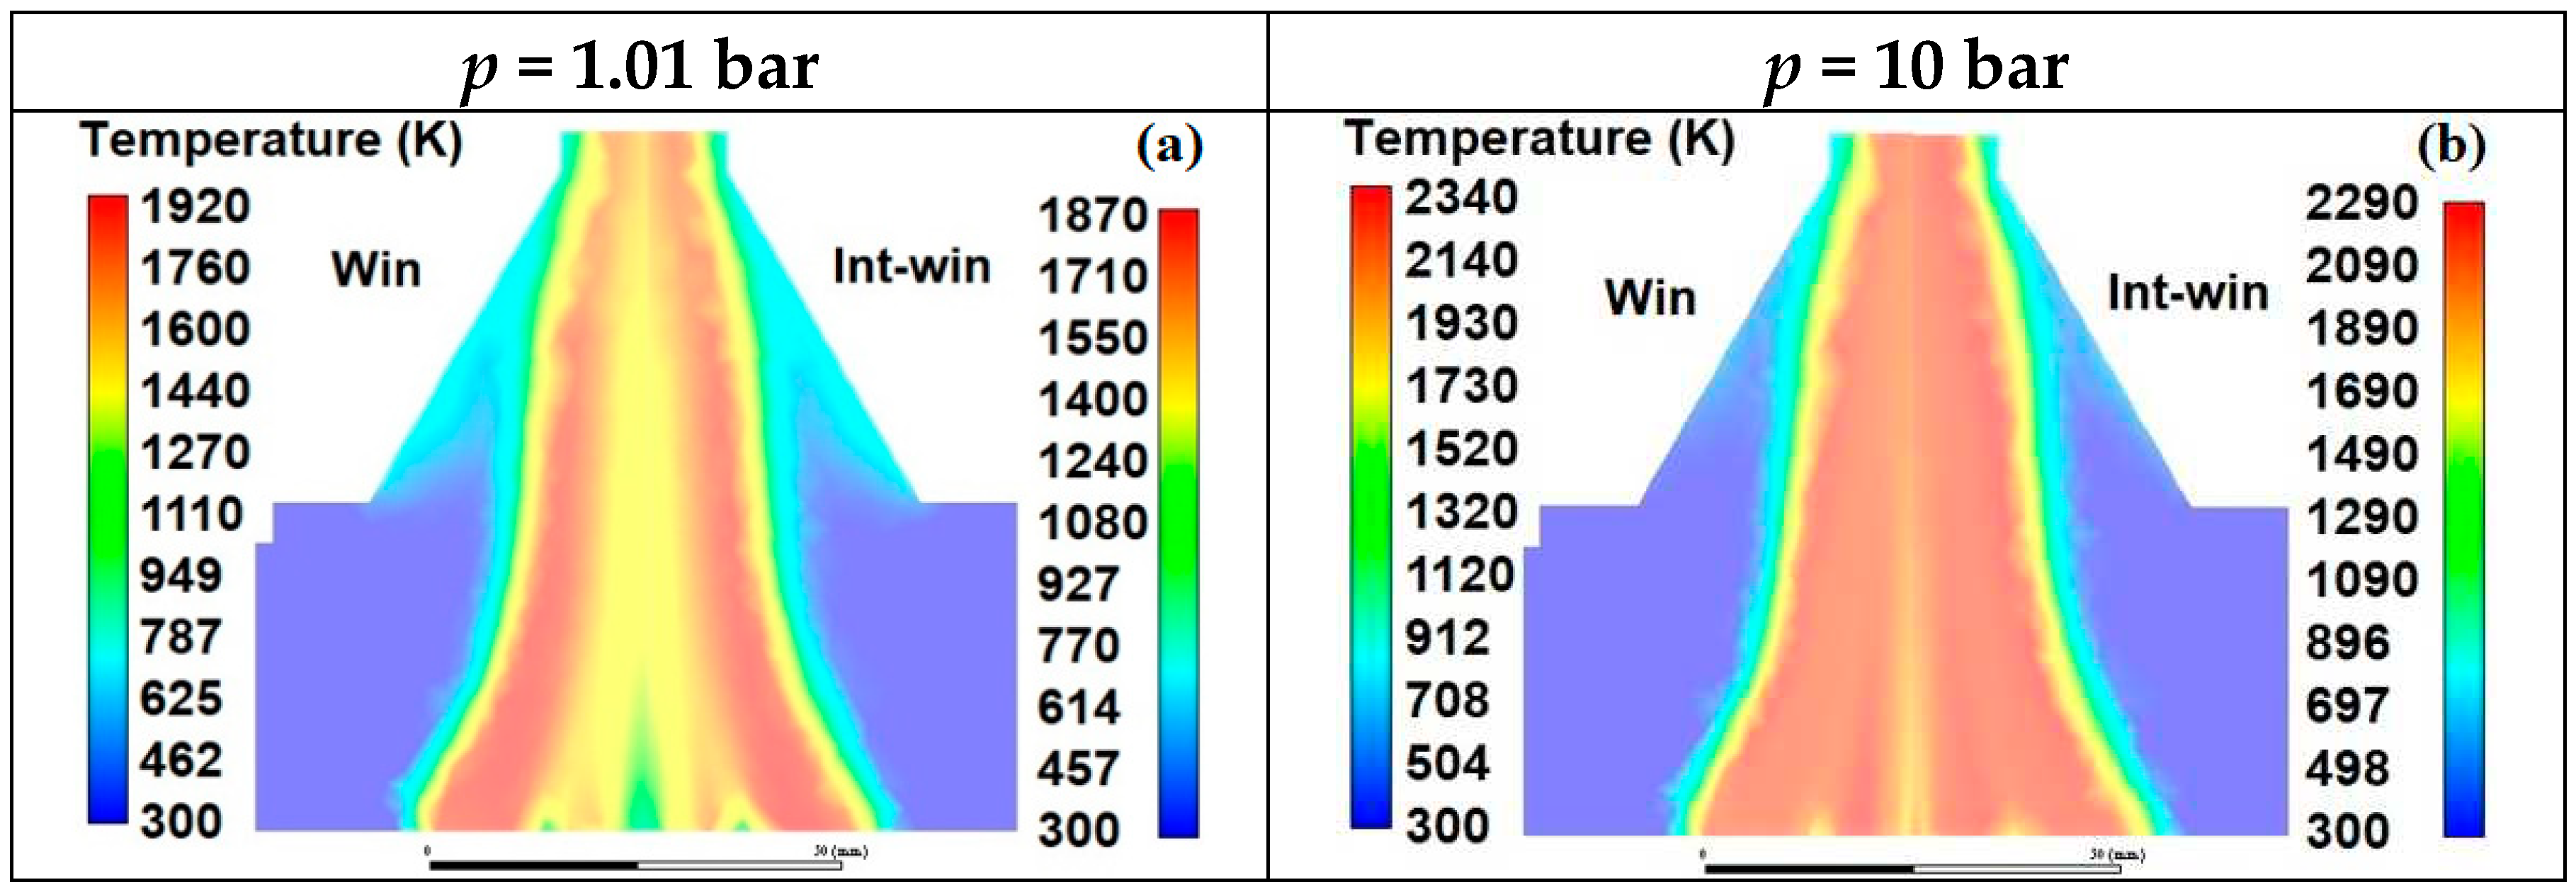
Figure 4.
Centerline flame temperature (K) in function of HAB (mm) of premixed flame C2H4/air ϕ = 1.77 at atmospheric pressure (dotted line) and 10 bar (solid line).
Figure 4.
Centerline flame temperature (K) in function of HAB (mm) of premixed flame C2H4/air ϕ = 1.77 at atmospheric pressure (dotted line) and 10 bar (solid line).
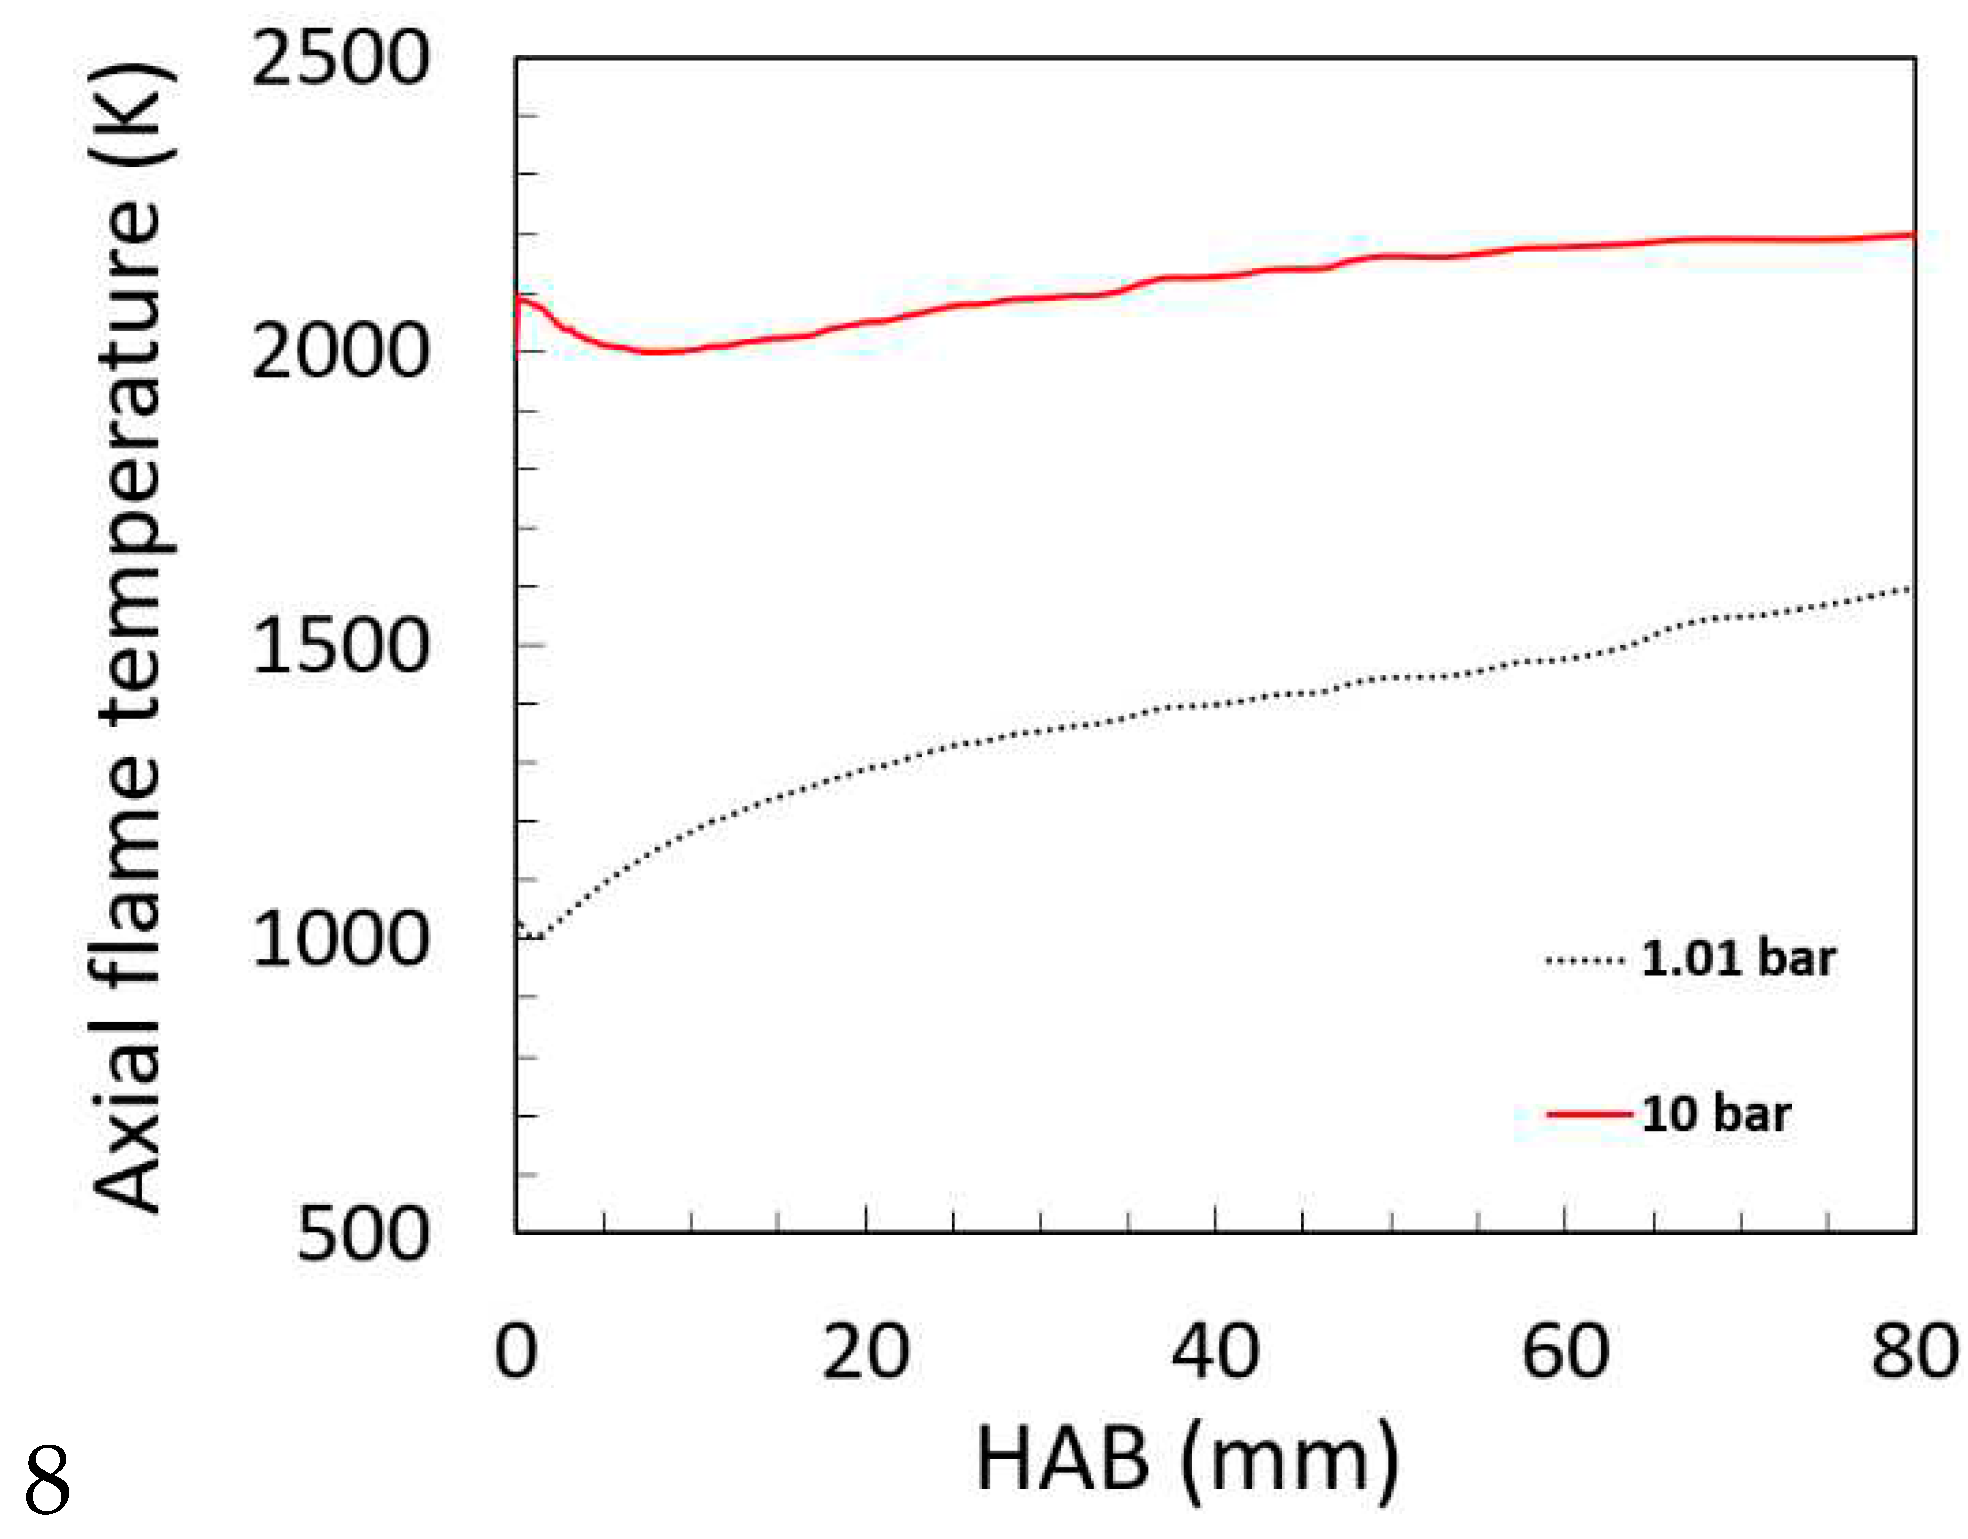
Figure 5.
Cross-sectional distribution of radial flow velocity (m/s) along windows and inter-windows axes of burner of premixed flame C2H4/air ϕ = 1.77 at atmospheric pressure (a) and 10 bar (b).
Figure 5.
Cross-sectional distribution of radial flow velocity (m/s) along windows and inter-windows axes of burner of premixed flame C2H4/air ϕ = 1.77 at atmospheric pressure (a) and 10 bar (b).
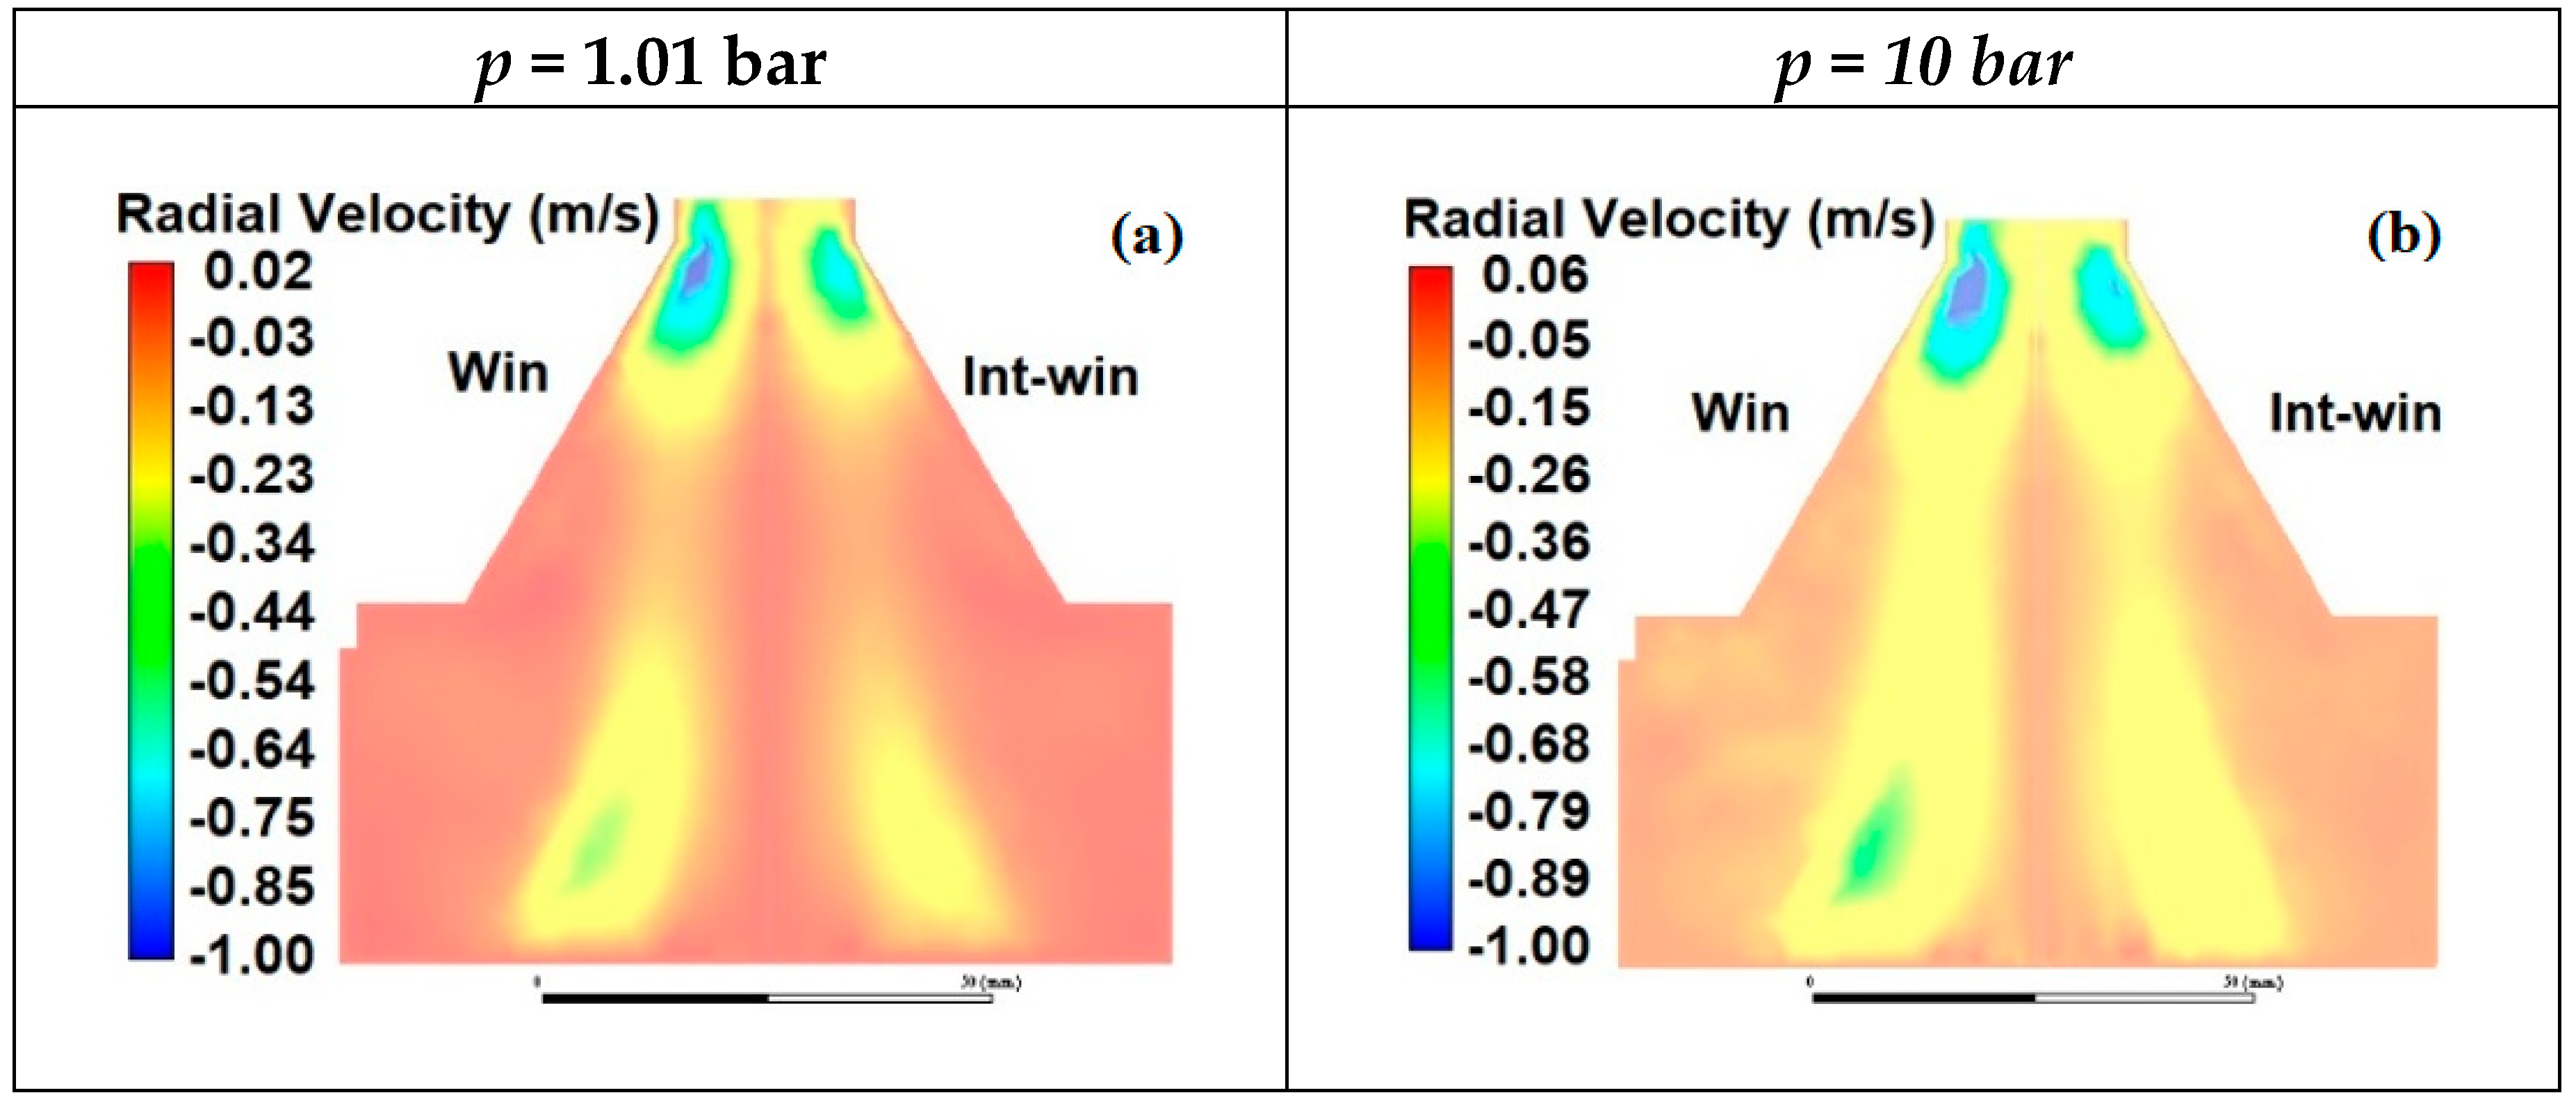
Figure 6.
Percentage of radial to centerline flow speed at flame central axe in function of HAB (mm) of premixed flame C2H4/air ϕ = 1.77 at atmospheric pressure (dotted line) and 10 bar (solid line).
Figure 6.
Percentage of radial to centerline flow speed at flame central axe in function of HAB (mm) of premixed flame C2H4/air ϕ = 1.77 at atmospheric pressure (dotted line) and 10 bar (solid line).
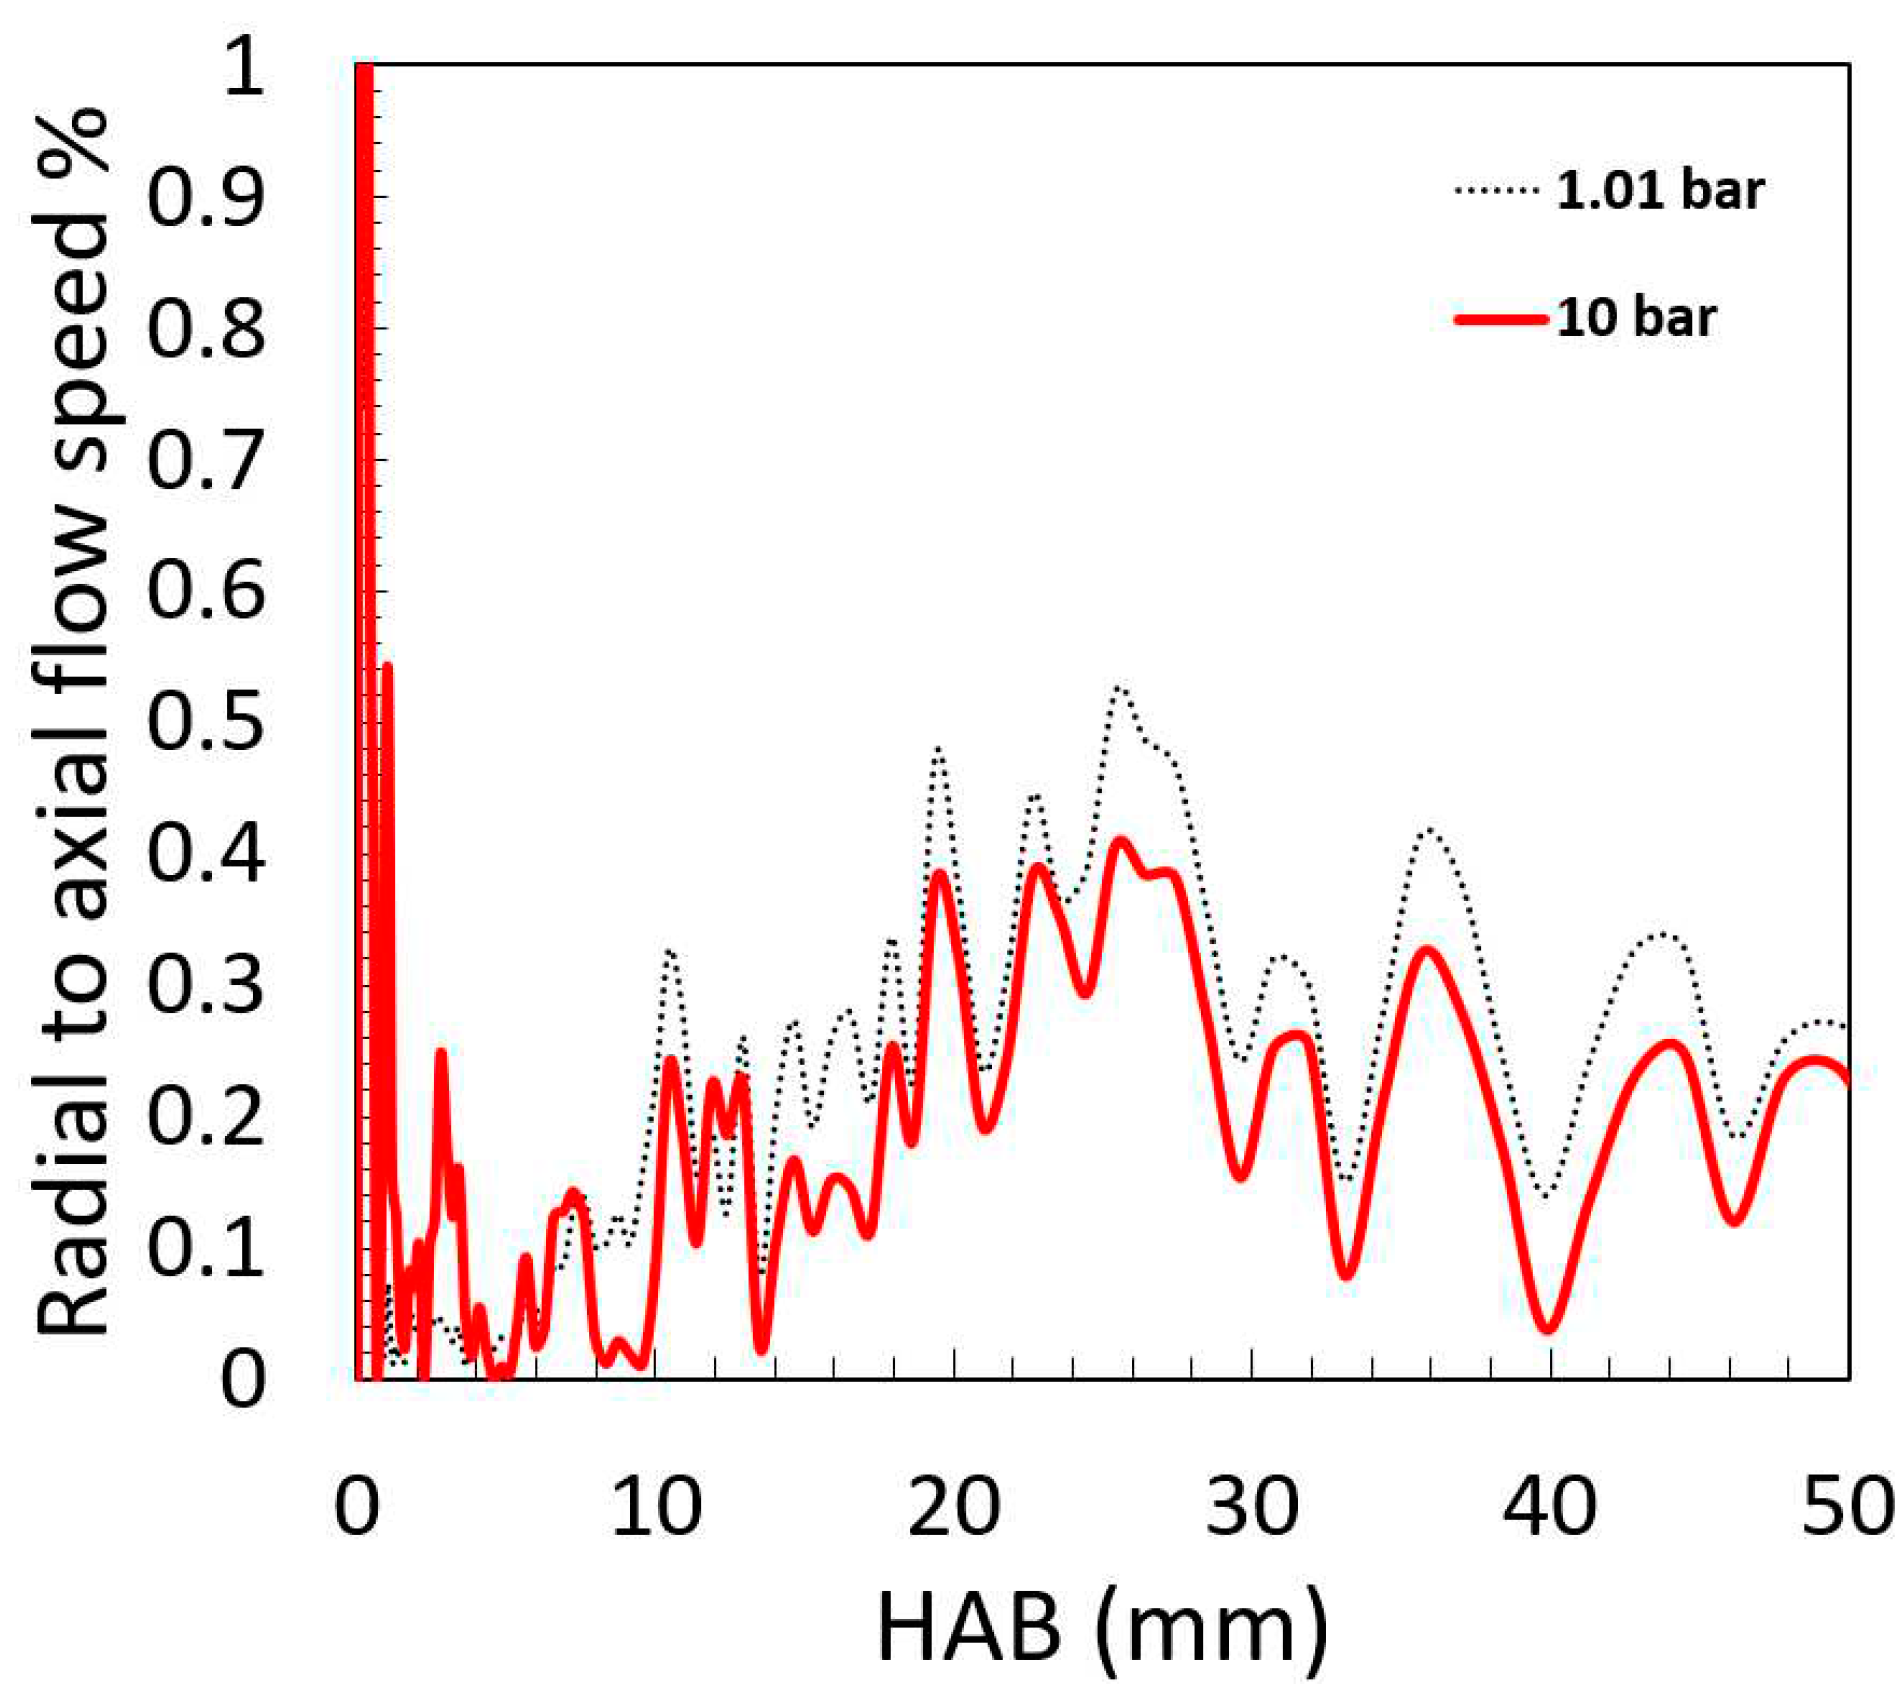
Figure 7.
Cross-sectional distribution of H2 and C2H2 tracer gases (mole fraction) in inner and outer premixed flames of C2H4/air ϕ = 1.77 and CH4/air ϕ = 1.2, respectively, at atmospheric pressure (a-b) and 10 bar (c-d).
Figure 7.
Cross-sectional distribution of H2 and C2H2 tracer gases (mole fraction) in inner and outer premixed flames of C2H4/air ϕ = 1.77 and CH4/air ϕ = 1.2, respectively, at atmospheric pressure (a-b) and 10 bar (c-d).
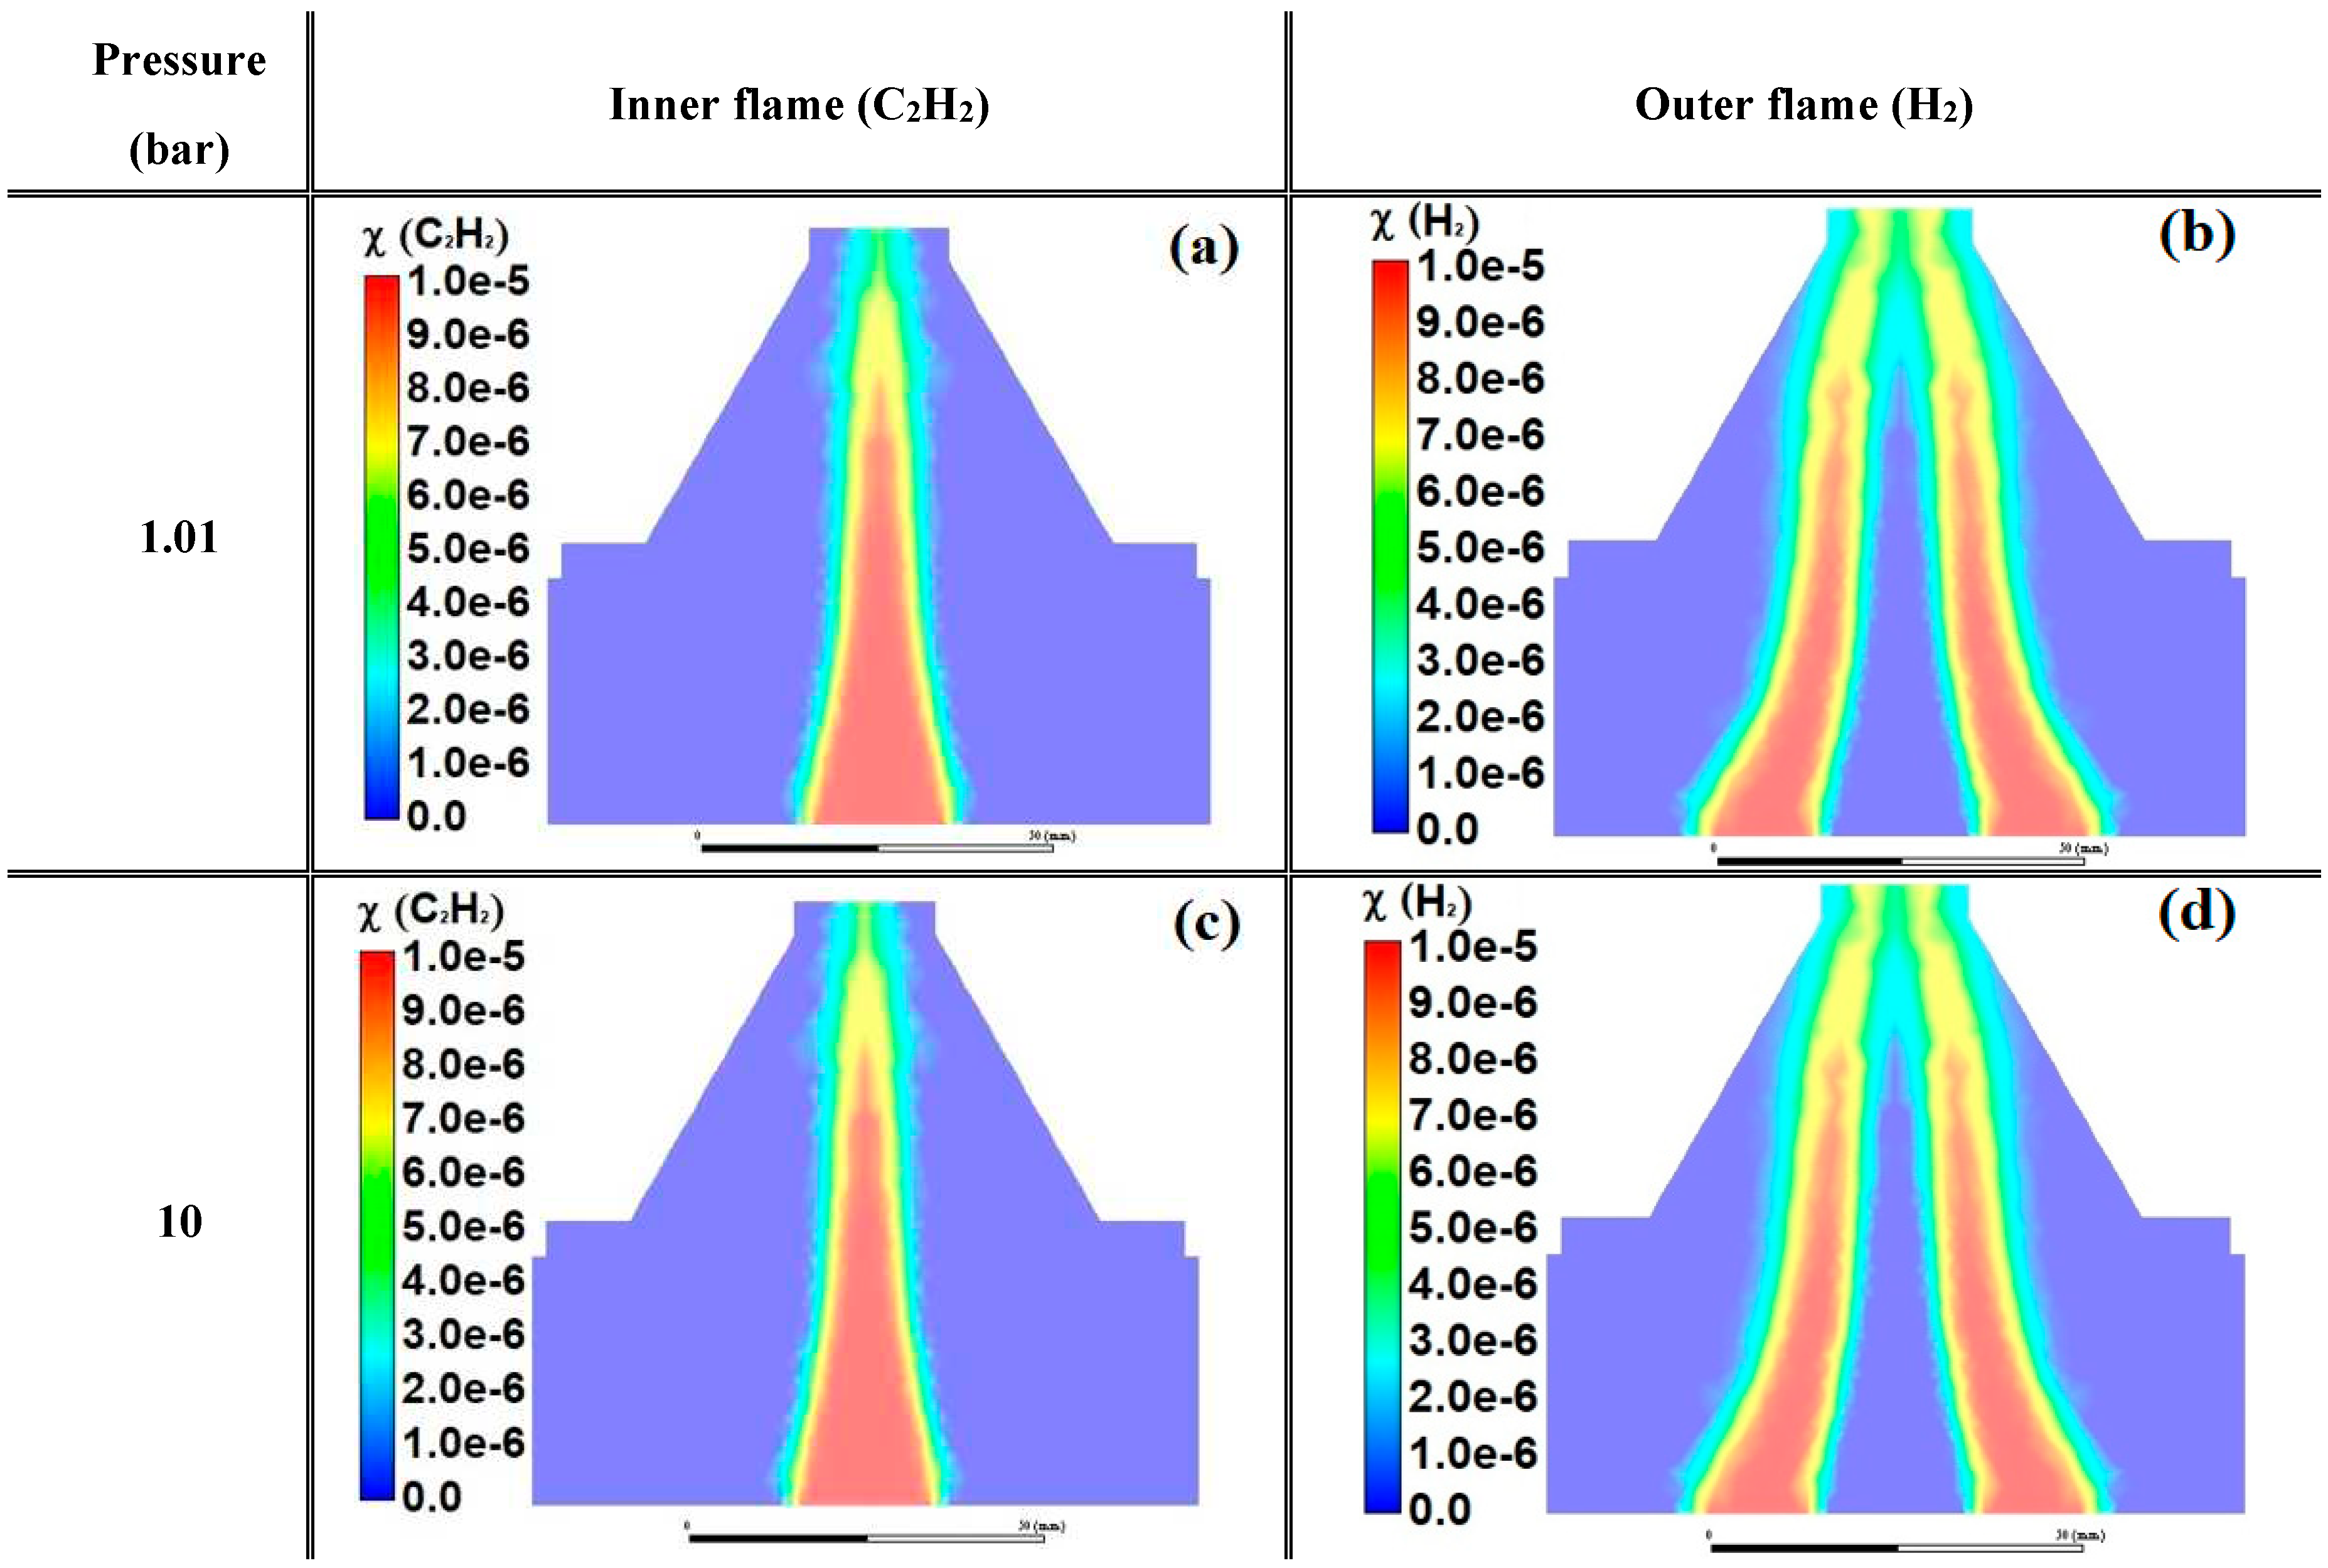
Figure 8.
Comparison between the measured centerline fV (ppm) profiles [6] (symbols) and the 2D-simulated ones (lines) of C2H4/air flames at p = 1.01 (dotted lines) and 10 (solid line) bar for ϕ = 2.1 (in black) and at p = 1.01 bar for ϕ = 2.34 (in red).
Figure 8.
Comparison between the measured centerline fV (ppm) profiles [6] (symbols) and the 2D-simulated ones (lines) of C2H4/air flames at p = 1.01 (dotted lines) and 10 (solid line) bar for ϕ = 2.1 (in black) and at p = 1.01 bar for ϕ = 2.34 (in red).
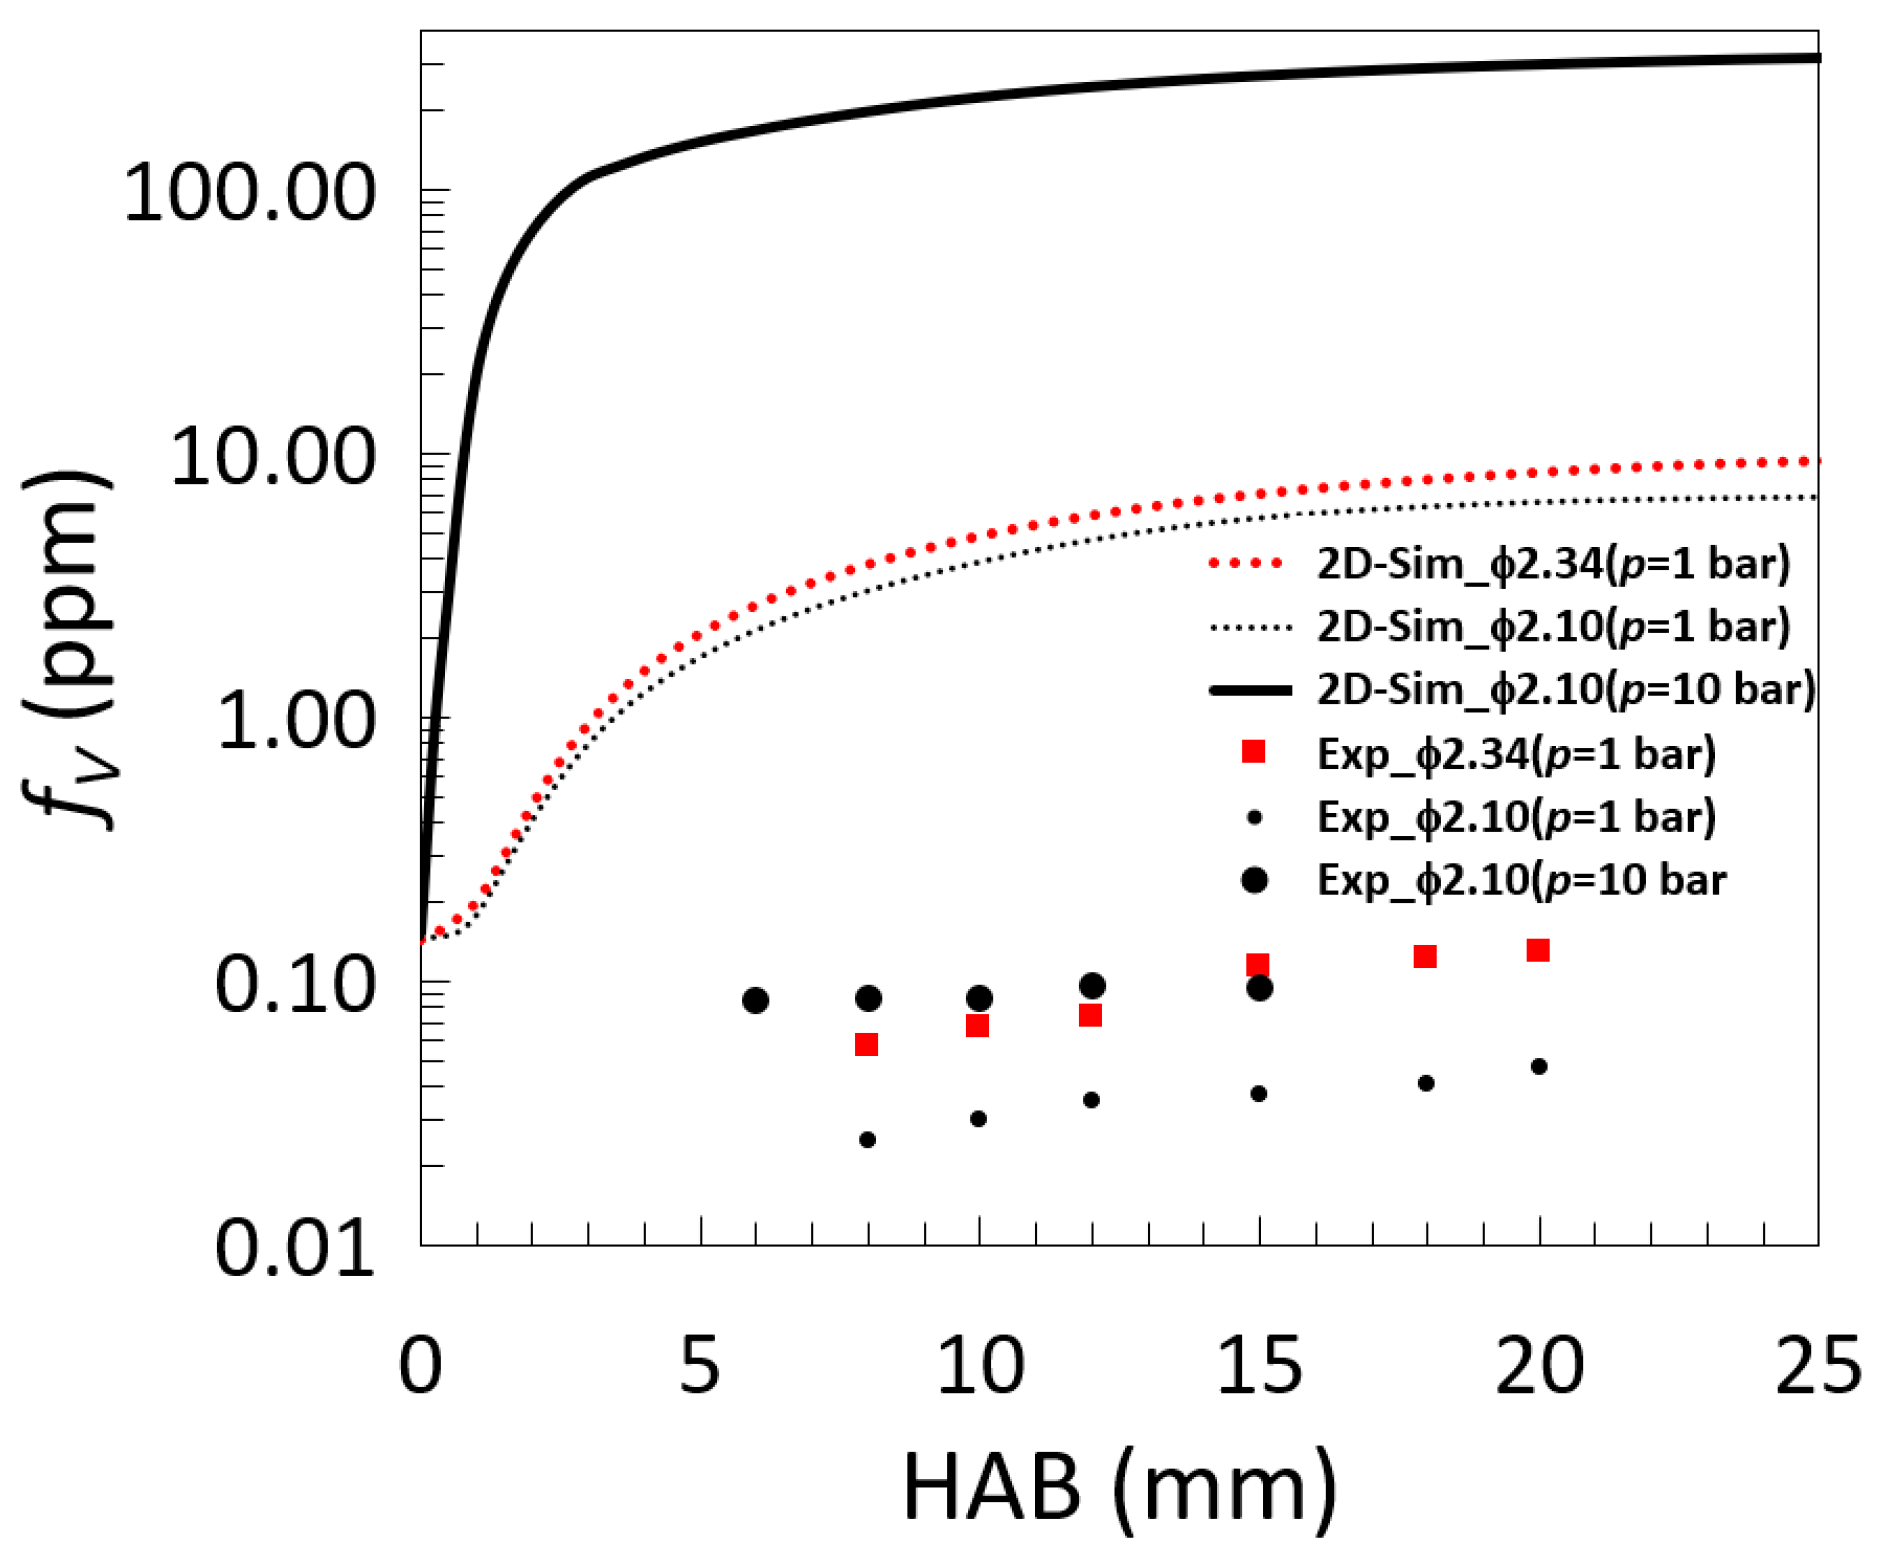
Figure 9.
Predicted centerline flame temperature (K) by 2D-simulation of C2H4/air flames at p = 1.01 (dotted lines) and 10 (solid line) bar for ϕ = 2.1 (in black) and at p = 1.01 bar for ϕ = 2.34 (in red).
Figure 9.
Predicted centerline flame temperature (K) by 2D-simulation of C2H4/air flames at p = 1.01 (dotted lines) and 10 (solid line) bar for ϕ = 2.1 (in black) and at p = 1.01 bar for ϕ = 2.34 (in red).
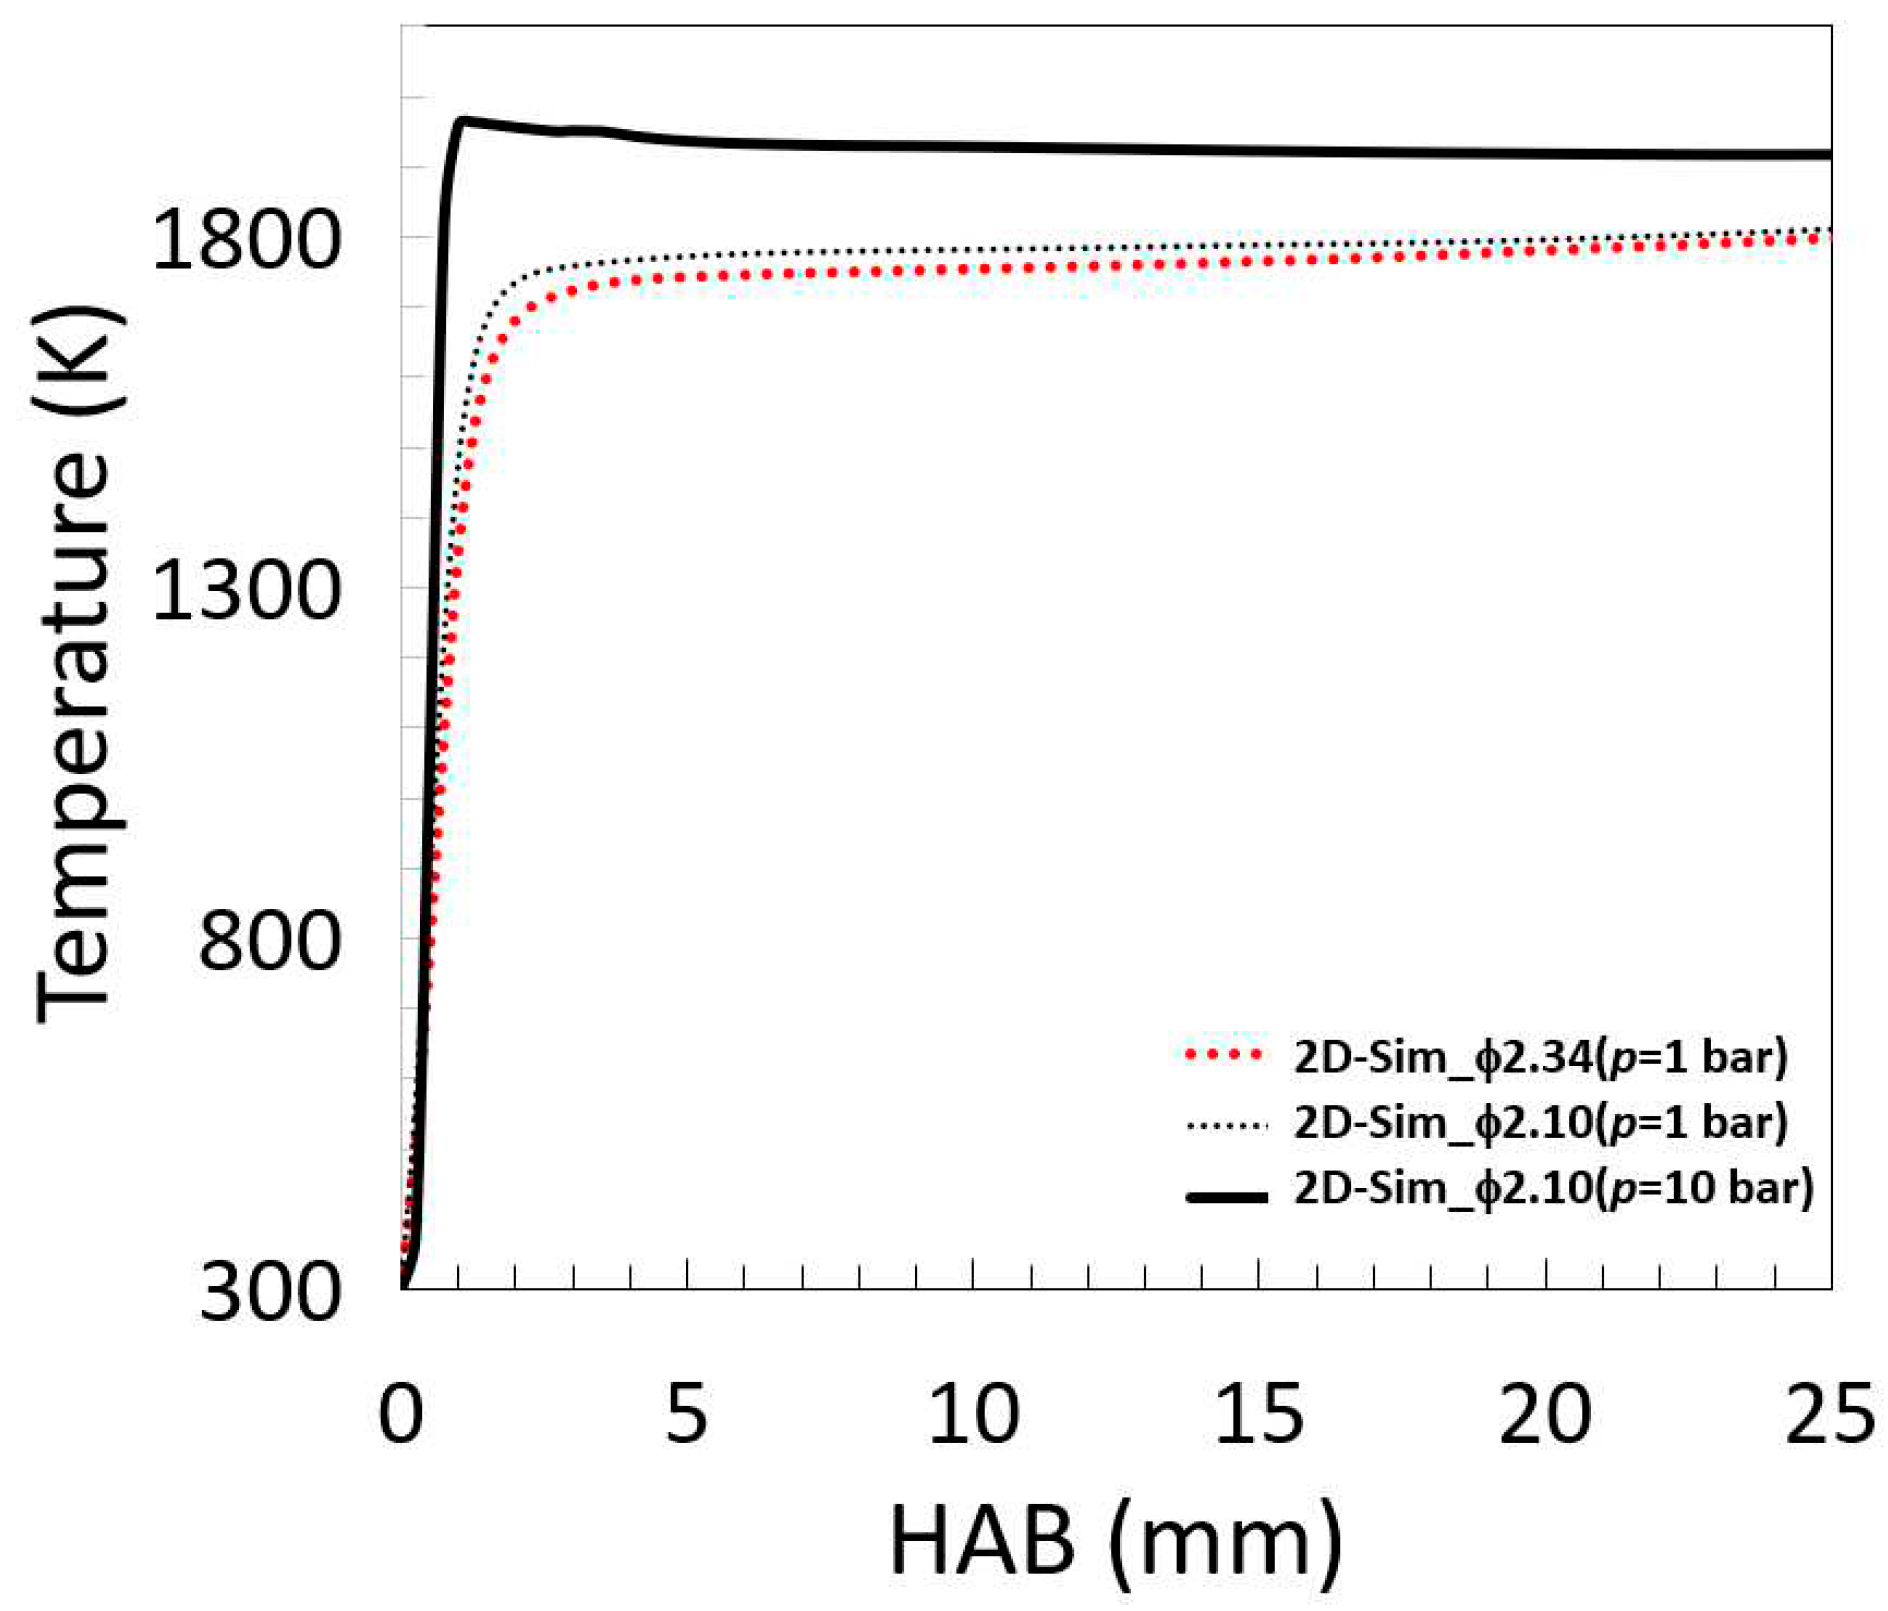
Figure 10.
Comparison between the measured centerline fV (ppm) profiles [6] (symbols) and the 1D-simulated ones (lines) of C2H4/air flames at p = 1.01 (dotted lines) and 10 (solid line) bar for ϕ = 2.1 (in black) and at p = 1.01 bar for ϕ = 2.34 (in red).
Figure 10.
Comparison between the measured centerline fV (ppm) profiles [6] (symbols) and the 1D-simulated ones (lines) of C2H4/air flames at p = 1.01 (dotted lines) and 10 (solid line) bar for ϕ = 2.1 (in black) and at p = 1.01 bar for ϕ = 2.34 (in red).
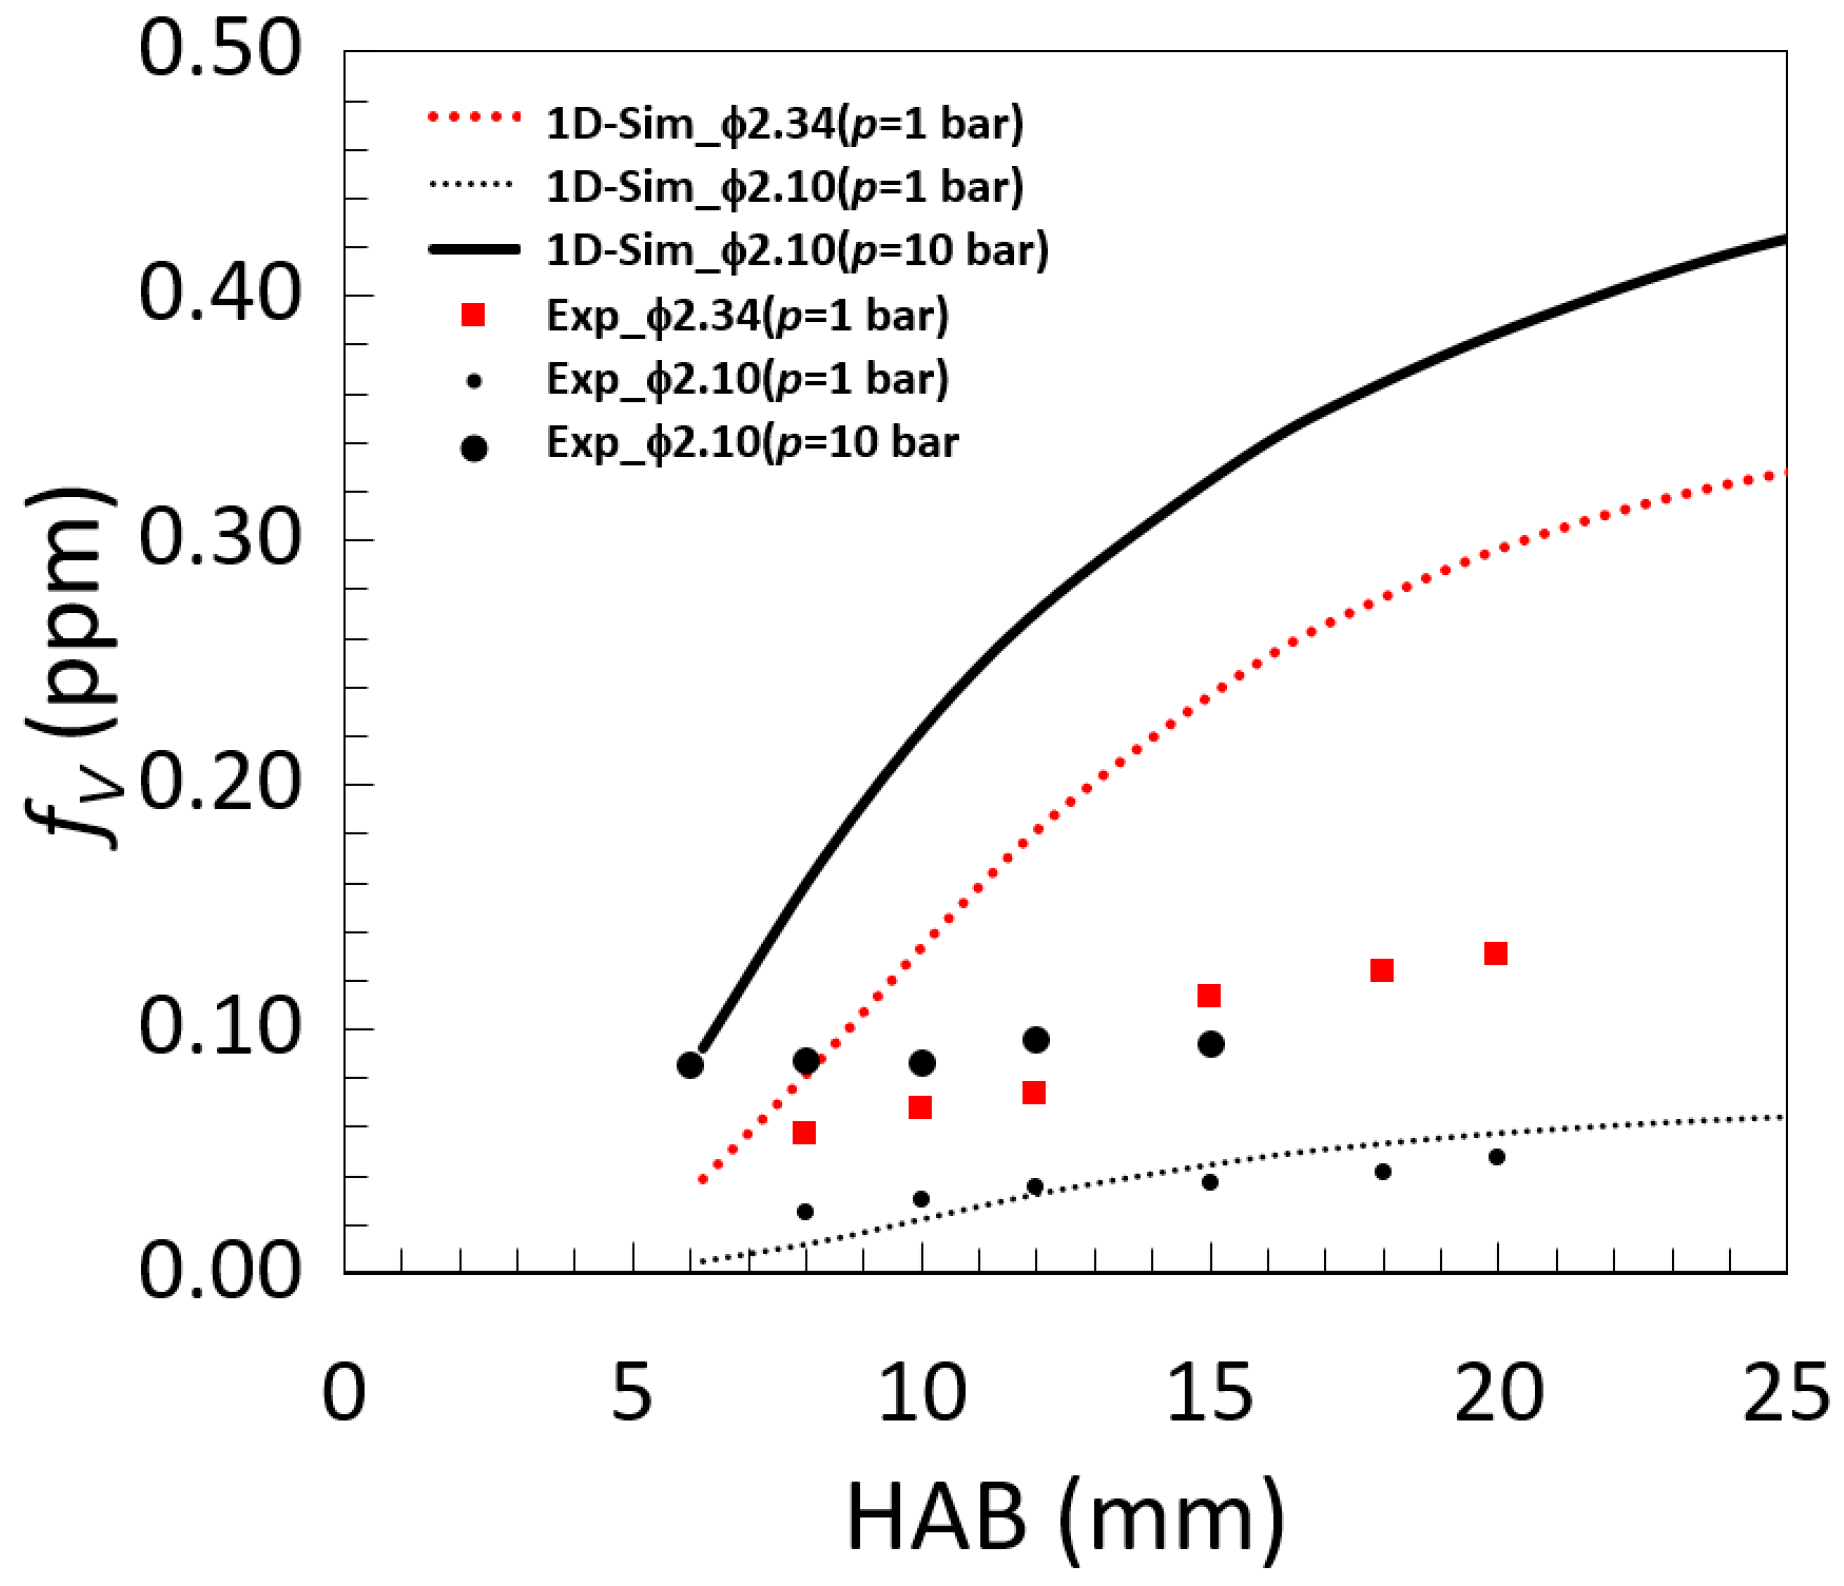
Figure 11.
Temperature (K) and fV (ppm) cross-sectional distributions of premixed flames C2H4/air ϕ = 2.1 and 2.34 of matrix diameter 20 mm shielded by a non-sooting flame of CH4/air ϕ = 1.2 at p = 1.01 and 10 bar.
Figure 11.
Temperature (K) and fV (ppm) cross-sectional distributions of premixed flames C2H4/air ϕ = 2.1 and 2.34 of matrix diameter 20 mm shielded by a non-sooting flame of CH4/air ϕ = 1.2 at p = 1.01 and 10 bar.
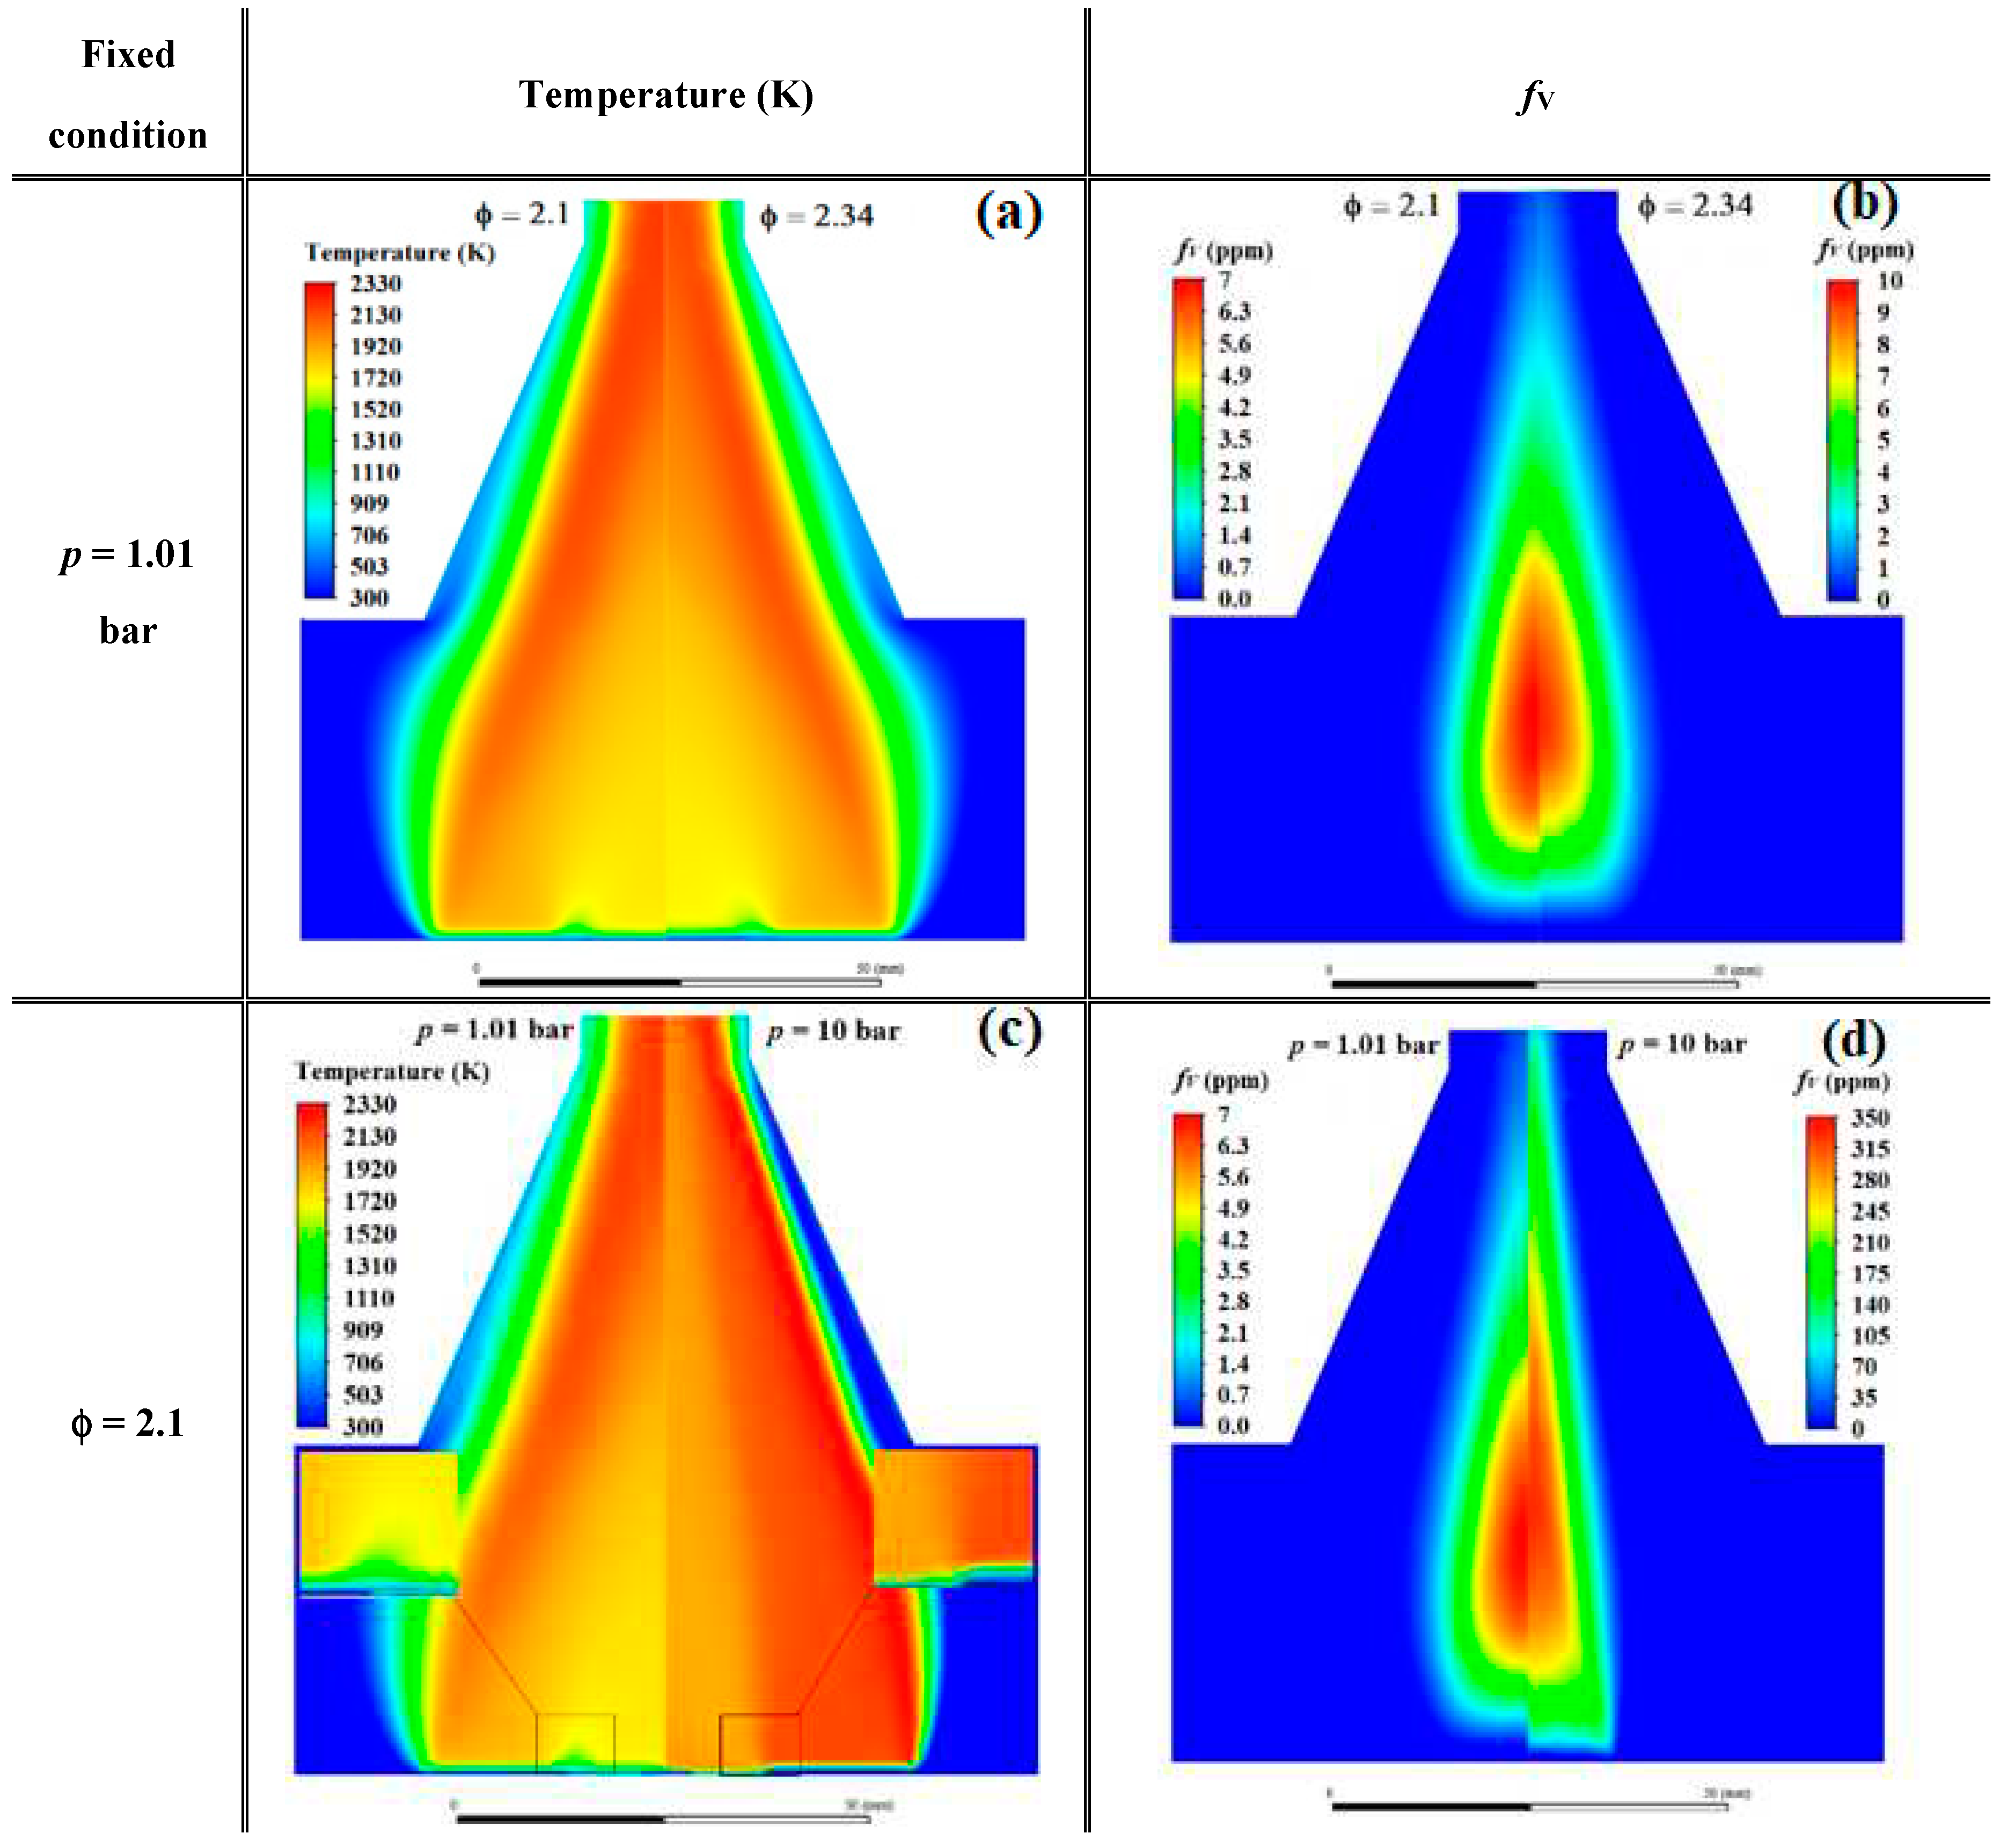
Figure 12.
Predicted radial temperature in K (red solid lines), fV in ppm (black dotted lines), and mole fraction of OH radical (violet solid lines) and C2H2 (green dotted lines) as a function of HAB (mm) of the atmospheric target flame C2H4/air ϕ = 2.1 of matrix diameter 56 mm with (a-b) and without EIM (c-d) at HAB 5 (thin lines) and 20 (thick lines) mm.
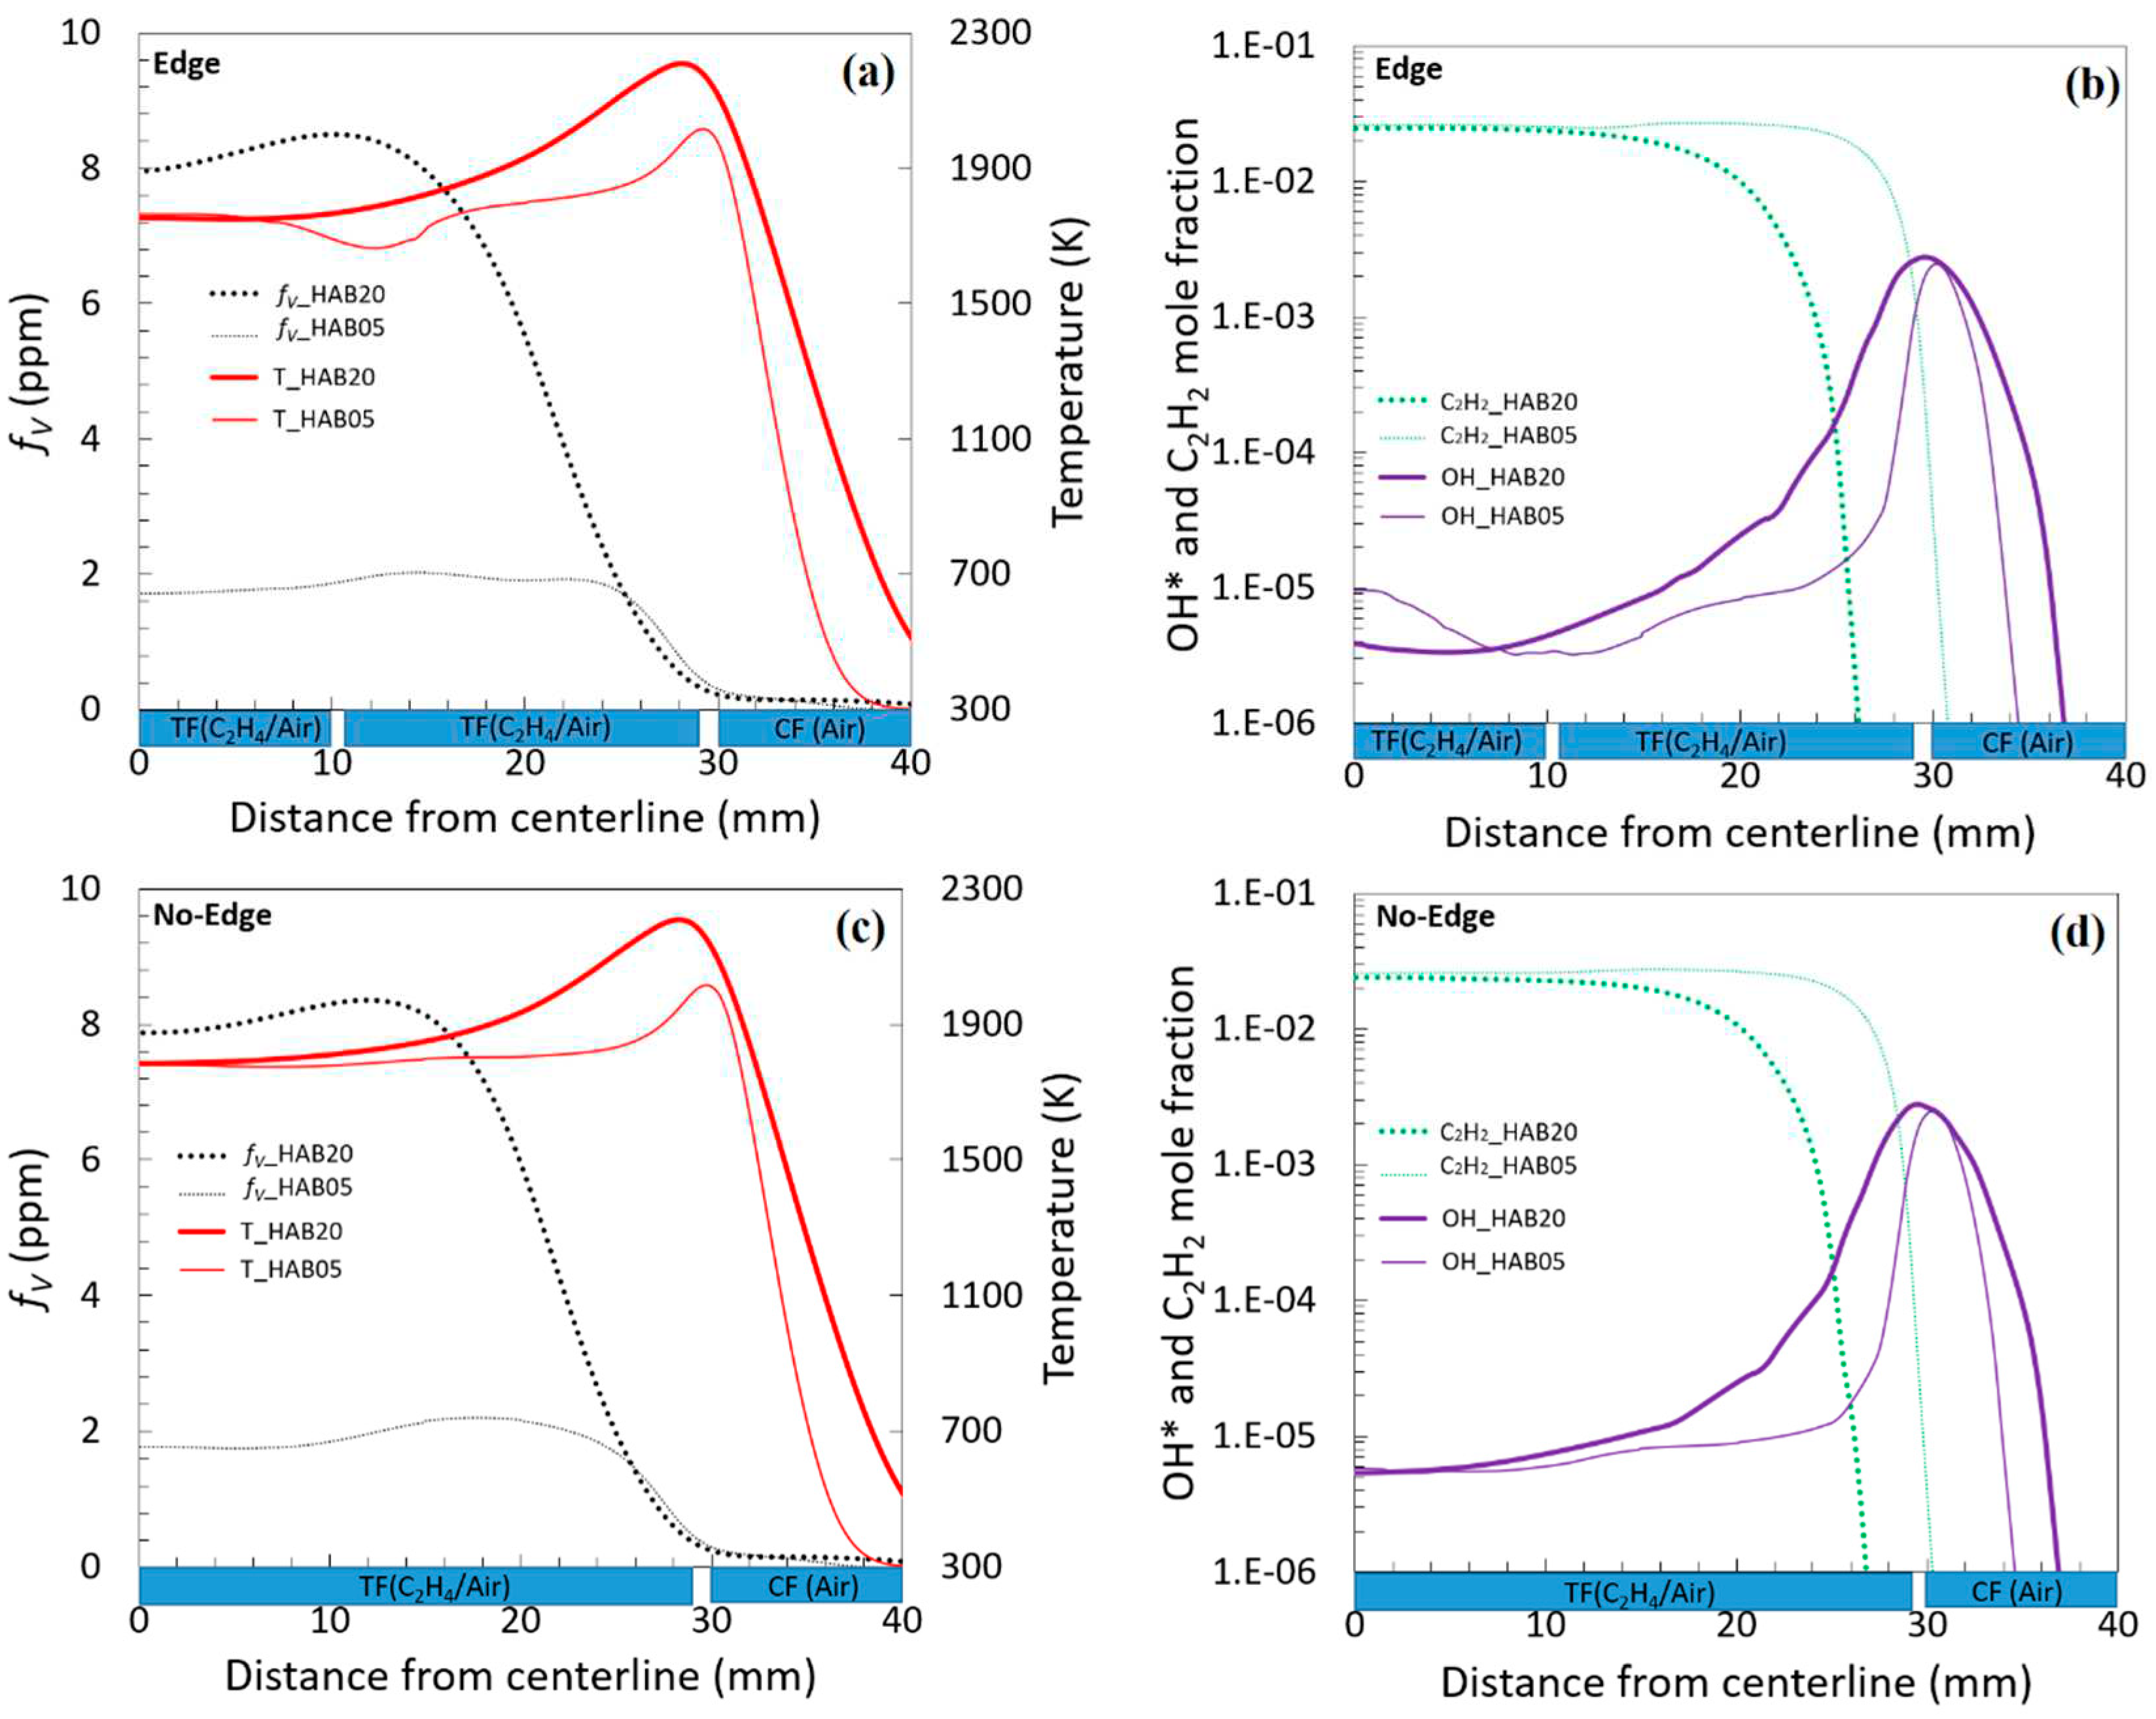
Figure 13.
Predicted centerline fV (ppm) in function of HAB (mm) by 2D-simulation at p = 1.01 and 10 bar of premixed flame C2H4/air ϕ = 2.1 of matrix diameter 56 mm with (dotted lines) and without edge (solid lines).
Figure 13.
Predicted centerline fV (ppm) in function of HAB (mm) by 2D-simulation at p = 1.01 and 10 bar of premixed flame C2H4/air ϕ = 2.1 of matrix diameter 56 mm with (dotted lines) and without edge (solid lines).
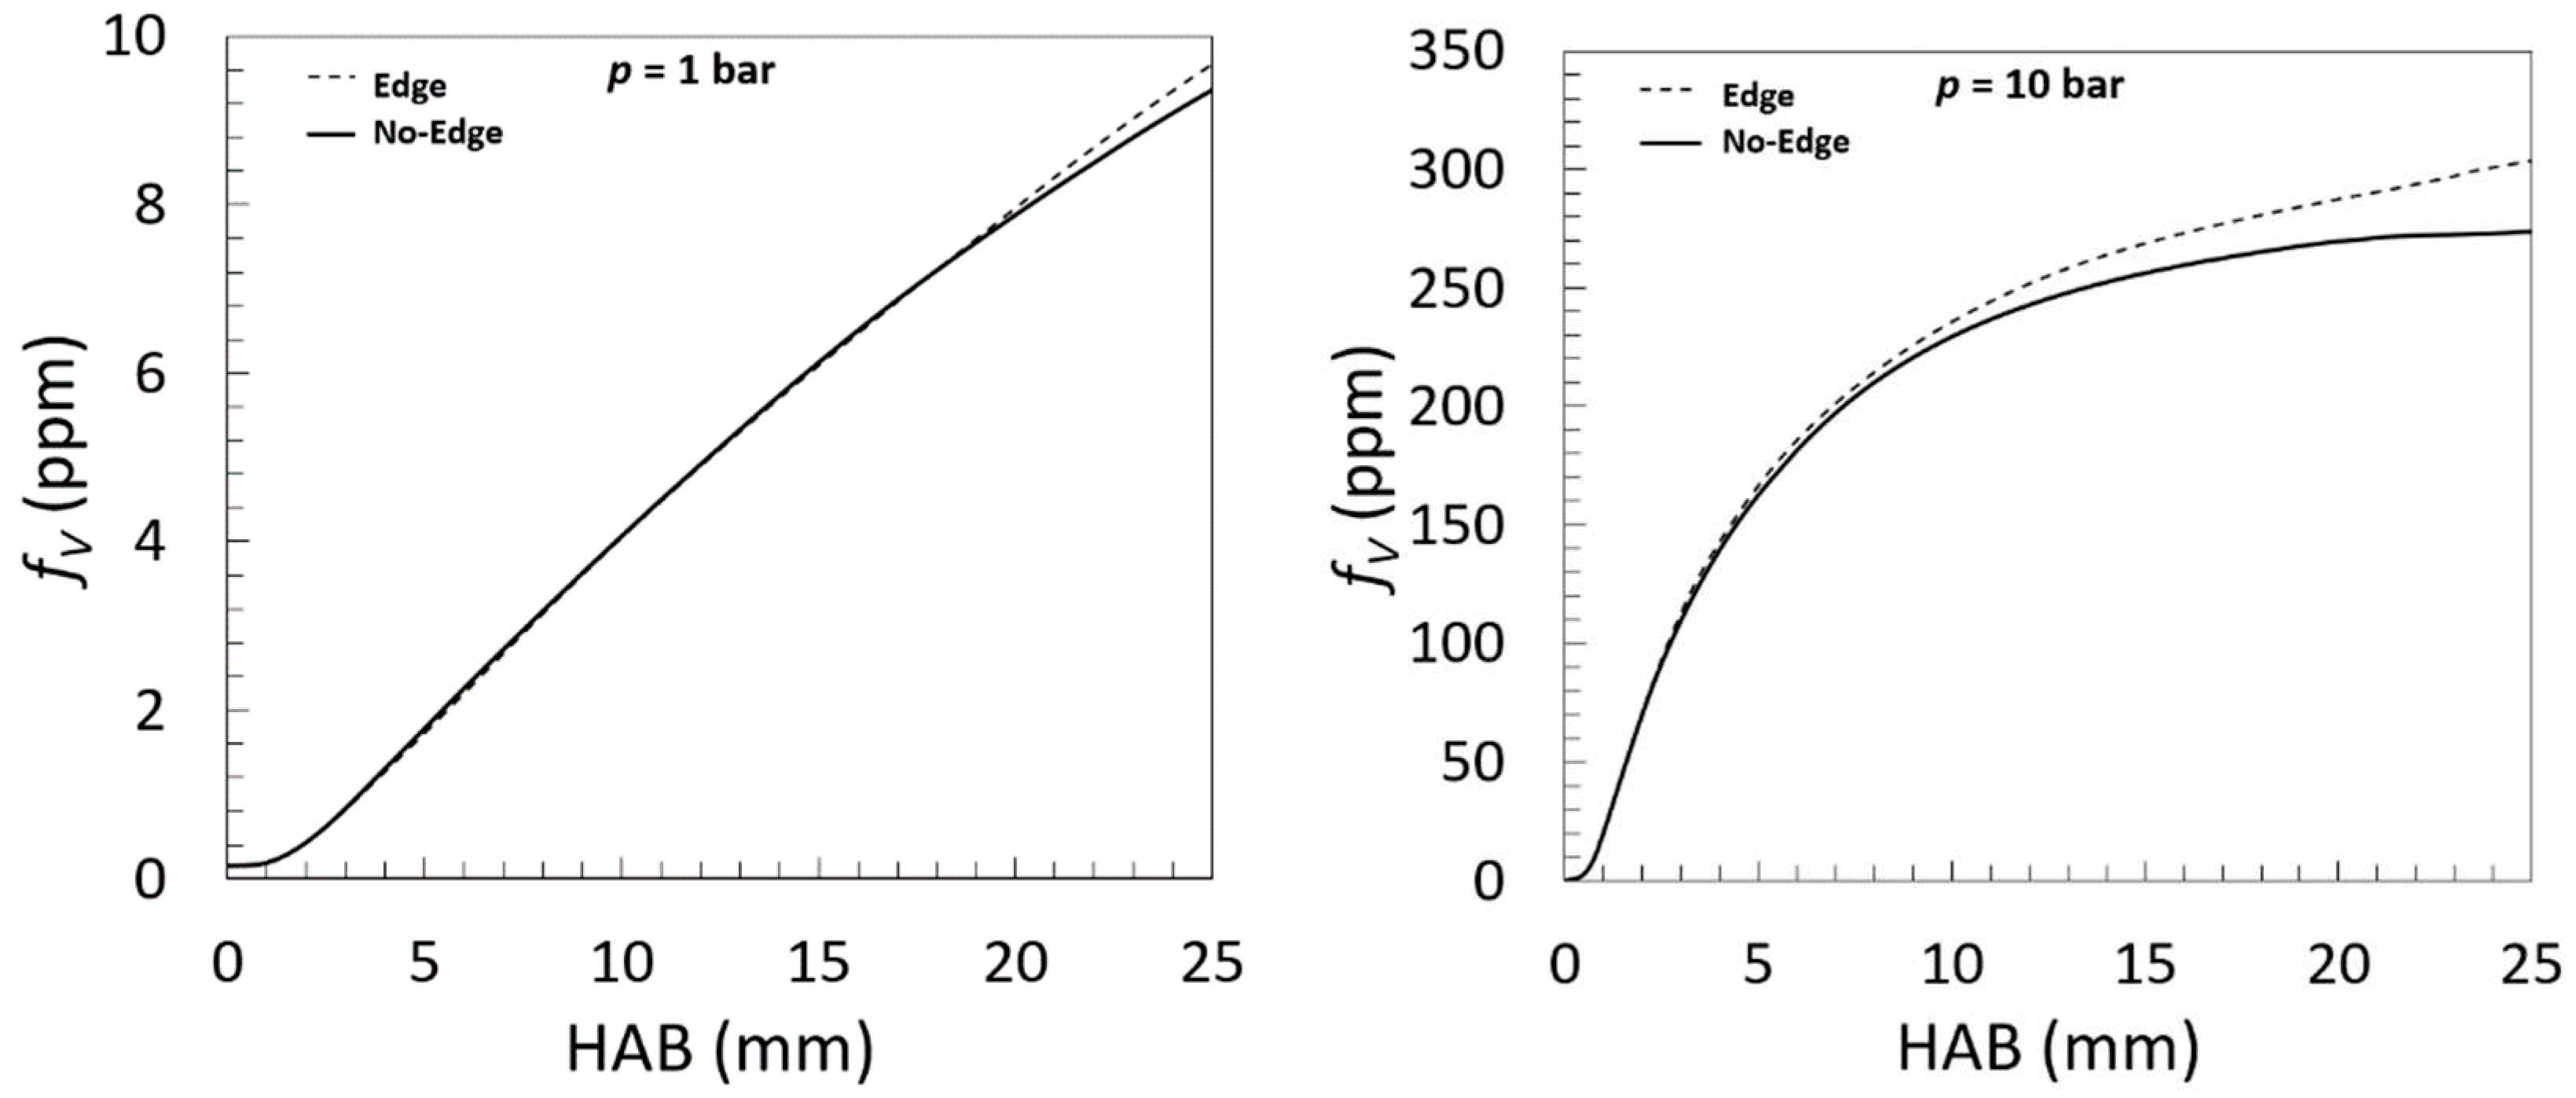
Figure 14.
Cross-sectional distributions of vorticity magnitude, acetylene mole fraction, fV (ppm) and gas temperature (K) of the target flame C2H4/air ϕ = 2.1 of diameter 56 mm with and without edge, and photos of the same target flame but of diameter 20 mm shielded by a non-sooting flame of CH4/air ϕ = 1.2 at p = 1.01 and 10 bar.
Disclaimer/Publisher’s Note: The statements, opinions and data contained in all publications are solely those of the individual author(s) and contributor(s) and not of MDPI and/or the editor(s). MDPI and/or the editor(s) disclaim responsibility for any injury to people or property resulting from any ideas, methods, instructions or products referred to in the content. |
© 2023 by the authors. Licensee MDPI, Basel, Switzerland. This article is an open access article distributed under the terms and conditions of the Creative Commons Attribution (CC BY) license (http://creativecommons.org/licenses/by/4.0/).
Copyright: This open access article is published under a Creative Commons CC BY 4.0 license, which permit the free download, distribution, and reuse, provided that the author and preprint are cited in any reuse.


