
Submitted:
10 January 2023
Posted:
12 January 2023
You are already at the latest version
Abstract
The paper presents the open source tool climdex-kit which includes utilities to compute, analyze and visualize climate indices based on the input data, target domain and temporal extent defined by the user. It is intended to support researchers as well as practitioners and decision makers to derive, handle and interpret meaningful information for climate change studies and sectoral applications. It currently includes the computation of 30 indices based on temperature and precipitation, describing both mean and extreme climate conditions, and it is designed to work with climate model projections. The tool is written in Python and integrates utilities from the well-established Climate Data Operators (CDO) and NetCDF Operators (NCO) libraries. The specific utilities for selecting, aggregating and visualizing data are thought to help users to produce tailored results improving understanding and communication of future climate change. In order to show the functionalities of the package as well as its potential integration in regional climate services, climdex-kit was applied to an ensemble of downscaled climate model projections up to 2100 for the region Trentino – South Tyrol (north-eastern Italian Alps). The projections for a selection of indices accounting for extreme temperature and precipitation conditions were derived and different visualization choices discussed. The package climdex-kit is developed in a way that allows users to implement additional routines for calculating other indices as well as for easily adapting the routines to handle with different data types and spatio-temporal targets defined by the specific application. Effective climate services can in fact be developed only if flexible tools and customizable climate information are integrated with a clear understanding of data features and limitations.
Keywords:
open source
; climate indices
; emissions scenarios
; climate projections
1. Introduction
Climate change and transformation is urging scientific communities, practitioners and decision makers around the world to better understand and handle with such systemic shift and its consequences at different levels, and to instill a gradual societal adaptation and change into the population (Fedele et al., 2019; Hurlimann et al., 2021; Pörtner et al., n.d.). The availability of tailored and robust information about current climate and climate change at local, regional or national scales is an increasing requirement in a wide range of end-user applications and as a decision-support basis in the fields of risk reduction and adaptation planning. For instance, several authors have already highlighted the communicative barriers existing between climate research activities and final users: in most cases research outcomes are not directly suitable for actual user needs, users are not informed about existing available products, or they lack necessary competences and support to interpret and use the available information (Hewitt & Stone, 2021; McNie, 2012). In this context, climate services are crucial and increasingly relevant instruments for enabling the transferability of the current knowledge on climate to a broad audience (both experts and non-experts) and the definition of user-oriented data and tools for their handling, e.g. spatio-temporal aggregation and visualization (Bruno Soares et al., 2018). Examples of climate services include the provision of downscaled climate data and indices for sectorial applications as well as spatially-explicit climate information for impact modelling on both national and regional scales (Cortekar et al., 2020). For instance, several national and regional organizations have recently started to build national climate scenarios, such as CH2018 for Switzerland (Fischer et al., 2022), ÖKS15 for Austria (Peßenteiner et al., 2021) and OPS21 for Slovenia (https://podatki.gov.si/data/search?s=%22podnebne+spremembe%22%2C+projekcije%2C+Slovenija).
The most relevant example of coordinated climate service in Europe is the Copernicus Climate Change Service (C3S) which supports society by providing authoritative information about the past, present and future European and global climate. It offers a wide collection and coordinated access point to climate observations and predictions as well as several derived sector-specific information through the Climate Data Store (CDS). Data are supported by documentation and an online toolbox for flexible data handling and visualization (Buontempo et al., 2020; Thepaut et al., 2018). Other examples of climate portals and services are the European Drought Observatory (EDO, https://edo.jrc.ec.europa.eu; (Cammalleri et al., 2021)) of the EU's Copernicus Emergency Management Service (https://emergency.copernicus.eu) focusing on drought-related data and indices and, at national Italian scale, DATACLIME (https://www.dataclime.com) of the Euro-Mediterranean Center for Climate Change (CMCC) and the open data meteorological portal MISTRAL (https://www.mistralportal.eu/; (Bottazzi et al., 2021).
Besides data portals, the development of successful climate services needs to be underpinned by modular and interoperable building blocks for customizing functionalities. In this context, an increasing number of ready-to-use packages is published in open source code repositories, e.g., GitHub (https://github.com), and written in popular programming languages. Some of them provide climate data access, post-processing and visualization tools such as Climate4R (https://github.com/SantanderMetGroup/climate4R) (Iturbide et al., 2019) and climate-resilience (https://climate-resilience.readthedocs.io/); others give access to more sector-oriented climate information, such as Clisagri (https://github.com/ec-jrc/Clisagri) (Ceglar et al., 2020)) handling with agro-climatic indices, or climatrends (de Sousa et al., 2020) providing climate analyses for ecological modelling; others focus more on climate extremes from both future projections, such as ClimProjDiags (https://earth.bsc.es/gitlab/es/ClimProjDiags) and historical data from stations text files or netCDF grids, such as the R Climpact package (https://ccrc-extremes.shinyapps.io/climpact/) which is used in the Climdex portal (https://www.climdex.org/), although none of them completely encompasses the steps we needed to cover, from the creation of the index, to its open access, metadata curation, and analysis. Some of them can be integrated into decision support systems and reach a broader audience via user-friendly platforms but with simplified functionalities. The development of flexible tools for elaborating climate information is essential to fill the still existing gaps between the available climate data and services and the actual needs of users on the regional and local level which include local climate change scenarios, uncertainty analysis, customized climate-related hazard indicators for different sectors and spatially-explicit analyses (Findlater et al., 2021; Tart et al., 2020). At sub-national Italian level, the development of regional and local climate data portals has been recently supported by several regional initiatives and authorities, especially Regional Environmental Protection Agencies (ARPA), even though most of them do not offer local-specific climate scenarios and no tools for accessing and visualizing regional data interactively.
In this framework, in order to answer to the increasing need of elaborating climate and climate change data for research activities as well as practice-oriented applications we developed an open source tool called climdex-kit and published in the official Python Package Index (PyPI, https://pypi.org/). The package is thought for users with programming skills which can further integrate the codes into open and interactive platforms addressing the general public. climdex-kit provides utilities and documentation to implement the whole pipeline of calculation, publishing and analysis of climate indices as well as to shape the visualization of results based on user needs. The current version of the package handles with ensembles of climate model projections for an arbitrary number of emission scenarios and it can be set to work with any climate dataset defined by the user. climdex-kit currently offers an initial set of more than 30 temperature and precipitation-related indices (see the Appendix A for the list of currently implemented indices) referring to both mean and extreme climate conditions. Besides index computation, climdex-kit offers functionalities to analyze the data, perform spatial and temporal aggregations and derive maps and graphs. The tool allows the user to customize the index calculation, to add functionalities and to work with any spatial domain covered by the data used. Given the increasing relevance of the FAIR principles, i.e. Findability, Accessibility, Interoperability and Reusability, in the context of data sharing, the package fosters these principles by facilitating the ingestion of the computed indices in openEO (Schumacher et al., 2022), a platform that leverages machine-actionable full processing capabilities to any remote interested party, through a restful service API. Complex orchestration of indices is made easy with the command-line interface, while the customization of existing indices, as well as the definition of new ones, requires the editing a few lines in a configuration file. Commands for the visualization and analysis of the results are also made available, with a high level of flexibility so to meet a wide range of user requirements.
In order to show a pilot demonstration of the implemented climdex-kit functionalities and to discuss potential integration into regional climate services, the package was applied to a set of regional climate model projections for Trentino-South Tyrol region (north-eastern Italian Alps). The input data used for the tool demonstration were the climate projections available from the EURO-CORDEX initiative (https://www.euro-cordex.net/) (Jacob et al., 2014) which were downscaled to 1-km resolution by using local observations. The paper is organized as follows: Section 2 describes the climdex-kit package and architecture together with the input requirements, Section 3 describes the study area and the data used for the pilot demonstration, Section 4 reports and discusses the results for the pilot case, while Section 5 provides conclusions and outlook.
2. The Climdex-Kit Project
climdex-kit is a free and open-source tool available in the official Python Package Index at https://pypi.org/project/climdex-kit/. It is meant to support researchers and developers in the whole pipeline of the calculation and analysis of climate indices as well as result communication.
Easily customizable and expandable, the package offers an initial preset of climate indices, most of which are derived from the core set of indices defined by the Expert Team on Climate Change Detection and Indices (ETCCDI, https://www.wcrp-climate.org/data-etccdi), and implemented with the underlying CDO toolkit. Such indices highlight different characteristics of extremes, including frequency, magnitude, and persistence, and are widely used in climate change studies.
For the computation of one or more indices, the tool accepts a predefined input data structure and naming convention. The input climate data shall be stored in netCDF files (.nc) and grouped by variables and, in case of projections as in the current configuration, by climate scenario:
| Listing 1. Expected input netCDF data organization and naming: $IDIR the root input directory, {var} the label of the climate variable, {scenario} the emission scenario, {model} the name of the model within the ensemble, {timeres |yearstart|yearend} the temporal resolution and range of the data. |
 |
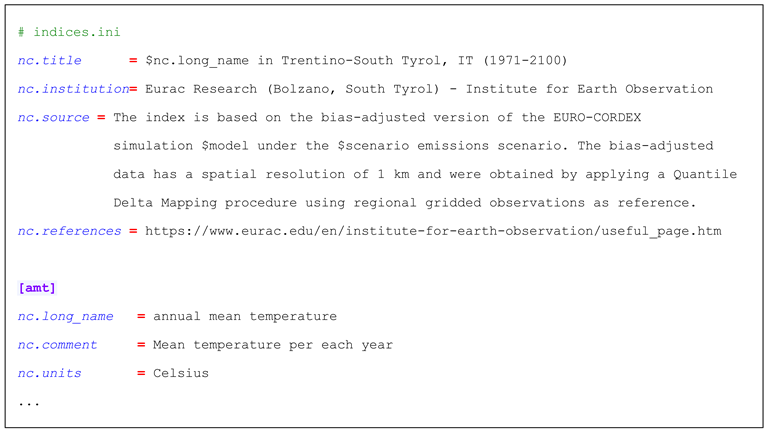
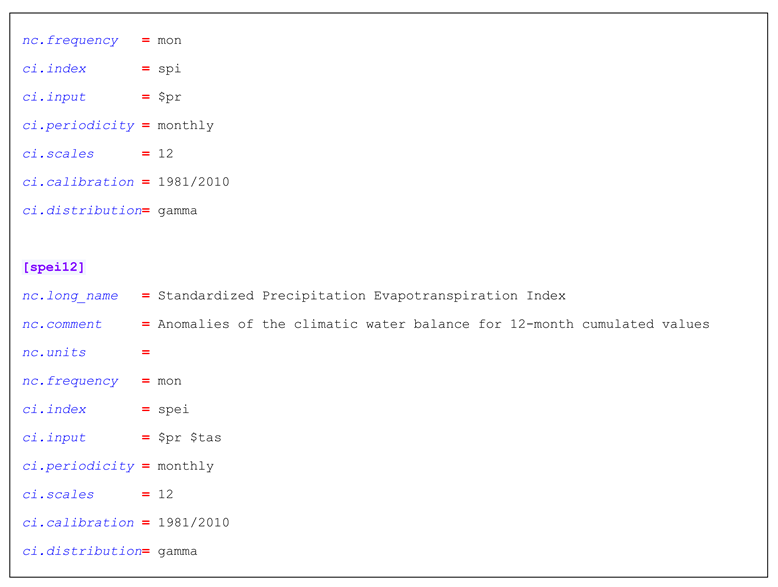
The outputs are stored as individual netCDF files one for each model and are grouped together by scenario in separate folders like the input files (Figure 1). A rich and thorough set of metadata are of primary relevance for discoverability and replicability of data: following the recommendations of the netCDF Climate and Forecast (CF) metadata convention (http://cfconventions.org/Data/cf-conventions/cf-conventions-1.9/cf-conventions.html), the package provides a handy way to set metadata fields in all output files, both at general and index-specific (Listing 2).
| Listing 2. Setting general and index-specific netCDF metadata fields in the output indices files: the nc-prefixed instructions outside of a specific index configuration–[amt] in this example–apply to all output files of a computation run. $-signed keywords can be used to refer to input file properties (e.g. see $model, or other metadata extracted from file name as shown in Listing 1) or other output metadata fields defined in the same document (e.g. see $nc.long_name). |
 |
The tool is composed by three components: the climate index computation, the publication of indices on an interoperable platform, and the index analysis and visualization. In the following each block is described in detail.
2.1. Climate Index Computation
In the current state, climdex-kit usually expects three-dimensional time-series of gridded input datasets, encoded as netCDF files. The software allows any spatial resolution and temporal extent of the inputs, while the temporal resolution required in input is determined by the specific index to compute. The current preset of indices is configured to expect daily data and to provide yearly or monthly time series as output.
The bulk calculation of each index, i.e., the calculation of an index for all input models of each input climate scenario, is managed by so-called worker processes with common blueprint interface, but each one implementing a partition of the available indices independently of each other. Depending on the type of used worker, a specific set of configuration rules applies.
The most widely used worker of the current preset of indices is the “CDO” worker, which lets a user define an arbitrary number of operator chains from the powerful CDO library (Schulzweida, Uwe, 2020). A CDO chaining feature includes one or more pairs of strings, the latter possibly representing further nested pairs. For example, the configuration of CDO worker behind the yearly frequency of days with very extreme precipitation (r99pfreq) is reported in Listing 3.
| Listing 3. The configuration of the [r99pfreq] index, computing the yearly frequency of days with very extreme precipitation: i) the first pair (.1 suffix) computes the baseline reference by chaining a temporal filter of the years between 1981 and 2010 of the input precipitation dataset $pr with a masking of only those grid points whose value is greater than 1 mm (i.e. wet conditions); ii) the second pair (.2 suffix) computes the 99th percentile of the baseline, implicitly stored as output of the first pair and referenced by the $tmp1 variable; iii) the last pair eventually counts the number of days per each year when the precipitation amount exceeds the local 99th percentile stored in the $tmp2 output, i.e. the very extreme precipitation days. |
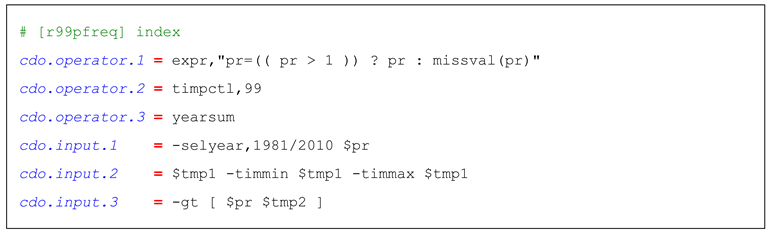 |
It is then translated into the CDO calls in the command-line interface reported in Listing 4.
| Listing 4. Resulting command-line interface CDO calls of the r99pfreq index defined in Listing 3. |
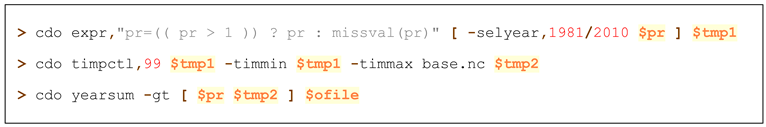 |
Dollar-signed keywords are used to refer to either input climate projections or ancillary data (e.g. $pr for precipitation) or to the temporary output files of each chain of operators (e.g. $tmp1), in a way that is independent of the underlying climate model or scenario of the runtime execution. Temporary files are automatically cleaned up by the worker once the job is done, and dedicated log files are created in order to better isolate and inspect the outputs of each calculation.
This is an example of how already existing CDO operators computing climate indices, e.g., those implemented in the framework of European Climate Assessment (ECA) project (Schulzweida and Quast, 2015), can be customized and further elaborated in climate-kit.
The richness and flexibility of CDO operators in the native library makes the definition of a new index rather straightforward and, in most cases, with no intervention on the source code but only adding a line in the configuration file. Climate indices requiring more complex calculations, like the well-known Standardized Precipitation Index (SPI) or Standardized Precipitation Evapotranspiration Index (SPEI), are handled by a separate worker based on the external climate-indices Python library (Adams, 2017). The data pre-processing that is necessary when interfacing with external libraries, like dimensions order rearrangement or renaming, is carried out through bindings with the NCO toolkit (Zender et al., 2012). Eventually, in case of other unforeseen worker types the package’s technical documentation helps developers in a step-by-step definition and successful registration of required types. Figure 2 helps depicting the overall architecture of the climdex-kit ecosystem.
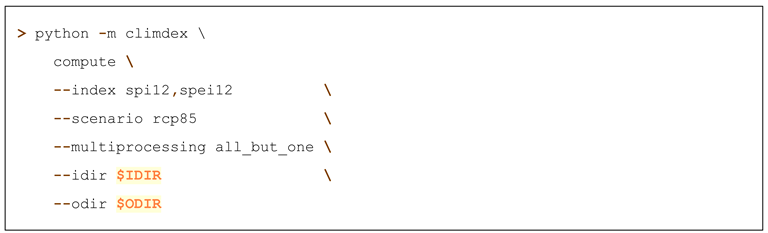
Moreover, the package offers the chance to reduce the computation time by calculating multiple indices, e.g., SPI and SPEI, for a selected emission scenario (RCP 8.5) in the example of Listing 5, from all models by using all available CPUs but one, in parallel:
| Listing 5. Call from command-line for the calculation in parallel of SPI and SPEI indices on all models for the ensemble of the RCP 8.5 emission scenario. $IDIR and $ODIR are placemarks for real input and output folders, while rcp85 is named after the scenario folder of the input datasets as defined in Listing 1. |
 |
Simulation “dry-runs”, i.e., model filtering via regular expression, and bulk editing of metadata fields of already existing indices (usually a much quicker operation than the calculation itself) are also possible through dedicated command-line arguments.
2.2. Climate Index Publication
In order to foster findable, standard-compliant, interoperable and machine-readable–in a word: FAIR (Wilkinson et al., 2016)–availability of research data, the publication of the indices onto a proper GIS web platform is a crucial requirement. Given its characteristics that go far beyond the mere indexing of a dataset into a discoverable catalogue, towards fully-fledged processing capabilities and powerful integrations with R and Python scripting environments (Zellner et al., 2020), the openEO platform (Schramm et al., 2021) was selected as target for publication of computed climate indices. The climdex-kit package offers utilities to craft the necessary configuration files that can be used to register the previously computed climate indices data into a specific openEO backend options, like OpenDataCube (ODC) (Killough, 2018) and rasdaman (Baumann et al., 2013). The stored datasets are defined as multidimensional virtual cubes, also called datacubes (Baumann, 2018), which group the underlying input files together in a single higher-dimensional data tank, greatly simplifying the access and analysis on the client-side for the end users.
The resulting list of dimensions–the domain–of each datacube is:
- “t” = time
- “Y” = spatial vertical coordinate
- “X” = spatial horizontal coordinate
- “M” = the model within the ensemble (a look-up table maps model names to their assigned index)
- “rcp” = the emission scenario
The band of each “cube” is represented by the value of the climate index, although further additional bands could be defined when available, like for instance the level of uncertainty associated to each computed value. Based on the Spatio-Temporal Asset Catalog (STAC) standard (https://stacspec.org/)–a superset of the Open Geospatial Consortium (OGC) API Features–the openEO API exposes a powerful set of processes, i.e., I/O functions that apply to the datasets in the catalogue, which are fully independent of the underlying backend options (Zellner et al., 2021). Optionally behind an authentication wall, an external user can easily discover, access and upload processing graphs on the published indices through the restful openEO API (https://openeo.org/documentation/1.0/developers/api/reference.html), greatly enhancing accessibility and interoperability of the data.
As data fairness does not come for free, despite the work in progress for enabling openEO cloud SaaS (Software-as-a-Service) (Schumacher et al., 2022), it should be noted that a user that wants to ingest and publish a set of indices with the tools provided by climdex-kit, still needs to rely on an existing openEO installation, usually hosted on the affiliated institute’s or organization’s infrastructure. The analysis and visualization utilities described in the next section expect an openEO endpoint for accessing the data: for future releases of the climdex-kit package, it is planned to offer the same capabilities also for offline file-system based settings.
2.3. Climate Index Analysis and Visualization
Once an index is registered in the openEO catalogue, the datacube is publicly and FAIR-ly exposed to end-users and climate researchers, as well as other pieces of software.
climdex-kit provides an initial set of command-line operations that can be used to analyze the computed indices, both analytically and visually, and perform the climate assessment in a certain region of interest. More specifically, the analysis of climate indices focuses on three main aspects: i) climate spatial patterns, ii) temporal trends, and iii) ensemble analysis. All analyses and products aid the users to quantify and assess the uncertainty of model projections and derived climate change signals.
Spatial maps. The user can visualize the spatial distribution of data over the whole covered domain or over any subregion of interest as a 2D map. The user can visualize the distributed value of one index at a certain time step for a specific model or a statistic within the ensemble, e.g. mean, median, percentiles. The tool allows the user to aggregate the values over any temporal interval of interest, e.g., decades or 30-year periods, and to calculate the differences between two spatial layers. Such maps support the assessment of mean values of a specific index in the historical period as well as in future climate and allow to evaluate the projected changes of a certain climate feature in the future (e.g., 2041–2070) with respect to the baseline (e.g., 1981–2010) or the differences in projected values under two scenarios.
Temporal trends. Besides the spatial distribution of mean climate conditions and their changes over a certain future period, the availability of time series for the climate indices permits to assess and visualize temporal trends. The trends can be computed over each single model or ensemble statistics and be defined for each pixel or for spatially aggregated values. The user can also select the time interval over which the trend is computed. The trend analysis includes the quantification of trends as well as of associated confidence intervals. the trend quantification is also companied by the time series visualization showing the transient behavior of the index over the period of interest for each model as well as the ensemble, both in absolute term and as differences with respect to the baseline. By plotting the time series for more than one scenario together, the user can easily point out how the climate actions influence the expected future climate conditions.
Ensemble analysis. Since the analysis of future climate is commonly based on the well-established ensemble approach, climate simulations from multiple models are considered, climdex-kit offers functionalities to manage and analyze the model ensemble. They consist in the derivation of time series of ensemble statistics, such as model ensemble mean or certain percentile, the calculation of ensemble spread, and the classification of models based on the sign as well as on the magnitude of their projected changes. Based on the model behavior, the user can filter out models and derive all visualization products from an ensemble subset.
A particular attention is paid to the evaluation of robustness of the projected climate signal. To this aim, climdex-kit allows to assess the model agreement on the direction of change and to apply a Mann-Whytney-Wilcoxon test (Wilcoxon, 1945; Mann and Whytney, 1947) to derive the statistical significance of the multi-model change for each grid cell. Depending on the application, user can thus adjust the thresholds used to define the robustness of the signal, e.g., the number of models that has to pass the test, as well as the significance level. For instance, the climate information at a certain grid point or region can be considered robust if at least 66% of simulations show the same direction of change and significant if the ensemble data pass the test at 5% significant level (Jacob et al., 2014; Pfeifer et al., 2015).
3. Study Area
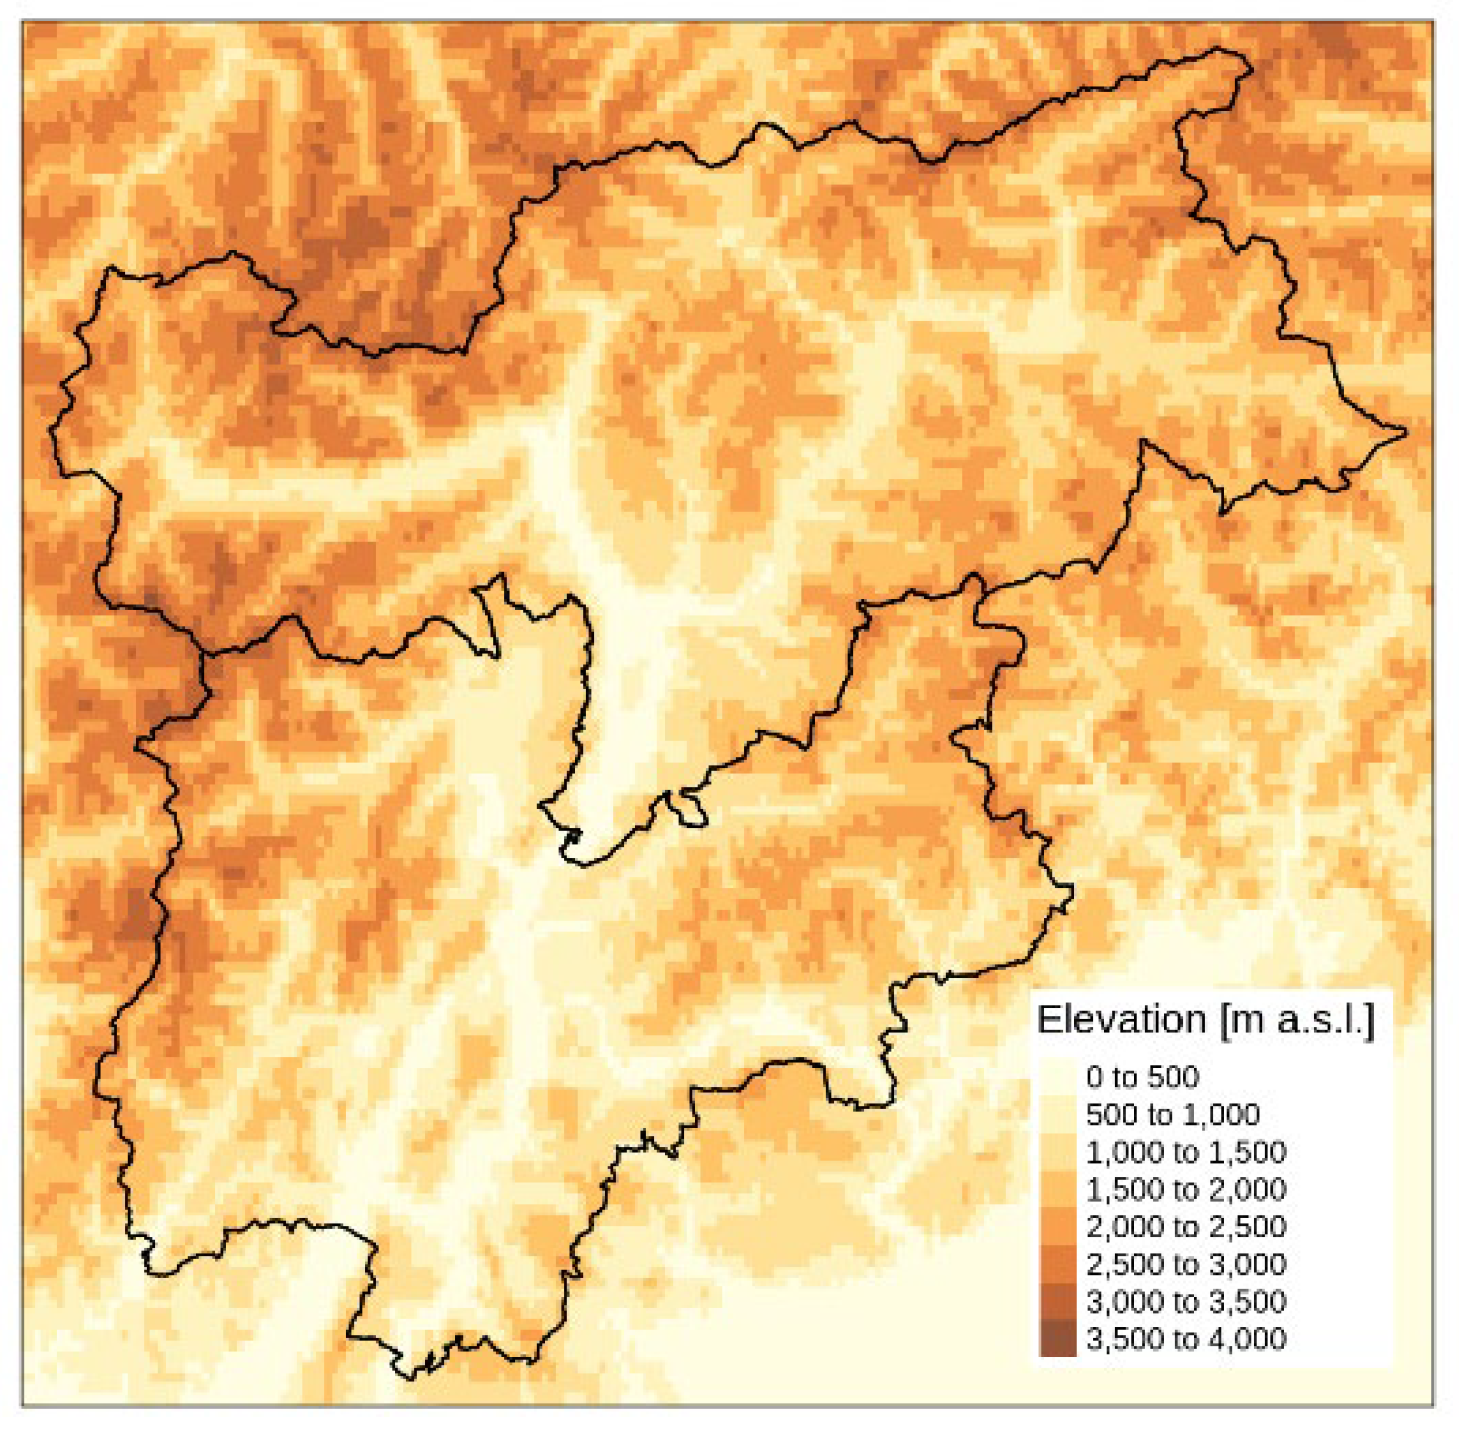
Trentino-South Tyrol is the northernmost region of Italy, comprising the province of Trentino in the south and Bolzano in the north. The total area is around 13,000 km2 and characterized by a rich variety of landscapes. The region is mostly mountainous with a mean elevation of about 1600 m and includes the Ötztal Alps and Zillertal Alps in the north, the Ortles-Cevedale group in the west, and a large portion of Dolomites in the east. The territory is characterized by strong altitude gradients with very narrow valleys surrounded by steep slopes. Elevation range extends from 65 m in the areas close to Lake Garda in the south to 3905 m of the Ortles peak in the Stelvio National Park (north-west). The climate of the region is influenced by humid air masses from the Atlantic north-west, dry air masses from the continental east, typically determining cold winters and warm summers, and warm contributions from the Mediterranean bringing humid winters and dry summers (Adler et al., 2015). The geographical location together with the complex topography determine a strong climate variability throughout the region and contribute to define small-scale climate conditions (Price, 2009).
Figure 3.
Orography of the study region.
4. Data and Methods
climdex-kit was designed and applied to an ensemble of regional climate model projections of daily minimum and maximum temperature and daily total precipitation covering the period 1971 – 2100 and relative to two future emission scenarios. More specifically, they were based on the model simulations of the EURO-CORDEX initiative for the RCP 4.5 and RCP 8.5 scenarios and for the 11°x11° European grid (EUR-11 domain). The ensemble included 15 models for temperature and 11 models for precipitation for each scenario (Table 1). If multiple realizations were available for the same model, only one was considered, while the model versions were selected based on the recommendations reported in the EURO-CORDEX Errata Table (https://ms.hereon.de/euro-cordex/078730/index.php.en).
In order to increase the spatial representativeness of climate simulations for Trentino-South Tyrol, all model data were downscaled from the original EURO-CORDEX grid to a target 1-km grid. All model simulations were bilinearly interpolated onto the 1-km grid and a Quantile Delta Mapping (QDM) (Cannon et al., 2015) was applied in order to adjust the systematic biases of model simulations against a set of reference observations. More details on QDM are reported in the Appendix C.
The reference data used for the bias adjustment were derived from a dense and quality-checked archive including more than 250 series of daily observations collected by the regional weather station network. The daily data for both temperature (maximum and minimum) and precipitation were gridded onto a 1-km grid by means of a two-step interpolation procedure as described in (Crespi et al., 2021). In order to assure the internal consistency of gridded maximum and minimum temperature values, i.e., maxima greater than minima, only maximum temperature values were interpolated directly, while the fields of minimum temperature were derived by interpolating the diurnal temperature range (difference between maximum and minimum temperature) and subtracting it from the maximum temperature grids.
5. The Regional Application
The downscaled ensemble of projected climate indicators was used to analyse the future variability in both temperature and precipitation-related conditions over the study region and to assess the associated uncertainty. By means of the functionalities provided by climdex-kit, several graphs and statistics for a subset of available indicators were customized and combined in order to understand the spatial and temporal changes in both mean and extreme climate features until 2100, with a specific focus on the middle of the century, which is particularly relevant in the context of regional adaptation planning.
By considering a subset of models providing both temperature and precipitation simulations, the projected changes by 2100 for the region cover a certain range of possible climate evolution. While a temperature increase is projected by all models and both seasons in the range of +1-3 °C for RCP 4.5 and +3-5 °C for RCP 8.5, precipitation changes are more spread. In particular, models agree to report wetter winters with up to +40 % of precipitation with respect to the baseline period, while both wetter and drier summers are depicted (Figure 4: ). These differences remark the need to take in account ensembles of models for the assessment of future climate and the level of related uncertainty.
Besides mean climate conditions, it is crucial to extract and evaluate potential changes in extremes of both temperature and precipitation in order to provide meaningful information supporting the assessment of future risks and adaptation options in specific sectors, e.g., health, water management, agriculture and infrastructure. For instance, future variations in the frequency of hot conditions both in the maximum and minimum temperatures can turn into potential impacts on health, especially if high temperatures are companied by high values of humidity which increases the heat perceived by human bodies (Scoccimarro et al., 2017), agriculture, e.g., by causing phenological shifts or crop damages, as well as energy, e.g. by varying energy demand for cooling (Castaño-Rosa et al., 2021).
Extreme conditions can be described by indices accounting for days in a period, e.g., year or season, with temperature or precipitation exceeding a certain threshold. Such a threshold can be based on either a fixed or a percentile-based value. The first definition allows for an easier interpretation of results and a flexible application in specific sectors adopting a pre-defined threshold for measuring, for example, the heat stress for people, phenological phases for specific agricultural crops or a critical rainfall level for slope stability (Peruccacci et al., 2017). Percentile-based thresholds allow to evaluate extreme conditions in proportion to local climate as well as the period of the year and, by changing the chosen percentile, they are more flexible to analyze events with different occurrence frequencies. In addition, percentile-based definitions are less affected by potential model biases than indices using fixed thresholds (Crespi et al., 2020).
Extreme hot conditions in Trentino-South Tyrol were analyzed by considering both minimum and maximum temperature exceedances by means of four indices available from climdex-kit: summer days (SU) and tropical nights (TR) considering a fixed exceedance level and warm days (TX90p) and warm nights (TN90p) which adopt a percentile as thresholds (see Table 2 for index definitions).
The indices using fixed values to identify hot conditions are more influenced by the local climate features and the spatial distribution of changes for both indices is mostly driven by the elevation. Summer days are expected to increase throughout the region, with the highest changes, in absolute terms, below 1500 m and up to + 40 days (ensemble mean) under RCP 8.5. Areas above a certain elevation do not show any change, since the threshold of 25 °C for maximum temperature is never exceeded even in the future. Projected positive changes are robust (i.e., all models show the same change direction) and significant over 84 % (RCP 4.5) and 87 % (RCP 8.5) of the region. By averaging over all grid points at lower elevations, i.e. below 700 m, which correspond to around 10 % of the region, the deviation between the two scenarios starts to increase after 2050 and by the end of the century the low-elevation areas are projected to experience a continuous increase and reach 140 summer days per year under RCP 8.5 (ensemble median), while the median of simulations under RCP 4.5 stabilizes at around 110 days per year.
Figure 5.
Projected values and changes for SU (a,b) and TR (c,d) in 2041–2070 from the mean of the model ensemble and under the two RCPs. The changes are computed as differences from 1981–2010.
Figure 5.
Projected values and changes for SU (a,b) and TR (c,d) in 2041–2070 from the mean of the model ensemble and under the two RCPs. The changes are computed as differences from 1981–2010.
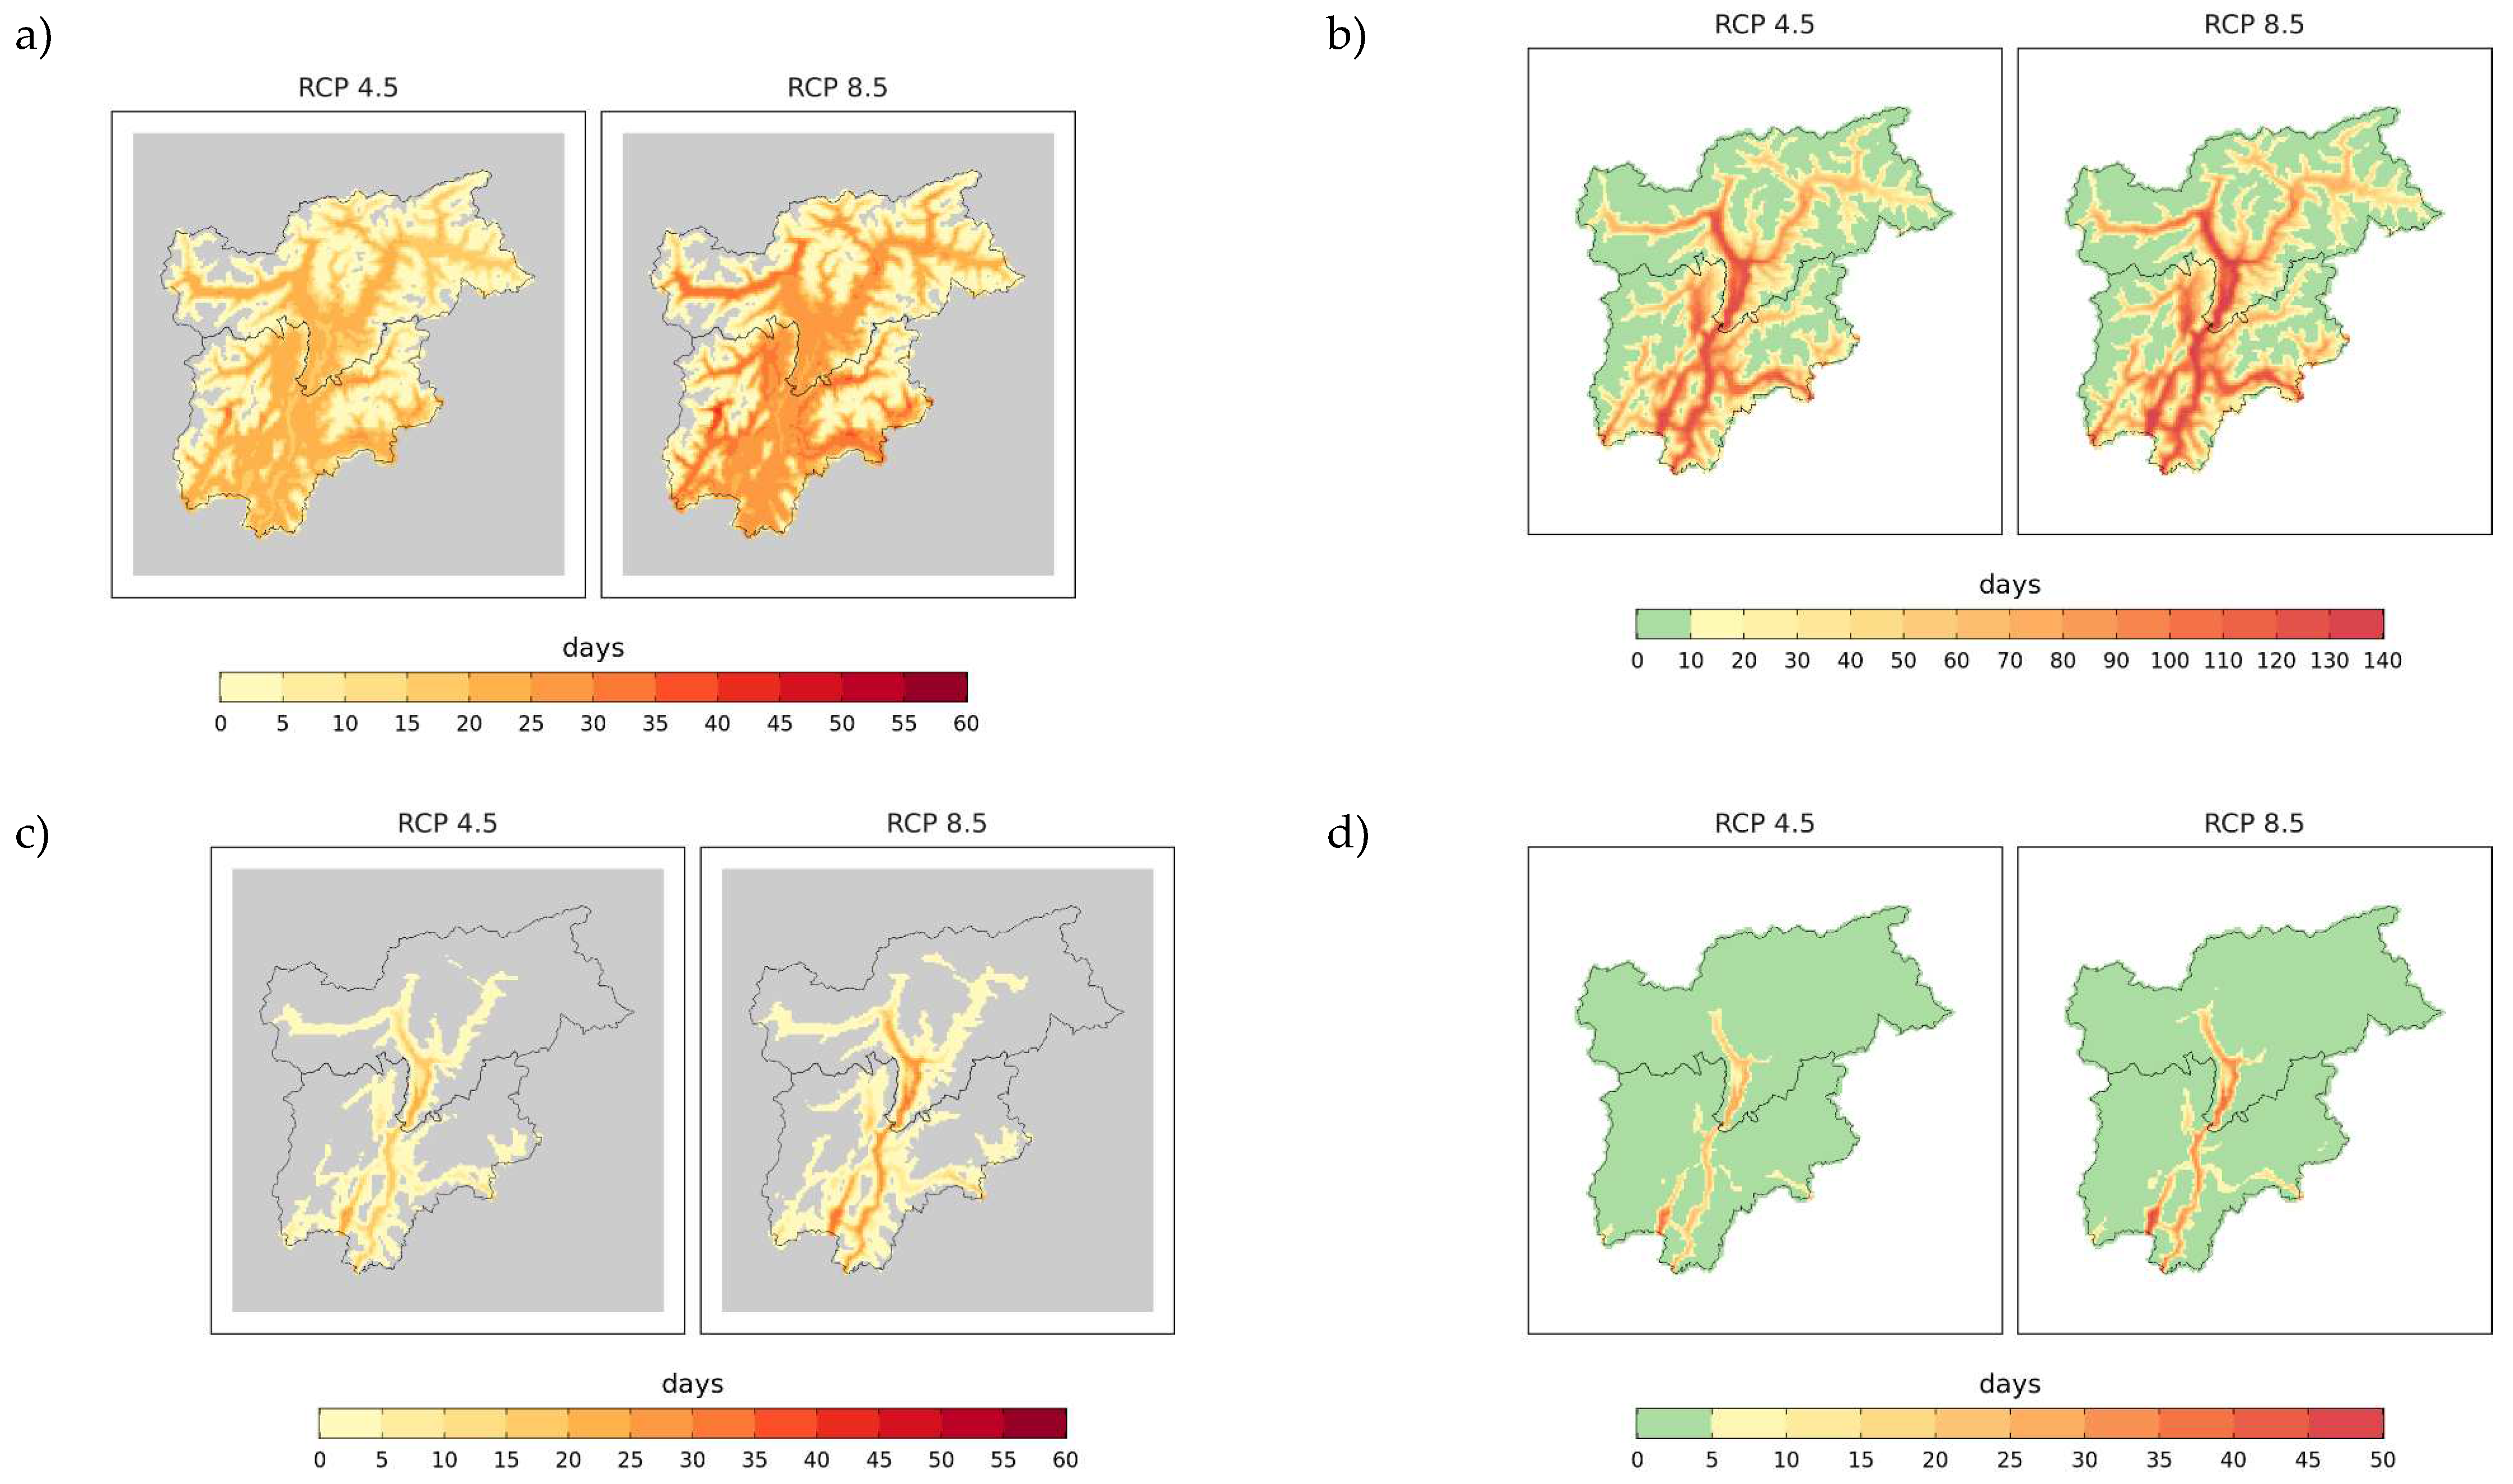
Tropical nights are expected to increase in all inner valleys, especially in the main Adige River valley. In these areas, the annual occurrences of minimum daily temperature above 20 °C are expected to increase up to 30 days under RCP 8.5 with respect to the baseline and reach almost 50 days per year until 2070, especially in the southernmost part of the region (close to lake Garda) and in the southern South Tyrol (Bassa Atesina). TR changes are positive and significant for about 21 % and 27 % of the region under RCP 4.5 and RCP 8.5, respectively, which correspond to grid points located at a mean elevation of 700 m and 800 m, respectively. By averaging over all grid points below 700 m the transient time series (Figure 6) shows that the difference between RCPs starts to increase after 2030 and by the end of the century TR remains below 15 days (ensemble median) under RCP 4.5, while it is more than 40 days per year under the high-emission scenario.
Similar findings are obtained from percentile-based indices, however in this case the potential changes in extreme temperature conditions are evaluated with respect to the local climate conditions and significant increases can arise even for the high-elevation areas.
Figure 7.
Projected values and changes for TX90p (a,b) and TN90p (c,d) in 2041–2070 from the mean of the model ensemble and under the two RCPs. The changes are computed as differences from 1981–2010.
Figure 7.
Projected values and changes for TX90p (a,b) and TN90p (c,d) in 2041–2070 from the mean of the model ensemble and under the two RCPs. The changes are computed as differences from 1981–2010.
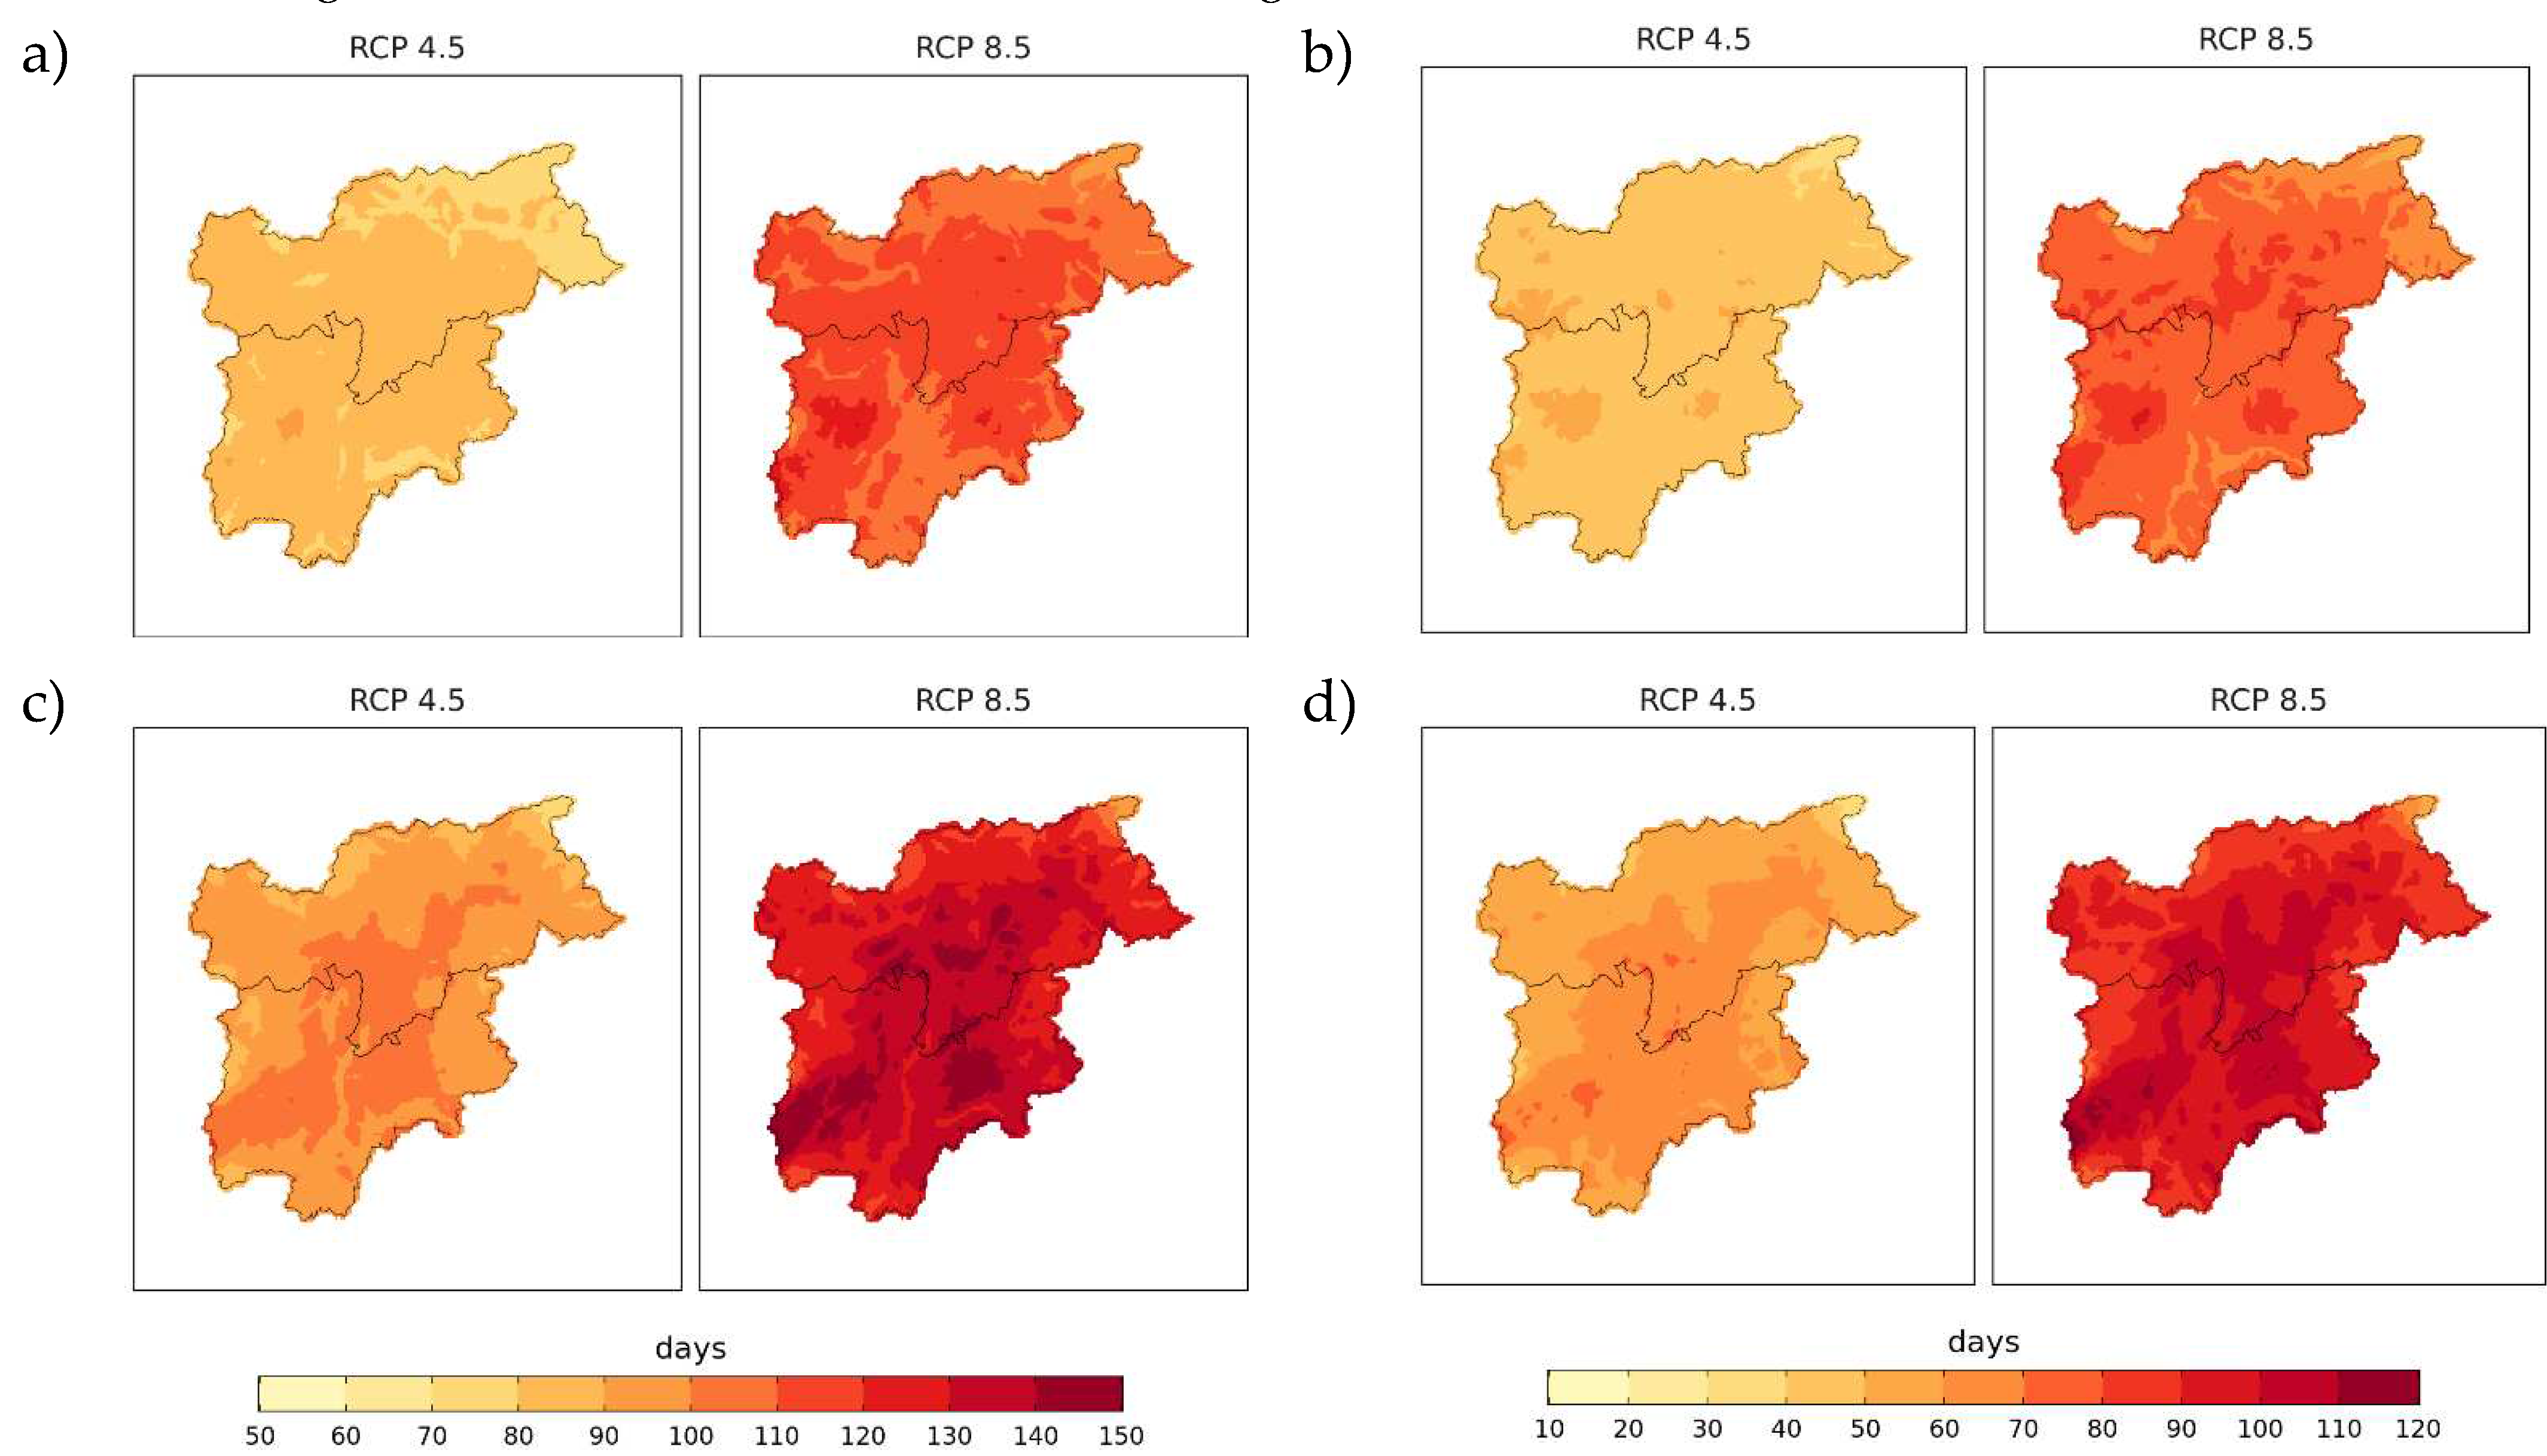
The mean of the model ensemble for 2041–2070 reports higher TX90p and TN90p values in the central portion of the region where the number of days in a year with exceeding temperatures is up to 120 (TX90) and 150 (TN90p) under RCP 8.5. The lowest frequency of both warm days and warm nights is reported in the north-eastern portion of the region. Future values of both indices are subjected to an increase with respect to the baseline period (1981–2010) throughout the domain. Based on the ensemble mean TX90p increases up to +50 days under RCP 4.5 and up to +100 days under RCP 8.5, while increases in TN90p are more pronounced and exceed + 100 days, especially in the inner valleys, under RCP 8.5 (Figure 7). The ensemble spread becomes larger in future periods, especially under RCP 8.5, and the differences between the two RCPs are greater for TN90p, especially in the far future (Figure 8). By considering the maps of relative changes as percentages with respect to 1981–2010, the indices in 2041–2070 are expected to be three times as their values in the baseline over most of the region. The direction of change is the same for the whole model ensemble and the changes are statistically significant over all grid cells.
In order to analyze the transient simulation throughout the century, the boxplots can be replaced by the time series of indices from all model ensemble where the median of models is displayed together with the 5th-95th percentile range of simulations as in Figure 6.
The projected increase in all temperature-related indices can be further evaluated through the distribution of daily maximum and minimum temperatures. Daily temperatures in summer (from June to August) reported a positive shift in the mean and an increase in the spread of the distribution in 2041–2070 for both scenarios and all ensemble model simulations (Figure S1 and Figure S2 in supplementary material). However, the distribution is narrower for minimum temperature, i.e., daily variability is lower, than for maximum temperature. It suggests that a relatively limited increase in the mean can produce larger variations in the exceedance values, as obtained for the projected changes in TN90p and TX90p (Dosio, 2016; Lustenberger et al., 2014).
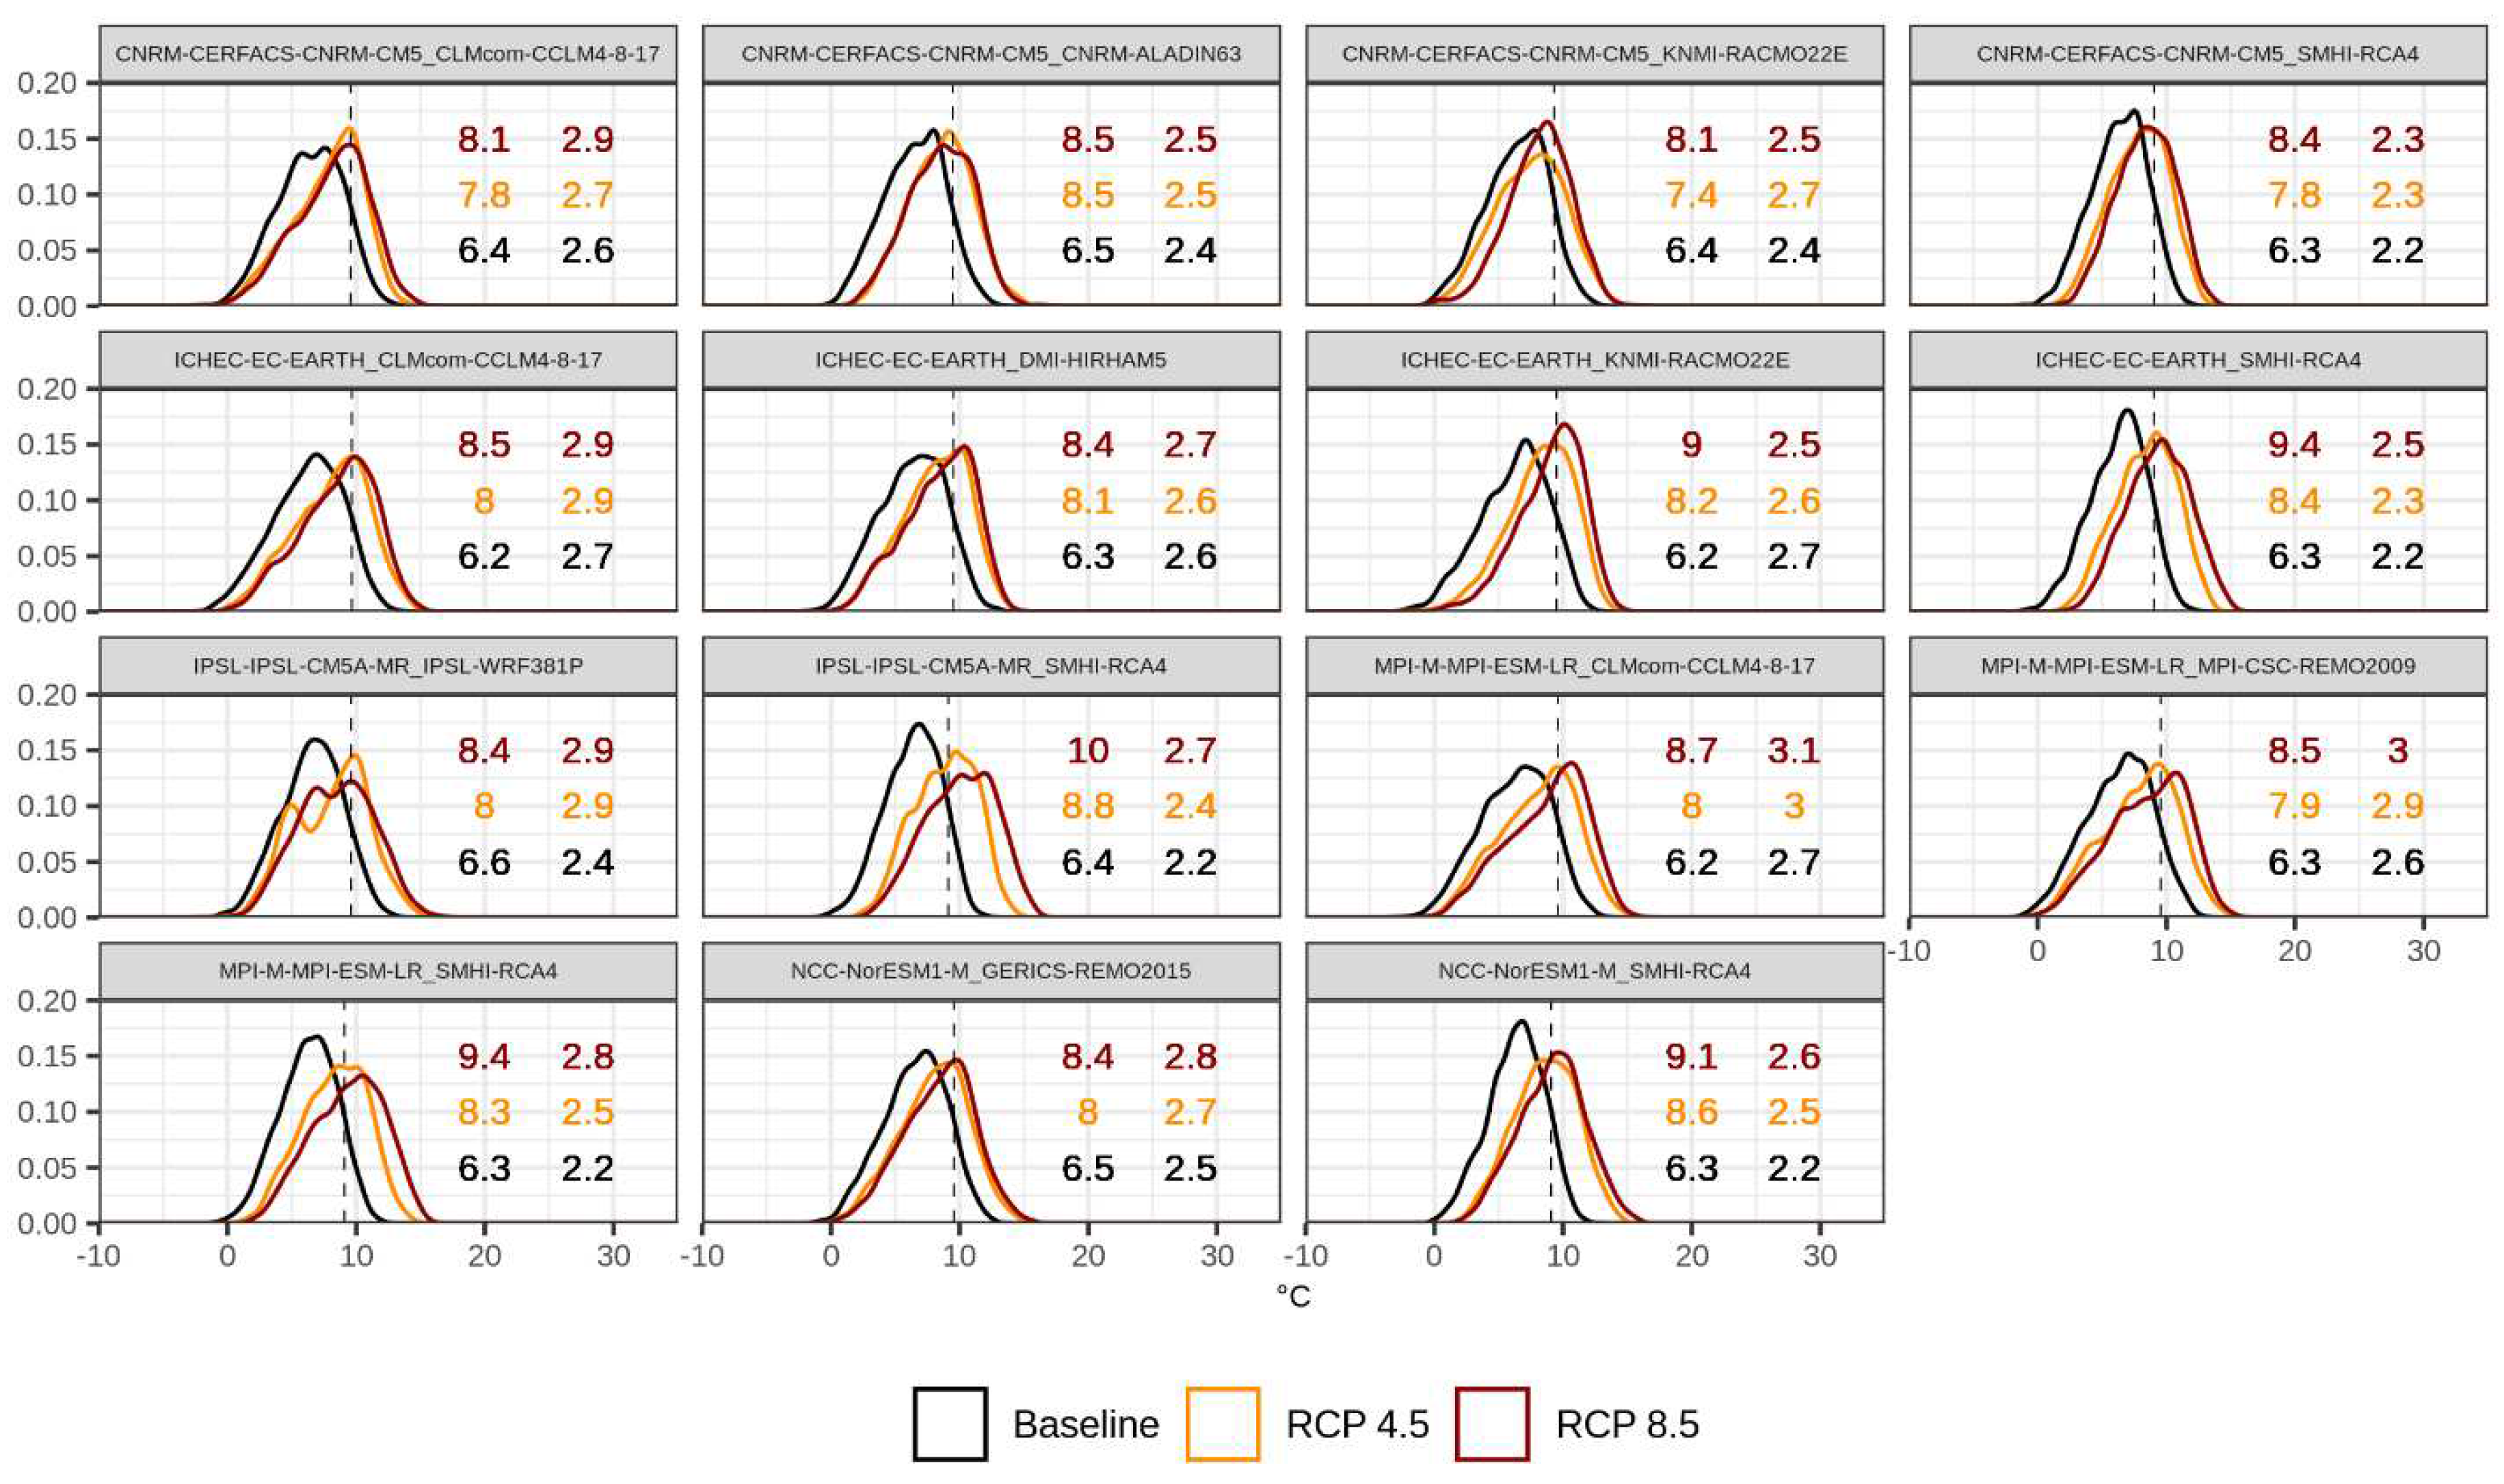
Figure 9.
Probability distribution function of daily maximum temperature in summer (June to August) of individual simulations in the baseline (1981–2010) and future period (2041–2070) for two RCPs. The vertical line reports the 90th percentile computed over the baseline and the numbers represent the mean (right column) and the standard deviation (left column) for each scenario.
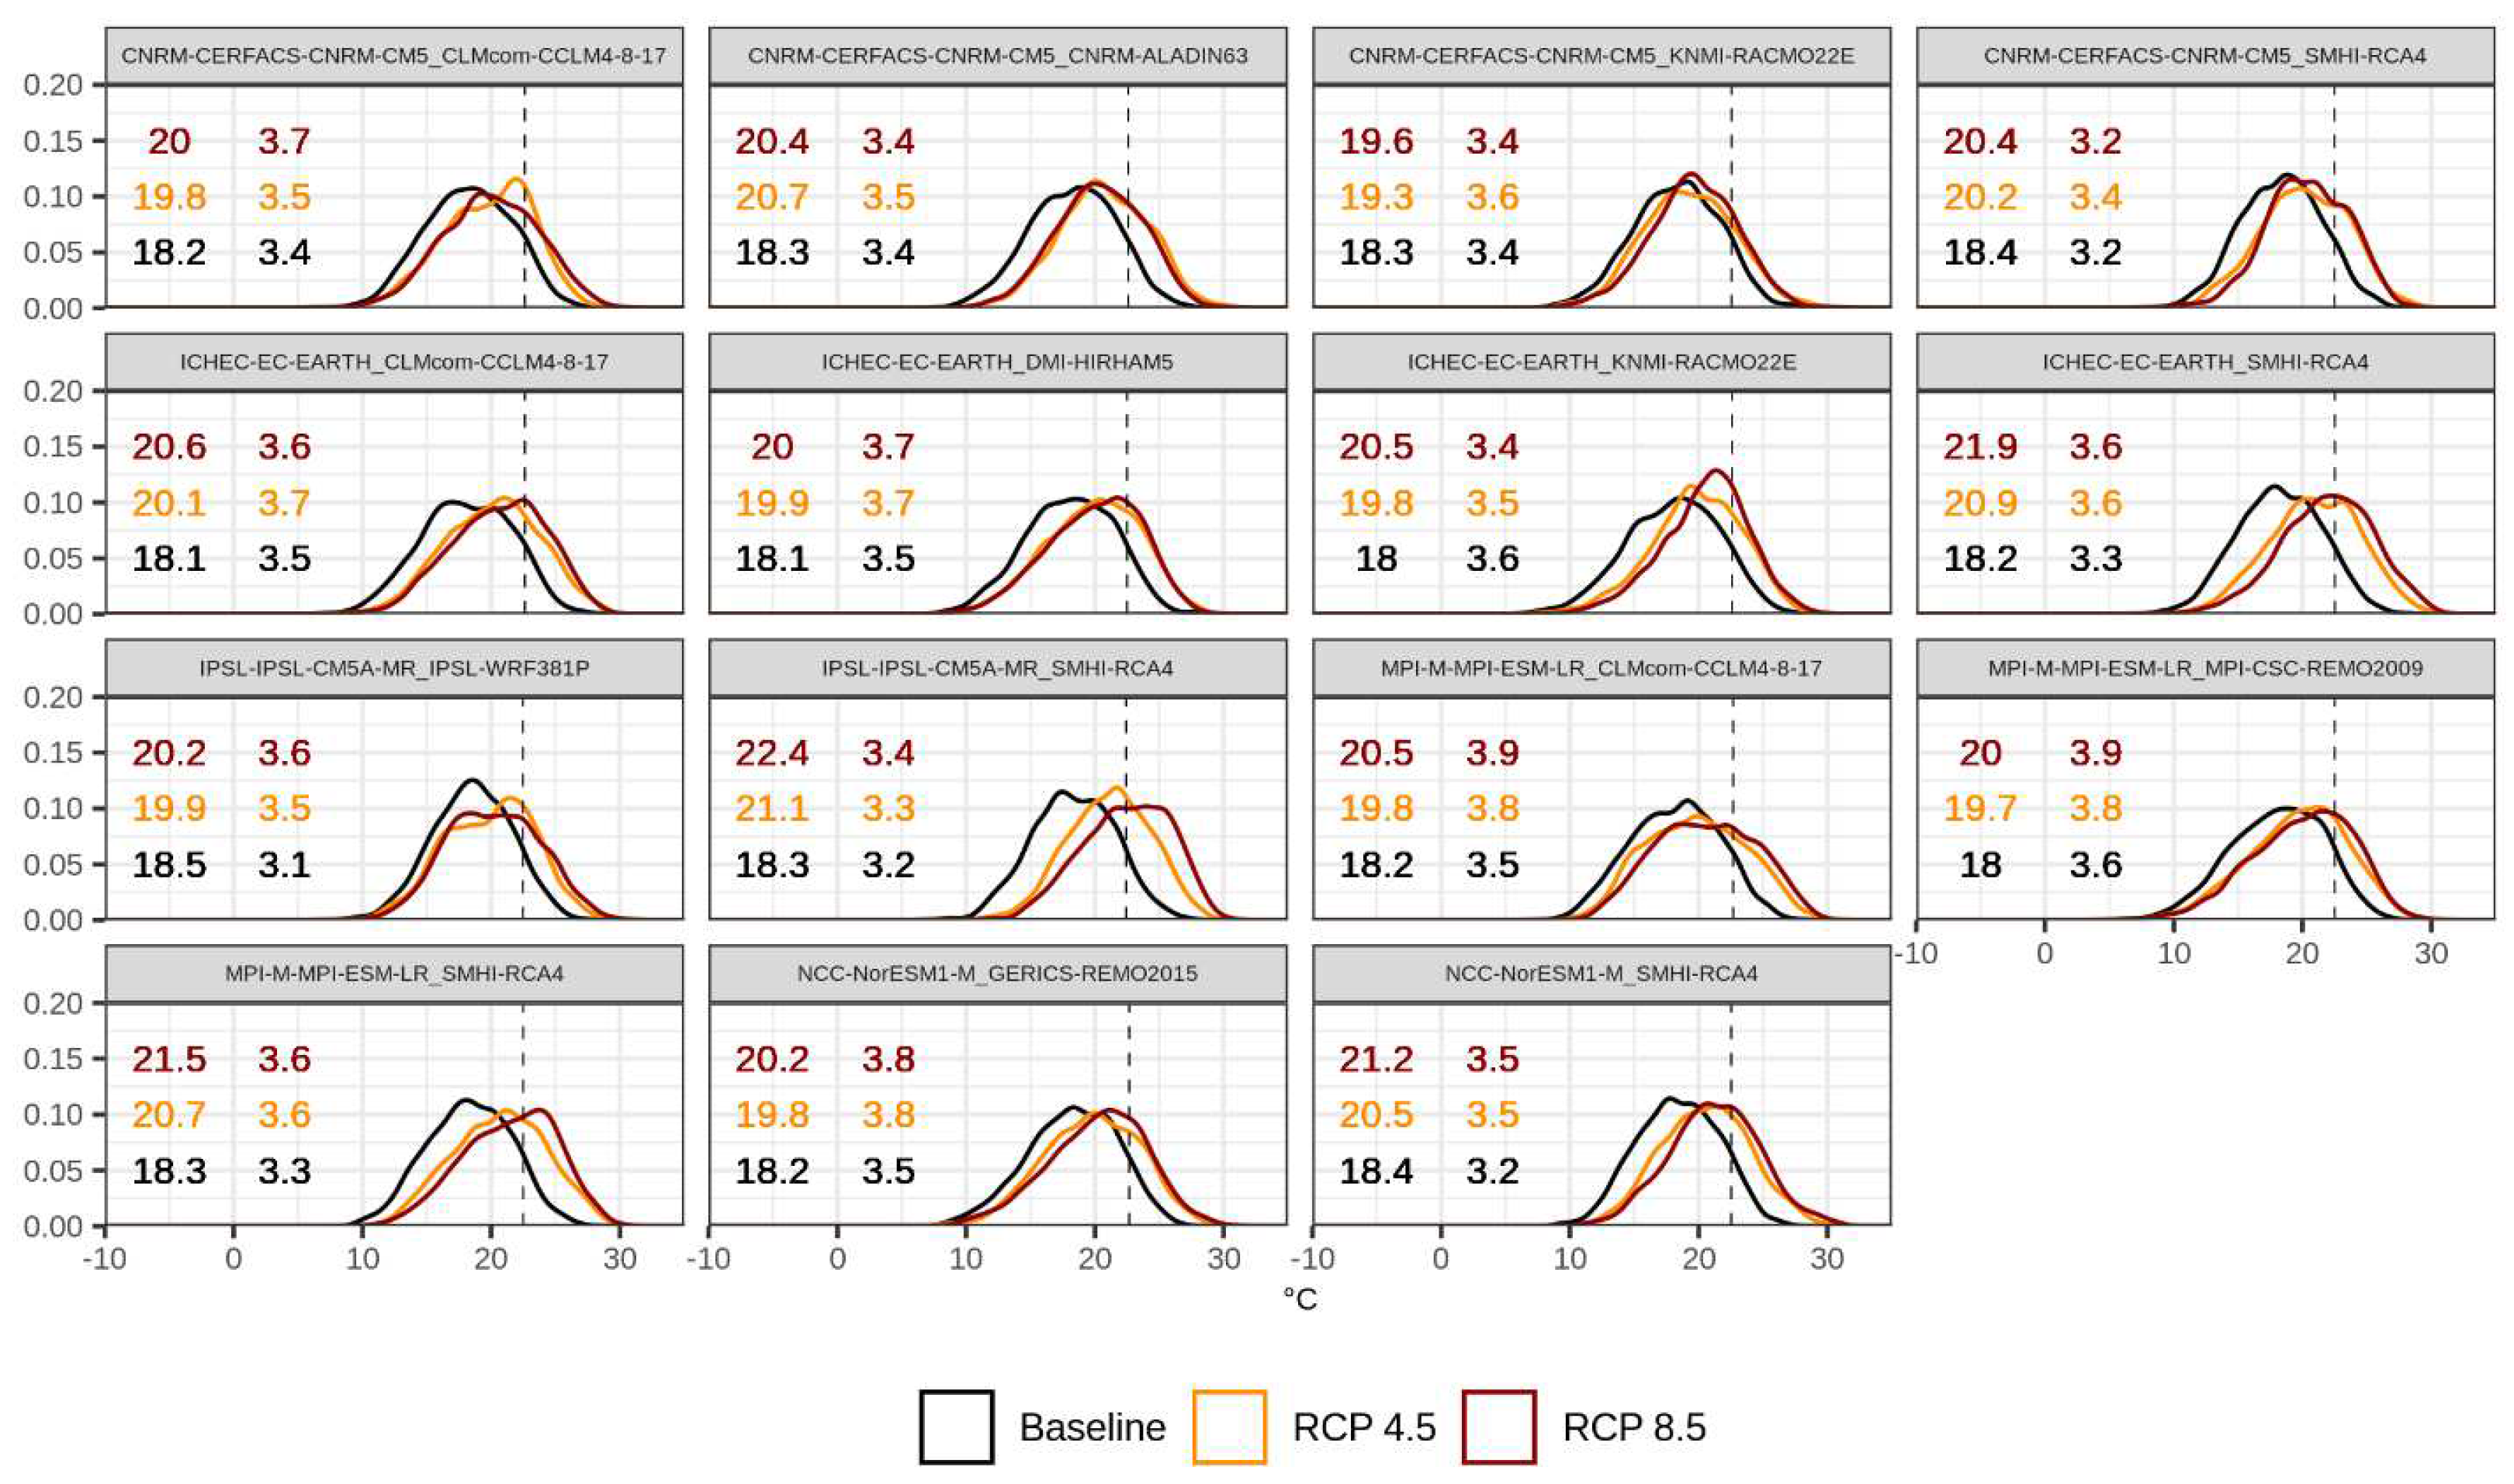
Figure 10.
Same as Figure 9 but for daily minimum temperature.
Figure 10.
Same as Figure 9 but for daily minimum temperature.
A similar analysis can be carried out for the evaluation of precipitation extremes in future climate. As example, the indices Rx5day, R95pTOT and R95pDAY were considered since they allow to assess different characteristic of extreme conditions. Rx5day provides a representation of the annual maximum intensity of short-duration rainfall extremes, i.e., cumulated over a 5-day window. Increases in the index are likely to turn out in increasing risk of river flooding and gravitational mass movements with impacts on both natural and urban environments (Coscarelli et al., 2021). R95pTOT and R95pDAY measure the total magnitude and frequency in a year of very wet days and represent complementary information for assessing and comparing future flood risk in different locations as well as the future occurrence of hazardous conditions (Hänsel et al., 2022).
For both Rx5day and R95pTOT, changes are expressed as percentage differences with respect to the values in the baseline, since they allow to better compare the relevance of changes across areas characterized by a different precipitation regime. By considering the mean ensemble changes, the precipitation extremes are projected to increase throughout the region and the signal turns out to be robust and significant for almost all grid points, especially for R95pTOT. The greater changes in the annual 5-day precipitation maximum are reported under RCP 8.5 for the central portion of the region where increases up to 15 % are projected (Figure 11a). The relative increase in R95pTOT by the middle of the century is stronger especially in the northern part of the region and over the central Adige River valley where the annual sum of daily precipitation exceeding the local 95th percentile is projected to be more than 30 % greater than current values (Figure 11b). It is necessary to consider that while projected climate fields at km scale are particularly useful for running impact models, the very local spatial patterns of changes can be partly affected and hampered by the pointwise bias-correction process and have to be considered cautiously by the users.
The overall positive multi-model mean changes showed in the maps are also confirmed by single model simulations. All model projected higher values of Rx5day and R95pTOT for both the middle and the end of the century at regional level. The spread of the ensemble remains almost invariant across the three 30-year periods considered and comparable between the two RCP scenarios (Figure 12).
Similar to the results for magnitude, also the frequency of daily exceedances report increases throughout the region and the signal is robust and significant for almost all points of the grid. As regional averages, the annual frequency of very wet days is projected to increase in 2041–2070 of around + 13 % and + 21 % (ensemble median) with respect to the baseline. However, if absolute changes are considered the increases are rather limited and in the range of + 0.5-2.0 days per year (figures not shown).
6. Conclusions and Outlook
The open source tool climdex-kit is intended to help researchers and decision makers to derive and analyse information on climate change through a set of functionalities combining the powerfulness of CDO, NCO and Phyton for climate index calculation, data publication and visualization.
Despite being intended for usage and communication to non-technical audience, he current version of the tool addresses expert users with a pre-existing knowledge of programming languages and climate data elaboration. climdex-kit asks the users to specify the input data required for the index computation and they have to be arranged in a pre-defined netCDF structure. Since the current version of the tool is thought to work with climate model projections, the users have to perform a preliminary evaluation of models and scenarios relevant for their analyses. At the current status, no downscaling and bias-correction routines for tailoring input data to specific targets are implemented and users who need to handle with tailored model simulations have to run these tasks before applying climdex-kit, as in the example presented in this paper.
climdex-kit adopts the model-ensemble approach and indices are computed in parallel from multiple emission scenarios and multiple model simulations as specified by the user. The multi-model simulations allow a better understanding of the range of possible future changes and support the robustness assessment of available projections. All these aspects can be directly investigated by the users through the climdex-kit functionalities for data analysis which are developed in Phyton language. They include the visualization of multi-model transient time series of indices and the spatial distribution of projected changes and their robustness as well as absolute values on maps whose settings can be fully defined by the users. In particular, the tool is intended to stress the need of considering the full model ensemble variability when dealing with climate signal by supporting the calculation of several ensemble statistics besides the ensemble mean. The added value of climdex-kit also lies in the fact that expert users can directly compute and investigate in a flexible and consistent way their climate data projections without further developing, implementing and manipulating ad-hoc routines from multiple sources. The first climdex-kit release offers a set of predefined indices, however expert users can extend such set by adding customized calculations while benefitting of the optimized data handling offered by the tool. Analyses and visualization options allow to obtain results which can be discussed and quickly integrated into decision-making processes, while allowing users for the integration of additional analyses and statistical tests.
The “publishing” module of climdex-kit was integrated in order to meet FAIR data principles and encourage the users to upload their index dataset in an open and interoperable platform and all the analyses are applied on the index values from it. While this allows an agile and efficient data management and sharing, it also limits the range of possible developers since such a platform has to be hosted by an organization infrastructure. A future version of the tool will be released and adapted to work also with offline file-system based settings.
climdex-kit integrates and further extends the powerful functionalities of existing software and packages for climate data analyses and visualization by providing a compact tool covering all the processing steps, from the index calculation to index publishing and visualization of analyses. It is expected to represent a core component easing the implementation of effective and scalable climate services. In order to reach such an outcome, the close cooperation of scientists, developers and practitioners is crucial. For instance, it would be important to integrate the offered functionalities and visualization setting in future releases with tailored solutions which are co-developed and co-designed with decision makers and stakeholders in specific sectors.
Native distributed-computing capabilities will also be crucial in the outlook of efficiently manage the steadily larger volumes of climate datasets, not only for climdex-kit to be natively ready for the increased size (and complexity) of the data, but also to properly work as foundation for a climate service that can synthetize information, generate consistent knowledge to the multiple audiences, and foster effective mitigation and adaption strategies.
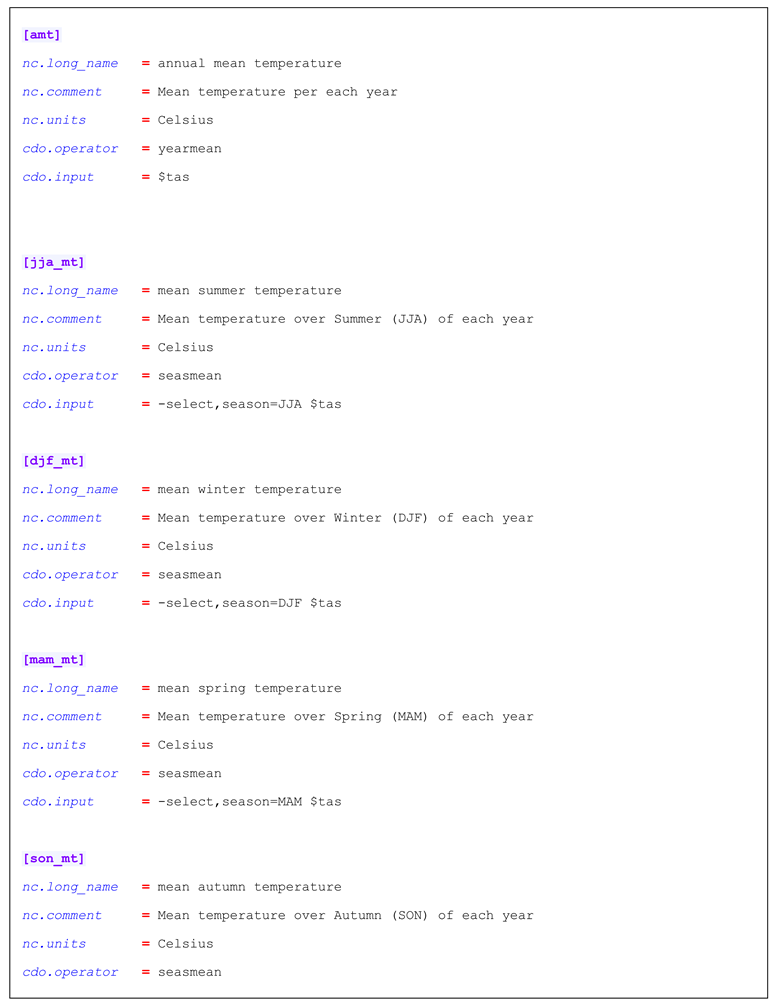
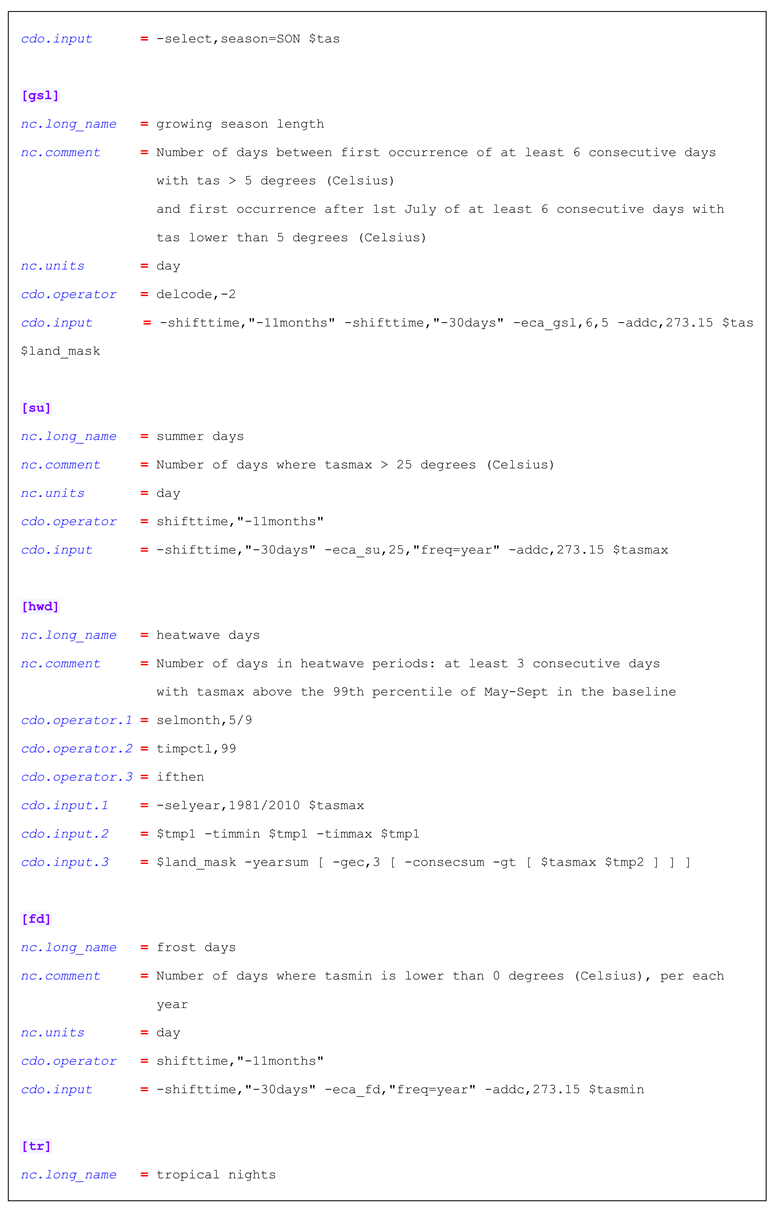
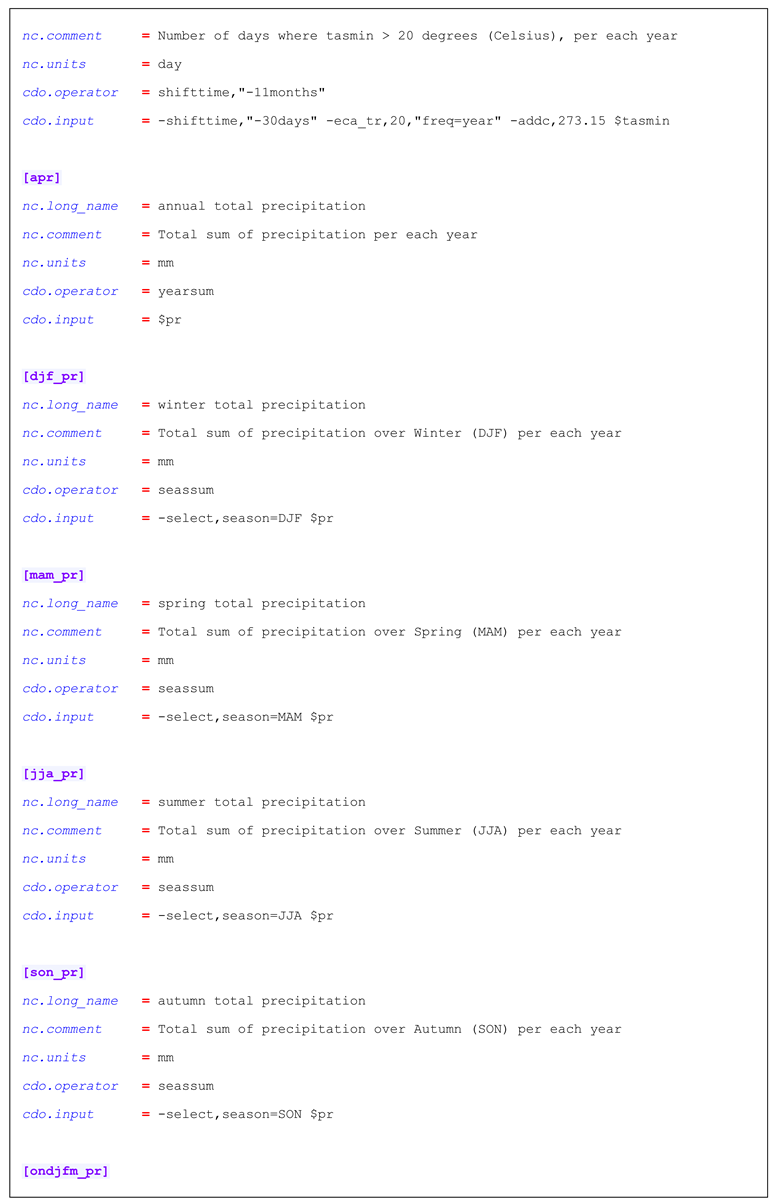
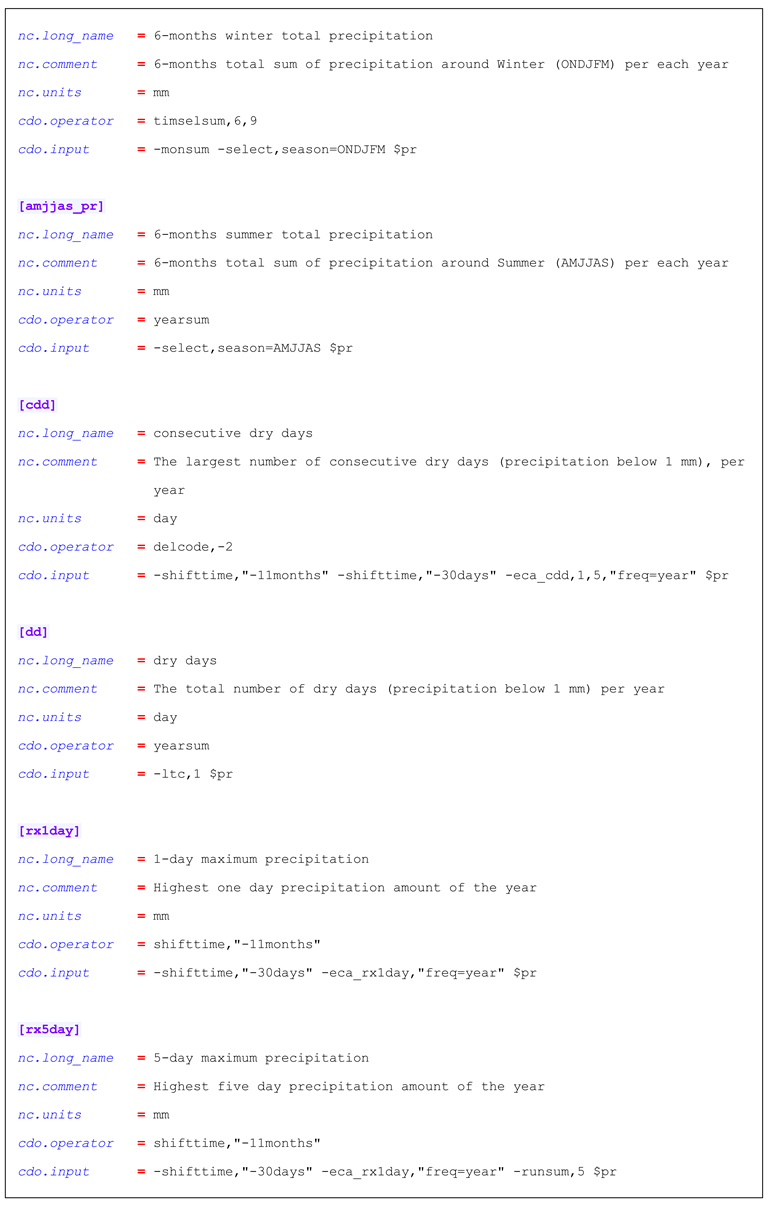
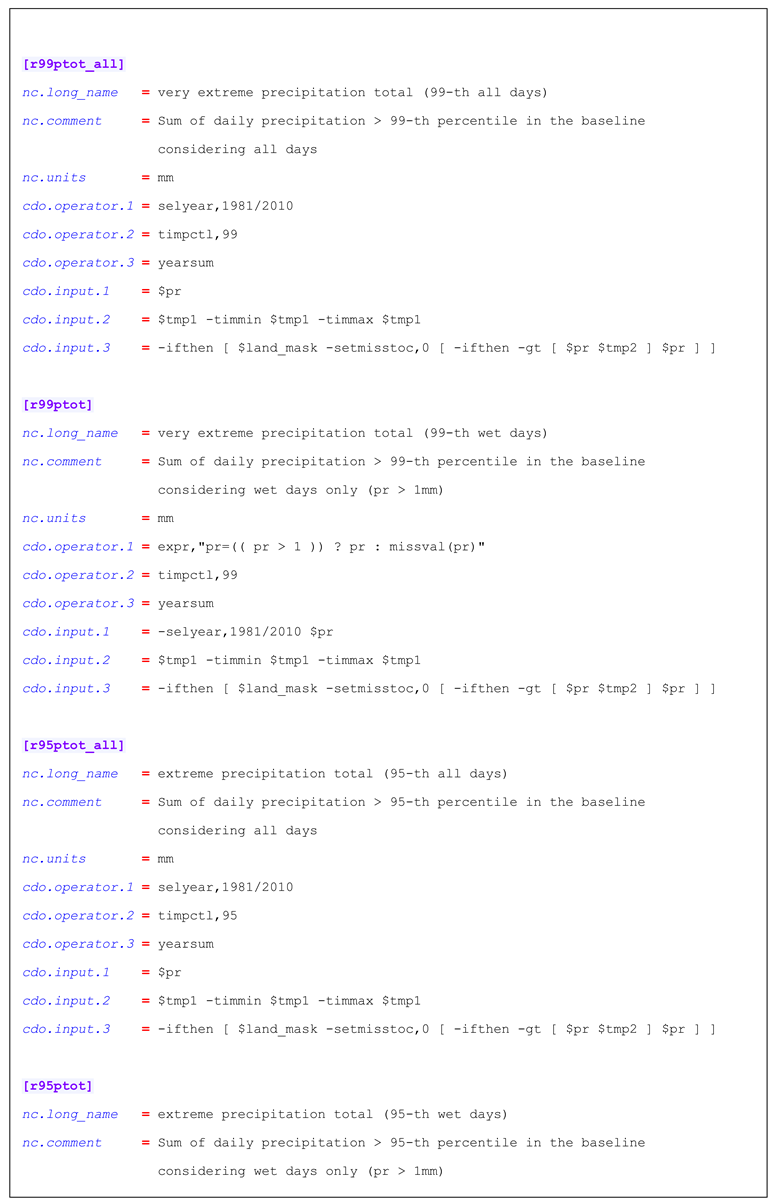
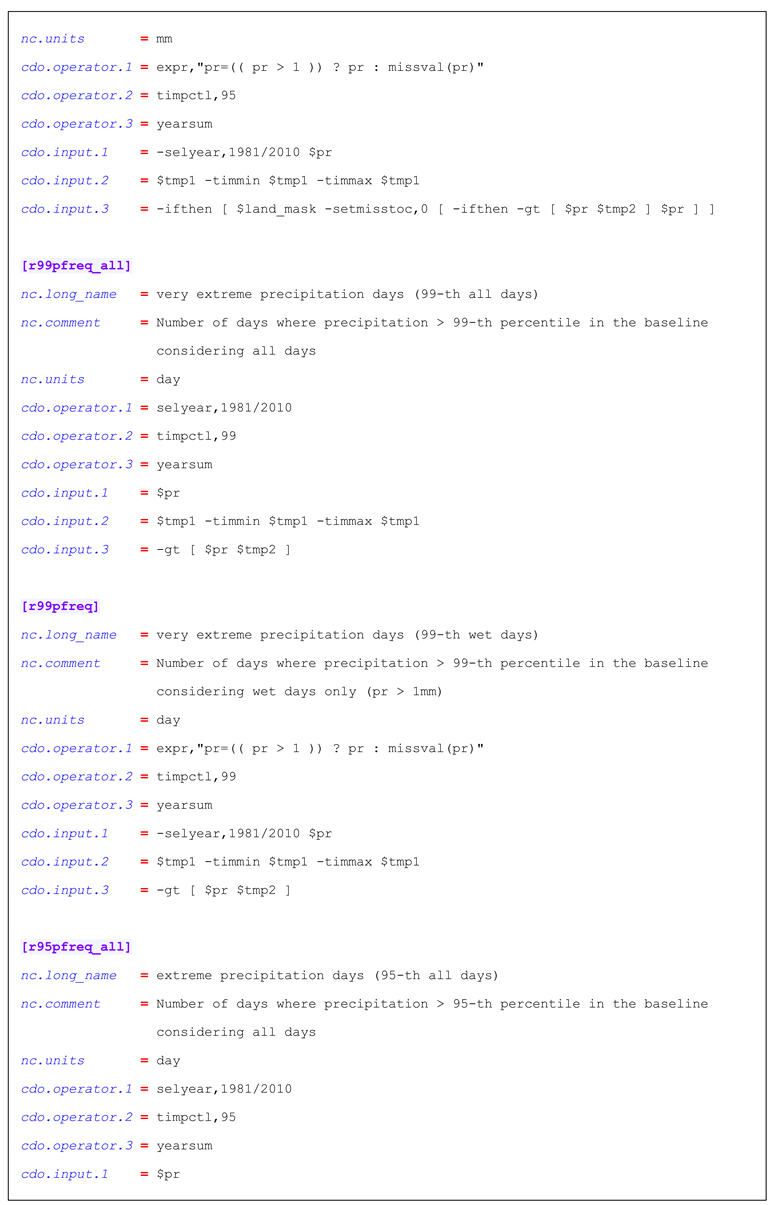
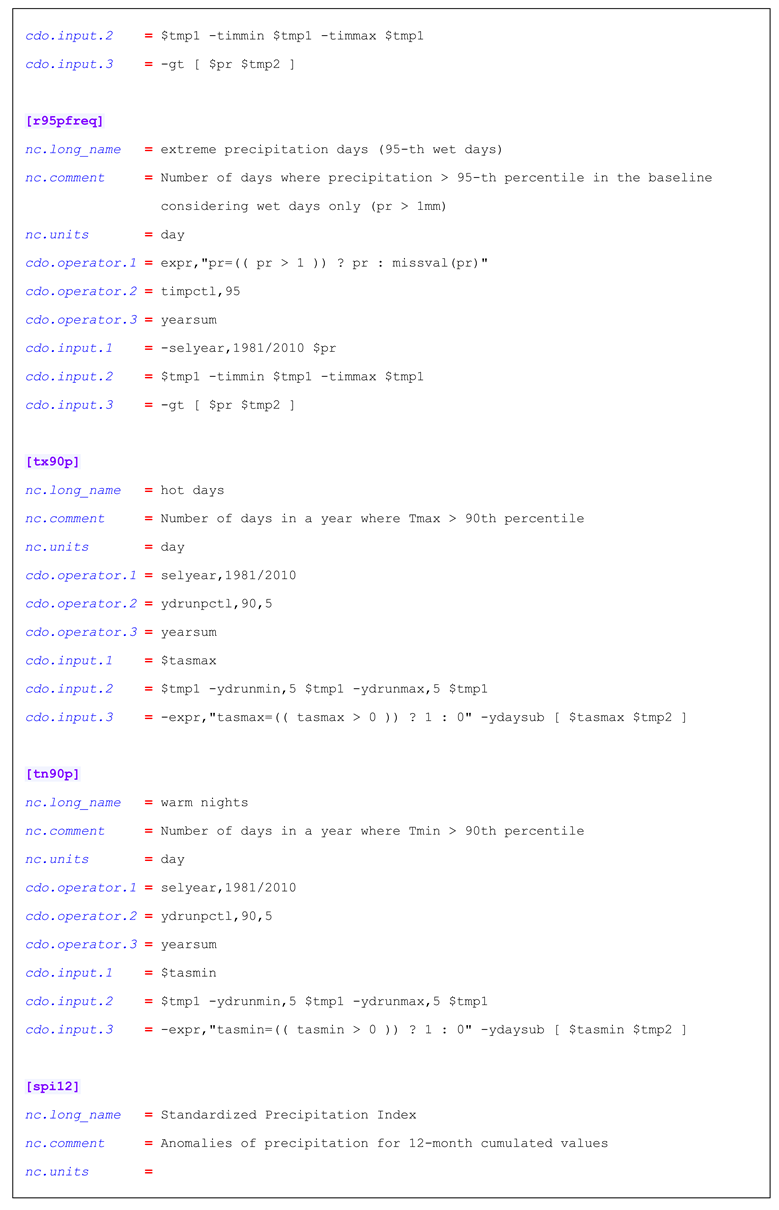
Appendix A. List of Indices
| Listing 6. Complete list of climate indices and their default configuration (taken from the indices.ini file). “nc”-prefixed options relate to the output NetCDF metadata instructions, while “cdo” and “ci”-prefixed ones are specific to the worker that will handle the computation of the index. |
 |
 |
 |
 |
 |
 |
 |
 |
The appendix is an optional section that can contain details and data supplemental to the main text. For example, explanations of experimental details that would disrupt the flow of the main text, but nonetheless remain crucial to understanding and reproducing the research shown; figures of replicates for experiments of which representative data is shown in the main text can be added here if brief, or as Supplementary data. Mathematical proofs of results not central to the paper can be added as an appendix.
Appendix B. Activity Diagrams
In this annex we provide a few additional Unified Modeling Language (UML) activity diagrams, that explain in detail the internal behaviour of the software.
Figure 13.
UML activity diagram of compute command-line action: ellipsoidal elements are activities, rectangular ones are objects, dashed circles are iterative or parallel loops iterating on the variable defined by the contiguous set of boxes along its line (eg. scenario). More articulated activities are marked with the “ሐ” sign. CDOWorker and CIWorker activity details are further expanded in Figure 14.
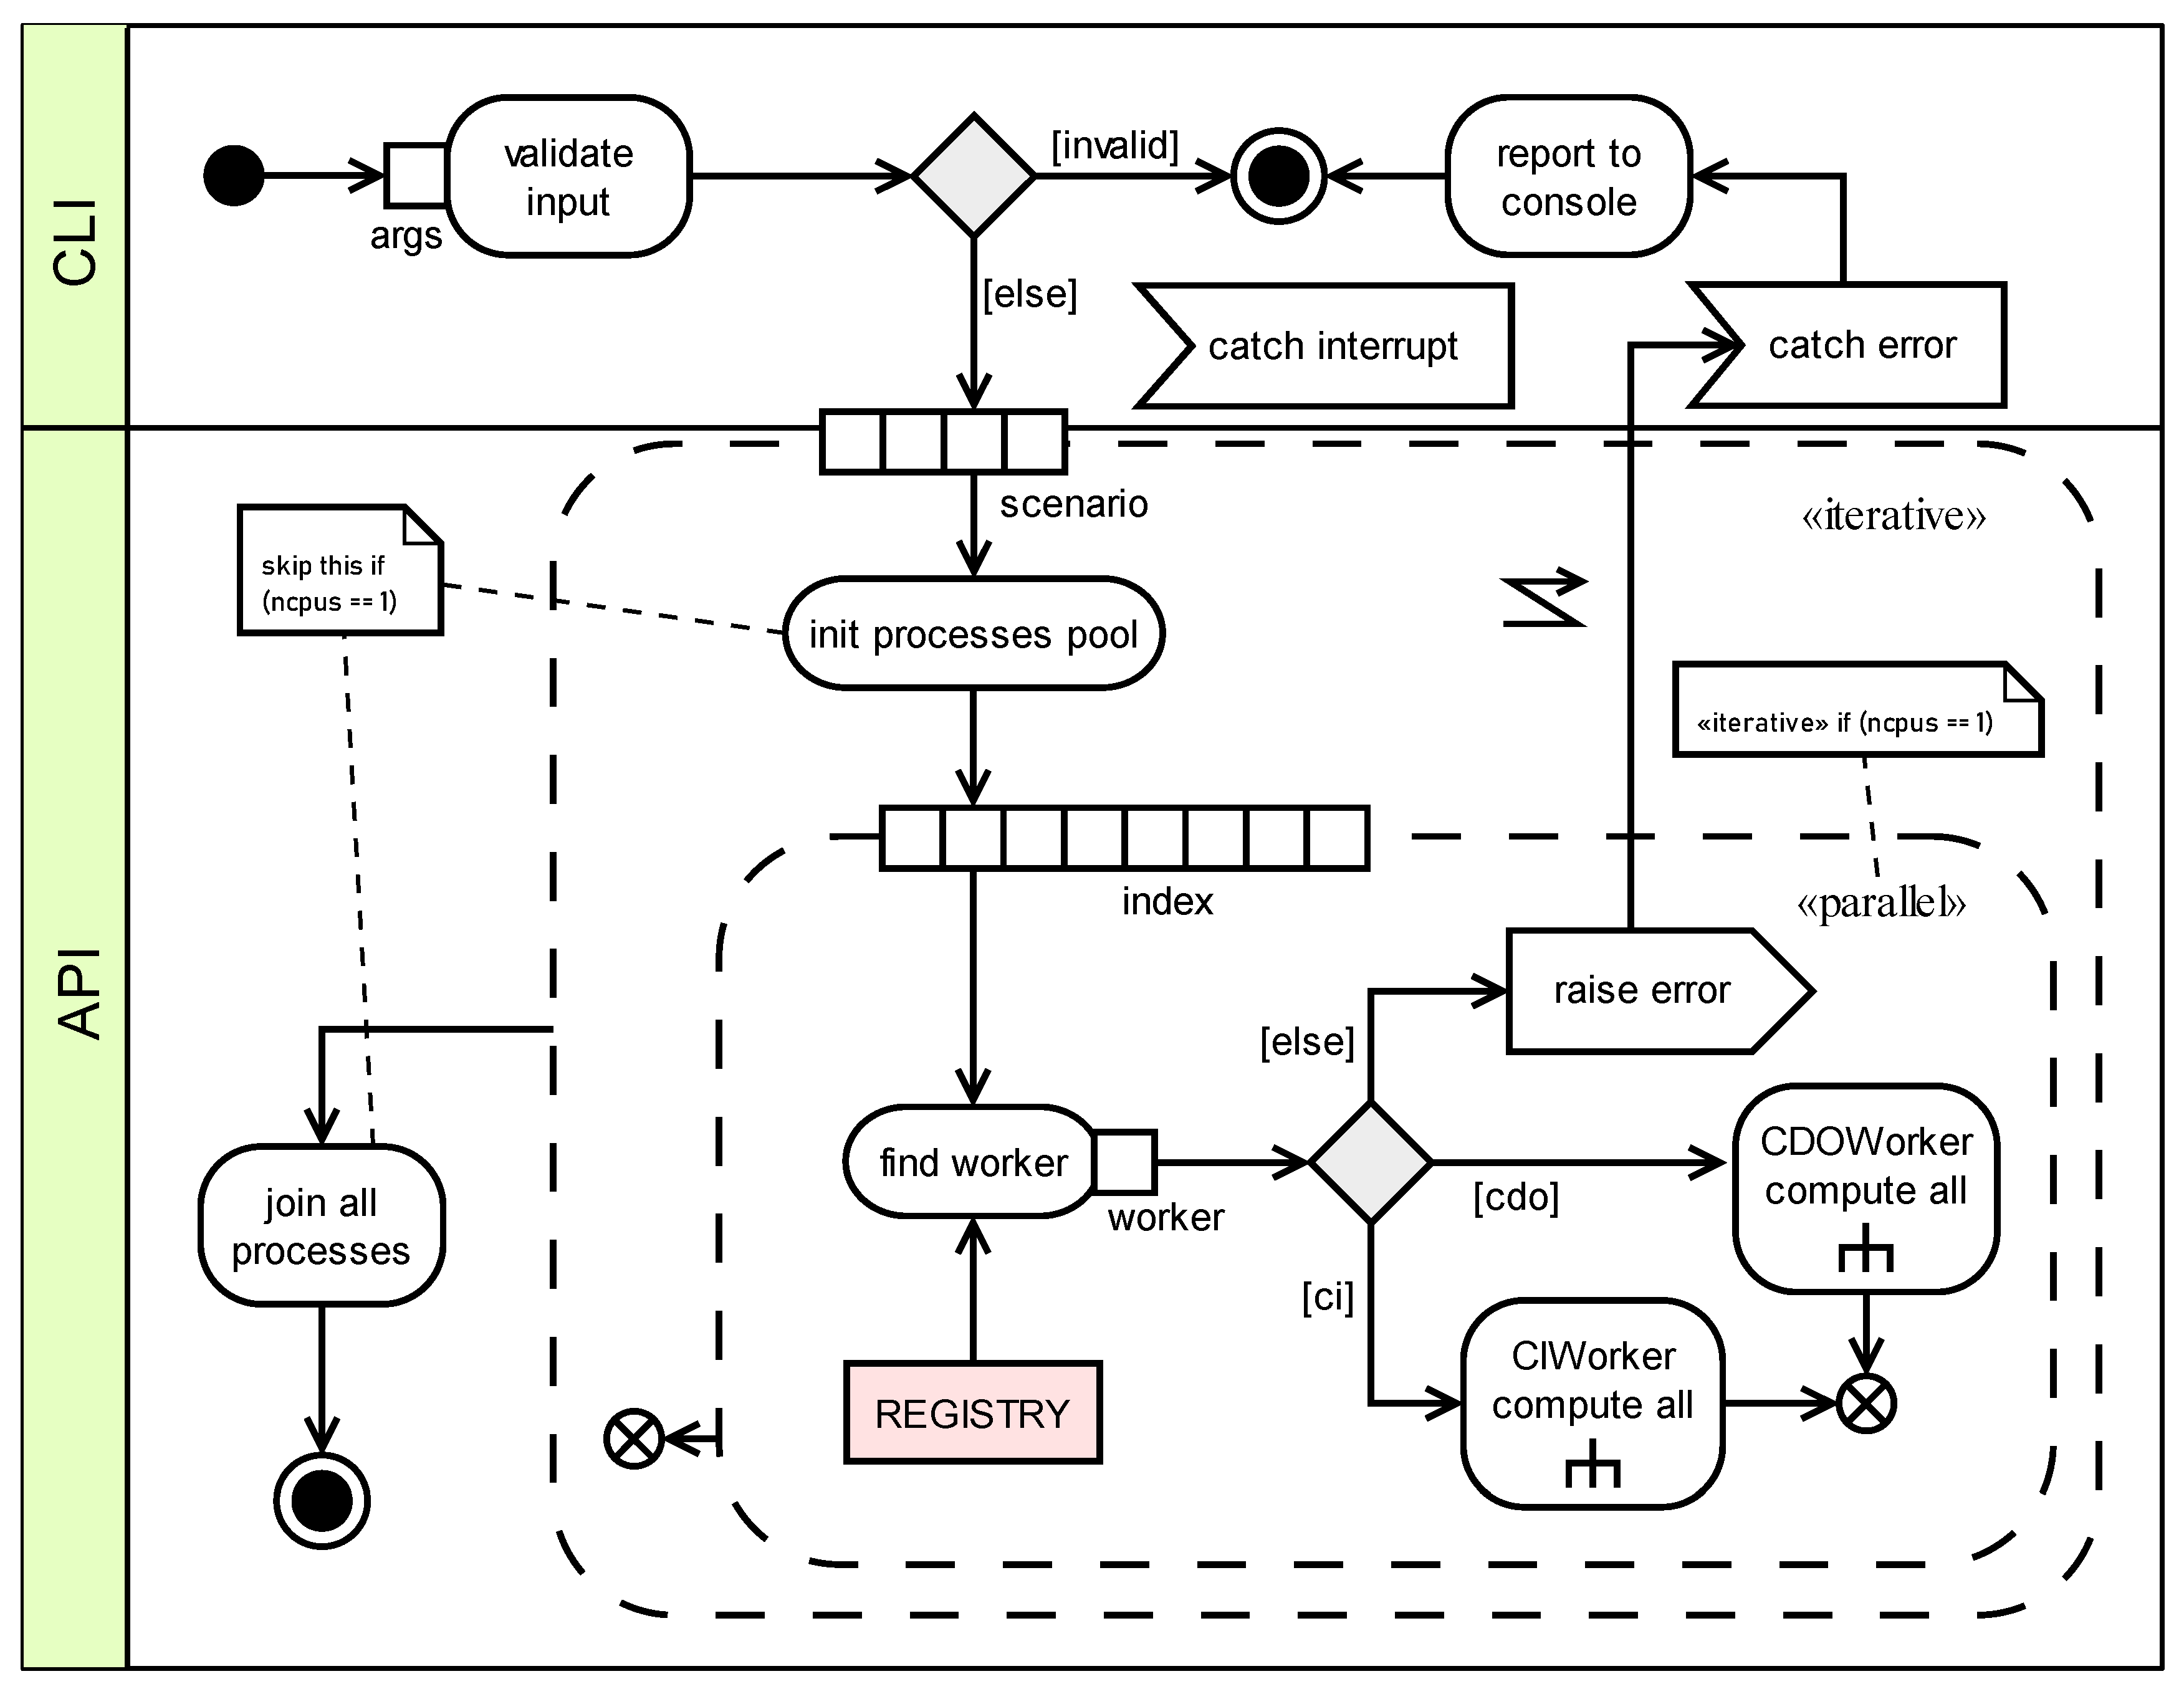
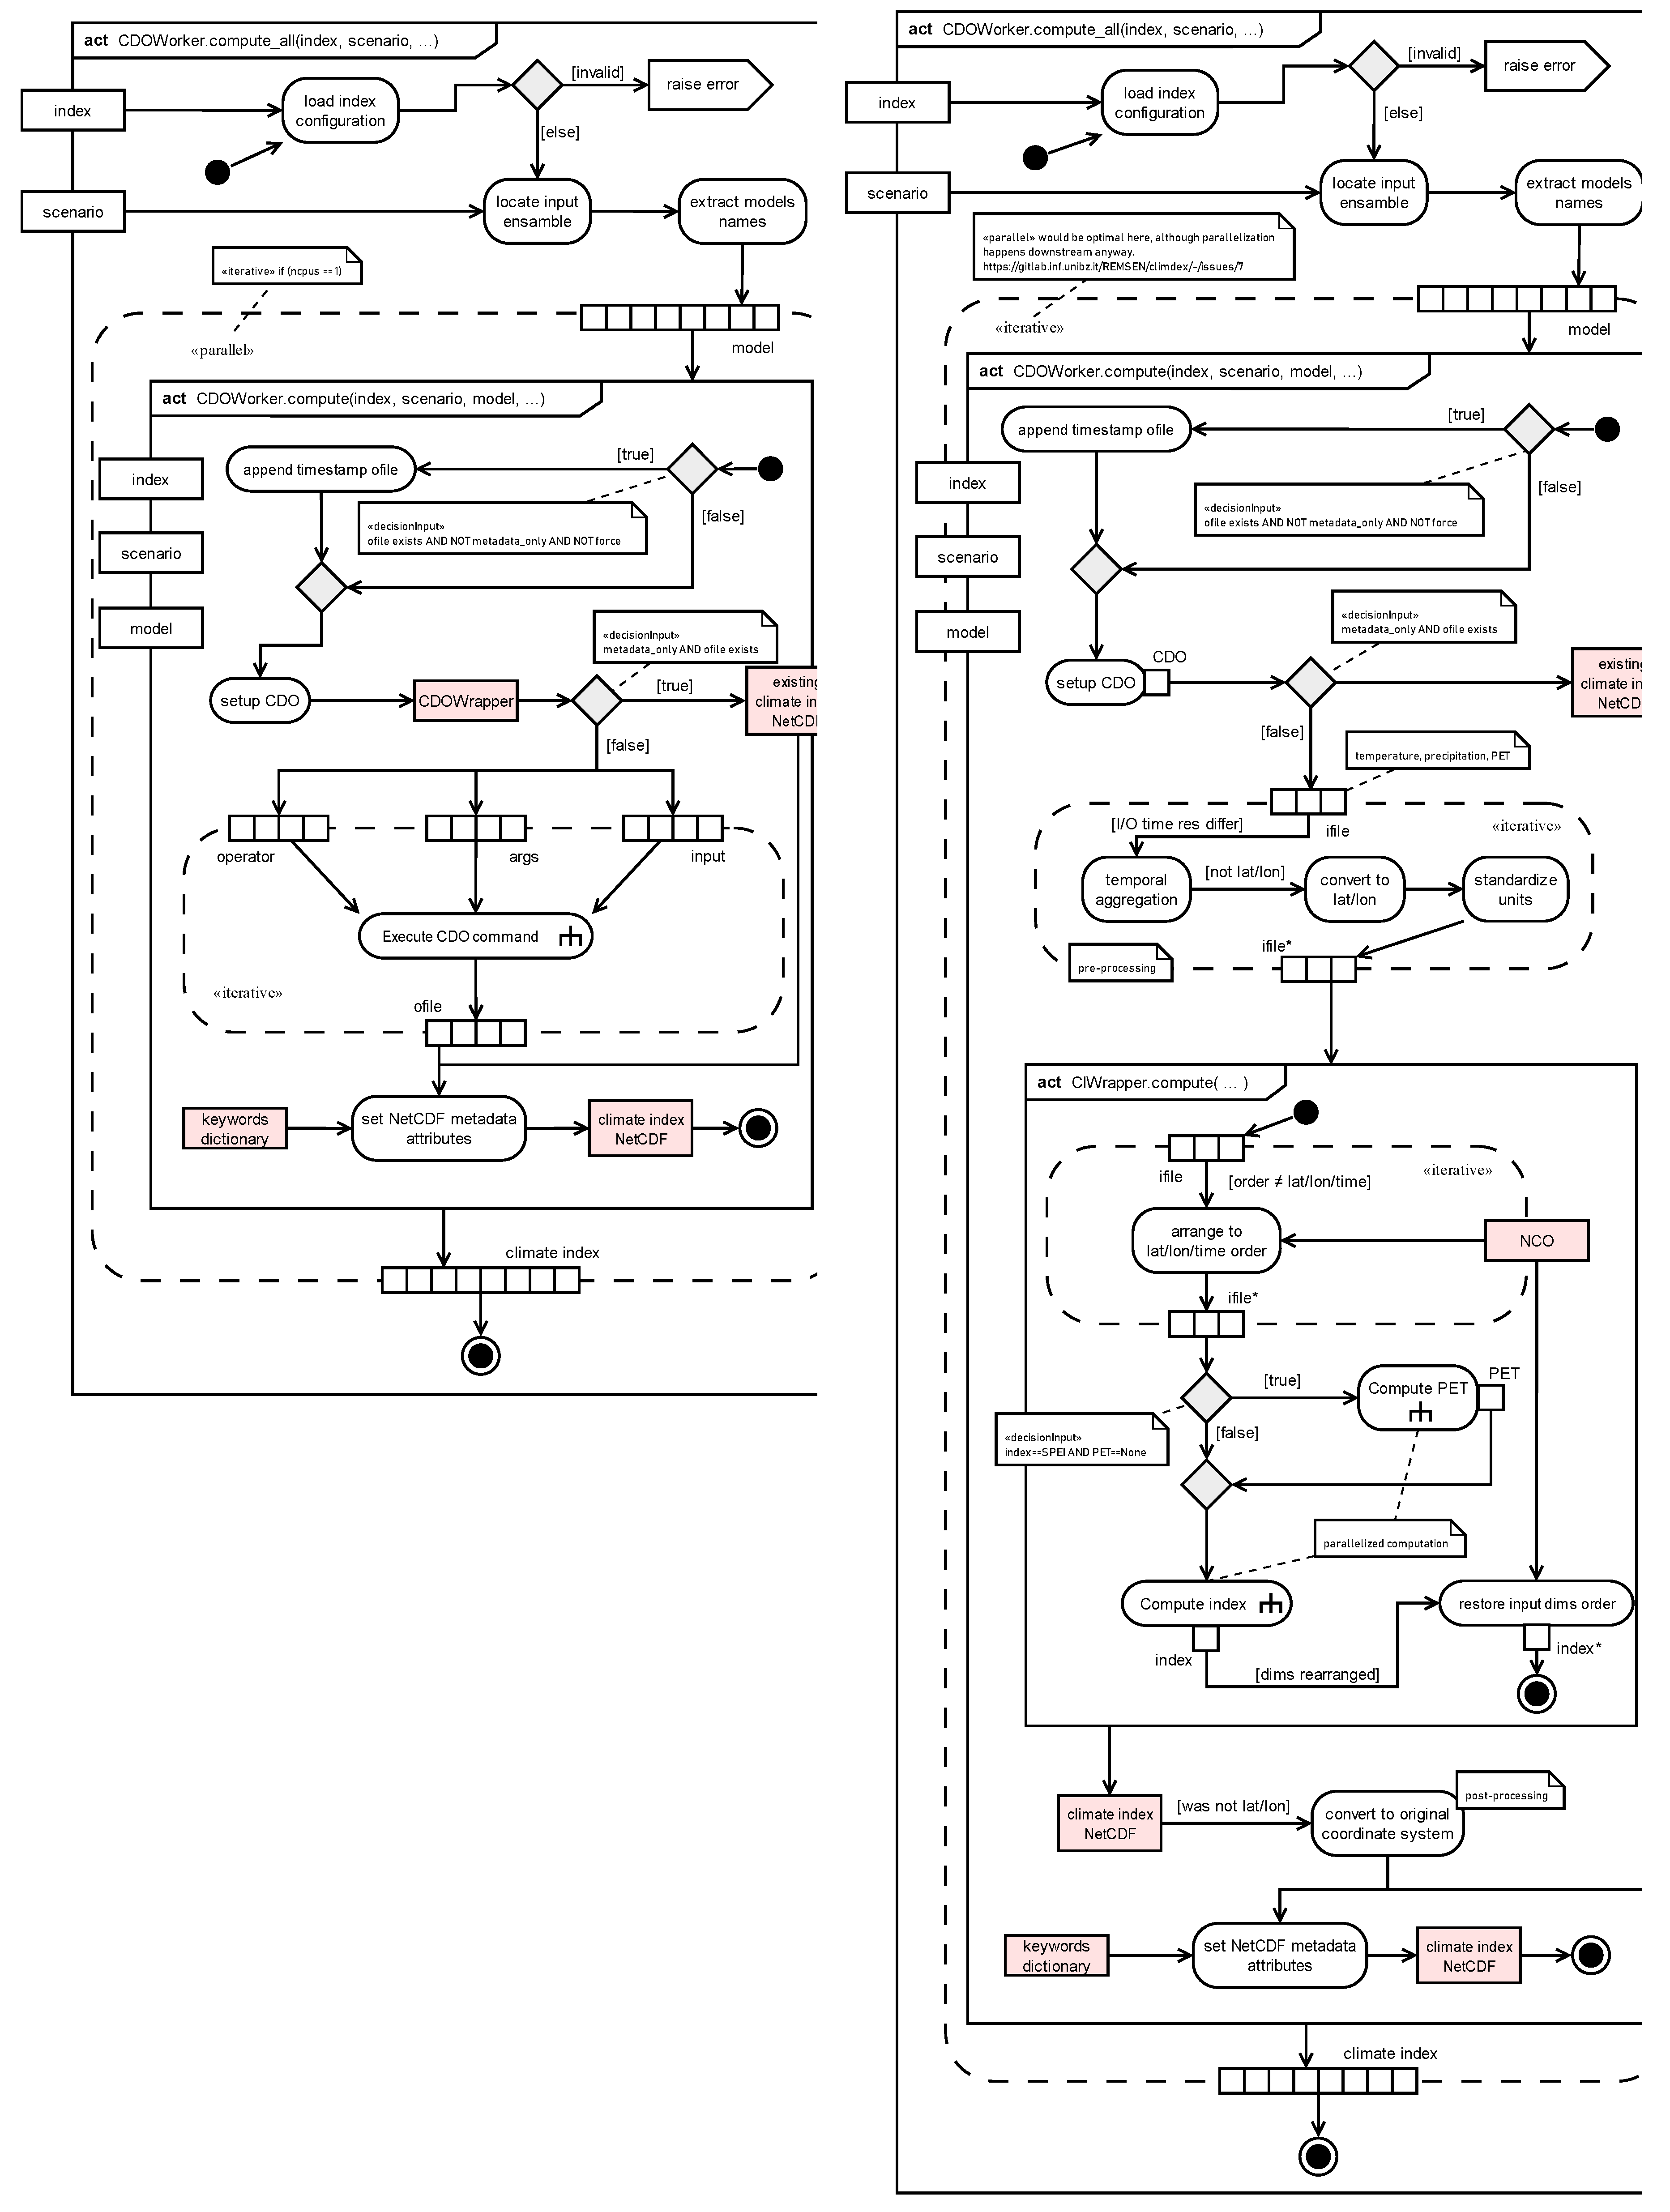
Figure 14.
UML activity diagram of the “CIWorker compute all” activity in Figure 13.
Figure 14.
UML activity diagram of the “CIWorker compute all” activity in Figure 13.
Appendix C. Quantile Delta Mapping
The Quantile Delta Mapping is a variant of Quantile Mapping (QM) for performing the bias adjustment of model data. It is designed to adjust the systematic biases of model simulations but, contrarily to the standard QM procedure, by preserving the original climate change signals, i.e. it preserves the changes in quantiles (Kim et al., 2021; Tong et al., 2021). In principle, QDM corrects the future model outputs to the observation reference over the calibration period by applying QM and it adjusts the bias-corrected values by means of a delta (for temperature) or relative (for precipitation) change term obtained from the model data as follows:
Where is the bias-corrected data for the historical period and is the delta (relative) change in the model data between the historical and future period. The bias-corrected future projection at time is obtained by adding (multiplying) the delta (relative) change to (by) the bias-corrected value over the calibration period, i.e. 1981-2010. In this case, the QDM correction was computed for 30-year sliding windows by steps of 10 years and was applied to the central 10 years of model data. In order to properly take the seasonality into account, the calibration was performed month-by-month by considering all daily values in a 3-month window centered on the month to correct. QDM was based on the R packages “MBC” (https://cran.r-project.org/web/packages/MBC/index.html).
References
- Adams, J. (2017). Climate_indices, an open source Python library providing reference implementations of commonly used climate indices. https://github.com/monocongo/climate_indices.
- Baumann, P. (2018). Datacube Standards and their Contribution to Analysis-Ready Data. IGARSS 2018 - 2018 IEEE International Geoscience and Remote Sensing Symposium, 2051–2053. [CrossRef]
- Baumann, P., Dumitru, A. M., & Merticariu, V. (2013). The Array Database That Is Not a Database: File Based Array Query Answering in Rasdaman. In M. A. Nascimento, T. Sellis, R. Cheng, J. Sander, Y. Zheng, H.-P. Kriegel, M. Renz, & C. Sengstock (Eds.), Advances in Spatial and Temporal Databases (Vol. 8098, pp. 478–483). Springer Berlin Heidelberg. [CrossRef]
- Bottazzi, M., Scipione, G., Marras, G. F., Trotta, G., D’Antonio, M., Chiavarini, B., Caroli, C., Montanari, M., Bassini, S., Gascón, E., Hewson, T., Montani, A., Cesari, D., Minguzzi, E., Paccagnella, T., Pelosini, R., Bertolotto, P., Monaco, L., Forconi, M., … Pieralice, A. (2021). The Italian open data meteorological portal: MISTRAL. Meteorological Applications, 28(4). [CrossRef]
- Bruno Soares, M., Alexander, M., & Dessai, S. (2018). Sectoral use of climate information in Europe: A synoptic overview. Climate Services, 9, 5–20. [CrossRef]
- Buontempo, C., Hutjes, R., Beavis, P., Berckmans, J., Cagnazzo, C., Vamborg, F., Thépaut, J.-N., Bergeron, C., Almond, S., Amici, A., Ramasamy, S., & Dee, D. (2020). Fostering the development of climate services through Copernicus Climate Change Service (C3S) for agriculture applications. Weather and Climate Extremes, 27, 100226. [CrossRef]
- Cammalleri, C., Arias-Muñoz, C., Barbosa, P., de Jager, A., Magni, D., Masante, D., Mazzeschi, M., McCormick, N., Naumann, G., Spinoni, J., & Vogt, J. (2021). A revision of the Combined Drought Indicator (CDI) used in the European Drought Observatory (EDO). Natural Hazards and Earth System Sciences, 21(2), 481–495. [CrossRef]
- Cannon, A. J., Sobie, S. R., & Murdock, T. Q. (2015). Bias Correction of GCM Precipitation by Quantile Mapping: How Well Do Methods Preserve Changes in Quantiles and Extremes? Journal of Climate, 28(17), 6938–6959. [CrossRef]
- Castaño-Rosa, R., Barrella, R., Sánchez-Guevara, C., Barbosa, R., Kyprianou, I., Paschalidou, E., Thomaidis, N. S., Dokupilova, D., Gouveia, J. P., Kádár, J., Hamed, T. A., & Palma, P. (2021). Cooling Degree Models and Future Energy Demand in the Residential Sector. A Seven-Country Case Study. Sustainability, 13(5), 2987. [CrossRef]
- Ceglar, A., Toreti, A., Zampieri, M., Manstretta, V., Bettati, T., & Bratu, M. (2020). Clisagri: An R package for agro-climate services. Climate Services, 20, 100197. [CrossRef]
- Cortekar, J., Themessl, M., & Lamich, K. (2020). Systematic analysis of EU-based climate service providers. Climate Services, 17, 100125. [CrossRef]
- Coscarelli, R., Aguilar, E., Petrucci, O., Vicente-Serrano, S. M., & Zimbo, F. (2021). The Potential Role of Climate Indices to Explain Floods, Mass-Movement Events and Wildfires in Southern Italy. Climate, 9(11), 156. [CrossRef]
- Crespi, A., Matiu, M., Bertoldi, G., Petitta, M., & Zebisch, M. (2021). A high-resolution gridded dataset of daily temperature and precipitation records (1980–2018) for Trentino-South Tyrol (north-eastern Italian Alps). Earth System Science Data, 13(6), 2801–2818. [CrossRef]
- de Sousa, K., van Etten, J., & Solberg, S. Ø. (2020). climatrends: Climate Variability Indices for Ecological Modelling. https://CRAN.R-project.org/package=climatrends.
- Fedele, G., Donatti, C. I., Harvey, C. A., Hannah, L., & Hole, D. G. (2019). Transformative adaptation to climate change for sustainable social-ecological systems. Environmental Science & Policy, 101, 116–125. [CrossRef]
- Findlater, K., Webber, S., Kandlikar, M., & Donner, S. (2021). Climate services promise better decisions but mainly focus on better data. Nature Climate Change, 11(9), 731–737. [CrossRef]
- Fischer, A. M., Strassmann, K. M., Croci-Maspoli, M., Hama, A. M., Knutti, R., Kotlarski, S., Schär, C., Schnadt Poberaj, C., Ban, N., Bavay, M., Beyerle, U., Bresch, D. N., Brönnimann, S., Burlando, P., Casanueva, A., Fatichi, S., Feigenwinter, I., Fischer, E. M., Hirschi, M., … Zubler, E. M. (2022). Climate Scenarios for Switzerland CH2018 – Approach and Implications. Climate Services, 26, 100288. [CrossRef]
- Hänsel, S., Hoy, A., Brendel, C., & Maugeri, M. (2022). Record summers in Europe: Variations in drought and heavy precipitation during 1901–2018. International Journal of Climatology, 42(12), 6235–6257. [CrossRef]
- Hewitt, C. D., & Stone, R. (2021). Climate services for managing societal risks and opportunities. Climate Services, 23, 100240. [CrossRef]
- Hurlimann, A. C., Moosavi, S., & Browne, G. R. (2021). Climate change transformation: A definition and typology to guide decision making in urban environments. Sustainable Cities and Society, 70, 102890. [CrossRef]
- Iturbide, M., Bedia, J., Herrera, S., Baño-Medina, J., Fernández, J., Frías, M. D., Manzanas, R., San-Martín, D., Cimadevilla, E., Cofiño, A. S., & Gutiérrez, J. M. (2019). The R-based climate4R open framework for reproducible climate data access and post-processing. Environmental Modelling & Software, 111, 42–54. [CrossRef]
- Jacob, D., Petersen, J., Eggert, B., Alias, A., Christensen, O. B., Bouwer, L. M., Braun, A., Colette, A., Déqué, M., Georgievski, G., Georgopoulou, E., Gobiet, A., Menut, L., Nikulin, G., Haensler, A., Hempelmann, N., Jones, C., Keuler, K., Kovats, S., … Yiou, P. (2014). EURO-CORDEX: New high-resolution climate change projections for European impact research. Regional Environmental Change, 14(2), 563–578. [CrossRef]
- Killough, B. (2018). Overview of the Open Data Cube Initiative. IGARSS 2018 - 2018 IEEE International Geoscience and Remote Sensing Symposium, 8629–8632. [CrossRef]
- Kim, S., Joo, K., Kim, H., Shin, J.-Y., & Heo, J.-H. (2021). Regional quantile delta mapping method using regional frequency analysis for regional climate model precipitation. Journal of Hydrology, 596, 125685. [CrossRef]
- McNie, E. C. (2012). Delivering Climate Services: Organizational Strategies and Approaches for Producing Useful Climate-Science Information. Weather, Climate, and Society, 5(1), 14–26. [CrossRef]
- Peruccacci, S., Brunetti, M. T., Gariano, S. L., Melillo, M., Rossi, M., & Guzzetti, F. (2017). Rainfall thresholds for possible landslide occurrence in Italy. Geomorphology, 290, 39–57. [CrossRef]
- Peßenteiner, S., Hohmann, C., Kirchengast, G., & Schöner, W. (2021). High-resolution climate datasets in hydrological impact studies: Assessing their value in alpine and pre-alpine catchments in southeastern Austria. Journal of Hydrology: Regional Studies, 38, 100962. [CrossRef]
- Pörtner, H.-O., Roberts, D. C., Tignor, M., Poloczanska, E. S., Mintenbeck, K., Alegría, A., Craig, M., Langsdorf, S., Löschke, S., Möller, V., Okem, A., & Rama, B. (eds. ). (n.d.). IPCC 2022: Climate Change 2022: Impacts, Adaptation, and Vulnerability. Contribution of Working Group II to the Sixth Assessment Report of the Intergovernmental Panel on Climate Change. Cambridge University Press. In Press.
- Schramm, M., Pebesma, E., Milenković, M., Foresta, L., Dries, J., Jacob, A., Wagner, W., Mohr, M., Neteler, M., Kadunc, M., Miksa, T., Kempeneers, P., Verbesselt, J., Gößwein, B., Navacchi, C., Lippens, S., & Reiche, J. (2021). The openEO API–Harmonising the Use of Earth Observation Cloud Services Using Virtual Data Cube Functionalities. Remote Sensing, 13(6), 1125. [CrossRef]
- Schulzweida, Uwe. (2020). CDO User Guide. [CrossRef]
- Schumacher, B., Griffiths, P., Pebesma, E., Dries, J., Jacob, A., Thiex, D., Mohr, M., & Briese, C. (2022). openEO Platform: Enabling analysis of large-scale Earth Observation data repositories with federated computational infrastructure  [Other]. display. [CrossRef]
- Scoccimarro, E., Fogli, P. G., & Gualdi, S. (2017). The role of humidity in determining scenarios of perceived temperature extremes in Europe. Environmental Research Letters, 12(11), 114029. [CrossRef]
- Tart, S., Groth, M., & Seipold, P. (2020). Market demand for climate services: An assessment of users’ needs. Climate Services, 17, 100109. [CrossRef]
- Thepaut, J.-N., Dee, D., Engelen, R., & Pinty, B. (2018). The Copernicus Programme and its Climate Change Service. IGARSS 2018 - 2018 IEEE International Geoscience and Remote Sensing Symposium, 1591–1593. [CrossRef]
- Tong, Y., Gao, X., Han, Z., Xu, Y., Xu, Y., & Giorgi, F. (2021). Bias correction of temperature and precipitation over China for RCM simulations using the QM and QDM methods. Climate Dynamics, 57(5–6), 1425–1443. [CrossRef]
- Wilkinson, M. D., Dumontier, M., Aalbersberg, Ij. J., Appleton, G., Axton, M., Baak, A., Blomberg, N., Boiten, J.-W., da Silva Santos, L. B., Bourne, P. E., Bouwman, J., Brookes, A. J., Clark, T., Crosas, M., Dillo, I., Dumon, O., Edmunds, S., Evelo, C. T., Finkers, R., … Mons, B. (2016). The FAIR Guiding Principles for scientific data management and stewardship. Scientific Data, 3(1), 160018. [CrossRef]
- Zellner, P., Jacob, A., Budhwar, P., Claus, M., Rossi, M., Lahn, F., & Pebesma, E. (2020, November). The OpenEO R-client: A tool to analyze big earth observation data in R: producing wet snow maps by harmonizing different types of multidimensional raster data over South Tyrol. SFScon - South Tyrol Free Software Conference, Bolzano, Italy. https://www.sfscon.it/talks/the-openeo-r-client-a-tool-to-analyze-big-earth-observation-data-in-r/.
- Zellner, P., Jacob, A., Mohr, M., Dries, J., Claus, M., Briese, C., Griffiths, P., & Pebesma, E. (2021). OpenEO platform brings analysis-ready data on demand. 45–48. https://hdl.handle.net/10863/17298.
- Zender, C. S., Vicente, P., & Wang, W. (2012). NCO: Simpler and faster model evaluation by NASA satellite data via unified file-level netCDF and HDF-EOS data post-processing tools. 2012, IN34A-07.
Figure 1.
Overview of the climdex-kit inputs and outputs (I/O) typical architecture: climate variables bundled together in model ensembles and grouped by different future emissions scenarios (RCPs) are processed to create one or more climate indices. The instructions and definition of each index is stored in the indices.ini file.
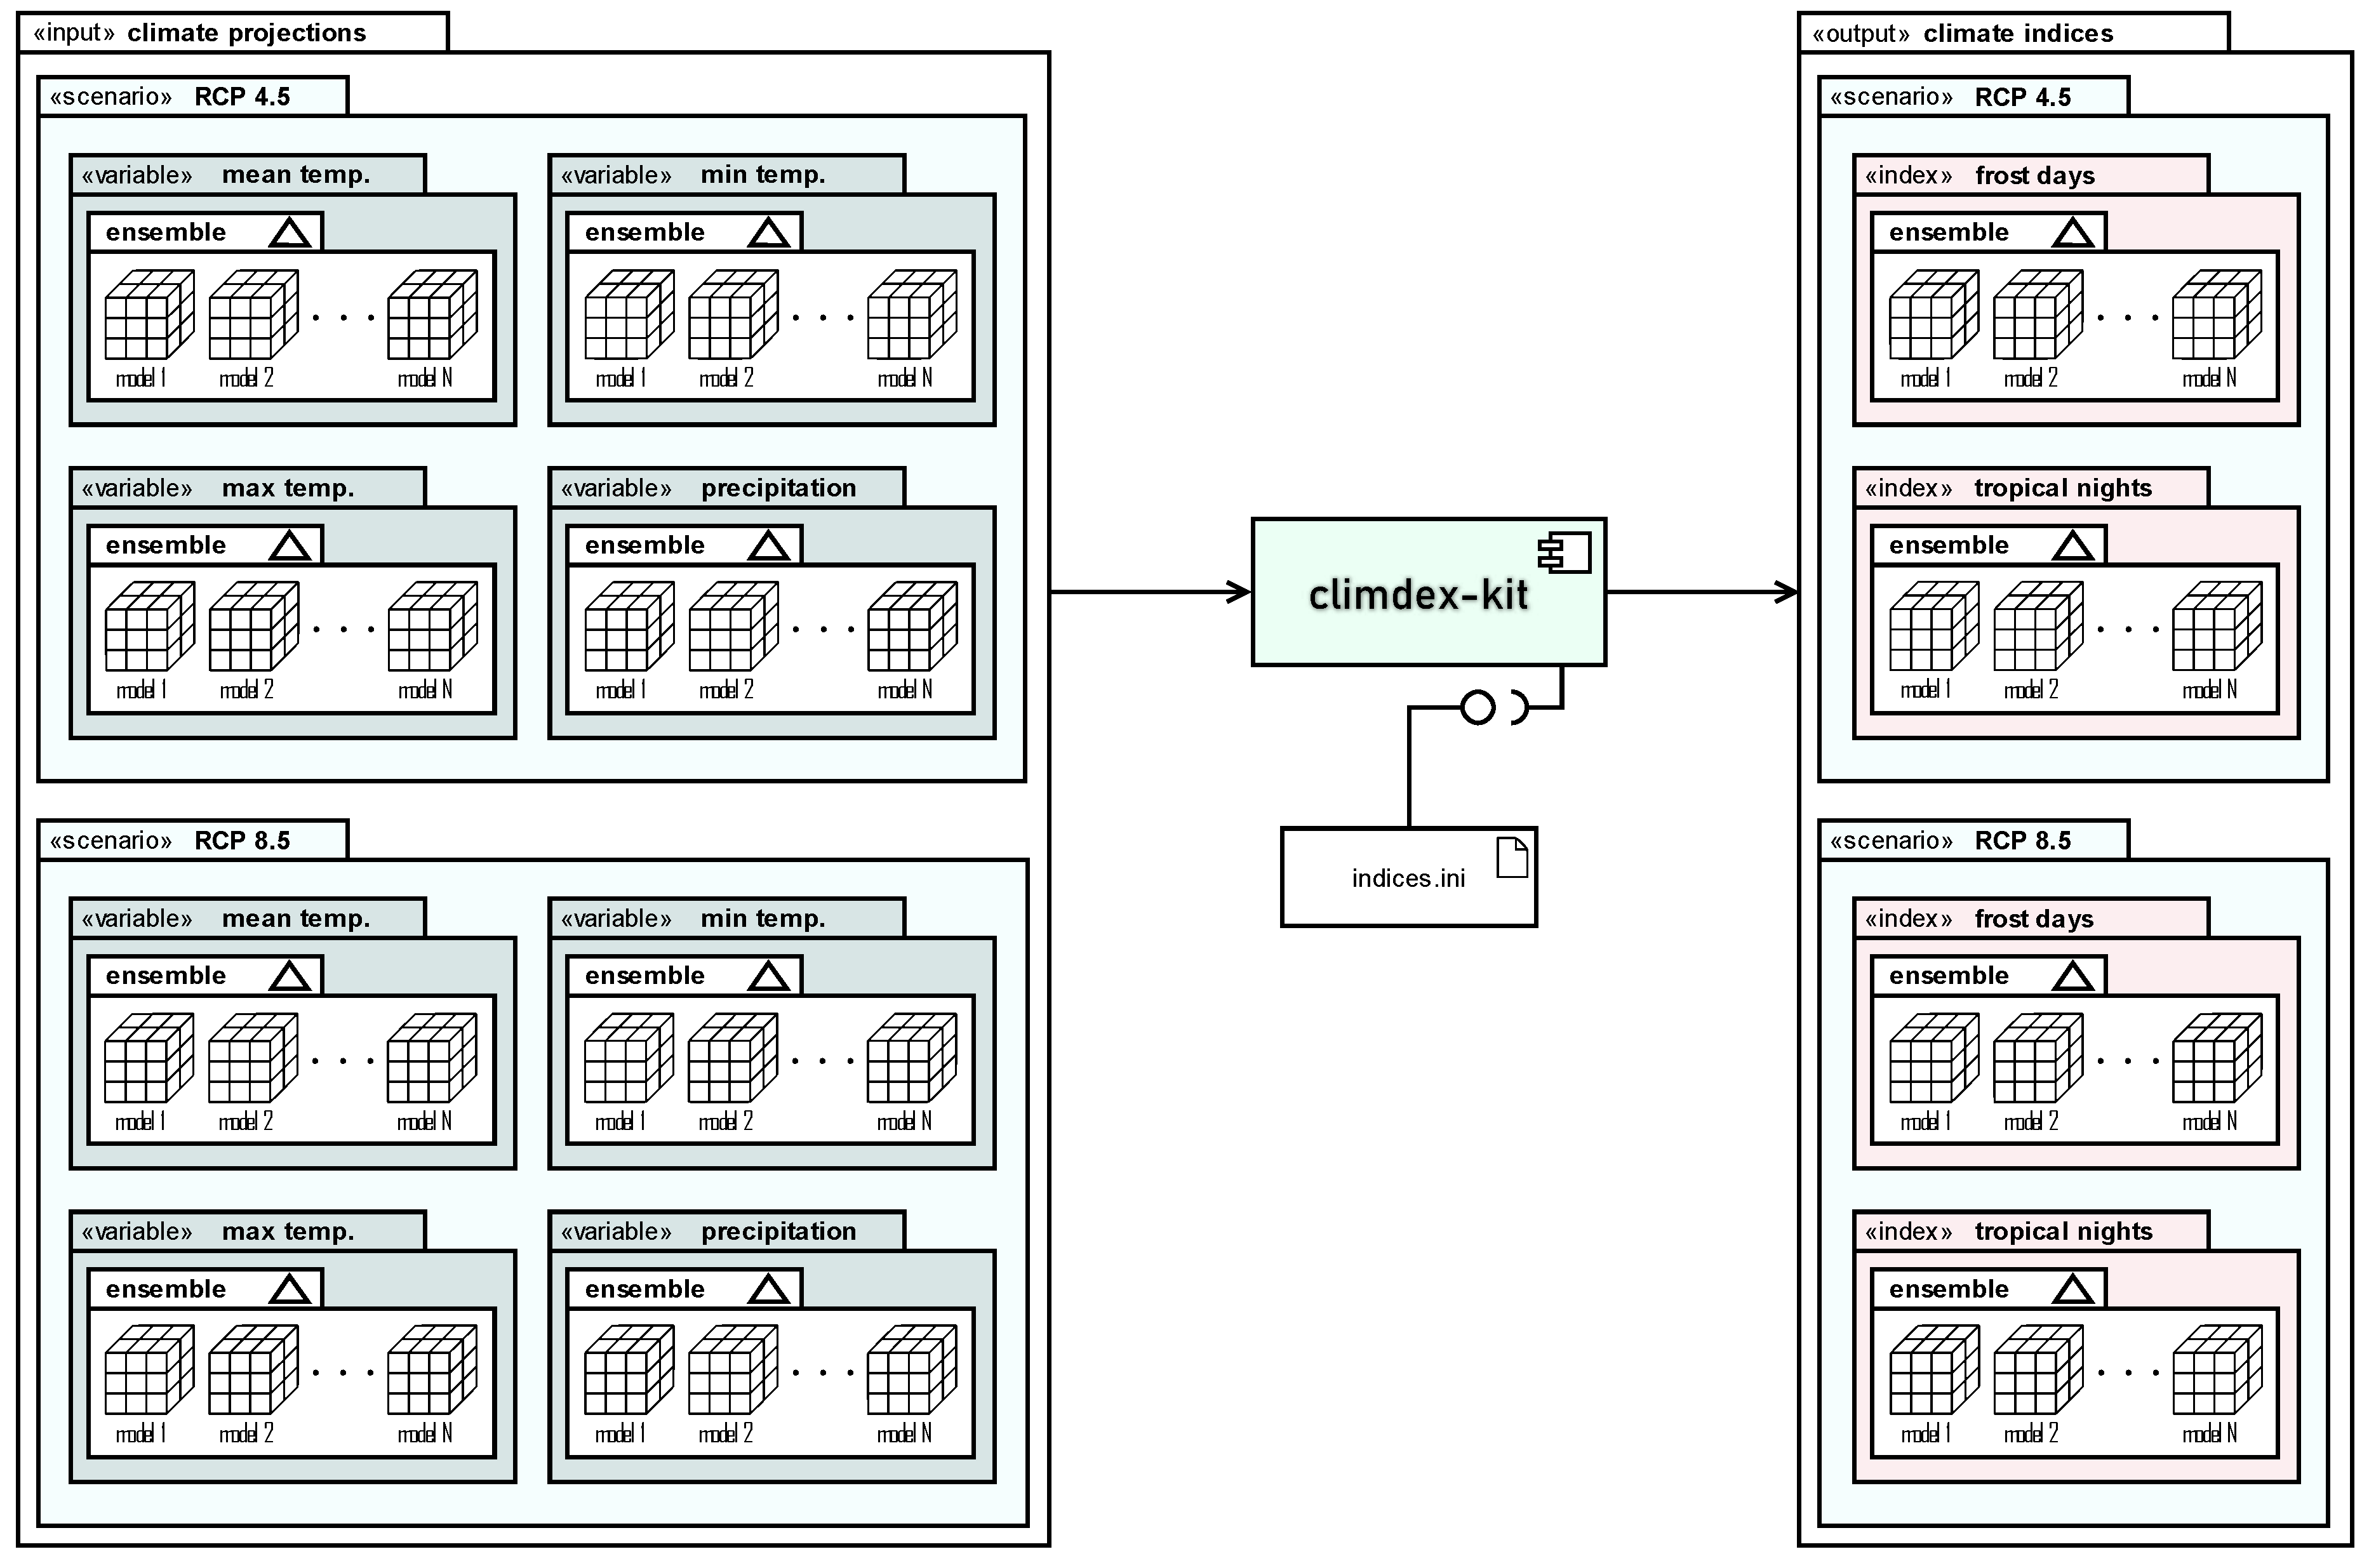
Figure 2.
Model diagram view of the internal climdex-kit architectures: top-level actions–bridged to the end-user up to the command-line interface (CLI) – rely on the underlying workers for their execution; the registry of workers is responsible for the instantiation of proper IWorker objects upon request, while underlying low-level bindings are used by the workers to define the jobs for the external toolkits like CDO or NCO; cross-cutting modules are also available for the proper encapsulation of reusable sub-routines or constants that are used throughout the package.
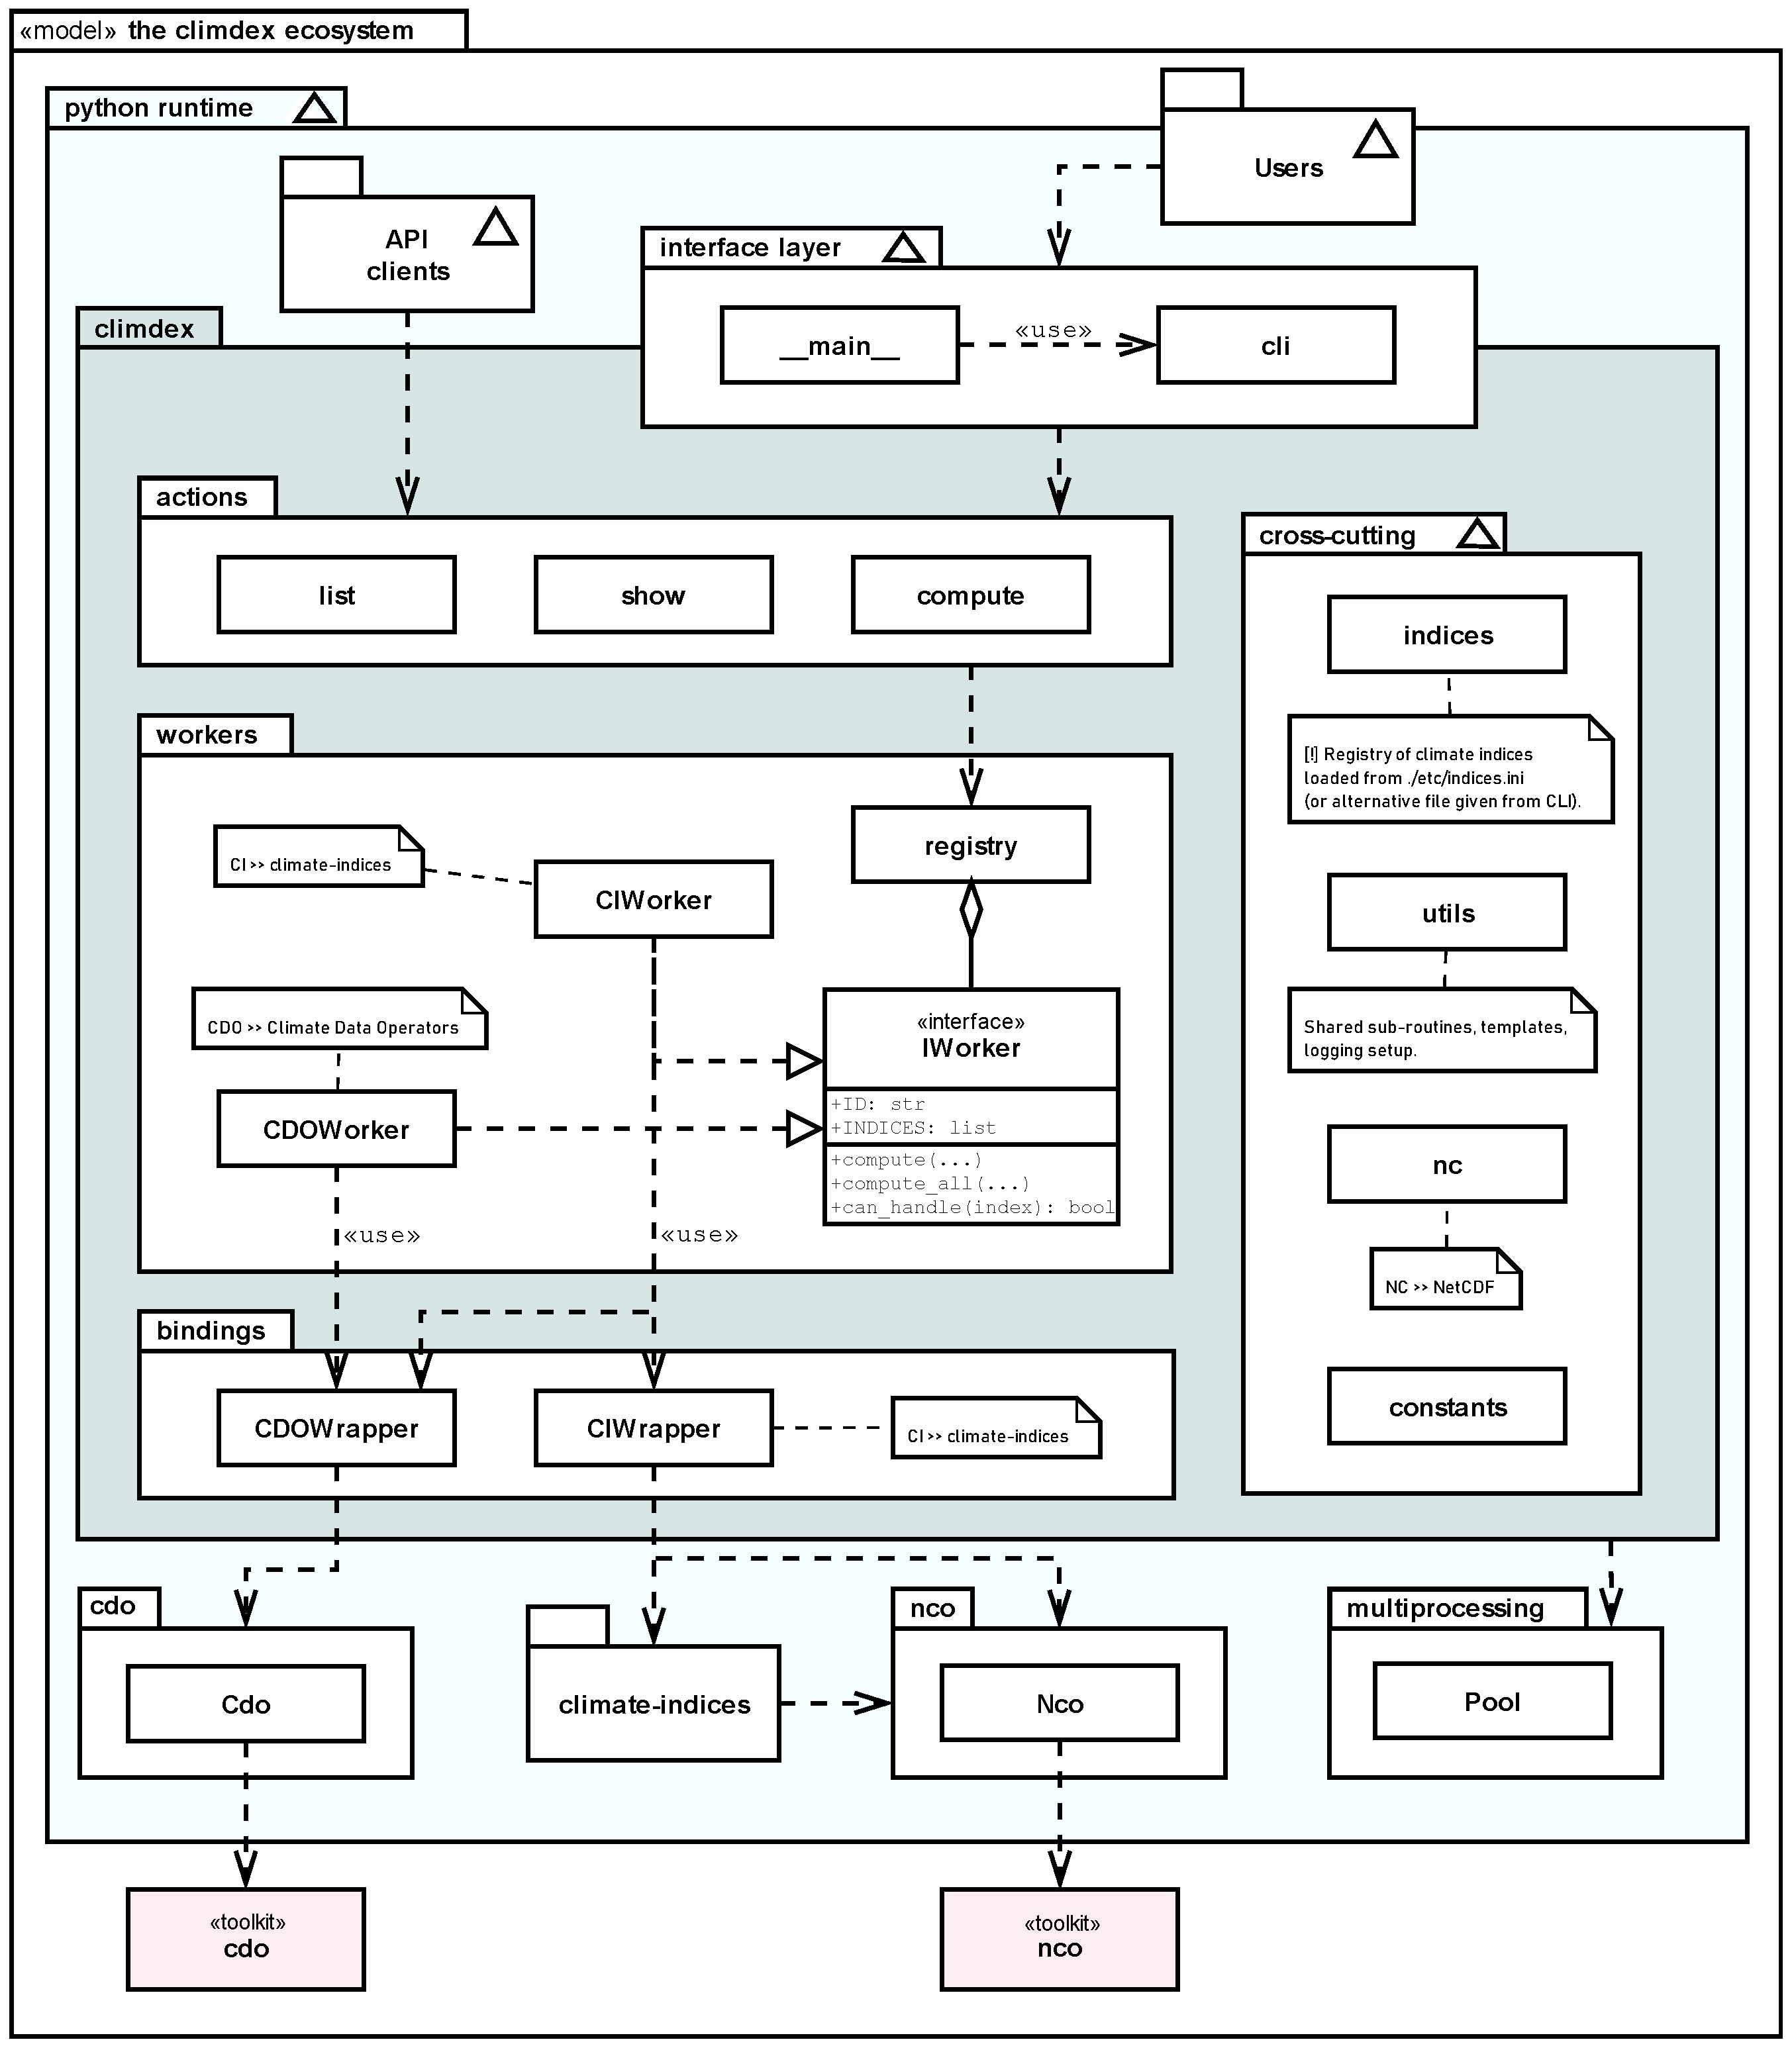
Figure 4.
Projected temperature and precipitation regional changes for (a) winter and (b) summer in Trentino-South Tyrol for a subset of EURO-CORDEX simulations under RCP 4.5 (circles) and RCP8.5 (triangles). Differences are computed over 2071-2100 with respect to 1981-2010.
Figure 4.
Projected temperature and precipitation regional changes for (a) winter and (b) summer in Trentino-South Tyrol for a subset of EURO-CORDEX simulations under RCP 4.5 (circles) and RCP8.5 (triangles). Differences are computed over 2071-2100 with respect to 1981-2010.
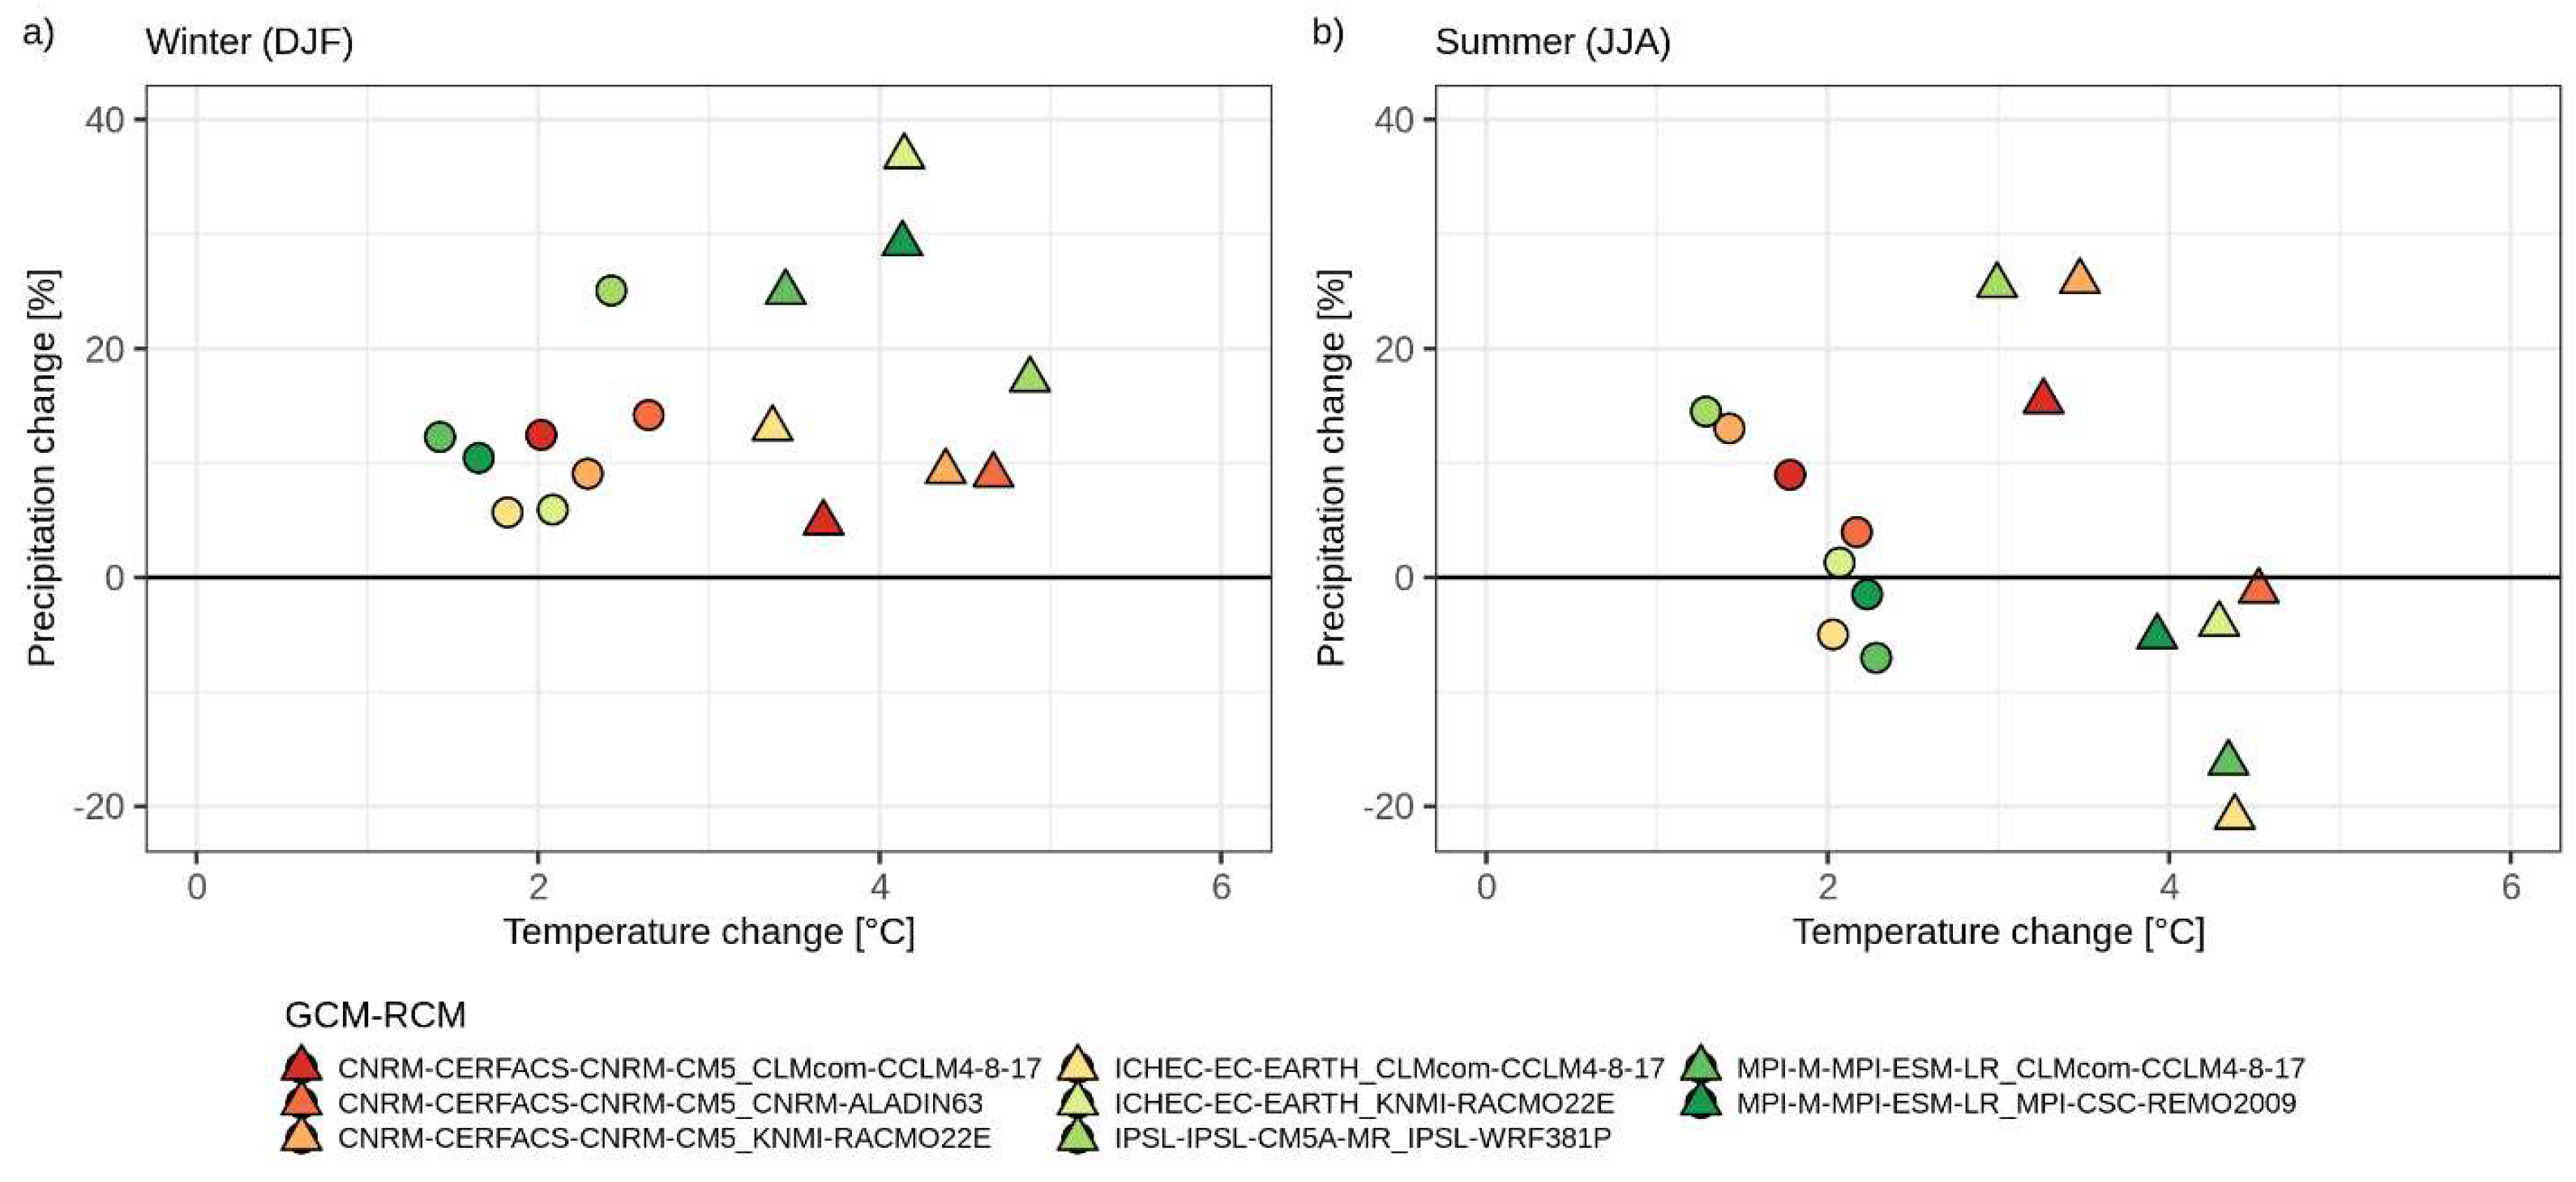
Figure 6.
Annual transient projections of (a) SU and (b) TR as average over all grid points of the region below 500 m. The solid lines represent the median of the model ensemble while the shaded areas report the 5th-95th range of the simulations. The grey lines and shading report the historical simulations.
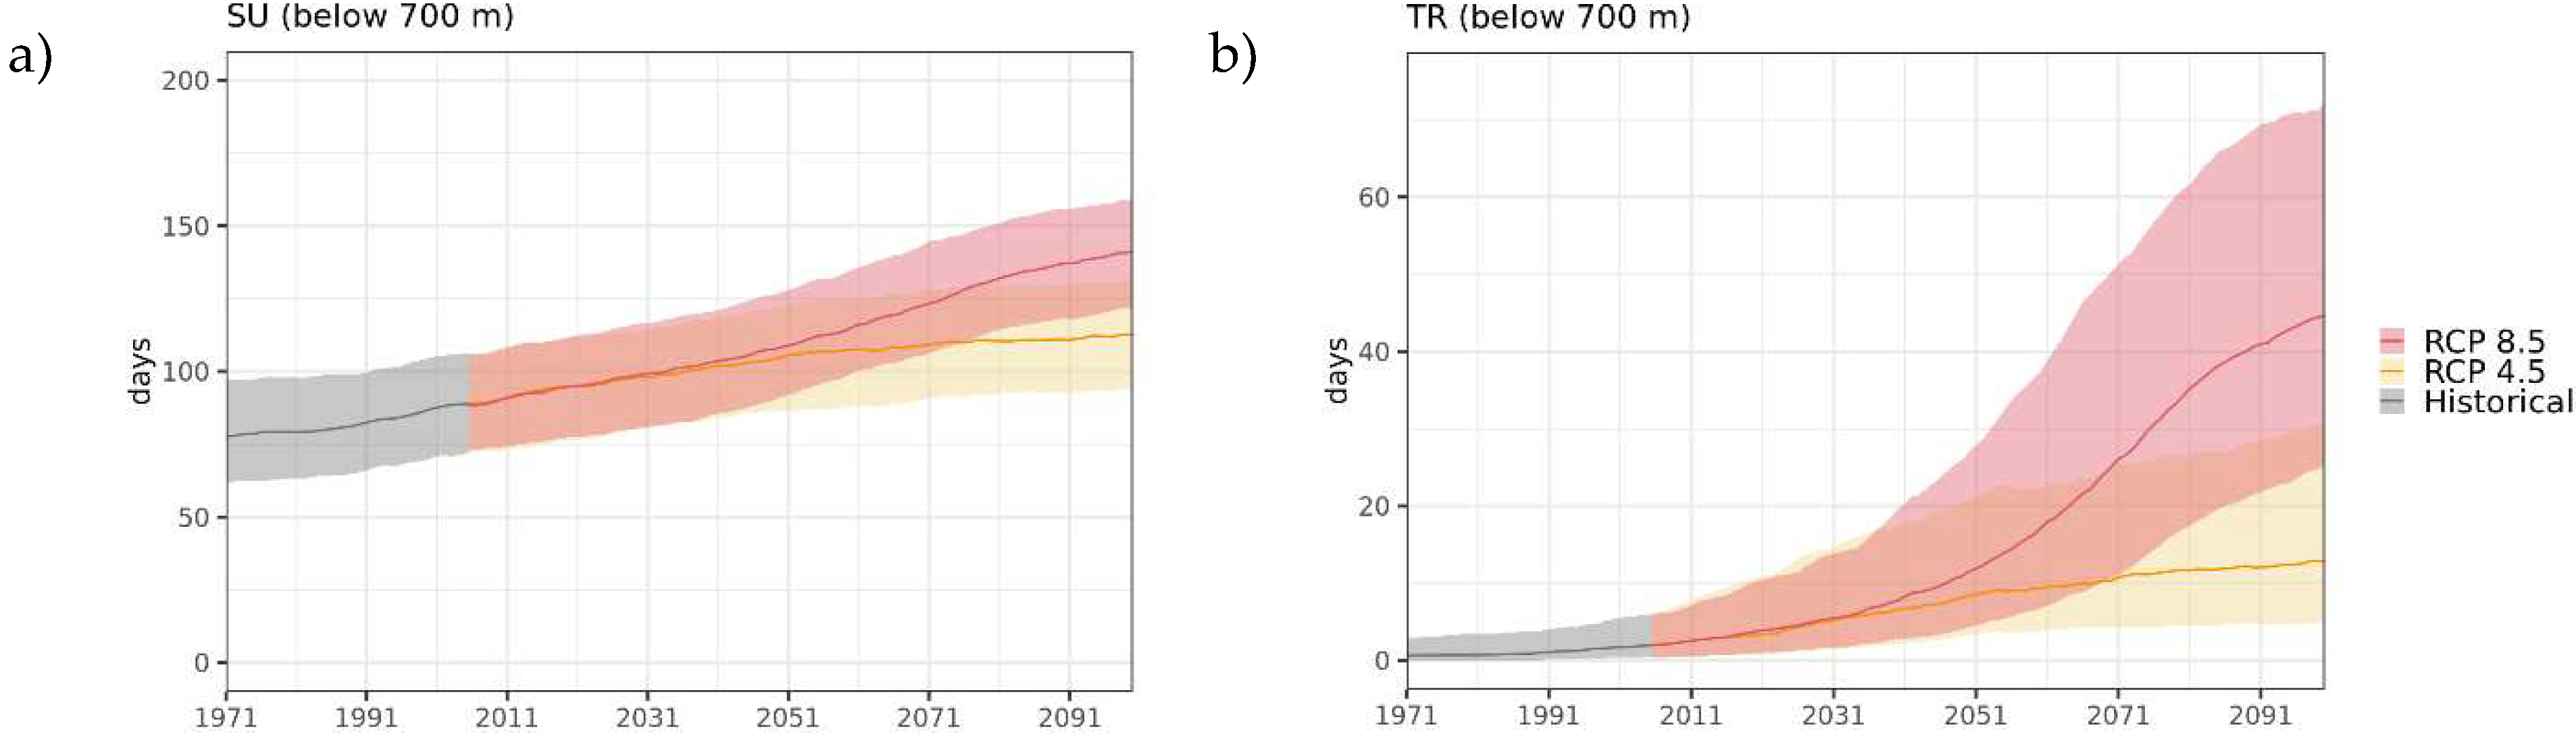
Figure 8.
Ensemble distribution of changes in (a) TX90p and (b) TN90p for three future 30-year periods with respect to the baseline 1981–2010 under the two RCPs. The horizontal line in the box represents the median of the model ensemble, the boxes extend between 5th and 95th percentiles while the wishers extend from minimum to maximum value of the ensemble.
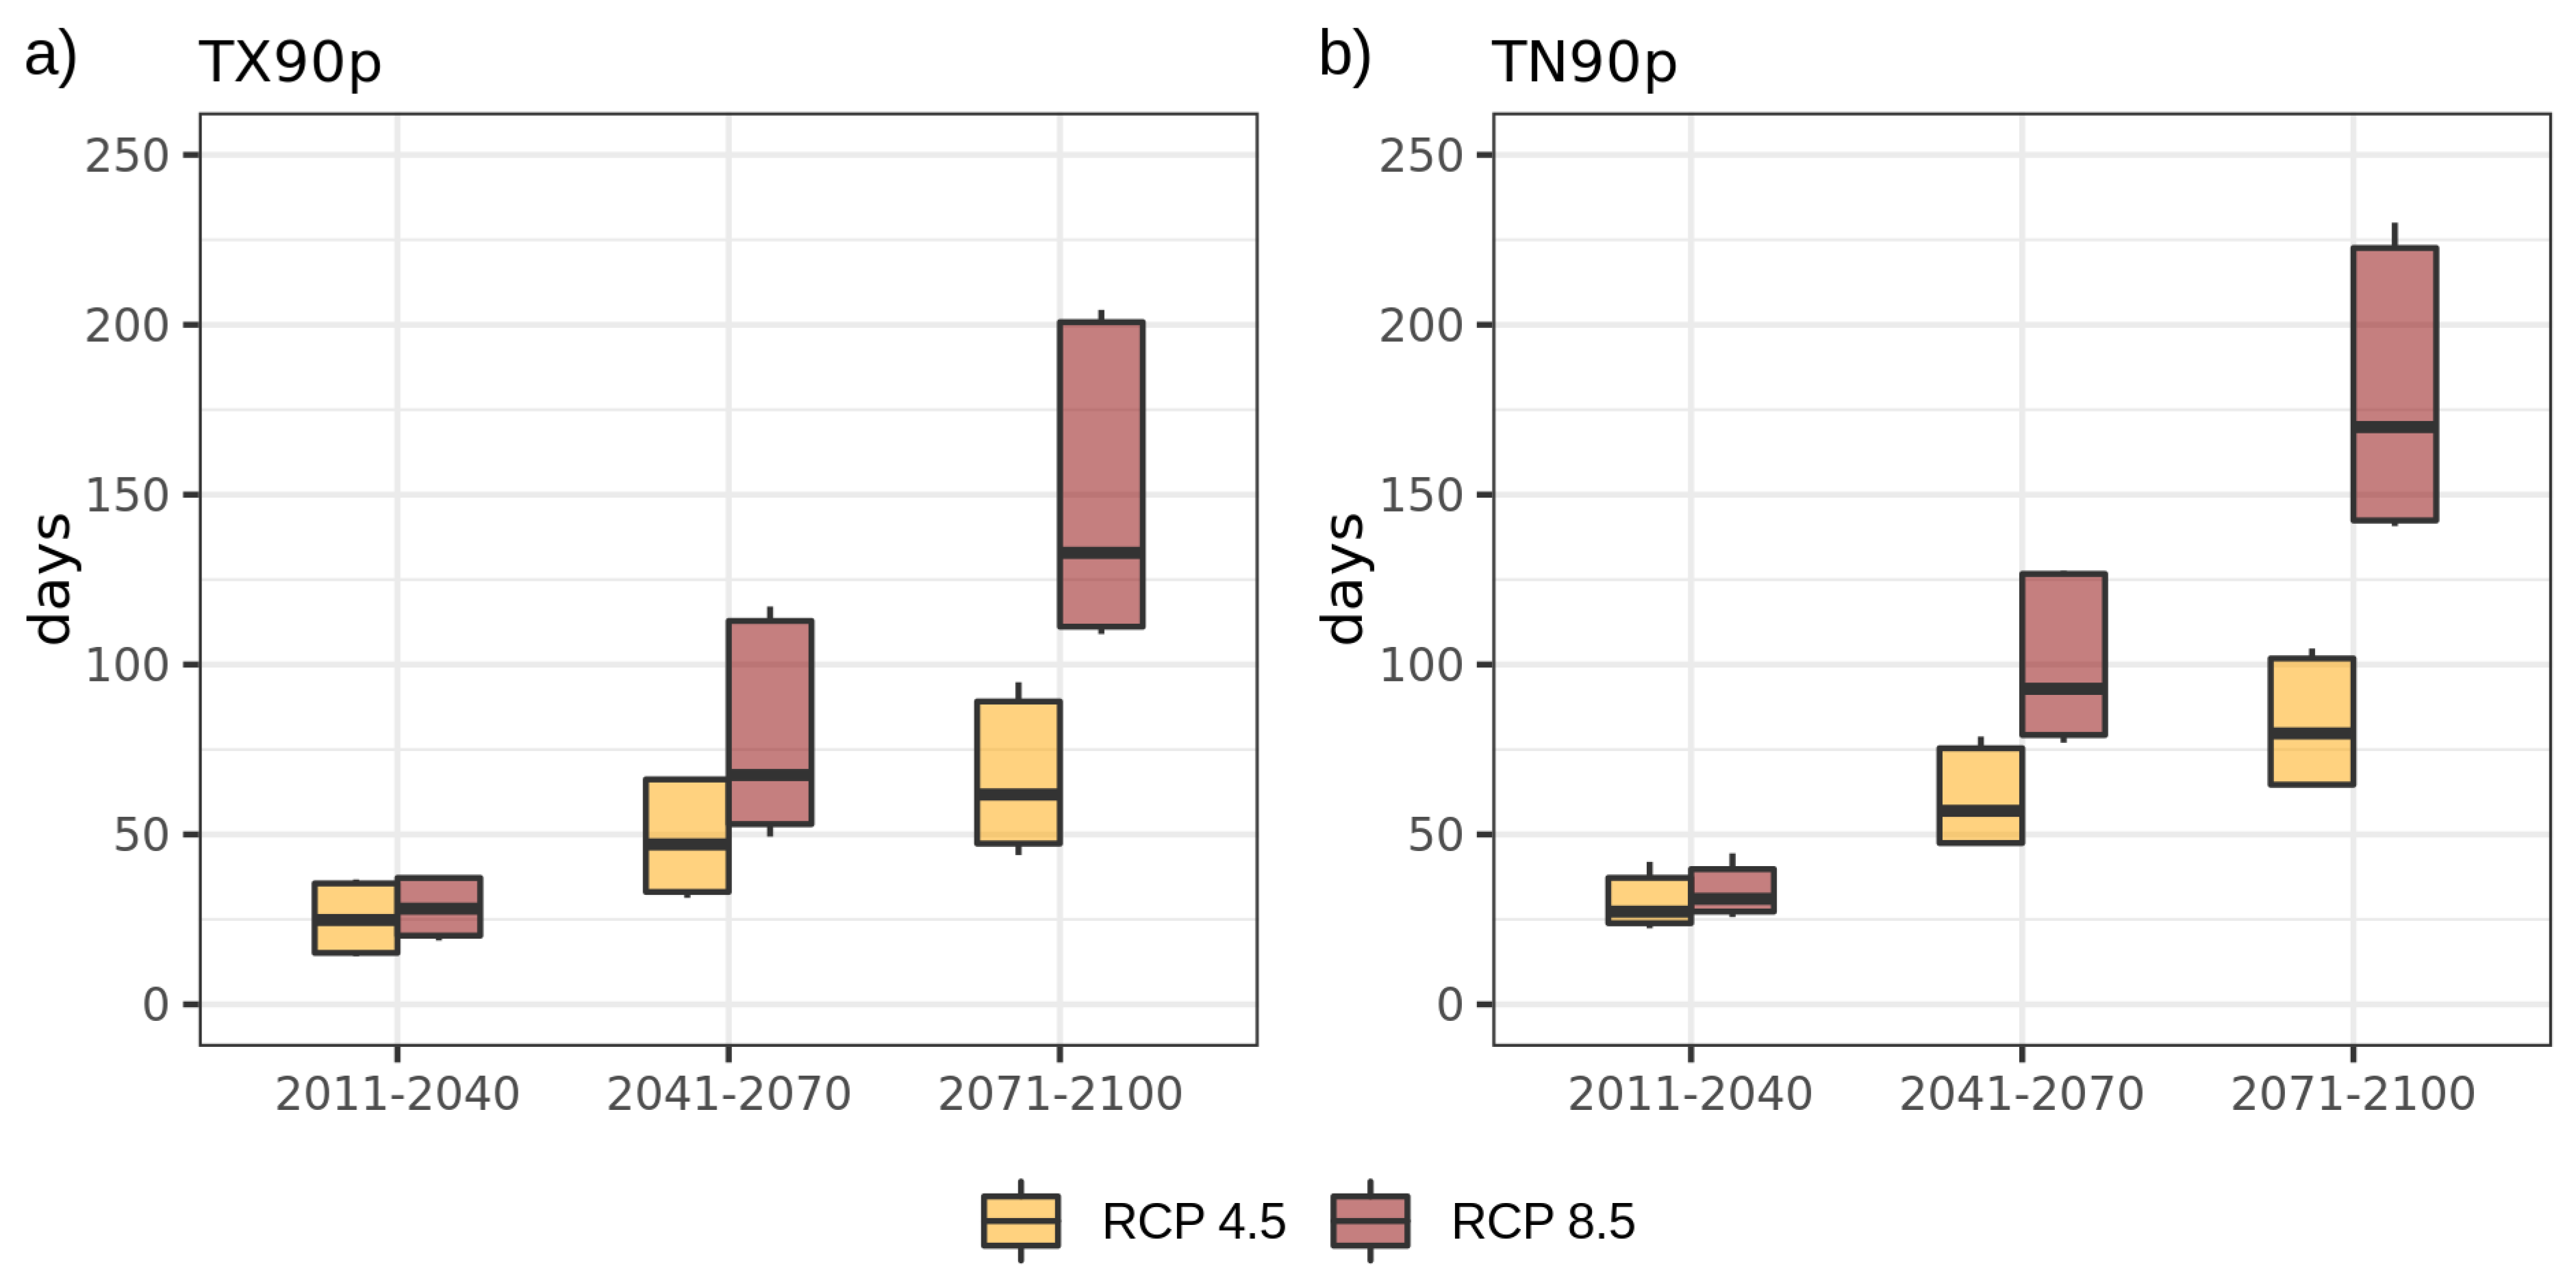
Figure 11.
Projected changes for (a) Rx5day and (b) R95ppTOT in 2041-2070 from the mean of the model ensemble and under the two RCPs. The changes are computed as percentage differences from 1981-2010. Only points reporting robust and significant changes are reported.
Figure 11.
Projected changes for (a) Rx5day and (b) R95ppTOT in 2041-2070 from the mean of the model ensemble and under the two RCPs. The changes are computed as percentage differences from 1981-2010. Only points reporting robust and significant changes are reported.
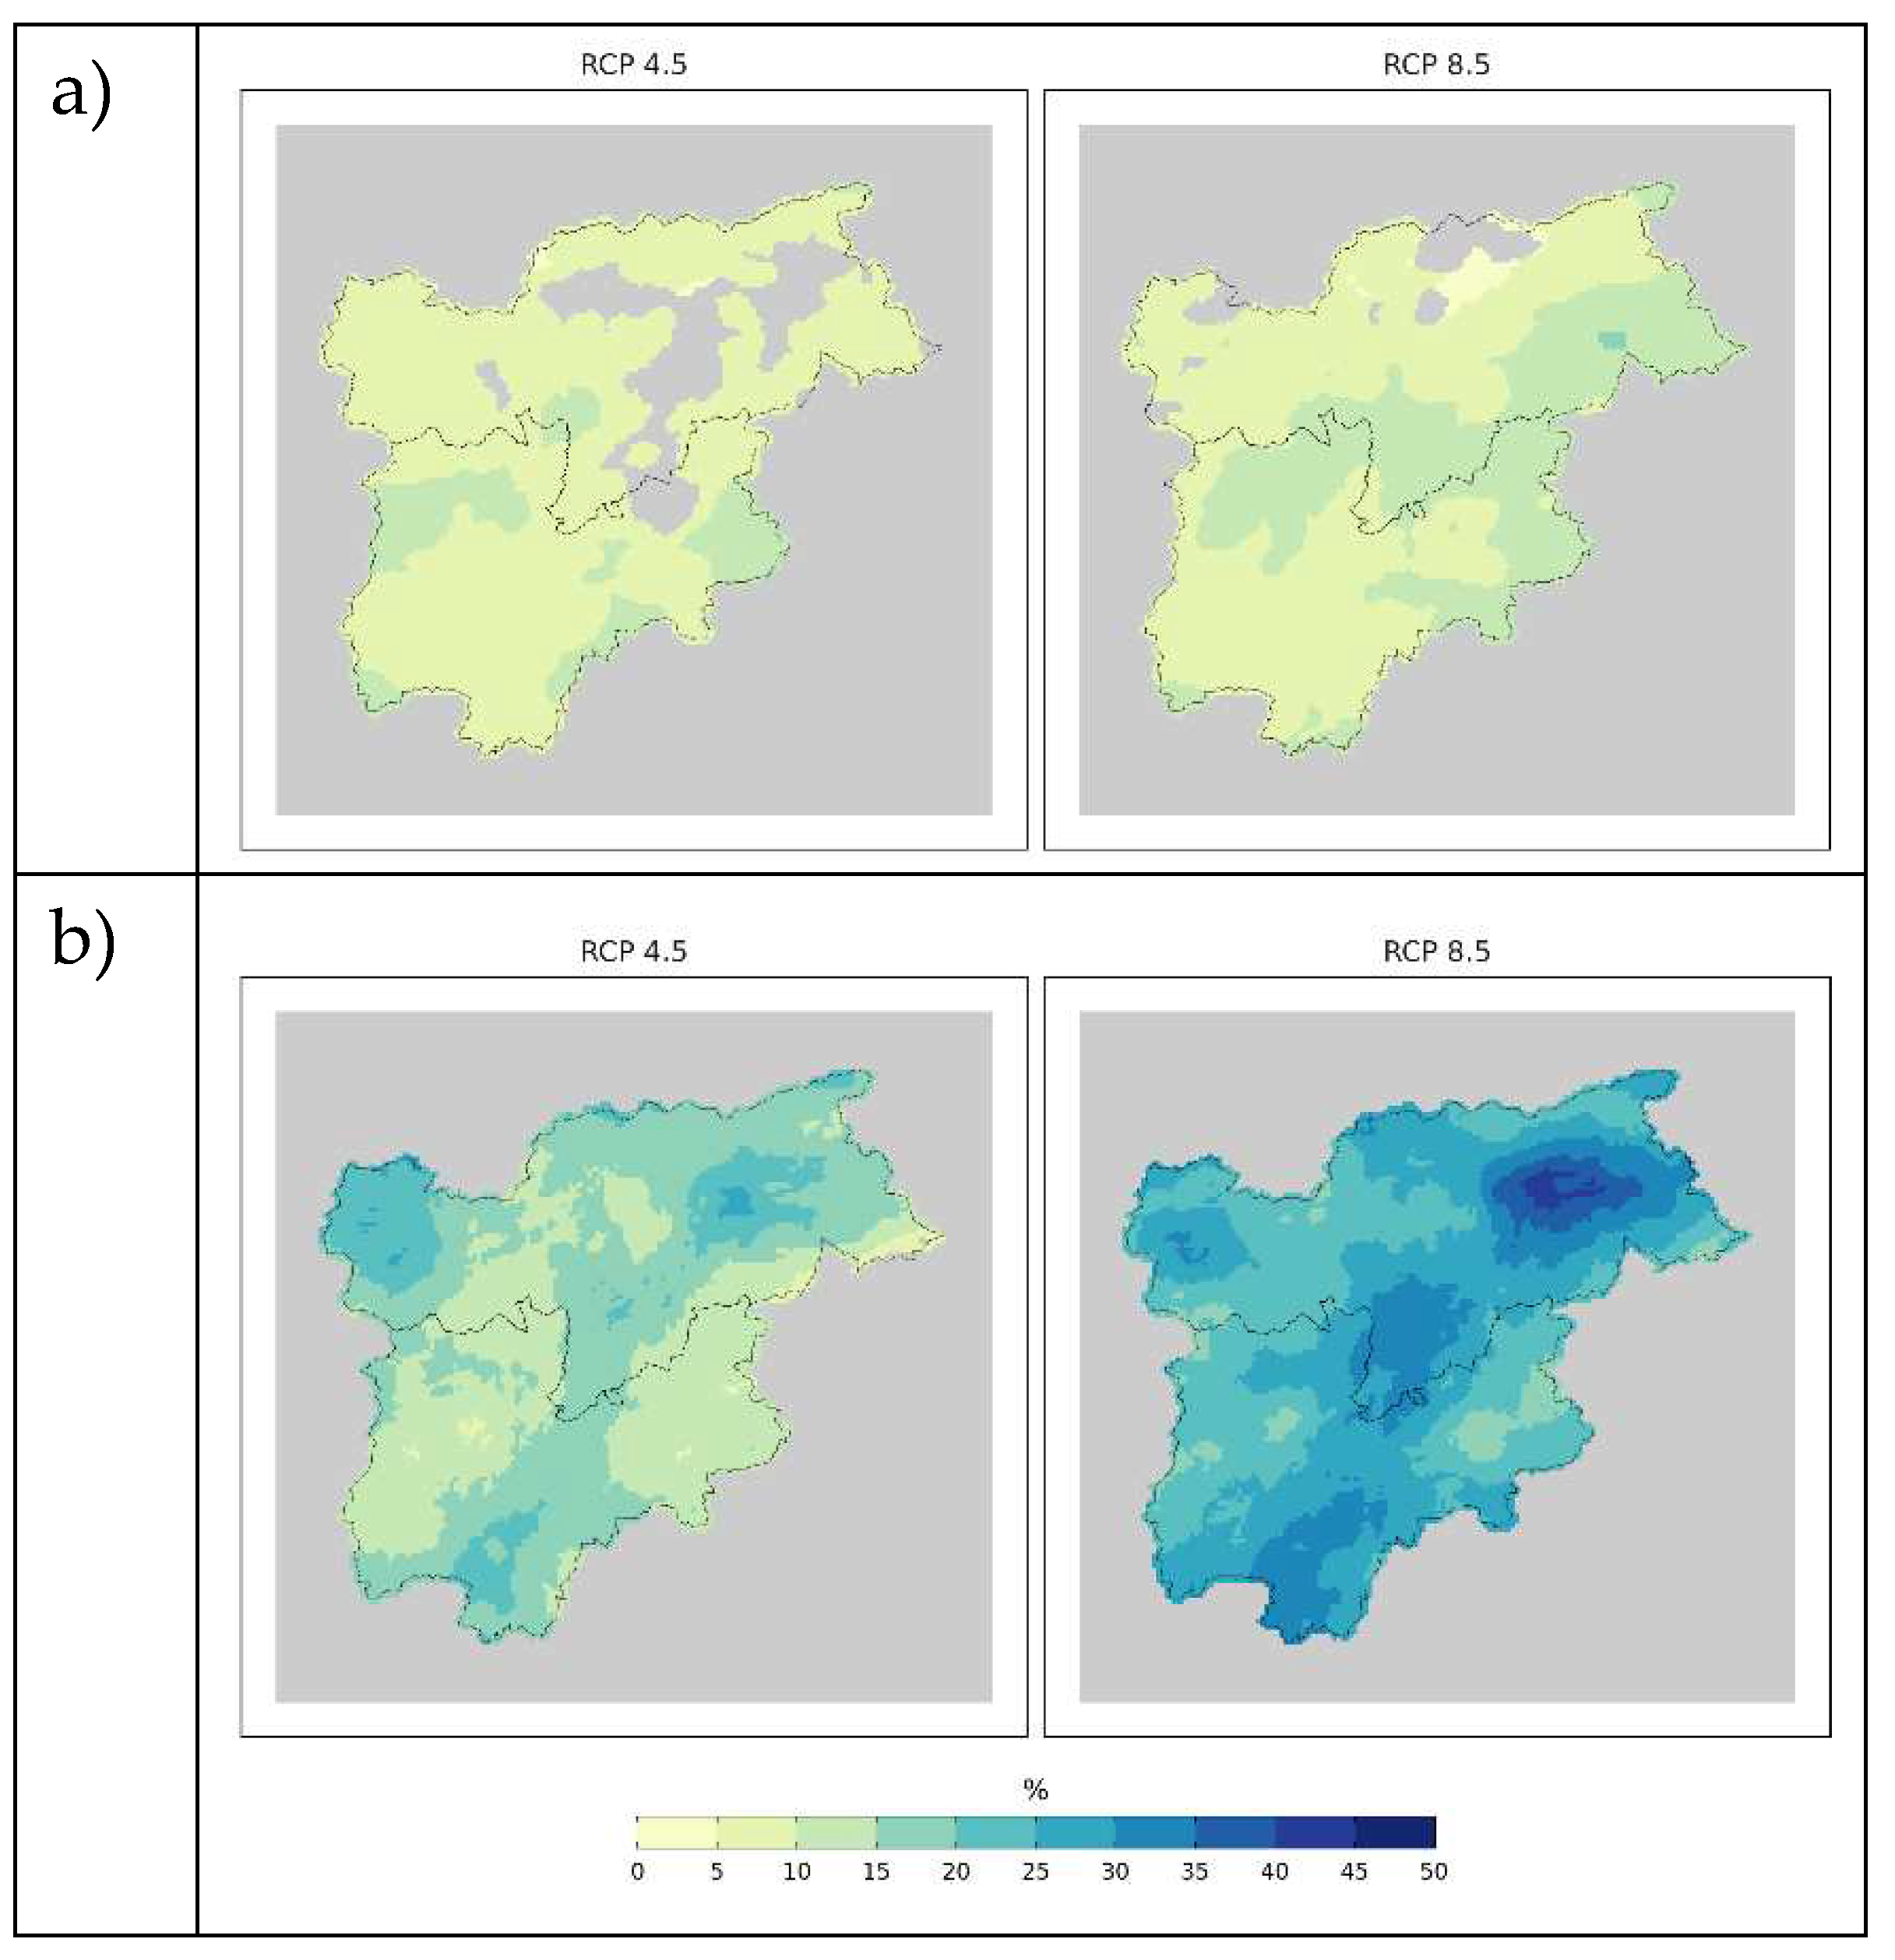
Figure 12.
Ensemble distribution of changes in (a) Rx5day and (b) R95pTOT for three future 30-year periods with respect to the baseline 1981-2010 under the two RCPs. The horizontal line in the box represents the median of the model ensemble, the boxes extend between 5th and 95th percentiles while the wishers extend from minimum to maximum value of the ensemble.
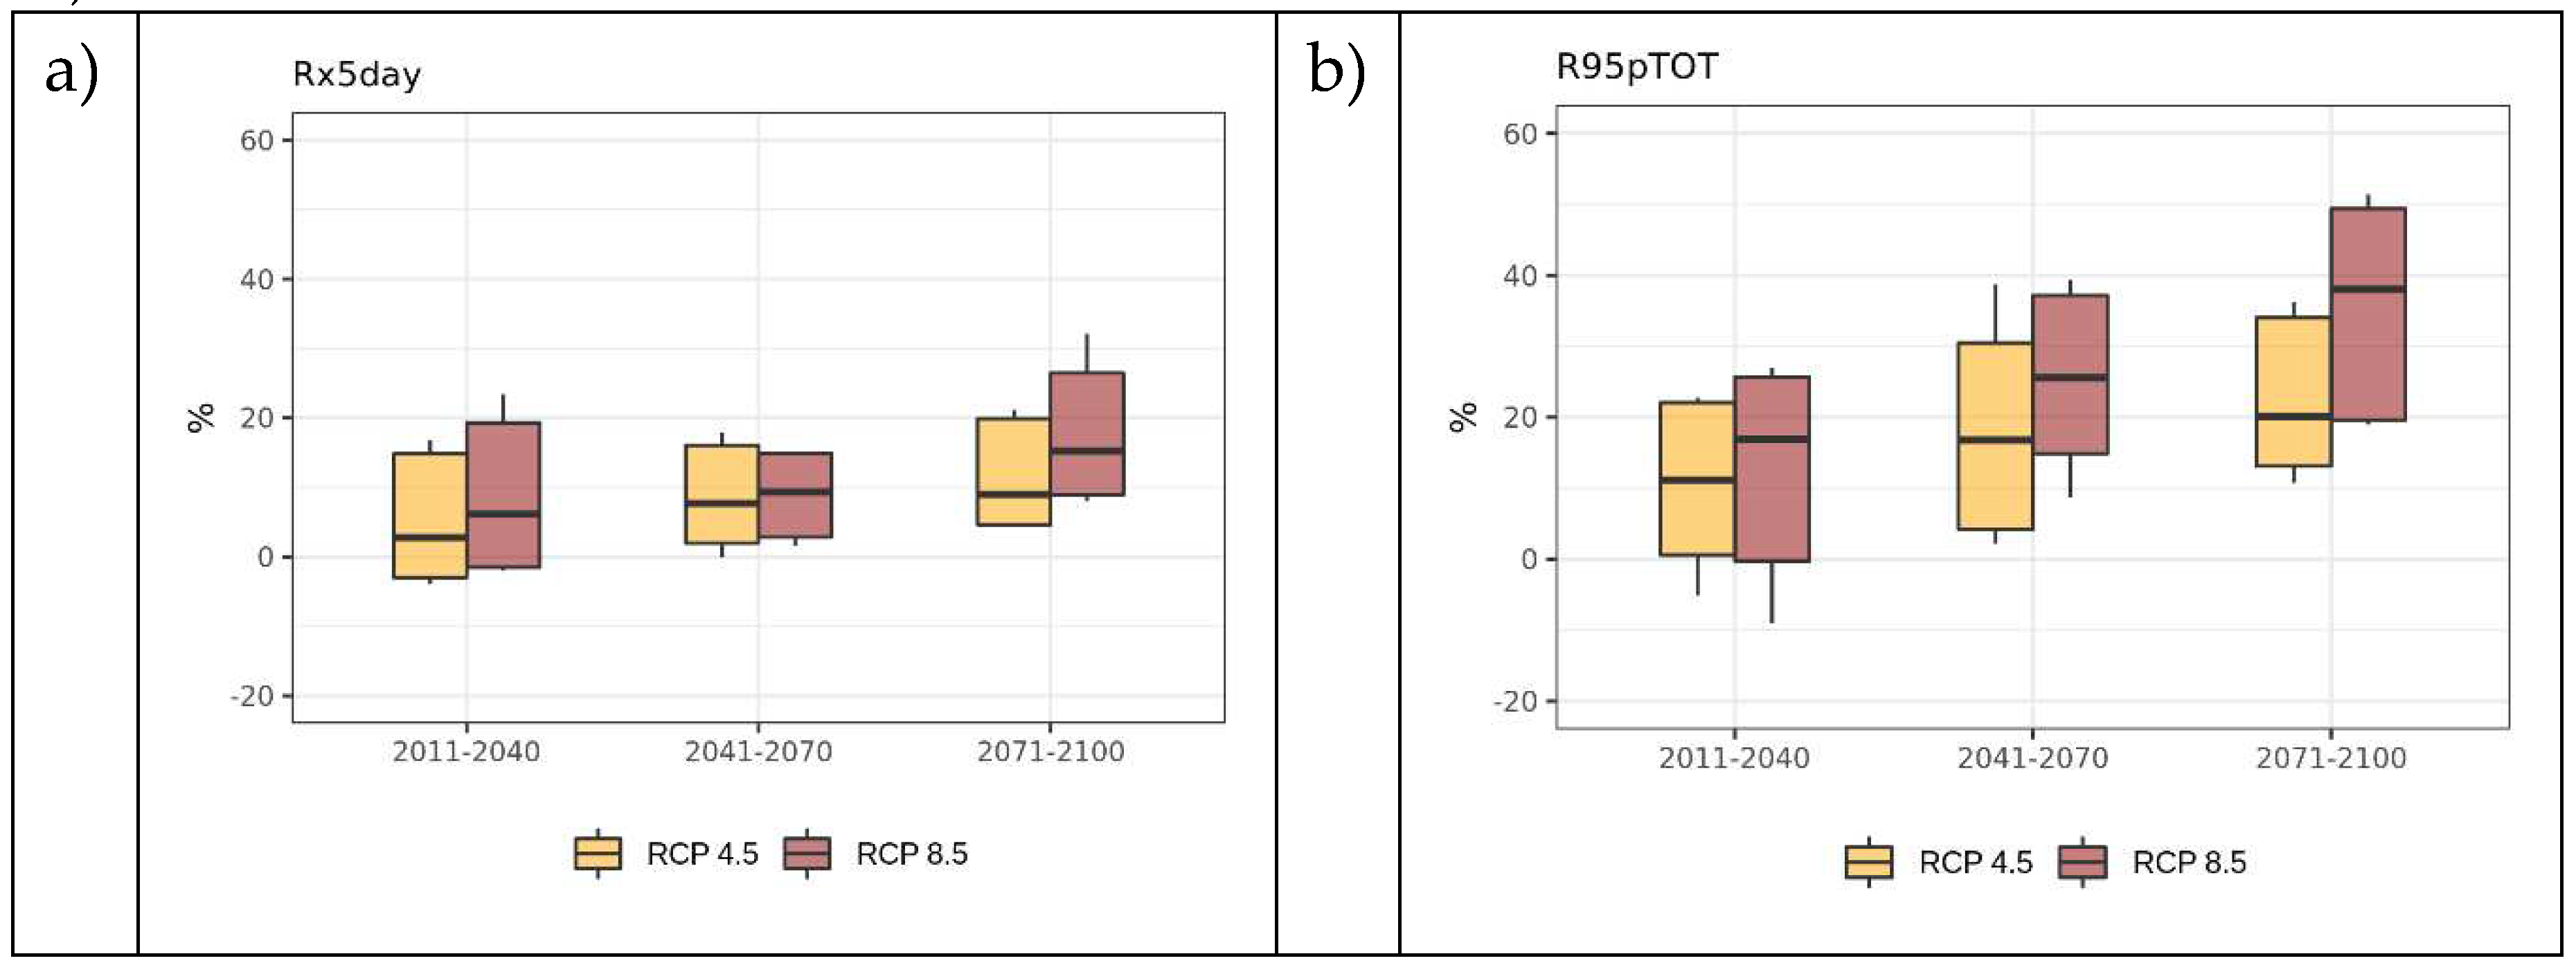

Table 1.
List of models selected from the EURO-CORDEX initiative.
| GCM | RCM | Realization | Version | Variable |
|---|---|---|---|---|
| CNRM-CERFACS-CNRM-CM5 | CLMcom-CCLM4-8-17 | r1i1p1 | v1 | tasmax, tasmin, pr |
| CNRM-CERFACS-CNRM-CM5 | CNRM-ALADIN63 | r1i1p1 | v2 | tasmax, tasmin, pr |
| CNRM-CERFACS-CNRM-CM5 | KNMI-RACMO22E | r1i1p1 | v2 | tasmax, tasmin, pr |
| CNRM-CERFACS-CNRM-CM5 | SMHI-RCA4 | r1i1p1 | v1 | tasmax, tasmin |
| CNRM-CERFACS-CNRM-CM5 | RMIB-UGent-ALARO-0 | r1i1p1 | v1 | pr |
| ICHEC-EC-EARTH | CLMcom-CCLM4-8-17 | r12i1p1 | v1 | tasmax, tasmin, pr |
| ICHEC-EC-EARTH | DMI-HIRHAM5 | r3i1p1 | v2 | tasmax, tasmin |
| ICHEC-EC-EARTH | KNMI-RACMO22E | r12i1p1 | v1 | tasmax, tasmin, pr |
| ICHEC-EC-EARTH | SMHI-RCA4 | r1i1p1 | v1 | tasmax, tasmin |
| IPSL-IPSL-CM5A-MR | IPSL-WRF381P | r1i1p1 | v1 | pr |
| IPSL-IPSL-CM5A-MR | SMHI-RCA4 | r1i1p1 | v1 | tasmax, tasmin |
| MOHC-HadGEM2-ES | CLMcom-CCLM4-8-17 | r1i1p1 | v1 | pr |
| MOHC-HadGEM2-ES | KNMI-RACMO22E | r1i1p1 | v2 | pr |
| MPI-M-MPI-ESM-LR | CLMcom-CCLM4-8-17 | r1i1p1 | v1 | tasmax, tasmin, pr |
| MPI-M-MPI-ESM-LR | MPI-CSC-REMO2009 | r1i1p1 | v1 | tasmax, tasmin, pr |
| NCC-NorESM1-M | GERICS-REMO2015 | r1i1p1 | v1 | tasmax, tasmin |
| NCC-NorESM1-M | SMHI-RCA4 | r1i1p1 | v1 | tasmax, tasmin |
Disclaimer/Publisher’s Note: The statements, opinions and data contained in all publications are solely those of the individual author(s) and contributor(s) and not of MDPI and/or the editor(s). MDPI and/or the editor(s) disclaim responsibility for any injury to people or property resulting from any ideas, methods, instructions or products referred to in the content. |
© 2023 by the authors. Licensee MDPI, Basel, Switzerland. This article is an open access article distributed under the terms and conditions of the Creative Commons Attribution (CC BY) license (http://creativecommons.org/licenses/by/4.0/).
Copyright: This open access article is published under a Creative Commons CC BY 4.0 license, which permit the free download, distribution, and reuse, provided that the author and preprint are cited in any reuse.


