
Submitted:
10 January 2023
Posted:
11 January 2023
You are already at the latest version
Abstract
Nitrogen fertilization ensures the proper growth of trees. The aim of the study was to evaluate the impact of differentiated nitrogen fertilization on selected parameters. It was assumed that such analysis is an indirect picture of the needs of cherries grown in herbicide fallow. The content of minerals in two layers of the soil, in leaves, and its influence of tree growth, and the content of chlorophyll in leaves were assessed. The experiments were carried out in three different cherry orchards. Three levels of fertilization were applied in each orchard: 0 kg, 60 kg and with 120 kg N ha- 1. As expected the fertilization resulted in an increase in the content of nitrate and ammonium forms of nitrogen in the soil, however, their content was also dependent on precipitation and temperature. Additionally a high nitrogen fertilization increased the content of phosphorus and potassium and decreased the magnesium in the topsoil layer. High nitrogen fertilization caused the decrease of content of phosphorus and potassium in the leaves. The level of calcium and magnesium in leaves increased with fertilization of 60 kg N ha–1 but decreased with the dose to 120 kg N ha–1. The use of nitrogen fertilization increased the vegetative growth of trees measured by leaf area and trunk cross-sectional area. However, the chlorophyll content was not dependent on the amount of nitrogen fertilization.
Keywords:
Prunus cerasus
; ammonium nitrate
; chlorophyll
; TCSA
; mineral content
; carotenoids
1. Introduction
The extensive root system allows plants to take up almost all nutrients from the soil, which makes soil fertilization the basic way of their nutrition. The availability of minerals depends on many factors. The main ones are the type of soil, the content of organic matter, the pH and the course of climatic conditions. These factors, by inducing microbiological and chemical processes in the soil, affect their uptake [1].
Fruit plants are perennial plants, which means that they are characterized by lower nutritional requirements than annual plants. It is caused by a much larger and more durable root system, as well as the ability to store nutrients in permanent organs such as roots, trunk, branches, shoots, and buds. Fruit plants can meet nutritional needs even with a low concentration of nutritional compounds. The annual increase in stocks is difficult to estimate because it is impossible to calculate how many components collected were used to build new tissues and how much was ‘in stock’ [2,3]. Some of the collected components return to the soil with fallen leaves and cut shoots, and other parts removed during agrotechnical work, such as flowers or fruit buds [4]. Orchard species differ in the demand for nitrogen. It depends mainly on the nitrogen content in the fruit and the weight of the entire crop relative to the weight of the rest of the plant. The least nitrogen contains apples because about 0.9g for each kg and the most kiwi, because as much as 4.5 g per kg of fruit[3]. Assuming that the average kiwi yield is approximately 20 t ha–1 [5], it is to compensate for the loss of nitrogen, which results from the yield, fertilization should be 90 kg ha֪–1. On the other hand, apples, although they contain much less nitrogen, the yield of apple trees is higher. In Poland, on many farms the yield is 50 t ha-1 and in some it may exceed 80 t ha–1 [6,7,8]. Along with the crop, from 50 to 80 kg of N ha–1 are taken out from the orchard. Therefore, the amount of nitrogen fertilization should be depend of the yield of trees. According to the integrated cherry cultivation methodology, if for instance due to spring frost is expected lower yield, the dose of nitrogen fertilization should be reduced by 30-50% [9].
In the cultivation of fruit plants, it is very important to maintain a balance between vegetative growth and fruiting of trees [10]. This allows for regular and annual fruiting. Excessive nitrogen fertilization increases growth, causes a deterioration in the quality of fruits and their storability [11]. Nitrogen, on the other hand, increases the weight of the fruit. The market requires the supply of large fruits with very good quality parameters. However, in the case of pome fruits, increasing nitrogen fertilization contributes to the deterioration of colour and greater sensitivity to storage diseases. Stone species react weaker than pome species to high nitrogen fertilization [11]. This is due to an imbalance of minerals in the plant, which interferes with the growth and yield of trees. Nitrogen fertilization contributes to a greater sensitivity of fruits to storage diseases. Therefore, the amount of nitrogen fertilization should be dependent of the expected yield in a given year [3], which depends on the course of the weather conditions [12,13]. It is recommended to divide the planned dose of nitrogen fertilization into 2 or 3 parts. This allows you to modify fertilization if there are factors limiting fruiting, e.g. frost or weather unfavourable for pollination during flowering [3].
Nitrogen is a necessary element for the proper development of plants, however is very mobile in the soil. The use of too high doses can lead to losses of this component due to leaching and contamination of groundwater [14]. Excessive use of nitrogen fertilisers can lead to high nitrate concentrations in the soil and then their leaching into groundwater [15,16]. Therefore, optimal nitrogen fertilization must be adjusted to ensure a high yield with the lowest possible fertilizer dose [17].
High nitrogen fertilization also increases susceptibility to diseases by stimulating vegetative growth [3]. In cherry orchards, the amount of recommended dose of fertilizer depends on the organic matter. The higher the content of organic matter, the lower the dose should be applied. According to the recommendations in cherry orchards fully fruiting, where the content of organic matter in the soil is in the range of 0.5-1.5%, the annual dose of nitrogen should be between 60 and 80 kg N ha-1 [18]. With a yield per hectare of full fruiting (yield 15 t ha–1), approx. 45 kg N [19] is removed from the orchard with the crop. The use of nitrogen applied in early spring by trees is small and usually not exceed more than 10-12 percent. Such a small use means that during flowering there is still a lot of fertilizer nitrogen in the soil and, as research shows, in the apple orchard during the flowering period there was still in the soil nearly 60% nitrogen of applied in spring [20].
In the early stages of growth, plants use nitrogen taken up and accumulated in tissues in the previous season. The amount of nitrogen stored depends on the age of the tree, size and applied fertilization [3]. In deciduous trees, before the end of the growing season and leaf fall, nitrogen is withdrawn from the leaves and transferred to the trunk, shoots, older roots, where it is stored and the tree uses it at the beginning of vegetation before it begins to take up from the soil [21,22]. In addition, fallen leaves decompose and nitrogen can be reused by the tree after undergoing decomposition and mineralization processes [23], in the second year after the drop [24].
The source of nitrogen is probably heterotrophic aerobic bacteria, including, among others, bacteria from the genera Azotobacter and Azospirillum. Assimilates N2 only for the purpose of cell metabolism, so they do not secrete bound N into the environment. Nitrogen enters the soil environment when the bacterial cells die. The amount of nitrogen that is supplied to the soil is estimated at several kilograms of N∙ha–1 per year [25]. Despite the small amount, the quantities supplied are of great importance for soil fertility. However, their occurrence and abundance depend on various environmental factors such as organic matter content, moisture, soil reaction, climatic condition. [26]. For example, Azotobater is very high in soil pH and rarely occurs in soils with a pH below 6 [27]. In contrast, Azospirilllum naturally occurs in regions with warm and or hot climates. In these regions, populations of associative microorganisms in soils are significantly higher than in the soils of our climate zone [28].
Nitrogen fertilization leads to an increase in the size of the tree and the area of the leaves [29] and on the other hand, it limits the intensity of flowering [30]. Trees grown under low nitrogen availability have a lower rate of photosynthesis, which results in a lower yield and fruit size [31], because photosynthesis is a function of the surface of the leaves, not their mass [32]. A significant correlation was found between the specific leaf weight (SLA specific leaf area) (leaf weight/area) and the nitrogen content of the leaves [33].
Nitrogen should be available throughout the growing season, so sorption of mineral nitrogen is important. Plant roots are capable of absorbing nitrogen in the nitrate form (NO3-), as well as in the ammonium form (NH4+), but in well-aerated soils, nitrates are the dominant source of nitrogen [34]. Ammonium nitrogen (NH4+) as a cation is well absorbed interchangeably, so it does not leach into deeper layers of the soil. In contrast, nitrate nitrogen (NO3-) as an anion is not subject to biological and exchange sorption. It is washed out into the deeper layers of the soil beyond the reach of the root system [35]. This causes its loss as a nutrient and is also a source of environmental contamination. Additionally, in the process of oxidation of ammonium ions and their reduction to nitrite, nitrous oxide (N2O) is formed, which is one of the factors that causes the degradation of the ozone layer in the atmosphere [36,37,38]. One of the recommended solutions to reduce nitrogen loss is to divide the full dose of nitrogen into 2-4 components [19].
The intensity of photosynthesis is directly proportional to the chlorophyll content in the leaves. Its content of chlorophyll depends on the availability of light, the vigour of tree growth, species, cultivar and rootstock, and stress factors [39,40,41,42]. The chlorophyll content of the leaves is thickened when poorly lit, than in central part of the crown is on average 1.3 times thickened than in the leaves on the outskirts of the crown [43]. The higher concentration of green pigments in poorly lit leaves is explained by the mechanism of their adaptation to worse light conditions. Lack of light causes a decrease in the thickness of the leaf blade [44]. However, conversion of chlorophyll concentrations per m2 LSA (leaf surface area) shows that leaves from the peripheral part of the crown have the same or higher chlorophyll content as the middle [43].
The purpose of the study was to evaluate the impact of different doses of nitrogen fertilization on the content of the basic element in the soil and in the leaves and its influence on selected cherry growth parameters.
2. Materials and Methods
2.1. Location and Main Agrotechnical Treatments
The research was carried out in the years 2010-2013 on sour cherries (Prunus cerasus L.) cultivar 'Łutówka' grafted on rootstock (Prunus mahaleb L.). The trees were planted in spring 1999 (OR1), 2001 (OR2), and 2002 (OR3) on the experimental farm of the Poznań University of Life Sciences on order-made podzolic soil. The groundwater level was at a depth of 180 cm. The distance between the rows was 4 m. In the first orchard, the distance between the trees in the row was 2.0 m. In the remaining OR2 and OR3, after two years of cultivation, it was decided to reduce the row spacing to 1.3 m due to the large space between the trees.
Between the rows of trees, a belt of grass was maintained, and a belt under the crowns of herbicide fallow trees, where Roundup 360 SL glyphosate was applied 2-3 times as weeds appeared, Monsanto Europe N.V., Belgium). Protection against diseases and pests was carried out on the basis of current recommendations for production in commercial sour cherry orchards.
Before the establishment of the experiment, a chemical analysis of the soil was performed and on its basis mineral fertilization of the soil was applied [45]. Two years before planting the trees, the legume plants were grown for green manure and the soil was carried out. Before planting, potassium (200 kg·ha–1 K2O), phosphorus (185 kg·ha–1 P2O5) and 60 t·ha–1 manure were applied to each orchard.
The trees were kept with a leader, in the form of a spindle crown.
2.2. Fertilization
2.2.1. Nitrogen Fertilization
The experiment was designed in a random block system in 4 repetitions. There were 5 trees in each repetition. One combination consisted of 20 trees. Between each repetition there were 2 insulation trees.
The following nitrogen fertilization were used:
- Control- without fertilisation (0N),
- 60 kg N ha–1 (N60),
- 120 kg N ha–1 (N120).
Every year in spring between 10 and 20 April, before the trees bloomed, fertilization with ammonium nitrate (34% N) was carried out.
2.2.2. Fertilization with other Ingredients
From the third year after planting, fertilization with other components was applied as necessary determined on the basis of soil analysis. Every other year, magnesium lime was applied at a dose of 750 kg ha–1 (40% CaO and 10% MgO).
2.3. Measurements, Observations, and Analyses
2.3.1. Vegetative Growth
In autumn, after the end of vegetation between 10 and 20 November, the volume of the trunk was measured at a height of 30 cm from the ground. Based on volume, the cross-sectional area of the trunks (TCSA) was calculated. The difference between the measurements in subsequent years was used to calculate the TCSA increment between the years of research.
The measurement of leaf area was carried out after the fruit harvest. A dozen or so undamaged leaves were taken randomly from each tree. A random number of tens were taken for each tree, so the measurement without a single repetition was 50 leaves. The leaves were scanned and the image obtained was analysed using the Digshape 1.9 program (ver.1.9.19, Cortex Nowa, Bydgoszcz, Poland), which calculated the leaf area. The result is given in cm2 per leaf.
2.3.2. Soil Sampling
2.3.2.1. Determination of Minerals
Each year, at the turn of July and August, soil samples were taken. The determination of the content of the P, K, Mg, and soil reaction was carried out in the laboratory of the Department of Pomology in Poznań. The samples were taken from the herbicide belt from two layers of soil: arable 0-20 cm and sub arable 21-40 cm. A soil drill was used for collection. From each fertilizer combination in the orchard, 4 soil samples with a volume of 500 ml were taken. The content of the components in the soil was determined according to the methods of Egner-Riehm (P and K) and Schachtschabel (Mg) [46].
The content of Cu, Mn, Zn, and Fe- in the soil was carried out soil was carried out based on the standard in force in Poland.
2.3.2.2. Determination of Nitrogen in Soil
The nitrogen determination were taken on 4 dates: after flowering trees, during the intensive fruit growth, after fruit harvest in August, and after the end of vegetation. The sampling method was analogous to the determination of other minerals. The samples immediately after collection were transported to the Department of Pomology and frozen. In the frozen state, they were submitted for analysis the next day. The assessment of the content of nitrogen forms: N-NH4 and N-NO3 in the soil was carried out based on the standard in force in Poland.
2.3.3. Leaves Sampling
Leaves for analysis were collected at the turn of July and August after fruit harvest. Samples were taken from each repetition separately. The sample consisted of 150-200 leaves. The leaves were collected from half of the annual increments at a height of 130-180 cm. Immediately after harvest, the leaves were dried in a dryer at 65-70°C. The K and Mg content was measured with an atomic absorption spectrometer, calcium, by atomic absorption with a lanthanum concentration of 1%. The P content was measured calorimetrically in a molybdenum-vanadium mixture. The total nitrogen level was measured using the Kjeldhal method. The mineral content in the soil and leaves was compared with the standard values applicable in Poland [47].
2.3.4. Determination of Pigments in Leaves
Fragments of a leaf blade weighing 0.5 g were cut from the leaves with a corkscrew and 5 ml of DMSO (dimethyl sulfoxide) was poured. The samples were left for about 1 hour in the dark, at room temperature, and then incubated at 65 °C (water bath) for 20 minutes. In the obtained extract after cooling, the content of chlorophyll a and b was determined spectrophotometrically.
The chlorophyll pigment content was determined using a spectrophotometer (Spekol, Carl Zeiss Jena, Jena, Germany) at the appropriate wavelength. For chlorophyll a, the absorbance of the extract was measured at a wavelength of 663 nm, for chlorophyll b at a wavelength of 645 nm, for carotene at a wavelength of 470 nm. The amount of chlorophyll a, chlorophyll b and the sum of chlorophyll a + b were calculated using formulas from the paper (Arnon 1949).
Chlorophyll a = (12,7·A663 – 2,7·A645)·V·( 1000 W)-1 (1)
Chlorophyll b = (22,9·A645 – 4,7·A663)·V·(1000 W)-1 (2)
Sum a + b = (20,2·A645 + 8,02·A663)·V·(1000 W)-1 (3)
Carotenoids = (1000 ×A470 – 1,9 chlorophyll a -63,14 chlor Chemical Characteristics of Banana- ophyll b) ×214 -1
where: A – absorbance at a given wavelength, V – total volume of extract (cm3), W – mass of the sample (g).
2.4. Analysis of Weather Conditions
Weather data was collected in court using an automatic weather station, iMETOS (Pessl Instruments, Austria). The temperature of the soil and air at a height of 2 m above ground level and the amount of precipitation were measured. Measurements of insolation during the study period were carried out using the meteorological station in PULS (HOBO® —Plus4, made by ONSET Computers, Bourne, MA, USA). Based on the measurements, average temperatures and rainfall totals in individual months of the year and vegetation period were calculated (Table 1, Figure 1 and Figure 2).
2.5. Statistical Analysis of Results
The results obtained were subjected to statistical analysis in Statistica 13.3 software (TIBCO Software Inc., Palo Alto, CA, USA). The means were compared using the Duncan test for a P≤ 0.05%. The relationships between the features were calculated by calculating the Pearson’s correlation coefficient. The principal component analysis (PCA) was used to determine the relationship between climatic conditions on nitrate nitrogen content.
3. Results and Discussion
3.1. Ammonia and Nitrate Nitrogen Content in Soil
Nitrogen fertilization had a significant impact on the nitrogen content of the soil (Figure 3 and Figure 4). With the increase in the dose of nitrogen fertilizer, the content of both determined nitrogen increased: ammonium and nitrate. However, the significance of the differences depended on the depth of sampling and the nitrogen compound. In the upper layer, no significant differences were found between the control combination and fertilization of 60 kg N ha–1. However, in the potted layer, nitrate nitrogen was at a significantly higher level after applying 60 kg N ha–1. The lack of a significant increase in nitrogen content in the soil can be explained by the fact that the trees consumed most of the nitrogen used. A similar relationship was found in the apple orchard, where the dose of 50 kg N ha–1 had no effect on the growth of assimilable forms of nitrogen in the soil. The lack of differences was explained by the high content of organic matter in the soil of the analysed orchard [48]. In our experiment, the value of caries was much lower than in the cited experiment, and despite this, the dose of 60 kg N ha–1 did not significantly increase the nitrogen content. Only increasing the dose to 120 kg N ha–1 significantly increased the nitrogen content in both layers of the soil. This effect of the increasing the content of available forms of nitrogen indicates that the trees did not take up more fertilizer, probably caused by exceeding the fertilizing needs of trees. This is also confirmed by studies in the apple orchard, where a sharp increase in the overall nitrogen content in the soil occurred at a dose of 100 kg N ha–1 in herbicide fallow belts. On the other hand, there was no significant increase in nitrogen content in the turf belt, because the turf stabilises the nitrogen content in the soil [49,50]. It should be emphasized that an additional source of nitrogen is a part of the mowed turf, which goes to the tree rows and undergoes mineralization, providing an additional 10-25 kg N ha–1 annually, depending on the number of swaths and the temperature course. This is a significant source because, according to Kowalczyk et al. [2022] [49], this amount can satisfy 50% of the nitrogen needed by fruit trees [51].
As a result of the mineralization of organic matter, an increase in nitrogen abundance can be observed near herbicide belts near the tree line, resulting in a lack of reaction not only to fertilization but also to nitrogen leaching [49,52]. The lack of significant differences between the combination of N0 and N60 may also be related to the presence of heterotrophic bacteria, including, among others, bacteria of the genera Azotobacter and Azospirillum, which assimilate N2. Despite its small amount, it is released into the soil environment and has a major impact on soil fertility [25]. This mechanism is supported by the observation that the use of high doses of mineral nitrogen fertilizers inhibits the activity of nitrogenase and reduces the number of diazotrophic bacteria [26,53]. Therefore, its potential contribution to the supply of nitrogen to the soil is smaller in fertilizer combinations. According to research conducted in an intensive apple orchard, the requirements of apple trees in the initial period of growth are only 8.8 to 44 kg N ha–1 [54]. According to the integrated production methodology for apple and cherry orchards, the excessive dose of nitrogen fertilization is 100 kg N ha–1 [9,55]. According to the results obtained and reports in the literature, nitrogen fertilization should take into account the abundance of soil in organic matter, the way the soil is maintained in the orchard, and the climatic conditions during the growing season. The level of intensity of mineralization processes depends on temperature and humidity [26]. Within herbicide belts, the only factor that can stabilize the nitrogen content is the activity of soil microorganisms involved in the processes of denitrification and nitrogen uptake by the roots of trees and plants from the turf belt, which causes the variability of nitrogen content in the soil under herbicide belts is much higher than in the soil under grassland [49]. Significant differences between fertilization levels were evident in the deeper soil layer, suggesting a movement of nitrogen compounds into the soil profile under herbicide fallow, and an increase in fertilization rates leads to greater leaching of nitrates into deeper soil layers and groundwater pollution [49,56].
At the first sampling date (T1), the nitrogen content was higher than in the next three (Figure 5, Figure 6, Figure 7 and Figure 8). Only in the sub-arable layer were content fluctuations observed, depending on the date of the analysis (Figure 6B). The high level of nitrogen in the soil in the first term was the result of applied fertilization and the limited capacity of trees to take nitrogen in early spring, because in the early stages of development they use nitrogen accumulated in tissues in previous season [3], and the rate of nitrogen uptake is influenced by the temperature and development phase of trees. At 8-12°C there is a visible increase in nitrogen absorption by the roots. Only after three weeks from the beginning of bud cracking, apple trees take nitrogen [57]. Changes in nitrogen content also depended on the course of weather conditions. The influence of precipitation was investigated and the influence of evaporation, water balance, soil and air temperature on ammonium and nitrogen content was evaluated. The relationship between climatic conditions and ammoniacal nitrogen content was low, and sometimes seemed random and had no effect on soil content. On the other hand, the content of nitrate was correlated in the water balance, evapotranspiration (Table 2, Figure 9). The greatest dependencies occurred in the first sampling dates. The positive water balance during sampling reduced the nitrate nitrogen content and the obtained results confirm the results of studies in which it was found that nitrate nitrogen was easily washed into deeper layers of the soil, because it is not subject to biological and exchange sorption [35].
The age of the orchard had no significant effect on the nitrogen content of the soil (Figure 10, Figure 11, Figure 12 and Figure 13). However, a clear trend can be observed, because the highest value of both forms of nitrogen was found in the oldest orchard (OR1). The lack of significance between orchards can be explained by the fact that a significant difference occurred in the sub-arable layer for the nitrate form, while a direction of change in content was not observed for ammoniacal nitrogen. The 0-20 cm layer was characterized by a significantly higher content of nitrate nitrogen (Figure 12B and Figure 13B). According to the literature, fertilizing the orchard should take into account the age of the orchard, the yield, and the number of trees [9]. The higher nitrogen content in the soil of the oldest orchard may be due to decreasing nutritional needs with the age of the trees, as the trees have completed a period of intensive growth. The OR1 orchard also had the lowest tree yield [58] and the number of trees per hectare. This explains the lower nutrient requirements of trees, as with a lower density of trees per hectare of vegetation, they compete less for nutrients and use nitrogen in a smaller percentage [59].
3.2. Content of Minerals other than Nitrogen in the Soil
Thanks to the good preparation of the site before planting the orchard, the content in the soil did not fall below the recommendations for commercial orchards. However, if the differentiated nitrogen fertilization was taken into account, it was found that it also differentiated the content of other components (Table 3 and Table 4).
The P content increased for 120 kg N ha–1 compared to the control and 60 kg N ha–1. A similar relationship was observed in the sub arable layer, where the phosphorus content was lower but the nature of the changes was similar. High nitrogen fertilization also contributed to a higher potassium content in the upper soil layer. In the sub arable layer, such a tendency was not found and at fertilization of 60 kg N ha-1, the potassium level was significantly lower. Similar results were obtained in many years of experience, where nitrogen fertilization increased the nitrogen content in the soil layer by 0-30 cm [60]. Magnesium content was highest in the control and nitrogen fertilization resulted in a decrease in content. The lower Mg content under the influence of fertilization may be the result of a decrease in soil pH and nitrification. Magnesium is more easily washed out because it is less absorbed by soil colloids, moreover, Mg2+ is not specifically bound to clay minerals [61].
The potassium to magnesium increased after nitrogen fertilization. The trend of changes was clearly visible in the 21-40 cm layer for the dose of 120 kg N ha-1, where the decrease in magnesium content in the 21-40 cm layer was the largest.
Despite the lack of significant differences in soil reaction, its reduction was visible in the upper layer of the soil. However, in the arable layer, the application of nitrogen caused an increase in pH. Nitrate uptake increases the pH of the external solution. In the case of ammonium form, H+ is pumped out of the cell and remains mainly outside, and therefore the pH is reduced [62,63]. This phenomenon is particularly evident in the case of nitrates, since they are absorbed in large quantities compared to other types of anions [61].
3.3. Mineral Content in Leaves
The nitrogen content in the leaves depended on the height of nitrogen fertilization. An increase in the dose of nitrogen fertilizer resulted in an increase in the nitrogen content in the leaves (Table 5). This mechanism has been observed by other researchers [49,64], although there were exceptions, as Vang-Petersen [65] found that increasing the dose fertilization to 162 kg N ha–1 did not affect the increase in the nitrogen content of the leaves. According to other authors, increasing the dose of nitrogen causes an increase in the level of nitrogen in the leaves only to a certain level, above which fertilization is no longer accompanied by an increase in the content of this component in the leaves [49,52,66]. Another observation known from the literature is that with the age of the tree, the nitrogen content in the leaves decreases [45,65,67]. However, this regularity was not confirmed in our research, because the lowest content was found in the leaves collected from the youngest orchard, where the content of assimilable forms of nitrogen in the soil was the lowest. First of all, a significant relationship was found between the content of nitrate N in the sub-arable layer of the soil and the nitrogen content in the leaves (Table 6). It was found that in addition to fertilization, several other factors have a great influence on the mineral content of the leaves. The main ones include the rootstock used [68], precipitation, and temperature [68,69]. An increase of the nitrogen content in the leaves was also found under the influence of tree cutting, whereas the intensity of tree cutting increased, the nitrogen content in the leaves increased [67].
The phosphorus content in the leaves was inversely proportional to the dose of ammonium nitrate. The highest content was in the control combination and the lowest at a dose of 120 kg N ha–1. A similar effect was on potassium content, where the application of nitrogen fertilization resulted in a lower content in the leaves. It should be noted, however, that the lowest content was at 60 kg N ha–1. Similar results were obtained in earlier years, where nitrogen fertilization reduced the content of phosphorus and potassium in leaves [45]. The uptake of potassium was significantly influenced by climatic conditions. The increase in average temperature and rainfall caused an increase in the K content in the leaves (Table 6).
The magnesium content was highest with fertilization of 60 kg N ha -1, and doubling the dose did not affect the content of this nutrient in the leaves. A similar relationship was noted in relation to calcium, where 60 kg N ha–1 caused an increase in the content in the leaves and a further increase in nitrogen fertilization reduced its content compared to the control treatment. The effect of nitrogen fertilization on the increase in magnesium content has been found in other experiments, but the difference between control trees and nitrogen-fertilized trees was not always significant . Climatic conditions had a significant impact on the nutrition of trees in Mg and Ca, but the increase in temperature and rainfall during the growing season reduced the content of Mg and Ca in the leaves (Table 6). In conditions of strong vegetative growth, a decrease in the content of components in the leaves is often observed, which is referred to as dilution, which distorts the results . Changes in the content of components in the leaves also depend on the intensity of yield. This applies most to N, K, Mg, Ca, Fe, Mn and to some extent also P, where apple trees yielding more abundantly had higher contents [70]. The pad can have a significant impact on the content of ingredients. The use of strongly dwarf rootstock P22 for apple trees with intensive tree production caused nitrogen deficiency in the leaves [71]. In contrast, intensively yielding plums took only much more K, which was accumulated in the fruit while reducing the content in the leaves and perennial parts of the tree, and the level of the remaining minerals did not differ between trees that produced intensively and had no fruit [73].
3.4. Effect of Nitrogen Fertilization on the Growth of Cherry Trees
Increasing nitrogen fertilization to 120 kg N ha–1 resulted in greater tree growth measured by the cross-sectional area of the trunk and leaf area (Table 7). The cross-sectional area of the trunk after six years of study was the smallest in unfertilized trees, while the dose did not cause differences. However, an interesting result was observed when comparing the increase in the cross-sectional area. The difference between 60 and 120 kg N ha–1 of fertilization was significant, taking into account all orchards combined, because this variability in individual orchards was less pronounced. This is an important argument to not increase nitrogen fertilization excessively. Similar conclusions were previously reached by Fallahi and Mohan (2000) [69], who if they observed variation in tree growth, it was only between small doses, while excessive fertilization no longer differentiated growth [58]. This is especially noticeable in the orchard on fertile soil in the first years after planting. In general, fertilization has no effect on tree growth and only when the root system expands into turf strips and there is a nitrogen deficit, this effect is significant [64]. Research shows that only after 8 years of cultivation in a cherry orchard, 50% of the small roots responsible for the uptake are located in the turf belt [57]. In our experiment, however, the reaction was found earlier, which was certainly due to the low level of organic matter.
The leaf area was significantly higher with nitrogen fertilization and was highest with 120 kg N ha–1. A similar relationship was found in the mass of leaves. However, the SLA (specific leaf area - cm2/g) did not differ significantly between the fertilization combinations and was very similar (Figure 14). Therefore, the only explanation is that applied nitrogen fertilization increases the surface of cherry leaves and does not increase their thickness. The more so because a similar relationship has already been found in research related to soil and foliar fertilization of almond trees [29]. Similar results were also obtained when conducting research on a tropical species with edible fruits Dimocarpus longan, where also an increased dose of nitrogen caused the growth of the leaf blade and fresh and dry leaf mass, but had no effect on SLA [30]. Only apple trees reacted to an increase in specific weight of leaves under the influence of fertilization, although no differences between nitrogen doses were found. The increase in SLW (specific leaf weight – mg/cm2) was attributed to a change in leaf morphology or an increase in soluble sugars or starch [74].
Fruit trees are perennial plants, and the effect of fertilization applied in the current year may be visible in the following or subsequent years. Sour cherry cultivar 'Łutówka' belongs to the cherry cultivars that bear fruit on last year's shoots. Their number and length will have a significant impact on the amount and size of the crop in the following year. An important factor is also the use of appropriate tree cutting, which must stimulate the tree to produce new growths, and at the same time the intensity of cutting should not be too high to limit the number of fruiting shoots. Therefore, appropriate nitrogen fertilization allows you to maintain a balance between the growth and yielding of such fruiting trees. It is also necessary to take into account tree spacing, which in intensive cherry orchards is much smaller than in old orchards, where the spacing between rows was at least 4.5 m and in a row 3 m. Such a spacing allowed the formation of trees with a larger crown, but with such a spacing the yield per unit area is much lower than from intensive orchards. The crown in intensive orchards has the shape of a spindle, and, moreover, for mechanical harvesting, and such a crown is better due to the high cost of labour, smaller sizes is better [75].
Increasing fertilization, apart from affecting the growth of trees, causes a change in quality parameters such as colouring. Sour cherries are primarily used for processing, where colour, size, extract content and acidity are crucial [58,76]. Trees which, as a result of poor nitrogen nutrition and improper cutting, have too few growths will have a low yield and at the same time will become unprofitable. That is why proper nitrogen fertilization, which is responsible for the vegetative growth of trees, is so important.
3.5. Pigment content in leaves
The applied nitrogen fertilization did not have a significant effect on the content of chlorophyll pigment in the leaves (Figure 15). Regardless of the use of nitrogen fertilization, the content of chlorophyll like carotenoids was at a similar level. However, it should be emphasized that the content of chlorophyll a was higher at the highest dose of nitrogen. Also, the chlorophyll b content was higher when nitrogen fertilization was applied to 60 kg N ha–1 and 120 kg N ha–1. Carotenoid levels also increased under nitrogen fertilization, but the differences between the combinations were not significant. Similar results were obtained using nitrogen fertilization in apple trees, where the dose of 80 kg N ha–1 and 250 kg N ha–1 caused an increase in chlorophyll content, but only the chlorophyll a content changed during the growing season. The increase occurred until mid-July, and then the content decreased. In contrast, the content of chlorophyll b and carotenoids did not change during the growing season. N fertilization resulted in a much higher content of photosynthetic pigments in the late season, it can be assumed that the application of N contributed to delayed leaf aging. The highest values were always recorded at the highest dose of nitrogen fertilization [66]. Nitrogen is needed to build chlorophyll and its presence affects its production. Of the more than 130 atoms that build chlorophyll, only 4 are nitrogen forming a porphyrin ring. Nitrogen deficiency is most pronounced because it inhibits the formation and development of chloroplasts. Chlorophyll synthesis is inhibited and the a/b ratio of chlorophylls is lower. The synthesis of carotenoids is also inhibited, which is correlated with the synthesis of chlorophylls [77]. Research conducted in apple trees confirms that the increase in nitrogen fertilization increased the amount of chlorophyll a and b. However, the difference in total chlorophyll (chlorophyll a+b) between fertilisation of 50 kg N ha - 1 and 100 kg N ha–1 was negligible [78]. A similar effect was found in another study, with the effect being more pronounced when high nitrogen levels (250 kg N ha–1) were applied at the end of the season [66]. Increasing the chlorophyll content can be achieved by foliar use of substances containing nutrients together with 5-aminolevulinic acid (ALA), which is a key precursor in the biosynthesis of porphyrins such as chlorophyll. In treated plants, ALA increases the accumulation of several chlorophyll intermediates, such as protochlorophyllide and protoporphyrin IX [79,80,81].
With the age of the orchard, the level of pigments in the leaves increased. Long-term studies conducted on apple trees have given different results. The highest values were found in the first 6 years of intensive growth, and in subsequent periods the overall level of chlorophyll decreased [82]. Studies of the amount of pigments contained in the assimilation apparatus of Scots pine (Pinus silvestris L) showed a clear increase in their content with the age of the needles and a decrease with increasing age of trees [83]. However, this trend was in chlorophyll pigments a and b until 2012. In 2013, the content of chlorophyll a and chlorophyll b was significantly lower (Figure 16). These results can be explained by lack of sufficient water, which causes a decrease in chlorophyll content, a violation of enzyme balance, and a significant decrease in nitrate reductase activity [84]. In conditions of greater moisture of cells, the photosynthetic apparatus of the leaf is "diluted" [85]. Analysing the course of the climatic conditions in the period prior to the analysis of chlorophyll content, a significant relationship was found between the amount of precipitation in July and the content of chlorophyll (Figure 17). Studies of tree species showed that the leaves of irrigated trees had a lower content of total chlorophyll compared to leaves taken from non-irrigated trees [86]. A similar trend of increasing content in subsequent years of research was found in carotenoids, but there was no decrease in carotenoid content in 2013 and no correlation with precipitation in the period prior to sampling. In studies conducted on cherry and plum leaves, a higher concentration of the pigment tested was noted during the harvest period, regardless of the level of irrigation and fertilization [86]. This phenomenon can be explained by the enormous mobility of chlorophyll pigments. The plant, wanting to preserve these pigments during fruit ripening in the period preceding harvest, withdraws pigments to leaves, while in autumn, during the period of yellowing of the leaves, the pigments are withdrawn to the permanent tree [87] The decrease in chlorophyll content may be associated with lower yields in 2013 [58], accompanied by a lower photosynthesis intensity and chlorophyll content [77]. An additional factor that affects the chlorophyll content is tree cutting. Both the timing of the cut and the intensity affect the chlorophyll content. In the experiment carried out after the high tree yield in 2012, moderate summer pruning was applied, which could have affected the pigment content of pigments in the leaves. This is confirmed by studies where the pruning of peaches in summer caused a decrease in chlorophyll a and b content, while the use of pruning in winter increased the chlorophyll content [86]. In another experiment, cutting mango trees resulted in the highest chlorophyll content. While light pruning had no effect on the overall pigment content [89].
5. Conclusions
The nitrogen fertilization at the beginning of the growing season had an impact on the content of ammoniacal and nitrate nitrogen in the soil. The nitrogen content is influenced by the course of the weather, but above all by the uptake by trees. These changes are in a sense a reflection of the fertilizer needs of the studied species. The content of N60 and N120 increased the content of ammonium and nitrate forms. However, there was no significant difference between the control (N0) and N60 for the ammonium form of nitrogen. Nitrate nitrogen increased with the applied dose regardless of the sampling level, but only in the subarable layer were the differences between the combinations significant. Probably the use of N60 covered the fertilizer needs of cherry trees. Only the increase in the dose of N120 significantly increased the nitrogen content in the soil.
Nitrogen fertilization applied at the beginning of the growing season does not affect the content of nitrogen nitrate and ammonium in the soil. The highest nitrogen content in the soil was found in the first sampling period at the beginning of vegetation, when ammonium nitrate was fertilized. During this time, trees benefit from nitrogen that was accumulated in the tissues of the tree after being taken in the previous season. Nitrogen uptake begins a few weeks after the start of vegetation, when the soil temperature rises to 8–12°C. The ammonium form content decreased on subsequent sampling dates. A similar trend was observed for the nitrate form in the topsoil layer, while in the subarable layer the nitrate nitrogen content varied depending on the timing of the samples. An important factor that influenced the content was the course of climatic conditions, such as precipitation and temperature.
The age of the orchard had no significant effect on the nitrogen content of the soil. Although the lowest values were found in the youngest orchard (OR3). Only the ammonium form in the subarable area was highest in the OR2 orchard.
Regardless of the nitrogen form, the content was higher in the arable layer of the soil, but only for the ammonium form, the difference in content was significant.
High nitrogen fertilization increased the content of phosphorus and potassium and decreased the magnesium content in the topsoil layer, resulting in an increase in the K/Mg ratio. The nitrogen fertilization slightly reduced the pH of the soil in the upper soil layer, but the differences were insignificant. Similar changes were observed in the sublayer for phosphorus and magnesium, while the K level was significantly lower with N60 fertilization and no significant differences were found between the control combination and the highest dose of nitrogen fertilization. The pH of the soil was higher with nitrogen fertilization, but the differences were not significant.
The nitrogen content in the leaves increased with increasing doses of nitrogen fertilization. The content of phosphorus and potassium decreased with increasing nitrogen fertilization. However, the highest magnesium and calcium content was when fertilizing N60 and increasing the dose to N120 reduced its content, which can be explained by stronger vegetative growth and the effect of dilution of ingredients.
The use of nitrogen fertilization increased the vegetative growth of trees measured by leaf area, trunk cross-sectional area and its growth during the research period. However, SLA (cm2/g) did not differ significantly between combinations, because the thickness of the leaves in the control and fertilized ammonium nitrate combinations was the same, regardless of the dose used.
The chlorophyll content was not dependent on the amount of nitrogen fertilization. However, it should be emphasized that the overall chlorophyll content in the leaves was higher with nitrogen fertilization. The course of the climatic conditions, especially precipitation, which caused their growth, had a greater impact on the chlorophyll content. Not without significance is also the intensity of yielding and cutting trees in this cherry variety, which bears fruit on annual shoots and the cutting is carried out in the summer after fruit harvest.
Author Contributions
Conceptualization, K.R. methodology, K.R.; software, K.R.; validation, K.R., G.P.Ł.; investigation, K.R.; resources, K.R. and G.P.Ł.; data curation, K.R.; writing—original draft preparation, K.R. and G.P.Ł.; writing—review and editing, K.R. and G.P.Ł.; visualization, K.R.; supervision, K.R.; project administration, K.R.; funding acquisition, K.R. All authors have read and agreed to the published version of the manuscript.
Funding
The publication was co-financed within the framework of the “Regional Initiative Excellence” program implemented at the initiative of the Polish Ministry of Science and Higher Education in 2019–2023 (No. 005/RID/2018/19)”, financing amount: PLN 12,000,000.
Institutional Review Board Statement
Not applicable.
Data Availability Statement
Not applicable.
Conflicts of Interest
The authors declare no conflict of interest.
References
- Zhao, J.; Dong, Y.; Xie, X.; Li, X.; Zhang, X.; Shen, X. Effect of Annual Variation in Soil PH on Available Soil Nutrients in Pear Orchards. Acta Ecol. Sin. 2011, 31, 212–216. [Google Scholar] [CrossRef]
- Ben Mimoun, M.; Marchand, M. Effects of Potassium Foliar Fertilization on Different Fruit Tree Crops over Five Years of Experiments. Acta Hortic. 2013, 211–217. [Google Scholar] [CrossRef]
- Carranca, C.; Brunetto, G.; Tagliavini, M. Nitrogen Nutrition of Fruit Trees to Reconcile Productivity and Environmental Concerns. Plants 2018, 7, 4. [Google Scholar] [CrossRef] [PubMed]
- Ventura, M.; Scandellari, F.; Bonora, E.; Tagliavini, M. Nutrient Release during Decomposition of Leaf Litter in a Peach (Prunus Persica L.) Orchard. Nutr. Cycl. Agroecosystems 2010, 87, 115–125. [Google Scholar] [CrossRef]
- Testolin, R.; Ferguson, A.R. Kiwifruit (Actinidia Spp.) Production and Marketing in Italy. N. Z. J. Crop Hortic. Sci. 2009, 37, 1–32. [Google Scholar] [CrossRef]
- Pietrzak, M.; Chlebicka, A.; Kraciński, P.; Malak-Rawlikowska, A. Information Asymmetry as a Barrier in Upgrading the Position of Local Producers in the Global Value Chain—Evidence from the Apple Sector in Poland. Sustainability 2020, 12, 7857. [Google Scholar] [CrossRef]
- Gaworski, M.; Ciesielski, W.; Kaminska, N. Effect of Modern Apple Production Technologies on Development of Family Orchard Farming with Particular Focus on Polish Conditions. Eng Rural Dev 2017, 24, 408–414. [Google Scholar]
- Wrona, D. Effect of Nitrogen Fertilization on Growth, Cropping and Fruit Quality of ‘Šampion’Apple Trees during 9 Years after Planting. Folia Hortic 2004, 16, 55–60. [Google Scholar]
- Olszak, R. Methodology of Integrated Cherry Protection (in Polish), 4th ed.; Main Inspector of Plant Health and Seed Inspection: Warsaw, 2020. [Google Scholar]
- Huett, D.O. Prospects for Manipulating the Vegetative-Reproductive Balance in Horticultural Crops through Nitrogen Nutrition: A Review. Aust. J. Agric. Res. 1996, 47, 47–66. [Google Scholar] [CrossRef]
- Lysiak, P.G.; Pacholak, E. Effects of 13 Years Soil Fertilisation on Storage Quality of ‘Cortland’ Apples. Acta Hortic. 1999, 485, 265–272. [Google Scholar] [CrossRef]
- Kurlus, R.; Rutkowski, K.; Łysiak, G.P. Improving of Cherry Fruit Quality and Bearing Regularity by Chemical Thinning with Fertilizer. Agronomy 2020, 10, 1281. [Google Scholar] [CrossRef]
- Rutkowski, K.; Zydlik, Z.; Pacholak, E. Effect of Tree Pruning Intensity on the Yield and Fruit Quality of the Sour Cherry. Zemdirb.-Agric. 2015, 102, 417–422. [Google Scholar] [CrossRef]
- Ju, X.; Zhang, C. Nitrogen Cycling and Environmental Impacts in Upland Agricultural Soils in North China: A Review. J. Integr. Agric. 2017, 16, 2848–2862. [Google Scholar] [CrossRef]
- Lu, Y.; Kang, T.; Gao, J.; Chen, Z.; Zhou, J. Reducing Nitrogen Fertilization of Intensive Kiwifruit Orchards Decreases Nitrate Accumulation in Soil without Compromising Crop Production. J. Integr. Agric. 2018, 17, 1421–1431. [Google Scholar] [CrossRef]
- Raza, M.; Lee, J.-Y. Factors Affecting Spatial Pattern of Groundwater Hydrochemical Variables and Nitrate in Agricultural Region of Korea. Episodes J. Int. Geosci. 2019, 42, 135–148. [Google Scholar] [CrossRef]
- Cui, M.; Zeng, L.; Qin, W.; Feng, J. Measures for Reducing Nitrate Leaching in Orchards:A Review. Environ. Pollut. 2020, 263, 114553. [Google Scholar] [CrossRef] [PubMed]
- Wójcik, P. Nawozy i Nawożenie Drzew Owocowych. 2009; ISBN 83-89211-88-2. [Google Scholar]
- Jankiewicz, L.; Lipecki, J. Fizjologia Roslin Sadowniczych; Państwowe Wydawn. Nauk, 2011; Volume 1, ISBN 978-83-01-16685-4. [Google Scholar]
- Lin, Z.; YuanMao, J.; FuTian, P.; Xu, Z.; XiangJi, F.; HongBo, L. Studies on utilization and accumulation dynamics of spring soil 15N-urea application in apple orchard. Acta Hortic. Sin. 2009, 36, 1805–1809. [Google Scholar]
- Grassi, G.; Millard, P.; Gioacchini, P.; Tagliavini, M. Recycling of Nitrogen in the Xylem of Prunus Avium Trees Starts When Spring Remobilization of Internal Reserves Declines. Tree Physiol. 2003, 23, 1061–1068. [Google Scholar] [CrossRef] [PubMed]
- Tromp, J. Nutrient Reserves in Roots of Fruit Trees, in Particular Carbohydrates and Nitrogen. Plant Soil 1983, 71, 401–413. [Google Scholar] [CrossRef]
- Neto, C.; Carranca, C.; Clemente, J. Senescent Leaf Decomposition in a Mediterranean Pear Orchard. Eur. J. Agron. 2009, 30, 34–40. [Google Scholar] [CrossRef]
- Tagliavini, M.; Tonon, G.; Scandellari, F.; Quiñones, A.; Palmieri, S.; Menarbin, G.; Gioacchini, P.; Masia, A. Nutrient Recycling during the Decomposition of Apple Leaves (Malus Domestica) and Mowed Grasses in an Orchard. Agric. Ecosyst. Environ. 2007, 118, 191–200. [Google Scholar] [CrossRef]
- Kozieł, M.; Gałązka, A.; Martyniuk, S. Wolnożyjące Bakterie Wiążące Azot Atmosferyczny z Rodzaju Azotobacter–Występowanie, Liczebność i Znaczenie. Stud. Rap. IUNG-PIB 2018, 56, 57–70. [Google Scholar] [CrossRef]
- Rutkowski, K.; Łysiak, G.P.; Zydlik, Z. Effect of Nitrogen Fertilization in the Sour Cherry Orchard on Soil Enzymatic Activities, Microbial Population, and Fruit Quality. Agriculture 2022, 12, 2069. [Google Scholar] [CrossRef]
- Kozieł, M.; Martyniuk, S.; Siebielec, G. Occurrence of Azotobacter Spp. in Cultivated Soils in Poland. Pol. J. Agron. 2021, 44, 3–8. [Google Scholar] [CrossRef]
- Krol, M.J. Azospirillum - bakterie asocjacyjne w zrownowazonym rolnictwie. Folia Univ. Agric. Stetin. Agric. 1999, 78, 93–102. [Google Scholar]
- Saa, S.; Fernández, E.; Muhammad, S.; Río, A.O.-D.; DeJong, T.M.; Laca, E.; Brown, P. Increases in Leaf Nitrogen Concentration and Leaf Area Did Not Enhance Spur Survival and Return Bloom in Almonds (Prunus Dulcis [Mill.] DA Webb). Acta Physiol. Plant. 2017, 39, 1–10. [Google Scholar] [CrossRef]
- Khaosumain, Y.; Sritontip, C.; Changjeraja, S. Effects of Different Nitrogen Fertilization Doses on Growth, Leaf Nutrient Concentration, Flowering and Fruit Quality in off-Season Longan. Acta Hortic. 2013, 984, 271–274. [Google Scholar] [CrossRef]
- Sete, P.B.; Comin, J.J.; Nara Ciotta, M.; Almeida Salume, J.; Thewes, F.; Brackmann, A.; Toselli, M.; Nava, G.; Rozane, D.E.; Loss, A.; et al. Nitrogen Fertilization Affects Yield and Fruit Quality in Pear. Sci. Hortic. 2019, 258, 108782. [Google Scholar] [CrossRef]
- Rosati, A.; Paoletti, A.; Al Hariri, R.; Famiani, F. Fruit Production and Branching Density Affect Shoot and Whole-Tree Wood to Leaf Biomass Ratio in Olive. Tree Physiol. 2018, 38, 1278–1285. [Google Scholar] [CrossRef] [PubMed]
- Pierce, L.L.; Running, S.W.; Walker, J. Regional-Scale Relationships of Leaf Area Index to Specific Leaf Area and Leaf Nitrogen Content. Ecol. Appl. 1994, 4, 313–321. [Google Scholar] [CrossRef]
- Tromp, J.; Ovaa, J.C. Uptake and Distribution of Nitrogen in Young Apple Trees after Application of Nitrate or Ammonium, with Special Reference to Asparagine and Arginine. Physiol. Plant. 1979, 45, 23–28. [Google Scholar] [CrossRef]
- Rupp, D. NITROGEN FERTILIZATION IN APPLE ORCHARDS - RELATIONSHIPS BETWEEN AVAILABLE NITROGEN IN SOIL SAMPLES, NITRATES IN SOIL WATER AND LEACHING OF NITROGEN. Acta Hortic. 1995, 401–410. [Google Scholar] [CrossRef]
- Zipori, I.; Erel, R.; Yermiyahu, U.; Ben-Gal, A.; Dag, A. Sustainable Management of Olive Orchard Nutrition: A Review. Agriculture 2020, 10, 11. [Google Scholar] [CrossRef]
- Wojcik, P. Ecological Impact of Nitrogen Fertilization. J. Fruit Ornam. Plant Res. 2001, 09. [Google Scholar]
- Tagliavini, M.; Scudellazi, D.; Marangoni, B.; Toselli, M. Nitrogen Fertilization Management in Orchards to Reconcile Productivity and Environmental Aspects. In Fertilizers and Environment: Proceedings of the International Symposium “Fertilizers and Environment”, held in Salamanca, Spain, 26–29, September, 1994; Rodriguez-Barrueco, C., Ed.; Developments in Plant and Soil Sciences; Springer Netherlands: Dordrecht, 1996; pp. 161–170. ISBN 978-94-009-1586-2. [Google Scholar]
- Moreno, M.A.; Adrada, R.; Aparicio, J.; BetráN, S. Performance of ‘Sunburst’ Sweet Cherry Grafted on Different Rootstocks. J. Hortic. Sci. Biotechnol. 2001, 76, 167–173. [Google Scholar] [CrossRef]
- Küçükyumuk, C.; Yildiz, H.; Küçükyumuk, Z.; Ünlükara, A. Responses of “0900 Ziraat” Sweet Cherry Variety Grafted on Different Rootstocks to Salt Stress. Not. Bot. Horti Agrobot. Cluj-Napoca 2015, 43, 214–221. [Google Scholar] [CrossRef]
- Viljevac, M.; Dugalić, K.; Mihaljević, I.; Šimić, D.; Sudar, R.; Jurković, Z.; Lepeduš, H. Chlorophyll Content, Photosynthetic Efficiency and Genetic Markers in Two Sour Cherry (Prunus Cerasus L.) Genotypes under Drought Stress. Acta Bot. Croat. 2013, 72, 221–235. [Google Scholar] [CrossRef]
- Wojdyło, A.; Nowicka, P.; Tkacz, K.; Turkiewicz, I.P. Fruit Tree Leaves as Unconventional and Valuable Source of Chlorophyll and Carotenoid Compounds Determined by Liquid Chromatography-Photodiode-Quadrupole/Time of Flight-Electrospray Ionization-Mass Spectrometry (LC-PDA-QTof-ESI-MS). Food Chem. 2021, 349, 129156. [Google Scholar] [CrossRef]
- Bondarenko, P. Physiological Basics of Sweet Cherry Productivity Depending on Rootstocks, Interstems and Plant Density. Open Agric. 2019, 4, 267–274. [Google Scholar] [CrossRef]
- Flore, J.; Layne, D.R. Photoassimilate Production and Distribution in Cherry. HortScience 1999, 34, 1015–1019. [Google Scholar] [CrossRef]
- Pacholak, E.; Zydlik, Z.; Rutkowski, K. Effect of Cherry Nitrogen Fertilization on the Content of Minerals in the Leaves and Soil. Acta Sci. Pol. Hortorum Cultus 2011, 10, 105–112. [Google Scholar]
- Page, A.L.; Miller, R.H.; Keeney, D.R. Methods of Soil Analysis. Part 2, Chemical and Microbiological Properties, Agronomy, 2nd ed.; Agronomy; 2nd ed.; American Society of Agronomy : Soil Science Society of America, 1982; ISBN 978-0-89118-072-2. [Google Scholar]
- Sadowski, A.; Nurzyński, J.; Pacholak, E.; Smolarz, K. Określenie Potrzeb Nawożenia Roślin Sadowniczych II. Zasady, Liczby Graniczne i Dawki Nawożenia. Instr. Upowsz. Nr 3, 1990. [Google Scholar]
- Kowalczyk, W.; Wrona, D.; Przybyłko, S. Effect of Nitrogen Fertilization of Apple Orchard on Soil Mineral 2 Nitrogen Content, Yielding of the Apple Trees and Nutritional Sta-3 Tus of Leaves and Fruits. Agriculture 2022. [Google Scholar] [CrossRef]
- Kowalczyk, W.; Wrona, D.; Przybyłko, S. Effect of Nitrogen Fertilization of Apple Orchard on Soil Mineral Nitrogen Content, Yielding of the Apple Trees and Nutritional Status of Leaves and Fruits. Agriculture 2022, 12, 1–17. [Google Scholar] [CrossRef]
- Komosa, A. Changes in Some Chemical Properties of the Soil under Grass Sward and Herbicide Strips in Apple Orchards. Acta Hortic. 1990, 223–230. [Google Scholar] [CrossRef]
- Engel, A.; Blanke, M.; Lenz, F. Wie viele Nährstoffe werden mit dem Mulchen der Fahrgassen in den Baumstreifen einer Obstanlage verfrachtet? Erwerbs-Obstbau 2009, 51, 151–161. [Google Scholar] [CrossRef]
- Wrona, D. The Influence of Nitrogen Fertilization on Growth, Yield and Fruit Size of’Jonagored’apple Trees. Acta Sci. Pol.-Hortorum Cultus 2011, 10, 3–10. [Google Scholar]
- Gałązka, A.; Bigos, J.; Siebielec, S. Promowanie Wzrostu Roślin Przez Bakterie z Rodzaju Azospirillum Oraz Ich Zastosowanie w Rolnictwie (Plant Growth Promotion by Bacteria of the Genus Azospirillum and Their Application in Agriculture). Pol. J. Agron. 2015, 23, 48–62. [Google Scholar]
- Neilsen, D.; Neilsen, G.H. Efficient Use of Nitrogen and Water in High-Density Apple Orchards. HortTechnology 2002, 12, 19–25. [Google Scholar] [CrossRef]
- Sobiczewski, P. Methodology of Integrated Protection of Apple Trees (Polish); 6th ed.; Main Inspector of Plant Health and Seed Inspection: Warsaw, 2020. [Google Scholar]
- Paltineanu, C.; Iancu, M. Orchard Groundcover Management Effects on Nitrate Leaching in an Irrigated Heavy-Clay Soil. Acta Hortic. 1997, 739–755. [Google Scholar] [CrossRef]
- Dong, S.; Scagel, C.F.; Cheng, L.; Fuchigami, L.H.; Rygiewicz, P.T. Soil Temperature and Plant Growth Stage Influence Nitrogen Uptake and Amino Acid Concentration of Apple during Early Spring Growth. Tree Physiol. 2001, 21, 541–547. [Google Scholar] [CrossRef] [PubMed]
- Rutkowski, K.; Łysiak, G.P. Weather Conditions, Orchard Age and Nitrogen Fertilization Influences Yield and Quality of ‘Łutówka’ Sour Cherry Fruit. Agriculture 2022, 12, 2008. [Google Scholar] [CrossRef]
- Haque, M.A.; Sakimin, S.Z. Planting Arrangement and Effects of Planting Density on Tropical Fruit Crops—A Review. Horticulturae 2022, 8, 485. [Google Scholar] [CrossRef]
- Cakmak, D.; Saljnikov, E.; Perovic, V.; Jaramaz, D.; Mrvic, V. Effect of Long-Term Nitrogen Fertilization on Main Soil Chemical Properties in Cambisol. In Proceedings of the In Soil solutions for changing world. In Proceedings of the 19th World congress of soil science, Brisbane, Australia, 1 August 2010; pp. 291–293. [Google Scholar]
- Mengel, K.; Kirkby, E.A. Principles of Plant Nutrition; Springer Science & Business Media, 2012; ISBN 978-94-010-1009-2. [Google Scholar]
- Smiley, R.W. Rhizosphere PH as Influenced by Plants, Soils, and Nitrogen Fertilizers. Soil Sci. Soc. Am. J. 1974, 38, 795–799. [Google Scholar] [CrossRef]
- Kirkby, E.A.; Mengel, K. Ionic Balance in Different Tissues of the Tomato Plant in Relation to Nitrate, Urea, or Ammonium Nutrition. Plant Physiol. 1967, 42, 6–14. [Google Scholar] [CrossRef] [PubMed]
- Sadowski, A.; Jadczuk, E. Effects of Nitrogen Fertilisation in a Sour Cherry Orchard. Acta Hortic. 1997, 475–480. [Google Scholar] [CrossRef]
- Vang-Petersen, O. Fertilizing Sour Cherry {Prunus Cerasus L. Cv. Stevnsbær) with N, P, and K. Tidsskr. Planteavl 1977, 81, 346–350. [Google Scholar]
- Prsa, I.; Stampar, F.; Vodnik, D.; Veberic, R. Influence of Nitrogen on Leaf Chlorophyll Content and Photosynthesis of ‘Golden Delicious’ Apple. Acta Agric. Scand. Sect. B - Plant Soil Sci. 2007, 57, 283–289. [Google Scholar] [CrossRef]
- Rutkowski, K.; Zydlik, Z.; Stachowiak, A. Effect of Tree Pruning Intensity on the Content of Mineral Components in the Sour Cherry Leaves of ‘Łutówka. ’ Folia Hortic. 2018, 30, 47–55. [Google Scholar] [CrossRef]
- Kurlus, R.; Łysiak, G. Rootstock Effect on Mineral Composition in Jonagored Apple Leaves; 2000; pp. 68–71. [Google Scholar]
- Fallahi, E.; Mohan, S.K. Influence of Nitrogen and Rootstock on Tree Growth, Precocity, Fruit Quality, Leaf Mineral Nutrients, and Fire Blight in `Scarlet Gala’ Apple. HortTechnology 2000, 10, 589–592. [Google Scholar] [CrossRef]
- Pacholak, E.; Zachwieja, M.; Zydlik, Z. Effect of Nitrogen Fertilization on the Content of Mineral Components in Soil, Leaves and Fruits of’Sampion’apple Trees. Acta Sci. Pol. Hortorum Cultus 2004, 2. [Google Scholar]
- Mészáros, M.; Hnátková, H.; Čonka, P.; Náměstek, J. Linking Mineral Nutrition and Fruit Quality to Growth Intensity and Crop Load in Apple. Agronomy 2021, 11, 506. [Google Scholar] [CrossRef]
- Samuolienė, G.; Viškelienė, A.; Sirtautas, R.; Kviklys, D. Relationships between Apple Tree Rootstock, Crop-Load, Plant Nutritional Status and Yield. Sci. Hortic. 2016, 211, 167–173. [Google Scholar] [CrossRef]
- Weinbaum, S.A.; Niederholzer, F.J.A.; Ponchner, S.; Rosecrance, R.C.; Carlson, R.M.; Whittlesey, A.C.; Muraoka, T.T. Nutrient Uptake by Cropping and Defruited Field-Grown `French’ Prune Trees. J. Am. Soc. Hortic. Sci. 1994, 119, 925–930. [Google Scholar] [CrossRef]
- Campbell, R.J.; Marini, R.P. Nitrogen Fertilization Influences the Physiology of Apple Leaves Subjected to European Red Mite Feeding. J. Am. Soc. Hortic. Sci. 1990, 115, 89–93. [Google Scholar] [CrossRef]
- Mika, A.; Wawrzyńczak, P.; Buler, Z.; Krawiec, A.; Białkowski, P.; Michalska, B.; Plaskota, M.; Gotowicki, B. Results of Experiments with Densely-Planted Sour Cherry Trees for Harvesting with a Continuously Moving Combine Harvester. J. Fruit Ornam. Plant Res. 2011, 19, 31–40. [Google Scholar]
- Grafe, C.; Schuster, M. Physicochemical Characterization of Fruit Quality Traits in a German Sour Cherry Collection. Sci. Hortic. 2014, 180, 24–31. [Google Scholar] [CrossRef]
- Pallardy, C.; Schuster, S.G. Physiology Woody Plants, 3rd ed.; Academic Press is an imprint of Elsevier, 2008. [Google Scholar]
- Uysal, E. Effects of Nitrogen Fertilization on the Chlorophyll Content of Apple. Meyve Bilimi 2018, 5, 12–17. [Google Scholar]
- Kurlus, R.; Lysiak, G. Fertilizer Containing 5-Aminolevulinic Acid Affects Sour Cherry Fruit Quality and Biological Characteristics. Acta Hortic. 2014, 323–329. [Google Scholar] [CrossRef]
- Memon, S.A.; Hou, X.; Wang, L.; Li, Y. Promotive Effect of 5-Aminolevulinic Acid on Chlorophyll, Antioxidative Enzymes and Photosynthesis of Pakchoi (Brassica Campestris Ssp.Chinensis Var. Communis Tsen et Lee). Acta Physiol. Plant. 2008, 31, 51. [Google Scholar] [CrossRef]
- Hotta, Y.; Tanaka, T.; Takaoka, H.; Takeuchi, Y.; Konnai, M. New Physiological Effects of 5-Aminolevulinic Acid in Plants: The Increase of Photosynthesis, Chlorophyll Content, and Plant Growth. Biosci. Biotechnol. Biochem. 1997, 61, 2025–2028. [Google Scholar] [CrossRef]
- Yakovenko, R.; Kopytko, P.; Pelekhatyi, V. The Content Of Chlorophyll And Nutrients In Apple Leaves Depending On Long-Term Fertiliser. Sci. Horiz. 2021, 24, 93–98. [Google Scholar] [CrossRef]
- Wężyk, P.; Wertz, B.; Waloszek, A. Skaner hiperspektralny aisa (airborne imaging spectrometer for applications) jako narzędzie pozyskiwania informacji o ekosystemie leśnym (hiperspectral scanner aisa (airborne imaging spectrometer for applications) – tool for forest ecosystem data gathering). Arch. Fotogram. Kartogr. Teledetekcji 2003, 13b, 485–496. [Google Scholar]
- Bandurska, H. Akumulacja wolnej proliny jako przejaw metabolicznej reakcji roślin na działanie stresu wodnego. Wiad. Bot. 1991, 35. [Google Scholar]
- Olszewska, M. Reakcja Wybranych Odmian Kostrzewy Lakowej i Tymotki Lakowej Na Stres Wodny. Acta Sci. Pol. Agric. 2003, 2, 141–148. [Google Scholar]
- Jaroszewska, A. Zawartość Barwników Asymilacyjnych w Liściach Drzew Pestkowych w Zależności Od Nawadniania i Nawożenia. Infrastruktura Ekol. Teren. Wiej. 2011, 155–164. [Google Scholar]
- Łysiak, G.; Kurlus, R.; Zydlik, Z.; Walkowiak-Tomczak, D. Apple Skin Colour Changes during Harvest as an Indicator of Maturity. Acta Sci. Pol. - Hortorum Cultus 2014, 13, 71–83. [Google Scholar]
- Demirtas, N.M.; Bolat, I.; Ercisli, S.; Ikinci, A.; Olmez, H.; Sahin, M.; Altindag, M.; Celik, B. The Effects of Different Pruning Treatments on Seasonal Variation of Carbohydrates in Hacihaliloglu Apricot Cultivar. Not. Bot. Horti Agrobot. Cluj-Napoca 2010, 38, 223–227. [Google Scholar] [CrossRef]
- Sanjay, K.S.; Sanjay, K.S.; Ram, R.S. Effects of Pruning Intensity on the Biochemical Status of Shoot Buds in Three Mango (Mangifera Indica L.) Cultivars Planted at High Density. J. Hortic. Sci. Biotechnol. 2010, 85, 483–490. [Google Scholar] [CrossRef]
Figure 1.
Precipitation per month in 2008-2013.
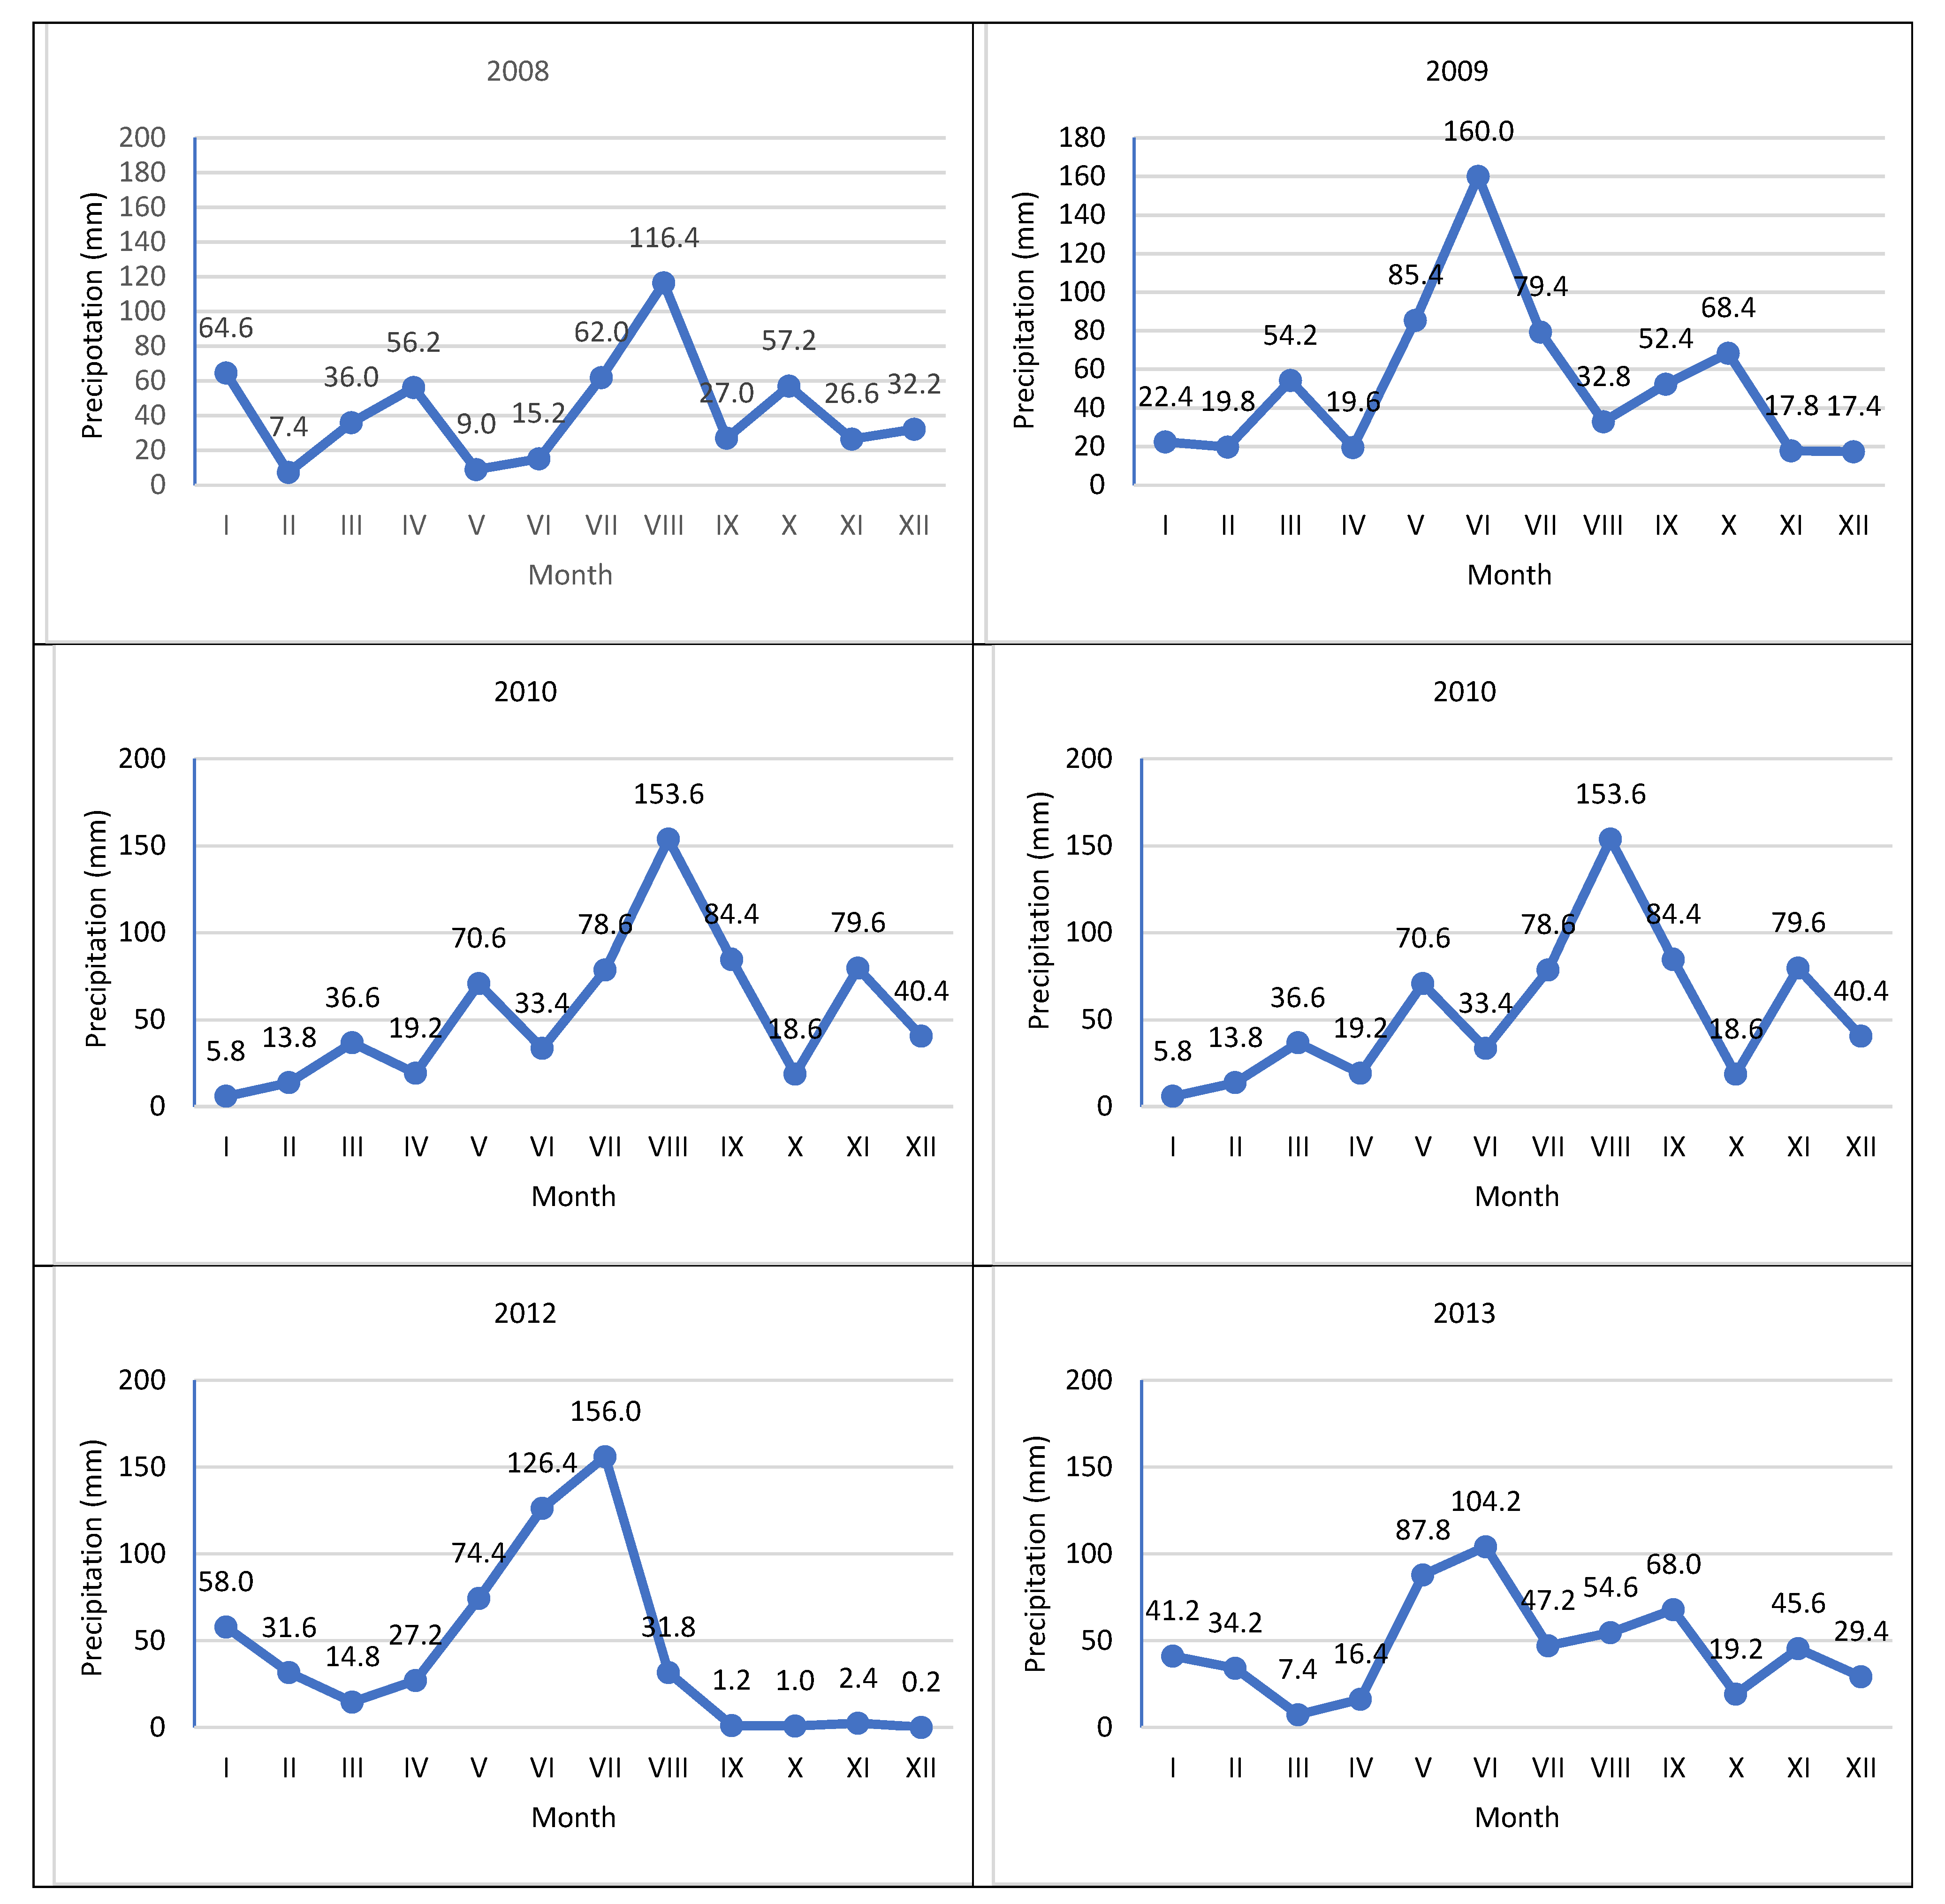
Figure 2.
Average, actual minimum and maximum temperatures in 2008-2013.
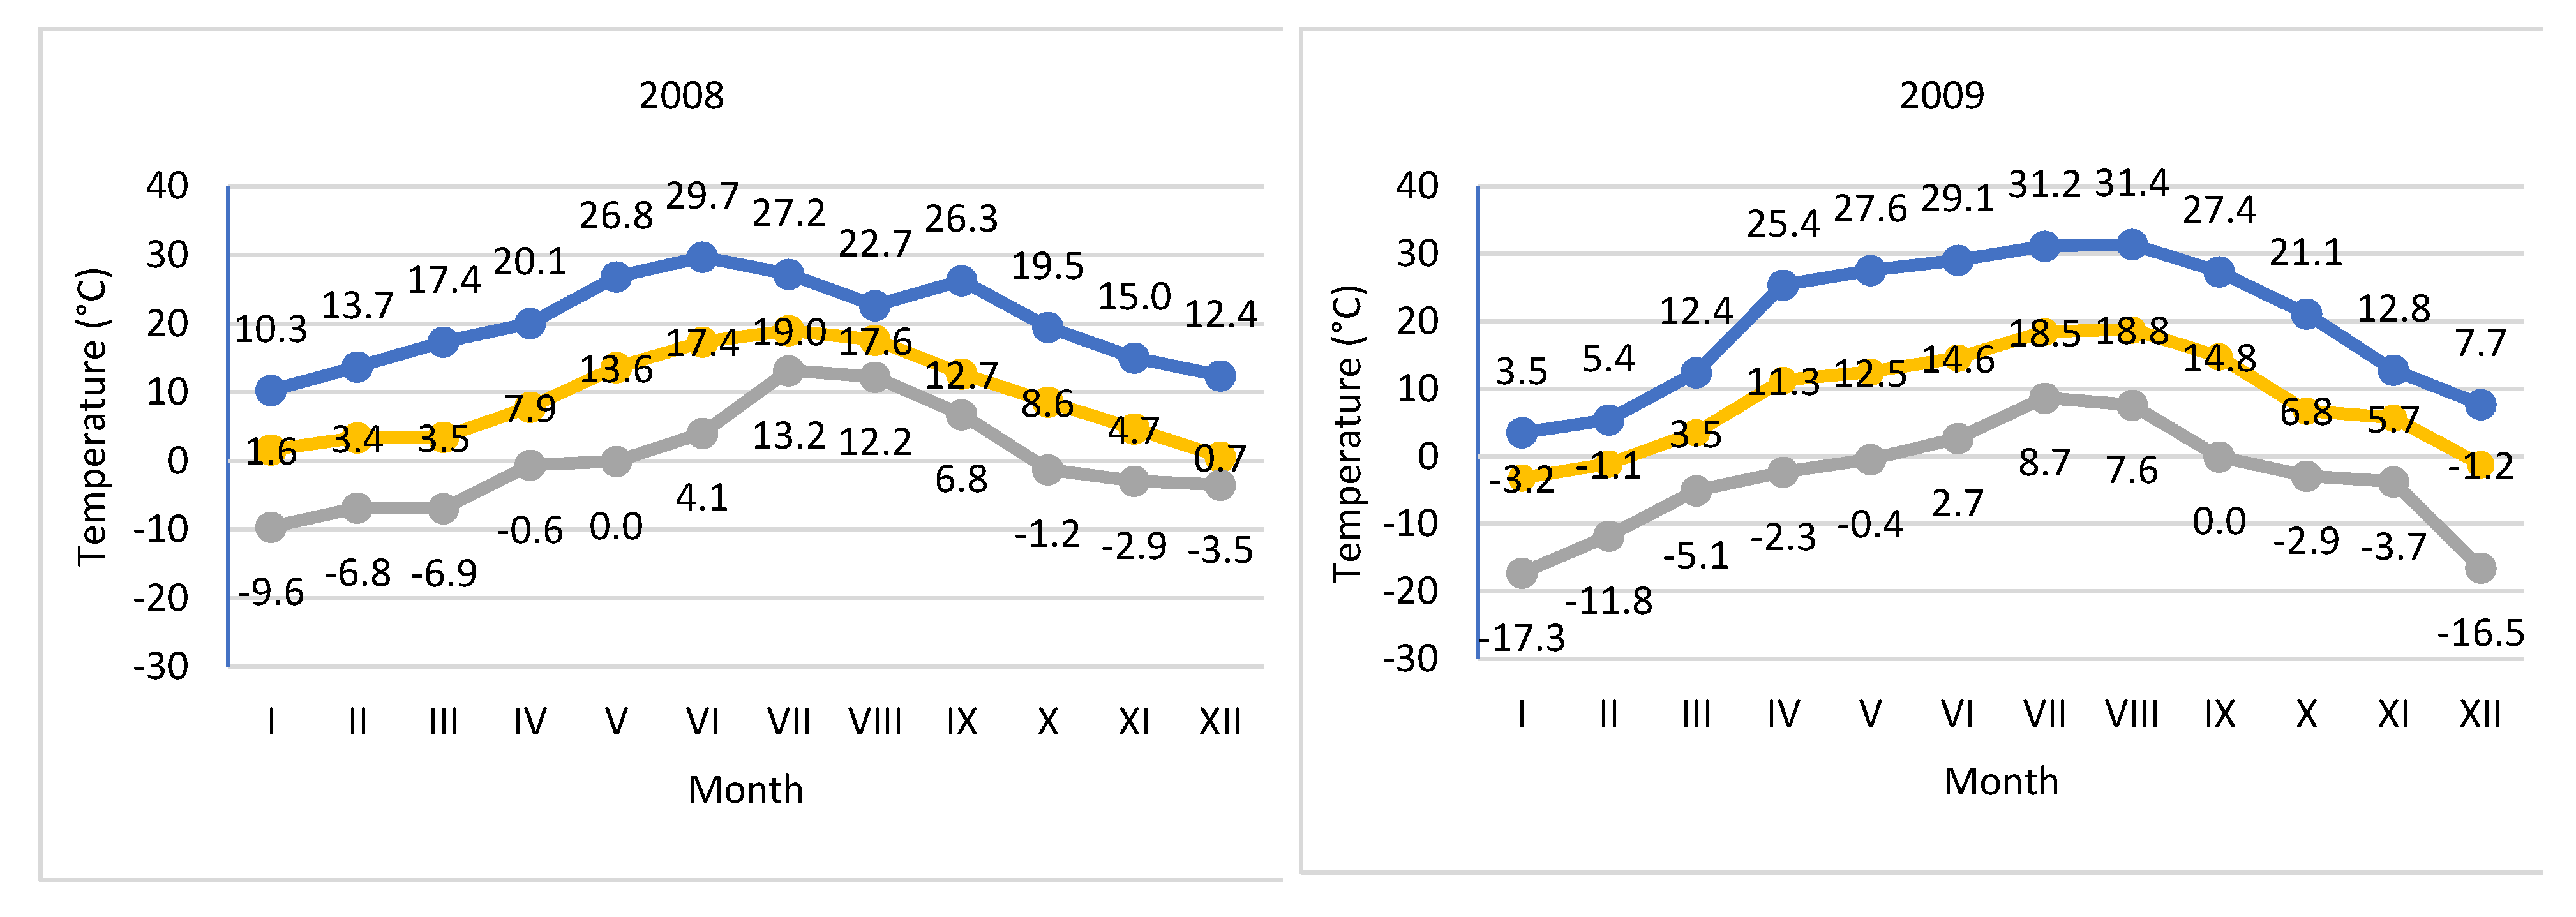
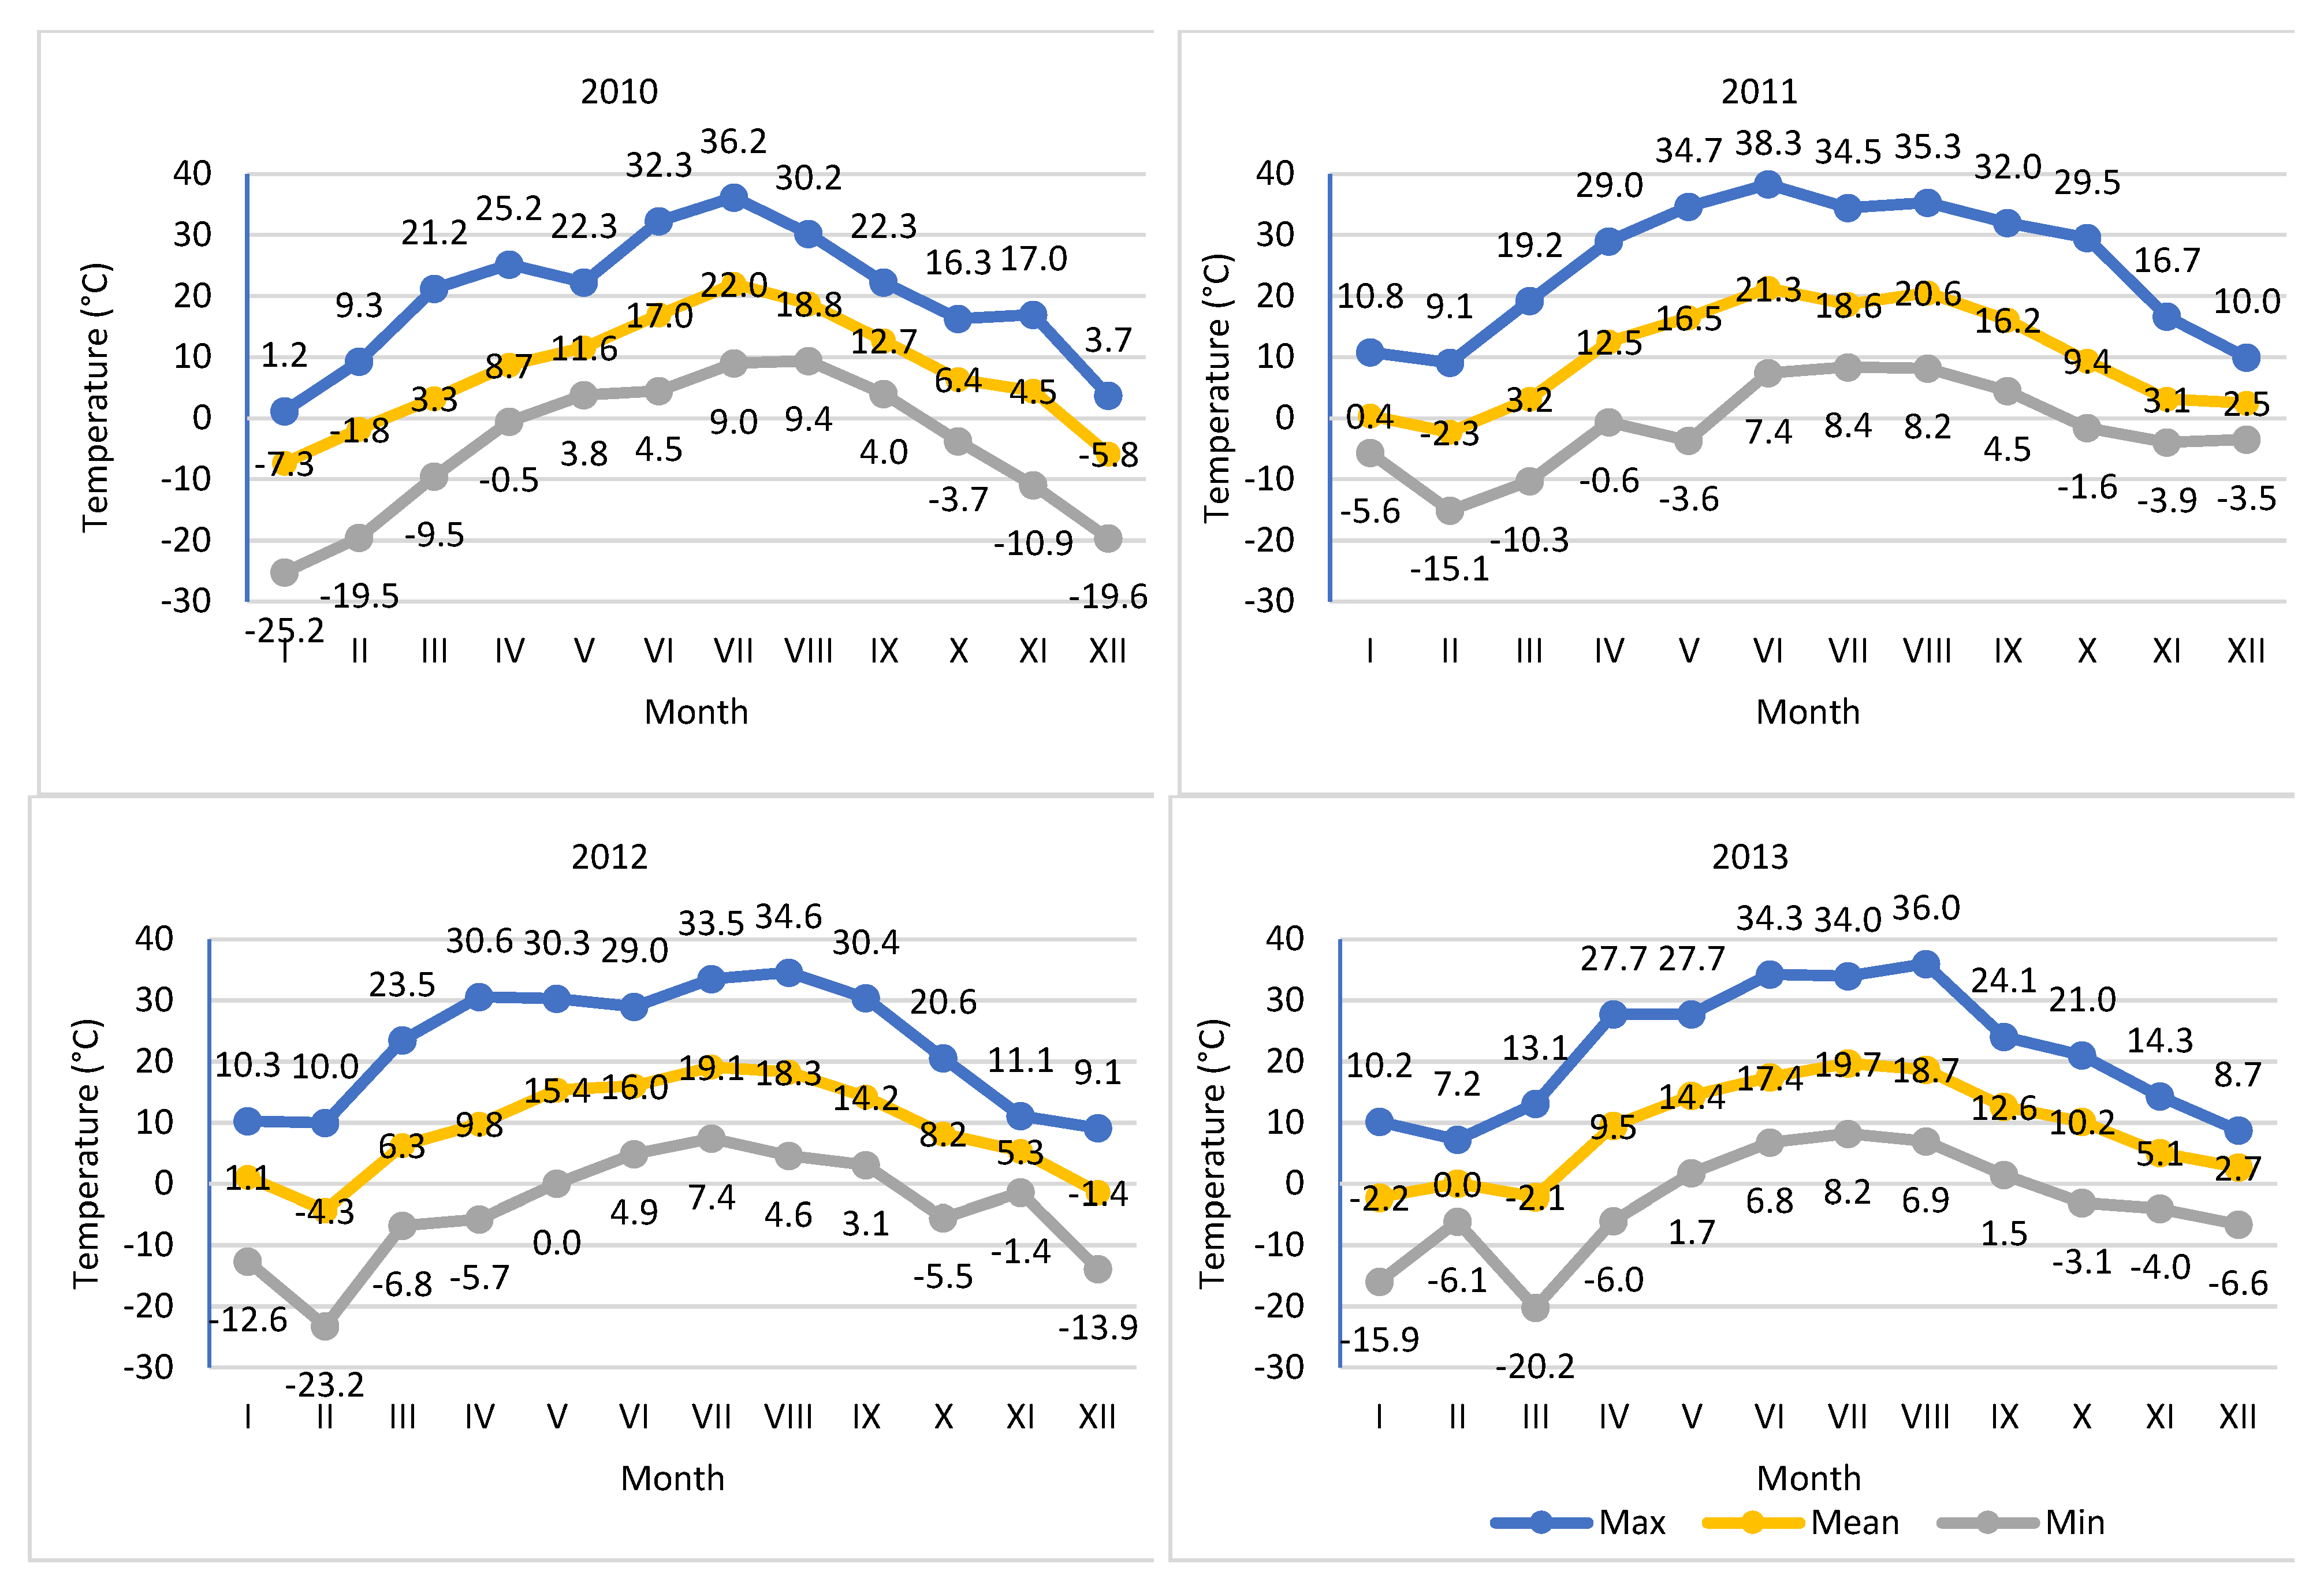
Figure 3.
The content of N-NH4 depending on nitrogen fertilization A- in the soil layer 0-20 cm, B- in the soil layer 21-40 cm
Figure 3.
The content of N-NH4 depending on nitrogen fertilization A- in the soil layer 0-20 cm, B- in the soil layer 21-40 cm
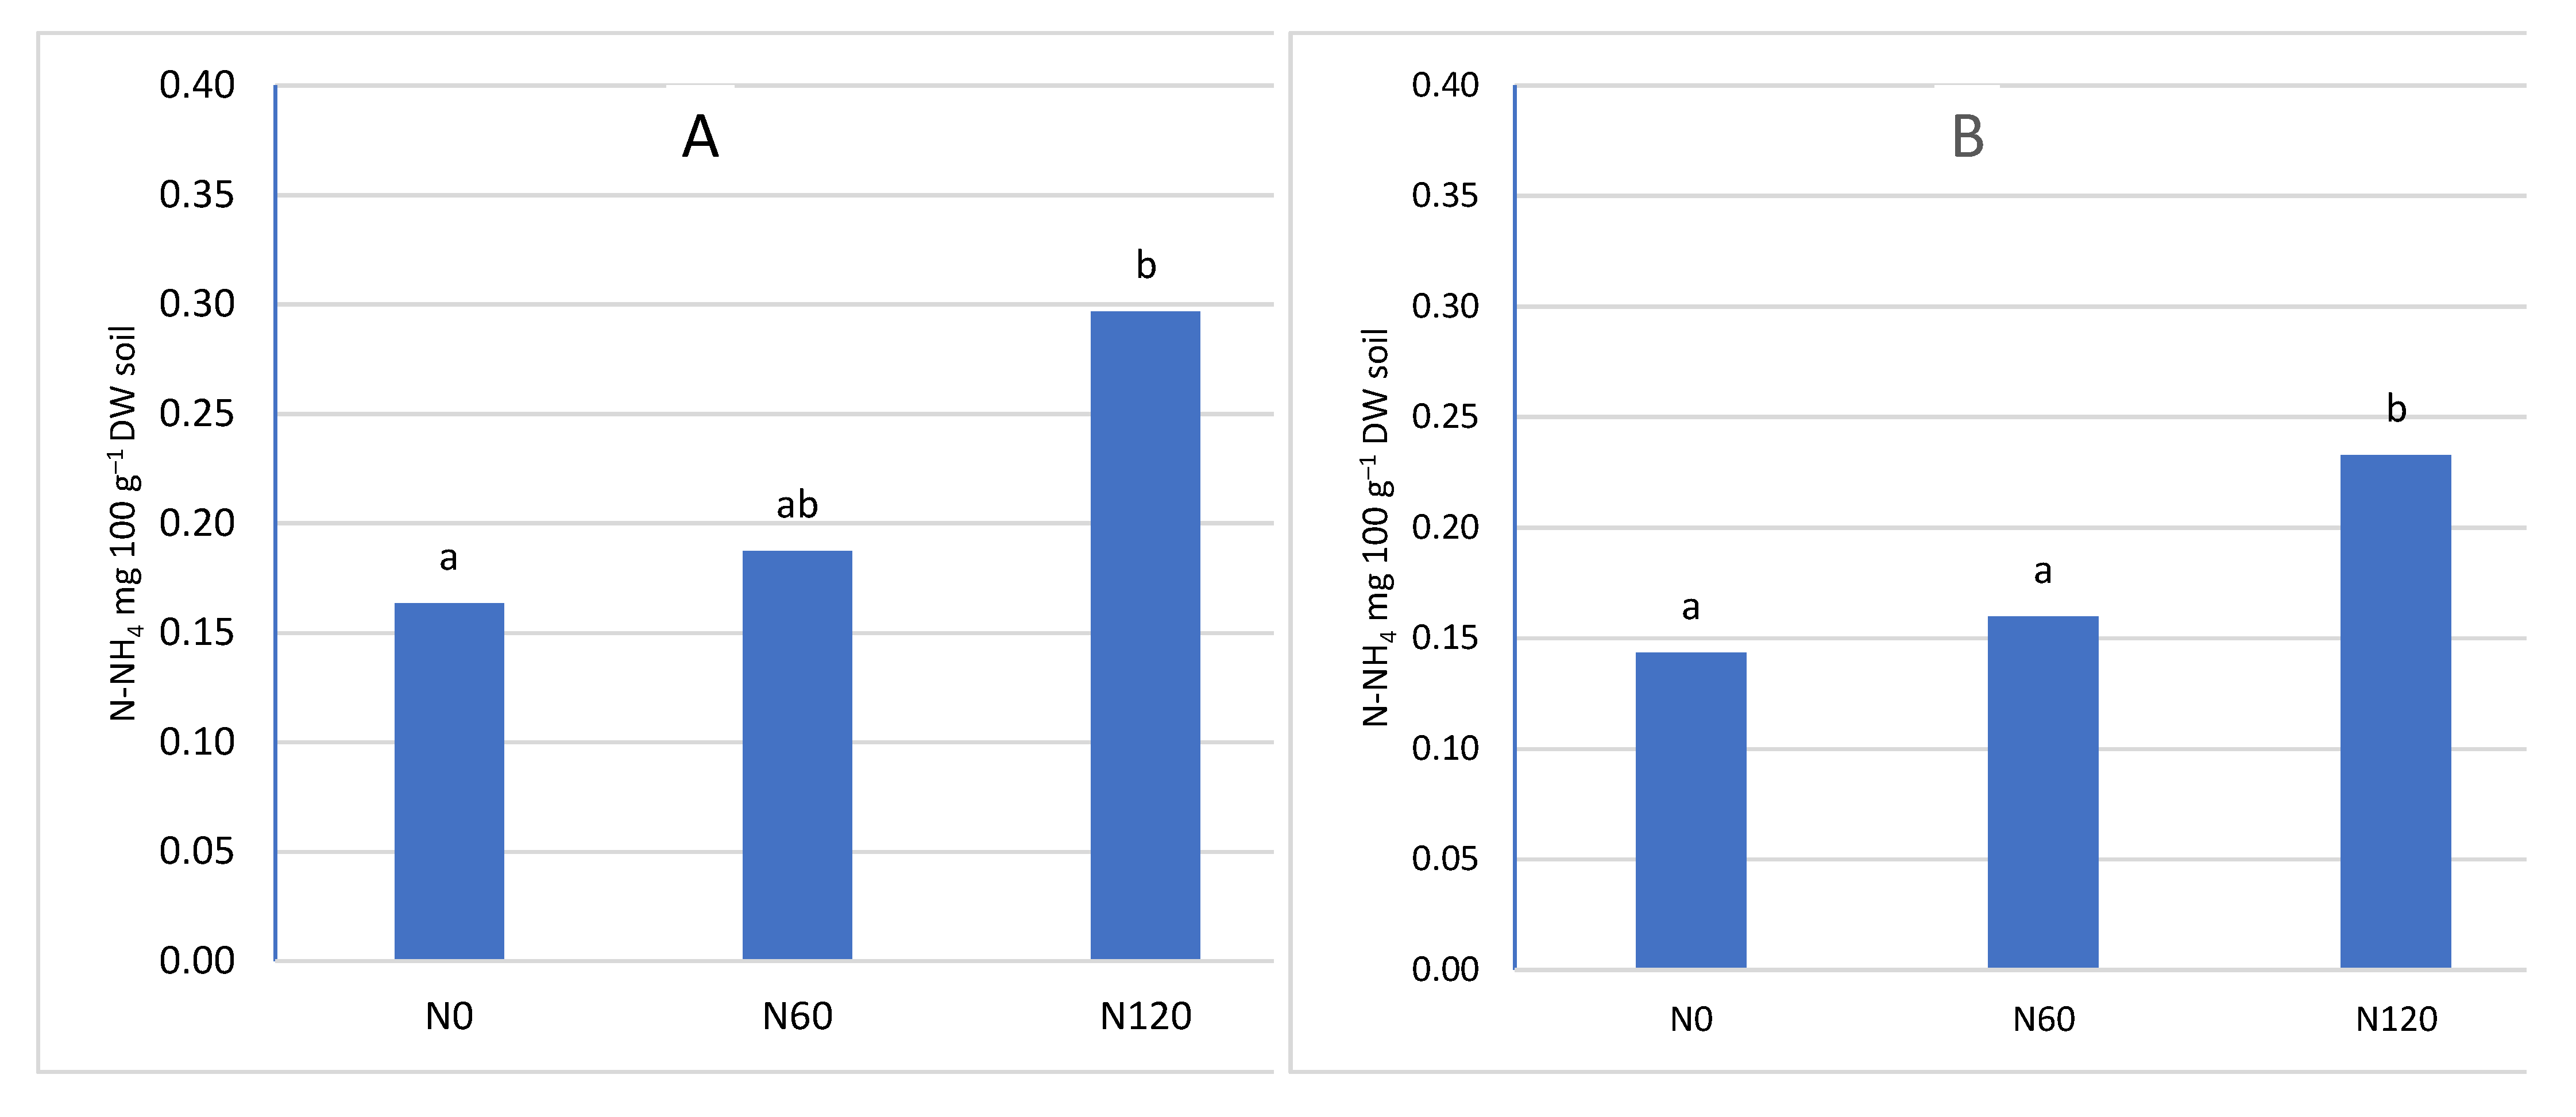
Figure 4.
The content of N-NO3 depending on nitrogen fertilization, A- in the soil layer 0-20 cm, B- in the soil layer 21-40 cm.
Figure 4.
The content of N-NO3 depending on nitrogen fertilization, A- in the soil layer 0-20 cm, B- in the soil layer 21-40 cm.
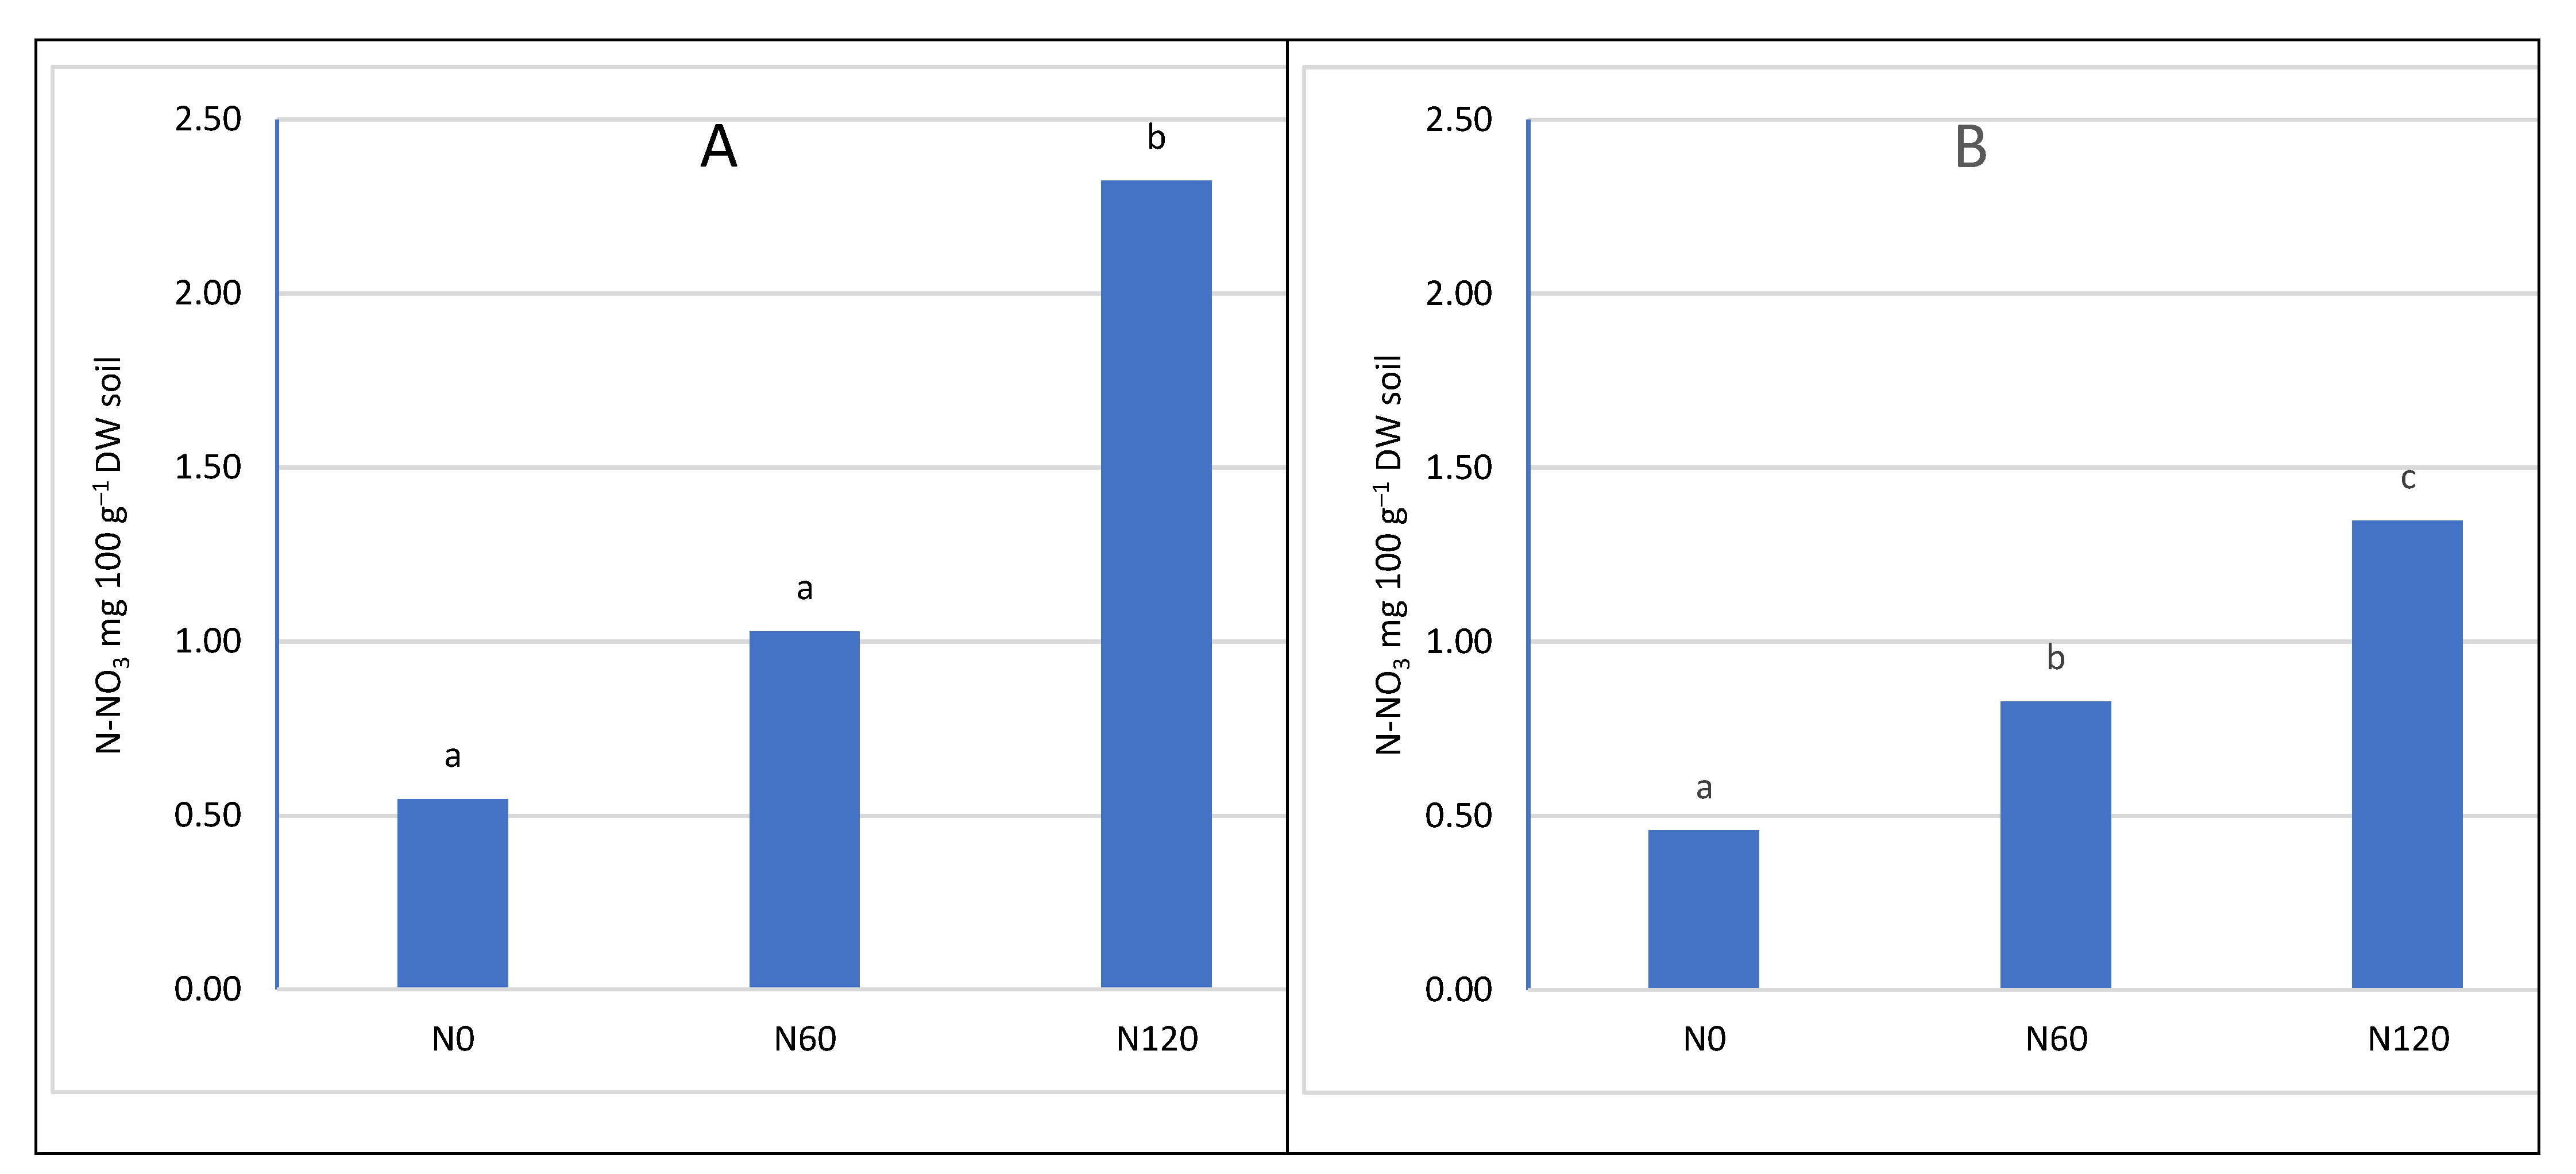
Figure 5.
The content of N-NH4 depends on the date of sampling A- in the soil layer 0-20 cm, B- in the soil layer 21-40 cm.
Figure 5.
The content of N-NH4 depends on the date of sampling A- in the soil layer 0-20 cm, B- in the soil layer 21-40 cm.
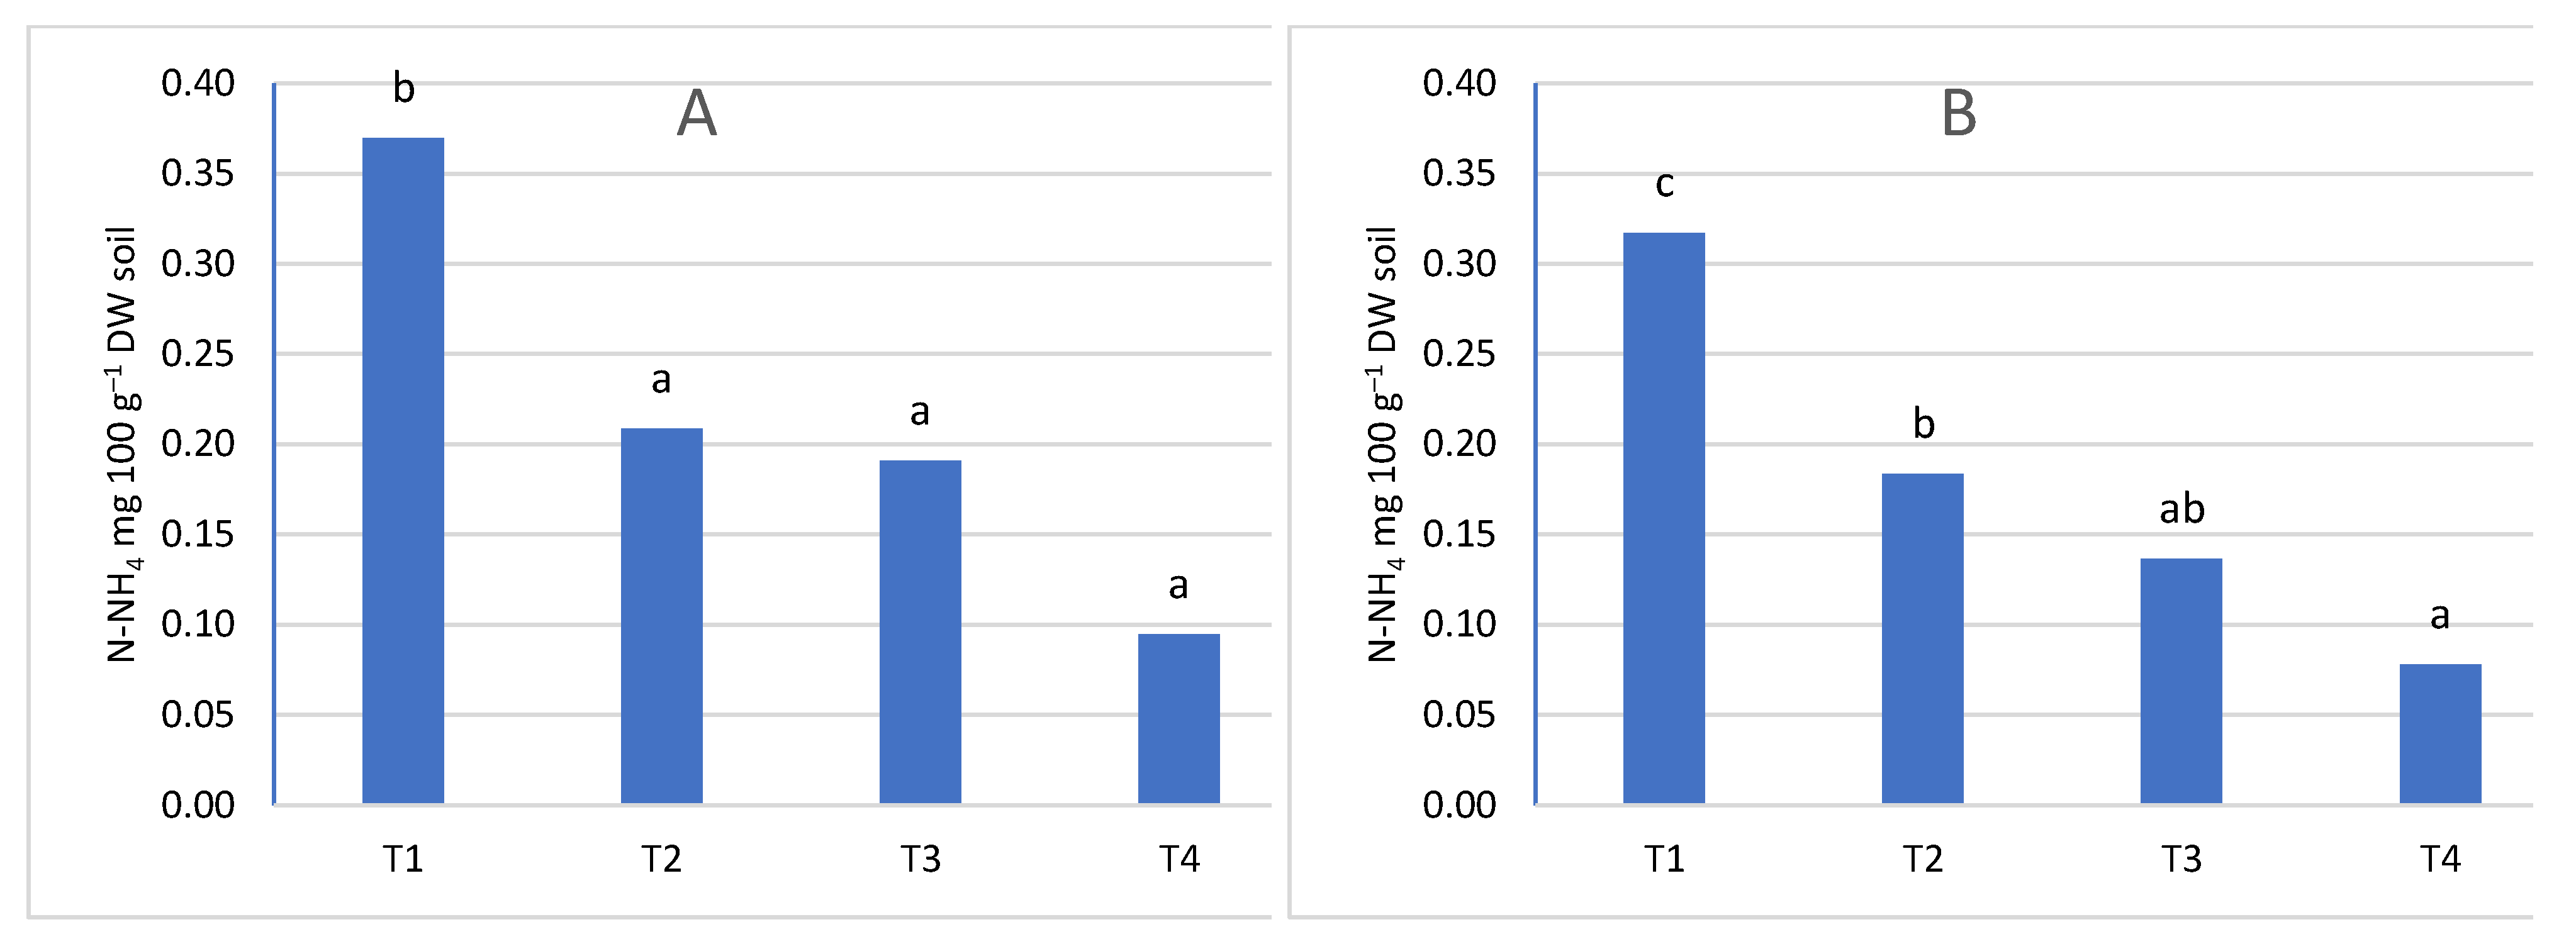
Figure 6.
The content of N-NO3 according to the date of sampling A- in the soil layer 0-20 cm, B- in the soil layer 21-40 cm.
Figure 6.
The content of N-NO3 according to the date of sampling A- in the soil layer 0-20 cm, B- in the soil layer 21-40 cm.
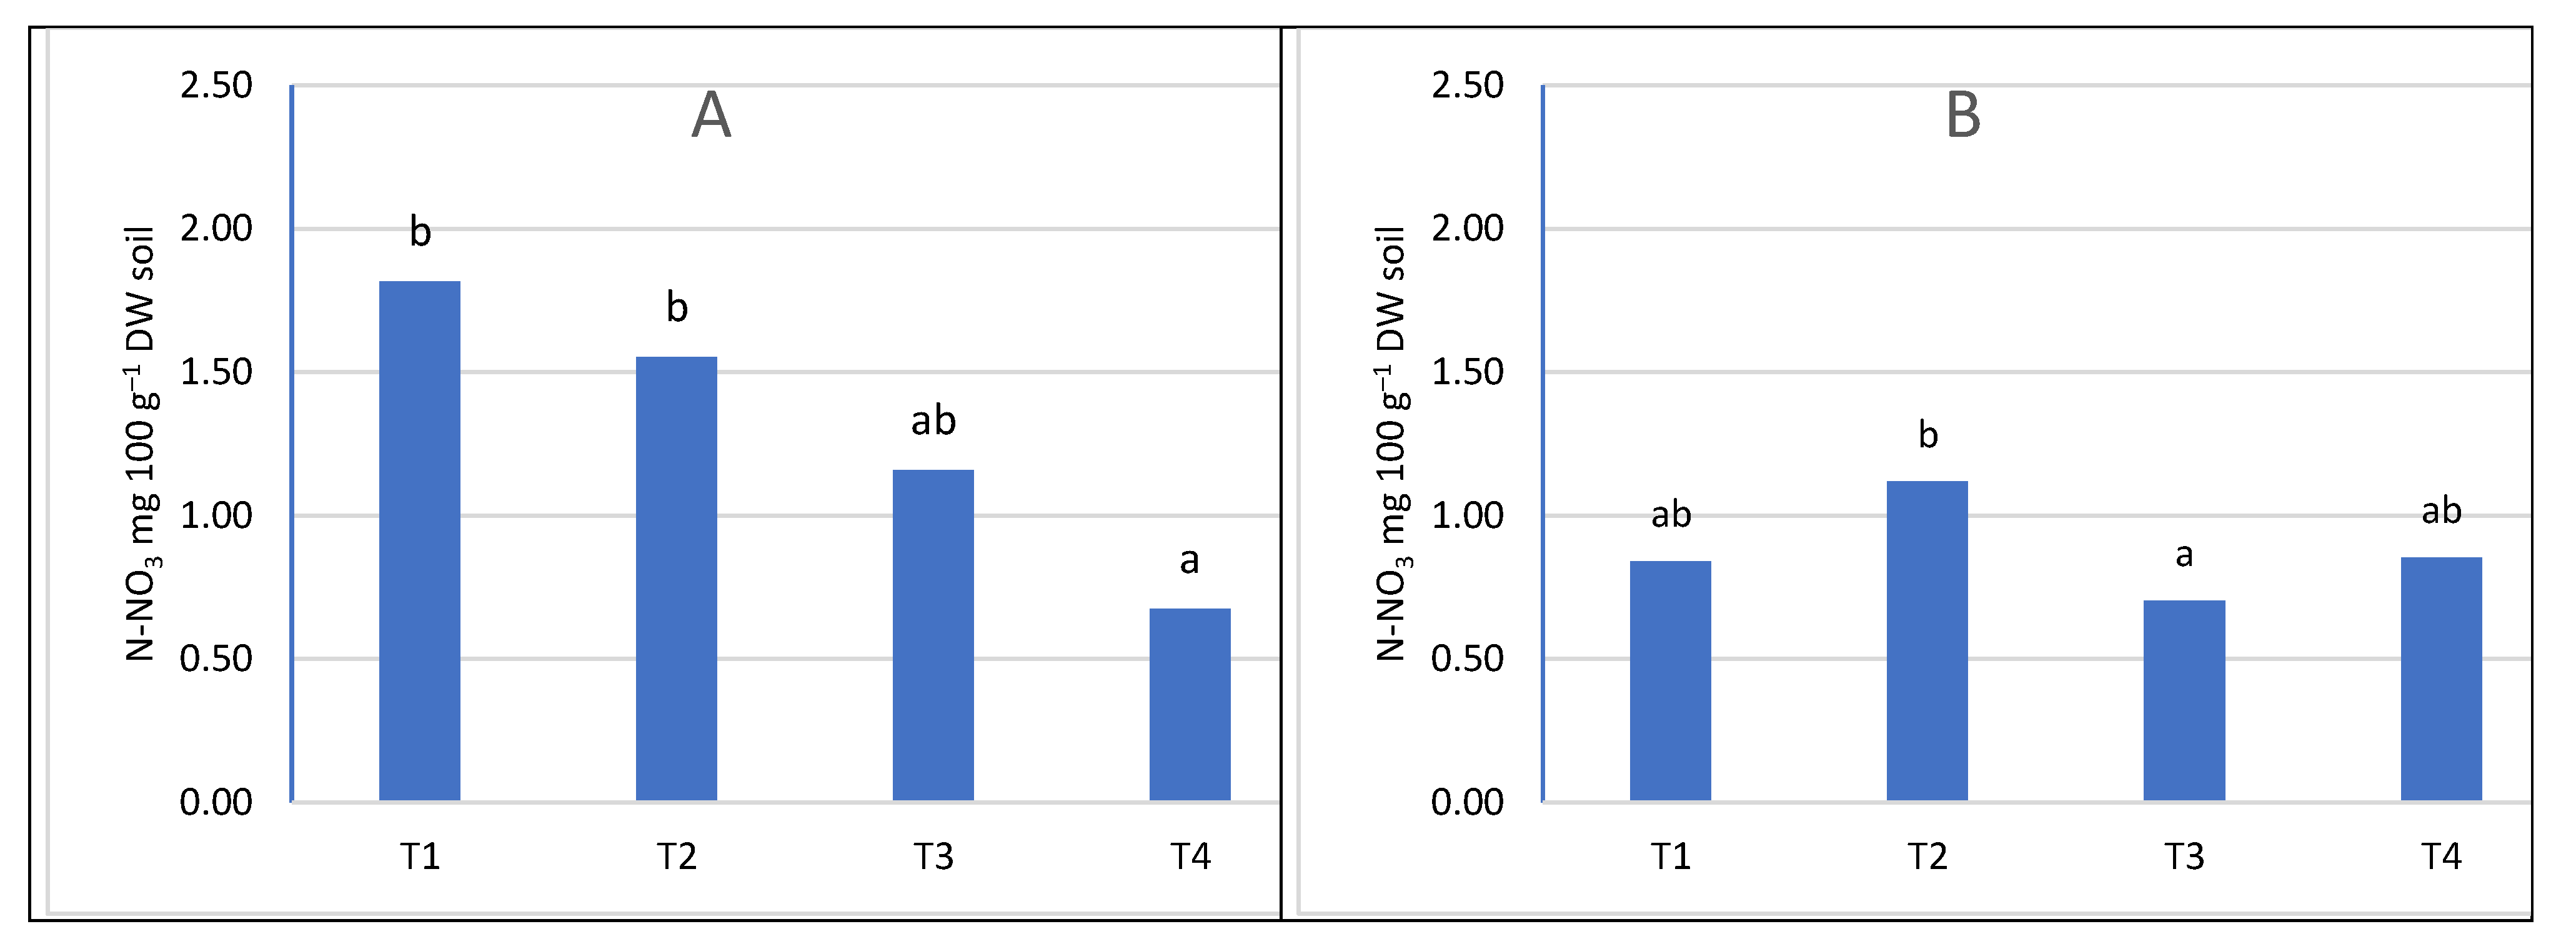
Figure 7.
The content of N-NH4 depending on the term and nitrogen fertilization A- in the soil layer 0-20 cm, B- soil layer 21-40 cm.
Figure 7.
The content of N-NH4 depending on the term and nitrogen fertilization A- in the soil layer 0-20 cm, B- soil layer 21-40 cm.
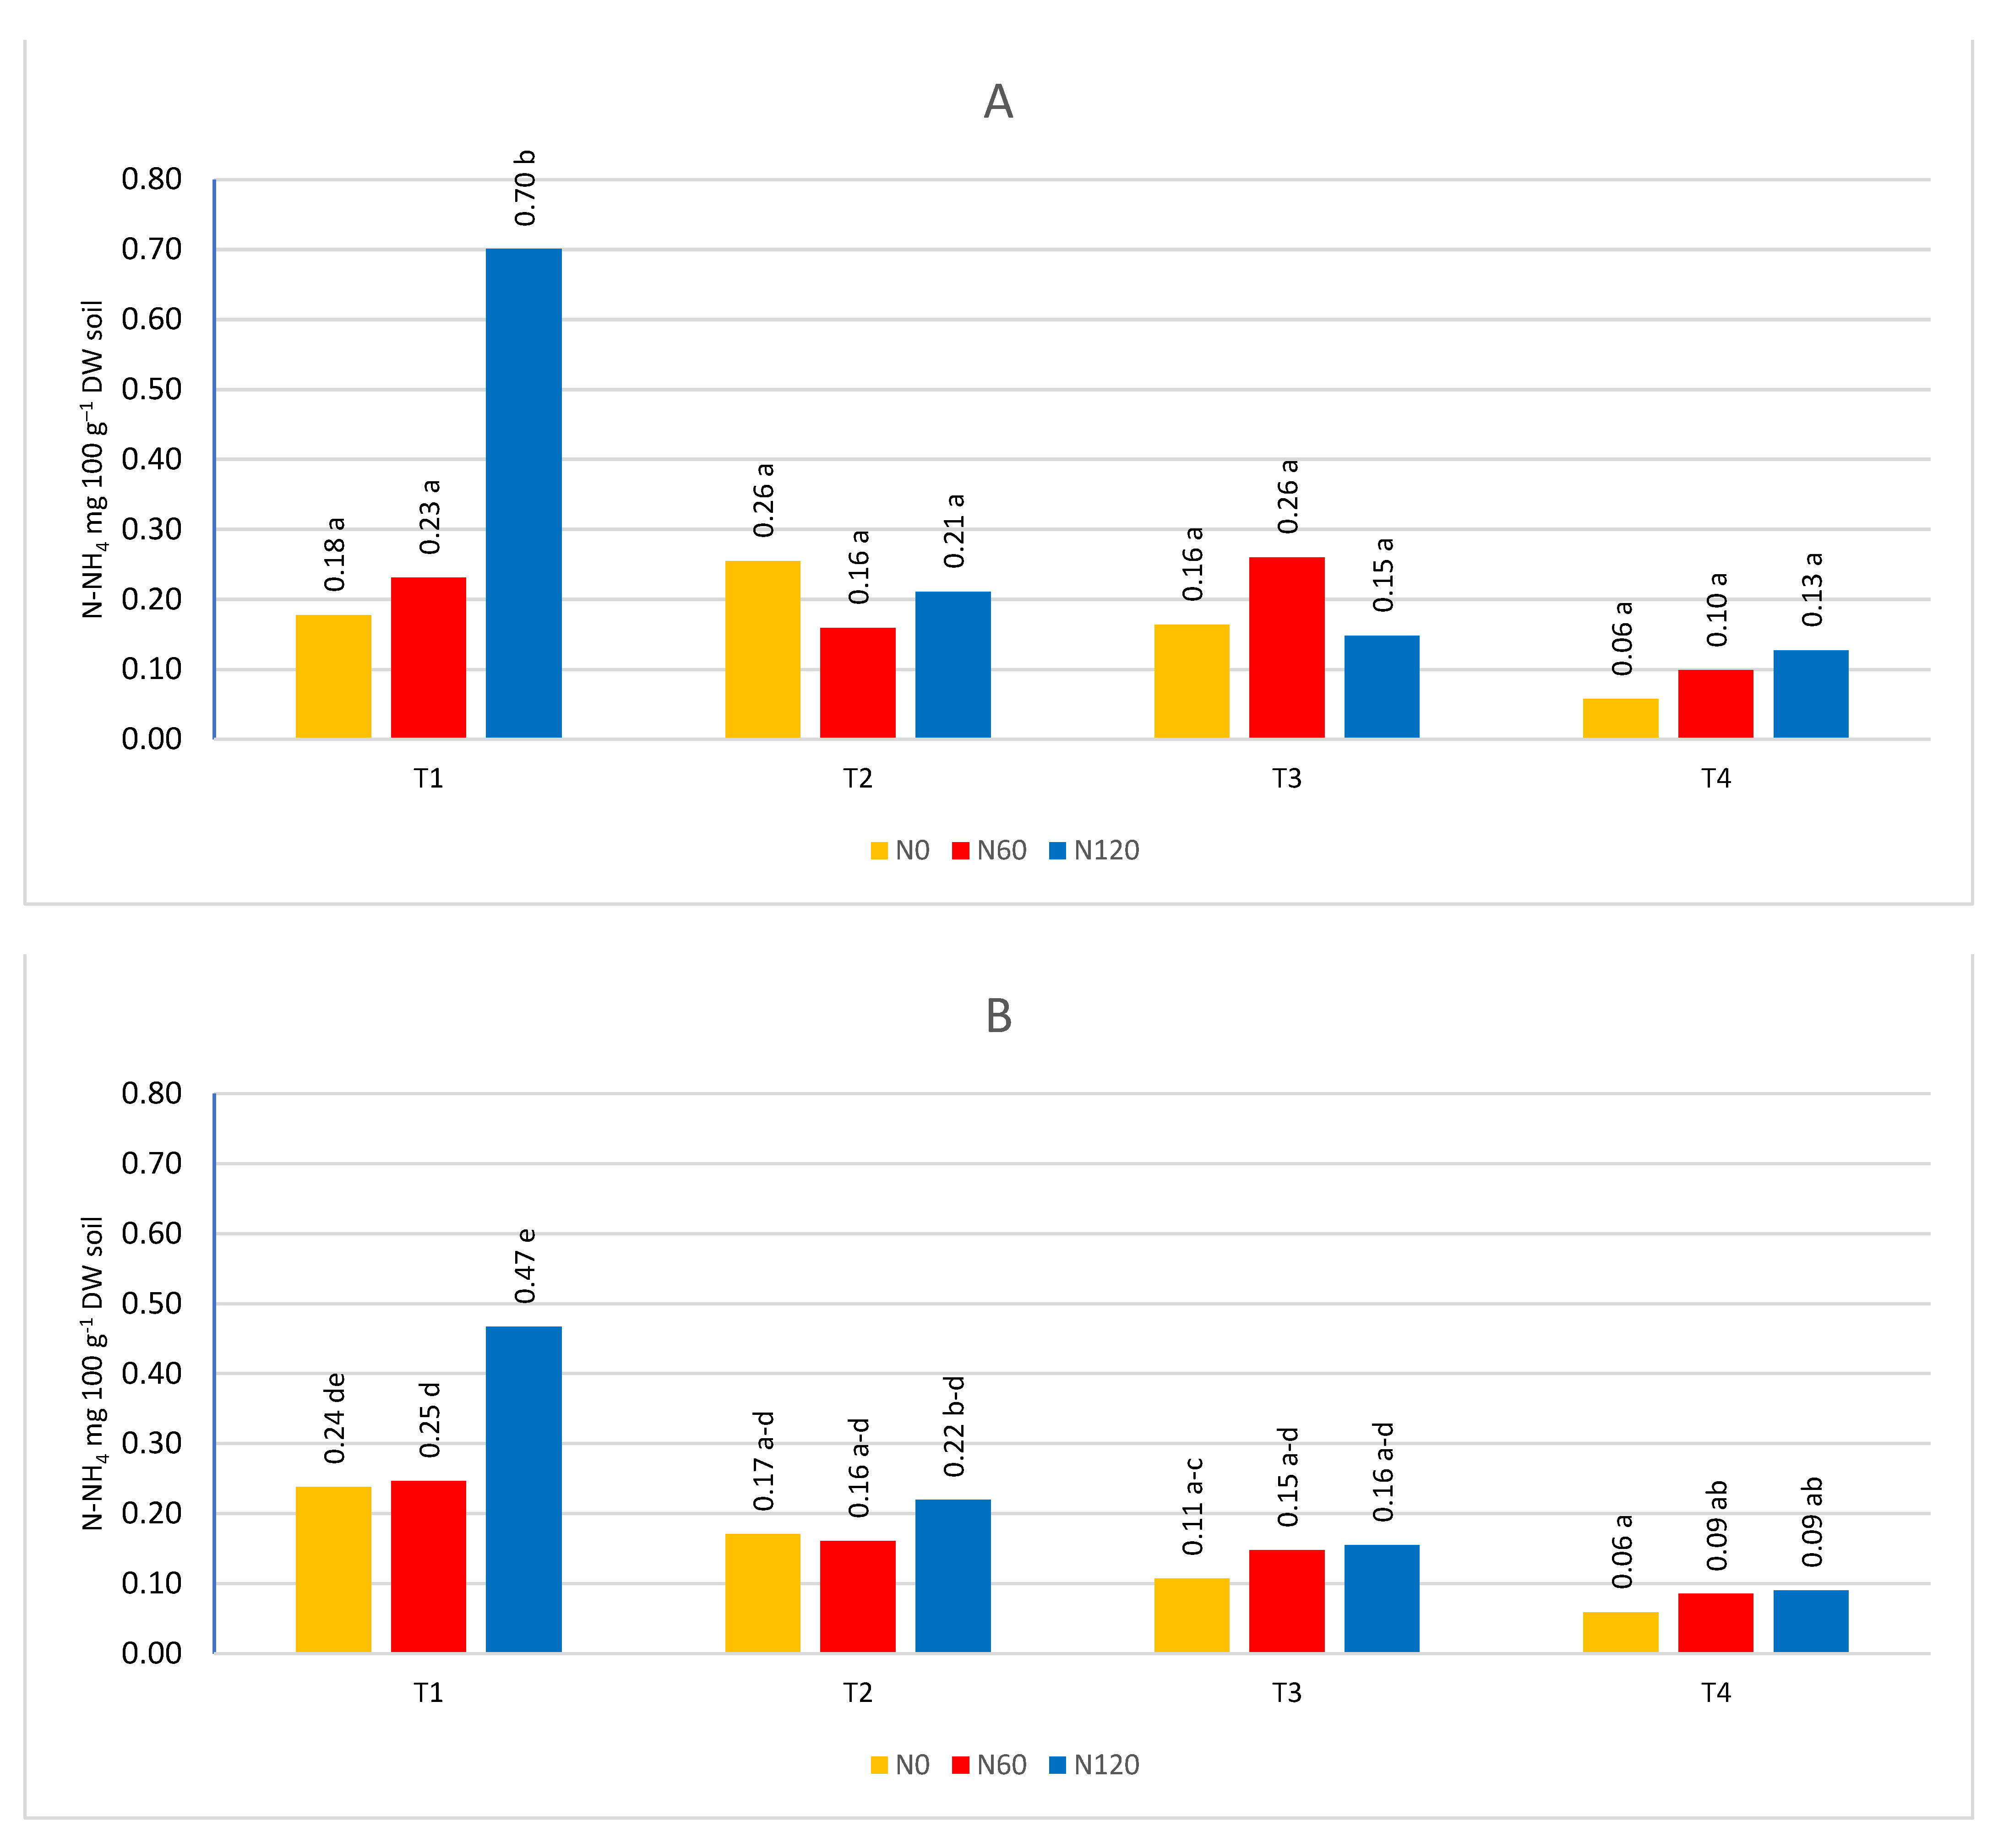
Figure 8.
The content of N-NO3 depending on the term and nitrogen fertilization A in the soil layer 0-20 cm, B in the soil layer 21-40 cm.
Figure 8.
The content of N-NO3 depending on the term and nitrogen fertilization A in the soil layer 0-20 cm, B in the soil layer 21-40 cm.
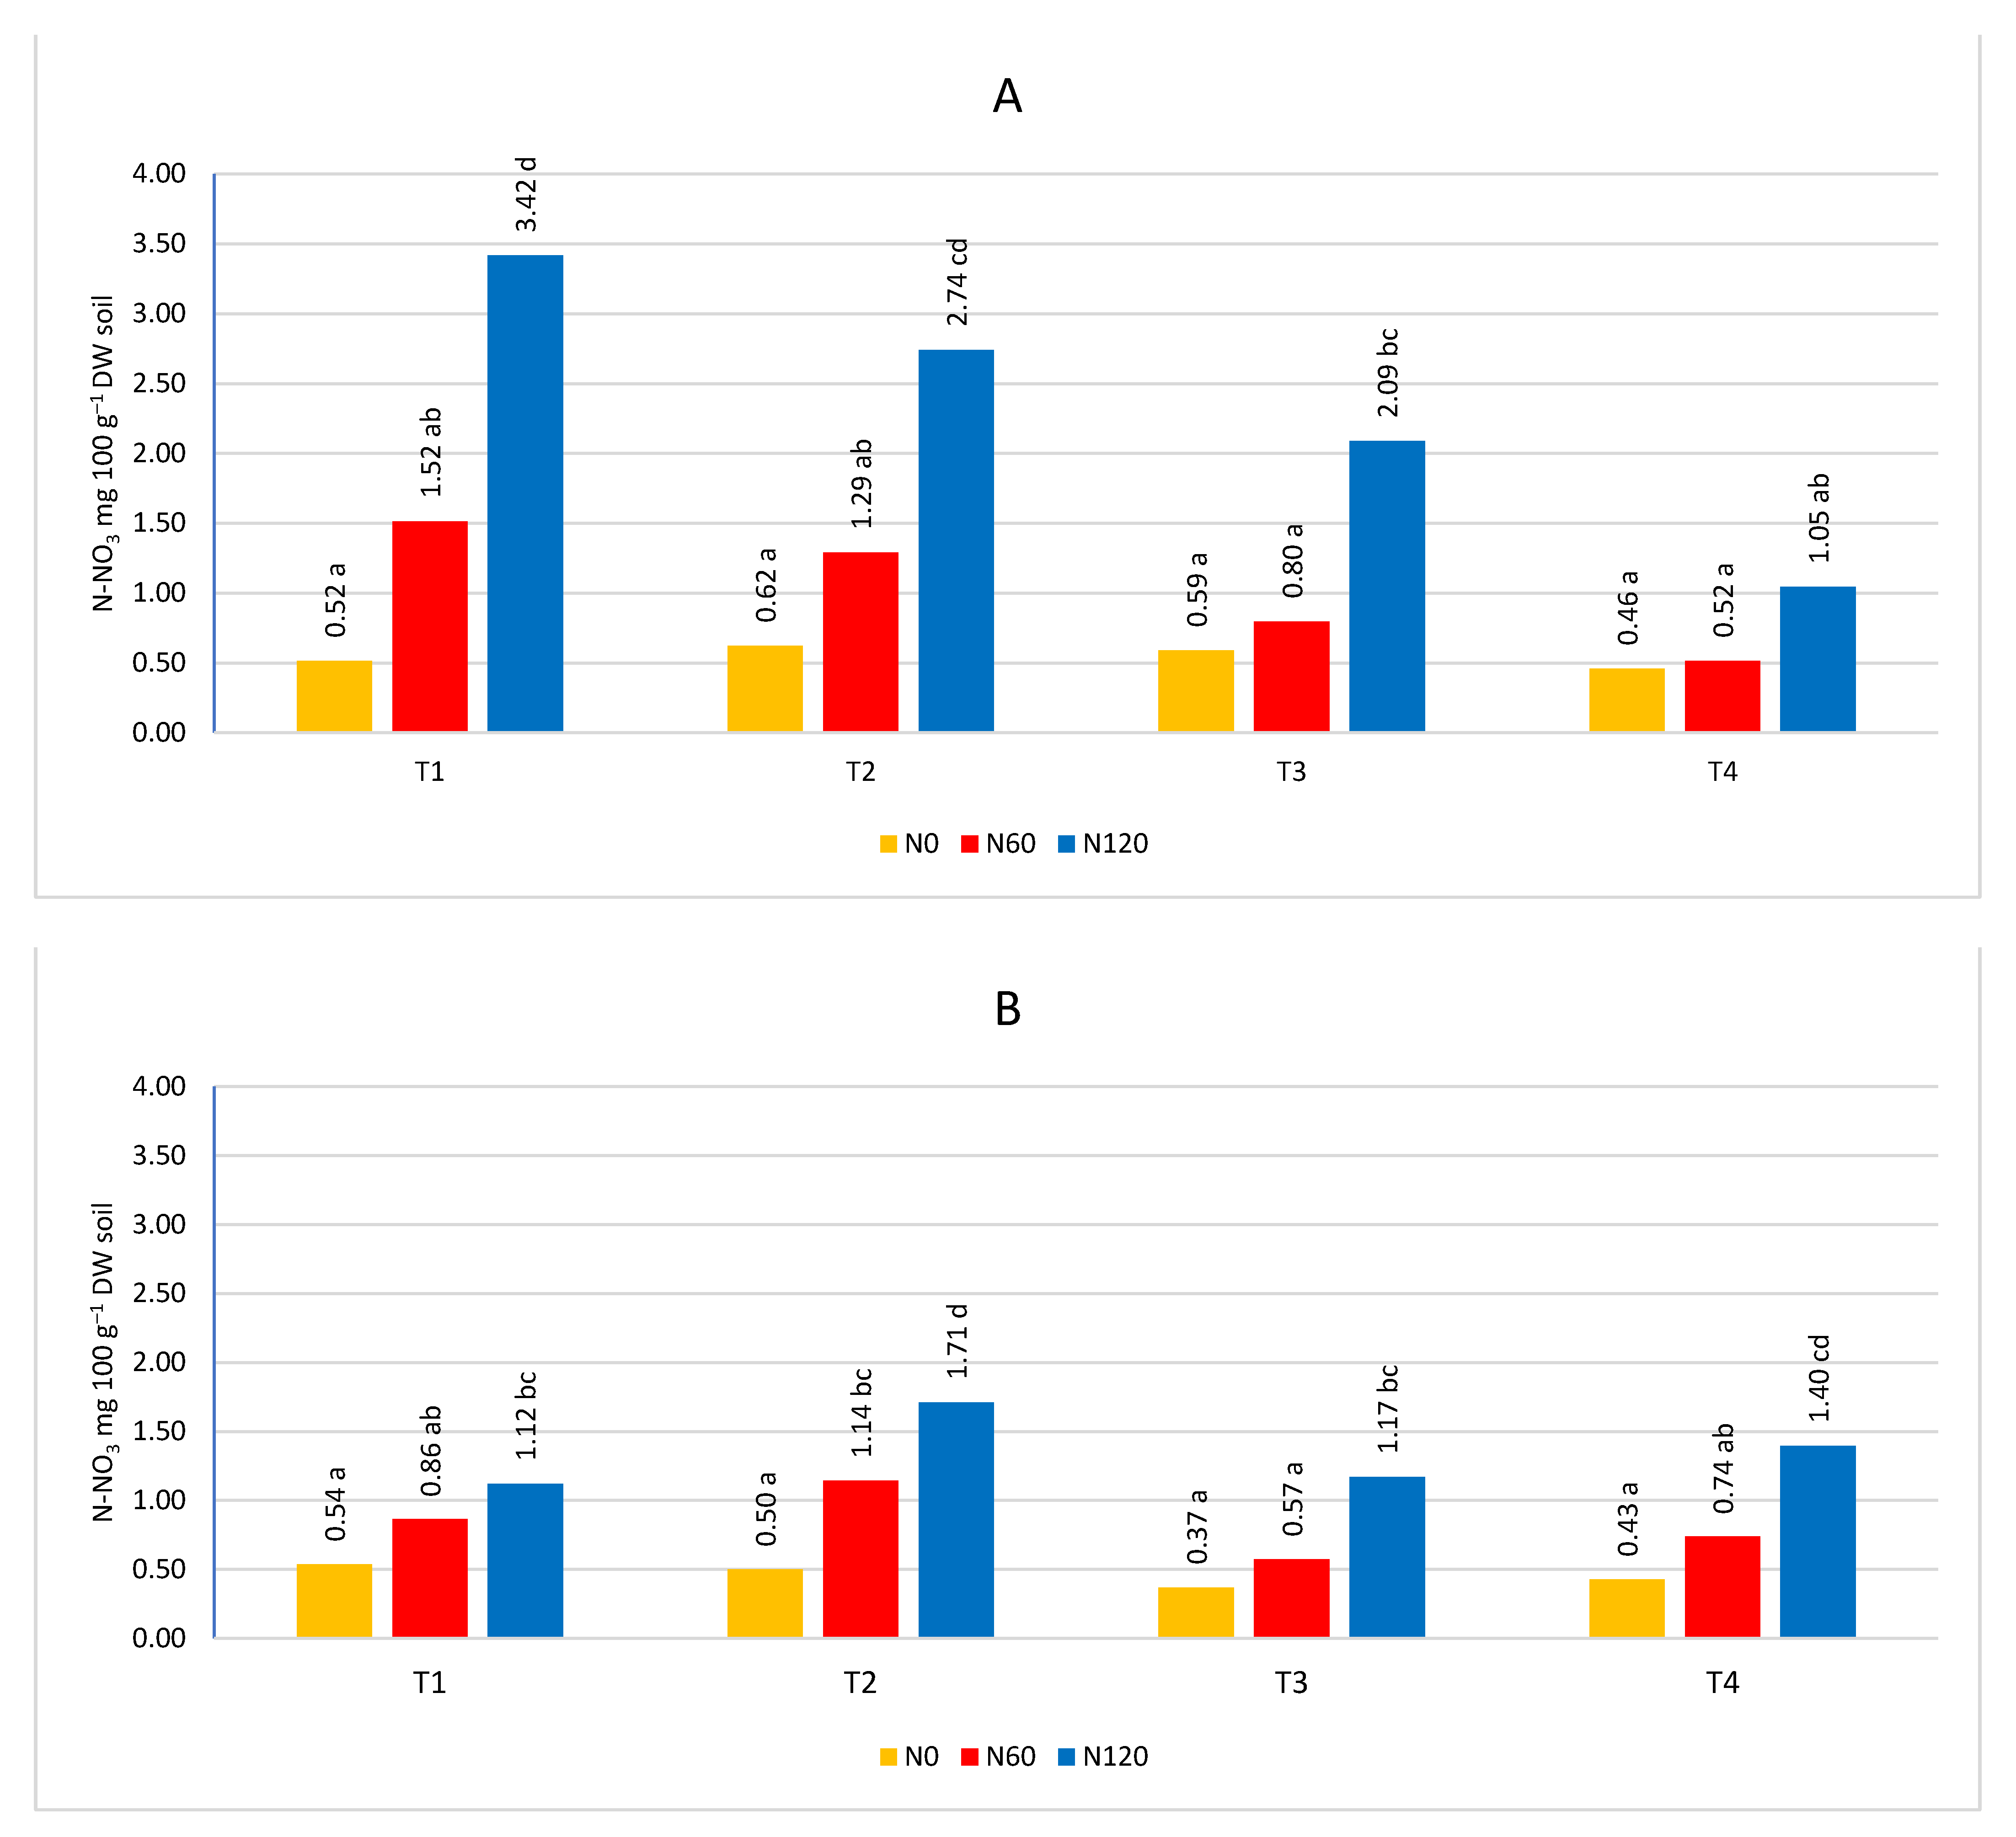
Figure 9.
Influence of climatic conditions on the nitrate nitrogen content in the soil according to the sampling time, as shown by PCA. A- sampling time T1, B- sampling time T2, C- sampling time T3, D – sampling time T4. WB- water balance, P1- sum precipitation 30 days before sampling, P2 sum precipitation 14 days before sampling, TA- average temperature 30 days before sampling, TS- soil temperature. ET- evapotranspiration.
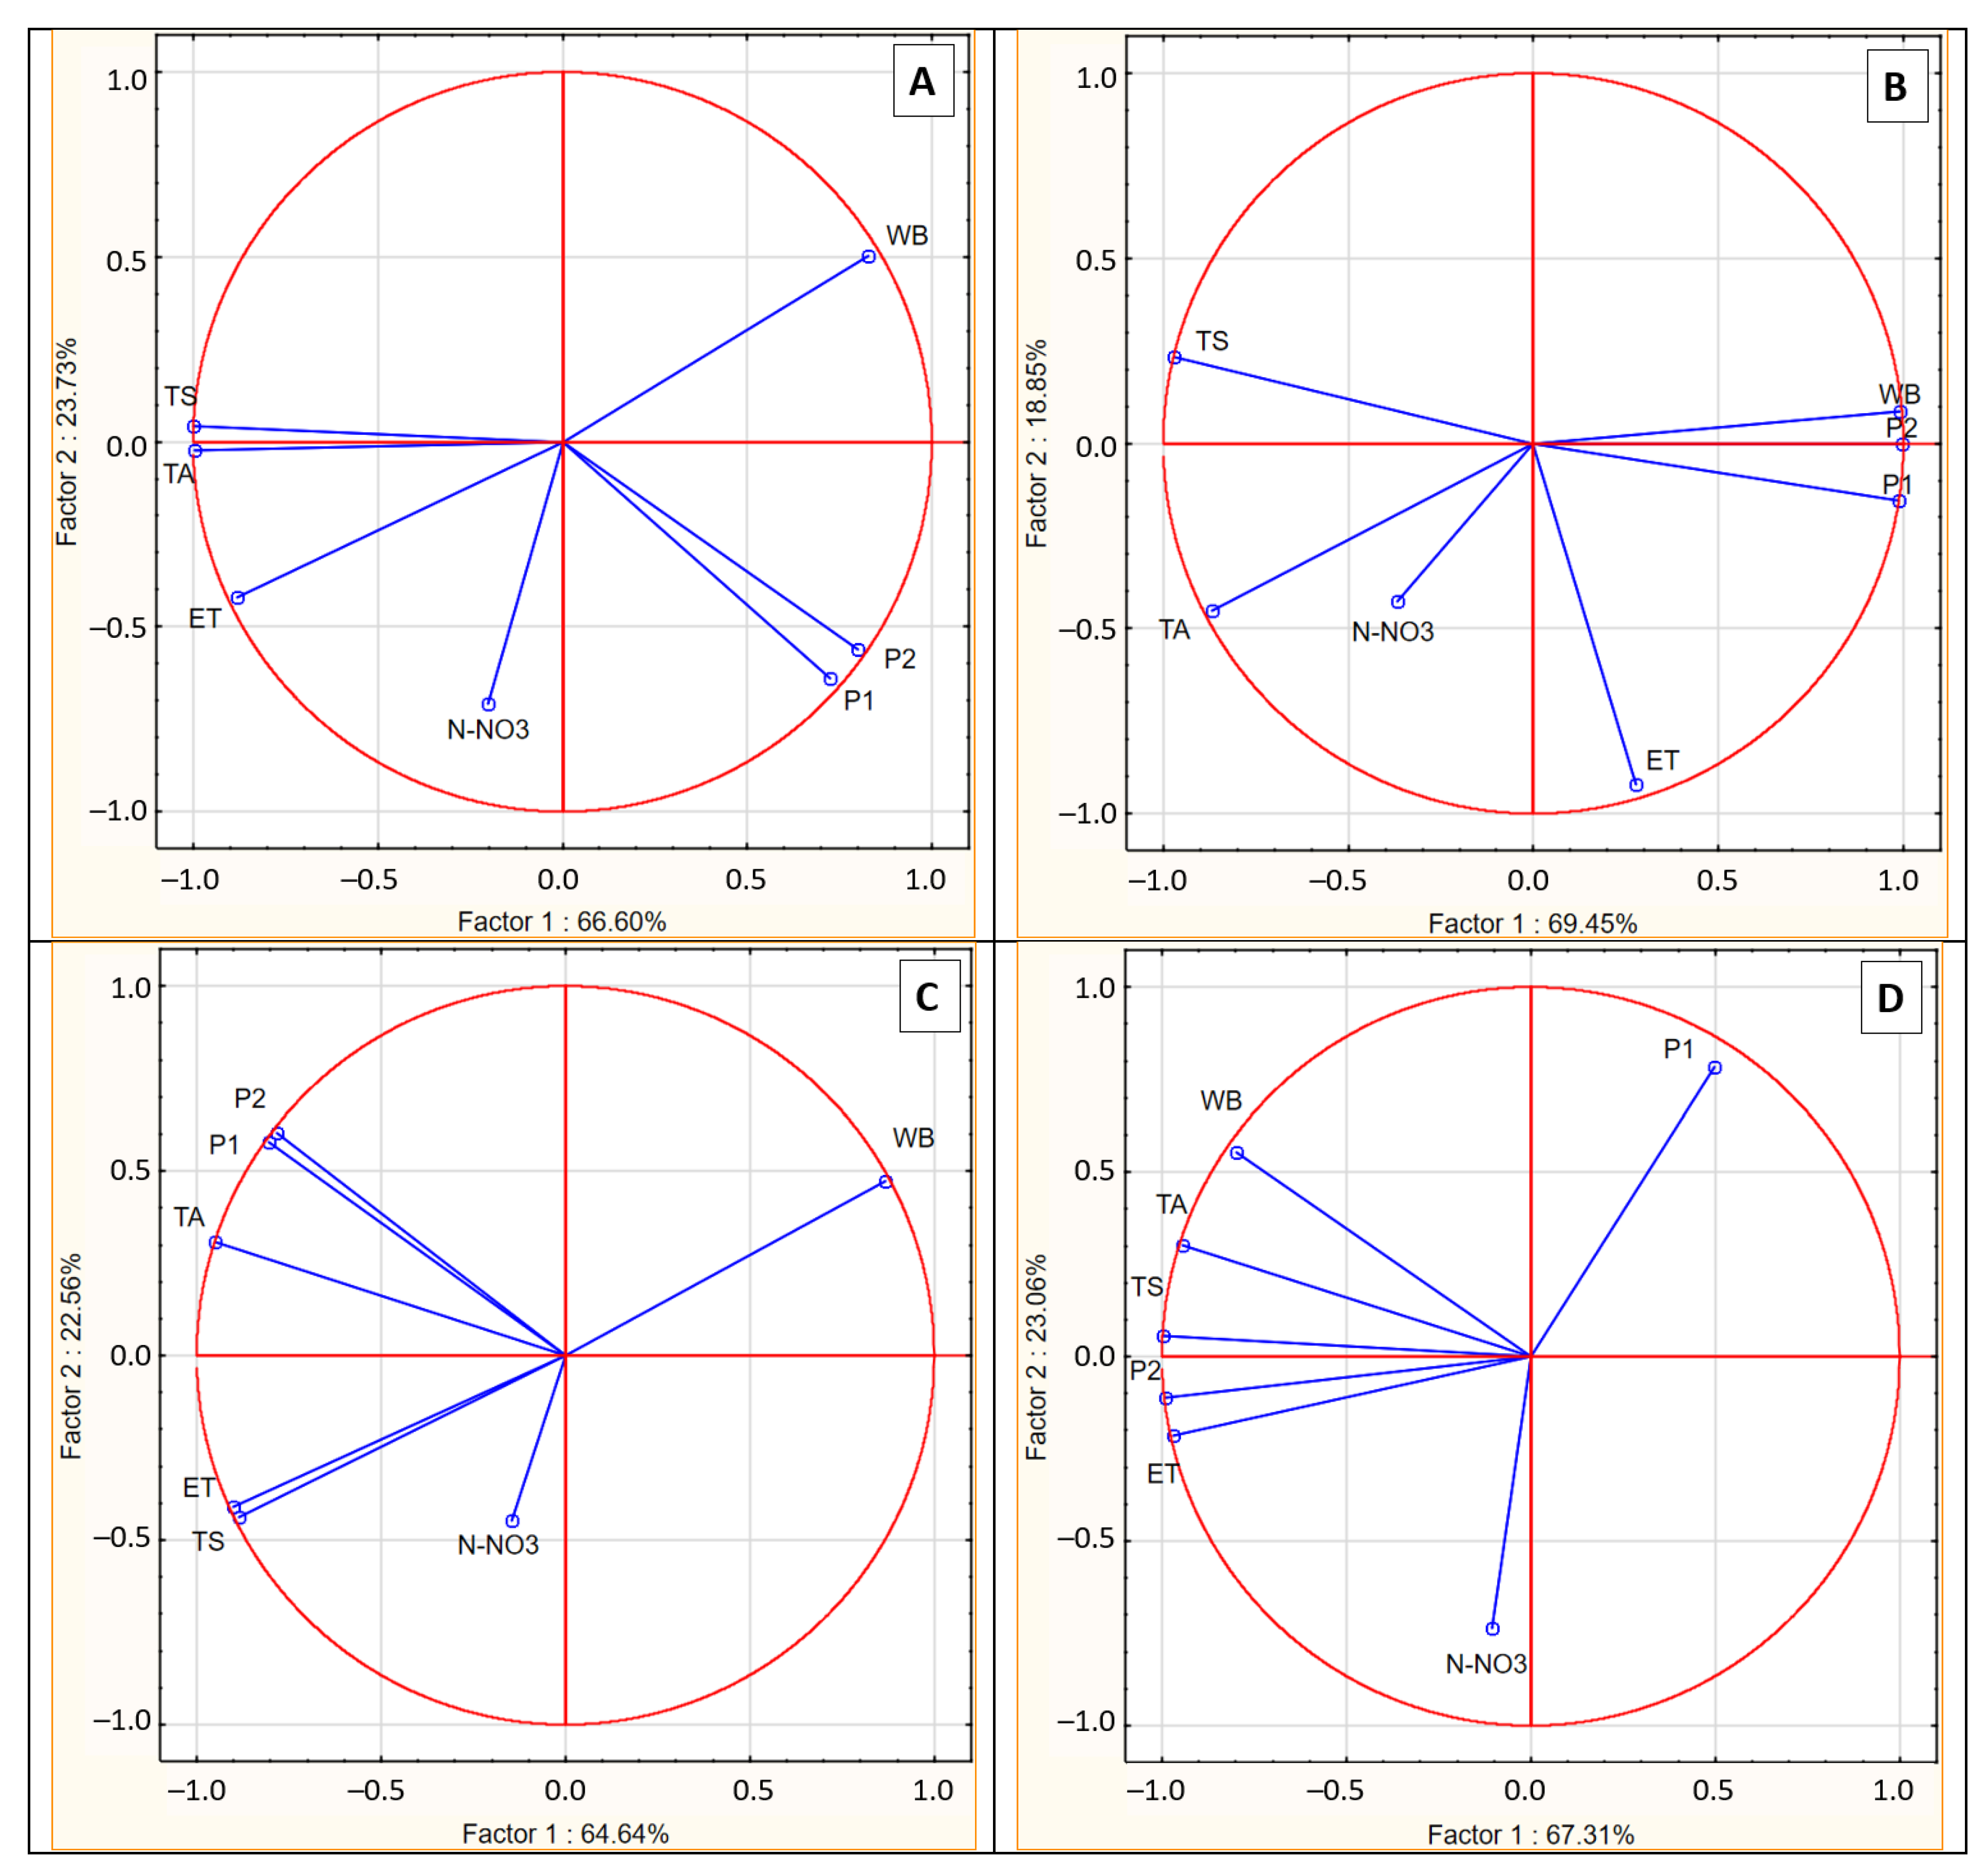
Figure 10.
The content of N-NH4 depending on the year of research A- in the soil layer 0-20 cm, B- in the soil layer 21-40 cm.
Figure 10.
The content of N-NH4 depending on the year of research A- in the soil layer 0-20 cm, B- in the soil layer 21-40 cm.
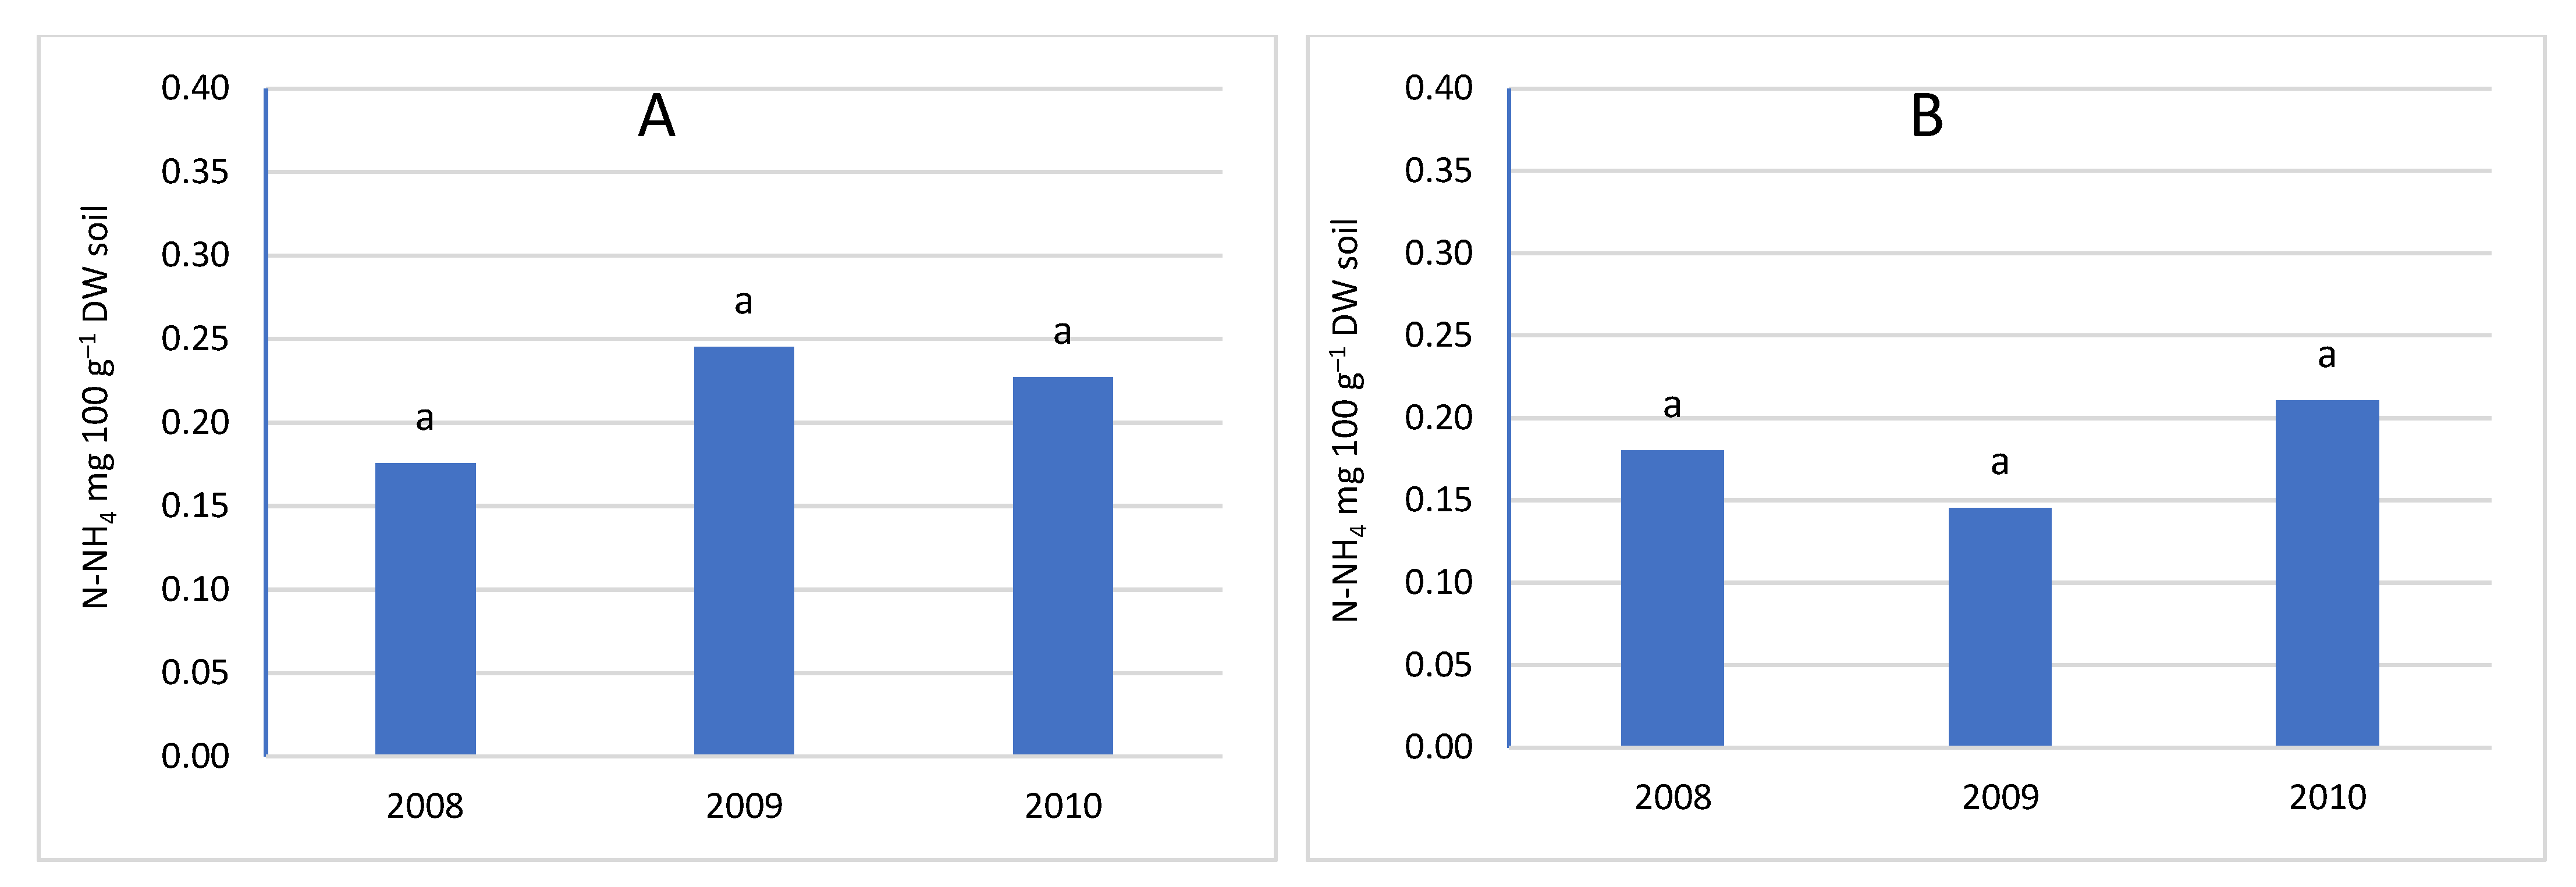
Figure 11.
The content of N-NO3 according to the year of research A- in the soil layer 0-20 cm, B- in the soil layer 21-40 cm.
Figure 11.
The content of N-NO3 according to the year of research A- in the soil layer 0-20 cm, B- in the soil layer 21-40 cm.
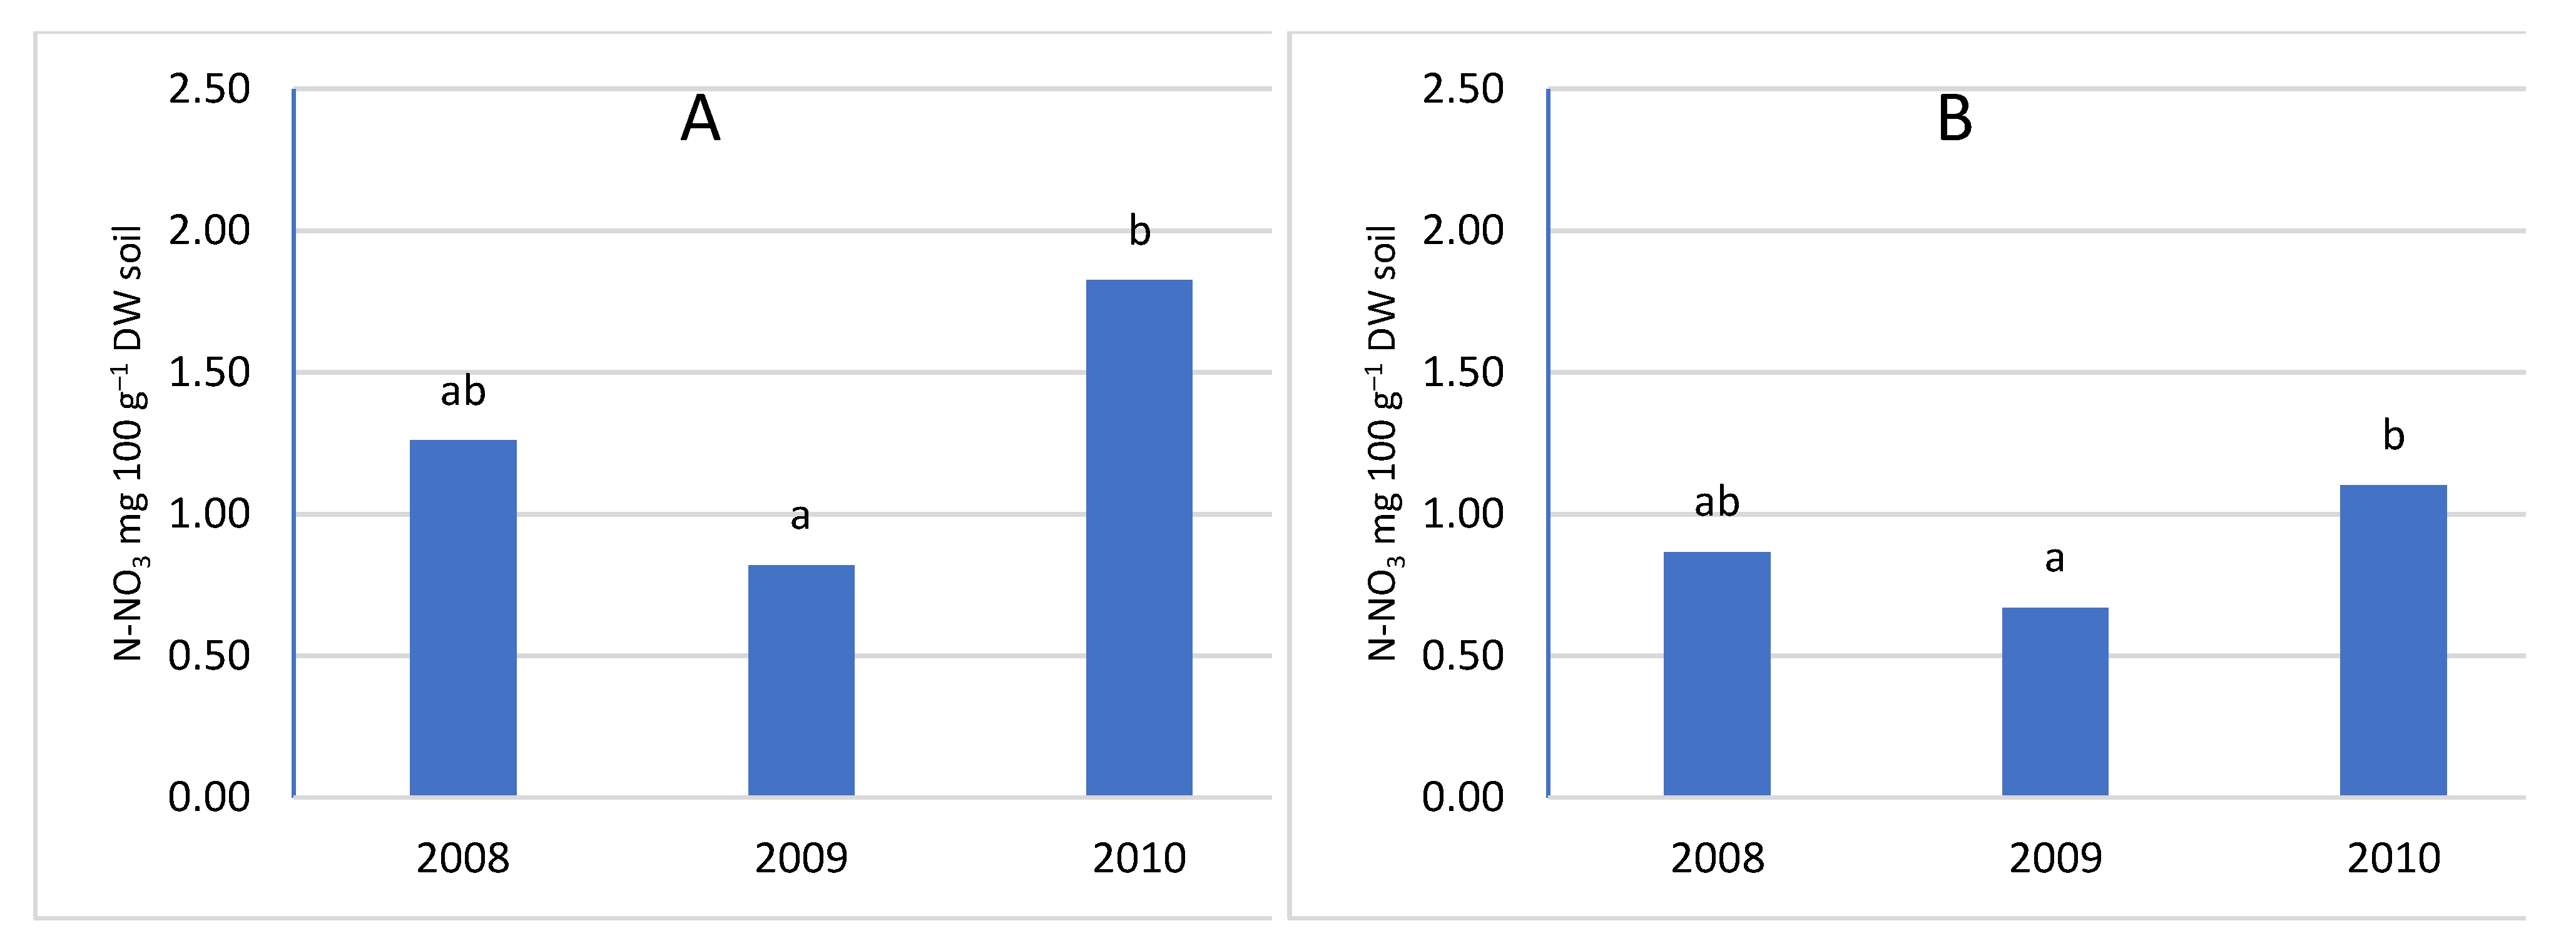
Figure 12.
The content of N-NH4 depending on the orchard A- orchard × soil layer, B- soil layer.
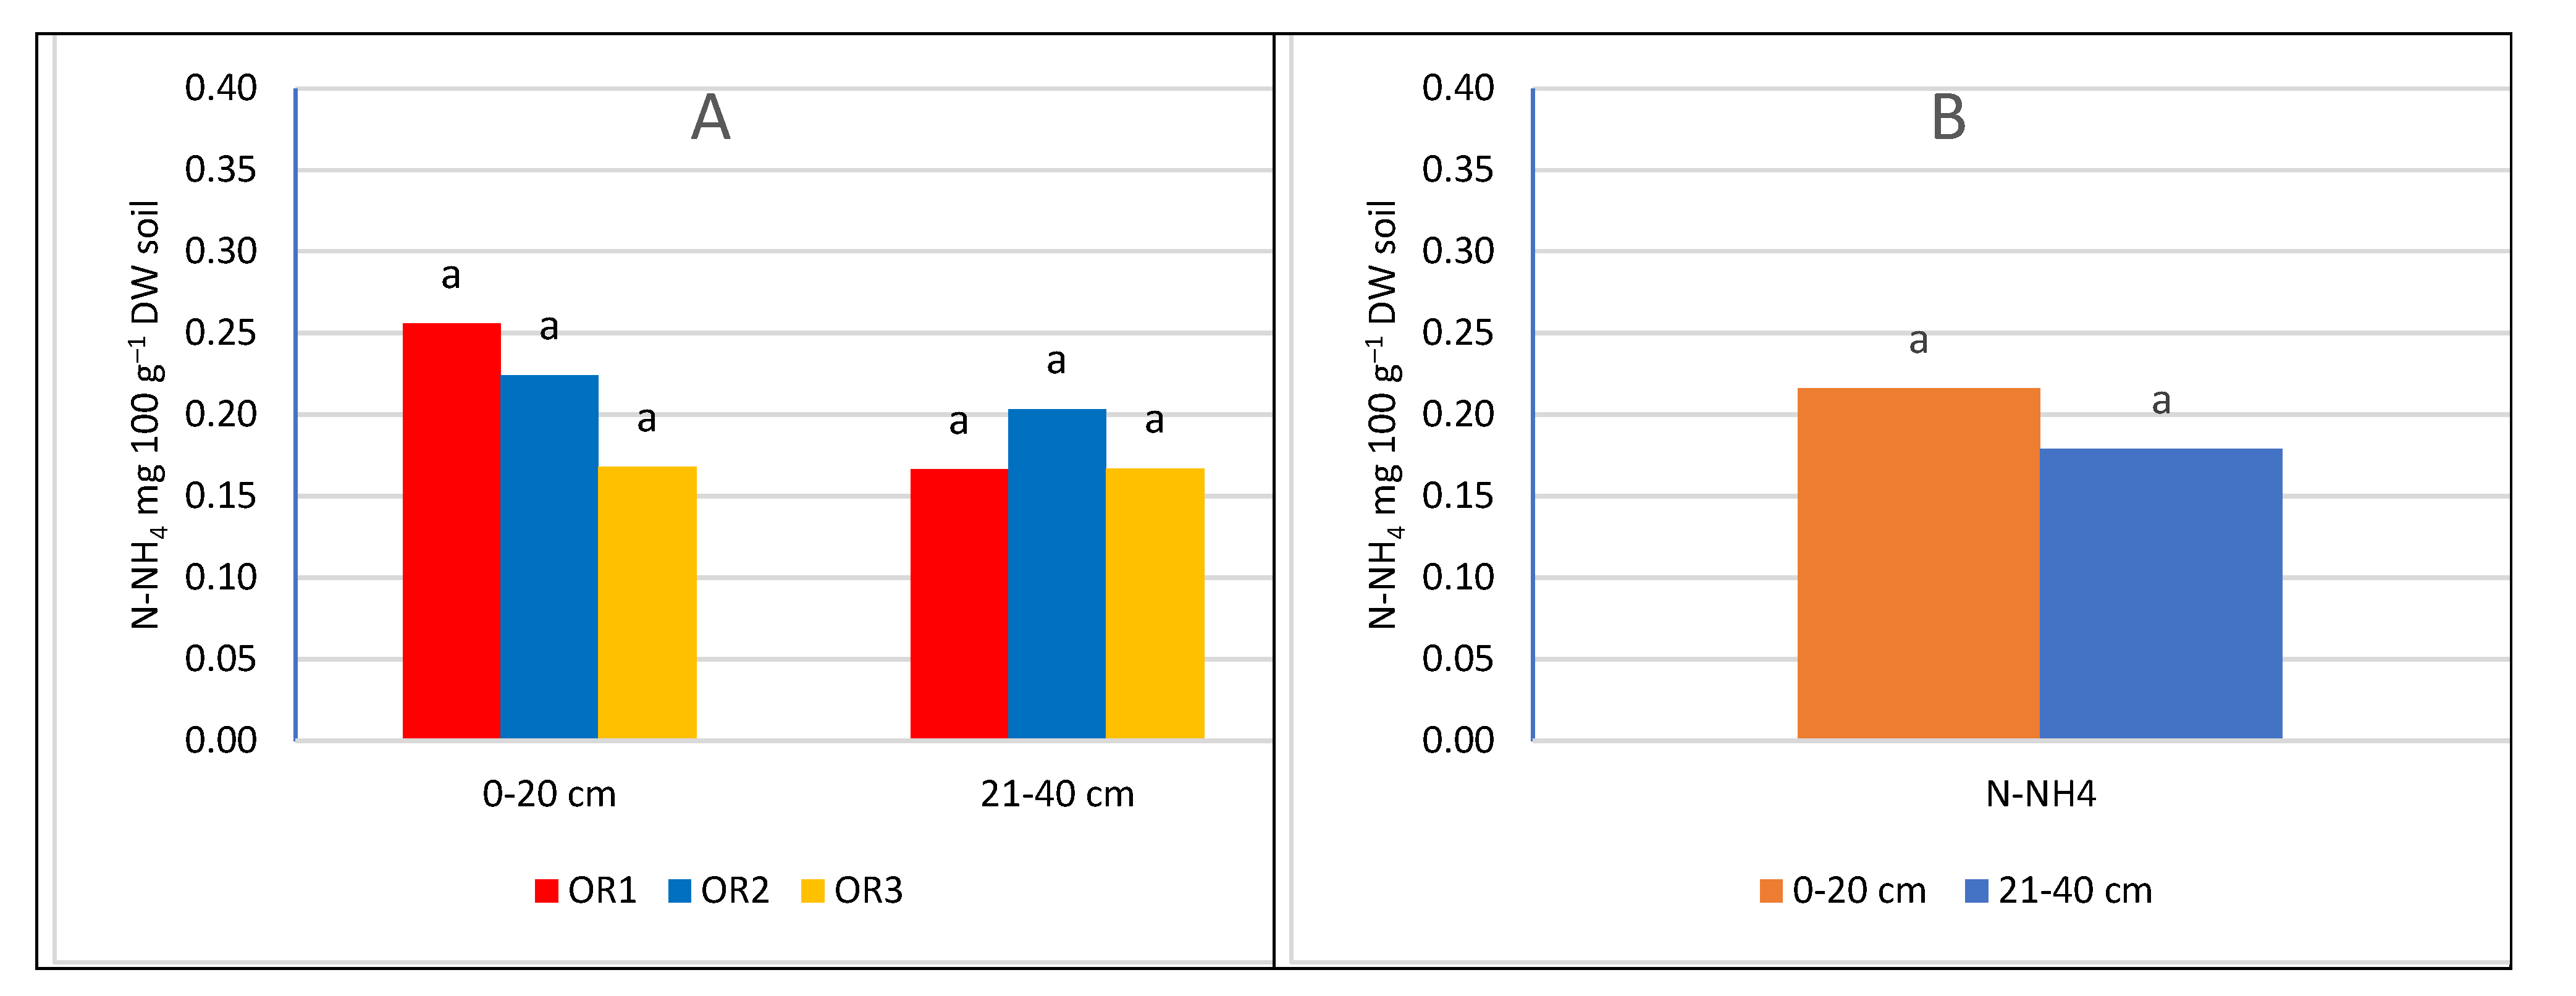
Figure 13.
The content of N-NO3 depending on the A- orchard × soil layer, B- soil layer.
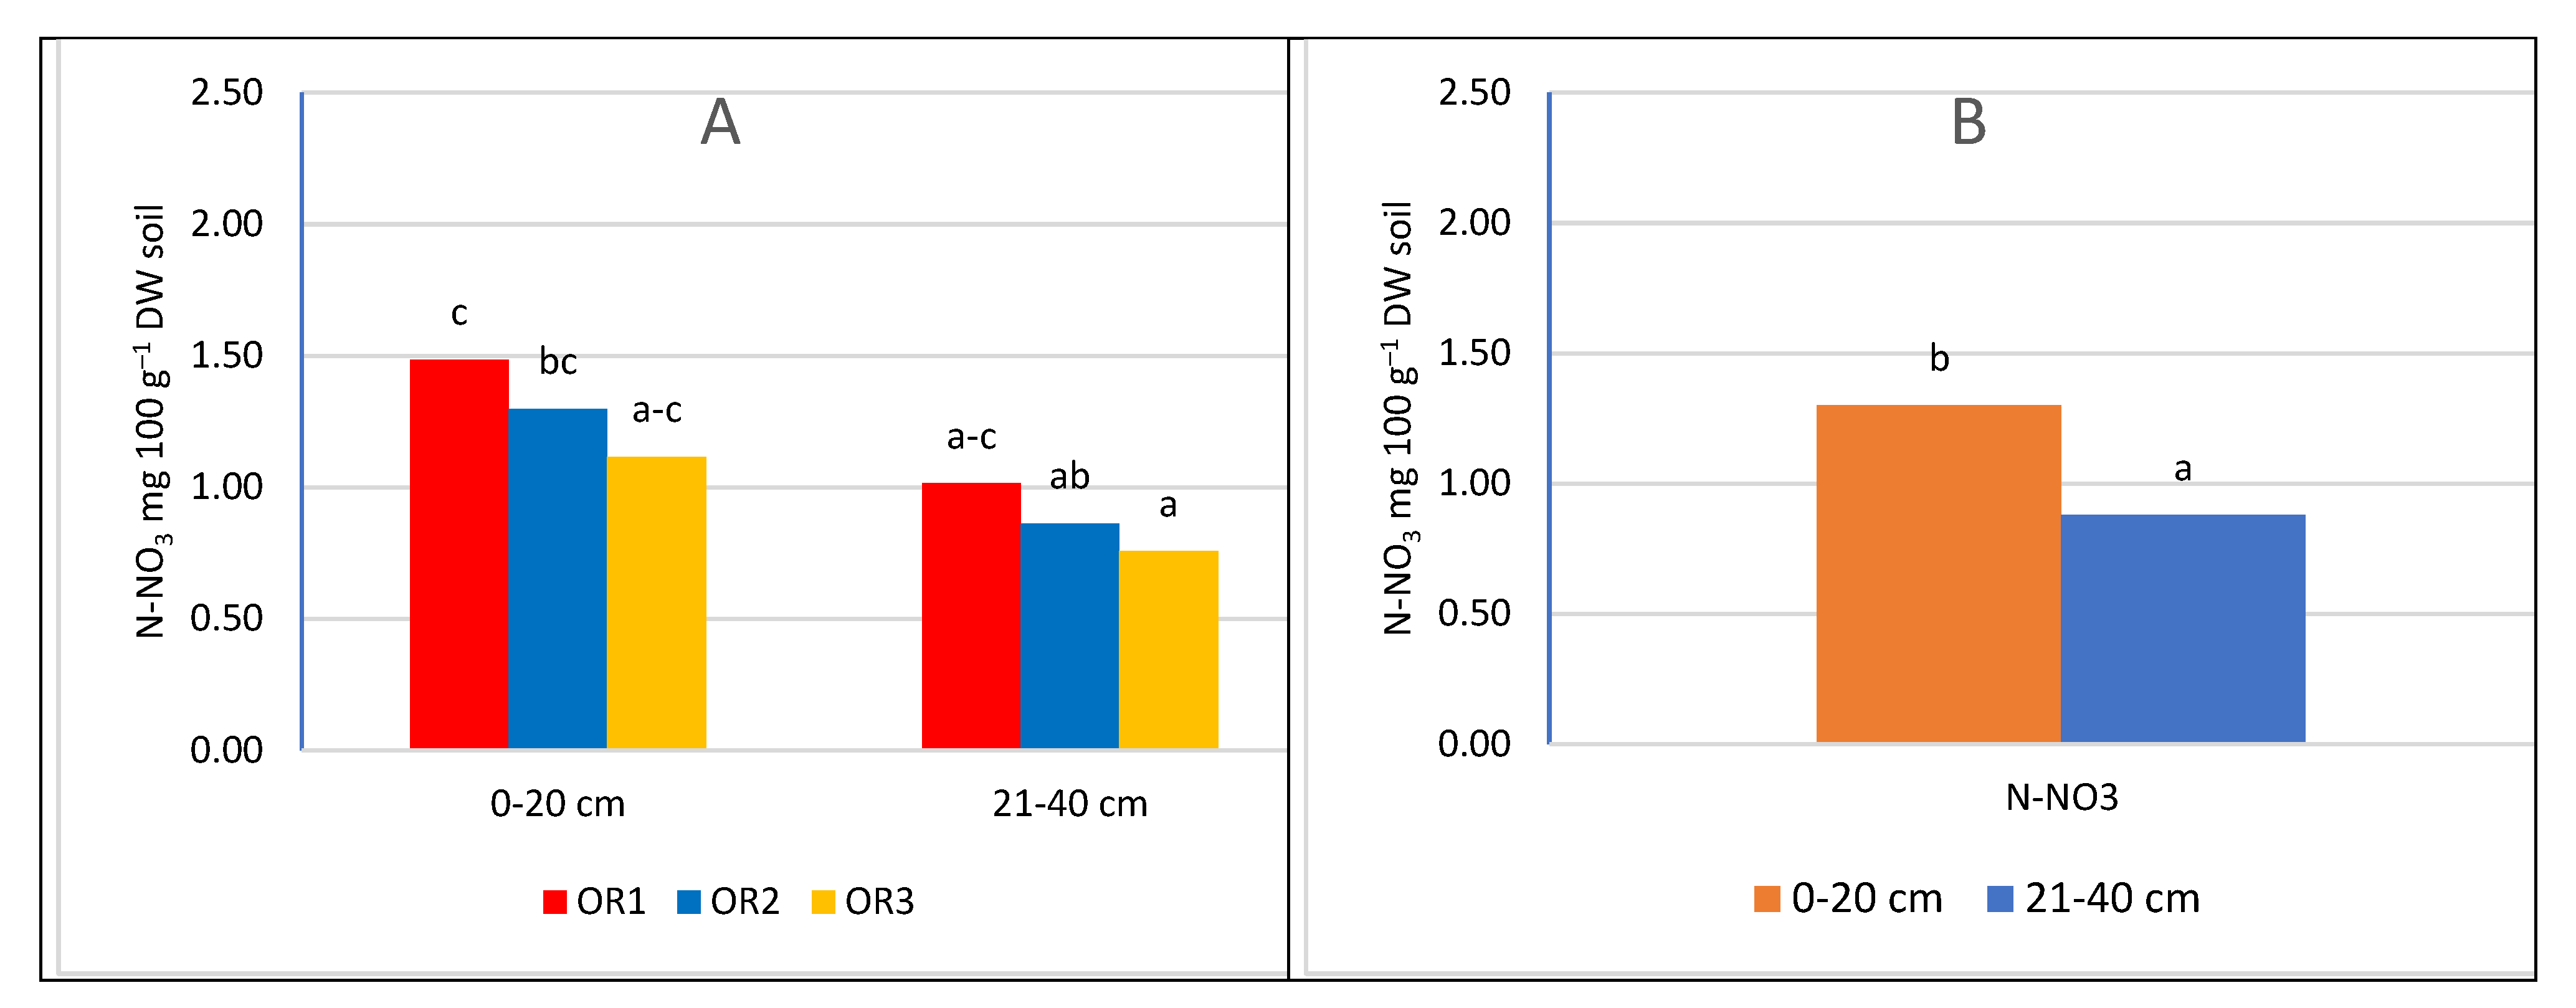
Figure 14.
Effect of nitrogen fertilization on the leaf surface (cm2) and SLW (leaf area per fresh weight) of sour cherries, average for 2012-2013.
Figure 14.
Effect of nitrogen fertilization on the leaf surface (cm2) and SLW (leaf area per fresh weight) of sour cherries, average for 2012-2013.
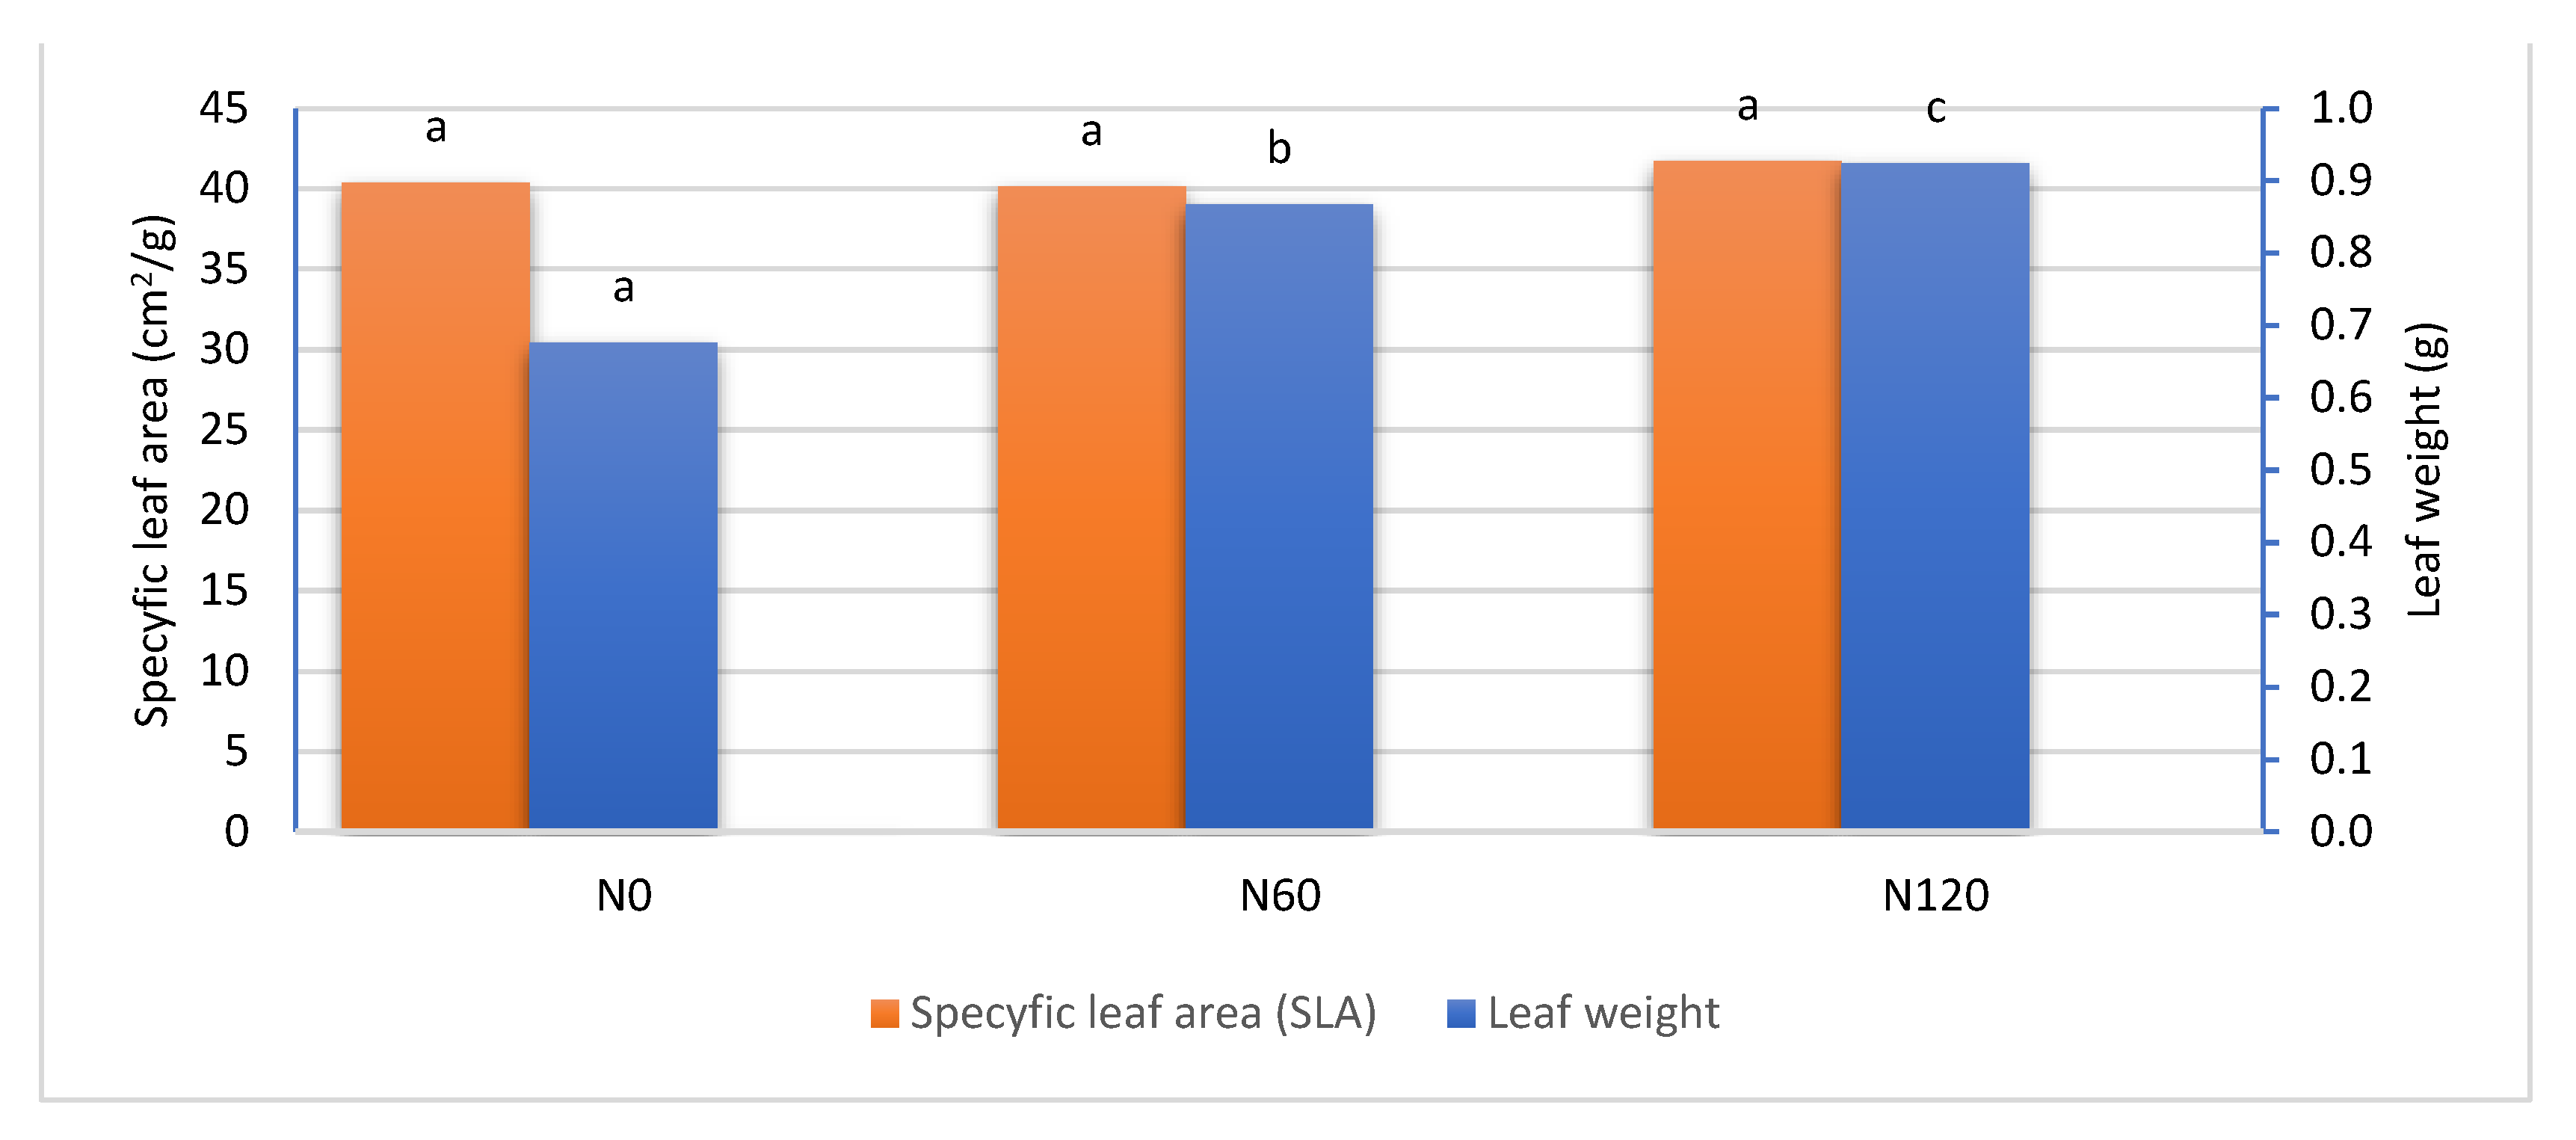
Figure 15.
The content of pigments in the leaves depends on nitrogen fertilization. A- chlorophyll a, B- chlorophyll b, C- chlorophyll a+b, D– Carotenoids.
Figure 15.
The content of pigments in the leaves depends on nitrogen fertilization. A- chlorophyll a, B- chlorophyll b, C- chlorophyll a+b, D– Carotenoids.
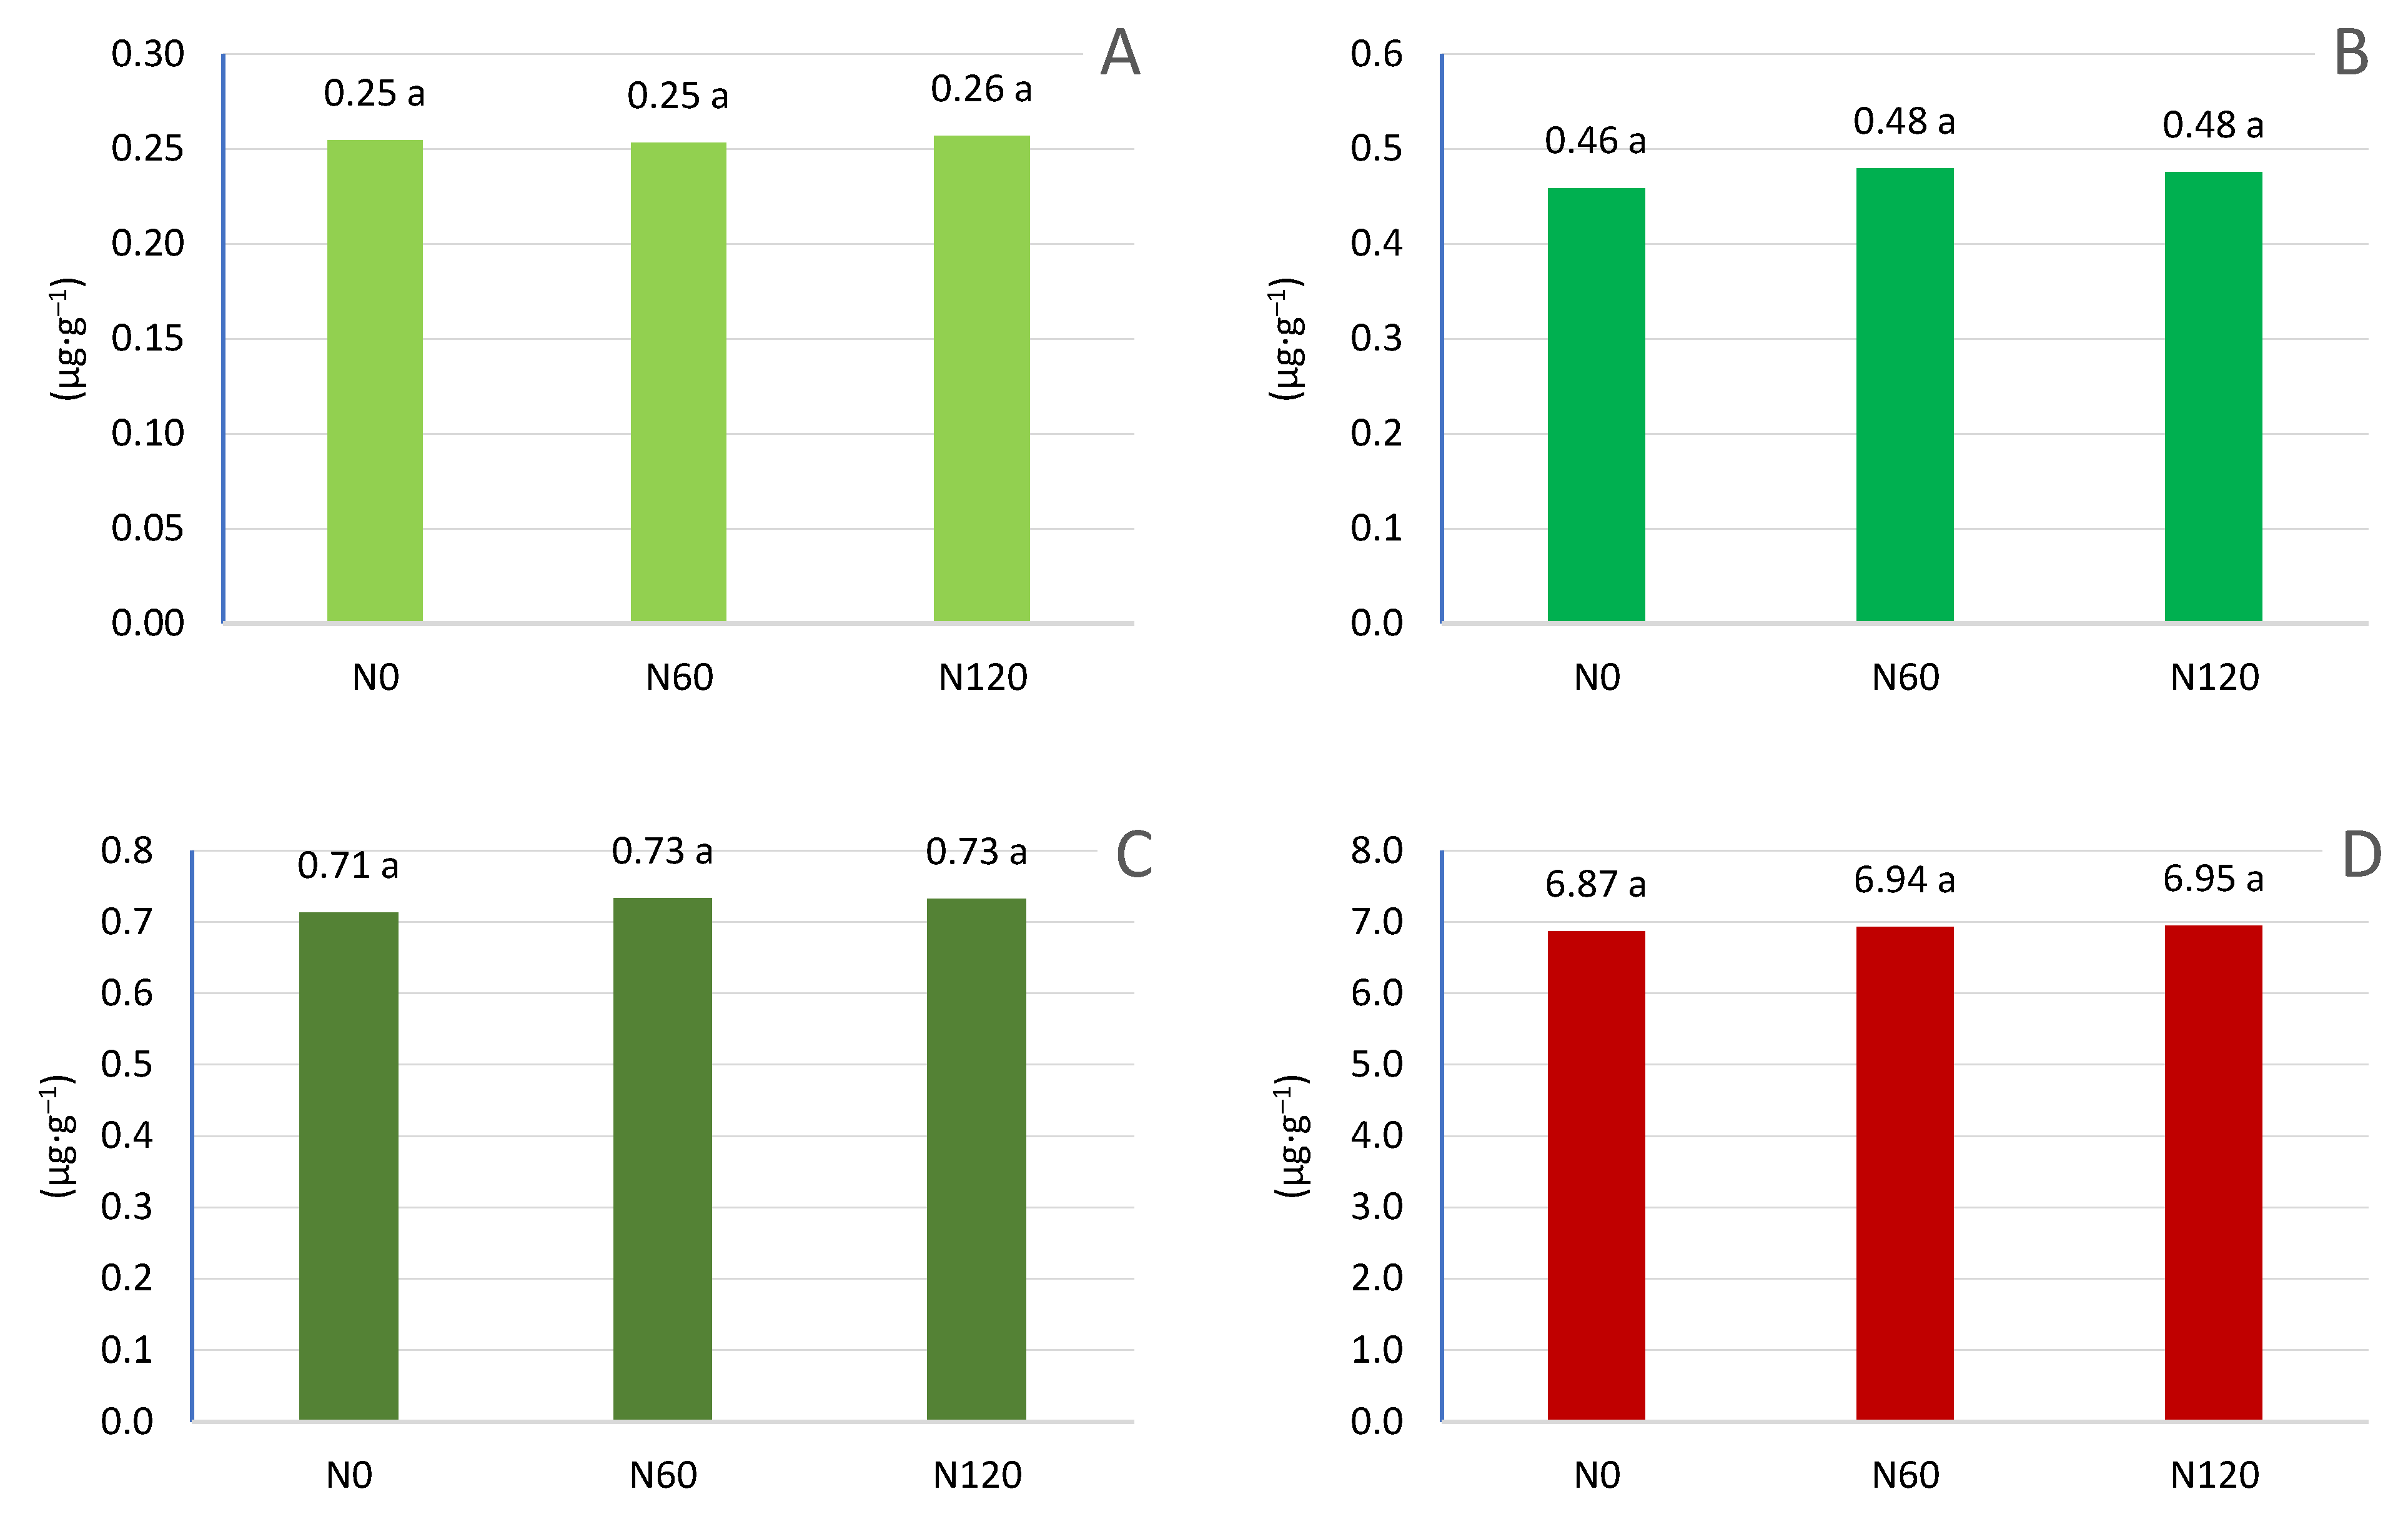
Figure 16.
The content of chlorophyll pigments in the leaves depends on the year of research. A- chlorophyll a, B- chlorophyll b, C- chlorophyll a+b, D- carotenoids.
Figure 16.
The content of chlorophyll pigments in the leaves depends on the year of research. A- chlorophyll a, B- chlorophyll b, C- chlorophyll a+b, D- carotenoids.
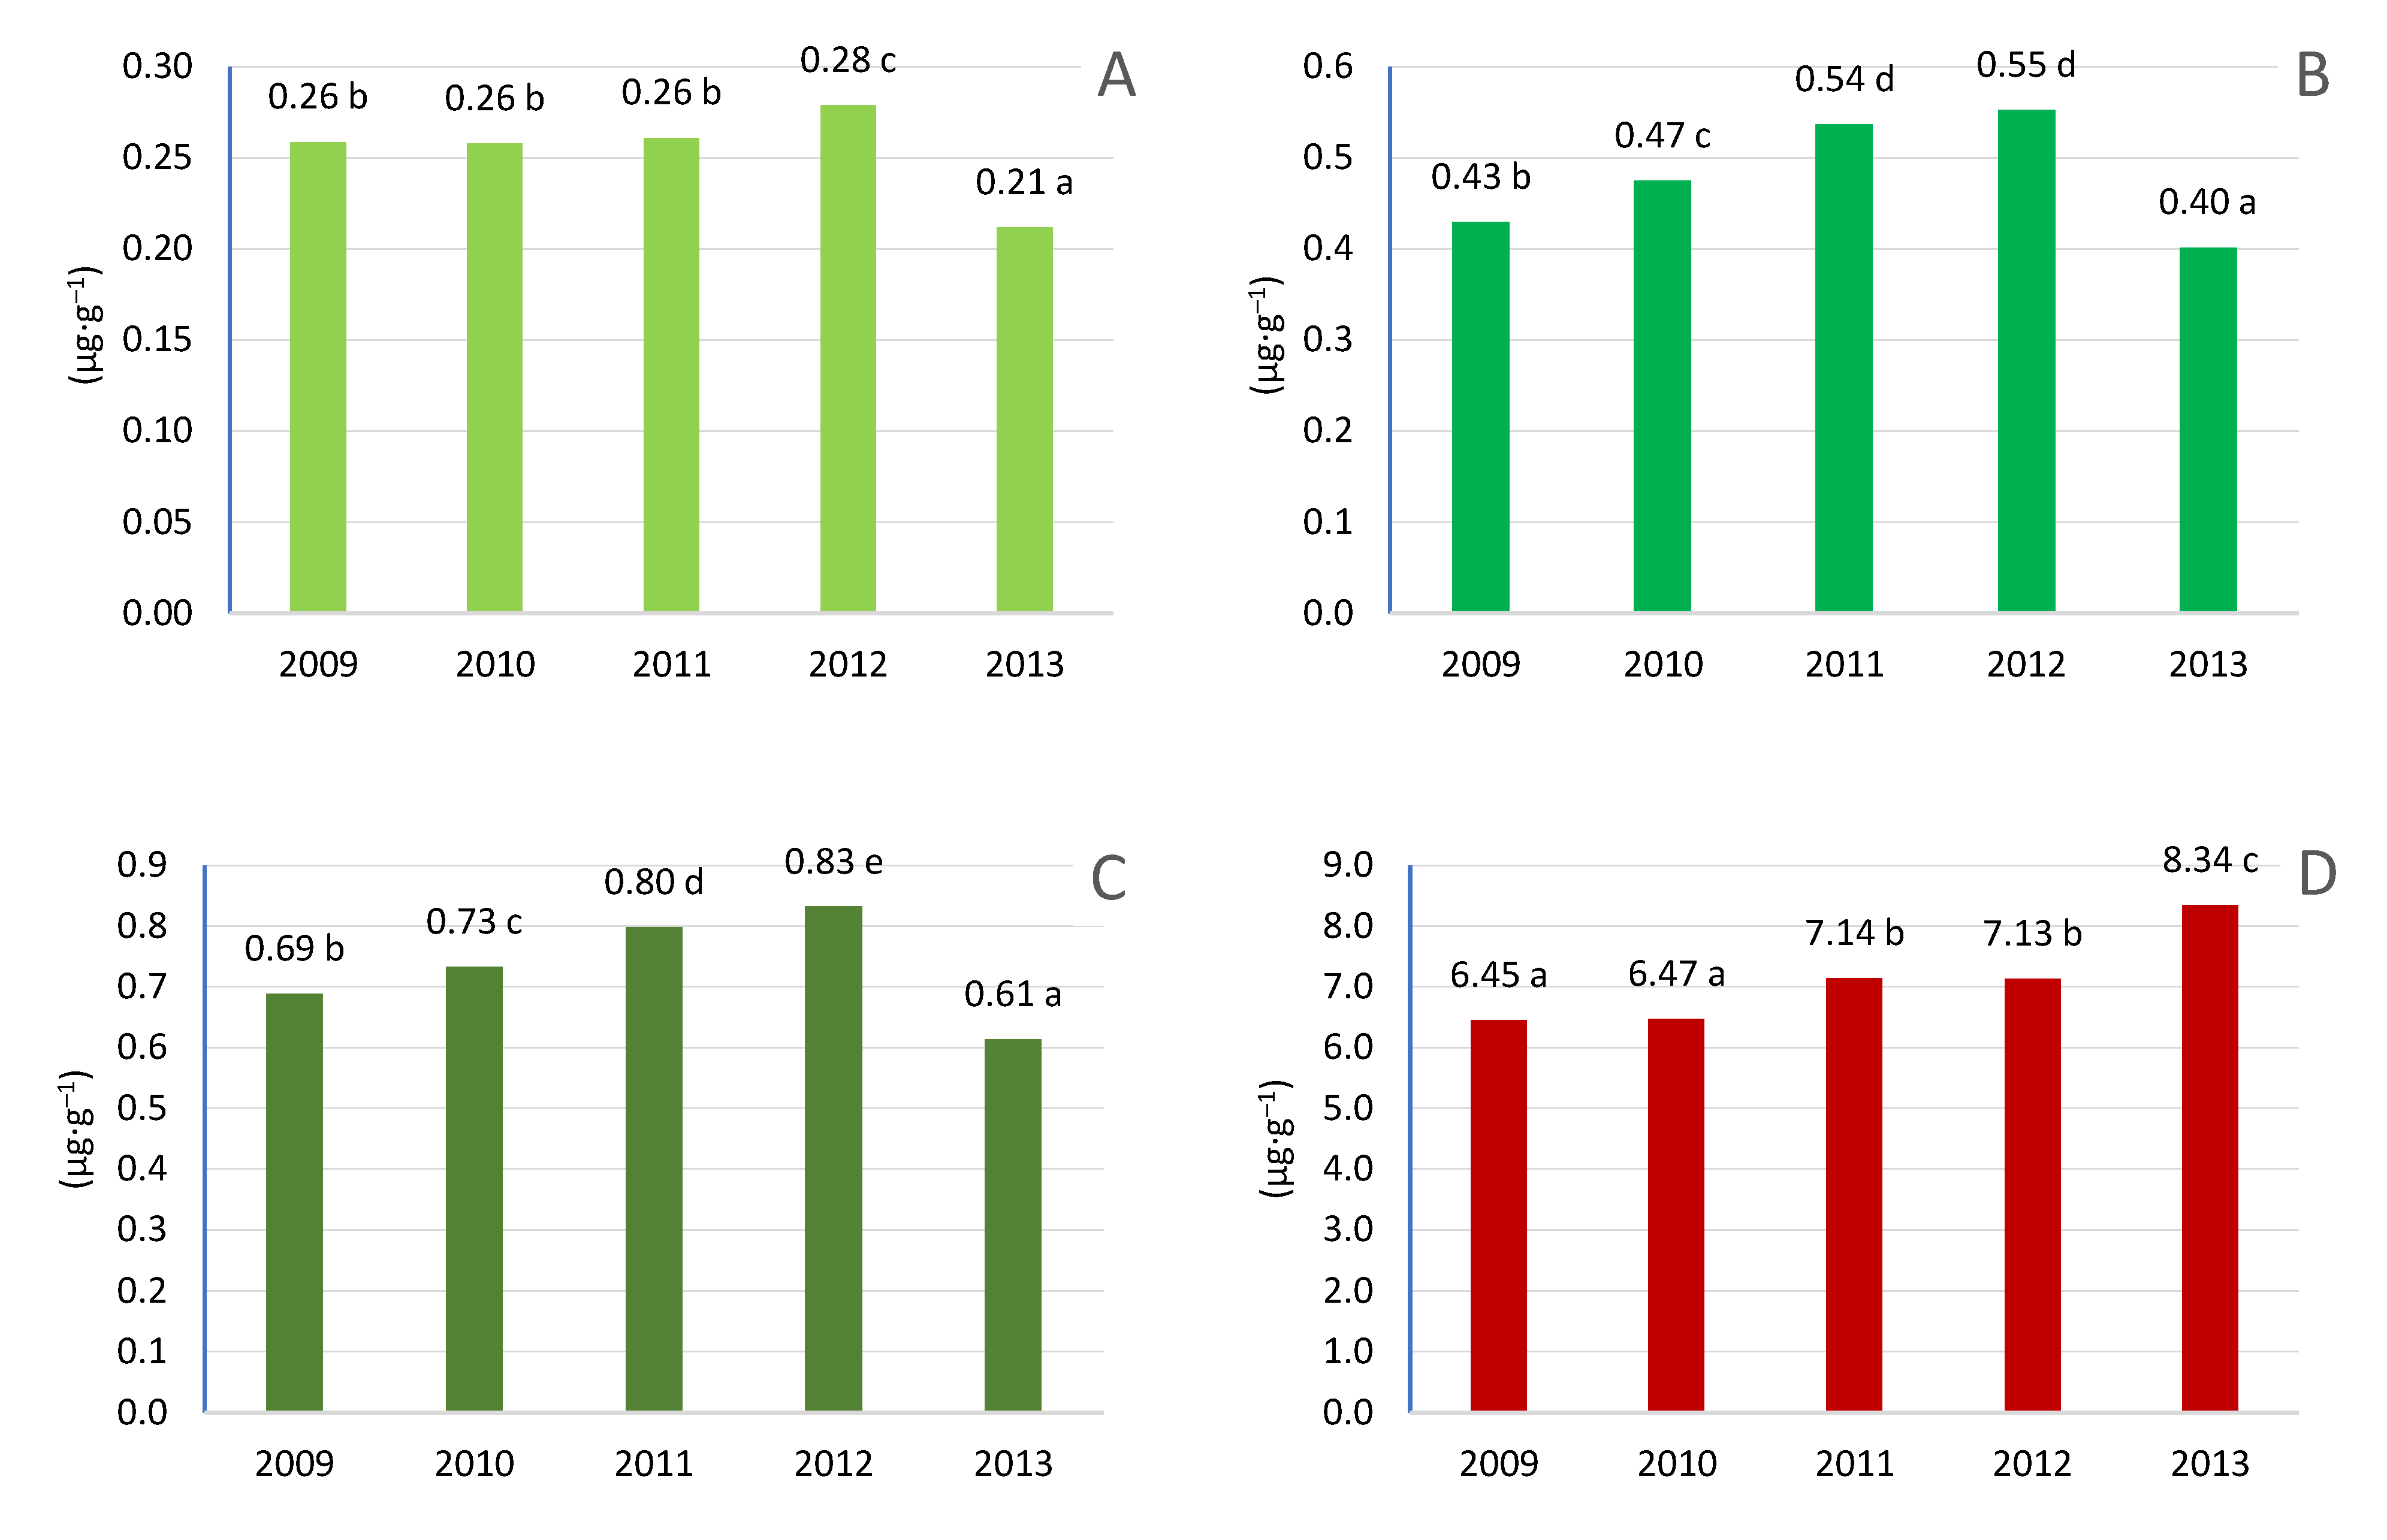
Figure 17.
Effect of precipitation in July on the content of chlorophyll pigments. A- chlorophyll a, B- chlorophyll b, C- chlorophyll a+b, D- carotenoids.
Figure 17.
Effect of precipitation in July on the content of chlorophyll pigments. A- chlorophyll a, B- chlorophyll b, C- chlorophyll a+b, D- carotenoids.
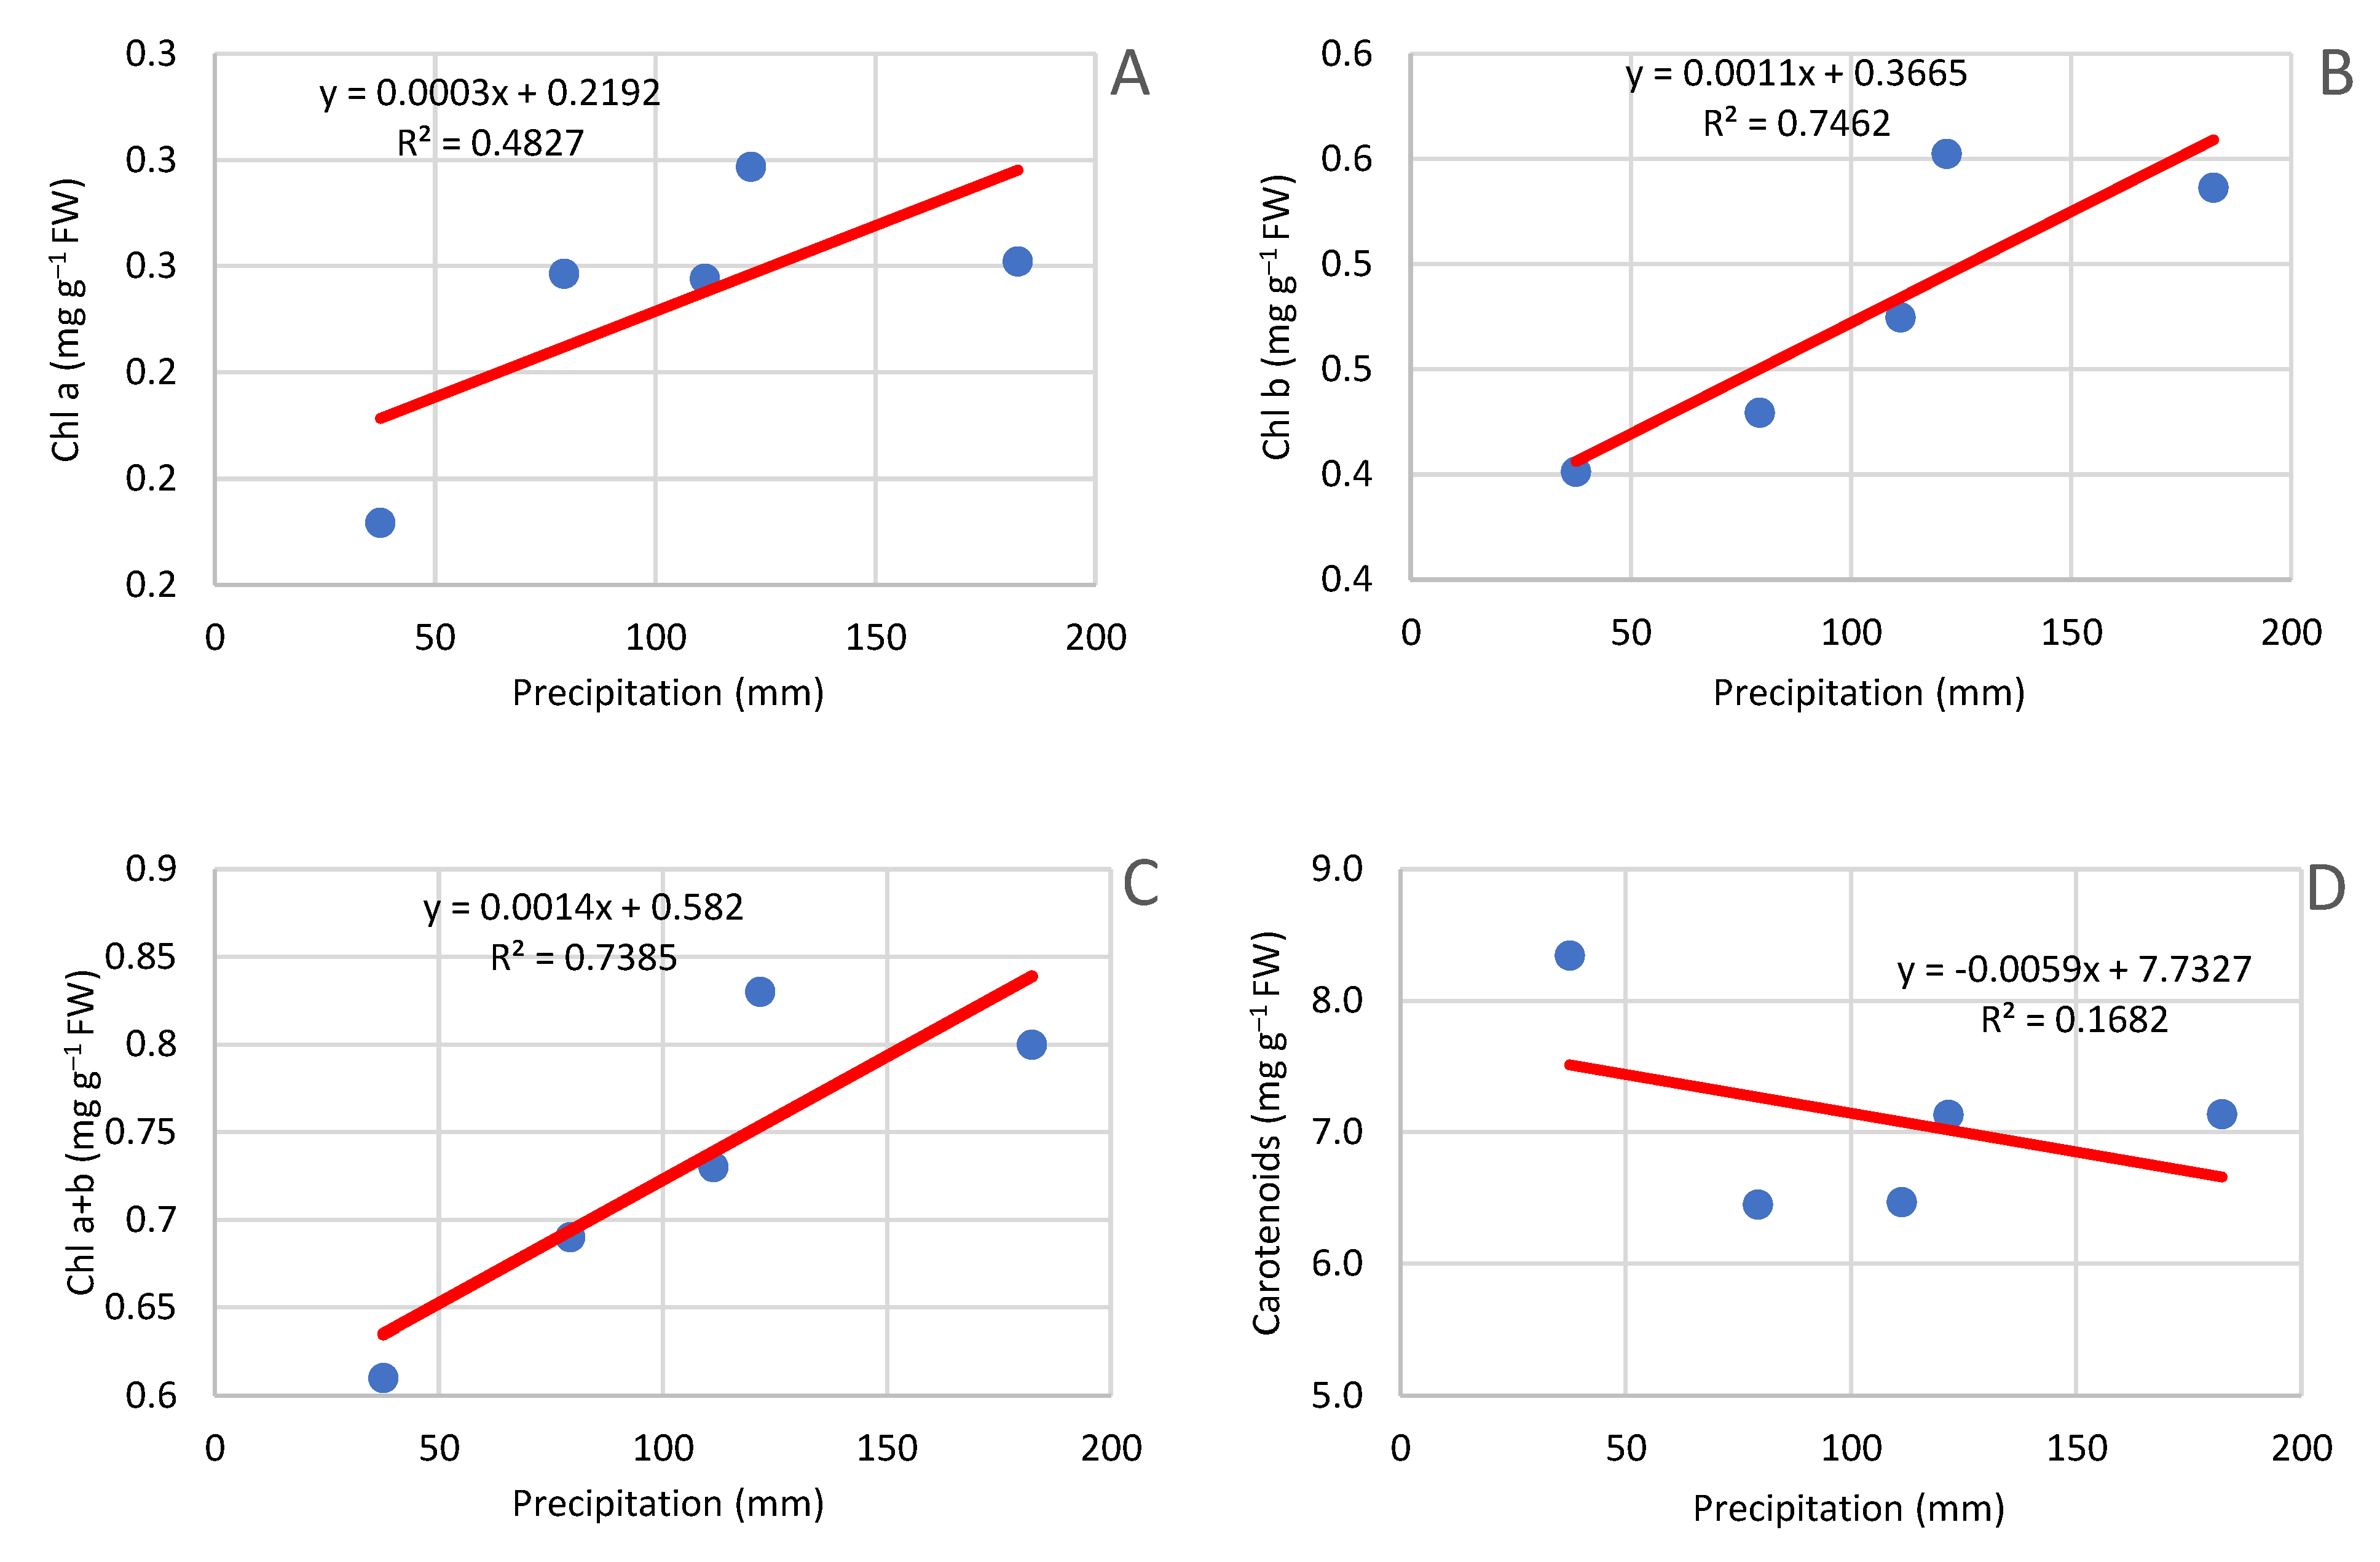

Table 1.
Meteorological conditions in 2008-2013.
| Month | Precipitation (mm) | Temperature (°C) | ||||
| Mean 1982-2007 | Mean 2008-2013 | Change from mean 1982-2007 in % | Mean 1982-2007 | Mean 2008 -2013 | Change from mean 1982-2007 | |
| January | 30.0 | 38.0 | +26 | –0.7 | –1.6 | –0.9 |
| February | 27.7 | 16.3 | –41 | –0.1 | –1.0 | –0.9 |
| March | 34.5 | 29.7 | –14 | 3.5 | 3.0 | –0.5 |
| April | 29.0 | 33.2 | +15 | 9.1 | 10.0 | 0.8 |
| May | 45.9 | 65.6 | +43 | 14.7 | 14.0 | –0.7 |
| June | 61.4 | 69.7 | +14 | 17.2 | 17.3 | 0.1 |
| July | 72.5 | 99.1 | +37 | 19.5 | 19.5 | 0.0 |
| August | 60.5 | 63.8 | +5 | 18.9 | 18.8 | –0.1 |
| September | 41.1 | 47.5 | +16 | 14.1 | 13.9 | -0.2 |
| October | 30.7 | 41.1 | +34 | 9.2 | 8.3 | –0.9 |
| November | 36.0 | 39.1 | +9 | 3.5 | 4.7 | 1.3 |
| December | 39.9 | 39.3 | –2 | 0.5 | -0.4 | –0.9 |
| Total | 509.2 | 609.20 | +14 | 9.1 | 8.9 | –0.2 |
Table 2.
Influence of climatic conditions on ammonia nitrogen content in soil.
| T1 | T2 | T3 | T4 | |||||
|---|---|---|---|---|---|---|---|---|
| 0-20 cm | 21-40 cm | 0-20 | 21-40 | 0-20 | 21-40 | 0-20 | 21-40 | |
| P30 | 0.16 | 0.41* | –0.51* | –0.17 | –0.10 | 0.17 | –0.41* | –0.45* |
| P14 | 0.09 | 0.33* | –0.52* | –0.27* | –0.11 | 0.16 | 0.24* | 0.12 |
| Ts | 0.27* | 0.14 | 0.49* | 0.11 | 0.26* | 0.26* | 0.17 | 0.03 |
| EWT | 0.50* | 0.51* | –0.08 | 0.54* | 0.25* | 0.26* | 0.27* | 0.18 |
| Pds | –0.38* | –0.32* | –0.52* | –0.25* | 0.18 | 0.27* | 0.10 | –0.06 |
| WB | –0.53* | –0.57* | –0.52* | –0.33* | –0.27* | –0.26* | 0.07 | –0.24* |
| Tair | 0.30* | 0.20 | 0.49* | 0.54* | 0.01 | 0.22 | 0.06 | –0.10 |
* Significant levels p < 0.05. Explanations: P30- rainfall 30 days before sampling; P14- rainfall 14 days before sampling; Ts- soil temperature; EWT- evapotranspiration; Pds- precipitation on the day of harvest; WB- water balance; Tair- air temperature.
Table 3.
The influence of nitrogen fertilization on the content of P, K, Mg nutrients and on pH in 2010–2013 in depth 0-20 cm.
Table 3.
The influence of nitrogen fertilization on the content of P, K, Mg nutrients and on pH in 2010–2013 in depth 0-20 cm.
| Orchard | Treatment | mg 100 g–1 DW soil | pH in KCl | ||||||||
|---|---|---|---|---|---|---|---|---|---|---|---|
| P | K | Mg | K/Mg | ||||||||
| OR 1 | N0 | 8.4 | B1 | 8.5 | ab | 13.2 | b | 0.6 | bc | 6.7 | b |
| N60 | 9.5 | c | 7.8 | a | 11.7 | a | 0.7 | c | 6.7 | b | |
| N120 | 9.6 | c | 9.8 | cd | 11.9 | a | 0.8 | de | 6.5 | ab | |
| OR 2 | N0 | 7.1 | a | 7.8 | a | 11.8 | a | 0.7 | c | 6.4 | ab |
| N60 | 8.3 | b | 8.3 | ab | 11.0 | a | 0.8 | d | 6.2 | a | |
| N120 | 8.9 | bc | 10.5 | d | 10.8 | a | 1.0 | f | 6.1 | a | |
| OR 3 | N0 | 11.5 | e | 10.0 | cd | 15.5 | c | 0.9 | e | 6.6 | ab |
| N60 | 9.6 | c | 9.2 | bc | 15.8 | c | 0.5 | a | 6.4 | ab | |
| N120 | 11.8 | e | 13.6 | e | 15.7 | c | 0.6 | ab | 6.4 | ab | |
| Mean for orchard | OR 1 | 9.2 | b2 | 8.7 | a | 12.3 | b | 0.7 | b | 6.6 | b |
| OR 2 | 8.1 | a | 8.9 | a | 11.2 | a | 0.8 | c | 6.2 | a | |
| OR 3 | 11.0 | c | 10.9 | b | 15.6 | c | 0.7 | a | 6.4 | ab | |
| Mean for treatment | N0 | 9.0 | a3 | 8.8 | a | 13.5 | b | 0.7 | b | 6.5 | a |
| N60 | 9.1 | a | 8.4 | a | 12.8 | a | 0.7 | a | 6.4 | a | |
| N120 | 10.1 | b | 11.3 | b | 12.8 | a | 0.8 | c | 6.3 | a | |
1 year × fertilization; the same letters are not significantly different at α = 0.05 (Duncan’s test). 2,3 the orchard and fertilization; The same letters are not significantly different at α = 0.05 (Duncan’s test).
Table 4.
The influence of nitrogen fertilization on the content of P, K, Mg nutrients and on pH in 2010–2013 in depth 21-40 cm.
Table 4.
The influence of nitrogen fertilization on the content of P, K, Mg nutrients and on pH in 2010–2013 in depth 21-40 cm.
| Orchard | Treatment | mg 100 g–1 DW soil | pH in KCl | ||||||||
|---|---|---|---|---|---|---|---|---|---|---|---|
| P | K | Mg | K/Mg | ||||||||
| OR 1 | N0 | 7.4 | cd1 | 5.9 | a | 9.2 | bc | 0.6 | ab | 6.6 | bc |
| N60 | 7.3 | cd | 6.8 | b | 7.8 | a | 0.8 | c-e | 6.7 | c | |
| N120 | 7.6 | cd | 7.7 | c | 7.9 | a | 0.9 | ef | 6.7 | c | |
| OR 2 | N0 | 5.3 | a | 8.7 | d | 9.8 | b-d | 0.9 | ef | 6.0 | a |
| N60 | 6.4 | b | 7.7 | c | 9.0 | b | 0.9 | d-f | 6.2 | ab | |
| N120 | 7.2 | bc | 7.6 | c | 8.0 | a | 0.9 | f | 6.3 | a-c | |
| OR 3 | N0 | 8.2 | d | 8.3 | cd | 11.5 | e | 0.7 | bc | 6.2 | ab |
| N60 | 6.3 | b | 6.5 | ab | 10.5 | d | 0.6 | a | 6.5 | bc | |
| N120 | 9.3 | e | 7.6 | c | 10.2 | cd | 0.8 | cd | 6.4 | a-c | |
| Mean for orchard | OR 1 | 7.4 | b2 | 6.8 | a | 8.3 | a | 0.8 | b | 6.7 | b |
| OR 2 | 6.3 | a | 8.0 | c | 9.0 | b | 0.9 | c | 6.2 | a | |
| OR 3 | 7.9 | b | 7.5 | b | 10.7 | c | 0.7 | a | 6.4 | a | |
| Mean for treatment | N0 | 7.0 | a3 | 7.6 | b | 10.2 | b | 0.8 | a | 6.3 | a |
| N60 | 6.7 | a | 7.0 | a | 9.1 | a | 0.7 | a | 6.5 | a | |
| N120 | 8.0 | b | 7.7 | b | 8.7 | a | 0.9 | b | 6.5 | a | |
1 year × fertilization; the same letters are not significantly different at α = 0.05 (Duncan’s test). 2,3 the orchard and fertilization; the same letters are not significantly different at α = 0.05 (Duncan’s test).
Table 5.
Effect of nitrogen fertilization on component content in leaves, depending on tree age (mean values from 2010–2013).
Table 5.
Effect of nitrogen fertilization on component content in leaves, depending on tree age (mean values from 2010–2013).
| Orchard | Treatment | Nutrient content (% DW) | |||||||||
|---|---|---|---|---|---|---|---|---|---|---|---|
| N | P | K | Ca | Mg | |||||||
| OR 1 | N0 | 2.14 | b1 | 0.31 | e | 1.63 | d | 2.73 | f | 0.45 | ab |
| N60 | 2.36 | d | 0.18 | ab | 1.24 | bc | 2.71 | f | 0.48 | bc | |
| N120 | 2.65 | f | 0.17 | a | 1.43 | c | 2.39 | de | 0.43 | a | |
| OR 2 | N0 | 1.96 | a | 0.28 | d | 1.08 | ab | 2.01 | a | 0.52 | de |
| N60 | 2.18 | bc | 0.22 | c | 1.06 | ab | 2.22 | b-d | 0.55 | ef | |
| N120 | 2.30 | cd | 0.19 | ab | 1.02 | ab | 2.13 | ab | 0.50 | cd | |
| OR 3 | N0 | 1.99 | a | 0.28 | d | 1.10 | ab | 2.17 | a-c | 0.55 | ef |
| N60 | 2.18 | bc | 0.20 | b | 0.89 | a | 2.44 | e | 0.58 | f | |
| N120 | 2.51 | e | 0.17 | ab | 0.95 | a | 2.34 | c-e | 0.52 | de | |
| Mean for orchard | OR 1 | 2.39 | b2 | 0.22 | a | 1.43 | b | 2.61 | c | 0.45 | a |
| OR 2 | 2.14 | a | 0.23 | a | 1.06 | a | 2.12 | a | 0.52 | b | |
| OR 3 | 2.23 | a | 0.22 | a | 0.98 | a | 2.32 | b | 0.55 | c | |
| Meant for treatment | N0 | 2.03 | a3 | 0.29 | c | 1.27 | b | 2.30 | a | 0.51 | a |
| N60 | 2.24 | b | 0.20 | b | 1.06 | a | 2.46 | b | 0.53 | b | |
| N120 | 2.49 | c | 0.17 | a | 1.13 | a | 2.29 | a | 0.48 | a | |
1 year × fertilization; the same letters are not significantly different at α = 0.05 (Duncan’s test). 2,3 the orchard and fertilization; the same letters are not significantly different at α = 0.05 (Duncan’s test).
Table 6.
Influence of climatic conditions and soil mineral content on leaf content.
| N | P | K | Ca | Mg | |
|---|---|---|---|---|---|
| T | 0.01 | 0.09 | 0.52* | -0.66* | -0.61* |
| T max. | -0.06 | 0.12 | 0.55* | -0.68* | -0.62* |
| T min. | 0.18 | -0.17 | -0.45* | 0.55* | 0.50* |
| Precipitation | 0.01 | 0.08 | 0.52* | -0.65* | -0.61* |
| ET | 0.09 | -0.14 | -0.54* | 0.67* | 0.62* |
| BW | 0.21* | -0.18 | -0.39* | 0.46* | 0.42* |
| N-NO3 (0-20 cm) | 0.53* | -0.08 | -0.05 | -0.07 | -0.16 |
| Total N (0-20 cm) | 0.53* | -0.02 | -0.01 | -0.09 | -0.18 |
| N-NO3 (20-40 cm) | 0.58* | -0.19* | 0.00 | -0.04 | -0.20* |
| Total N (20-40 cm) | 0.60* | -0.20* | -0.03 | -0.04 | -0.19 |
| P (0-20 cm) | 0.31* | -0.02 | 0.23* | -0.19 | -0.06 |
| K (0-20 cm) | 0.40* | -0.17 | -0.09 | 0.02 | 0.21* |
| Mg (0-20 cm) | -0.05 | 0.08 | 0.10 | 0.04 | 0.15 |
| K/Mg (0-20 cm) | 0.28* | -0.09 | -0.13 | -0.09 | 0.09 |
| P (20-40 cm) | 0.43* | -0.01 | 0.31* | -0.17 | -0.37* |
| K (20-40 cm) | 0.24* | -0.10 | -0.18 | -0.02 | 0.15 |
| Mg (20-40 cm) | -0.22* | 0.21* | -0.07 | -0.01 | 0.39* |
| K/Mg (20-40 cm) | 0.38* | -0.22* | -0.05 | -0.02 | -0.19 |
* Significant levels p < 0.05. T- average temperature of vegetation period, Tmax - average maximum temperature of vegetation period, Tmin. - average minimum temperature of vegetation period, ET – evapotranspiration, BW – water balance.
Table 7.
The influence of nitrogen fertilization on cherry growth in 2007-2013.
| Orchard | Treatment | Leaf area (cm2) | TCSA | ||||||
|---|---|---|---|---|---|---|---|---|---|
| 2007 | 2013 | Increase 2007-2013 | |||||||
| OR 1 | N0 | 29.0 | a1 | 56.5 | b | 84.1 | bc | 27.7 | ab |
| N60 | 34.1 | bc | 68.0 | c | 102.4 | d | 34.4 | a-d | |
| N120 | 34.7 | bc | 54.9 | b | 92.1 | c | 37.2 | b-d | |
| OR 2 | N0 | 28.0 | a | 43.5 | a | 69.3 | a | 25.9 | a |
| N60 | 32.8 | b | 46.8 | a | 78.0 | ab | 31.2 | a-c | |
| N120 | 34.9 | bc | 46.7 | a | 88.6 | c | 41.9 | d | |
| OR 3 | N0 | 28.7 | a | 41.5 | a | 72.2 | a | 30.8 | a-c |
| N60 | 32.6 | b | 43.1 | a | 78.7 | ab | 35.6 | a-d | |
| N120 | 36.3 | c | 39.7 | a | 77.9 | ab | 38.2 | cd | |
| Mean for orchard | OR 1 | 32.6 | a2 | 59.8 | c | 92.9 | b | 33.1 | a |
| OR 2 | 31.9 | a | 45.7 | b | 78.7 | a | 33.0 | a | |
| OR 3 | 32.5 | a | 41.4 | a | 76.3 | a | 34.9 | a | |
| Mean for treatment | N0 | 28.6 | a3 | 47.1 | a | 75.2 | a | 28.1 | a |
| N60 | 33.2 | b | 52.6 | b | 86.4 | b | 33.8 | b | |
| N120 | 35.3 | c | 47.1 | a | 86.2 | b | 39.1 | c | |
1 year × fertilization; the same letters are not significantly different at α = 0.05 (Duncan’s test). 2,3 the orchard and fertilization; the same letters are not significantly different at α = 0.05 (Duncan’s test).
Disclaimer/Publisher’s Note: The statements, opinions and data contained in all publications are solely those of the individual author(s) and contributor(s) and not of MDPI and/or the editor(s). MDPI and/or the editor(s) disclaim responsibility for any injury to people or property resulting from any ideas, methods, instructions or products referred to in the content. |
© 2023 by the authors. Licensee MDPI, Basel, Switzerland. This article is an open access article distributed under the terms and conditions of the Creative Commons Attribution (CC BY) license (http://creativecommons.org/licenses/by/4.0/).
Copyright: This open access article is published under a Creative Commons CC BY 4.0 license, which permit the free download, distribution, and reuse, provided that the author and preprint are cited in any reuse.


