
Submitted:
31 December 2022
Posted:
09 January 2023
You are already at the latest version
Abstract
This study aimed to evaluate the level of skill in observing teaching competency in pre-service physical education (PE) teachers and provide basic data to cultivate teaching competency. A total of 21 third-year pre-service PE teachers were selected as participants. The study derived descriptive statistics to analyze the participants’ observation skills regarding teaching competency in different class stages using evaluation results of class demonstrations by pre-service teachers. Mann–Whitney U test was conducted to verify the statistical significance of the evaluation between in-service and pre-service teachers. Compared with in-service teachers, pre-service teachers reported high agreement with intuitive teaching behaviors. However, pre-service teachers indicated low agreement with skills that required complex teaching behaviors depending on various situations. Based on theories by Schon (1983), pre-service teachers showed high “knowledge for practice” and low “knowledge in practice.” Thus, pre-service education must balance practical knowledge and theory rather than focus on theory-based education. This study provided directions for pre-service teacher education to enhance the competency of pre-service teachers for leading and analyzing classes.
Keywords:
pre-service teacher education
; teacher evaluation
; pre-service physical education teacher
; class demonstration
; teaching behavior analysis
1. Introduction
The purpose of pre-service teacher education is to nurture teachers with practical teaching expertise who can guide students in school. In the area of physical education (PE), which mainly consists of physical activities, teaching is commonly conducted in various environments, such as school fields and gymnasiums, depending on the class contents. Therefore, teacher education must be conducted to accurately realize the purpose of education based on various factors, such as physical activity, learning environment, and learners [1]. In pre-service teacher education, training for the cultivation of practical teaching ability is limited to conducting class demonstrations in courses consisting of PE teaching methods, textbook research, and teaching methods. In the absence of mandatory practice and regulations, such training has not always been provided. Class demonstration is an effective way to enhance the practical teaching capacity of pre-service teachers, and research on class demonstrations in pre-service PE teacher education has shown their various educational meanings.
Zach, Harari, and Harari [2] reported that class demonstrations based on pre-service teacher education help develop sufficient knowledge and teaching capabilities necessary to run classes in schools. Similarly, Kim [3] showed that self-reflection of class demonstrations in pre-service PE teachers enable understanding of problems and teaching philosophy of PE. Jeon et al. [4] observed that pre-service PE teachers develop competencies to understand the use of documents, such as lesson plans and curricula, through reflection activities of class demonstrations. Saban and Çoklar [5] reported that through micro-teaching, pre-service teachers can identify the strengths and weaknesses of their teaching behavior by reflecting on the use of various teaching tools, lesson planning, and timing.
Ryu [6] showed that self-class evaluation using video demonstrations and reflective activities helps pre-service teachers find and improve problems in teaching activities and gain confidence. Indeed, teacher evaluation of class demonstrations by pre-service PE teachers involves reflecting on evaluation results, which identify problems with various teaching behaviors, such as inefficient presentation of assignments, lack of communication skills with students, and lack of student evaluation [7]. In a study on planning and implementation of class demonstrations by pre-service teachers, Park and Choi [8] suggested the need for an evaluation system that can accurately analyze and interpret the causes of positive and negative behaviors as well as identify practical knowledge levels.
Based on these findings, class demonstrations help pre-service teachers reflect on the process of planning and operating classes and improve their teaching competency. In particular, simultaneous evaluation of teaching and reflective activities effectively improves the quality of classes by further improving teaching competency. Reflective activities have positive effects on class demonstration; opportunities to understand and improve problems through objective evaluation allow professional evaluation of teaching competency according to systematic standards [9,10]. Therefore, evaluation of pre-service teachers’ class demonstrations is an effective educational method to cultivate teaching competency for the successful management of classes in school [11].
Since the 1970s, studies have evaluated teaching behaviors to analyze those teaching behaviors that improve class efficiency. This has been achieved by developing and analyzing valid and reliable teaching performance evaluation factors [12,13]. Systematic analysis methods on events related to teacher feedback, student–teacher interaction, and student learning participation time have been actively pursued. Systematic observational analysis is to observe, record, and analyze interaction behaviors with confidence in the degree of agreement between observers according to the guidelines and procedures presented in the same event [14]. Previously, Rink and Werner [15] developed the Qualitative Measures of Teaching Performance Scale (QMTPS) to seek qualitative improvement in teaching competency by analyzing the type of task, task presentation, student response to the task, and teacher behavior through feedback. Studies on teaching behavior analysis have enhanced teaching behavior efficiency and PE teaching competency [16].
However, as teaching behavior analysis has focused on selected elements, had poor utilization potential owing to the complicated process of evaluating and calculating results, and required expert evaluations, its use has gradually decreased over time [17]. Moreover, it had difficulties in assessing motor, cognitive, and affective domains, which are important goals of school education [9]. Thus, to overcome these limitations, studies have sought different ways for comprehensive analysis of teaching behavior.
For instance, NASPE [18] has presented conceptual definitions of each evaluation item and developed a tool to effectively evaluate the teaching expertise of PE teachers. SHAPE America [19] and NBPTS [20] suggested that qualification standards for PE teachers must specifically present the detailed contents of teacher’s responsibilities. A team of researchers developed a scale, called Self-Evaluation of Teacher Effectiveness Questionnaire in Physical Education, consisting of 25 questions in six domains that state values in improving teachers’ knowledge, understanding, motivation, and belief in education [20]. As such, experts are actively developing tools for teacher evaluation.
However, most evaluation tools are limited in that they only present directions or fail to present evaluation results for actual classes. Furthermore, the lack of clear evaluation criteria increases the risk of subjective evaluation by the evaluator. Teacher evaluation cannot rely on teachers’ experience and knowledge; it must be conducted according to objective and valid criteria for professional analysis [22].
In a recent study, Kim [1] developed a teaching competency evaluation tool for PE teachers and evaluated classes led by PE teachers. Kim analyzed the teaching competency by sex and experience to evaluate the applicability of the developed tool. However, most studies on teacher evaluation are focused on evaluating the teaching competency of PE teachers. meanwhile, research on developing teaching competency evaluation tools or evaluating the performance of pre-service PE teachers—who need practical teaching experience—is lacking. Teacher evaluation requires the analysis of data on teaching as a process, teaching methods, and teacher knowledge, as well as the use of adequate evaluation tools. Such evaluation of teaching competency cannot be achieved in a short period of time; rather, it must be systematically learned to acquire professional abilities [17]. Therefore, studies must be conducted to evaluate the teaching competency of pre-service teachers, identify exact problems, and seek improvements.
Our study aimed to evaluate class demonstrations conducted by pre-service PE teachers and identify their level of practical teaching knowledge. We selected videos of class demonstrations by pre-service PE teachers conducted in PE teaching method and evaluated these using the teaching competency evaluation tool developed by Kim and Kwak [23]. Specifically, we aimed to compare the evaluation results of pre-service PE teachers and field teachers to identify their class observation skills. Education that observes and evaluates the process of class demonstration or practice in pre-service teacher education is expected to affect the improvement of teaching competency [24,25,26,27,28,29,30].
The evaluation criteria for class demonstration video were as follows. First, what tendencies do the differences in the mean scores of detailed items show according to the class level between pre-service and field PE teachers? Second, in what order do the detailed items of the class level between the two groups show concordance? Third, what significant differences do the detailed items of the class level between the two groups show? With our findings, we expected to help pre-service PE teachers develop the ability to evaluate correct and incorrect PE teaching behaviors. Furthermore, by presenting the future directions of PE teacher evaluation education, we intended to help enhance professionalism in teachers.
2. Methods
2.1. Participants
We analyzed the data of 21 third-year pre-service teachers enrolled in the Department of Physical Education at a University in Korea and taking the course Physical Education Teaching Methods. The participants had no previous experience of participating in teaching practice and guiding students in schools. However, they had completed major courses, such as Introduction to School Physical Education, Theory of Physical Education, Theory of Gymnastics, Theory of Soccer Guidance, Theory of Cross Country Guidance, and Theory of Volleyball Guidance, as well as the different major and teaching courses required of students by the second semester of the third year, such as Introduction to Education, Psychological Aspects of Education, and Educational Technology. All participants received an explanation of the purpose and necessity of the study, in addition to the steps of the study. The 21 participants included for analysis voluntarily agreed to participate in the study.
2.2. Data Collection
Class demonstrations by pre-service PE teachers were conducted as follows. On the fifth session of the Physical Education Teaching Methods course, the class demonstration and implementation plans were explained to the participants. In sessions six to eight, lesson plans completed by the participants were reviewed for feedback. In session nine, middle school PE class videos were shown to the participants, and class evaluation methods were taught using evaluation tools. After all class demonstrations, we evaluated the videos of class demonstrations by pre-service teachers in the classroom in the 14th session. The class with the best systematic plan and operation was selected and then evaluated by three experienced PE teachers, using the pre-service PE teacher teaching competency evaluation tool [23]. The specific evaluation tool item standards are shown in Table 1. Pre-service teachers completed the evaluation tool as they watched videos of class demonstrations. After completion, the evaluation papers were submitted to the instructor for data collection.
2.3. Data Analysis
First, we derived the descriptive statistics for the analysis of class demonstration evaluation results and assessed the level of skill in observing teaching competency by stage. Second, we analyzed the intra correlation coefficient (ICC) to evaluate agreement between the evaluators [31]. Single measures of ICC are used to evaluate differences in outcomes between groups, and mean measures, differences from the mean [32]. ICC analysis can provide high validity and reliability in measuring the evaluation results of a small number of people [32], as in this study. Third, to identify differences between evaluation of in-service and pre-service teachers, we conducted a matrix analysis to visualize the results on coordinates based on the X-axis (in-service teachers) and Y-axis (pre-service teachers). Lastly, we conducted Mann–Whitney U test, a non-parametric test, to verify the statistical significance of the evaluation between in-service and pre-service teachers.
2.4. Inter-Rater Reliability
Table 2 shows the ICC that we analyzed to investigate inter-rater reliability. We confirmed the reliability between raters.
2.5. Ethics
After explaining the purpose and necessity of the study to the participants, we provided each with a written IRB consent form for participation. The entire process of class demonstration was observed and operated to execute the study in accordance with the proposed plan. The data collected during the study were reviewed by with pre-service teachers. Additionally, peer debrief and triangulation were conducted with two PhDs in Sports Education who had interests in and conducted research on pre-service teacher education. This study was conducted after obtaining IRB approval (GINUEIRB-2021-005) from Gyeongin National University of Education in Korea.
3. Results
3.1. Class Preparation Stage
Figure 1 and Table 3 show the evaluation score on class preparation by in-service and pre-service teachers. The mean score difference between the two groups was 0.53 points. In detail, inter-rater agreement was observed in the order of “safety inspection of learning environment” (-0.04), “preparing learning materials” (0.76), and “securing teaching aids and space” (0.80). Mann–Whitney U test showed a significant difference in “preparing learning materials” (U = 6.00, p = .05).
3.2. Introduction Stage
Figure 2 and Table 4 show the evaluation score on the introduction stage of class demonstration by in-service and pre-service teachers. The mean score difference between the two groups was 1.11 points. In detail, inter-rater agreement was observed in the order of “use of various questions” (0.41), “health check” (0.62), “establishment and introduction of learning organization” (0.73), “recall of previous lesson contents” (0.79), “motivation” (0.98), “smooth progress” (1.06), “warm-up activities” (1.09), “attention” (1.15), “use of demonstrations, media, and cues” (1.29), “attendance and dress check” (1.45), “use of adequate language” (1.47), and “safety education” (2.33). Mann–Whitney U test showed a significant difference in “attendance and dress check” (U = 2.00, p = .01) and “warm-up activities” (U = 4.00, p = .01) of the routine activity domain and “attention” (U = 6.50, p = .05), “recall of previous lesson contents” (U = 9.00, p = .05), “use of demonstrations, media, and cues” (U = 4.50, p = .05), “use of adequate language” (U = 1.50, p = .01), and “safety education” (U = 0.00, p = .01) of the learning objectives and task presentation domain.
3.3. Development Stage
Figure 3 and Table 5 show the evaluation scores on the development stage of class demonstration by in-service and pre-service teachers. The mean score difference between the two groups was 0.64 points. In detail, inter-rater agreement was observed in the order of “adequacy of learning environment” (0.08), “use of appropriate teaching and learning methods” (0.09), “adequate use of teaching materials and media” (0.12), “presentation of various tasks” (-0.33), “inappropriate teaching behavior” (0.38), “providing feedback” (0.51), “appropriateness of task execution time” (0.51), “fair and equal treatment” (1.08), “efficient control and operation of class hours” (1.15), “teaching method based on the characteristics of learners” (1.39), and “establishing a communicative atmosphere” (1.41). Mann–Whitney U test showed a significant difference in “teaching method based on the characteristics of learners” (U = 2.00, p = .01) of the class strategy domain. In the observation and interaction domain, we found significant differences in “establishing a communicative atmosphere” (U = 5.00, p = .05) and “fair and equal treatment” (U = 6.00, p = .05). The maintaining the learning environment domain showed a significant difference in “efficient control and operation of class hours” (U = 3.00, p = .01).
3.4. Conclusion Stage
Figure 4 and Table 6 show the evaluation score on the conclusion stage of class demonstration by in-service and pre-service teachers. The mean score difference between the two groups was 0.79 points. In detail, inter-rater agreement was observed in the order of “encouraging active participation of learners” (0.14), “cool-down activities” (-0.21), “preview of next lesson” (0.26), “learning transfer to daily life” (0.51), “confirming the understanding of learning contents” (-1.04), “efficient organization of learning materials” (1.14), and “injury check” (2.24). Mann–Whitney U test showed a significant difference in “injury check” (U = 0.50, p = .01) of the routine activity domain and “confirming the understanding of learning contents” (U = 8.00, p = .05) of the summary and evaluation domain.
5. Discussion
We analyzed the differences in the characteristics of evaluation results for each stage of class demonstration between pre-service and in-service teachers. Both groups had the same evaluation scores for “securing teaching aids and space” and “safety inspection of learning environment” of the establishing a learning environment domain in the class preparation stage. This stage has the purpose of selecting an appropriate place for learning contents before class and creating a safe and enjoyable learning environment by using adequate teaching aids and facilities [1]. In pre-service teacher education, the importance of establishing a learning environment is emphasized for smooth class progression. Pre-service teachers are thought to have understood the knowledge needed to create a learning environment and experience the process of preparing a class, thereby accumulating the knowledge to distinguish teaching behavior to create the necessary learning environment. As such, they showed similar results for the evaluation of class demonstration videos as in-service PE teachers.
However, inter-rater agreement was not observed for “preparing learning materials.” This suggests differences in the standards for using materials suitable for learning topics between pre-service and in-service teachers. Preparing learning materials involves organizing an appropriate space and preparing sufficient teaching aids, such as scoreboards and team vests, to facilitate task activities according to individual or group activities [33]. As such, the differences between the evaluation scores of pre-service and in-service teachers can be expected; the latter have abundant experience in preparing learning materials for teaching. Pre-service PE teachers can grasp the appropriate behavior of securing space for classes; however, they have not reached the same level of distinguishing teaching behaviors for preparing learning materials appropriate for various conditions.
In the routine activity domain, pre- and in-service PE teachers showed the same evaluation scores for “health check” and “smooth progression,” and discrepancies in the scores for “attendance and dress check” and “warm-up activities.” Routine activity refers to events that occur repeatedly in class, such as attendance check, dress check, and warm-up activities [33,34]. In-service PE teachers use various and interesting ways for attendance check and warm-up activities. In contrast, pre-service teachers conduct formal routine activities, which they consider as excellent teaching activities.
In the learning objectives and task presentation domain, pre-service and in-service teachers showed similar evaluation scores for “motivation,” “use of various questions,” and “organization,” and discrepancies in the scores for “attention,” “presenting learning tasks,” “use of demonstrations, media, and cues,” and “use of adequate language.” Task presentation plays a role in promoting active participation by effectively presenting learning topics and tasks to the learners [35]. This requires effective communication using language, demonstrations, and media. Effective teachers explain task presentations concisely and clearly, demonstrate with complete movements, use appropriate cues, and emphasize key contents [36]. In-service teachers may have given a moderate score for the use of different task presentation behaviors, whereas the pre-service teachers tended to overrate.
The pre-service and in-service PE teachers gave similar scores for “use of appropriate teaching and learning methods” and “presenting various tasks” in the teaching strategy domain of the development stage. In contrast, the two groups did not show an agreement for “teaching method based on the characteristics of learners.” The national PE curriculum suggests teaching and learning methods that consider the characteristics of learners [37]. Such teaching strategy tailored for the learners is an important factor in PE. However, as most pre-service PE teachers performed class demonstrations as secondary assistant teachers, they faced difficulties in understanding the characteristics of learners. Consequently, the pre-service teachers may have given high scores, in contrast to in-service teachers.
In the observation and interaction domain, intuitive teaching functions, such as “providing feedback” and “fair and equal treatment,” can be easily judged from videos of class demonstrations. However, pre-service teachers tended to overrate items that are learned through field experience, such as “establishing a communicative atmosphere.” In the maintaining the learning environment domain, pre-service teachers showed discrepancies in scores for “efficient control and operation of control hours” and similar scores for “appropriateness of task execution time,” “adequacy of learning environment,” “adequate use of teaching materials and media,” and “inappropriate teaching behavior” compared with the in-service teachers. Based on these findings, pre-service PE teachers showed a tendency to overrate instructional functions that involve direct interaction with learners, compared with in-service teachers. However, pre-service PE teachers had similar opinions as in-service teachers on skills that could be acquired from assisting fellow teachers.
Pre- and in-service PE teachers showed agreement in scores for “cool-down activities” and “efficient organization of teaching materials” in the routine activity domain of the conclusion stage while showing a discrepancy in the score for “injury check.” Injury check is directly related to the safety and health of students [1]. However, pre-service teachers may not have acquired knowledge on basic routine activities as in the introduction stage, thereby limiting their analysis of “injury check.”
Pre-service and in-service PE teachers showed similar scores for “encouraging active participation of learners,” “lesson transfer to daily life,” and “preview of next lesson” in the summary and evaluation domain while showing a discrepancy in the score for “confirming the understanding of learning contents.” This suggests that pre-service teachers tended to overrate the important educational activity of confirming the achievement of learning goals through reflective activities with students.
In summary, our findings on pre-service teachers’ analytic abilities supported the critical view that theory-based teacher education is not helpful in developing the practical competency of pre-service teachers [38]. The importance of practical knowledge has been emphasized in studies on education and teacher education. However, in pre-service teacher education, “theory-based teacher education” based on the “technological rationalism model” remains as the dominant education strategy, acting as a key obstacle that limits the development of pre-service teachers [27,39].
Therefore, additional measures to increase the practical knowledge of pre-service teachers are needed. These measures must seek balanced education between “knowledge for practice” and “knowledge in practice” [39]. “Knowledge for practice” refers to theoretical knowledge, such as universal concepts or propositional knowledge expressed in specific language and methods through class demonstrations. “Knowledge in practice” refers to knowledge internalized or newly acquired in practice by teachers through teaching activities [40]. As pre-service teachers have high knowledge of practice and low practical skills gained through experience, teacher education programs must focus on establishing a balanced curriculum consisting of “knowing-how” and “knowing-that” [8]. This will be possible systematically operate the purpose of preservice teacher education and pursue the direction of sustainable education. Thus, pre-service teacher education must aim to cultivate the ability to operate and analyze classes through theory and practice.
6. Conclusions and Suggestions
In our study, the pre-service teachers showed discrepancies in their evaluation scores for class demonstration videos and tended to overrate many items compared with in-service teachers. Such tendency was attributed to the low level of knowledge in pre-service teachers observing teaching behaviors required for different classes, and may be related to a lack of practical teaching knowledge. Class demonstrations in pre-service PE teacher education in universities often depend on assistant teachers rather than actual students, similar to micro-teaching. Intuitive teaching function is the capacity to demonstrate and appropriately apply the learned contents as assistant teachers. However, teachings skills that require interaction with actual students or teaching behaviors acquired through field experience and presented as practical knowledge are difficult to demonstrate or evaluate. Therefore, in light of our findings, the following are suggested to improve the teaching behavior analysis ability of pre-service PE teachers.
First, pre-service teachers should obtain higher levels of practical teaching knowledge. The lack of reliability in the evaluation results by pre-service teachers may be attributed to their limited knowledge to judge the level of teaching behavior. To analyze classes, the teacher must apply curriculum knowledge and teaching methods, as well as observe class environment and learner characteristics. Therefore, pre-service teacher education must provide effective training to cultivate practice-oriented PCK(Pedagogical Content Knowledge) required for PE teachers.
Second, institutions must establish a well-organized curriculum that can help pre-service teachers accumulate adequate knowledge and analysis skills for PE classes. Pre-service teachers often do not have opportunities to observe in-person or lead PE classes at schools. Therefore, they must be provided with opportunities to spectate PE classes led by excellent in-service teachers and learn professional PE class management skills and standards.
Based on our findings, suggestions for follow-up studies are as follows. Future studies must explore the value of self-reflective activities according to class evaluations to confirm the value of evaluation tools from the perspective of pre-service teachers. Additionally, studies must combine and apply systematic observation methods for analysis of teaching behavior. Using teaching behavior analysis tools, such as duration recording, QMTPS, and Cheffers Adaptation to Flanders’ Interaction Analysis System, will increase the reliability and validity of data in follow-up studies.
Author Contributions
Conceptualization, C.-M. K., J.-H. J., H.-S. Y.; methodology, C.-M. K., M.-J. K., H.-S. Y.; writing, original draft preparation, C.-M. K., J.-H. J., H.-S. Y.; writing, review and editing, C.-M. K., J.-H. J., H.-S. Y., M.-J. K.; visualization, M.-J. K., H.-S. Y.; supervision, all authors. All authors have read and agreed to the published version of the manuscript.
Funding
This research was funded by the National Research Foundation of Korea (NRF-2020S1A5B5A17091060).
Institutional Review Board Statement
This study was conducted in accordance with the guidelines of the Declaration of Helsinki and approved by the Institutional Review Board of Gyeong-in National University of Education in Korea (GINUEIRB-2021-005).
Informed Consent Statement
Informed consent was obtained from all the subjects involved in the study.
Data Availability Statement
Not applicable.
Conflicts of Interest
The funders had no role in the design of the study; in the collection, analyses, or interpretation of data; in the writing of the manuscript; or in the decision to publish the results.
References
- DKim, C.M. Development of Physical Education Teachers’ Teaching Competency Evaluation Tool and Application. Ph.D. Thesis, Kyung Hee University, Yongin, Korea, 2019.
- Zach, S., Harari, I., & Harari, N. Changes in teaching efficacy of pre-service teachers in physical education. Physical education and sport pedagogy, 2012, 17(5), 447–462. [CrossRef]
- Kim, W.J. Study of self-reflective process on pre-service physical education teachers' microteaching. Korean Journal of Sport Pedagogy. 2010, 17, 25–52. [Google Scholar]
- Jeon, S., Hong, A., & Jung, H. Formation process and characteristics of preliminary physical education teachers' micro-teaching experience and professional identity. Korean Journal of Sport Pedagogy. 2017, 24(4), 105–129. [CrossRef]
- Saban, A., & Çoklar, A. N. Pre-Service Teachers' Opinions about the Micro-Teaching Method in Teaching Practise Classes. Turkish Online Journal of Educational Technology-TOJET. 2013, 12(2), 234–240.
- Ryu, M.J. Understanding the Experiences of Pre-service teachers in Self-analysis and Self-evaluation and its meaning in Video-assistant Micro-teaching Class. Journal of Research in Curriculum & Instruction. 2019, 23, 83–95. [Google Scholar] [CrossRef]
- Kwak, E.C.; Kim, C.M. Exploring the Educational Possibility of Teaching Evaluation System in Pre-service Physical Education Teacher Education Program. J. Learn.-Cent. Curric. Instr. 2020, 20, 493–517. [Google Scholar] [CrossRef]
- Park, J. J & Choi, E.C. Understanding The Pre-service PE Teacher's Practical Knowledge through Reflective Micro-teaching. Korean Journal of Sport Science. 2010, 21, 1595–1614. [Google Scholar] [CrossRef]
- Hunt, K.; Gurvitch, R.; Lund, J.L. Teacher Evaluation: Done to You or with You? J. Phys. Educ. Recreat. Danc. 2016, 87, 21–27. [Google Scholar] [CrossRef]
- Yalcin Arslan, F. Reflection in pre-service teacher education: Exploring the nature of four EFL pre-service teachers’ reflections. Reflective Pract. 2019, 20, 111–124. [Google Scholar] [CrossRef]
- Boud, D. The role of self-assessment in student grading. Assessment and Evaluation in Higher Education. 1999, 14, 20–30. [Google Scholar] [CrossRef]
- Good, T. L., & Grouws, D. A. Process-Product Relationships in Fourth Grade Mathematics Classrooms: Final Report. Columbia: Center for Research in Social Behavior, University of Missouri, 1975.
- Peacock, A. , & Rawson, B. Helping teachers to develop competence criteria for evaluating their professional development. International Journal of Educational Development. 2001, 21, 79–92. [Google Scholar] [CrossRef]
- Darst, P. W., Mancini, V. H., & Zakrajsek, D. Systematic observation instrumentation for physical education (2nd ed.). New York, NY: Leisure Press, 1983.
- Rink, J.; Werner, P. Qualitative Measures of Teaching performance-scale (QMTPS). In Analyzing Physical Education and Sport Instruction; Darst, P., Zakrajek, D., Mancini, V., Eds.; Human Kinetics: Champaign, IL, USA, 1989. [Google Scholar]
- Brophy, J.; Good, T. Teacher Behavior and Student Achievement; Occasional Paper, No. 73; Institute for Research on Teaching: East Lansing, MI, USA, 1984. [Google Scholar]
- Rink, J.E. Measuring teacher effectiveness in physical education. Res. Q. Exerc. Sport 2013, 84, 407–418. [Google Scholar] [CrossRef] [PubMed]
- NASPE. National Association for Sport and Physical Education. Physical education teacher evaluation tool. Reston, VA: Author, 2007.
- SHAPE America. National standards for initial physical education teacher education. Retrieved from https://www.shapeamerica.org/accreditation/upload/2017-SHAPE-America-Initial-PETEStandards-and-Components.pdf, 2017.
- NBPTS. Physical Education Standards. Reston, VA: Author, 2014.
- Kyrgiridis, P., Derri, V., Emmanouilidou, K., Chlapoutaki, E., & Kioumourtzoglou, E. Development of a questionnaire for selfevaluation of teacher effectiveness in physical education (SETEQ-PE). Measurement in Physical Education and Exercise Science. 2014, 18(2), 73–90. [CrossRef]
- Marzano, R.J. Teacher evaluation. Educ. Leadersh. 2012, 70, 14–19. [Google Scholar]
- Kim, C. M., & Kwak, E. C. An Exploration of a Reflective Evaluation Tool for the Teaching Competency of Pre-Service Physical Education Teachers in Korea. Sustainability.2022, 14(13), 8195. [CrossRef]
- Chamoso, J. M. , Cáceres, M. J., & Azcárate, P. Reflection on the teaching-learning process in the initial training of teachers. Characterization of the issues on which pre-service mathematics teachers reflect. Teaching and Teacher Education. 2012, 28, 154–164. [Google Scholar] [CrossRef]
- Darling-Hammond, L., & Bransford, J. (with LePage, P., Hammerness, K., & Duffy, H.). Preparing teachers for a changing world: What teachers should learn and be able to do. San Francisco: Jossey-Bass, 2005.
- Greenburg, A. D. A comparison of problems confron-ting male high school physical education teachers in an inner-city and in suburban area (Doctoral dissertation, University of Illinois, 1970). Dissertation Abstracts International, 31.
- Korthagen, F. A. J. Linking practice and theory: the pedagogy of realistic teacher education. London: Lawrence Erlbaum Associates Publishers, 2001.
- Nolan, J., & Hoover , L. A. Teacher supervision and evaluation. NY: John Wiley& Sons, Inc, 2004.
- So, W. W. M., Pow, J. W. C., & Hung, V. H. K. The interactive use of a video database in teacher education: Creating a knowledge base for teaching through a learning community. Computers & Education. 2009, 53(3), 775–786. [CrossRef]
- Borko, H., Jacobs, J., Eiteljorg, E., & Pittman, M. E. Video as a tool for fostering roductive discussions in mathematics professional development. Teaching And Teacher Education.2008, 24(2), 417–436. [CrossRef]
- Mehta, S. , Bastero-Caballero, R. F., Sun, Y., Zhu, R., Murphy, D. K., Hardas, B., & Koch, G. Performance of intra class correlation coefficient (ICC) as a reliability index under various distributions in scale reliability studies. Statistics in medicine. 2018, 37, 2734–2752. [Google Scholar]
- Bujang, M. A. , & Baharum, N. A simplified guide to determination of sample size requirements for estimating the value of intraclass correlation coefficient: a review. Archives of Orofacial Science, 2017, 12, 1–11. [Google Scholar]
- Grube, D. , Ryan, S., Lowell, S., & Stringer, A. Effective classroom management in physical education: Strategies for beginning teachers. Journal of Physical Education, Recreation & Dance. 2018, 89, 47–52. [Google Scholar] [CrossRef]
- Werner, P. , & Rink, J. Case studies of teacher effectiveness in second grade physical education. Journal of Teaching in Physical Education. 1989, 8, 280–297. [Google Scholar] [CrossRef]
- Rink, J. Teaching Physical Education for Learning, 7th ed.; McGraw-Hill: Boston, MA, USA, 2014. [Google Scholar]
- Roehler, L., Duffy, G., Conley, M., Hermann, B., Johnson, J., & Michelson, S. Exploring preservice teachers' knowledge structures. In annual meeting of the American Educational Research Association, Washington, DC, 1987.
- Korean Ministry of Education. (2015). 2015 national curriculum for physical education. Ministry of Education.
- So, K.H. Teacher Learning: How and what teachers Learn. The Journal of Curriculum Studies, 2009, 27, 107–126. [Google Scholar] [CrossRef]
- Schon, D. A. The reflective practitioner. San Francisco: Jossey-Bass, 1983.
- Schön, D. A. Educating the reflective practitioner: Toward a new design for teaching and learning in the professions. Jossey-Bass, 1987.
Figure 1.
Comparison of detailed evaluation items in class preparation stage.
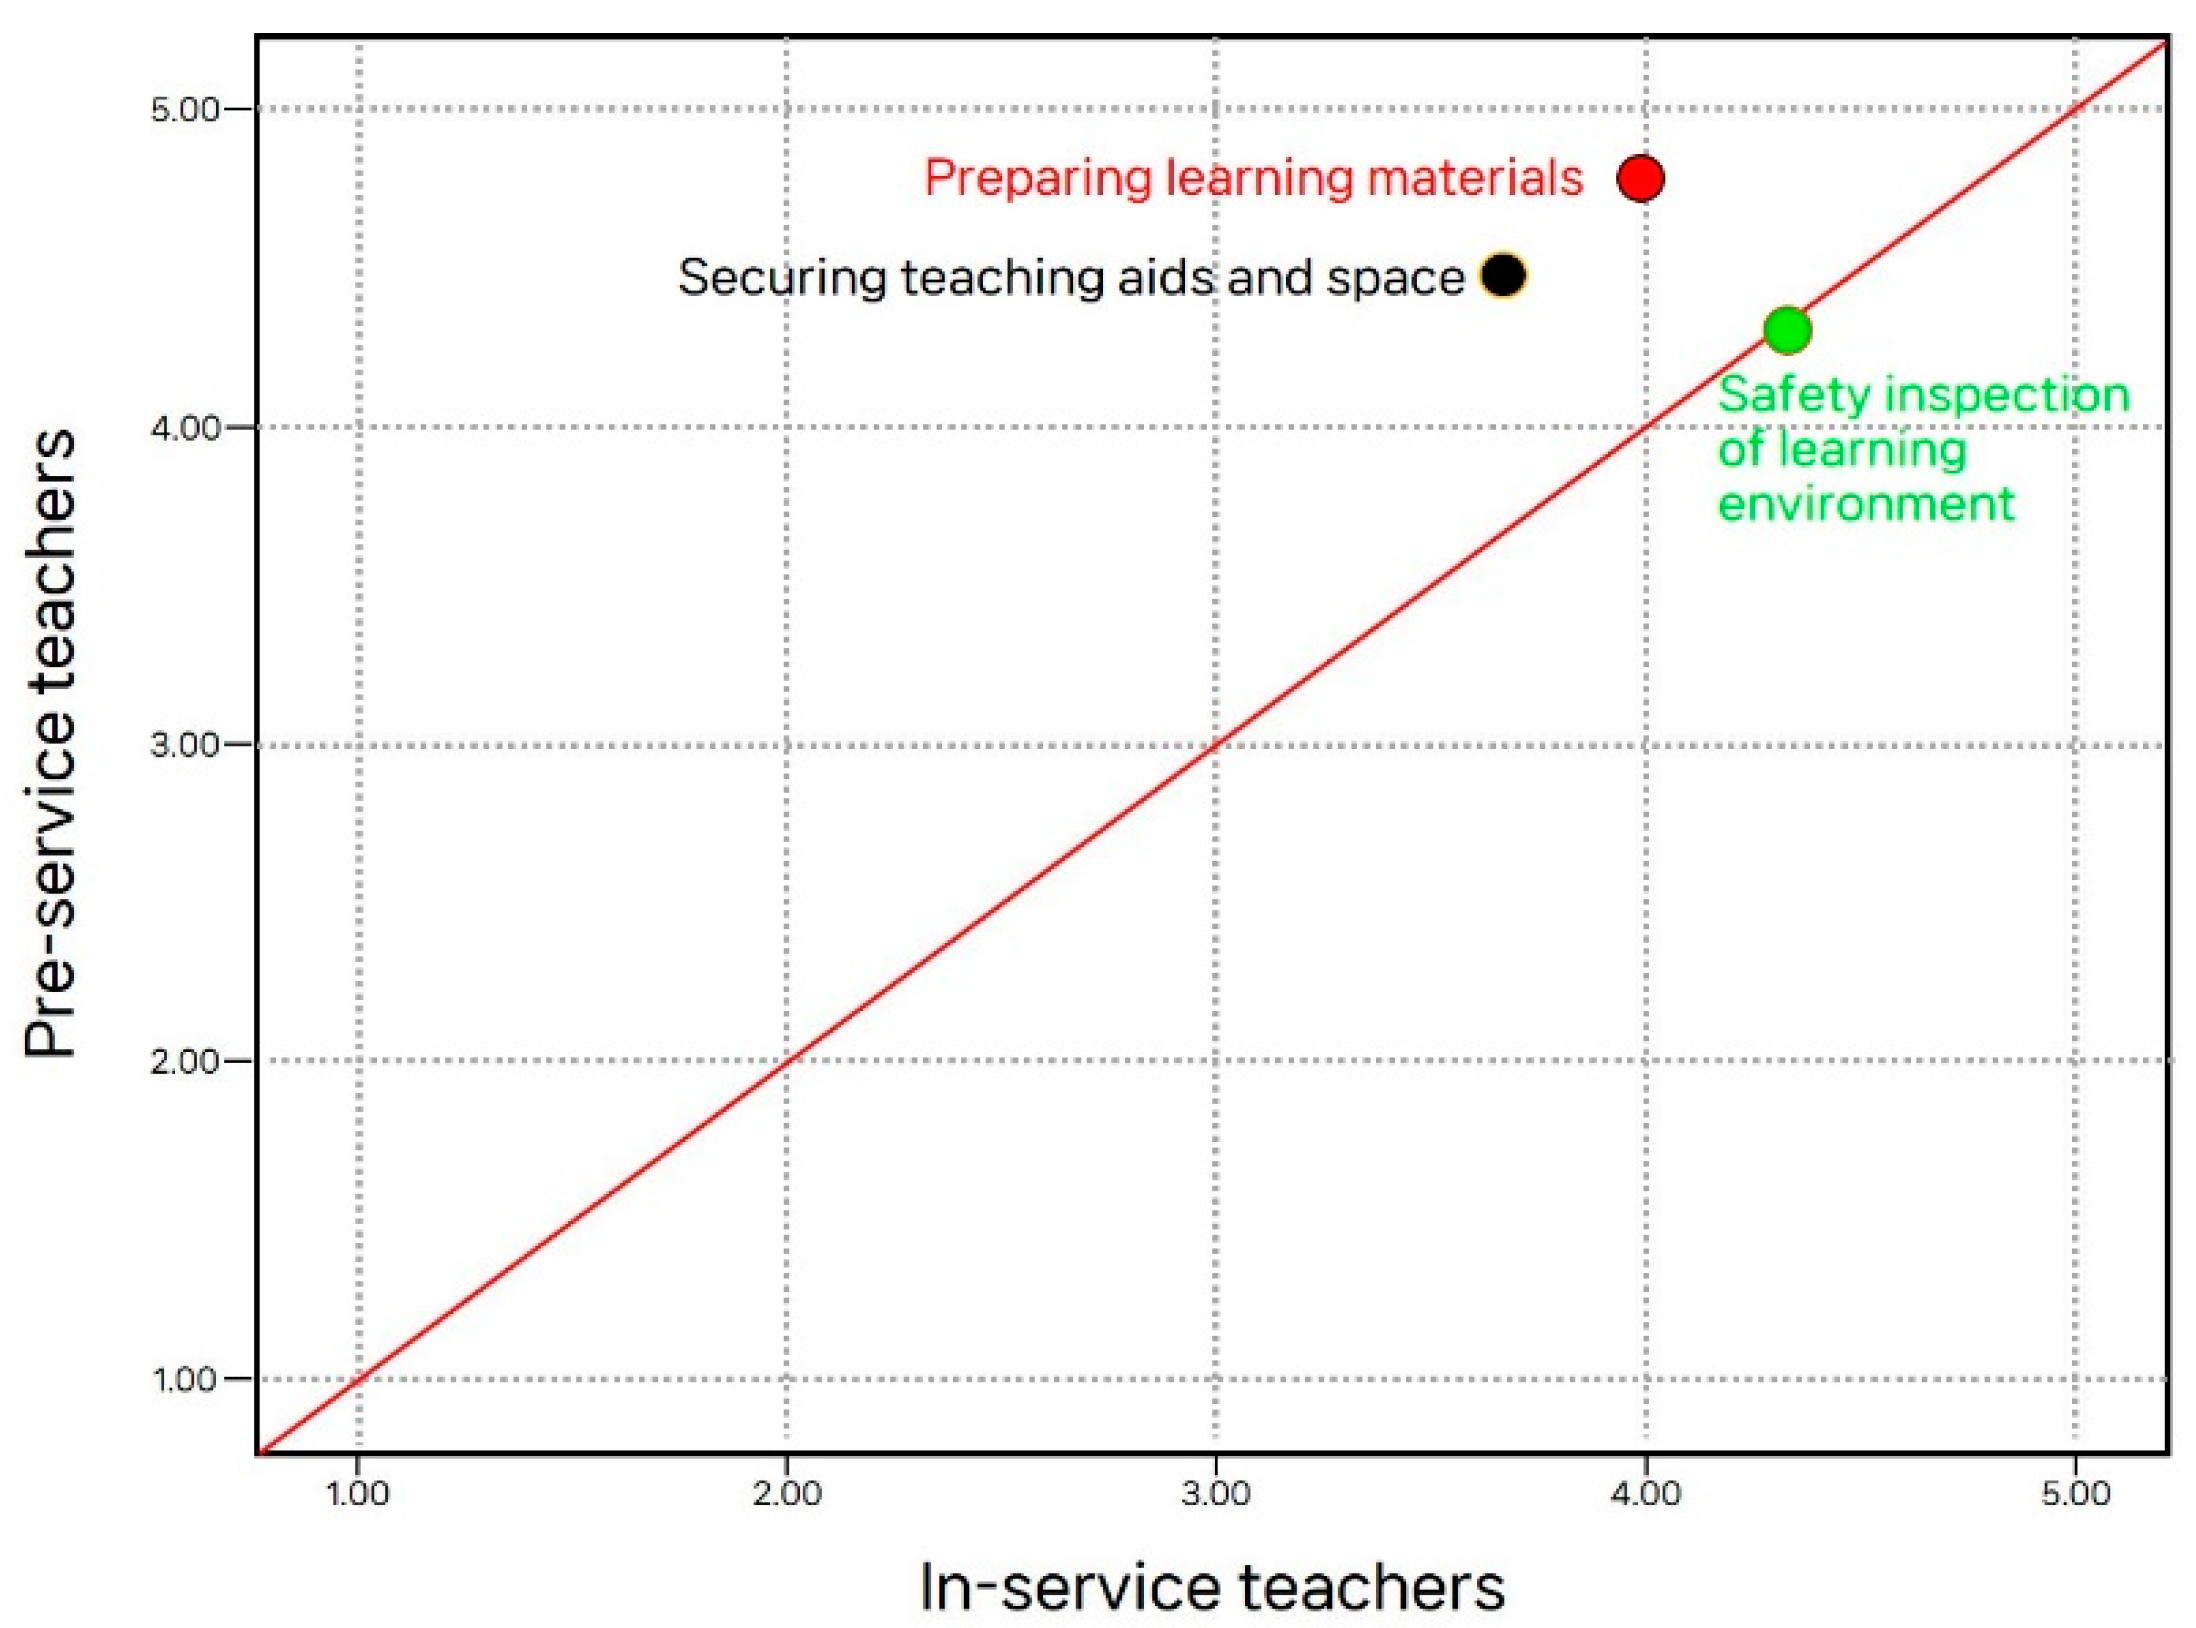
Figure 2.
Comparison of detailed evaluation items in introduction stage.
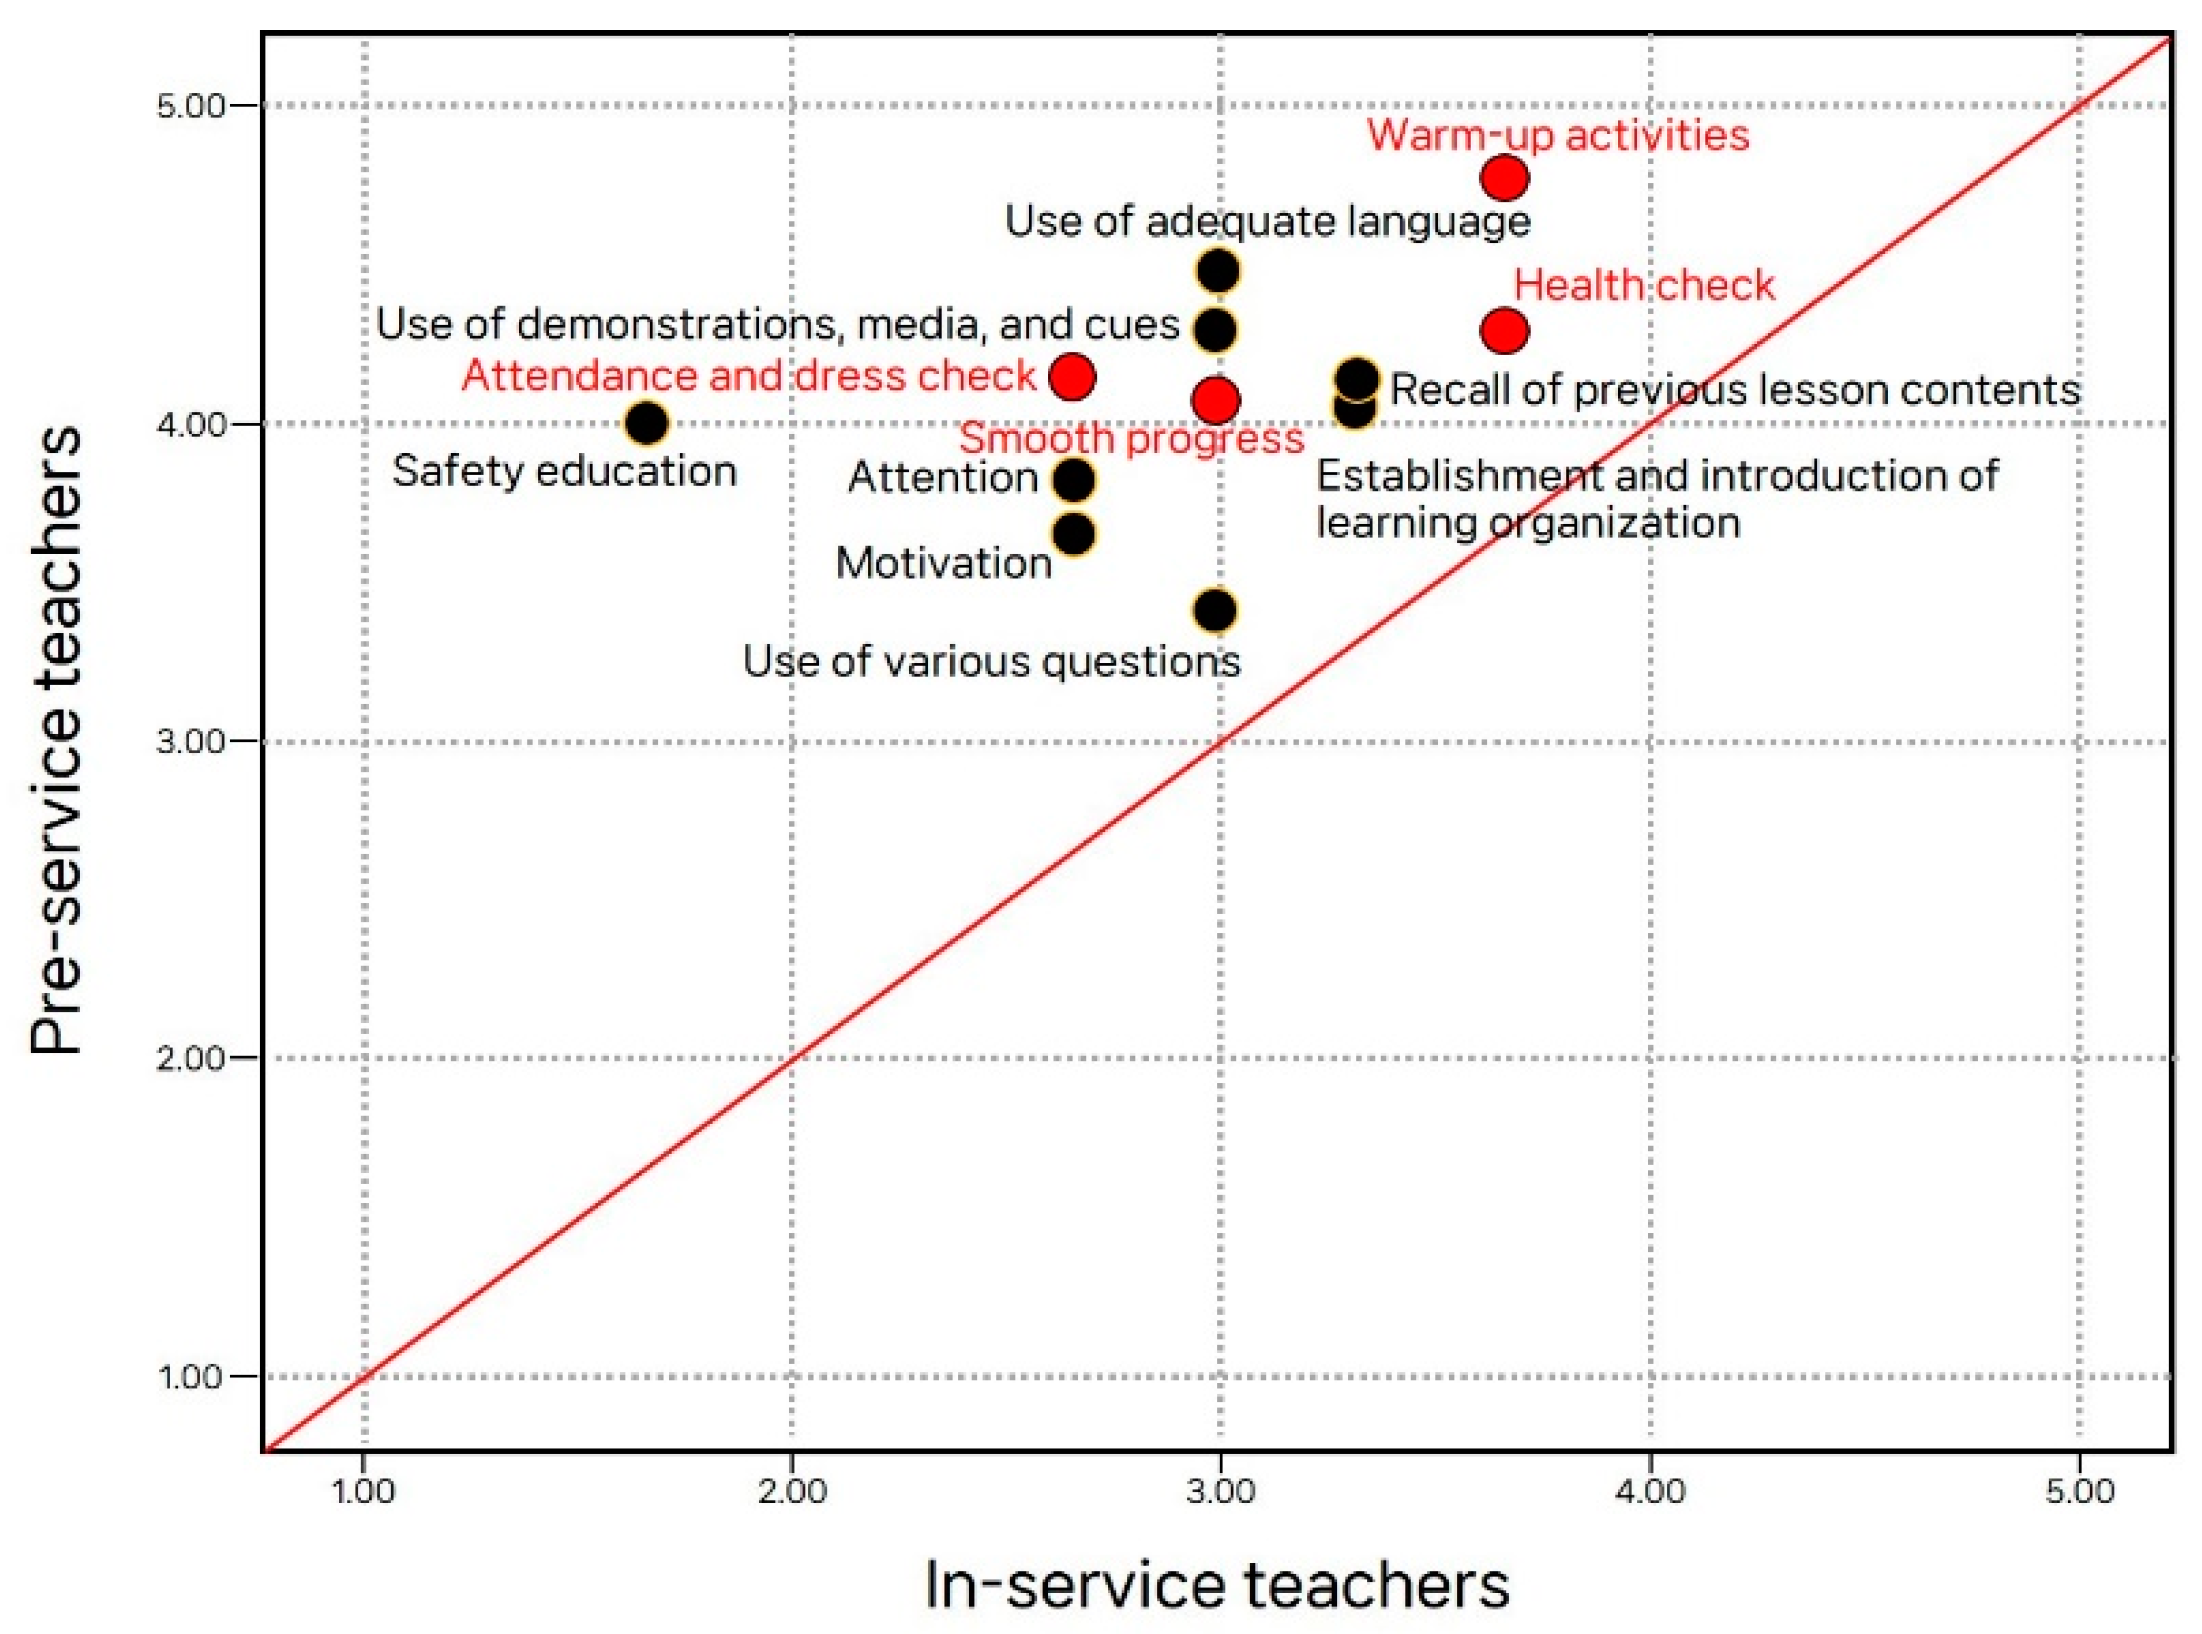
Figure 3.
Comparison of detailed evaluation items in development stage.
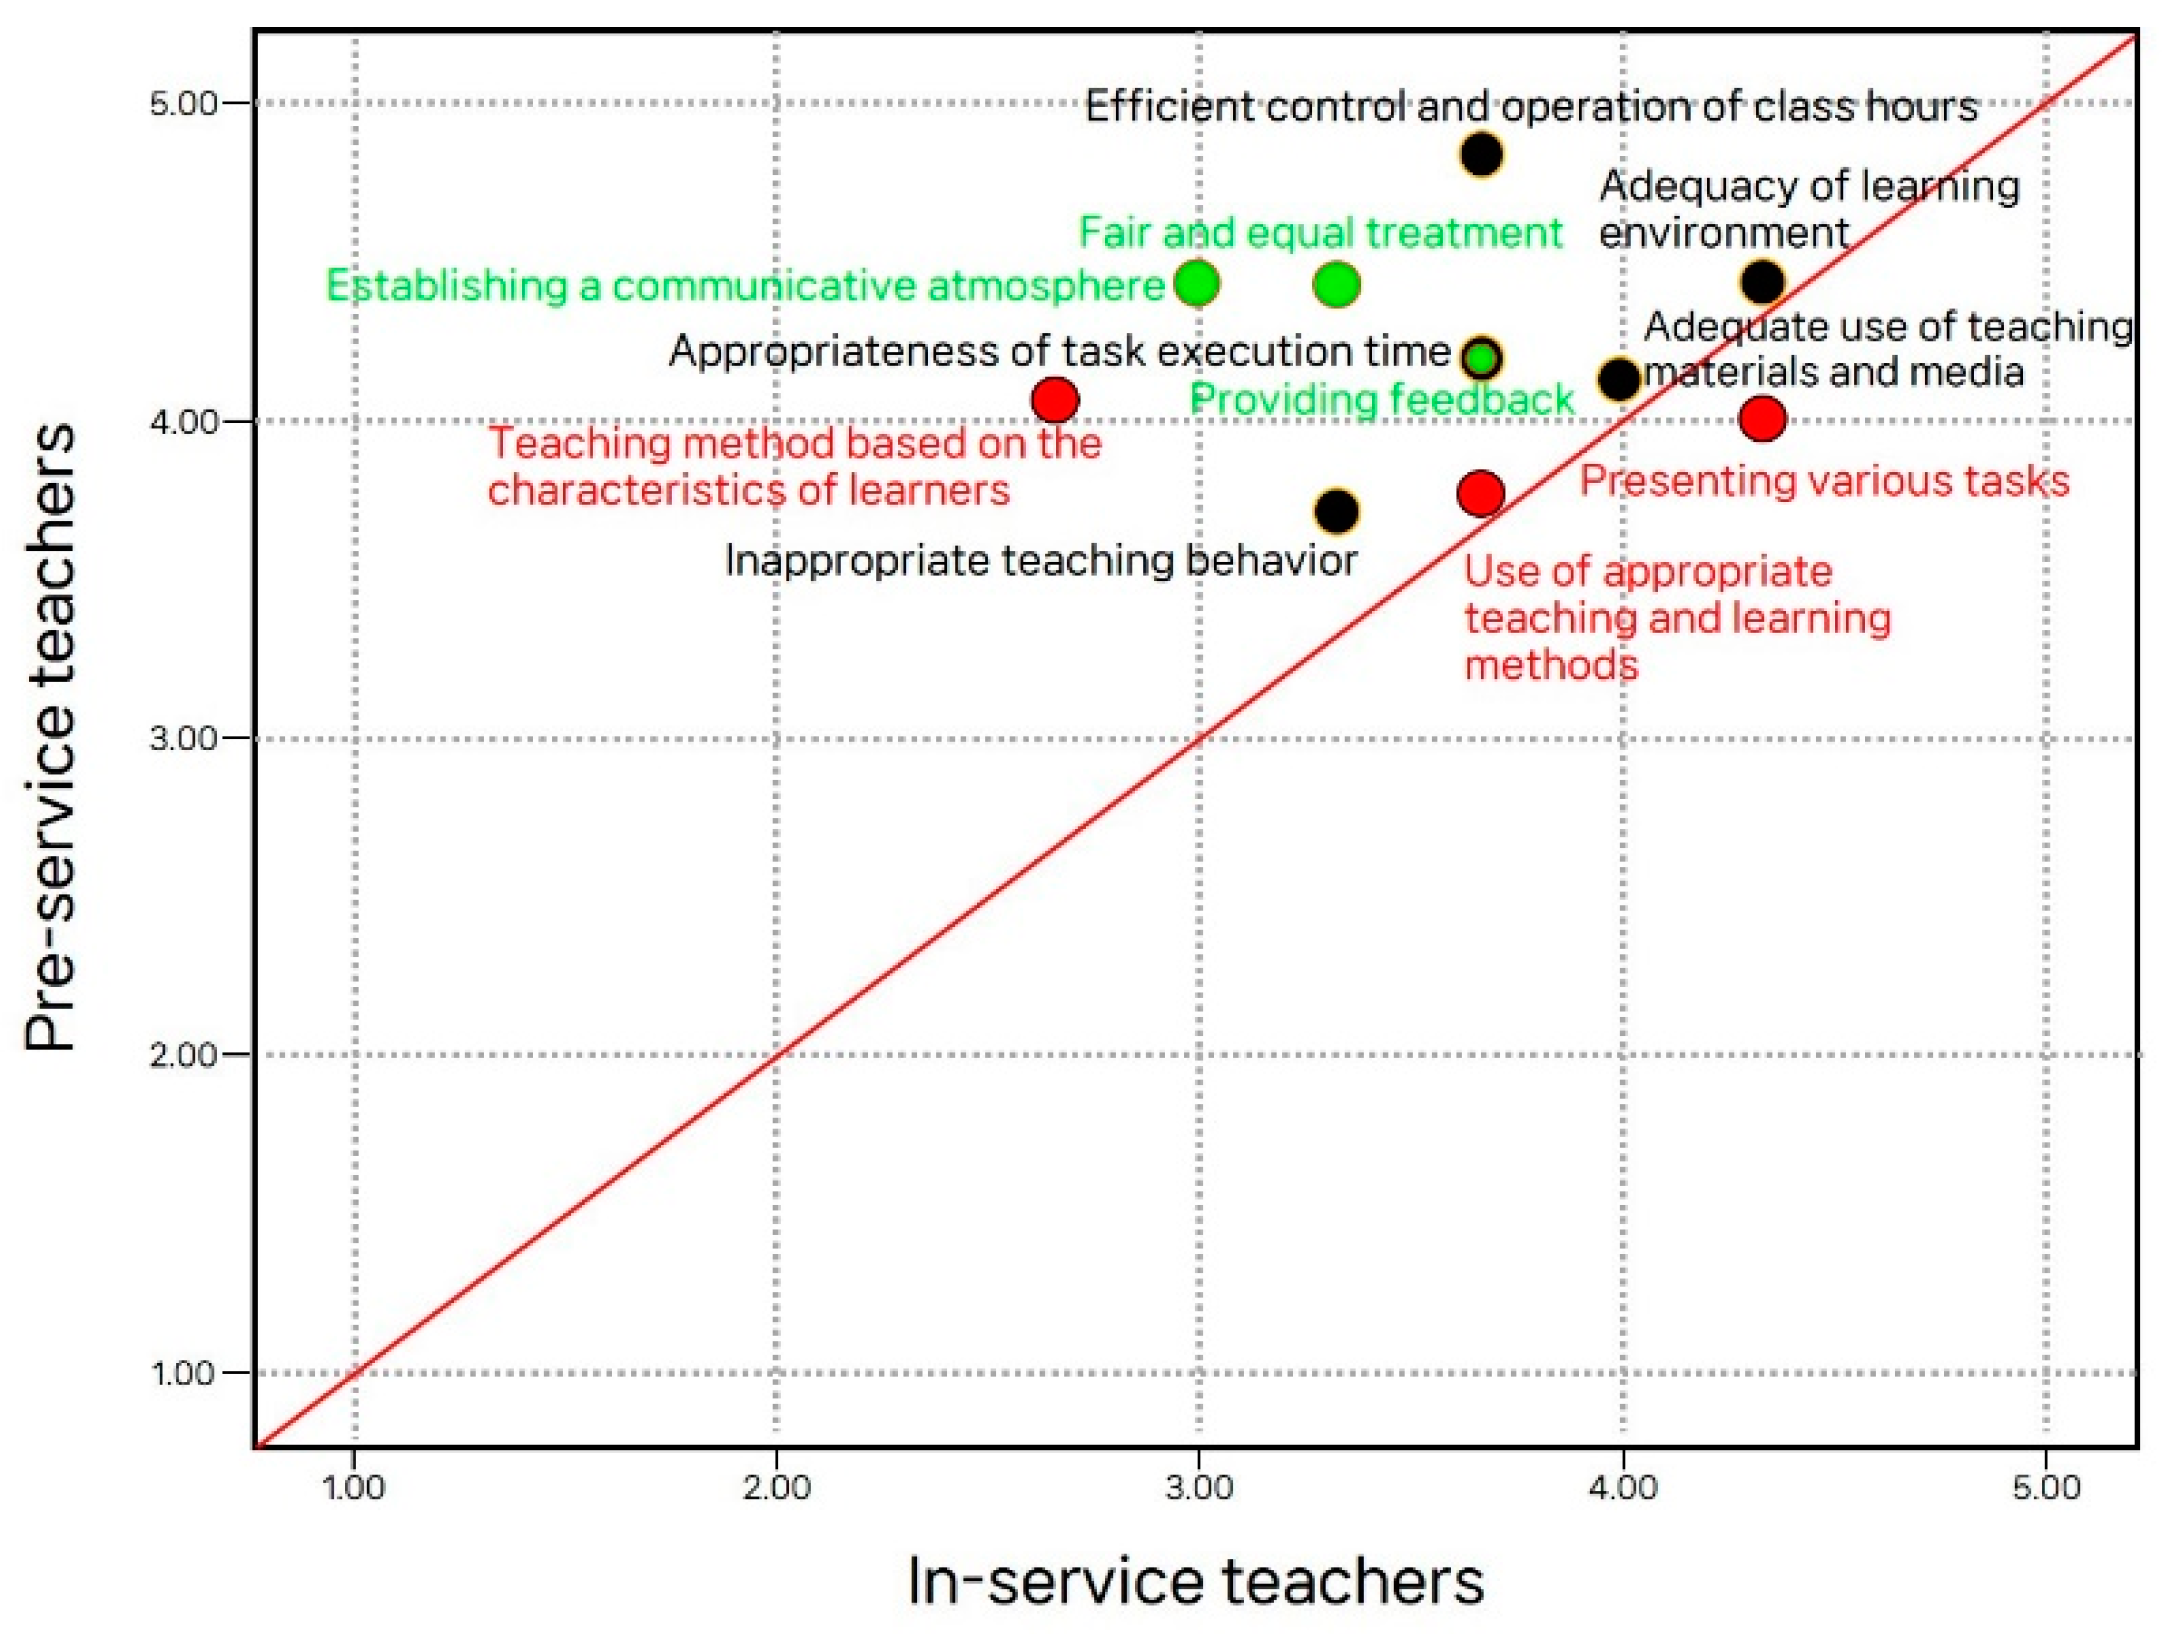
Figure 4.
Comparison of detailed evaluation items in conclusion stage.
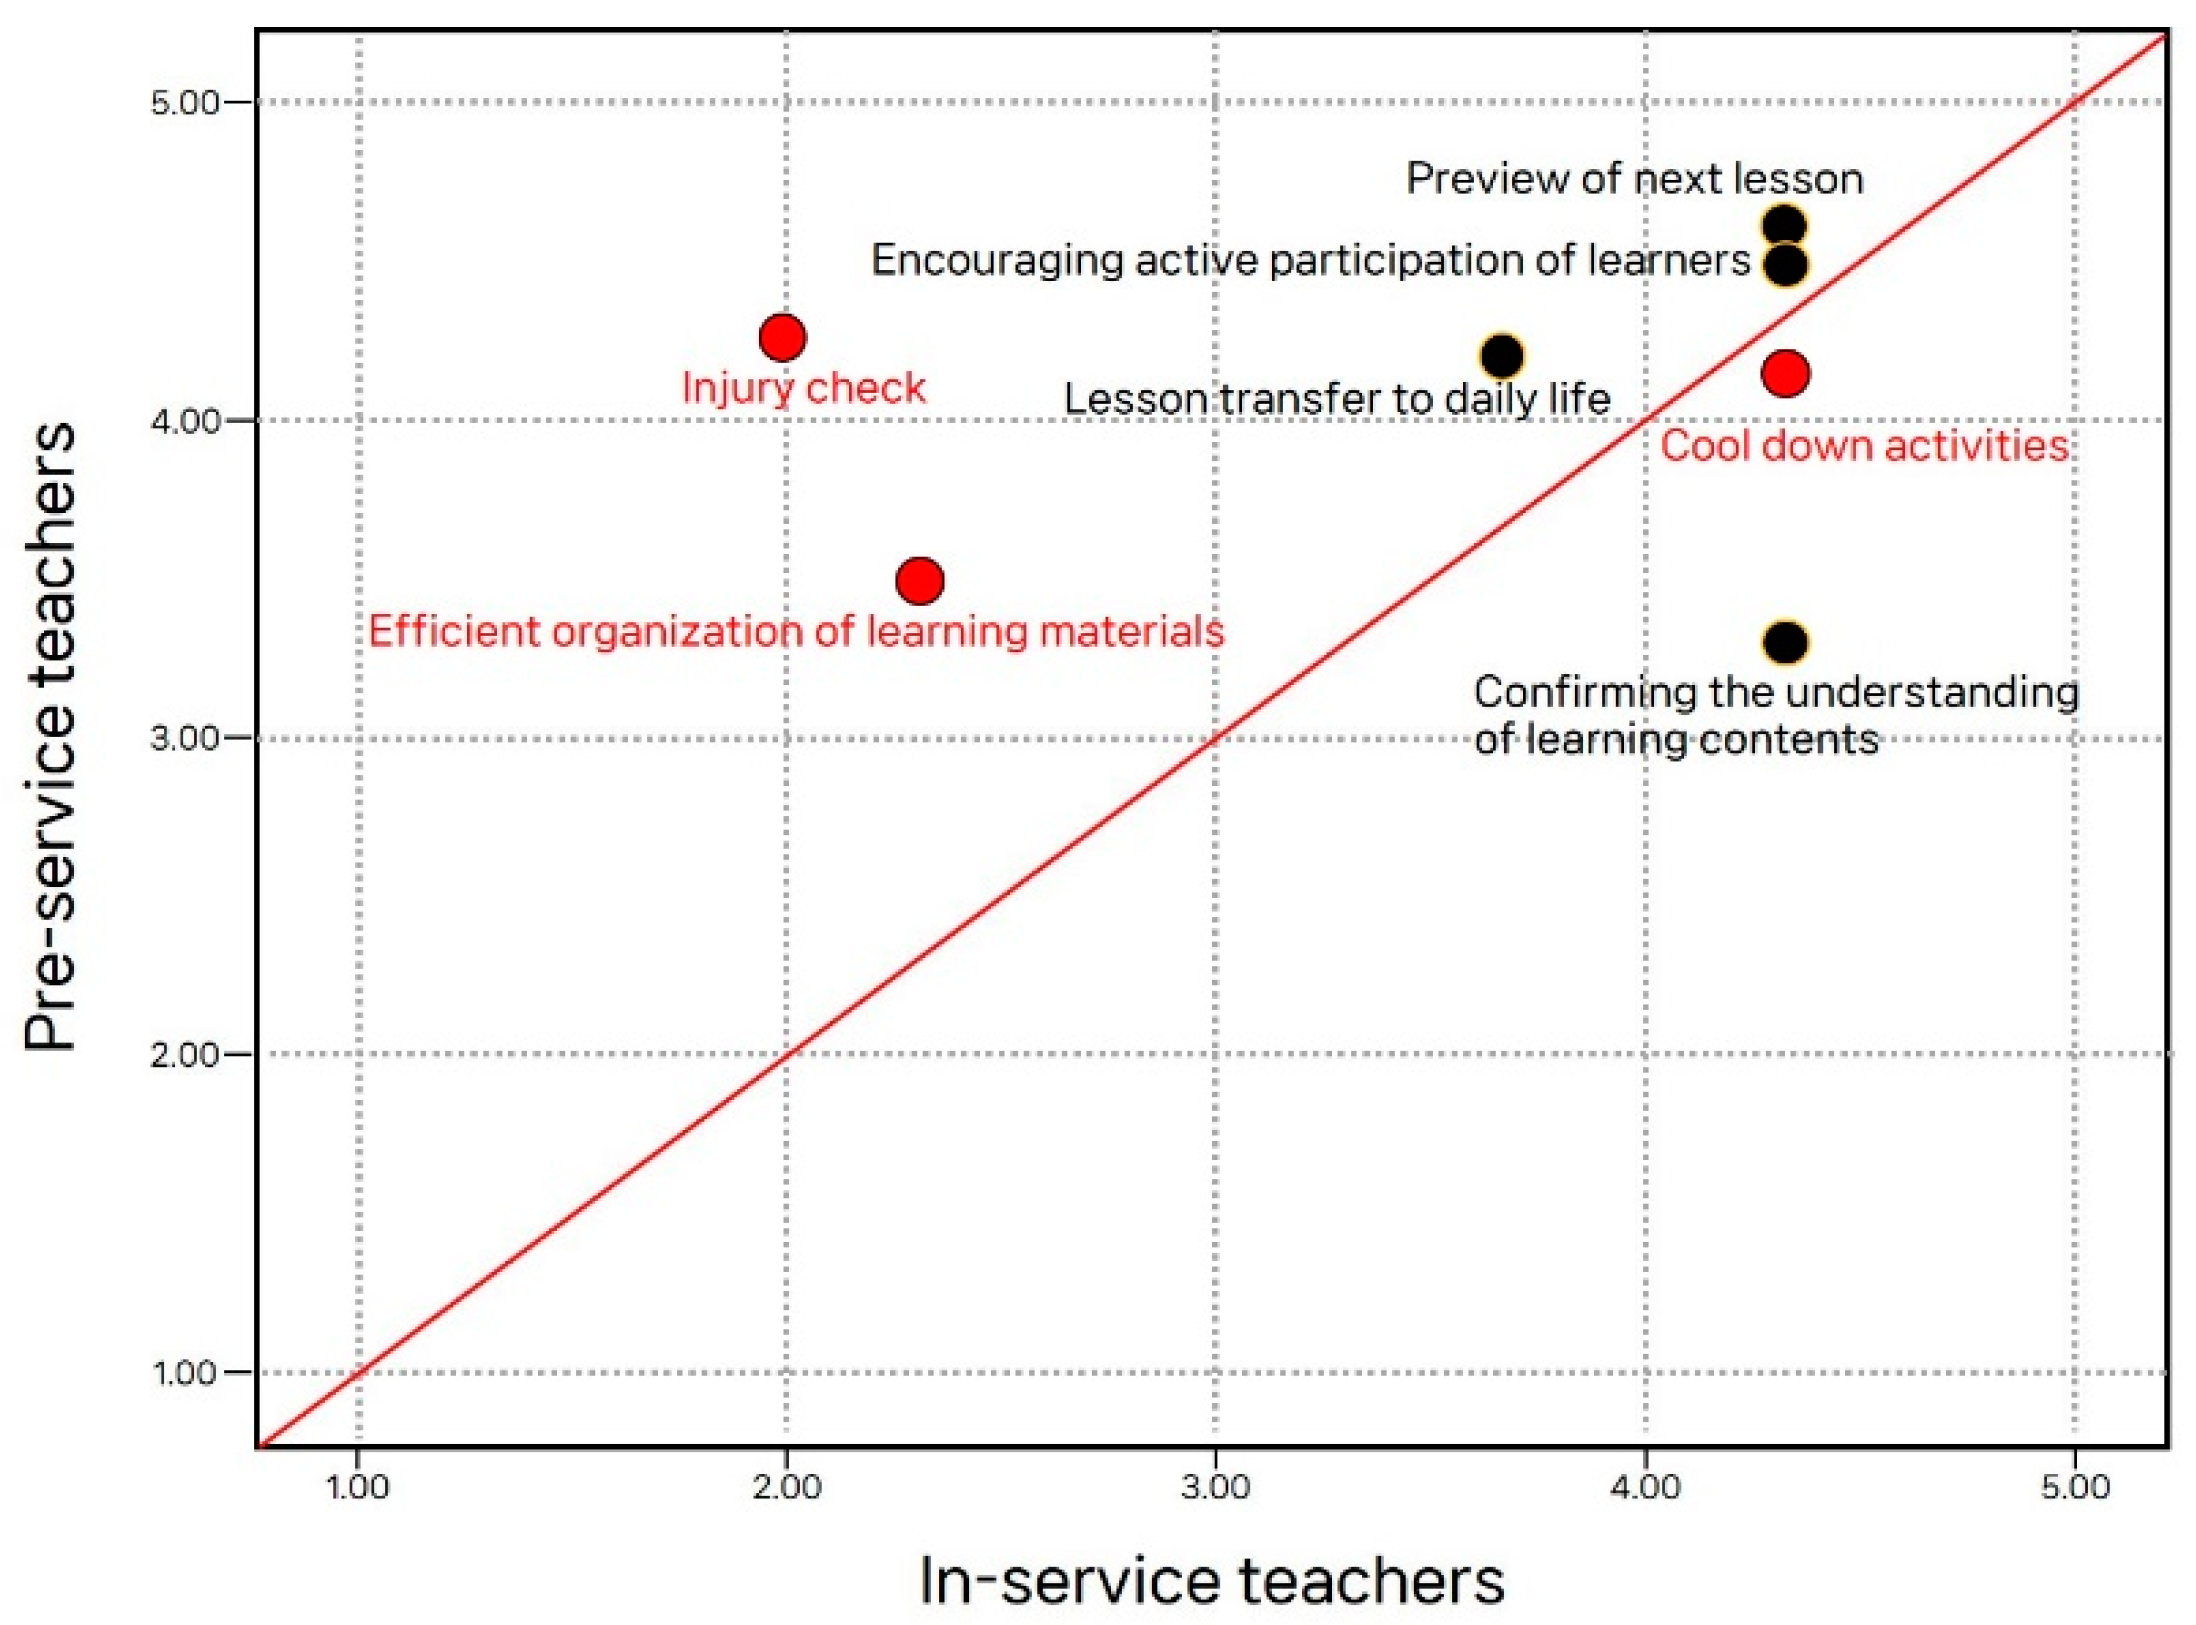

Table 1.
Items for each teaching evaluation domain.
| Stage | Domain | Evaluation ontents | |
|---|---|---|---|
| Class preparation |
Establishing a learning environment | Securing teaching aids and space Safety inspection of learning environment |
Preparing learning materials |
| Introduction | Routine activity | Attendance and dress check Health check |
Warm-up activities Smooth progress |
| Learning objectives and task presentation |
Attention Recall of previous lesson contents Use of demonstrations, media, and cues Use of adequate language |
Motivation Use of various questions Establishment and introduction of learning organization Safety education |
|
| Development | Class strategy | Use of appropriate teaching and learning methods Teaching method based on the characteristics of learners |
Presenting various tasks |
| Observation and interaction | Providing feedback Establishing a communicative atmosphere |
Fair and equal treatment | |
| Maintaining the learning environment | Adequacy of learning environment Efficient control and operation of class hours Appropriateness of task execution time |
Adequate use of teaching materials and media Inappropriate teaching behavior |
|
| Conclusion | Routine activity | Cool-down activities Injury check |
Efficient organization of learning materials |
| Summary and evaluation | Confirming understanding of learning contents Encouraging active participation of learners |
Learning transfer to daily life Preview of next lesson |
|
| Total | 33 items | ||
Table 2.
Inter-rater reliability analysis.
| Classification | ICC Value | 95% Confidence Interval | F Test | ||
|---|---|---|---|---|---|
| Lower Bound | Upper Bound | Significance (P-Value) |
|||
| Single measures | 0.508 | 0.301 | 0.694 | 4.025 | 0.000 |
| Mean measures | 0.756 | 0.564 | 0.872 | 4.025 | 0.000 |
Table 3.
Analysis of class preparation stage.
| Class Stage | Domain | Detailed Item | In-Service Teachers (n = 3) |
Pre-Service Teachers (n = 21) |
GAP | U | Z | p | ||
|---|---|---|---|---|---|---|---|---|---|---|
| M | SD | M | SD | |||||||
| Class preparation | Establishing a learning environment | Securing teaching aids and space | 3.67 | 0.58 | 4.47 | 0.72 | 0.80 | 10.00 | -1.800 | .072 |
| Safety inspection of learning environment | 4.33 | 0.58 | 4.29 | 0.59 | -0.04 | 25.00 | -0.061 | .951 | ||
| Preparing learning materials | 4.00 | 0.00 | 4.76 | 0.44 | 0.76 | 6.00 | -2.495 | .013* | ||
| Total (M) | 4.00 | 4.51 | 0.53 | |||||||
*p <.05, **p <.01. GAP: Gap(between), U: Mann-Whitney test, Z: Z-value.
Table 4.
Introduction stage analysis.
| Class Stage | Domain | Detailed Item | In-Service Teachers (n = 3) |
Pre-Service Teachers (n = 21) |
GAP | U | Z | p | ||
|---|---|---|---|---|---|---|---|---|---|---|
| M | SD | M | SD | |||||||
| Introduction stage |
Routine activity |
Attendance and dress check | 2.67 | 0.58 | 4.12 | 0.60 | 1.45 | 2.00 | -2.748 | .006** |
| Health check | 3.67 | 0.58 | 4.29 | 0.47 | 0.62 | 12.00 | -1.782 | .075 | ||
| Warm-up activities | 3.67 | 0.58 | 4.76 | 0.44 | 1.09 | 4.00 | -2.720 | .007** | ||
| Smooth progress | 3.00 | 0.00 | 4.06 | 0.83 | 1.06 | 6.00 | -2.201 | .028* | ||
| Learning objectives and task presentation |
Attention | 2.67 | 0.58 | 3.82 | 0.81 | 1.15 | 6.50 | -2.144 | .032* | |
| Recall of previous lesson contents | 3.33 | 0.58 | 4.12 | 0.70 | 0.79 | 9.00 | -2.061 | .039* | ||
| Use of demonstrations, media, and cues | 3.00 | 0.00 | 4.29 | 0.77 | 1.29 | 4.50 | -2.364 | .018* | ||
| Use of adequate language | 3.00 | 0.00 | 4.47 | 0.62 | 1.47 | 1.50 | -2.739 | .006** | ||
| Motivation | 2.67 | 0.58 | 3.65 | 1.00 | 0.98 | 11.00 | -1.608 | .108 | ||
| Use of various questions | 3.00 | 1.00 | 3.41 | 0.87 | 0.41 | 19.00 | -0.735 | .462 | ||
| Establishment and introduction of learning organization | 3.33 | 0.58 | 4.06 | 0.75 | 0.73 | 10.50 | -1.804 | .071 | ||
| Safety education | 1.67 | 0.58 | 4.00 | 0.79 | 2.33 | 0.00 | -2.803 | .005** | ||
| Total (M) | 2.97 | 4.09 | 1.11 | |||||||
* p <.05, **p <.01. GAP: Gap(between), U: Mann-Whitney test, Z: Z-value.
Table 5.
Development stage analysis.
| Class Stage | Domain | Detailed Item | In-Service Teachers (n = 3) |
Pre-Service Teachers (n = 21) |
GAP | U | Z | p | ||
|---|---|---|---|---|---|---|---|---|---|---|
| M | SD | M | SD | |||||||
| Development stage | Class strategy | Use of appropriate teaching and learning methods | 3.67 | 0.58 | 3.76 | 0.66 | 0.09 | 24.00 | -0.178 | .858 |
| Teaching method based on the characteristics of learners | 2.67 | 0.58 | 4.06 | 0.56 | 1.39 | 2.00 | -2.827 | .005** | ||
| Presenting various tasks | 4.33 | 0.58 | 4.00 | 0.87 | -0.33 | 20.50 | -0.575 | .565 | ||
| Observation and interaction |
Providing feedback | 3.67 | 0.58 | 4.18 | 0.53 | 0.51 | 14.50 | -1.445 | .149 | |
| Establishing a communicative atmosphere | 3.00 | 1.00 | 4.41 | 0.51 | 1.41 | 5.00 | -2.438 | .015* | ||
| Fair and equal treatment | 3.33 | 0.58 | 4.41 | 0.62 | 1.08 | 6.00 | -2.247 | .025* | ||
| Maintaining the learning environment |
Adequacy of learning environment | 4.33 | 0.58 | 4.41 | 0.80 | 0.08 | 21.50 | -0.478 | .633 | |
| Efficient control and operation of class hours | 3.67 | 0.58 | 4.82 | 0.39 | 1.15 | 3.00 | -2.970 | .003** | ||
| Appropriateness of task execution time | 3.67 | 0.58 | 4.18 | 0.81 | 0.51 | 14.50 | -1.296 | .195 | ||
| Adequate use of teaching materials and media | 4.00 | 0.00 | 4.12 | 0.60 | 0.12 | 22.50 | -0.394 | .694 | ||
| Inappropriate teaching behavior | 3.33 | 0.58 | 3.71 | 0.85 | 0.38 | 18.50 | -0.794 | .427 | ||
| Total (M) | 3.61 | 4.19 | 0.64 | |||||||
*p <.05, **p <.01. GAP: Gap(between), U: Mann-Whitney test, Z: Z-value.
Table 6.
Conclusion stage analysis.
| Class Stage | Domain | Detailed Item | In-Service Teachers (n = 3) |
Pre-Service Teachers (n = 21) |
GAP | U | Z | p | ||
|---|---|---|---|---|---|---|---|---|---|---|
| M | SD | M | SD | |||||||
| Conclusion stage |
Routine activity |
Cool-down activities | 4.33 | 0.58 | 4.12 | 0.70 | -0.21 | 22.00 | -0.462 | .644 |
| Injury check | 2.00 | 1.00 | 4.24 | 0.56 | 2.24 | 0.50 | -2.924 | .003** | ||
| Efficient organization of learning materials | 2.33 | 1.15 | 3.47 | 0.94 | 1.14 | 10.00 | -1.768 | .077 | ||
| Summary and evaluation | Confirming the understanding of learning contents | 4.33 | 0.58 | 3.29 | 0.77 | -1.04 | 8.00 | -2.013 | .044* | |
| Encouraging active participation of learners | 4.33 | 0.58 | 4.47 | 0.62 | 0.14 | 21.50 | -0.478 | .633 | ||
| Lesson transfer to daily life | 3.67 | 0.58 | 4.18 | 0.88 | 0.51 | 16.50 | -1.013 | .311 | ||
| Preview of next lesson | 4.33 | 0.58 | 4.59 | 0.51 | 0.26 | 19.00 | -0.797 | .425 | ||
| Total (M) | 3.62 | 4.05 | 0.79 | |||||||
*p <.05, **p <.01. GAP: Gap(between), U: Mann-Whitney test, Z: Z-value.
Disclaimer/Publisher’s Note: The statements, opinions and data contained in all publications are solely those of the individual author(s) and contributor(s) and not of MDPI and/or the editor(s). MDPI and/or the editor(s) disclaim responsibility for any injury to people or property resulting from any ideas, methods, instructions or products referred to in the content. |
© 2023 by the authors. Licensee MDPI, Basel, Switzerland. This article is an open access article distributed under the terms and conditions of the Creative Commons Attribution (CC BY) license (http://creativecommons.org/licenses/by/4.0/).
Copyright: This open access article is published under a Creative Commons CC BY 4.0 license, which permit the free download, distribution, and reuse, provided that the author and preprint are cited in any reuse.


