
Submitted:
29 December 2022
Posted:
04 January 2023
You are already at the latest version
Abstract
Ophelia syndrome is characterized by the coincidence of severe neuropsychiatric symptoms, classical Hodgkin lymphoma, and the presence of antibodies to the metabotropic glutamate 5 receptor (mGluR5). Little is known about the pathogenetic link between these symptoms and the role that anti-mGluR5-antibodies play. We investigated lymphoma tissue from patients with Ophelia syndrome and with isolated classical Hodgkin lymphoma by quantitative immunocytochemistry for mGluR5-expression. Further, we studied the L-1236, L-428, L-540, SUP-HD1, KM-H2, and HDLM-2 classical Hodgkin lymphoma cell lines by FACS and Western blot for mGluR5-expression, and by transcriptome analysis. mGluR5 surface expression differed significantly in terms of receptor density, distribution pattern, and percentage of positive cells. Highest expression levels were found in the L-1236 line. RNA-sequencing revealed more than 800 genes that were higher expressed in the L-1236 line in comparison to the other classical Hodgkin lymphoma cell lines. High mGluR5-expression was associated with upregulation of PI3K/AKT and MAPK pathways and of downstream targets (e.g. EGR1) known to be involved in classical Hodgkin lymphoma progression. Finally, mGluR5 expression was increased in the classical Hodgkin lymphoma-tissue of our Ophelia syndrome patient in contrast to five classical Hodgkin lymphoma-patients without autoimmune encephalitis. Given the association of encephalitis and classical Hodgkin lymphoma in Ophelia syndrome, it is possible that mGluR5-expression on classical Hodgkin lymphoma cells not only drives tumor progression but also triggers anti-mGluR5 encephalitis even before classical Hodgkin lymphoma becomes manifest.
Keywords:
metabotropic glutamate 5 receptor
; anti-mGluR5 encephalitis
; neuroimmunology
; pediatric neu-rology
; pediatric oncology
; transcriptome analysis
; Hodgkin lymphoma
; Ophelia syndrome
1. Introduction
Classical Hodgkin lymphoma is a B-cell lymphoma characterized by the presence of a few giant multinucleated Hodgkin and Reed-Sternberg cells [1]. These cells make up less than 1% of the infiltrated lymphoid tissue and are surrounded by inflammatory cells that form the tumor microenvironment [1,2]. Hodgkin and Reed-Sternberg cells express the CD30 surface marker and thereby define classical Hodgkin lymphoma. The disease is divided into the subtypes (i) nodular sclerosis, (ii) mixed cellularity, (iii) lymphocyte-depleted, and (iv) lymphocyte-rich, which represent the majority of Hodgkin lymphoma [2]. Although Hodgkin lymphoma accounts for only 5-6% of all childhood cancers, it is the most frequent neoplasia in adolescents and young adults between 15-19 years of age with a second peak in elderly individuals [3,4,5].
Classical Hodgkin lymphoma is not only known to be associated with viral infections and autoimmune diseases [6,7,8], but also with atypical immune-mediated phenomena such as paraneoplastic neurological syndromes [9,10,11]. These are often caused by an antibody-mediated response against so-called “onconeural” antigens, e.g., antigens that are expressed by both nervous system and tumor [12]. Thus, ectopic expression of these antigens by classical Hodgkin lymphoma may trigger a misdirected autoimmune response against neuronal structures due to molecular mimicry [13,14]. Paraneoplastic neurological symptoms can precede, accompany, or occur in the wake of classical Hodgkin lymphoma [6,15,16]. Examples are the paraneoplastic cerebellar degeneration (PCD) syndrome, subacute cortical cerebellar degeneration (SCCD), and limbic encephalitis (LE) [9,14,17]. One of the latter was first described as “Ophelia syndrome” by Ian Carr (1982) [14,18,19,20]. It primarily and exceedingly affects children and young adults, who develop severe psychosis with extensive hallucinations, behavioral changes, cognitive dysfunction, seizures, movement disorders, and sleep disturbance [10,18,21,22]. Lancaster et al. (2011) described pathogenic autoantibodies in Ophelia syndrome that target the metabotropic glutamate receptor 5 (mGluR5) and cause a decrease in mGluR5 density on neurons [19]. Early recognition of this anti-mGluR5 encephalitis by cerebrospinal fluid antibody screening is crucial, as patients respond favorably to antibody removal. Most patients recover and benefit from thorough follow-up with early detection of classical Hodgkin lymphoma [18,19]. Although lymphoma occurs in half of all Ophelia cases, there are no reports that have investigated the pathophysiological or functional association between anti-mGluR5 encephalitis and classical Hodgkin lymphoma [18]. Therefore, we set out (i) to investigate the expression of mGluR5 in patients with classical Hodgkin lymphoma (some with and some without a prior encephalitis), (ii) to investigate mGluR5 positivity on CD30+ Hodgkin and Reed-Sternberg cells from biopsy material of these patients, and (iii) to analyze the transcriptome of various established classical Hodgkin lymphoma cell lines for a correlation between mGluR5 mRNA expression and downstream target activation that might promote tumor growth.
2. Materials and Methods
2.1. Patient
We diagnosed anti-mGluR5 encephalitis (Ophelia syndrome) in a 15-year-old boy who presented with acute psychosis, severe encephalopathy, and autonomic dysregulation. Antibody screening revealed the presence of anti-mGluR5 IgG-antibodies in cerebrospinal fluid and serum (Figure 1A and B). Full recovery was only achieved after 22 weeks of ICU treatment and immunotherapy including methylprednisolone, IV immunoglobulins, immunoadsorption, IV and intrathecal rituximab as well as IV bortezomib application. Sixteen months thereafter, the patient developed advanced classical Hodgkin lymphoma of the nodular sclerosing subtype, which responded to EuroNet-PHL protocol treatment [23] obtaining complete remission.
2.2. Immunological studies on tumor tissue from patients and controls
We examined samples obtained from the lymph nodes of the index patient and tissue from n=5 age-matched classical Hodgkin lymphoma-cases without autoimmune encephalitis. Staining was performed on 3 μm tissue sections from formalin-fixed, paraffin-embedded (FFPE) lymph node biopsy specimens using an automated slide staining system (BenchMark XT, Ventana Medical Systems, Tucson, AZ, USA); heat-induced epitope retrieval (Cell Conditioning 1, Ventana), primary staining with anti-mGluR5 (1:250, Cat# PA5-33823, ThermoFisher, Waltham, MA, USA, or Cat# ab27190, Abcam, Cambridge, UK) and automated secondary antibody staining with the DAB detection kit (iVIEW, Ventana Medical Systems).
2.3. Cell lines and culture conditions
We used standard cell lines from classical Hodgkin lymphoma patients of the nodular sclerosing (L-428, HDLM-2, L-540, SUP-HD1) or mixed cellularity (KM-H2, L-1236) subtype, established from pleural effusions (HDLM-2, KM-H2, L-428, SUP-HD1), bone marrow (L-540), or peripheral blood (L-1236) [24,25,26,27,28,29]. Jurkat cells served as negative control. Cells were cultured in RPMI-1640 GlutaMAX (Invitrogen) supplemented with 10% fetal bovine serum and 1% penicillin/streptomycin and maintained in a 5% CO2 humidified atmosphere at 37°C.
2.4. Immunocytochemistry – surface antigen labeling and quantification
We performed immunocytochemistry (ICC) with patient cerebrospinal fluid on fresh-frozen murine brain sections and on mGluR5-expressing HEK293T cells as described previously [30,31]. Further we seeded 5 x 10⁵ classical Hodgkin lymphoma cells on poly-L-lysine (Sigma) coated coverslips in 12-well plates. Cells were fixed with 4% paraformaldehyde, blocked with 5% normal goat serum and 2% bovine serum albumin for 1 h at RT and incubated with the primary antibodies against mGluR5 (1:250, Cat# ab76316, Abcam, Cambridge, UK) and CD30 (1:80, Ber-H2, Cat# M0751, Dako, Jena, Germany) O/N at 4°C. Secondary staining was done with a fluorophore-conjugated anti-rabbit-IgG antibody (Alexa Fluor 488, 1:1,000, Cat# A-11008, Invitrogen, Waltham, MA, USA) and anti-mouse antibody (Alexa Fluor 568, 1:250, Cat# A-11004, Invitrogen) for 1 h followed by incubation with 4’,6-diamidino-2-phenylindole (DAPI; 1:1,000; Cat# D1306, Invitrogen). Fluorescence was recorded using a THUNDER Imager DMi8 with a Leica DFC9000 GT camera and the LAS(X) software (Leica Microsystems, Wetzlar, Germany). The imaging parameters (illumination light intensity, aperture, exposure time, camera sensitivity) were strictly kept constant for all recordings. For comparison of anti-mGluR5 and anti-CD30 staining intensities, we used the Fiji/ImageJ v.2.3.0/1.53 software. We used the ROI of the nuclear DAPI signal to find the single cells and radially extended the respective ROIs by 1 μm to also cover the cytosol and cell membrane. We then recorded the Integrated Densities over all ROIs for each fluorophore from a total of 1,000 cells per sample. The distributions of the Integrated Density values were visualized on a dotplot using the RStudio v.1.4.1106 software (Figure 2C).
2.5. Western blot
We extracted protein with cell lysis RIPA Buffer (50 mM Tris-HCl pH 8.0, 150 mM NaCl, 1% NP-40, 0.5% sodium deoxycholate, 0.1% SDS, Complete® protease inhibitors). Samples were treated with 4x LDS loading buffer (NuPAGE®) and DTT (NuPAGE® sample reducing agent). 150 µg of each classical Hodgkin lymphoma cell line and Jurkat cells (negative control) were loaded onto a gradient 4-12% NuPAGE® Bis-Tris gel (MES Running buffer; 150 V; XCell Surelock Mini-cell) without boiling. Blots were incubated with respective primary anti-mGluR5 (monoclonal rabbit antibody, 1:1,000, Cat# ab76316, Abcam) and anti-α-Tubulin (1:1,000, Cat# MCA77G, Bio Rad, Hercules, CA, USA) antibodies O/N at 4°C and stained with corresponding HRP-labeled secondary antibodies: anti-rabbit-IgG (1:2,000, Cat# DC03L, Calbiochem, San Diego, CA, USA) and anti-rat-IgG (1:2,000, Cat# DC01L, Calbiochem). For detection we used ECL (Amersham plc, Amersham, UK) and a gel imager (VWR Image Capture Software, Radnor, PA, USA). For verification of the characteristic mGluR5 banding pattern, we loaded protein extracts from the L-1236 Hodgkin lymphoma cell line and 1 µg of mouse brain (positive control side-by-side and performed a Western blot as described above (Supplementary Figure S1)
2.6. Quantitative reverse-transcription quantitative polymerase-chain-reaction
We performed reverse-transcription quantitative polymerase-chain-reactions (RT-qPCR) for relative quantification of GRM5 gene expression on an ABI 7000 Prism sequence detection system (Applied Biosystems, Waltham, MA, USA) with triplicates in three independent reactions for each sample. Each RT-qPCR reaction contained transcript-specific oligonucleotide primers (for primer sequences see Supplementary Table S1), cDNA of the cell lines of interest, and SYBR Green Master Mix (#4309155; Life Technologies, Carlsbad, CA, USA) in a 20 μl volume. The following cycling conditions were used: 50°C for 2 minutes, 95°C for 10 minutes followed by 40 cycles of 95°C for 15 seconds, 60°C for 1 minute and final ramp from 60-90°C for melting curve recording. For generation of a standard curve we prepared a 1:10 serial dilution of 16 steps from the respective PCR-products and ran them under the above conditions. For calculation of the PCR-efficiency we used the n=7 dilutions that provided the best linear regression line. Relative target gene expression was calculated by the efficiency corrected ΔΔCt method by Pfaffl et al. (2001) using HPRT as reference gene [32].
2.7. Fluorescence-activated cell sorting (FACS)
For FACS analysis, a standard staining procedure was applied. Each classical Hodgkin lymphoma cell line was harvested, washed, and resuspended in FACS buffer (PBS, 10% FBS, 0.1% NaN3) to a concentration of 5 x 10⁶ cells/mL. Cells were incubated with primary antibodies against mGluR5 (1:250, Cat# ab27190, Abcam, Cambridge, UK) and CD30 (1:80, Ber-H2, Cat# M0751, Dako, Jena, Germany) for 2 h on ice. Cells were washed thrice with 1x PBS. The secondary antibodies (anti-rabbit-IgG antibody, Alexa Fluor 488, 1:1,000, Cat# A-11008, Invitrogen, Waltham, MA, USA and anti-mouse antibody, Alexa Fluor 568, 1:250, Cat# A-11004, Invitrogen) were added and incubated for 2 h on ice. Labeled cells were washed thrice with 1x PBS, centrifuged each time at 500 x g for 5 minutes at 4°C, and resuspended in 500 μL of ice-cold FACS buffer for flow cytometry. Cells were double-labeled for Hodgkin lymphoma tumor marker CD30 and for cell surface receptor mGluR5. The gating strategy comprised the exclusion of dead cells and debris (forward and side scatter) as well as doublets (plotting height and width against area), and aimed for the double-positive (mGluR5+|CD30+) cells, using a fluorescence activated cell sorter (FACS) Aria II (Beckton Dickinson, Heidelberg, Germany).
2.8. Gene expression profiling
We extracted total RNA from all six classical Hodgkin lymphoma cell lines (5 x 10⁵ cells each) using the NucleoSpin® RNA Plus Kit (Macherey and Nagel, Düren, Germany). Quality of the RNA was controlled via the 2100 Bioanalyzer (Agilent Technologies, Santa Clara, CA, USA). RNA-sequencing was done on a polyA+ enriched cDNA library on the BGISEQ-500 RNA-Sequencing pipeline (Beijing Genomics Institute, Hong Kong) yielding >40 Mio FASTQ 100 paired-end stranded reads that were quality controlled using FastQC v0.11.8 and then aligned to the human reference sequence (GRCh37.75) with the STAR 2.4.0.1 aligner [33]. Resulting BAM files were further investigated and normalized with the StringTie v2.2.1 pipeline [34,35], which yielded the relative mRNA quantities for each transcript present in the transcriptome dataset. As a quantitative measure for gene abundance, we used the FPKM value (fragments per kilobase of transcript per million mapped reads), which is calculated by the StringTie software. To control for multiple testing in the gene expression studies, we calculated the false discovery rate (FDR) [36]. Gene expression differences between the n=1 “GRM5 high-expressing” (L-1236) and the n=5 “GRM5 low-expressing” (L-428, L-540, SUP-HD1, KM-H2, HDLM-2) cell lines were considered significant if the up- or down-regulation was by a factor of five or larger and the FDR was < 0.05. Differential gene expression yielded over 800 genes that were upregulated by > 10-fold in L-1236. Genes of interest were annotated using the database for Annotation, Visualization, and Integrated Discovery (DAVID) tool [37].
2.9. Statistics
Quantitative data are presented as the mean±SD of results obtained from at least three independent experiments. Significance levels of ICC signal variation, RT-qPCR relative expression levels, and Western blot densities were determined by one-way analyses of variance (ANOVA) and Tukey’s Multiple Comparison Test. A probability of < 0.05 was considered statistically significant, indicated in the graphs as p < 0.05 (*), p < 0.01 (**), p < 0.001 (***); n.s., not significant. Statistical analyses and graphing were performed with RStudio Software Version 4.1.3, Image J, and GraphPad Prism v9.2 (GraphPad Software, Inc., La Jolla, CA).
3. Results
3.1. mGluR5 is expressed on Hodgkin lymphoma tissue at varying levels
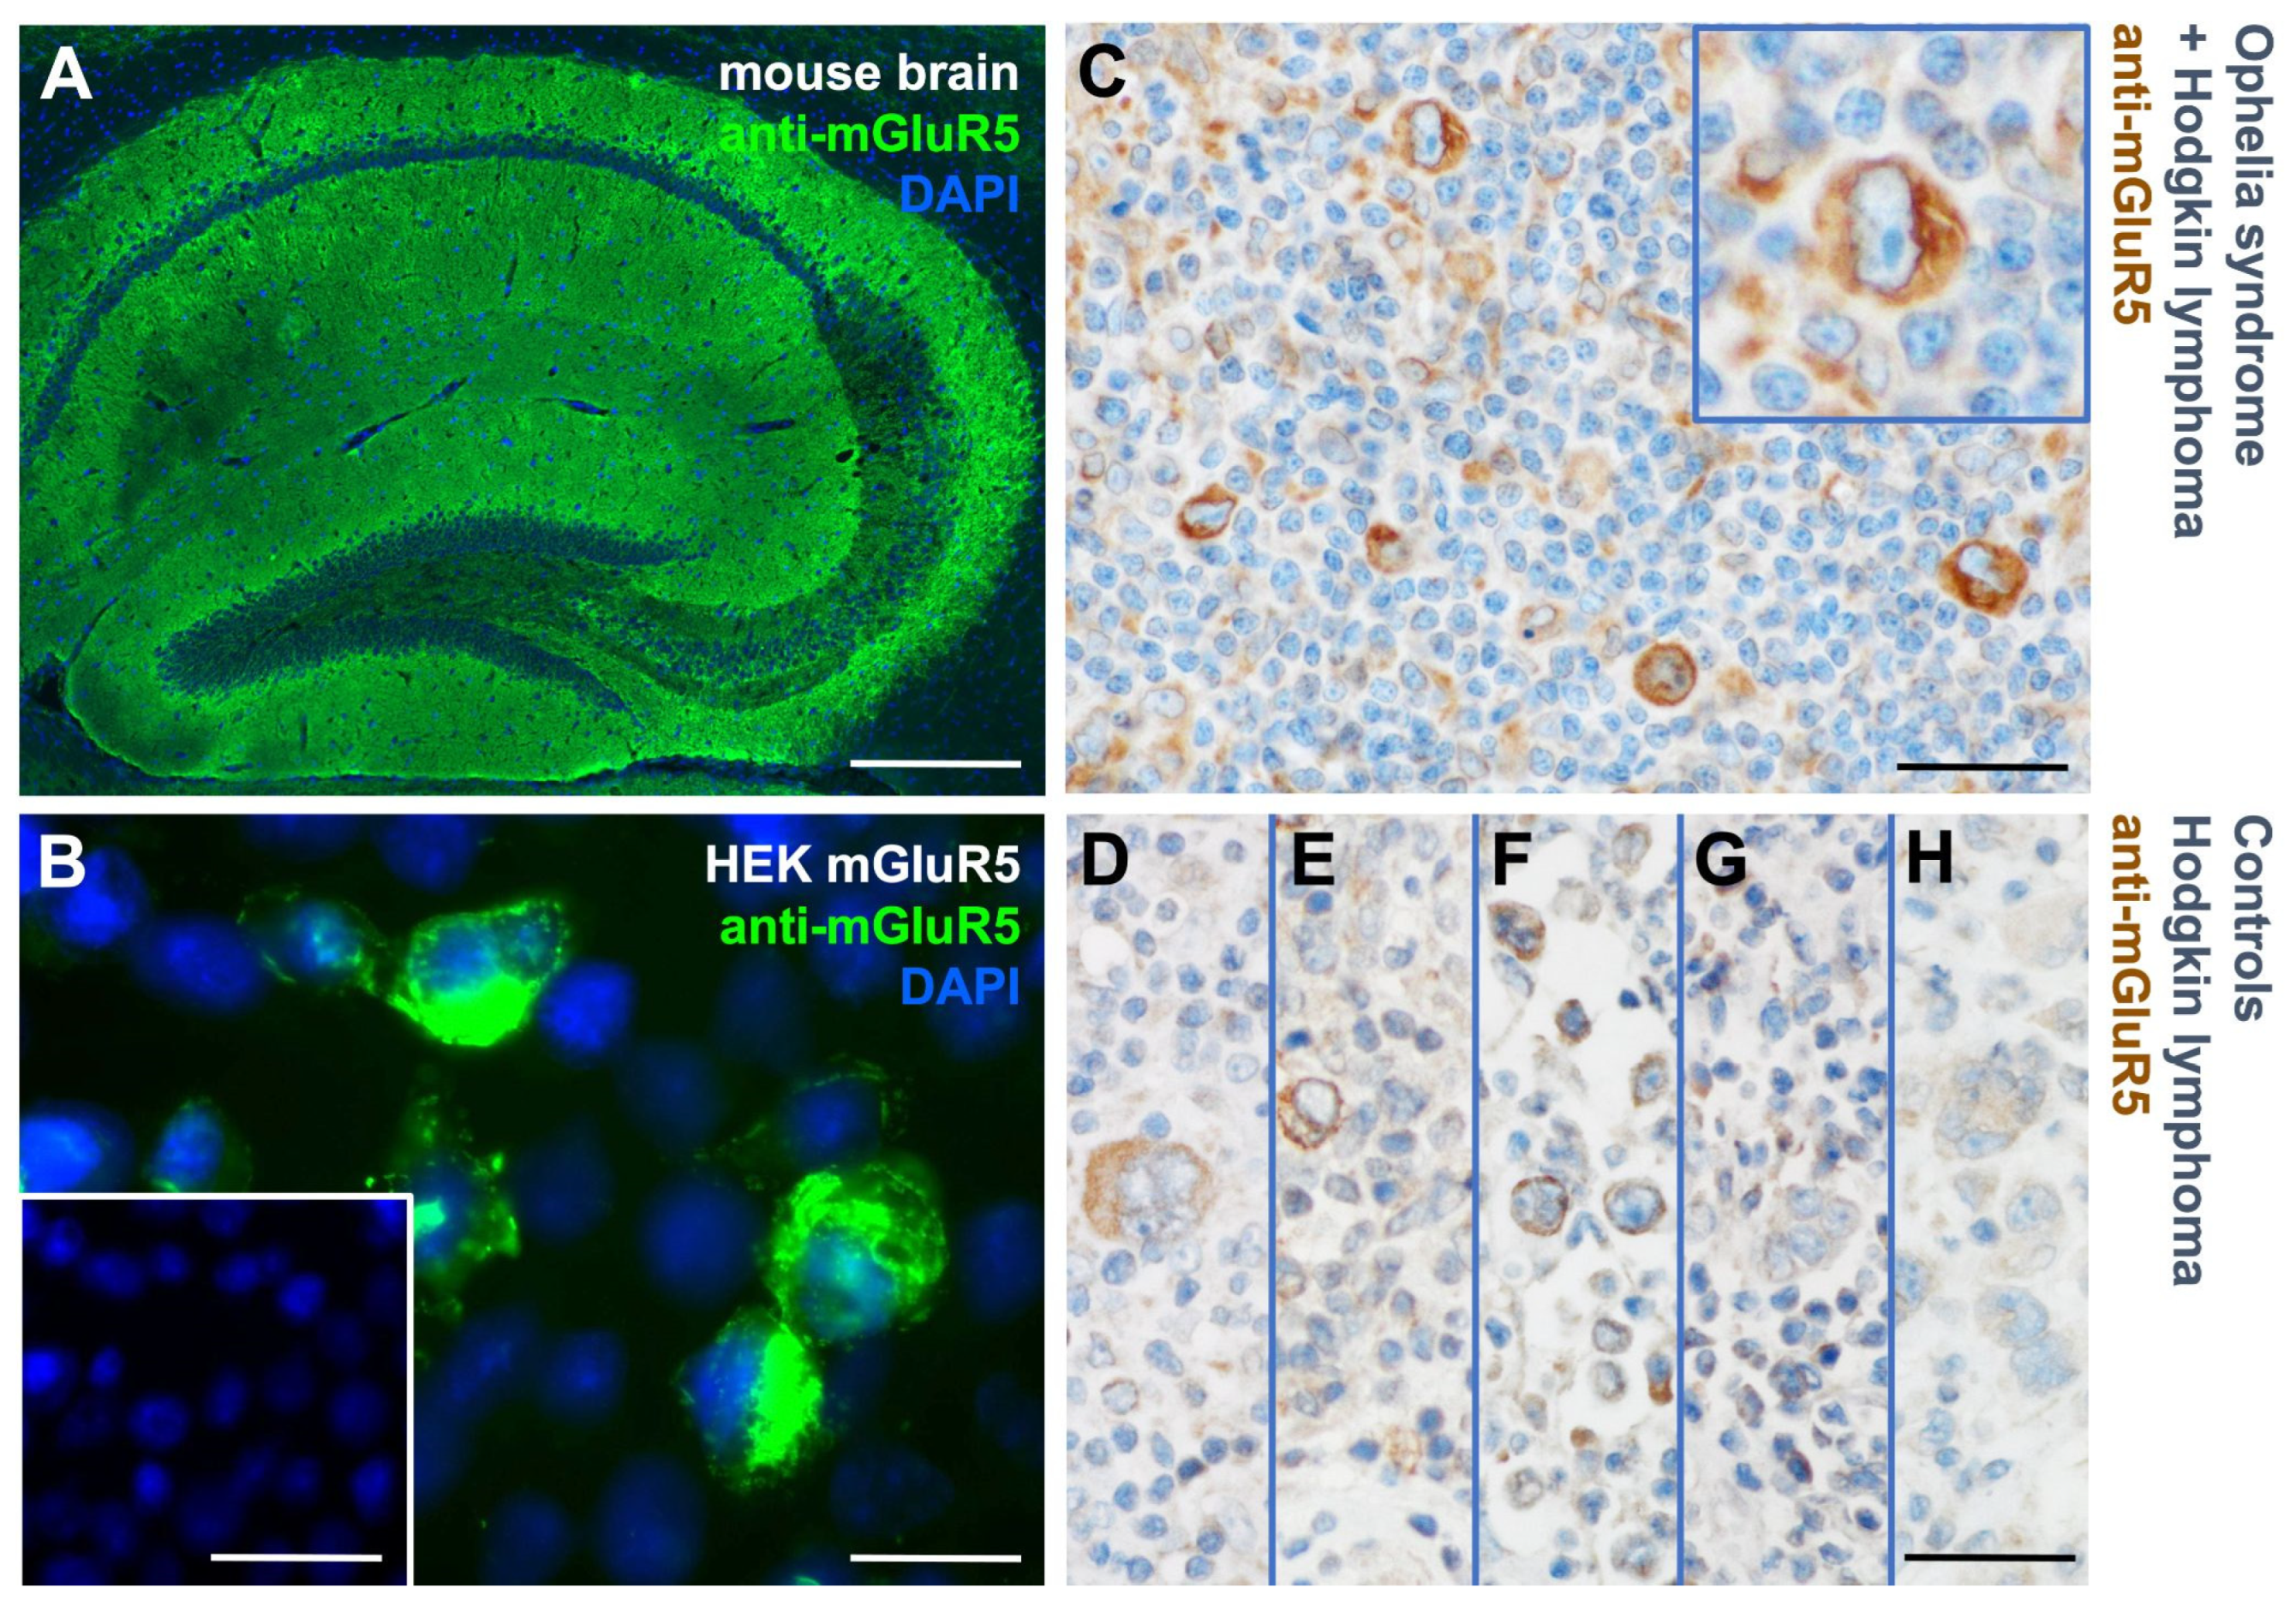
To investigate a possible link between encephalitis and classical Hodgkin lymphoma, we performed immunostaining with anti-mGluR5 antibodies on tumor biopsy specimens from our patient with Ophelia syndrome and in n=5 classical Hodgkin lymphoma patients without autoimmune encephalitis.
The index patient’s tumor revealed an intensive mGluR5 signal on classical Hodgkin lymphoma cells (Figure 1C). Controls showed a heterogeneous immunoreactivity pattern with far fewer positive cells and weaker intensities (Figure 1D-H). These initial findings prompted our further examination of mGluR5 expression in classical Hodgkin lymphoma cell lines.
Figure 1.
Detection of anti-mGluR5 antibodies in the cerebrospinal fluid and of mGluR5 protein expression in the tumor cells of a patient with Ophelia syndrome. (A) Immunostaining of fresh frozen mouse hippocampus with the patient’s cerebrospinal fluid depicts reactivity typical for anti-mGluR5 antibodies. (B) Patient’s cerebrospinal fluid immunostaining on mGluR5-expressing HEK293T cells shows clear reactivity in contrast to control (inset). (C) ICC with commercial anti-mGluR5 antibodies on a tumor biopsy specimen of the patient after developing classical Hodgkin lymphoma reveals mGluR5+ Hodgkin and Reed-Sternberg cells. (D-H) Biopsy specimens from patients with classical Hodgkin lymphoma but without encephalitis (controls) demonstrate only weak or absent anti-mGluR5 reactivity. Size bars: 100 µm (A, inset of B, C-H), 20 µm (B and inset of C).
3.2. Heterogeneous mGluR5 expression patterns
To characterize anti-mGluR5 staining intensities and distributions, as well as mGluR5/GRM5 expression levels, we investigated six classical Hodgkin lymphoma cell lines. Jurkat cells served as controls. We performed immunofluorescence co-staining of mGluR5 and CD30 and were able to detect mGluR5 predominantly in the L-1236 and to a lesser extent in the KM-H2 cell lines. In the other cell lines we mainly recorded low background fluorescence (Figure 2). Immunostaining of the L-1236 line revealed a specific distribution of the mGluR5 signals not seen in the other cell lines, with mGluR5 appearing to form a cluster on the cell surface, while a more even cell membrane distribution was seen in the the KM-H2 line (100x magnification on Figure 2B; for 3D-reconstruction see Supplementary Figure S2). In the L-1236 and KM-H2 lines, anti-mGluR5 signals varied considerably and cells that were anti-CD30 positive showed a tendency for higher anti-mGluR5 staining intensities (Figure 2A,B). The anti-CD30 staining varied also across the cell lines. The highest percentage of anti-CD30 positive cells was seen in the L-428 and L-540 lines, which had the lowest anti-mGluR5 signals (Figure 2).
Figure 2.
Comparative analysis and quantification of mGluR5 immunostaining in classical Hodgkin lymphoma cell lines. (A) Immunostaining of classical Hodgkin lymphoma cell lines using exactly the same imaging parameters to be able to distinguish between the various expression levels for CD30 (red) and mGluR5 (green). Nuclei were stained by DAPI (blue). Jurkat cells, as negative controls, expressed very low levels of CD30 and mGluR5. (B) Co-immunostaining of anti-CD30 (red) and anti-mGluR5 (green). (C) Dotplots generated with the ggbeeswarm::geom_beeswarm() feature of R!. Staining intensities were given as relative Integrated Density units of the 8 bit b/w images. 1,000 cells from each sample were plotted; the white dot depicts the mean and the white whiskers the SD. The Y-axis is adjusted to a log10 scale.
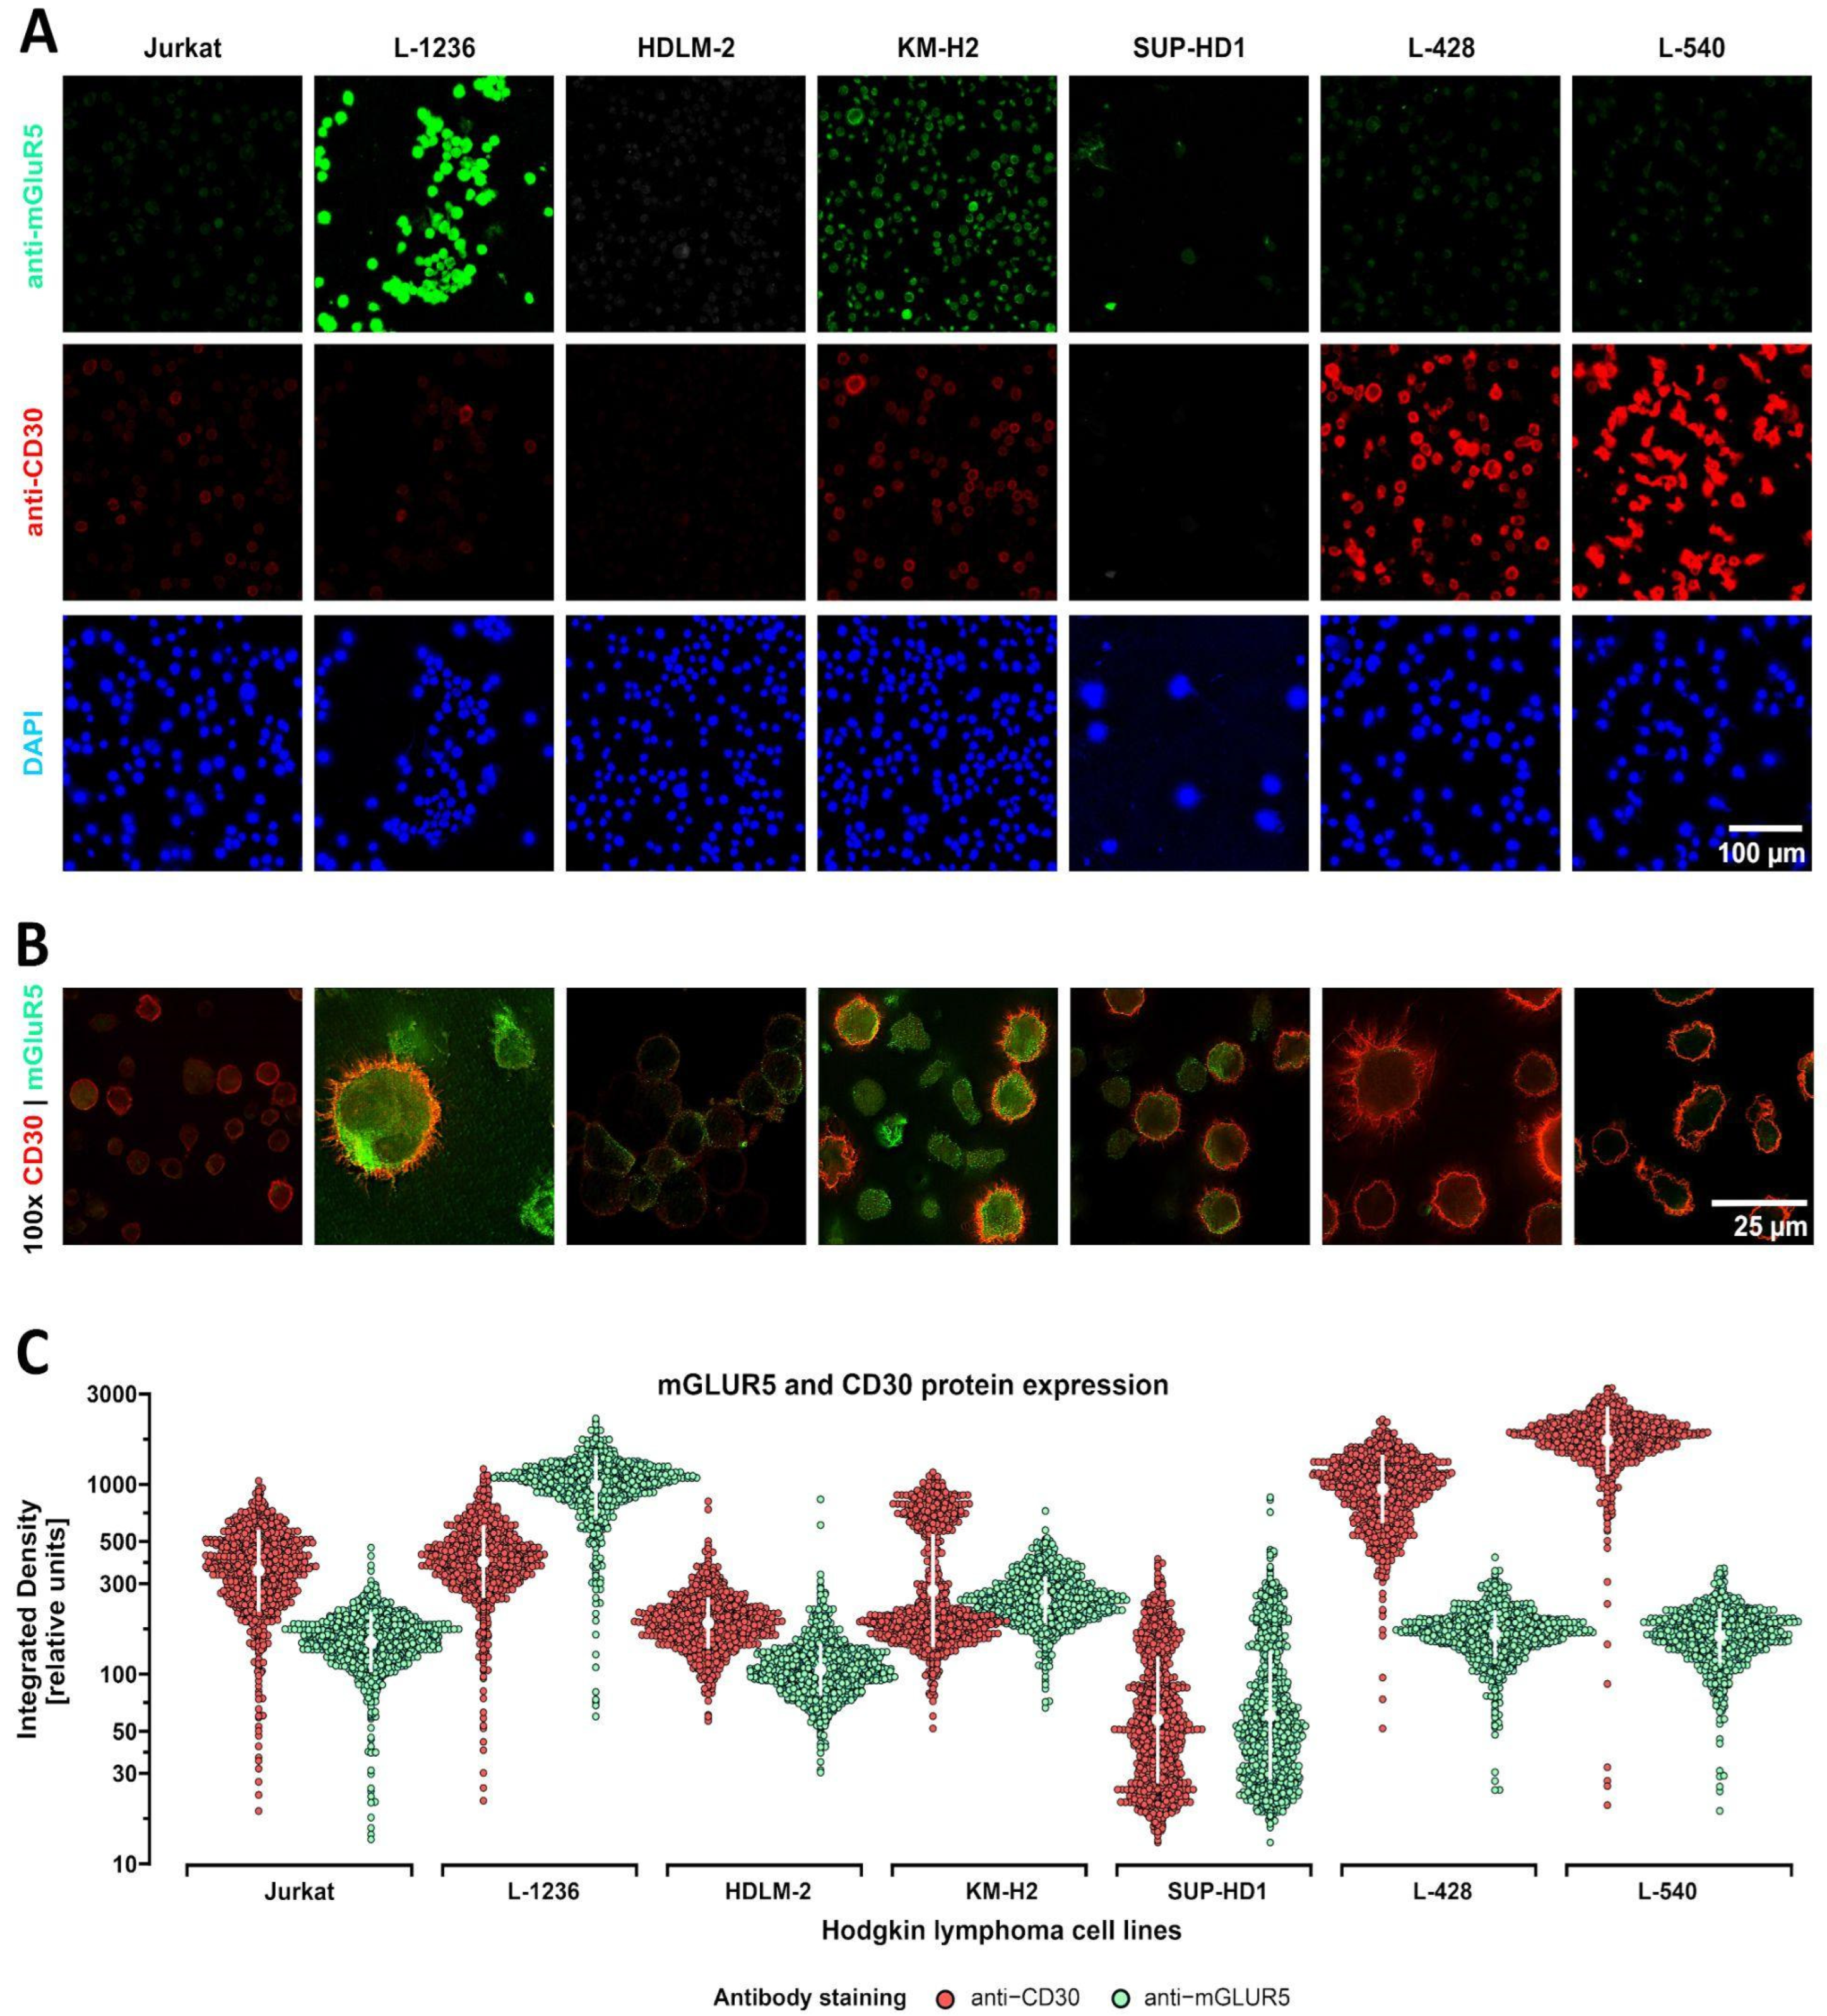
In summary, immunostaining detected strong, moderate, and weak/absent staining intensities, depending on the cell line. Clearly detectable immune signals in the majority of cells were only seen in the L-1236 and KM-H2 cell line. The overall staining intensities of the HDLM-2, SUP-HD1, L428, and L-540 lines were very low (in the range of background fluorescence). The distribution pattern of mGluR5 on the cell surface varied considerably between the different cell lines but also between single cells of the same line. A similar tendency of not uniform staining, with the exception of the L-540 line, was seen for the CD30 marker. This staining pattern is typical for classical Hodgkin lymphoma and shows that not every tumor cell expresses this characteristic marker permanently [38,39].
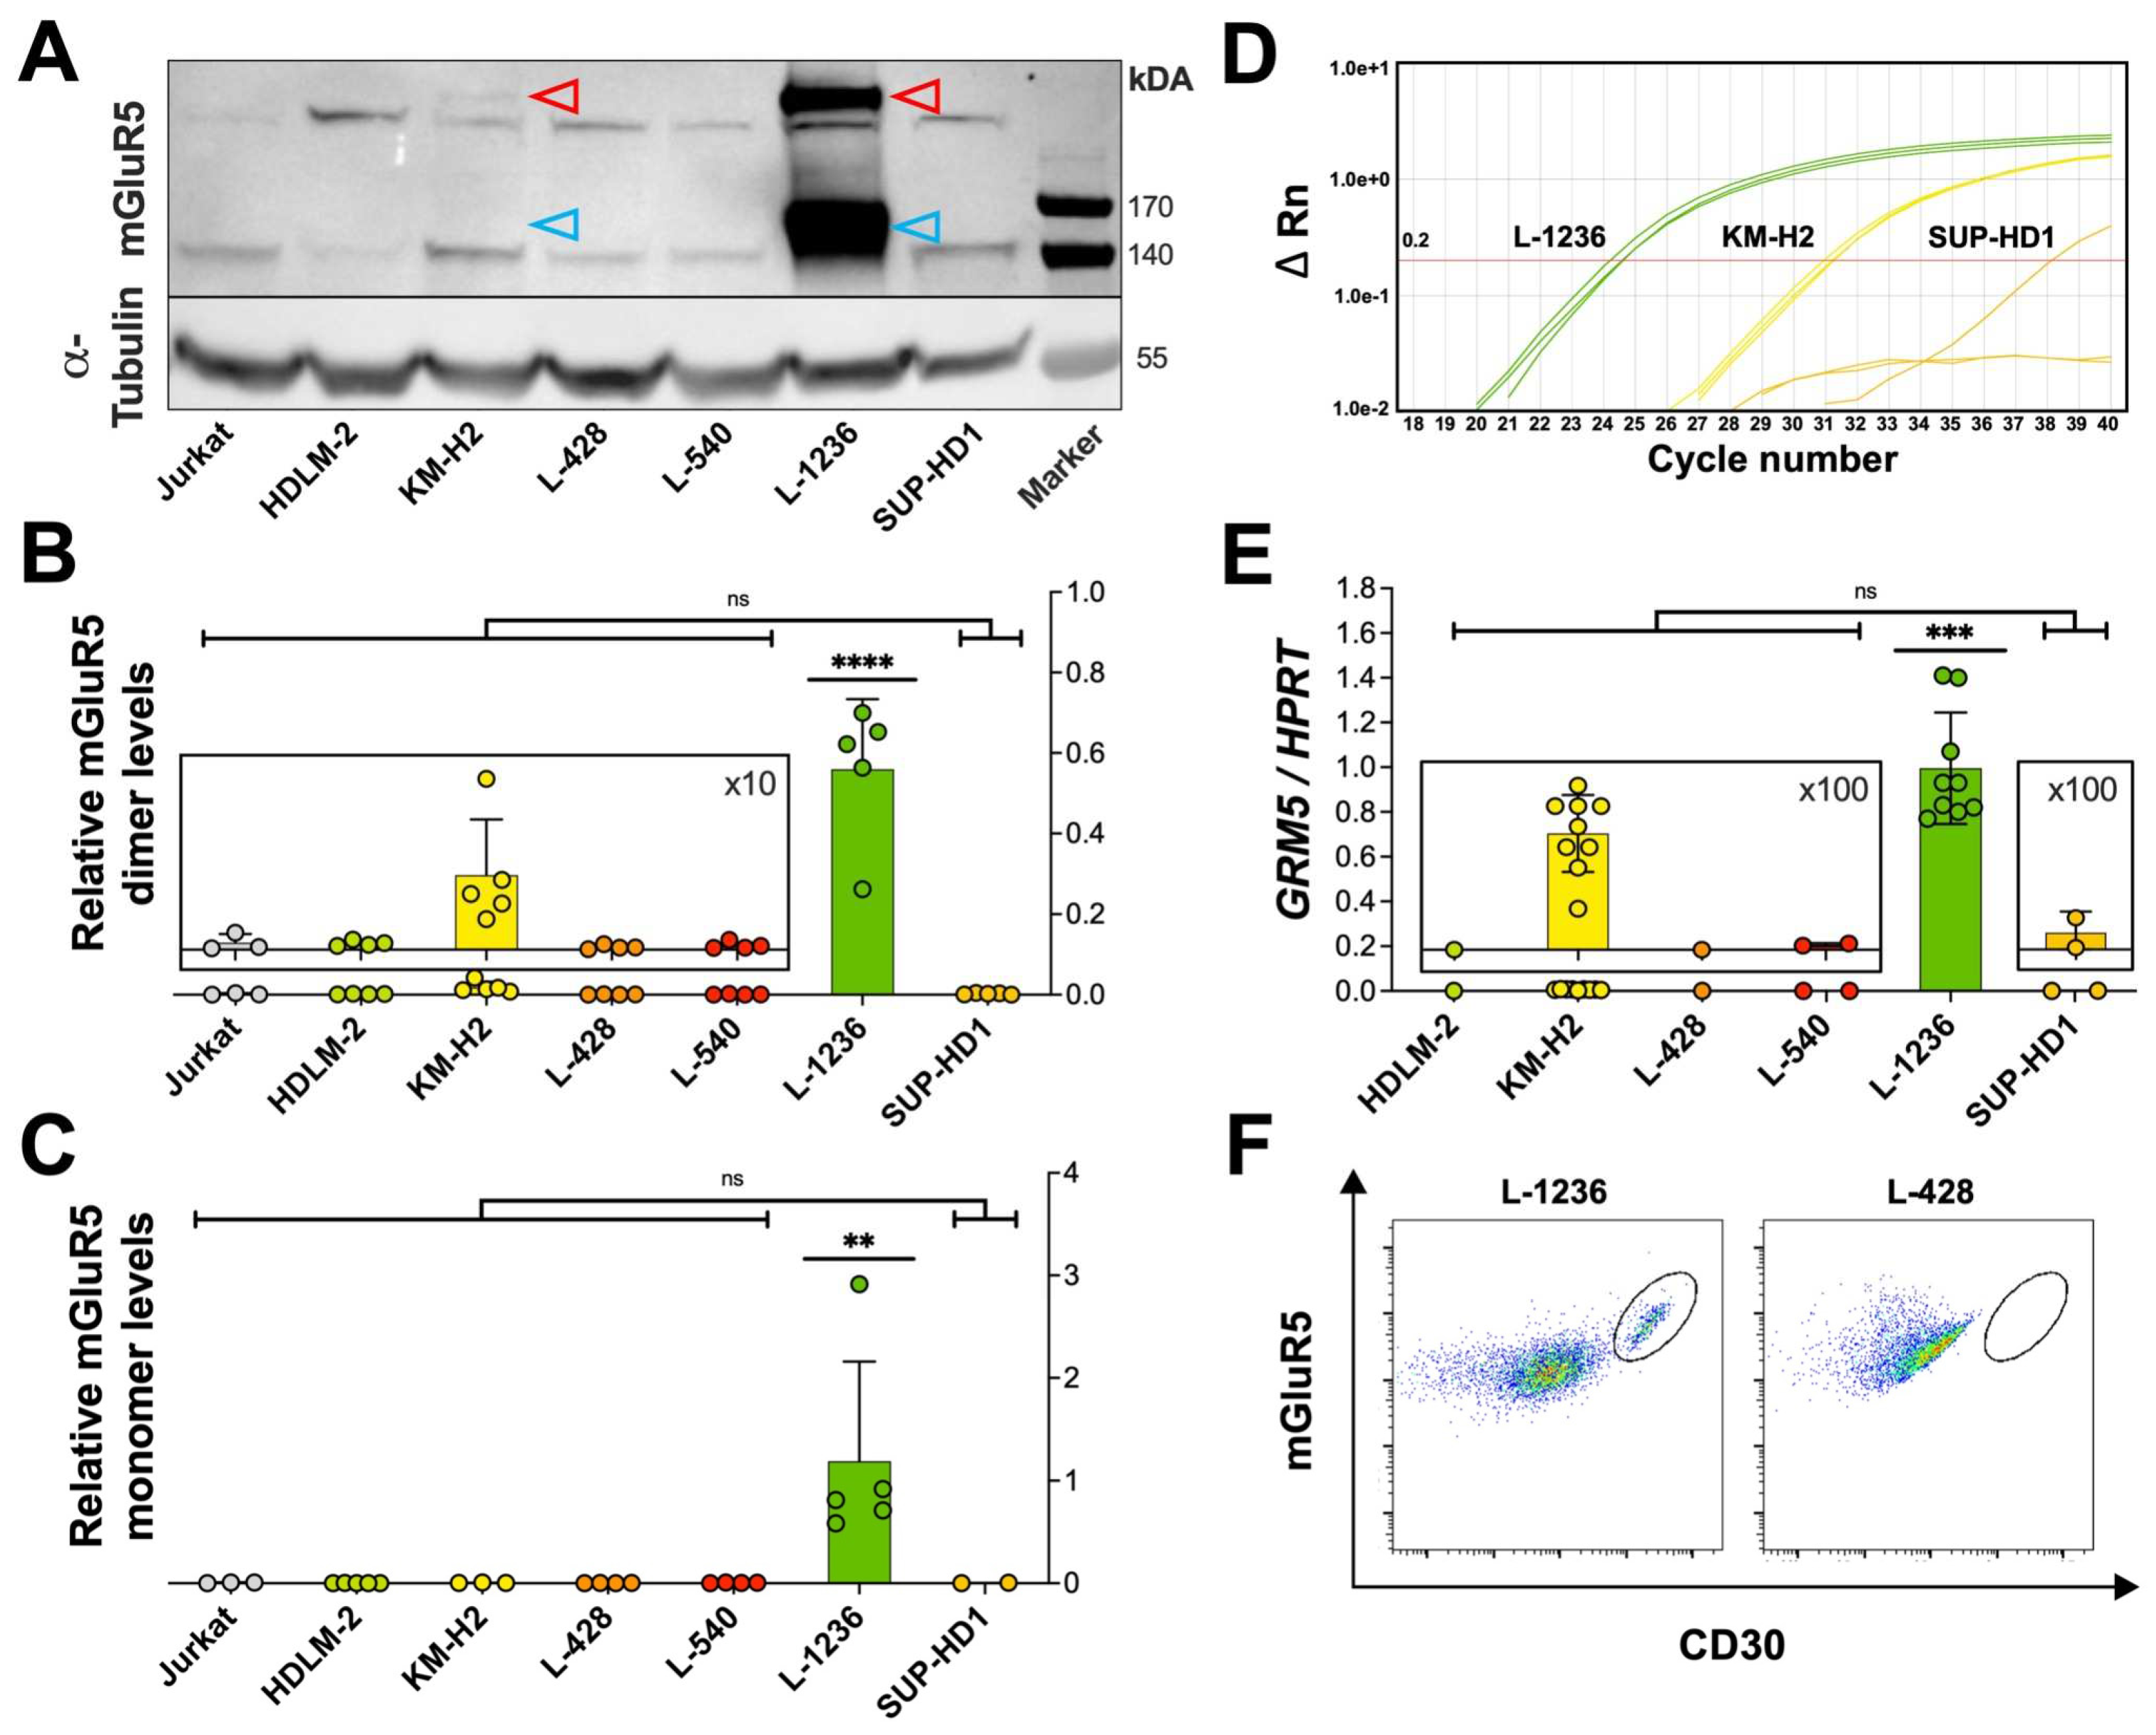
To further quantify mGluR5/GRM5 expression in classical Hodgkin lymphoma cells, we extended our investigations using immunoblotting and RT-qPCR (Figure 3A-E). On the protein level, we detected two major bands, one at ~150 kDa, corresponding to the known monomeric form of mGluR5 and another at ~280 kDa corresponding to the disulfide-bond linked dimeric form of mGluR5 [40,41]. Considerably weaker bands at 140 kDa and 270 kDa were seen in all cell lines including Jurkat controls and were thus regarded as non-specific (Figure 3A). Overall, mGluR5 protein abundance was by far highest in the L-1236 line (p < 0.0001) as compared to all other classical Hodgkin lymphoma cell lines.
In RT-qPCR, the mGluR5 encoding GRM5 gene could be consistently amplified only in the two L-1236 and KM-H2 lines. In the RNA-sequencing experiment this high variance in GRM5 mRNA copy numbers was confirmed (Figure 4A).
These findings encouraged us to proceed with flow cytometry to quantify mGluR5-positive cells in all six classical Hodgkin lymphoma cell lines in an unbiased manner. Looking at the FACS data from the L-1236 line, a subpopulation of double-positive (mGluR5+|CD30+) cells was easily distinguishable (Figure 3F), amounting to 10% of all viable cells. In the other classical Hodgkin lymphoma cell lines, either no distinct subpopulation of double-positive cells was found (L-428, HDLM-2), or the subpopulation was barely visible and the percentage of mGluR5+|CD30+ cells was significantly lower (below 6% for L-540, KM-H2, SUP-HD1) (Figure 3F, Supplementary Figure S3).
Overall, immunohistochemistry, Western blot, RT-qPCR, and FACS consistently indicate heterogeneous mGluR5 expression, which was exceptionally high in the L-1236 line as compared with the other classical Hodgkin lymphoma cell lines.
To verify these results at the population level, we reanalyzed published gene expression data (Affymetrix microarray data) from a n=130 cohort of patients with classical Hodgkin lymphoma [42]. In a subset of n=6 patients (~5%) we detected a high expression of GRM5 (Supplementary Figure S4 and Table S2). These results corroborate our findings from classic Hodgkin cell line analysis.
Figure 3.
Relative mGluR5 protein levels and GRM5 mRNA expression. (A) Representative Western blot with different mGluR5 expression levels on six classical Hodgkin lymphoma cell lines. The anti-mGluR5 antibody detects two specific bands: one band of higher molecular weight at ~280 kDa representing the mGluR5 dimer and its monomeric form at ~150 kDa. Signal intensities of dimeric (B) and monomeric (C) mGluR5 from three immunoblots were normalized to α-Tubulin expression. The L-1236 cell line (green) shows by far the highest expression of mGluR5. Jurkat cells serve as negative control. (D) Amplification plot of RT-qPCR from classical Hodgkin lymphoma cell lines, depicting consistent amplification of the GRM5 target gene only in the L-1236 and KM-H2 lines in all three RT-qPCR reactions and in SUP-HD1 in only one out of three RT-qPCR reactions with a high Ct value. Fluorescence is plotted on a log-scale with ΔRn (horizontal lines) against cycle numbers (Ct value) (vertical lines). The threshold for detection was set at a ΔRn = 0.2. (E) Large variations in GRM5 expression determined by RT-qPCR. L-1236 shows by far the highest amount of GRM5 per HPRT mRNA copy number. (F) Representative dot plots from flow cytometry analysis with the six classical Hodgkin lymphoma cell lines. L-1236 but not L-428 shows a distinct mGluR5+|CD30+ subpopulation (gate) (after exclusion of dead cells and doublets). All bars represent the mean and SD of three independent experiments. * (p < 0.05), ** (p < 0.01), and *** (p < 0.001) indicate the significance levels between classical Hodgkin lymphoma cell lines, ns = not significant. Significance values were calculated with one-way ANOVA followed by Tukey’s multiple comparison test.
3.3. mGluR5 expression is correlated with sustained activation of glutamatergic signaling pathways
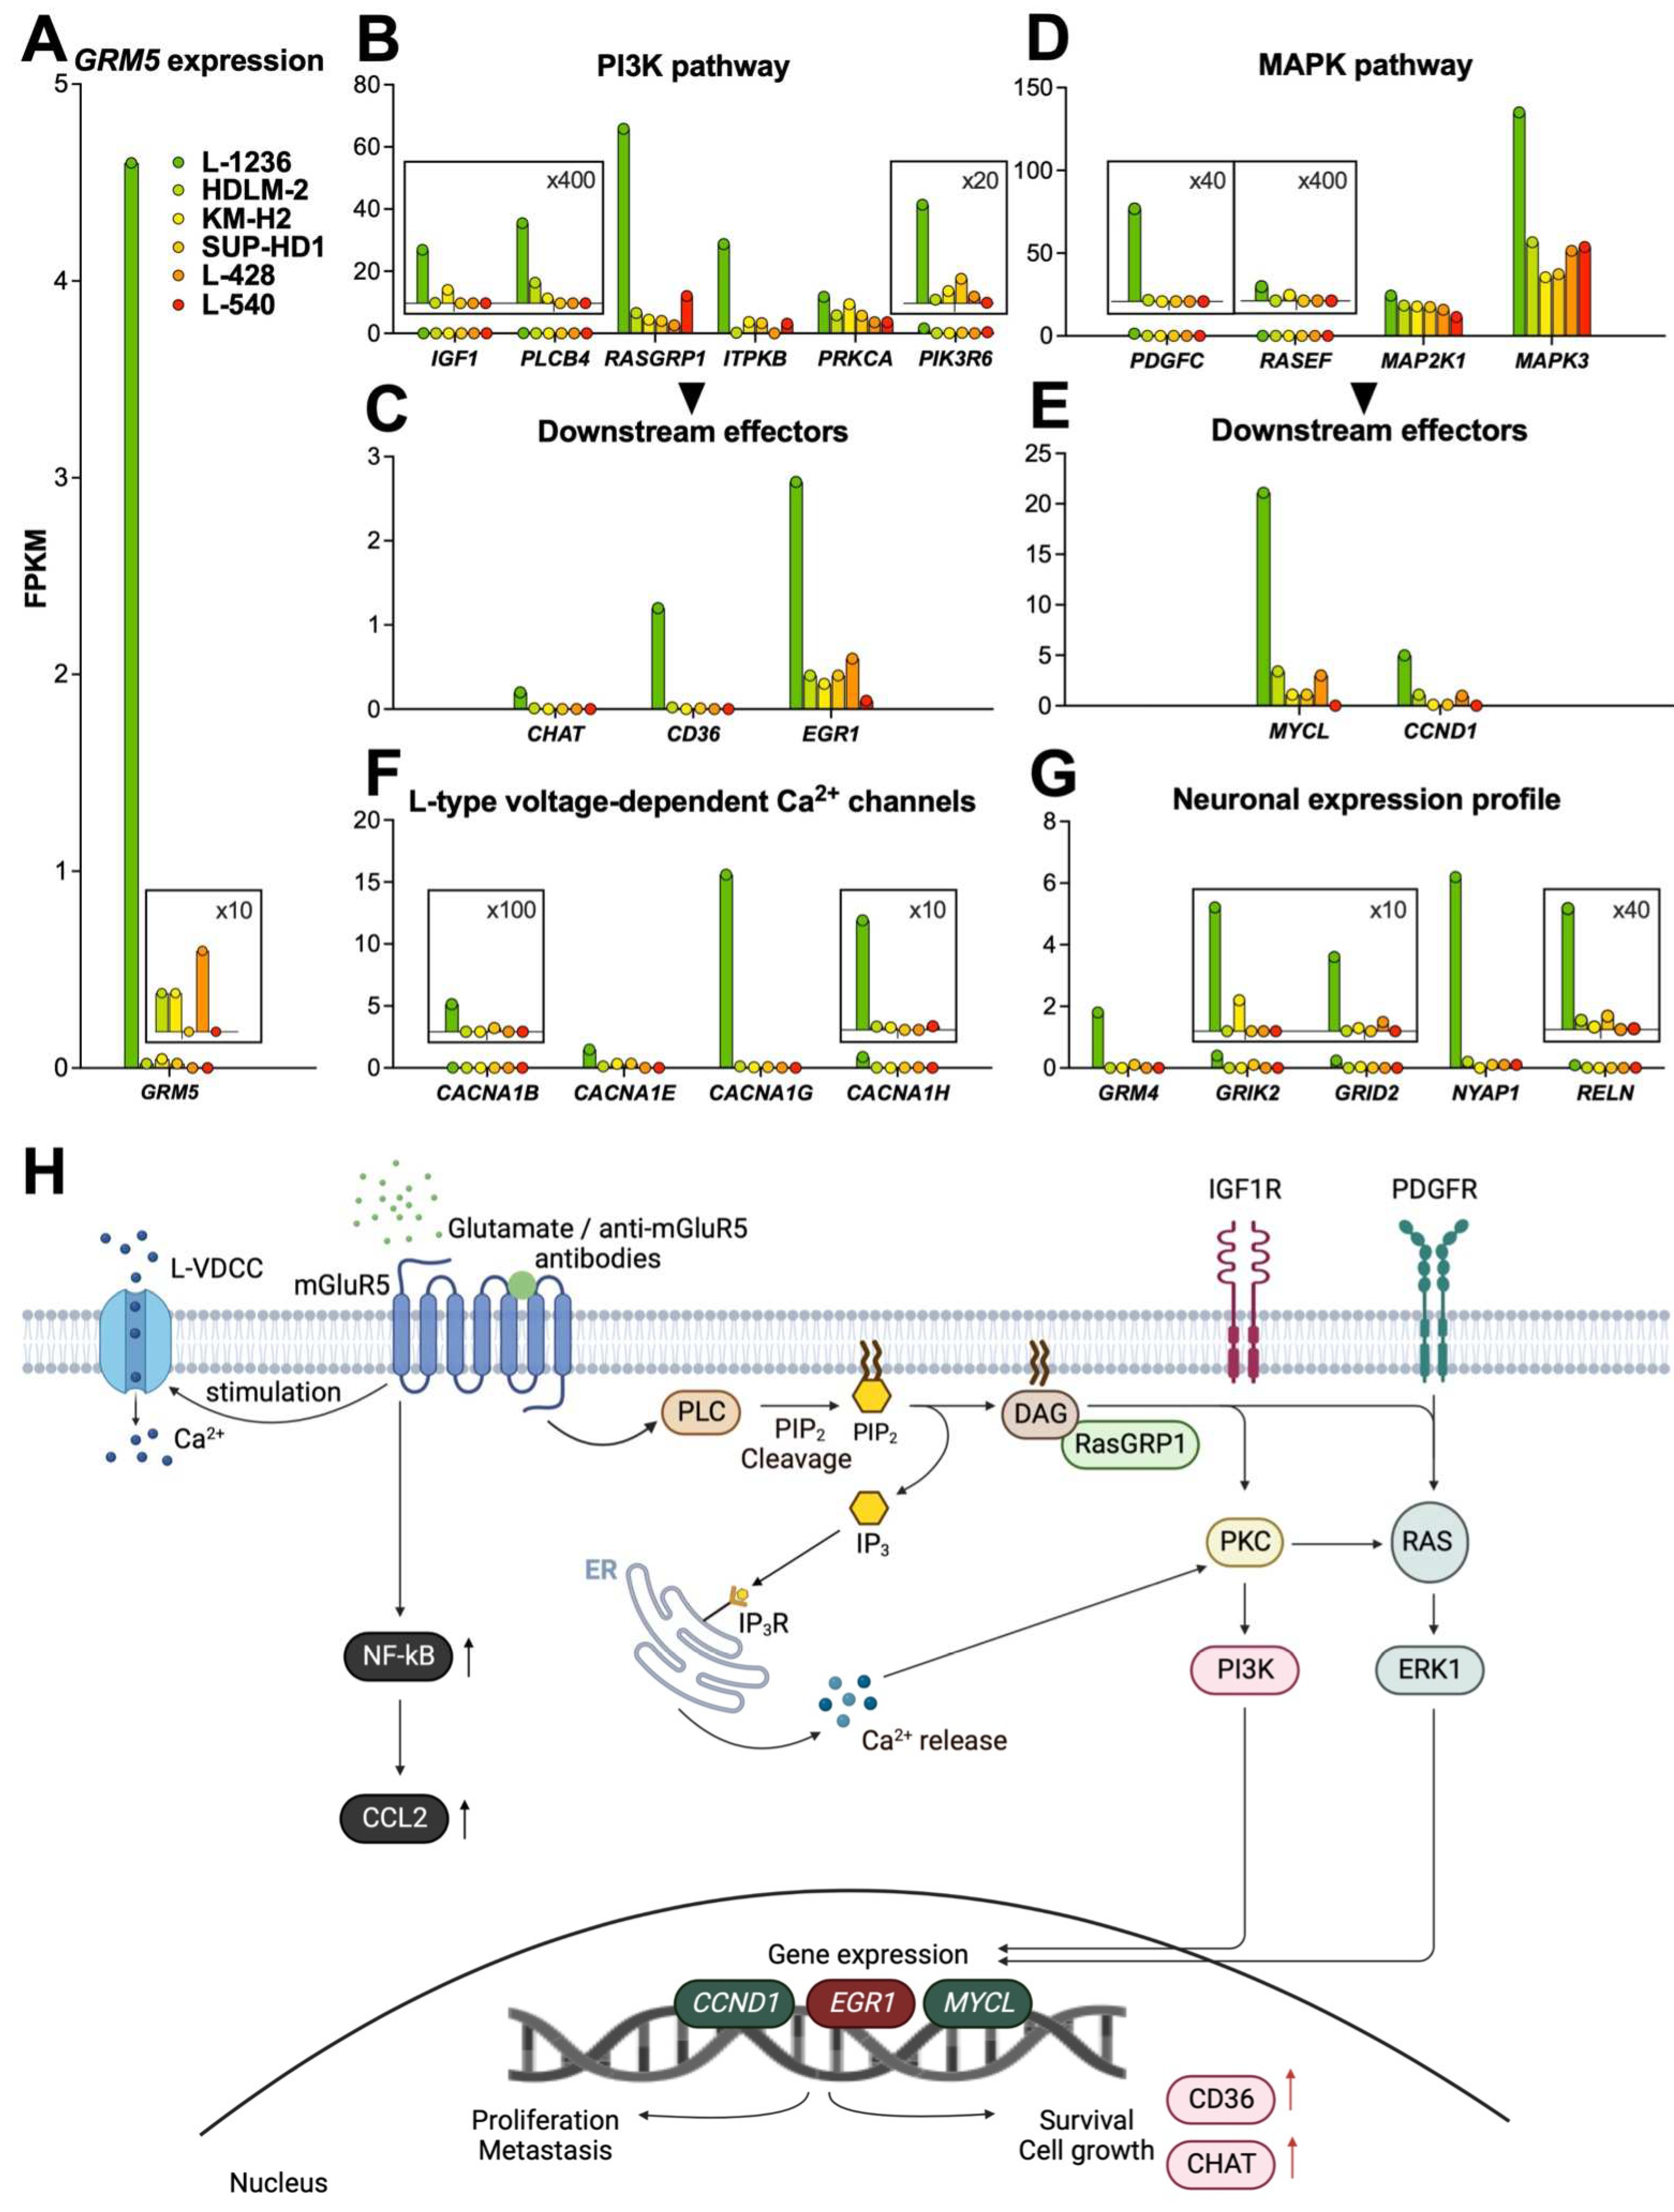
To investigate whether the highly variant mGluR5 expression would have an effect on cell physiology, we performed RNA-sequencing of all six classical Hodgkin lymphoma cell lines. The gene expression profile of L-1236 was markedly different from that of the other cell lines and data analysis revealed that together with GRM5, more than 800 genes were upregulated (≥ 10-fold).
For further analysis, we grouped the genes by G-protein coupled receptor (GPCR)- related signaling pathways (Supplementary Table 3). Most strikingly, several genes involved in mGluR5-linked signal transduction were overexpressed, indicating hyperactivity of two fundamental pathways (PI3K and MAPK) that control many processes essential for tumor growth and survival (Figure 4A-H). In the following paragraphs we depict the fold increase of mRNA transcript numbers (given as FPKM values) of L-1236 over the average expression in the remaining n=5 classical Hodgkin lymphoma cell lines. In summary, we identified upregulation of several genes, particularly of the PI3K and MAPK pathways, as a characteristic signature of the L-1236 cell line.
Figure 4.
GRM5-related gene expression profile of classical Hodgkin lymphoma cell lines. RNA-sequencing data of classical Hodgkin lymphoma cell lines on GRM5 expression and activation of mGluR5-related pathways. (A) L-1236 (green) shows by far the highest GRM5 expression. Representative genes from PI3K (B) and MAPK (D) pathways with respective downstream effectors (C,E), calcium signaling (F), and neuronal expression profiles (G) are most activated in L-1236 (green). Y-axes are adjusted to considerably differing FPKM values. For details see magnified insets (scaling factors are indicated). (H) A schematic overview displays known signal transduction pathways that are activated by mGluR5 in L-1236 according to our RNA-sequencing data. Expression of mGluR5 and activation by its corresponding ligands (e.g., L-glutamate or anti-mGluR5 antibodies) results in coupling with G-protein (not shown) and activation of protein lipase C (PLC). This is followed by the (over-)activation of signaling pathways promoting cell survival (PI3K), upregulating cell proliferation (MAPK), and increasing Ca2+-influx via L-type voltage-dependent Ca2+ channels (LVDCCs) leading to downstream modifications, all of which are implicated in classical Hodgkin lymphoma progression. CCND1, Cyclin D1; ChAT, Choline acetyltransferase; DAG, Diacylglycerol; EGR1, Early growth response 1; ERK1, Extracellular signal-regulated kinase 1; IP3, Inositol 1,4,5-triphosphate; IP3R, Inositol 1,4,5-triphosphate receptor; PIP2, Phosphatidylinositol 4,5-bisphosphate; PKC, Protein kinase C; PI3K, Phosphoinositide 3-kinase; RasGRP1, Ras guanyl-releasing protein 1. Created with BioRender.com.
3.3.1. PI3K pathway
We detected upregulation of PLCB4 (Phospholipase Cβ4, 15.6-fold upregulation), which is directly involved in mGluR5-related signal transduction by cleaving phosphatidylinositol-4,5-diphosphate (PIP2) into inositol 1,4,5-triphosphate (IP3) and diacylglycerol (DAG) [43,44]. The DAG-regulated nucleotide exchange factor RASGRP1 (Ras guanyl releasing protein 1) specifically activates Ras [45]. IP3 binds to its corresponding receptor (IP3R) at the endoplasmic reticulum (ER) resulting in Ca2+ release into the cytoplasm [43]. Both the elevated intracellular Ca2+ and DAG activate protein kinase C (PKC), which in turn activates Ras, followed by ERK1 phosphorylation. We found upregulation of RASGRP1 (11.1-fold upregulation), ITPKB (Inositol 1,4,5-triphosphate receptor, IP3R; 13.9-fold upregulation) and PIK3R6 (Phosphoinositide 3-kinase, PI3K; 10.1-fold upregulation). Elevated gene expression of the downstream targets EGR1 (Early growth response 1, EGR1; 7.5-fold upregulation), CHAT (Choline acetyltransferase, ChAT; 112.4-fold upregulation) and CD36 (208.5-fold upregulation), confirmed activation of the PI3K pathway.
Growth factors are key constituents that help sustain G-protein coupled receptor (GPCR) signaling. IGF1 (Insulin-like growth factor, IGF1; 15.4-fold upregulation) is an upstream regulator of PI3K and was upregulated as well, suggesting receptor binding and activation upon enhanced mGluR5 expression (Figure 4B, C).
3.3.2. MAPK pathway
The MAPK cascade is overactive in about one-third of all human cancers [46]. Inhibition of components of this cascade by targeted inhibitors represents an important antitumor strategy [46]. mGluR5-dependent overexpression was found in PDGFC (platelet-derived growth factor C, 332.7-fold upregulation), RASEF (RAS and EF-hand domain containing protein, 13.4-fold upregulation), as well as downstream effectors MAP2K1 (mitogen-activated protein kinase kinase 1, MEK1, 1.5-fold upregulation), MAPK3 (extracellular signal-regulated kinase 1, ERK1, 2.9-fold upregulation), nuclear transcription targets MYCL (L-Myc proto-oncogene BHLH transcription factor, 12.4-fold upregulation), and CCND1 (cyclin D1 10.7-fold upregulation) that are all involved in the MAPK pathway (Figure 4D, E).
3.3.3. Calcium signaling
Activation of mGluR5, followed by membrane depolarization through Ca2+-release opens L-type voltage-dependent Ca2+-channels (L-VDCCs) [47]. This implies a crosstalk between mGluRs, intracellular Ca2+ and membrane Ca2+-channels.
We found L-VDCC genes, including CACNA1B (29.7-fold upregulation), CACNA1E (10.5-fold upregulation), CACNA1G (137.5-fold upregulation), and CACNA1H (54.4-fold upregulation) (Calcium voltage-gated channel subunit α-1B, E, G, and H, respectively) were upregulated in L-1236 along with high GRM5 expression (Figure 4F).
3.3.4. NF-kB pathway
Classical Hodgkin lymphoma is also characterized by a high constitutive activity of the NF-kB pathway. Examining genes involved in this pathway, we found a significant overexpression of CCL2 (C-C chemokine ligand 2; 14.4-fold upregulation, Supplementary Table S3) in L-1236.
- Neuronal expression profile
Associated with a high expression of GRM5, we detected upregulation of other genes involved in glutamatergic signaling, including GRM4, which is a member of group III mGluRs. In contrast to the other cell lines, L-1236 expressed ionotropic glutamate receptors (iGluRs), including GRIK2 (glutamate ionotropic receptor kainate type subunit 2) and GRID2 (glutamate ionotropic receptor delta type subunit 2). Interestingly, genes normally exclusively turned on in neurons, were also upregulated in L-1236. These included NYAP1 (neuronal tyrosine-phosphorylated phosphoinositide 3-kinase adaptor 1) that regulates neuronal morphogenesis and RELN (Reelin, extracellular matrix glycoprotein), a regulator of neuronal migration, which also activates N-methyl-D-aspartate receptors (NMDARs) and α-amino-3-hydroxy-5-methyl-4-isoxazole propionic acid receptors (AMPARs) (Figure 4G) [48,49].
5. Discussion
Previous work has focused on the identification of mGluR5 as a neuronal antigen target of autoantibodies in Ophelia syndrome, a disorder characterized by classical Hodgkin lymphoma in association with anti-mGluR5 mediated encephalitis [18,19]. However, little attention has been paid to the question, whether mGluR5 can be found in classical Hodgkin lymphoma tumor tissue. Thus, the aim of this study was to search for mGluR5 expression in classical Hodgkin lymphoma cells and gain a more in-depth understanding of the link between tumor growth and autoimmunity.
In neurons, stimulation of mGluR5 activates the PI3K and MAPK pathways and causes increased Ca2+-influx into the cytosol [50,51]. In classical Hodgkin lymphoma, these glutamatergic signaling cascades are the most frequently dysregulated ones [52,53,54] with glutamate stimulating proliferation and migration of tumor cells via GPCR activation [44].
Our study shows that the two fundamental PI3K, MAPK, and PDGFC (platelet-derived growth factor C) pathways in conjunction with the increased recruitment of its receptor PDGFR (platelet-derived growth factor receptor) which in turn also enhances MAPK signaling [55,56], were upregulated along with high mGluR5 expression in classical Hodgkin lymphoma cell lines. In addition, we detected upregulation of downstream targets of the PI3K and MAPK pathways that are known to be generally involved in tumor progression (Figure 4H). High expression of the surface protein CD36 [57], the transcription factors Early Growth Response Protein 1 [58], Cyclin D1 [59], and L-Myc [60,61] and of the enzyme ChAT [62,63] have been linked to tumor progression, poor survival and increased metastasis in several cancers, including melanoma [59] and recently also in lymphoma [60,61].
ChAT is a critical enzyme for acetylcholine synthesis. Acetylcholine can be produced in lung and colon cancer cells and act as an autocrine and paracrine growth factor [62,63]. High CHAT overexpression (≥ 100-fold), as shown in L-1236 may result in non-neuronal production and release of acetylcholine by Hodgkin and Reed-Sternberg cells, thereby self-promoting lymphoma growth.
Transcription factor L-Myc, a member of the Myc-proto-oncogene family, is amplified and overexpressed in 70% of all human malignancies including classical Hodgkin lymphoma. Its upregulation contributes to uncontrolled cell proliferation, survival, and escape from immune surveillance [60,61]. As classical Hodgkin lymphoma shares many characteristics with acute inflammatory processes, NF-kB signaling plays a major role by mediating the immediate-early expression of various cytokines including the chemokine CCL2 [56]. Upregulation of CCL2, as shown in our data (Supplementary Table S3), has been associated with cancer advancement, metastasis, and relapse [64,65].
In addition to this, other glutamate receptors are differentially expressed in tumors [66,67,68], e.g., mGluR1 in melanoma [55] or mGluR3 in malignant gliomas and mGluR4 in medulloblastomas [66]. Activation of these receptors stimulates tumor growth and development of metastasis in a MAPK-dependent manner [66]. Moreover, investigations showed that glutamate receptor antagonists, including the potent mGluR3 antagonist LY341495, limit tumor growth [66,69]. While mGluR5 was not considered an oncogene previously, it has recently been found to play an important role for promoting tumor growth, e.g., in melanoma and oral squamous cell carcinoma [70,71,72], and having an influence on astrocyte proliferation upon chemical and mechanical injury [73].
Besides these data on various tumors, non-malignant immune cells, e.g., B- and T-lymphocytes also show baseline expression of mGluR5 supporting our findings [74]. This indicates that the basic machinery required for mGluR5 signaling is already present prior to the development of Hodgkin and Reed-Sternberg cells and the transformation to classical Hodgkin lymphoma. Interestingly, our analysis also showed several neuronal genes activated in L-1236, suggesting that some classical Hodgkin lymphoma cells might exploit neuronal and neurodevelopmental pathways for tumorigenesis. Consistent with this, studies have reported that tumors behave more aggressively when expressing genes related to the nervous system [75,76].
The six classical Hodgkin lymphoma cell lines L-1236, HDLM-2, KM-H2, SUP-HD1, L-428, and L-540 investigated in this study were established between the 1970s and 1990s. They have been used extensively as model systems in research for many years and are considered as “the classical Hodgkin lymphoma cell lines” [77]. The L-1236 line was obtained from peripheral blood of a 31-year-old patient, diagnosed with classical Hodgkin lymphoma of mixed cellularity subtype, who developed an advanced disease with rapid progression and multiple relapses [28]. Unlike our index patient with Ophelia syndrome, no neurologic or psychiatric symptoms suggestive of encephalitis were reported from the L-1236 donor [28]. However, data on the clinical course and medical history of that patient are incomplete and signs of previous paraneoplastic neurological symptoms may have gone unnoticed or unreported. In any case, both our patient and the L-1236 donor suffered from advanced stage disease, an aggressive clinical course. The strong expression of mGluR5 and its downstream effectors (e.g., MYCL and EGR1) may have contributed to the aggressive clinical course.
Given the observed occurrence of classical Hodgkin lymphoma in the wake of half of all reported Ophelia syndromes and reports of additional cases of classical Hodgkin lymphoma with preceding paraneoplastic symptoms before [78,79,80,81], we believe it is possible that mGluR5 expression on classical Hodgkin lymphoma cells not only drives tumor progression but also plays a role in triggering anti-mGluR5 encephalitis early during tumor development, long before classical Hodgkin lymphoma is clinically detected.
However, classical Hodgkin lymphoma does not follow in all cases of anti-mGluR5 encephalitis, and conversely, Ophelia syndrome occurs in only a minority of patients with classical Hodgkin lymphoma. According to our reanalysis of a large mRNA expression dataset of Hodgkin tumor tissues, high mGluR5 expression does not seem to be all that rare in classical Hodgkin lymphoma. We hypothesize that other factors must play a role for manifestation of Ophelia syndrome. Such factors may include the histological subtype, mechanisms of immune tolerance or preceding viral infections, which may trigger both encephalitis and subsequent tumor progression as a “second hit”. Further prospective studies are needed in cases of paraneoplastic neurological disease and/or classical Hodgkin lymphoma with respect to mGluR5 expression on tumor cells.
6. Conclusions
In recent years, significant progress has been made in our understanding of Ophelia syndrome. However, the underlying molecular mechanisms leading to both anti-mGluR5 encephalitis and classical Hodgkin lymphoma were poorly understood. This study contributes to the understanding and may have clinical implications:
Detection of paraneoplastic neurological disease preceding classical Hodgkin’s lymphoma can be challenging [21]. However, early diagnosis of an Ophelia syndrome is paramount both for the treatment of anti-mGluR5 encephalitis and the earliest possible recognition of a subsequent classical Hodgkin lymphoma. Based on our findings, we recommend (i) thorough follow-up and close screening for classical Hodgkin lymphoma after detection of anti-mGluR5 encephalitis, (ii) searching for mGluR5 expression in classical Hodgkin lymphoma biopsy material of patients with autoimmune encephalitis, and (iii) inclusion of mGluR5 screening alongside the standard diagnostic procedure for classical Hodgkin lymphoma, as this could provide further information on tumor progression and may serve as a prognostic marker. Further studies on the clinical relevance of mGluR5 expression in classical Hodgkin lymphoma, as well as its functional impact on tumor development are needed to gain a more in-depth understanding of the pathogenesis of anti-mGluR5 encephalitis and its link to lymphoma development.
Supplementary Materials
The following supporting information can be downloaded at the website of this paper posted on Preprints.org, Figure S1: mGluR5 banding pattern of human Hodgkin cells and mouse brain. Figure S2: Distribution of mGluR5 on the surface of Hodgkin lymphoma cells - 3D-reconstruction. Figure S3: FACS analysis of classical Hodgkin lymphoma cells. Figure S4: Calculation of GRM5 gene expression intensities using the public GEO GSE17920 dataset. Table S1: Primers used in RT-qPCR; Table S2: Clinical details of classical Hodgkin lymphoma patients from GEO GSE17920 with high GRM5 expression. Table S3: Main upregulated signaling pathways in the L-1236 cell line.
Author Contributions
Conceptualization, Sofia Schnell, Markus Schuelke and Marc Nikolaus; Data curation, Sofia Schnell, Petra Bittigau, Markus Schuelke and Marc Nikolaus; Formal analysis, Sofia Schnell, Markus Schuelke and Marc Nikolaus; Funding acquisition, Markus Schuelke; Investigation, Sofia Schnell and Marc Nikolaus; Methodology, Sofia Schnell, Jakob Kreye, Susanne Morales-Gonzalez, Markus Schuelke and Marc Nikolaus; Project administration, Markus Schuelke; Resources, Ellen Knierim, Kathrin Hauptmann and Patrick Hundsdoerfer; Software, Sofia Schnell and Markus Schuelke; Supervision, Ellen Knierim and Markus Schuelke; Validation, Sofia Schnell, Ellen Knierim, Susanne Morales-Gonzalez, Markus Schuelke and Marc Nikolaus; Visualization, Sofia Schnell and Marc Nikolaus; Writing – original draft, Sofia Schnell, Markus Schuelke and Marc Nikolaus; Writing – review & editing, Sofia Schnell, Ellen Knierim, Petra Bittigau, Jakob Kreye, Kathrin Hauptmann, Patrick Hundsdoerfer, Susanne Morales-Gonzalez, Markus Schuelke and Marc Nikolaus.
Funding
M.N. and J.K. are participants in the BIH-Charité Clinician Scientist Program funded by Charité - Universitätsmedizin Berlin and the Berlin Institute of Health. This research was also funded by grants of the Deutsche Forschungsgemeinschaft (DFG; German Research Foundation) under Germany’s Excellence Strategy—EXC-2049—390688087 to M.S.
Institutional Review Board Statement
The study was conducted in accordance with the Declaration of Helsinki. It involved the use of material of human origin. The study was approved by the Ethics Committee of Charité-Universitätsmedizin Berlin (EA2/121/17). The control classical Hodgkin lymphoma samples were obtained in anonymous form from the author K.H. for which no ethics approval is required. The classical Hodgkin lymphoma cell lines can be freely used for research and can be obtained from standard repositories such as the Leibniz-Institute (DSZM-German Collection of Microorganisms and Cell Cultures GmbH).
Informed Consent Statement
The parents of the index patient provided written informed consent for research use and publication of clinical details and material. No patient-identifying information nor face image is published with this article.
Data Availability Statement
The raw FASTQ sequence files of all the RNA-sequencing runs as well as the StringTie result files have been deposited in NCBI’s Gene Expression Omnibus [82] and are accessible through GEO Series accession number GSE212326 (URL: https://www.ncbi.nlm.nih.gov/geo/query/acc.cgi?acc=GSE212326, privileged access for reviewers with the access token “ylczyegwjdszjov”).
Acknowledgments
We thank Daniel Nörenberg from the clinical research group for hematology, oncology, and tumor immunology at Charité Campus Virchow Klinikum Berlin, Germany for providing the classical Hodgkin lymphoma cell lines HDLM-2 and L-428 and Stephan Mathas from the MDC Berlin-Buch, Germany for providing the classical Hodgkin lymphoma cell lines L-1236, L-540, SUP-HD1, and KM-H2.
Conflicts of Interest
The authors declare no conflict of interest. The funders had no role in the design of the study; in the collection, analyses, or interpretation of data; in the writing of the manuscript; or in the decision to publish the results.
References
- Weniger, M.A.; Küppers, R. Molecular Biology of Hodgkin Lymphoma. Leukemia 2021, 35, 968–981. [CrossRef]
- Tiacci, E.; Döring, C.; Brune, V.; van Noesel, C.J.M.; Klapper, W.; Mechtersheimer, G.; Falini, B.; Küppers, R.; Hansmann, M.-L. Analyzing Primary Hodgkin and Reed-Sternberg Cells to Capture the Molecular and Cellular Pathogenesis of Classical Hodgkin Lymphoma. Blood 2012, 120, 4609–4620. [CrossRef]
- Connors, J.M.; Cozen, W.; Steidl, C.; Carbone, A.; Hoppe, R.T.; Flechtner, H.-H.; Bartlett, N.L. Hodgkin Lymphoma. Nat. Rev. Dis. Primer 2020, 6, 1–25. [CrossRef]
- Grimm, S.; Chamberlain, M. Hodgkin’s Lymphoma: A Review of Neurologic Complications. Adv. Hematol. 2010, 2011, e624578. [CrossRef]
- Gopas, J.; Stern, E.; Zurgil, U.; Ozer, J.; Ben-Ari, A.; Shubinsky, G.; Braiman, A.; Sinay, R.; Ezratty, J.; Dronov, V.; et al. Reed-Sternberg Cells in Hodgkin’s Lymphoma Present Features of Cellular Senescence. Cell Death Dis. 2016, 7, e2457. [CrossRef]
- Miller, E.B. Autoimmunity and Lymphoma: A Brief Review. J. Rheum. Dis. Treat. 2018, 4. [CrossRef]
- Thomas, E.; Brewster, D.H.; Black, R.J.; Macfarlane, G.J. Risk of Malignancy among Patients with Rheumatic Conditions. Int. J. Cancer 2000, 88, 497–502. [CrossRef]
- Graus, F.; Ariño, H.; Dalmau, J. Paraneoplastic Neurological Syndromes in Hodgkin and Non-Hodgkin Lymphomas. Blood 2014, 123, 3230–3238. [CrossRef]
- Maslovsky, I.; Volchek, L.; Blumental, R.; Ducach, A.; Lugassy, G. Persistent Paraneoplastic Neurologic Syndrome after Successful Therapy of Hodgkin’s Disease. Eur. J. Haematol. 2001, 66, 63–65. [CrossRef]
- Juneja, M.; Kaur, S.; Mishra, D.; Jain, S. Ophelia Syndrome: Hodgkin Lymphoma with Limbic Encephalitis. INDIAN Pediatr. 2015, 52, 2.
- Rosenfeld, M.R.; Dalmau, J. Paraneoplastic Neurologic Syndromes. Neurol. Clin. 2018, 36, 675–685. [CrossRef]
- Briani, C.; Vitaliani, R.; Grisold, W.; Honnorat, J.; Graus, F.; Antoine, J.C.; Bertolini, G.; Giometto, B.; Euronetwork, F. the P. Spectrum of Paraneoplastic Disease Associated with Lymphoma. Neurology 2011, 76, 705–710. [CrossRef]
- Dropcho, E.J. Neurologic Paraneoplastic Syndromes. Curr. Oncol. Rep. 2004, 6, 26–31. [CrossRef]
- Dalmau, J.; Geis, C.; Graus, F. Autoantibodies to Synaptic Receptors and Neuronal Cell Surface Proteins in Autoimmune Diseases of the Central Nervous System. Physiol. Rev. 2017, 97, 839–887. [CrossRef]
- Goldin, L.R.; Landgren, O. Autoimmunity and Lymphomagenesis. Int. J. Cancer 2009, 124, 1497–1502. [CrossRef]
- Váróczy, L.; Gergely, L.; Zeher, M.; Szegedi, G.; Illés, Á. Malignant Lymphoma-Associated Autoimmune Diseases – a Descriptive Epidemiological Study. Rheumatol. Int. 2002, 22, 233–237. [CrossRef]
- Ammannagari, N.; Chikoti, S.; Bravin, E. Hodgkin’s Lymphoma Presenting as a Complex Paraneoplastic Neurological Syndrome: A Case Report. J. Med. Case Reports 2013, 7, 96. [CrossRef]
- Spatola, M.; Sabater, L.; Planagumà, J.; Martínez-Hernandez, E.; Armangué, T.; Prüss, H.; Iizuka, T.; Oblitas, R.L.C.; Antoine, J.-C.; Li, R.; et al. Encephalitis with MGluR5 Antibodies: Symptoms and Antibody Effects. Neurology 2018, 90, e1964–e1972. [CrossRef]
- Lancaster, E.; Martinez-Hernandez, E.; Titulaer, M.J.; Boulos, M.; Weaver, S.; Antoine, J.-C.; Liebers, E.; Kornblum, C.; Bien, C.G.; Honnorat, J.; et al. Antibodies to Metabotropic Glutamate Receptor 5 in the Ophelia Syndrome. Neurology 2011, 77, 1698–1701. [CrossRef]
- Carr, I. THE OPHELIA SYNDROME: MEMORY LOSS IN HODGKIN’S DISEASE. The Lancet 1982, 319, 844–845. [CrossRef]
- Betcherman, L.; University of Toronto, Ontario, Canada; Punnett, A.; University of Toronto, Ontario, Canada; Division of Hematology/Oncology, Hospital for Sick Children, Toronto, Ontario, Canada Paraneoplastic Syndromes in Children with Hodgkin Lymphoma. Oncol. Hematol. Rev. US 2017, 13, 41. [CrossRef]
- Guevara, C.; Farias, G.; Silva-Rosas, C.; Alarcon, P.; Abudinen, G.; Espinoza, J.; Caro, A.; Angus-Leppan, H.; de Grazia, J. Encephalitis Associated to Metabotropic Glutamate Receptor 5 (MGluR5) Antibodies in Cerebrospinal Fluid. Front. Immunol. 2018, 9.
- Lo, A.C.; Dieckmann, K.; Pelz, T.; Gallop-Evans, E.; Engenhart-Cabillic, R.; Vordermark, D.; Kelly, K.M.; Schwartz, C.L.; Constine, L.S.; Roberts, K.; et al. Pediatric Classical Hodgkin Lymphoma. Pediatr. Blood Cancer 2021, 68, e28562. [CrossRef]
- Drexler, H.G.; Gignac, S.M.; Hoffbrand, A.V.; Leber, B.F.; Norton, J.; Lok, M.S.; Minowada, J. Characterization of Hodgkin’s Disease Derived Cell Line HDLM-2. In Proceedings of the New Aspects in the Diagnosis and Treatment of Hodgkin’s Disease; Diehl, V., Pfreundschuh, M., Loeffler, M., Eds.; Springer: Berlin, Heidelberg, 1989; pp. 75–82.
- Naumovski, L.; Utz, P.; Bergstrom, S.; Morgan, R.; Molina, A.; Toole, J.; Glader, B.; McFall, P.; Weiss, L.; Warnke, R. SUP-HD1: A New Hodgkin’s Disease-Derived Cell Line with Lymphoid Features Produces Interferon-Gamma [See Comments]. Blood 1989, 74, 2733–2742. [CrossRef]
- Drexler, H.G.; Gaedicke, G.; Lok, M.S.; Diehl, V.; Minowada, J. Hodgkin’s Disease Derived Cell Lines HDLM-2 and L-428: Comparison of Morphology, Immunological and Isoenzyme Profiles. Leuk. Res. 1986, 10, 487–500. [CrossRef]
- Schaadt, M.; Fonatsch, C.; Kirchner, H.; Diehl, V. Establishment of a Malignant, Epstein-Barr-Virus (EBV)-Negative Cell-Line from the Pleura Effusion of a Patient with Hodgkin’s Disease. Blut 1979, 38, 185–190. [CrossRef]
- Wolf, J.; Kapp, U.; Bohlen, H.; Kornacker, M.; Schoch, C.; Stahl, B.; Mucke, S.; von Kalle, C.; Fonatsch, C.; Schaefer, H.; et al. Peripheral Blood Mononuclear Cells of a Patient with Advanced Hodgkin’s Lymphoma Give Rise to Permanently Growing Hodgkin-Reed Sternberg Cells. Blood 1996, 87, 3418–3428. [CrossRef]
- Diehl, V.; Kirchner, H.H.; Schaadt, M.; Fonatsch, Chr.; Stein, H.; Gerdes, J.; Bote, Chr. Hodgkin’s Disease: Establishment and Characterization of Four in Vitro Cell Lines. J. Cancer Res. Clin. Oncol. 1981, 101, 111–124. [CrossRef]
- Nikolaus, M.; Meisel, C.; Kreye, J.; Prüss, H.; Reindl, M.; Kaindl, A.M.; Schuelke, M.; Knierim, E. Presence of Anti-Neuronal Antibodies in Children with Neurological Disorders beyond Encephalitis. Eur. J. Paediatr. Neurol. 2020, 28, 159–166. [CrossRef]
- Kreye, J.; Wenke, N.K.; Chayka, M.; Leubner, J.; Murugan, R.; Maier, N.; Jurek, B.; Ly, L.-T.; Brandl, D.; Rost, B.R.; et al. Human Cerebrospinal Fluid Monoclonal N-Methyl-D-Aspartate Receptor Autoantibodies Are Sufficient for Encephalitis Pathogenesis. Brain 2016, 139, 2641–2652. [CrossRef]
- Pfaffl, M.W. A New Mathematical Model for Relative Quantification in Real-Time RT–PCR. Nucleic Acids Res. 2001, 29, e45–e45. [CrossRef]
- Dobin, A.; Davis, C.A.; Schlesinger, F.; Drenkow, J.; Zaleski, C.; Jha, S.; Batut, P.; Chaisson, M.; Gingeras, T.R. STAR: Ultrafast Universal RNA-Seq Aligner. Bioinformatics 2013, 29, 15–21. [CrossRef]
- Pertea, M.; Pertea, G.M.; Antonescu, C.M.; Chang, T.-C.; Mendell, J.T.; Salzberg, S.L. StringTie Enables Improved Reconstruction of a Transcriptome from RNA-Seq Reads. Nat. Biotechnol. 2015, 33, 290–295. [CrossRef]
- Pertea, M.; Kim, D.; Pertea, G.M.; Leek, J.T.; Salzberg, S.L. Transcript-Level Expression Analysis of RNA-Seq Experiments with HISAT, StringTie and Ballgown. Nat. Protoc. 2016, 11, 1650–1667. [CrossRef]
- Reiner, A.; Yekutieli, D.; Benjamini, Y. Identifying Differentially Expressed Genes Using False Discovery Rate Controlling Procedures. Bioinformatics 2003, 19, 368–375. [CrossRef]
- Huang, D.W.; Sherman, B.T.; Tan, Q.; Kir, J.; Liu, D.; Bryant, D.; Guo, Y.; Stephens, R.; Baseler, M.W.; Lane, H.C.; et al. DAVID Bioinformatics Resources: Expanded Annotation Database and Novel Algorithms to Better Extract Biology from Large Gene Lists. Nucleic Acids Res. 2007, 35, W169–W175. [CrossRef]
- Agostinelli, C.; Pileri, S. PATHOBIOLOGY OF HODGKIN LYMPHOMA. Mediterr. J. Hematol. Infect. Dis. 2014, 6, e2014040–e2014040. [CrossRef]
- Seitz, V.; Thomas, P.E.; Zimmermann, K.; Paul, U.; Ehlers, A.; Joosten, M.; Dimitrova, L.; Lenze, D.; Sommerfeld, A.; Oker, E.; et al. Classical Hodgkin’s Lymphoma Shows Epigenetic Features of Abortive Plasma Cell Differentiation. Haematologica 2011, 96, 863–870. [CrossRef]
- Kirschstein, T.; Bauer, M.; Müller, L.; Rüschenschmidt, C.; Reitze, M.; Becker, A.J.; Schoch, S.; Beck, H. Loss of Metabotropic Glutamate Receptor-Dependent Long-Term Depression via Downregulation of MGluR5 after Status Epilepticus. J. Neurosci. 2007, 27, 7696–7704. [CrossRef]
- Romano, C.; Yang, W.-L.; O’Malley, K.L. Metabotropic Glutamate Receptor 5 Is a Disulfide-Linked Dimer*. J. Biol. Chem. 1996, 271, 28612–28616. [CrossRef]
- Steidl, C.; Lee, T.; Shah, S.P.; Farinha, P.; Han, G.; Nayar, T.; Delaney, A.; Jones, S.J.; Iqbal, J.; Weisenburger, D.D.; et al. Tumor-Associated Macrophages and Survival in Classic Hodgkin’s Lymphoma. N. Engl. J. Med. 2010, 362, 875–885. [CrossRef]
- Eddy, K.; Chen, S. Glutamatergic Signaling a Therapeutic Vulnerability in Melanoma. Cancers 2021, 13, 3874. [CrossRef]
- Prickett, T.D.; Samuels, Y. Molecular Pathways: Dysregulated Glutamatergic Signaling Pathways in Cancer. Clin. Cancer Res. Off. J. Am. Assoc. Cancer Res. 2012, 18, 4240–4246. [CrossRef]
- Ebinu, J.O.; Bottorff, D.A.; Chan, E.Y.; Stang, S.L.; Dunn, R.J.; Stone, J.C. RasGRP, a Ras Guanyl Nucleotide- Releasing Protein with Calcium- and Diacylglycerol-Binding Motifs. Science 1998, 280, 1082–1086. [CrossRef]
- Dhillon, A.S.; Hagan, S.; Rath, O.; Kolch, W. MAP Kinase Signalling Pathways in Cancer. Oncogene 2007, 26, 3279–3290. [CrossRef]
- Kato, H.K.; Kassai, H.; Watabe, A.M.; Aiba, A.; Manabe, T. Functional Coupling of the Metabotropic Glutamate Receptor, InsP3 Receptor and L-Type Ca2+ Channel in Mouse CA1 Pyramidal Cells. J. Physiol. 2012, 590, 3019–3034. [CrossRef]
- Wang, S.; Li, X.; Zhang, Q.; Chai, X.; Wang, Y.; Förster, E.; Zhu, X.; Zhao, S. Nyap1 Regulates Multipolar–Bipolar Transition and Morphology of Migrating Neurons by Fyn Phosphorylation during Corticogenesis. Cereb. Cortex 2020, 30, 929–941. [CrossRef]
- Qiu, S.; Zhao, L.F.; Korwek, K.M.; Weeber, E.J. Differential Reelin-Induced Enhancement of NMDA and AMPA Receptor Activity in the Adult Hippocampus. J. Neurosci. 2006, 26, 12943–12955. [CrossRef]
- Hou, L.; Klann, E. Activation of the Phosphoinositide 3-Kinase-Akt-Mammalian Target of Rapamycin Signaling Pathway Is Required for Metabotropic Glutamate Receptor-Dependent Long-Term Depression. J. Neurosci. 2004, 24, 6352–6361. [CrossRef]
- Reiner, A.; Levitz, J. Glutamatergic Signaling in the Central Nervous System: Ionotropic and Metabotropic Receptors in Concert. Neuron 2018, 98, 1080–1098. [CrossRef]
- Yu, L.J.; Wall, B.A.; Wangari-Talbot, J.; Chen, S. Metabotropic Glutamate Receptors in Cancer. Neuropharmacology 2017, 115, 193–202. [CrossRef]
- Liu, F.; Yang, X.; Geng, M.; Huang, M. Targeting ERK, an Achilles’ Heel of the MAPK Pathway, in Cancer Therapy. Acta Pharm. Sin. B 2018, 8, 552–562. [CrossRef]
- Sun, R.-F.; Yu, Q.-Q.; Young, K.H. Critically Dysregulated Signaling Pathways and Clinical Utility of the Pathway Biomarkers in Lymphoid Malignancies. Chronic Dis. Transl. Med. 2018, 4, 29–44. [CrossRef]
- Teh, J.L.F.; Chen, S. Glutamatergic Signaling in Cellular Transformation. Pigment Cell Melanoma Res. 2012, 25, 331–342. [CrossRef]
- Nakatsumi, H.; Matsumoto, M.; Nakayama, K.I. Noncanonical Pathway for Regulation of CCL2 Expression by an MTORC1-FOXK1 Axis Promotes Recruitment of Tumor-Associated Macrophages. Cell Rep. 2017, 21, 2471–2486. [CrossRef]
- Wang, J.; Li, Y. CD36 Tango in Cancer: Signaling Pathways and Functions. Theranostics 2019, 9, 4893–4908. [CrossRef]
- Wang, B.; Guo, H.; Yu, H.; Chen, Y.; Xu, H.; Zhao, G. The Role of the Transcription Factor EGR1 in Cancer. Front. Oncol. 2021, 11.
- González-Ruiz, L.; González-Moles, M.Á.; González-Ruiz, I.; Ruiz-Ávila, I.; Ayén, Á.; Ramos-García, P. An Update on the Implications of Cyclin D1 in Melanomas. Pigment Cell Melanoma Res. 2020, 33, 788–805. [CrossRef]
- Cai, Q.; Medeiros, L.J.; Xu, X.; Young, K.H. MYC-Driven Aggressive B-Cell Lymphomas: Biology, Entity, Differential Diagnosis and Clinical Management. Oncotarget 2015, 6, 38591–38616.
- Klapproth, K.; Wirth, T. Advances in the Understanding of MYC-Induced Lymphomagenesis. Br. J. Haematol. 2010, 149, 484–497. [CrossRef]
- Cheng, K.; Samimi, R.; Xie, G.; Shant, J.; Drachenberg, C.; Wade, M.; Davis, R.J.; Nomikos, G.; Raufman, J.-P. Acetylcholine Release by Human Colon Cancer Cells Mediates Autocrine Stimulation of Cell Proliferation. Am. J. Physiol.-Gastrointest. Liver Physiol. 2008, 295, G591–G597. [CrossRef]
- Song, P.; Sekhon, H.S.; Jia, Y.; Keller, J.A.; Blusztajn, J.K.; Mark, G.P.; Spindel, E.R. Acetylcholine Is Synthesized by and Acts as an Autocrine Growth Factor for Small Cell Lung Carcinoma. Cancer Res. 2003, 63, 214–221.
- Hao, Q.; Vadgama, J.V.; Wang, P. CCL2/CCR2 Signaling in Cancer Pathogenesis. Cell Commun. Signal. 2020, 18, 82. [CrossRef]
- Nagarsheth, N.; Wicha, M.S.; Zou, W. Chemokines in the Cancer Microenvironment and Their Relevance in Cancer Immunotherapy. Nat. Rev. Immunol. 2017, 17, 559–572. [CrossRef]
- Nicoletti, F.; Arcella, A.; Iacovelli, L.; Battaglia, G.; Giangaspero, F.; Melchiorri, D. Metabotropic Glutamate Receptors: New Targets for the Control of Tumor Growth? Trends Pharmacol. Sci. 2007, 28, 206–213. [CrossRef]
- Brocke, K.S.; Staufner, C.; Luksch, H.; Geiger, K.D.; Stepulak, A.; Marzahn, J.; Schackert, G.; Temme, A.; Ikonomidou, C. Glutamate Receptors in Pediatric Tumors of the Central Nervous System. Cancer Biol. Ther. 2010, 9, 455–468. [CrossRef]
- Teh, J.; Chen, S. Metabotropic Glutamate Receptors and Cancerous Growth. Wiley Interdiscip. Rev. Membr. Transp. Signal. 2012, 1, 211–220. [CrossRef]
- Rzeski, W.; Turski, L.; Ikonomidou, C. Glutamate Antagonists Limit Tumor Growth. Proc. Natl. Acad. Sci. 2001, 98, 6372–6377. [CrossRef]
- Marín, Y.E.; Namkoong, J.; Shin, S.-S.; Raines, J.; Degenhardt, K.; White, E.; Chen, S. Grm5 Expression Is Not Required for the Oncogenic Role of Grm1 in Melanocytes. Neuropharmacology 2005, 49, 70–79. [CrossRef]
- Choi, K.Y.; Chang, K.; Pickel, J.M.; Badger, J.D.; Roche, K.W. Expression of the Metabotropic Glutamate Receptor 5 (MGluR5) Induces Melanoma in Transgenic Mice. Proc. Natl. Acad. Sci. 2011, 108, 15219–15224. [CrossRef]
- Park, S.-Y.; Lee, S.-A.; Han, I.-H.; Yoo, B.-C.; Lee, S.-H.; Park, J.-Y.; Cha, I.-H.; Kim, J.; Choi, S.-W. Clinical Significance of Metabotropic Glutamate Receptor 5 Expression in Oral Squamous Cell Carcinoma. Oncol. Rep. 2007, 17, 81–87. [CrossRef]
- Ferraguti, F.; Corti, C.; Valerio, E.; Mion, S.; Xuereb, J. Activated Astrocytes in Areas of Kainate-Induced Neuronal Injury Upregulate the Expression of the Metabotropic Glutamate Receptors 2/3 and 5. Exp. Brain Res. 2001, 137, 1–11. [CrossRef]
- Pacheco, R.; Gallart, T.; Lluis, C.; Franco, R. Role of Glutamate on T-Cell Mediated Immunity. J. Neuroimmunol. 2007, 185, 9–19. [CrossRef]
- Cao, Y. Tumorigenesis as a Process of Gradual Loss of Original Cell Identity and Gain of Properties of Neural Precursor/Progenitor Cells. Cell Biosci. 2017, 7, 61. [CrossRef]
- Jung, E.; Alfonso, J.; Monyer, H.; Wick, W.; Winkler, F. Neuronal Signatures in Cancer. Int. J. Cancer 2020, 147, 3281–3291. [CrossRef]
- Drexler, H.G.; Pommerenke, C.; Eberth, S.; Nagel, S. Hodgkin Lymphoma Cell Lines: To Separate the Wheat from the Chaff. Biol. Chem. 2018, 399, 511–523. [CrossRef]
- Ruiz-García, R.; Martínez-Hernández, E.; Joubert, B.; Petit-Pedrol, M.; Pajarón-Boix, E.; Fernández, V.; Salais, L.; Pozo, M. del; Armangué, T.; Sabater, L.; et al. Paraneoplastic Cerebellar Ataxia and Antibodies to Metabotropic Glutamate Receptor 2. Neurol. - Neuroimmunol. Neuroinflammation 2020, 7. [CrossRef]
- Deodhare, S.; O’Connor, P.; Ghazarian, D.; Bilbao, J.M. Paraneoplastic Limbic Encephalitis in Hodgkin’s Disease. Can. J. Neurol. Sci. 1996, 23, 138–140. [CrossRef]
- Rosenbaum, T.; Gärtner, J.; Körholz, D.; Janßen, G.; Schneider, D.; Engelbrecht, V.; Göbel, U.; Lenard, H.-G. Paraneoplastic Limbic Encephalitis in Two Teenage Girls. Neuropediatrics 1998, 29, 159–162. [CrossRef]
- Ypma, P.F.; Wijermans, P.W.; Koppen, H.; Sillevis Smitt, P. a. E. Paraneoplastic Cerebellar Degeneration Preceding the Diagnosis of Hodgkin’s Lymphoma. Neth. J. Med. 2006, 64, 243–247.
- Barrett, T.; Wilhite, S.E.; Ledoux, P.; Evangelista, C.; Kim, I.F.; Tomashevsky, M.; Marshall, K.A.; Phillippy, K.H.; Sherman, P.M.; Holko, M.; et al. NCBI GEO: Archive for Functional Genomics Data Sets—Update. Nucleic Acids Res. 2013, 41, D991–D995. [CrossRef]
Disclaimer/Publisher’s Note: The statements, opinions and data contained in all publications are solely those of the individual author(s) and contributor(s) and not of MDPI and/or the editor(s). MDPI and/or the editor(s) disclaim responsibility for any injury to people or property resulting from any ideas, methods, instructions or products referred to in the content. |
© 2023 by the authors. Licensee MDPI, Basel, Switzerland. This article is an open access article distributed under the terms and conditions of the Creative Commons Attribution (CC BY) license (http://creativecommons.org/licenses/by/4.0/).
Copyright: This open access article is published under a Creative Commons CC BY 4.0 license, which permit the free download, distribution, and reuse, provided that the author and preprint are cited in any reuse.


