
Submitted:
03 February 2023
Posted:
06 February 2023
You are already at the latest version
Abstract
The greater U.S. Midwest is on the leading edge of tick and tick-borne disease (TBD) expansion, with tick and TBD encroachment into Illinois occurring from both the northern and the southern regions. To assess historical and future habitat suitability of four ticks of medical concern within the state, we fit individual and mean-weighted ensemble species distribution models for Ixodes scapularis, Amblyomma americanum, Dermacentor variabilis, and a newly invading species, Amblyomma maculatum using a variety of landscape and mean climate variables for the periods of 1970-2000, 2041-2060, and 2061-2080. Ensemble model projections for the historical climate were consistent with known distributions of each species but predicted the habitat suitability of A. maculatum to be much greater throughout Illinois than what known distributions demonstrate. Presence of forest and wetlands were the most important landcover classes predicting occurrence of all tick species. As the climate warmed, the expected distribution of all species became strongly responsive to precipitation and temperature variables, particularly precipitation of the warmest quarter and mean diurnal range, as well as proximity to forest cover and water sources. The suitable habitat all species was predicted to shrink in the 2050 climate scenario, and then increase more broadly statewide in the 2070 scenario, but at reduced likelihoods. Predicting where ticks may invade and concentrate as the climate changes will be important to anticipate, prevent, and treat TBD in Illinois.
Keywords:
Ticks
; species distribution models
; habitat suitability models
; Illinois
; climate
1. Introduction
Ticks and their associated pathogens present a growing public and veterinary health threat in the United States. Human-induced climate and landscape alterations are driving increased prevalence of emerging tick-borne diseases (TBDs) (Diuk-Wasser et al. 2021) including bacterial, rickettsial, protozoal, and viral organisms (Savage et al. 2017; Paddock and Goddard et al. 2015). These pathogen emergences are increasingly relevant as the ranges (Raghavan et al. 2021; Molaei et al. 2022) and activity periods (Raghavan et al. 2021) of native and invasive tick species (Paddock and Goddard 2015; Rochlin et al. 2019) shift, putting these vectors into greater contact with humans, companion animals, and livestock. Economically, changes in tick and TBD ecology are triggering millions of dollars in healthcare and livestock impacts (Hook et al. 2022).
Ticks are highly sensitive to and constrained by weather and climate variables (Ogden et al. 2014; Bacon et al. 2021), as well as landscape features like vegetation and land-use patterns that impact habitat fragmentation (Allan et al. 2003; Brownstein et al. 2005; Diuk-Wasser et al. 2021). In general, the questing and phenological activity, development, and survival of common tick species of medical concern are directly correlated with higher levels of humidity and warmer temperatures (Berger et al. 2014a; b; Ogden et al. 2014; Ostfeld & Brunner 2015). However, these impacts are species-specific. Ticks like Ixodes scapularis are highly susceptible to desiccation, whereas Amblyomma americanum, Amblyomma maculatum, and Dermacentor variabilis are more tolerant of drier conditions (Bacon et al. 2021; Rynkiewicz & Clay 2014). Greater tick density is often associated with habitats that include uninterrupted forest cover (Heske 1995; Ferrell & Brinkerhoff 2018), or even specific invasive types of landscape cover (Noden & Dubie 2017), but edge-effects and open-landscape can also foster high tick abundance depending on species (Rynkiewicz & Clay 2014; Flenniken et al. 2022). These landcover and climate relationships are critical to the landscape epidemiology of TBD because they generate the microclimatic conditions that facilitate interactions among ticks and their hosts (Randolph & Storey 1999; Diuk-Wasser et al. 2021).
The greater U.S. Midwest Is on the leading edge of tick and TBD expansion. Within the past decade, studies have documented the continued range movement of four ticks of medical and veterinary concern in this region including the blacklegged tick (Ixodes scapularis) (Rydzewski et al. 2011; Lockwood et al. 2018), lone star tick (Amblyomma americanum) (Springer et al. 2014; Fowler et al. 2022), American dog tick (Dermacentor variabilis) (Boorgula et al. 2020; Martin et al. 2022), and Gulf Coast tick (Amblyomma maculatum) (Lockwood et al. 2018; Phillips et al. 2020; Alkishe & Petersen 2022; Flenniken et al. 2022). These range expansions have corresponded with an increase in reported TBD cases associated with these species including Lyme disease (Robinson et al. 2015), ehrlichiosis (Johnson et al. 2015), tidewater fever (Phillips et al. 2020) and newly documented Heartland virus (Tuten et al. 2020).
Illinois is experiencing tick and TBD expansion in both the northern and the southern regions (Springer et al. 2014; Sonenshine et al. 2018; Gilliam et al. 2020; Kopsco et al. 2021). Concurrently, there has been a 10-fold increase in commonly reported TBD cases among humans between 1999 and 2017 (IDPH 2017a, b; IDPH 2018; Lyons et al. 2021), including Lyme disease, Rocky Mountain spotted fever, ehrlichiosis, and anaplasmosis. Three distinct climate regions exist longitudinally across the state, with clear impacts on tick species abundance (Bacon et al. 2021). As climate alterations impact the various bioclimatic factors across these areas, it is important to predict how tick distribution and TBD risk will potentially change across the state.
While there is debate about the specific impacts of extreme climate conditions on ticks and TBDs in the future (Ogden et al. 2020), climate projection models can predict and assess various current and future habitat and distribution scenarios. Species distribution models (SDM) represent a suite of statistical and machine-learning methods for predicting suitable species habitat ranges and niches based on known occurrence records and various environmental variables. These strategies range from deterministic (e.g. logistic regression) to stochastic (e.g. Bayesian regression trees) approaches, and utilize various levels of model validation techniques. Given differences in model performance, using SDM model ensembles may provide a more complete picture of the possibilities for tick species range variation, and opportunities for public health and veterinary partners to enact control and prevention measures where most needed (Lippi et al. 2021b; Kopsco et al. 2022).
The objective of this study was to fit and evaluate current and future species distribution models for each of the four tick species of major medical and veterinary concern within Illinois, including Ixodes scapularis, Dermacentor variabilis, Amblyomma americanum, and Amblyomma maculatum, and to evaluate habitat and climate variables associated with their predicted occurrence. We expected that as the climate continues to warm, habitats in southern and central Illinois will become less hospitable for a desiccant-sensitive species like Ixodes scapularis, but more habitable for the other three more desiccant-tolerant species. This hypothesis would reflect a greater predicted species range throughout the state for Dermacentor and Amblyomma species but would result in a growing absence of suitable Ixodes scapularis habitat, except in the northernmost part of the state.
2. Materials and Methods
2.1. Tick Occurrence Data
We sourced presence-only tick occurrence records from several online, publicly accessible databases and through active tick collections throughout Illinois. Databases included Walter Reed Biosystematics Unit’s VectorMap (http://vectormap.si.edu/), Global Biodiversity Information Facility (GBIF; https://www.gbif.org/), Biodiversity Information Serving Our Nation (BISON; https://bison.usgs.gov/). To be included in a model, all tick occurrence data had to meet the following quality control criteria: be an observation from no earlier than 1950, include two decimal places or more for at least one coordinate, and have a coordinate inaccuracy of ≤20,000 m. Duplicate coordinates occurred often due to data being deposited in multiple databases, so entries were compared and duplicate coordinates were removed. Geolocations were cross-checked to ensure that records were accurate to the field location. Remaining coordinates were then thinned to 1km distance using the spThin package (Aiello-Lammens et al. 2015) to reduce the effect of sampling bias on model predictions.
2.2. Environmental covariates
Bioclimatic variables (1-19) (Table 1) were sourced from the geodata package (Hijmans et al. 2022) and downloaded at a resolution of 0.5 arcminutes (~1km2). Current climate models were fit using the historical data representing the average measurements from 1970-Future climate models were fit with mean projections of these data at a ~1km2 resolution using a Coupled Model Intercomparison Project Phase 6 (CMIP6) Earth Systems Model (EC-Earth3-Veg) under Representative Concentration Pathway (RCP) 8.5 for 2050 (average from 2041-2060) and 2070 (average from 2061- 2080). Overall; 2000, ESMs like EC-Earth3-Veg tend to describe the most relevant climate feedback mechanisms, and provide more thorough uncertainty measurements than Global Circulation Models (GCMs) (Doscher et al. 2022). While using an ensemble of future climate models is generally employed when fitting SDMs for larger regions to minimize individual model bias, we chose a single GCM that is shown to perform best for the small region we are modeling (Ashfaq et al. 2022). Using an ensemble that incorporates numerous GCMs/ESMs over a small region like a single state can skew predictions (Ashfaq et al. 2022). RCP 8.5 is a future climate scenario that describes the expected baseline high greenhouse gas impact resulting from a lack of carbon emission mitigation policies (Riahi et al. 2011), i.e. a “worst case” scenario.
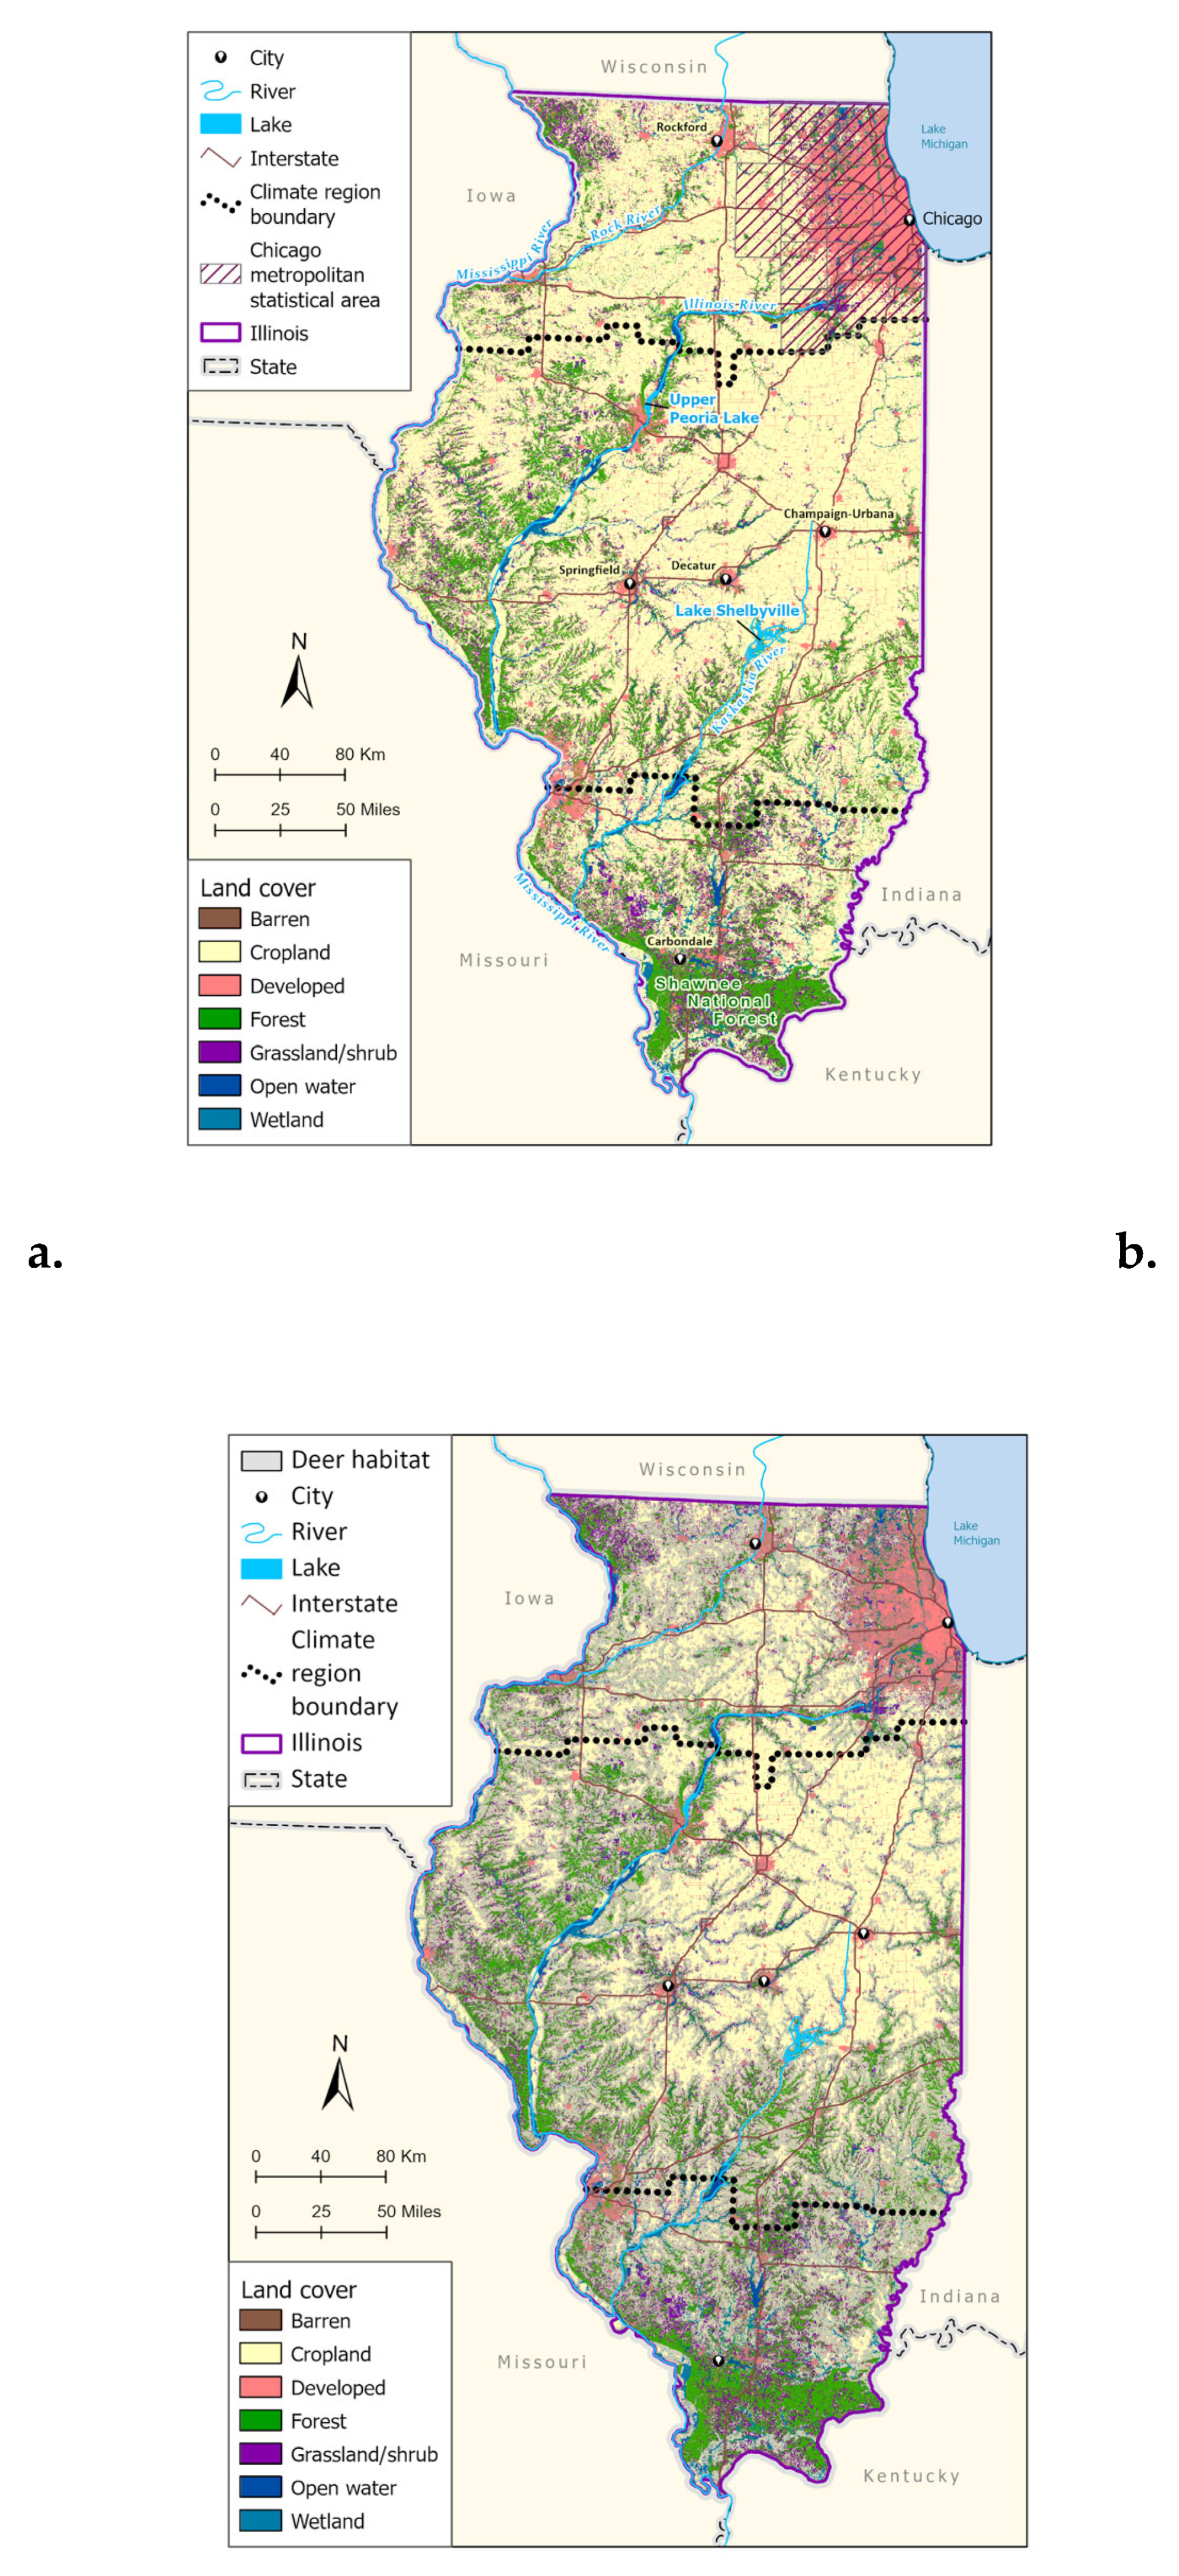
Due to the importance of white-tailed deer (Odocoileus virginianus) as reproductive hosts for each of these four species, we included a raster of suitable deer habitat within Illinois (USGS 2018). Landcover class (Figure 1) and percent impervious surface, from the National Land Cover Database (NLCD) (Dewitz & USGS 2021) were also included. The NLCD is a collection of land cover imagery at 30m resolution that combines information from all years of land cover change (2001-2019) across 16 classes of cover that include impervious land, cropland, wetland, and various vegetation types, which were aggregated into seven more general land cover categories (Water, Developed, Barren, Forest, Grass/Shrub, Cropland, and Wetland). An average of these land cover classes was taken across every 2-3 years instead of data from a single year to adjust for the change that occurred from 2001-Elevation was sourced from the raster package (Hijmans 2022) derived from Shuttle Radar Topography Mission (SRTM) National Elevation Dataset digital elevation models (at a resolution of 1 and 1/3 arcseconds; USGS 2022).
All covariates were cropped to the extent of the Illinois’ state borders (xmin: -91.2019, 5, xmax: -87.5, ymin: 36.9, ymax: 42.5) and resampled to a resolution of 1 km (0.5 arcminutes) to match the bioclimatic data sets for the specific climate projection period. Extracted covariate values were assessed for collinearity for each species and period by assessing variance inflation factor. Any variable with a v-step score of 10 or higher was excluded from that species and climate period model due to collinearity.
2.3. Model fitting and evaluation
Models were fit using the sdm package (Naimi & Araujo 2016) in R version 4.1.3. Regression and machine learning models for each species for the current climate were first fit using the following individual methods: generalized linear models (GLM), generalized additive models (GAM), Bayesian regression trees (BRT), classification and regression trees (CART), MaxEnt, random forest (RF), multivariate adaptive regression splines (MARS), and support vector machines (SVM). The number of randomly selected pseudo-absence points were set at approximately the same number of presence points for each species due to the mixed use of regression and machine learning techniques within the modeling algorithm (Barbet-Massin et al. 2012), and were also thinned to 1km2 to match presence points. Cross-validation and bootstrap data partitioning methods (with 30% test percentage) were used for each model type, with five replicates for each method totaling five replicates per algorithm (30 total replicates per species). Single model algorithms that were not 100% successful during replicate runs were excluded from ensemble models. Models were evaluated using several performance scores including threshold-dependent and threshold-independent methods: area under the curve (AUC), true skill statistic (TSS), model deviance (DEV), and correlation (COR). Single models demonstrating AUC > 0.75, and TSS > 0.50 were retained for mean-weighted ensemble models (i.e. a two-step process that incorporates both within-model averaging and between-model averaging). Cohen’s kappa was not used for single model evaluation due to its overreliance on prevalence but was consulted to determine consistency in predictions across models (Grimmett et al. 2020). AUC was not used alone to assess prediction accuracy because of its poor ability to reliably assess presence-background nature of the tick occurrence data (Allouche et al. 2006; Grimmett et al. 2020).
Figure 1.
(a) National Land Cover Database (NLCD; 2019) aggregated landcover classes for Illinois. Climate region boundaries are derived from the National Oceanic and Atmospheric Administration U.S. Climate Divisional Dataset. (b) NLCD aggregated land cover with white-tailed deer habitat overlay (USGS GAP Analysis).
3. Results
3.1. Ixodes scapularis models
After duplicate records were removed and presence points thinned there remained 62 known I. scapularis occurrence points across Illinois, and 70 pseudoabsence points randomly generated (Table 2). After assessing for multicollinearity amongst environmental variables for the all climate periods, fifteeen predictor variables out of the 29 total environmental covariates were removed from the dataset due to v-step scores greater than 10 (bio1, bio2, bio3, bio4, bio6, bio10, bio11, bio12, bio14, bio15, bio16, bio17, bio19, percent impervious surface, percent white-tailed deer habitat). Retained in the historical, 2050, and 2070 climate correlate dataset for I. scapularis were bio5, bio7, bio8, bio9, bio13, bio18, elevation, percent water body coverage, percent barren land, percent forest, percent grassland, percent cropland, and percent wetland.
Single algorithm evaluation revealed RF to be the best fit model for predicting the historical climate distribution of I. scapularis (Table 2). The landscape variables that most strongly predicted occurrence of I. scapularis habitat across this model in the historical climate were percent forest (16.5% relative contribution), percent wetland (10.8%), and percent grassland (11.1%). Climate variables all contributed less than 5% each. I. scapularis was predicted to occur above 80% likelihood in forest landscapes with less than 50% coverage, and was expected to increasingly occur with greater percentages of wetlands and grasslands. Predicted I. scapularis occurrence was less likely with increasing maximum temperatures in the warmest month (bio5), increasing mean temperature of the driest quarter (bio9), increasing annual temperature range (bio7), and increasing precipitation in the wettest month (bio13). I. scapuarlis was more likely to occur with increasing precipitation in the warmest quarter (bio18), and with increasing temperatures (up to 21°C) in the wettest quarter.
The best fit single algorithm model for future predictions was RF (2050; AUC = 0.82, COR=0.55, TSS = 0.64, DEV = 1.08), and SVM (2070; AUC=0.90, COR = 0.72, TSS = 0.76, DEV = 0.81). Percent forest covergage became more important in preducting the likelihood of I. scapularis in the 2050 and 2070 climate scenarios, increasing to 27.2% (2050) and then 28% (2070) relative contribution (Table 3). By 2070, percent wetland rose to 13.6% relative contribution and was one of the most important variables along with precupitation of the warmest quarter (bio18) (Table 3). Overall, I. scapularis displayed they same response to landcover and climate variables in the future scenarios as it did in the historical climate. As the climate changed, the difference that occurred was that the presence of I. scapularis was increasingly more likely in habitats with greater forest cover (between 50% and 75% coverage), and the overall greatest predicted probability of I. scapularis for any variables dropped to approximately 85% likelihood in 2050, and then to 75% in 2070 .
Best fit mean-weighted ensemble models for both historical and future climate scenarios included the following algorithms: GLM, BRT, CART, MaxEnt, RF, and SVM. Within the historical climate the best fit ensemble models predicted that I. scapularis would most likely be found within the Chicago metropolitan statistical area (CMSA) along the northeastern border of Lake Michigan, along riparian zones in western and central Illinois, and within the forested regions of east-central and southern Illinois (Figure 2a). The tick species was also expected to be found scattered throughout forested pockets within the central portion of the state. As the climate warmed in the 2050 (Figure 2b) and 2070 (Figure 2c) projection scenarios, the likelihood of I. scapularis presence throughout the central and southern tiers began to recede and concentrate along rivers and waterbodies (2050), and then shifted to a greater expectation of occurrence within the heavily forested region of Southern Illinois (2070) (Figure 3).
3.2. Amblyomma americanum models
After removing duplicate observations and occurrence points were thinned to 1km, 99 records of Amblyomma americanum were retained for modeling and 100 randomly selected pseudoabsence points were generated (Table 2). Fifteen variables were removed due to multicollinearity (bio1, bio3, bio4, bio5, bio6, bio7, bio10, bio11, bio12 , bio14, bio16, bio17, bio19, percent developed land, and percent impervious surface,). Retained for modeling of all climate periods were bio2, bio8, bio9, bio13, bio15, bio18 and land cover categories elevation, white-tailed deer habitat, percent water body coverage, percent barren land, percent forest coverage, percent grassland, percent cropland, and percent wetland.
Random forest was the best fit single model algorithm for predicted A. americanum habitat distribution of the six total included model algorithms across all climate periods (Table 2; 2050: AUC = 0.89, COR = 0.70, TSS = 0.74, DEV = 0.84; 2070: AUC = 0.92, COR = 0.74, TSS = 0.76, DEV = 0.76). The most important variables that predicted occurrence of A. americanum habitat across this model for the historical climate were percent wetland (17.9% variable contribution), percent forest coverage (11.8%), and presence of white-tailed deer habitat (3.9%). Climate variables bio2 (1.8%), and bio15 (2.4%) were the most important contributing climate variables to the historical climate prediction of A. americanum distribution (Table 2). Presence of A. americanum was between 80 and 90% likely to occur in forest habitats with less than 50% coverage in the historical climate period. Under these conditions, A. americanum is also positively associated with barren land, white-tailed deer habitat, and wetland landcover, with occurrence probabilities as high as 90% with increasing percent class coverage. Likelihood of occurrence declined slightly with increasing grassland and waterbody coverage. The probability of this species’ occurrence briefly increased and then sharply declined with increasing percentage of cropland coverage, precipitation seasonality (bio15), precipitation in the warmest quarter (bio18), mean diurnal range (bio2), and mean temperature of the wettest quarter (bio8) . Occurrence of A. americanum was negatively associated with increasing precipitation of the wettest month (bio13), and was positively associated with increasing temperature of the driest quarter (bio9). In future climate scenarios, A. americanum responded to these land cover and climate variables in the same way except that this tick was more likely to occur in higher percents of cropland and forest, and was more significantly predicted by mean diurnal range (bio2) than in the historical climate period. In the 2070 mean climate, the overall probability of A. americanum occurrence across all variables was lower.
Best fit mean-weighted ensemble models for both current and future climate scenarios included the following algorithms: GLM, BRT, CART, MaxEnt, RF, MARS, and SVM. Historical A. americanum distribution was predicted to be greatest in the southern-most portion of the state where there is more contiguous forest and suitable white-tailed deer habitat, and along riparian zones of the Illinois and Rock River systems, and within the Chicago metropolitan statistical area (Figure 4a). As the climate scenarios progress to 2050 mean climate, A. americanum appears to occur with greater likelihood in Shawnee National Forest but is less likely to occur in the white-tailed deer habitat between forest patches in and around Lake Shelbyville and the Kaskaskia River, the Illinois River and forest to the west, the Rock River, and within the CMSA (Figure 4b; Figure 5). By 2070, A. americanum is expected to occur more broadly within croplands across the state, but at lower probabilities. It is also less likely to occur in the CMSA (Figure 4c; Figure 5)
3.3. Dermacentor variabilis models
After removing duplicate records and thinning observations, 290 records of D. variabilis were retained for modeling and 300 randomly generated pseudoabsence points were generated. Best fit models for the all climate conditions for D. variabilis included bio2, bio7, bio8, bio9, bio10, bio13, bio18, elevation, percent water body coverage, percent barren land, percent developed land, percent forest, percent grassland, percent cropland, and percent wetland. Fourteen covariates (bio1, bio3, bio4, bio5, bio6, bio11, bio12, bio14, bio15, bio16, bio17, bio19, percent impervious surface, and suitable white-tailed deer habitat) were removed from consideration in the historical climate model due to collinearity issues.
Random forest was the best fit single model algorithm for predicting the presence of D. variabilis within the historical and both future climate periods (Table 2; 2050: AUC = 0.89, COR = 0.68, TSS = 0.67, DEV = 0.85; 2070: AUC = 0.88, COR = 0.68, TSS = 0.67, DEC = 0.86). Percent forest coverage was the most important variable in predicting D. variabilis occurrence (30.4% relative importance) in the historical period, followed by percent wetland (12.7%) (Table 3). The climate variable that contributed most to the model was mean diurnal range (bio2; 8.6%) (Table 3). Greater likelihood of D. variabilis presence was predicted with increasing percentage of barren land and wetland. D. variabilis was 90% likely to occur in habitats with up to 25% forest coverage, but decline to near 50% occurrence likelihood as forest percentage increased. Similarly, D. variabilis was less likely to occur with increasing cropland, developed land, grassland, and water body percentage. Predicted occurrence of D. variabilis increased to and then remained at 75% likelihood in response to the mean temperature of the driest quarter (bio9), and presence declined with increasing mean temperature of the warmest quarter (bio10). In response to precipitation of the wettest month (bio13), precipitation of the warmest quarter (bio18), mean diurnal range (bio2), temperature annual range (bio7), and mean temperature of the wettest quarter, D. variabilis predicted occurrence initially increased with the increasing temperature or precipitation, but then declined to near 50% probability.
For the 2050 climate projection percent forest (30.4% relative contribution) and wetland (12.3%) were again the most important variables in predicting occurrence of D. variabilis, followed by elevation (3.8%) and mean diurnal range (bio2; 3.4%) (Table 3). As the percentage of forest increased above 25%, the expected occurrence of D. variabilis declined from nearly 90% to approximately 60% likelihood. Under the conditions expected in this period, this species was more likely to be found in areas with water bodies (between 80-85% likelihood). Expected occurrence of D. variabilis followed the same increase followed by decrease trends with climate variables as it did in the historical period, but overall percent likelihood of occurrence reduced from the 90-60% range to 80-50% range.). Similar response patterns are seen in the 2070 projected climate compared to the 2050 climate, but with overall less expected occurrence of D. variabilis, and more dramatic response to the changing variables. Increasing percentage of forest reduces the overall likelihood of D. variabilis to 40% at 100% forest coverage. Percent barren land continued to predict D. variabilis presence consistently at 75% probability. The likelihood of D. variabilis was positively associated with increasing precipitation of the wettest month (bio13), and precipitation of the warmest quarter (bio18), but only until 300mm after which it declined. Likelihood of D. variabilis occurrence declined to below 50% when mean diurnal range increased above 11°C, and declined to 60% probability of occurrence when the temperature annual range (bio7) rose above 40 °C.
Best fit mean-weighted ensemble models for historical and future climate scenarios included the following algorithms: GLM, BRT, CART, MaxEnt, RF, MARS, and SVM. Occurrence for D. variabilis under historical climate conditions was predicted to be distributed throughout the state, with concentrations of higher probability located within southern Illinois, the CMSA, and along riparian zones (Figure 6a). All climate scenarios predict that probability of D. variabilis occurrence is generally resilient in most habitats except cropland, but increasingly dependent on lower temperature and higher precipitation as the climate shifts into the more extreme 2070 projections (Figure 6b, c). By 2050, the tick species is less likely to occur along the northern border of the state, as well as along riparians zones of the Illinois and Kaskaskia Rivers (Figure 7). By 2070, the tick appears to increase in likelihood within those areas but becomes less likely to occur in the Shawnee Forest region of southern Illinois, and the south-central forested region. (Figure 7).
3.4. Amblyomma maculatum models
Fifteen records of A. maculatum were retained for modeling after removing duplicates and thinning, and were combined with 20 randomly selected pseudoabsence points. A total of twenty environmental correlates were removed due to multicollinearity (bio1, bio2, bio3, bio4, bio5, bio6, bio7, bio8, bio9, bio10, bio11, bio12, bio13, bio14, bio16, bio17, bio19, percent white-tailed deer habitat, elevation, and percent impervious surface). Remaining predictors in each climate model for A. maculatum were bio15, bio18, percent water bodies, percent barren land, percent developed, percent forest, percent grassland, percent cropland, and percent wetland
Support vector machines was the best fit model to predict the historical and 2070 distribution of A. maculatum (Table 2; 2070: AUC = 0.77; COR = 0.47; TSS = 0.67; DEV = 1.24), while RF was the best algorithm for the 2050 climate period (AUC = 0.75, COR = 0.48, TSS = 0.65, DEV = 1.23. Percent forest (29.1% relative importance), percent developed land (10.3%), percent wetland (10.1%), and percent cropland (10.0%) were the most important landscape variables in predicting probable locations of A. maculatum during the historical and 2050 climate periods (Table 3). In 2070, percent barren land and grassland also become more important predictors of A. maculatum occurrence (Table 3). Precipitaton seasonality (bio15) and precipitation of the warmest quarter (bio18) were the only significant climate variables included in the models, and these both increased in relative contribution to the model in the 2050 and 2070 scenarios (Table 3). In the historical climate, occurrence of this tick species was expected in open landscapes, and was positively correlated with increasing percentages of grassland, cropland, developed land, and negatively associated with forests. Proximity to waterbodies and wetlands also increased the probability of A. maculatum occurrence during this period. Variation in precipitation as well as total precipitation in the warmest quarter initially was associated with an increase in likelihood of A. maculatum occurrence (to only 50-55% likelihood), but then likelihood decreased as the coefficient rose above 25, and as precipitation in the warmest quarter reached 330mm.
As the climate warmed in 2050 and 2070, occurrence probability of A. maculatum shifted to specific habitats. Percent forest, developed land, and precipitation of the warmest quarter (bio18) became the most important variables for the model in 2050 (50.0%, 6.2%, and 7.8% relative importance respectively). Probability of A. maculatum occurrence increased in areas with greater percentage of developed landcover (i.e. CMSA) and decreased in response to increasing percentage of forest. Precipitation of the warmest quarter (bio18) was associated with a sharp increase in likelihood of A. maculatum occurrence during this time period, and increasing seasonality of precipitation (bio15) was associated with an increase in probability of occurrence to approximately 30mm, and then a sharp decline in probability of occurrence. Under the 2070 climate scenario, percent forest contributed slightly less to the A. maculatum distribution model (45.3%) as other variables increased in relative contribution. Percent wetland, percent barren land, percent cropland, percent grassland, and percent developed land contributed roughly the same amount fo the model (13.1%, 9.8%, 8.6%, 7.7%, and 7.6% relative importance respectively; Table 3). Precipitation of the warmest quarter ( bio18) was also a driving climate variable in the prediction of A. maculatum distribution (10.4% relative variable importance). Within these future conditions, A. maculatum was predicted (between 40 and 70% likelihood) to be associated with open landscapes like increasing barren land, cropland, developed land, and grasslands. Occurrence of this tick species was also expected at 40-50% probability. in areas with 10-20% water bodies and wetlands. As the variation in precipitation across seasons (bio15) increased above 15mm, the likelihood of A. maculatum occurrence decreased from 45% likelihood to below35% probability. Increasing precipitation of the warmest quarter (bio18) was associated with a strong increase in A. maculatum occurrence probability from 30%-60% as precipitation reached 340mm.
These model predictions suggest that A. maculatum has wide distribution potential throughout Illinois in the historical climate scenario. It is most likely to be able to survive in open barren landscapes that are close to water sources and wetlands, placing the most probable distribution predictions along the Illinois and Rock rivers, and around the CMSA on the banks of Lake Michigan. Scattered pockets of higher probability throughout the state correspond with areas that are devoid of dense forest (greater than 50% coverage), or areas that are more than 50% cropland (Figure 8a). In the 2050 (Figure 8b) and 2070 (Figure 8c) climate prediction ensemble models projected that A. maculatum distribution would reduce overall, with covariates only predicting likelihood of tick occurrence as high as 70%. During these scenarios, A. maculatum was generally more prevalent in areas with less than 50% forest cover. In 2050, the distribution of A. maculatum was predicted to be more highly concentrated in open habitat near rivers and the floodplains of water bodies, as well as increased probability of occurrence in the CMSA (Figure 8b). The predictions for A. maculatum distribution in the 2070 scenario appear to change drastically, with higher likelihood of occurrence throughout the central portion of the state – particularly in areas with a high percentage of cropland – and less strongly associated with wetlands (Figure 8c). Change over time shows a south to north shift in suitable habitat across the state (Figure 9).
4. Discussion
This investigation applied numerous species distribution modeling techniques to examine the historically predicted distribution of four ticks of medical concern in Illinois, and the estimated future habitat suitability based on two climate scenarios. With the exception of A. maculatum, our results support known (Jobe et al. 2007; Rydzewki et al. 2012; Gilliam et al. 2020) and predicted (Guerra et al. 2001; Lippi et al. 2021a; Alkishe et al. 2021; Flenniken et al. 2022) habitat ranges for these species within the state and attempted to identify environmental factors that will contribute to continued or altered suitability distributions in potential future climate conditions.
The best fit individual models to describe these historical and future habitat suitability scenarios were random forest and support vector machines. Random forest is a specific type of classification/regression tree (CART) ensemble and recursive partitioning method that can handle highly dimensional data with accuracy and is resistant to overfitting due to its randomized splitting and sampling procedure of the training data (Strobl et al. 2009). However, Valavi et al. (2021) note that RF prediction can be negatively impacted when using presence-background data like the tick data used in this investigation due to class imbalance and overlap. This occurs when there is a small sample of presence points, and the background points are sampled in a way that does not allow for enough discrimination in the predictors of presence and background location (Valavi et al. 2021). Support vector machines are another machine learning algorithm that utilize kernel function for mapping presences amidst complex correlational data and are useful because they do not require data to be independent (Drake et al. 2006; Valavi et al. 2022). To prevent biasing the outcomes as best as we could we applied mean weights, approximate equal sampling of the presence and the background data and used down-sampling by way of cross-validation (Valavi et al. 2021). The best performing models were consistently the mean-weighted ensembles, which is an outcome supported by previous research (Valavi et al. 2022).
Our models support and expand upon previous work on habitat suitability for ticks in Illinois. Records of county-level establishment, passive surveillance, and ecological niche modeling demonstrate expansion of I. scapularis across the state (Eisen et al. 2016; Kopsco et al. 2021; Alkishe et al. 2021; Wikel 2022), however our expectation that as the climate continues to warm, regions in southern and central Illinois will become less hospitable for a desiccant-sensitive species like I. scapularis, was not supported. We found that occurrence of these species are still driven strongly by precipitation and temperature variables as previous work in the state has demonstrated (Bacon et al. 2021), but in ways we did not expect. Our models predicted that I. scapularis will initially be confined to more northern regions in the state, and within habitats that provide more protective cover (e.g. upland forest) and moisture availability, e.g. along riparian zones of the Sangamon, Rock, and Illinois Rivers, as well as in forested areas and edge surrounding Lake Shelbyville, and Upper Peoria Lake. However, Shawnee National Forest becomes highly likely to be suitable refugia in the 2070 climate scenarios.
We observed the potential continued future suitability of habitat for I. scapularis located in high population centers like Cook, DuPage, McHenry, and Lake Counties outside Chicago. Borrelia burgdorferi-infected I. scapularis have been collected from high-access areas within these locations going back decades (Jobe et al. 2007; Rydzewski et al. 2011). Guerra et al. (2002) identified positive associations of I. scapularis with various soil types (e.g. fertile alfisols, sand, and loam), deciduous and dry forests, and negative associations with grasslands, acidic soils, conifer, and wet forests. At that time, highly likely (>0.50) habitat suitability for I. scapularis was largely limited to areas within Shawnee National Forest, and along the Illinois and Mississippi River and very few areas of higher probability of presence (0.50-0.75) in the counties surrounding Chicago (Guerra et al. 2002). We predicted greater suitability for I. scapularis throughout the central and southern portions of the state than what was previously predicted or currently reported by Illinois Department Public Health records (IDPH 2022). It is suspected that I. scapularis is not currently occupying a larger distribution within Illinois due to its complex ecology (Kilpatrick et al. 2017; Diuk-Wasser et al. 2021; McBride et al. 2022). While our results could suggest that the tick simply has not yet invaded these areas, they may also reflect sampling limitations. Lyons et al. (2021) found few I. scapularis ticks during active surveillance in southern Illinois, but the timing of this surveillance was not optimized to the phenology of I. scapularis and passive surveillance efforts lacked coverage in many areas of interest.
Levi et al. (2015) examined activity patterns of I. scapularis over 19 years and found years with warmer temperatures in the summer and fall were associated with a three-week acceleration in the phenology of nymphal and larval ticks as compared to years with lower temperatures. Model predictions suggest up to a two-week average earlier activity period for larvae and nymphs if 2050 warming predictions hold (Levi et al. 2015), which provide additional opportunity for overlap with humans and domestic animals. Given that the risk of acquiring a tickborne illness like Lyme disease is heavily dependent on not only the enzootic cycle of disease, but also on human behavior, our predictions can help identify areas of Illinois to concentrate additional surveillance efforts to more accurately quantify that acarological risk.
Predicted A. americanum habitat for the historical climate closely matches reported occurrence within Illinois (IDPH 2022). Currently this species is most abundant in the southern portion of the state but is becoming increasingly more common in the north (Ma et al. 2021; Rochlin et al. 2022; Fowler et al. 2022). A. americanum’s aggressive host seeking and non-specific host preferences create an optimal dispersal scenario which allow this tick to travel long distances on meso-mammals and deer, as well as birds (Goddard and Varella-Stokes 2009). Despite all tick species modeled relying on white-tailed deer for at least part of their lifecycle, A. americanum was the only species distribution significantly predicted by suitable white-tailed deer habitat. We suspecte that this is because white-tailed deer (Odocoileus virginianus) are the preferred hosts for all life stages of A. americanum (Paddock & Yabsley 2007).
However, D. variabilis and A. americanum were also found to be constrained by the 2070 climate scenarios in similar habitats but were more likely to occur throughout more of the forested southern portion of the state, like previous research (Oliveira et al. 2017). A. maculatum was the only tick predicted to continue to expand throughout the state as the temperatures rose more extremely into the 2070 climate. Of greatest concern for public health is the increasing likelihood of these additional vector tick species near the higher population centers along the Illinois River and surrounding Chicago. We have found that few medical professionals in northern areas in Illinois were familiar with the risk of ehrlichiosis within the state (Carson 2022), despite 422 cases between 2011 and 2021 (IDPH 2022). This is likely due to the current abundance of A. americanum being higher in the southern portion of the state and is likely to delay diagnosis and treatment of pathogens vectored by these less-studied tick species. Both Bayles et al. (2013) and Soucy & de Urioste-Stone (2020) also found that adoption of effective tick prevention measures, such as tick checks, was associated with perceived risk of tick bites. As actual risk of tick exposure changes due to shifting tick habitat and abundance, public and professional awareness must be addressed through dynamic communication efforts.
We focused on more extreme expectations for future climate scenarios to capture a likely “worst case scenario” for future tickborne disease risk, mainly because the entirety of Illinois is expected to be within a projected “extreme heat belt” with heat index temperatures exceeding 125 degrees Fahrenheit for at least one day by 2053 (First Street Foundation 2022). Broader studies that have examined potential tick niche expansion and retraction under future scenarios have found similar results for these species regardless of the global circulation model chosen. Ma et al. (2022) explored the impact of several shared socioeconomic pathways through 2100 and predicted all of Illinois to be highly suitable for A. americanum during all scenarios ranging from least impactful to most impactful. These projections combine climate model data with policy to best capture a likely outcome for climate change. Employing ecological niche models with RCP 4.5 and RCP 8.5 predicted a similar suitability outcome for A. americanum in North America (Raghavan et al. 2016, 2019), as did a study by Boorgula et al. (2020) which predicted moderate to high suitability for D. variabilis throughout the state continued through both RCP 4.5 and RCP 8.5 scenarios. While Flenniken et al. (2022) did not examine future projections of A. maculatum, they found that under current climate conditions the expected ecological niche for this species is much greater than its current distribution, suggesting the potential for expansion north and east. By focusing on Illinois alone, we were able to apply a more fine-scale environmental niche prediction for each of these four tick species within the RCP 4.5 and 8.5 scenarios.
We recognize several limitations in our investigation. It is important to note that species distribution modelling is often subject to confounding due to the phenomenological approach to predicting tick distributions. Spurious correlations can be assumed without additional mechanistic understanding of the relationships among ticks and these environmental predictors at a smaller scale (Ostfeld & Brunner 2015). We attempted to control for this, in part, by including known white-tailed deer habitat, but this variable was removed due to collinearity issues with other environmental correlates. Previous work also demonstrated that for certain species, like I. scapularis, tick presence varied despite host availability, suggesting a more influential role of abiotic variables (Guerra et al. 2002). While the inclusion of other forest-level habitat variables likely replaced the need for specific deer habitat for three of the four ticks, we consider it a limitation given the need for and importance of considering reproductive host species in habitat models. However, in the case of the Lyme bacteria (Borrelia burgdorferi) recent evidence may suggest that overall tickborne disease hazard risk posed by the positive association between deer density and nymphal tick density is cancelled out through opposing forces of both amplification and dilution since deer are not a competent reservoir for the bacteria (Gandy et al. 2022).
Our environmental correlates included climate variables that change according to proposed scenarios, but the landcover predictors did not include estimates of variability. As landcover predictors did not change over time, our model results therefore assume that the changes in climate do not change the percentage of cropland or other landcover types throughout the state. ESRI landscape change predictions for 2050 in Illinois included an expected gain of over 821,000 acres of cropland throughout the state, a gain of over 503,000 acres of developed or impervious surface, and losses of deciduous forest (743,000 acres), grassland (380,000 acres), and wetland (39,224 acres) (ESRI Landcover 2050). Future modeling work should include these predictions to improve upon static landscape assumptions. Further, the historical climate and landscape variables were slightly mismatched (climate was a mean from 1970-2000, whereas the landscape mean ranged from 2001-2019). These differences could potentially impact the model accuracy. We did not incorporate soil types or profiles (Guerra et al. 2002) into the models which also may have impacted the predictions due to their ability to harbor and control microclimates and habitats that can impact tick survival. However, since only certain vegetation is expected to grow according to various soil profiles (Guerra et al. 2002), we assumed that vegetation was enough of a proxy for these models.
Booth (2022) reported that certain combined temperature and precipitation bioclimatic variables can be unreliable in species distribution modeling depending on proximity to the equator due to discontinuities in interpolation and can result in extreme differences over short distances. In the United States, specifically, mean temperature of the warmest quarter (bio8), and mean temperature of the driest quarter (bio9) demonstrated anomalies in the south and southeastern regions of the country (Booth 2022). These discontinuities were like others that occurred globally near the equator. These anomalies should not have impacted our results because of Illinois’ distance from the equator, but mention is warranted since these variables were important in our models.
Sampling bias consideration is important with occurrence data and may have influence potentially seen in response curves of I. scapularis in the historical climate. Previous research (Diuk-Wasser et al. 2021) showed an increasing likelihood of presence of I. scapularis in uninterrupted forest, whereas our results demonstrate a large decline in the likelihood of I. scapularis occurrence with increasing percentage of forest cover. This could reflect a lack of data points collected from deeper within forests (i.e. collections intentionally performed in easily accessible places because this is where the disease transmission risk is), or that this species spends more time in edge environments within Illinois. The sampling method (drag versus CO2 trap versus small animal capture) is also important to consider when assessing bias. Rynkiewicz et al. (2014) reported that I. scapularis was mainly found collected from small mammals while A. americanum and D. variabilis were able to be collected using cloth drag and CO2 protocols. Records of I. scapularis in Illinois may therefore be underrepresented, as most sampling in the state has used the cloth drag approach.
The very small data set for A. maculatum may have contributed to projected future results suggesting a lack of A. maculatum in landscapes that it is known to thrive in, like grasslands, or future projections associating the tick with croplands. Specifically, the sample size may have impacted the accuracy of the random forest/CART predictions per class overlap as previously stated (Valavi et al. 2021). Reevaluation of this tick’s expected distribution as more data become available is necessary.
5. Conclusions
The variable landscape of Illinois creates a patchwork of risk to humans and domestic animals that can be predicted based on climate and landscape features. As the climate changes over the coming decades, the distribution of these tick species will change as it adapts to the increasing temperatures. Knowing where ticks may concentrate will be important to anticipating, preventing, and treating tickborne disease.
Supplementary Materials
The following supporting information can be downloaded at: www.mdpi.com/xxx/s1, Figures S1 – S8.
Author Contributions
H.L.K.: Conceptualization, Data curation, Investigation, Formal analysis, Writing – original draft, Writing – review and editing P.G.: Visualization, Writing – review and editing N.M.P.: Conceptualization, Writing – original draft, Writing – review and editing R.L.S.: Conceptualization, Supervision, Funding acquisition, Writing – original draft, Writing – review and editing.
Funding
This work was supported by the Department of Defense grant number: TB180052.
Data Availability Statement
Data and code can be accessed here: https://github.com/hkopsco/ILTickSDM.
Acknowledgments
We are grateful to all the researchers who cataloged, contributed, and maintained tick occurrence observations in public data bases.
Conflicts of Interest
The authors declare no conflict of interest.
References
- 6th National Risk Assessment of Hazardous Heat [WWW Document], n.d.. FirstStreet. Available online: https://firststreet.org/research-lab/published-research/article-highlights-from-hazardous-heat/ (accessed on 11 December 2022).
- Aiello-Lammens, M.E.; Boria, R.A.; Radosavljevic, A.; Vilela, B.; Anderson, R.P. spThin: An R package for spatial thinning of species occurrence records for use in ecological niche models. Ecography 2015, 38, 541–545. [Google Scholar] [CrossRef]
- Allan, B.F.; Keesing, F.; Ostfeld, R.S. Effect Of Forest Fragmentation on Lyme Disease Risk. Conserv. Biol. 2003, 17, 267–272. [Google Scholar] [CrossRef]
- Alkishe, A.; Raghavan, R.K.; Peterson, A.T. Likely Geographic Distributional Shifts among Medically Important Tick Species and Tick-Associated Diseases under Climate Change in North America: A Review. Insects 2021, 12, 225. [Google Scholar] [CrossRef] [PubMed]
- Alkishe, A.; Peterson, A.T. Climate change influences on the geographic distributional potential of the spotted fever vectors Amblyomma maculatum and Dermacentor andersoni. PeerJ 2022, 10, e13279. [Google Scholar] [CrossRef] [PubMed]
- Allouche, O.; Tsoar, A.; Kadmon, R. Assessing the accuracy of species distribution models: prevalence, kappa and the true skill statistic (TSS). J. Appl. Ecol. 2006, 43, 1223–1232. [Google Scholar] [CrossRef]
- Ashfaq, M.; Rastogi, D.; Kitson, J.; Abid, M.A.; Kao, S.-C. Evaluation of CMIP6 GCMs over the CONUS for Downscaling Studies. J. Geophys. Res. 2022, 127. [Google Scholar] [CrossRef]
- Bacon, E.A.; Kopsco, H.; Gronemeyer, P.; Mateus-Pinilla, N.; Smith, R.L. Effects of Climate on the Variation in Abundance of Three Tick Species in Illinois. J. Med. Entomol. 2022, 59, 700–709. [Google Scholar] [CrossRef] [PubMed]
- Barbet-Massin, M.; Jiguet, F.; Albert, C.H.; Thuiller, W. Selecting pseudo-absences for species distribution models: How, where and how many? Methods Ecol. Evol. 2012, 3, 327–338. [Google Scholar] [CrossRef]
- Bayles, B.R.; Evans, G.; Allan, B.F. Knowledge and prevention of tick-borne diseases vary across an urban-to-rural human land-use gradient. Ticks Tick Borne Dis. 2013, 4, 352–358. [Google Scholar] [CrossRef] [PubMed]
- Berger, K.A.; Ginsberg, H.S.; Gonzalez, L.; Mather, T.N. Relative humidity and activity patterns of Ixodes scapularis (Acari: Ixodidae). J. Med. Entomol. 2014, 51, 769–776. [Google Scholar] [CrossRef] [PubMed]
- Berger, K.A.; Ginsberg, H.S.; Dugas, K.D.; Hamel, L.H.; Mather, T.N. Adverse moisture events predict seasonal abundance of Lyme disease vector ticks (Ixodes scapularis). Parasites and Vectors 2014, 7, 1–8. [Google Scholar] [CrossRef]
- Boorgula, G.D.Y.; Peterson, A.T.; Foley, D.H.; Ganta, R.R.; Raghavan, R.K. Assessing the current and future potential geographic distribution of the American dog tick, Dermacentor variabilis (Say) (Acari: Ixodidae) in North America. PLoS ONE 2020, 15, e0237191. [Google Scholar] [CrossRef] [PubMed]
- Booth, T.H. 2022. Checking bioclimatic variables that combine temperature and precipitation data before their use in species distribution models. Austral Ecol. [CrossRef]
- Brownstein, J.S.; Holford, T.R.; Fish, D. Effect of Climate Change on Lyme Disease Risk in North America. Ecohealth 2005, 2, 38–46. [Google Scholar] [CrossRef] [PubMed]
- Carson, D.A.; Kopsco, H.; Gronemeyer, P.; Mateus-Pinilla, N.; Smith, G.S.; Sandstrom, E.N.; Smith, R.L. Knowledge, attitudes, and practices of Illinois medical professionals related to ticks and tick-borne disease. One Health 2022, 15, 100424. [Google Scholar] [CrossRef] [PubMed]
- Dewitz, J.; and, U.S. Geological Survey, 2021, National Land Cover Database (NLCD) 2019 Products (ver. 2.0, June 2021): U.S. Geological Survey data release. [CrossRef]
- Diuk-Wasser, M.A.; VanAcker, M.C.; Fernandez, M.P. Impact of Land Use Changes and Habitat Fragmentation on the Eco-epidemiology of Tick-Borne Diseases. J. Med. Entomol. 2021, 58, 1546–1564. [Google Scholar] [CrossRef] [PubMed]
- Drake, J.M.; Randin, C.; Guisan, A. Modelling ecological niches with support vector machines. J. Appl. Ecol. 2006, 43, 424–432. [Google Scholar] [CrossRef]
- Ferrell, A.M.; Brinkerhoff, R.J. Using landscape analysis to test hypotheses about drivers of tick abundance and infection prevalence with Borrelia burgdorferi. Int. J. Environ. Res. Public Health 2018, 15, 18–20. [Google Scholar] [CrossRef] [PubMed]
- Flenniken, J.M.; Tuten, H.C.; Rose Vineer, H.; Phillips, V.C.; Stone, C.M.; Allan, B.F. Environmental Drivers of Gulf Coast Tick (Acari: Ixodidae) Range Expansion in the United States. J. Med. 2022. Entomol. [CrossRef]
- Fowler, P.D.; Nguyentran, S.; Quatroche, L.; Porter, M.L.; Kobbekaduwa, V.; Tippin, S.; Miller, G.; Dinh, E.; Foster, E.; Tsao, J.I. , 2022. Northward Expansion of Amblyomma americanum (Acari: Ixodidae) into Southwestern Michigan. J. Med. Entomol. [CrossRef]
- Gandy, S.; Kilbride, E.; Biek, R.; Millins, C.; Gilbert, L. . No net effect of host density on tick-borne disease hazard due to opposing roles of vector amplification and pathogen dilution. Ecol. Evol. [CrossRef]
- Gilliam, B.; Gronemeyer, P.; Chakraborty, S.; Winata, F.; Lyons, L.A.; Miller-Hunt, C.; Tuten, H.C.; Debosik, S.; Freeman, D.; O’hara-Ruiz, M.; Mateus-Pinilla, N. Impact of Unexplored Data Sources on the Historical Distribution of Three Vector Tick Species in Illinois. J. Med. Entomol. 2020, 57, 872–883. [Google Scholar] [CrossRef] [PubMed]
- Grimmett, L.; Whitsed, R.; Horta, A. Presence-only species distribution models are sensitive to sample prevalence: Evaluating models using spatial prediction stability and accuracy metrics. Ecol. Modell. 2020, 431, 109194–https10. [Google Scholar] [CrossRef]
- Guerra, M.A.; Walker, E.D.; Kitron, U. Canine surveillance system for Lyme borreliosis in Wisconsin and northern Illinois: Geographic distribution and risk factor analysis. Am. J. Trop. Med. Hyg. 2001, 65, 546–552. [Google Scholar] [CrossRef] [PubMed]
- Guerra, M.; Walker, E.; Jones, C.; Paskewitz, S.; Cortinas, M.R.; Stancil, A.; Beck, L.; Bobo, M.; Kitron, U. Predicting the risk of Lyme disease: Habitat suitability for Ixodes scapularis in the north central United States. Emerg. Infect. Dis. 2002, 8, 289–297. [Google Scholar] [CrossRef] [PubMed]
- Heske, E.J. Mammalian Abundances on Forest-Farm Edges versus Forest Interiors in Southern Illinois: Is There an Edge Effect? J. Mammal. 1995, 76, 562–568. [Google Scholar] [CrossRef]
- Hijmans, R.J. (2022). raster: Geographic Data Analysis and Modeling. R package version.
- 3.5-15. https://CRAN.R-project.org/package=raster.
- Hijmans RJ, Ghosh A, Mandel A (2022). _geodata: Download Geographic Data_. R package version 0.5-3. https://CRAN.R-project.org/package=geodata.
- Hook, S.A.; Jeon, S.; Niesobecki, S.A.; Hansen, A.P.; Meek, J.I.; Bjork, J.K.H.; Dorr, F.M.; Rutz, H.J.; Feldman, K.A.; White, J.L.; Backenson, P.B.; Shankar, M.B.; Meltzer, M.I.; Hinckley, A.F. Economic Burden of Reported Lyme Disease in High-Incidence Areas, United States, 2014-2016. Emerg. Infect. Dis. 2022, 28, 1170–1179. [Google Scholar] [CrossRef] [PubMed]
- Illinois Department of Public Health. 2017a. Reportable Communicable Disease Cases, 1990 - 1999 - data.illinois.gov [WWW Document], n.d. URL https://data.illinois.gov/dataset/633reportable_communicable_disease_cases_1990_1999 (accessed 7.27.22).
- Illinois Department of Public Health. 2017b. Reportable Communicable Disease Cases, 2000 - 2009 - data.illinois.gov [WWW Document], n.d. URL https://data.illinois.gov/dataset/634reportable_communicable_disease_cases_2000_2009 (accessed 7.27.22).
- Illinois Department of Public Health. 2018. Reportable Communicable Disease Cases, 2010 - 2017 - data.illinois.gov [WWW Document], n.d. URL https://data.illinois.gov/dataset/635reportable_communicable_disease_cases_2010_2012 (accessed 7.27.22).
- Illinois Department of Public Health. 2022. Story Map Series [WWW Document n.d. URL https://idph.maps.arcgis.com/apps/MapSeries/index.html?appid=976061db733441eb977ef5cf2facd5c4 (accessed 11.1.22).
- Illinois Department of Public Health. 2022. Reported Tickborne Cases 2011-2021 [WWW Document], n.d. Available online: https://dph.illinois.gov/topics-services/diseases-and-conditions/diseases-a-z-list/lyme-disease/data/tickborne-cases-2011-2021.html (accessed on 11 August 2022).
- Jin, S.; Homer, C.; Yang, L.; Danielson, P.; Dewitz, J.; Li, C.; Zhu, Z.; Xian, G.; Howard, D. Overall Methodology Design for the United States National Land Cover Database 2016 Products. Remote Sensing 2019, 11, 2971, Jobe, D.A., Nelson, J.A., Adam, M.D., Martin, S.A., Jr, 2007. Lyme disease in urban areas, Chicago. Emerg. Infect. Dis. 13, 1799–1800. https://doi.org/10.3201/eid1311.070801. [Google Scholar] [CrossRef]
- Johnson, D.K.H.; Schiffman, E.K.; Davis, J.P.; Neitzel, D.F.; Sloan, L.M.; Nicholson, W.L.; Fritsche, T.R.; Steward, C.R.; Ray, J.A.; Miller, T.K.; Feist, M.A.; Uphoff, T.S.; Franson, J.J.; Livermore, A.L.; Deedon, A.K.; Theel, E.S.; Pritt, B.S. 2015. Human Infection with Ehrlichia muris-like Pathogen, United States, 2007-2013(1). Emerg. Infect. Dis. 21, 1794–1799. [CrossRef]
- Kilpatrick, A.M.; Dobson, A.D.M.; Levi, T.; Salkeld, D.J.; Swei, A.; Ginsberg, H.S.; Kjemtrup, A.; Padgett, K.A.; Jensen, P.M.; Fish, D.; Ogden, N.H.; Diuk-Wasser, M.A. 2017. Lyme disease ecology in a changing world: Consensus, uncertainty and critical gaps for improving control. Philos. Trans. R. Soc. Lond. B Biol. Sci. [CrossRef]
- Kopsco, H.L.; Duhaime, R.J.; Mather, T.N. Crowdsourced Tick Image-Informed Updates to U.S. County Records of Three Medically Important Tick Species. J. Med. Entomol. 2021, 58, 2412–2424. [Google Scholar] [CrossRef]
- Kopsco, H.L.; Smith, R.L.; Halsey, S.J. 2022. A Scoping Review of Species Distribution Modeling Methods for Tick Vectors. Frontiers in Ecology and Evolution 10. [CrossRef]
- Levi, T.; Keesing, F.; Oggenfuss, K.; Ostfeld, R.S. , 2015. Accelerated phenology of blacklegged ticks under climate warming. Philos. Trans. R. Soc. Lond. B Biol. Sci. [CrossRef]
- Lewis, S. ACCESS1-0 climate model output prepared for the Coupled Model Intercomparison Project Phase 5 (CMIP5) historical experiment, r2i1p1 ensemble. 2013. [CrossRef]
- Lippi, C.A.; Gaff, H.D.; White, A.L.; Ryan, S.J. ; 2021a. Scoping review of distribution models for selected Amblyomma ticks and rickettsial group pathogens. PeerJ 9, e10596. [CrossRef]
- Lippi, C.A.; Gaff, H.D.; White, A.L.; St John, H.K.; Richards, A.L.; Ryan, S.J. ; 2021b. Exploring the Niche of Rickettsia montanensis (Rickettsiales: Rickettsiaceae) Infection of the American Dog Tick (Acari: Ixodidae), Using Multiple Species Distribution Model Approaches. J. Med. Entomol. 58, 1083–1092. [CrossRef]
- Lockwood, B.H.; Stasiak, I.; Pfaff, M.A.; Cleveland, C.A.; Yabsley, M.J. Widespread distribution of ticks and selected tick-borne pathogens in Kentucky (USA). Ticks Tick Borne Dis. 2018, 9, 738–741. [Google Scholar] [CrossRef] [PubMed]
- Lyons, L.A.; Brand, M.E.; Gronemeyer, P.; Mateus-Pinilla, N.; Ruiz, M.O.; Stone, C.M.; Tuten, H.C.; Smith, R.L. Comparing Contributions of Passive and Active Tick Collection Methods to Determine Establishment of Ticks of Public Health Concern Within Illinois. J. Med. Entomol. 2021. [CrossRef] [PubMed]
- Ma, D.; Lun, X.; Li, C.; Zhou, R.; Zhao, Z.; Wang, J.; Zhang, Q.; Liu, Q. Predicting the Potential Global Distribution of Amblyomma americanum (Acari: Ixodidae) under Near Current and Future Climatic Conditions, Using the Maximum Entropy Model. Biology 2021, 10. [Google Scholar] [CrossRef] [PubMed]
- Martin, J.T.; Fischhoff, I.R.; Castellanos, A.A.; Han, B.A. Ecological Predictors of Zoonotic Vector Status Among Dermacentor Ticks (Acari: Ixodidae): A Trait-Based Approach. J. Med. Entomol. 2022. [CrossRef] [PubMed]
- McBride, S.E.; Lieberthal, B.A.; Buttke, D.E.; Cronk, B.D.; De Urioste-Stone, S.M.; Goodman, L.B.; Guarnieri, L.D.; Rounsville, T.F.; Gardner, A.M. Patterns and Ecological Mechanisms of Tick-Borne Disease Exposure Risk in Acadia National Park, Mount Desert Island, Maine, United States. J. Med. Entomol. 2022. [CrossRef]
- Molaei, G.; Eisen, L.M.; Price, K.J.; Eisen, R.J. Range Expansion of Native and Invasive Ticks, a Looming Public Health Threat. J. Infect. Dis. 2022. [CrossRef]
- Naimi, B.; Araújo, M.B. sdm: A reproducible and extensible R platform for species distribution modelling. Ecography 2016, 39, 368–375. [Google Scholar] [CrossRef]
- Naimi, B.; Araújo, M.B. , 2016. Package “sdm.” cran.r-project.org › web › packages › sdm › sdmcran.r-project.org › web › packages › sdm › sdm.
- Noden, B.H.; Dubie, T. 2017. Involvement of invasive eastern red cedar (Juniperus virginiana) in the expansion of Amblyomma americanum in Oklahoma. J. Vector Ecol. 2017, 42, 178–183. [Google Scholar] [CrossRef] [PubMed]
- Ogden, N.H.; Radojevic, M.; Wu, X.; Duvvuri, V.R.; Leighton, P.A.; Wu, J. Estimated effects of projected climate change on the basic reproductive number of the Lyme disease vector Ixodes scapularis. Environ. Health Perspect. 2014, 122, 631–638. [Google Scholar] [CrossRef] [PubMed]
- Ogden, N.H.; Ben Beard, C.; Ginsberg, H.S.; Tsao, J.I. Possible Effects of Climate Change on Ixodid Ticks and the Pathogens They Transmit: Predictions and Observations. J. Med. Entomol. 2020. [CrossRef] [PubMed]
- Oliveira, S.V. de, Romero-Alvarez, D.; Martins, T.F.; Santos, J.P. dos, Labruna, M.B.; Gazeta, G.S.; Escobar, L.E.; Gurgel-Gonçalves, R. Amblyomma ticks and future climate: Range contraction due to climate warming. Acta Trop. 2017, 176, 340–348. [Google Scholar] [CrossRef] [PubMed]
- Ostfeld, R.S.; Brunner, J.L. Climate change and Ixodes tick-borne diseases of humans. Philos. Trans. R. Soc. Lond. B Biol. Sci. 2015, 370, 20140051. [Google Scholar] [CrossRef] [PubMed]
- Paddock, C.D.; Goddard, J. The Evolving Medical and Veterinary Importance of the Gulf Coast tick (Acari: Ixodidae). J. Med. Entomol. 2015, 52, 230–252. [Google Scholar] [CrossRef] [PubMed]
- Paddock, C.D.; Yabsley, M.J. Ecological Havoc, the Rise of White-Tailed Deer, and the Emergence of Amblyomma Americanum-Associated Zoonoses in the United States. Curr. Top. Microbiol. Immunol. 2007, 315, 289–324. [Google Scholar] [CrossRef] [PubMed]
- Pascoe, E. L.; Marcantonio, M.; Caminade, C.; and Foley, J. E. E. (2019). Modeling Potential Habitat for Amblyomma Tick Species in California. Insects. [CrossRef]
- Phillips, V.C.; Zieman, E.A.; Kim, C.-H.; Stone, C.M.; Tuten, H.C.; Jiménez, F.A. Documentation of the Expansion of the Gulf Coast Tick (Amblyomma maculatum) and Rickettsia parkeri: First Report in Illinois. J. Parasitol. 2020, 106, 9–13. [Google Scholar] [CrossRef] [PubMed]
- Raghavan, R.K.; Goodin, D.G.; Hanzlicek, G.A.; Zolnerowich, G.; Dryden, M.W.; Anderson, G.A.; Ganta, R.R. Maximum Entropy-Based Ecological Niche Model and Bio-Climatic Determinants of Lone Star Tick (Amblyomma americanum) Niche. Vector Borne Zoonotic Dis. 2016, 16, 205–211. [Google Scholar] [CrossRef] [PubMed]
- Raghavan, R.K.; Peterson, A.T.; Cobos, M.E.; Ganta, R.; Foley, D. Current and Future Distribution of the Lone Star Tick, Amblyomma americanum (L.) (Acari: Ixodidae) in North America. PLoS ONE 2019, 14, e0209082. [Google Scholar] [CrossRef] [PubMed]
- Raghavan, R.K.; Koestel, Z.L.; Boorgula, G.; Hroobi, A.; Ganta, R.; Harrington, J., Jr.; Goodin, D.; Stich, R.W.; Anderson, G. Unexpected winter questing activity of ticks in the Central Midwestern United States. PLoS ONE 2021, 16, e0259769. [Google Scholar] [CrossRef] [PubMed]
- Randolph, S.E.; Storey, K. Impact of microclimate on immature tick-rodent host interactions (Acari: Ixodidae): Implications for parasite transmission. J. Med. Entomol. 1999, 36, 741–748. [Google Scholar] [CrossRef]
- Riahi, K.; Rao, S.; Krey, V.; Cho, C.; Chirkov, V.; Fischer, G.; Kindermann, G.; Nakicenovic, N.; Rafaj, P. RCP 8.5—A scenario of comparatively high greenhouse gas emissions. Clim. Change 2011, 109, 33. [Google Scholar] [CrossRef]
- Robinson, S.J.; Neitzel, D.F.; Moen, R.A.; Craft, M.E.; Hamilton, K.E.; Johnson, L.B.; Mulla, D.J.; Munderloh, U.G.; Redig, P.T.; Smith, K.E.; Turner, C.L.; Umber, J.K.; Pelican, K.M. Disease Risk in a Dynamic Environment: The Spread of Tick-Borne Pathogens in Minnesota, USA. Ecohealth 2015, 12, 152–163. [Google Scholar] [CrossRef] [PubMed]
- Rochlin, I. Modeling the Asian Longhorned Tick (Acari: Ixodidae) Suitable Habitat in North America. J. Med. Entomol. 2019, 56, 384–391. [Google Scholar] [CrossRef] [PubMed]
- Rochlin, I.; Egizi, A.; Lindström, A. The original scientific description of the Lone Star tick (Amblyomma americanum, Acari: Ixodidae) and implications for the species’ past and future geographic distributions. J. Med. Entomol. 2022, 59, 412–420. [Google Scholar] [CrossRef] [PubMed]
- Rydzewski, J.; Mateus-Pinilla, N.; Warner, R.E.; Hamer, S.; Weng, H.-Y. Ixodes scapularis and Borrelia burgdorferi among diverse habitats within a natural area in east-central Illinois. Vector Borne Zoonotic Dis. 2011, 11, 1351–1358. [Google Scholar] [CrossRef] [PubMed]
- Rynkiewicz, E.C.; Clay, K. Tick community composition in Midwestern US habitats in relation to sampling method and environmental conditions. Exp. Appl. Acarol. 2014, 64, 109–119. [Google Scholar] [CrossRef] [PubMed]
- Savage, H.M.; Burkhalter, K.L.; Godsey, M.S., Jr.; Panella, N.A.; Ashley, D.C.; Nicholson, W.L.; Lambert, A.J. Bourbon virus in field-collected ticks, Missouri, USA. Emerg. Infect. Dis. 2017, 23, 2017–2022. [Google Scholar] [CrossRef] [PubMed]
- Sonenshine, D.E. 2018. Range Expansion of Tick Disease Vectors in North America: Implications for Spread of Tick-Borne Disease. Int. J. Environ. Res. Public Health 15. [CrossRef]
- Soucy, A.; de Urioste-Stone, S. TOURIST BEHAVIOUR AND TICK-BORNE DISEASE RISK, in: WIT Transactions on Ecology and the Environment. WIT Press; [CrossRef]
- Springer, Y.P.; Eisen, L.; Beati, L.; James, A.M.; Eisen, R.J. Spatial Distribution of Counties in the Continental United States With Records of Occurrence of Amblyomma americanum (Ixodida: Ixodidae). J. Med. Entomol. 2014, 51, 342–351. [Google Scholar] [CrossRef] [PubMed]
- Strobl, C.; Malley, J.; Tutz, G. An introduction to recursive partitioning: Rationale, application, and characteristics of classification and regression trees, bagging, and random forests. Psychol. Methods 2009, 14, 323–348. [Google Scholar] [CrossRef] [PubMed]
- Tuten, H.C.; Burkhalter, K.L.; Noel, K.R.; Hernandez, E.J.; Yates, S.; Wojnowski, K.; Hartleb, J.; Debosik, S.; Holmes, A.; Stone, C.M. Heartland Virus in Humans and Ticks, Illinois, USA, 2018-2019. Emerg. Infect. Dis. 2020, 26, 1548–1552. [Google Scholar] [CrossRef] [PubMed]
- U.S. Geological Survey (USGS) - Gap Analysis Project (GAP), 2018, White-tailed Deer (Odocoileus virginianus) mWTDEx_CONUS_2001v1 Habitat Map: U.S. Geological Survey data release. [CrossRef]
- Valavi, R.; Elith, J.; Lahoz-Monfort, J.J.; Guillera-Arroita, G. Modelling species presence-only data with random forests. Ecography 2021, 44, 1731–1742. [Google Scholar] [CrossRef]
- Valavi, R.; Guillera-Arroita, G.; Lahoz-Monfort, J.J.; Elith, J. Predictive performance of presence-only species distribution models: A benchmark study with reproducible code. Ecol. Monogr. 2022, 92. [Google Scholar] [CrossRef]
- Wikel, S.K. Changing Geographic Ranges of Human Biting Ticks and Implications for Tick-Borne Zoonoses in North America. Zoonotic Diseases 2022, 2, 126–146. [Google Scholar] [CrossRef]
- Yang, L.; Jin, S.; Danielson, P.; Homer, C.; Gass, L.; Case, A.; Costello, C.; Dewitz, J.; Fry, J.; Funk, M.; et al. A New Generation of the United States National Land Cover Database: Requirements, Research Priorities, Design, and Implementation Strategies. ISPRS J. Photogramm. Remote Sens. 2018, 146, 108–123. [Google Scholar] [CrossRef]
Figure 2.
(A) Mean-weighted ensemble prediction of the probability of I. scapularis occurrence in Illinois under historical climate conditions. (B) Mean-weighted ensemble of predicted probability of I. scapularis occurrence in Illinois in 2050 projected climate Coupled Model Intercomparison Project phase 5 (CMIP6)/ EC-Earth3-Veg Representative Concentration Pathway (RCP) 8.5 average from 2041-2060). (C) Mean-weighted ensemble of future predicted probability of I. scapularis occurrence in Illinois in 2070 projected climate (CMIP6)/ EC-Earth3-Veg Representative Concentration Pathway (RCP) 8.5 average from 2061–2080). Darker colors indicate higher likelihood of tick presence.
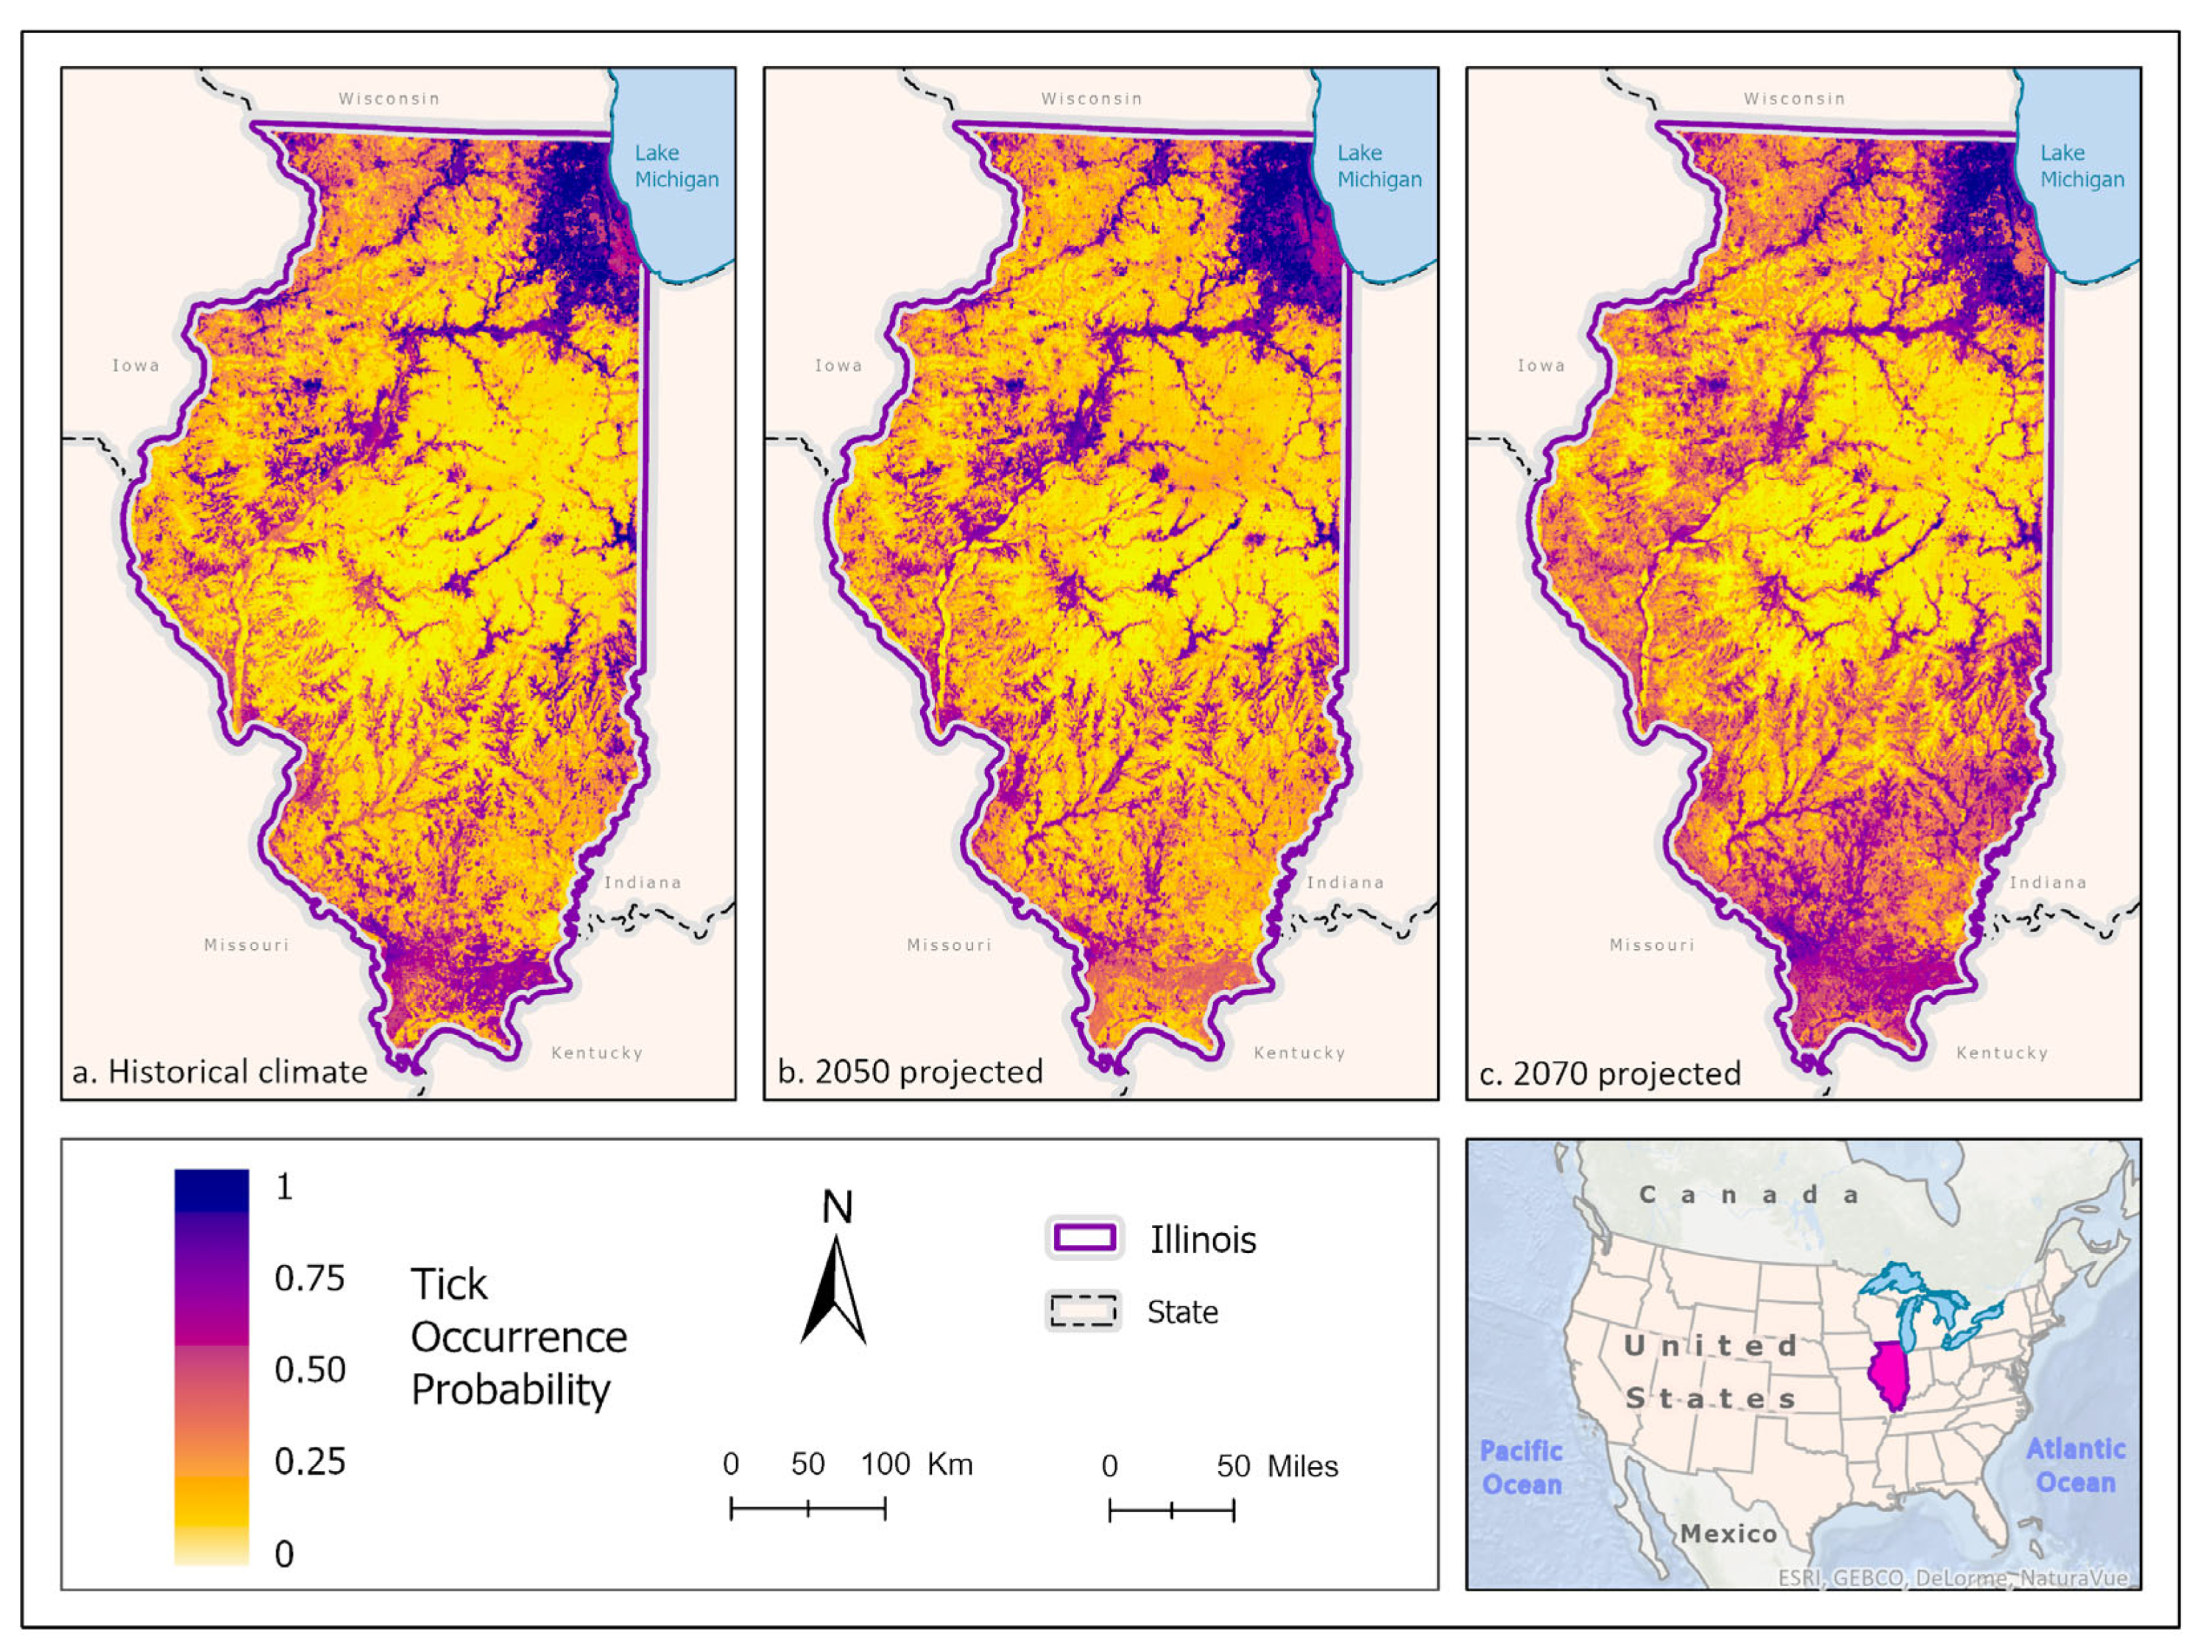
Figure 3.
Percent change in likelihood of I. scapularis occurrence between the historical climate and 2050 (left) and from 2050 to 2070 (right). Red shades indicate reduced likelihood of occurrence (negative change), blue shades indicate increased likelihood of occurrence (positive change). The histogram represents the number of pixels (y-axis) containing the binned percentage likelihood change (x-axis) of I. scapularis suitable habitat across the map.
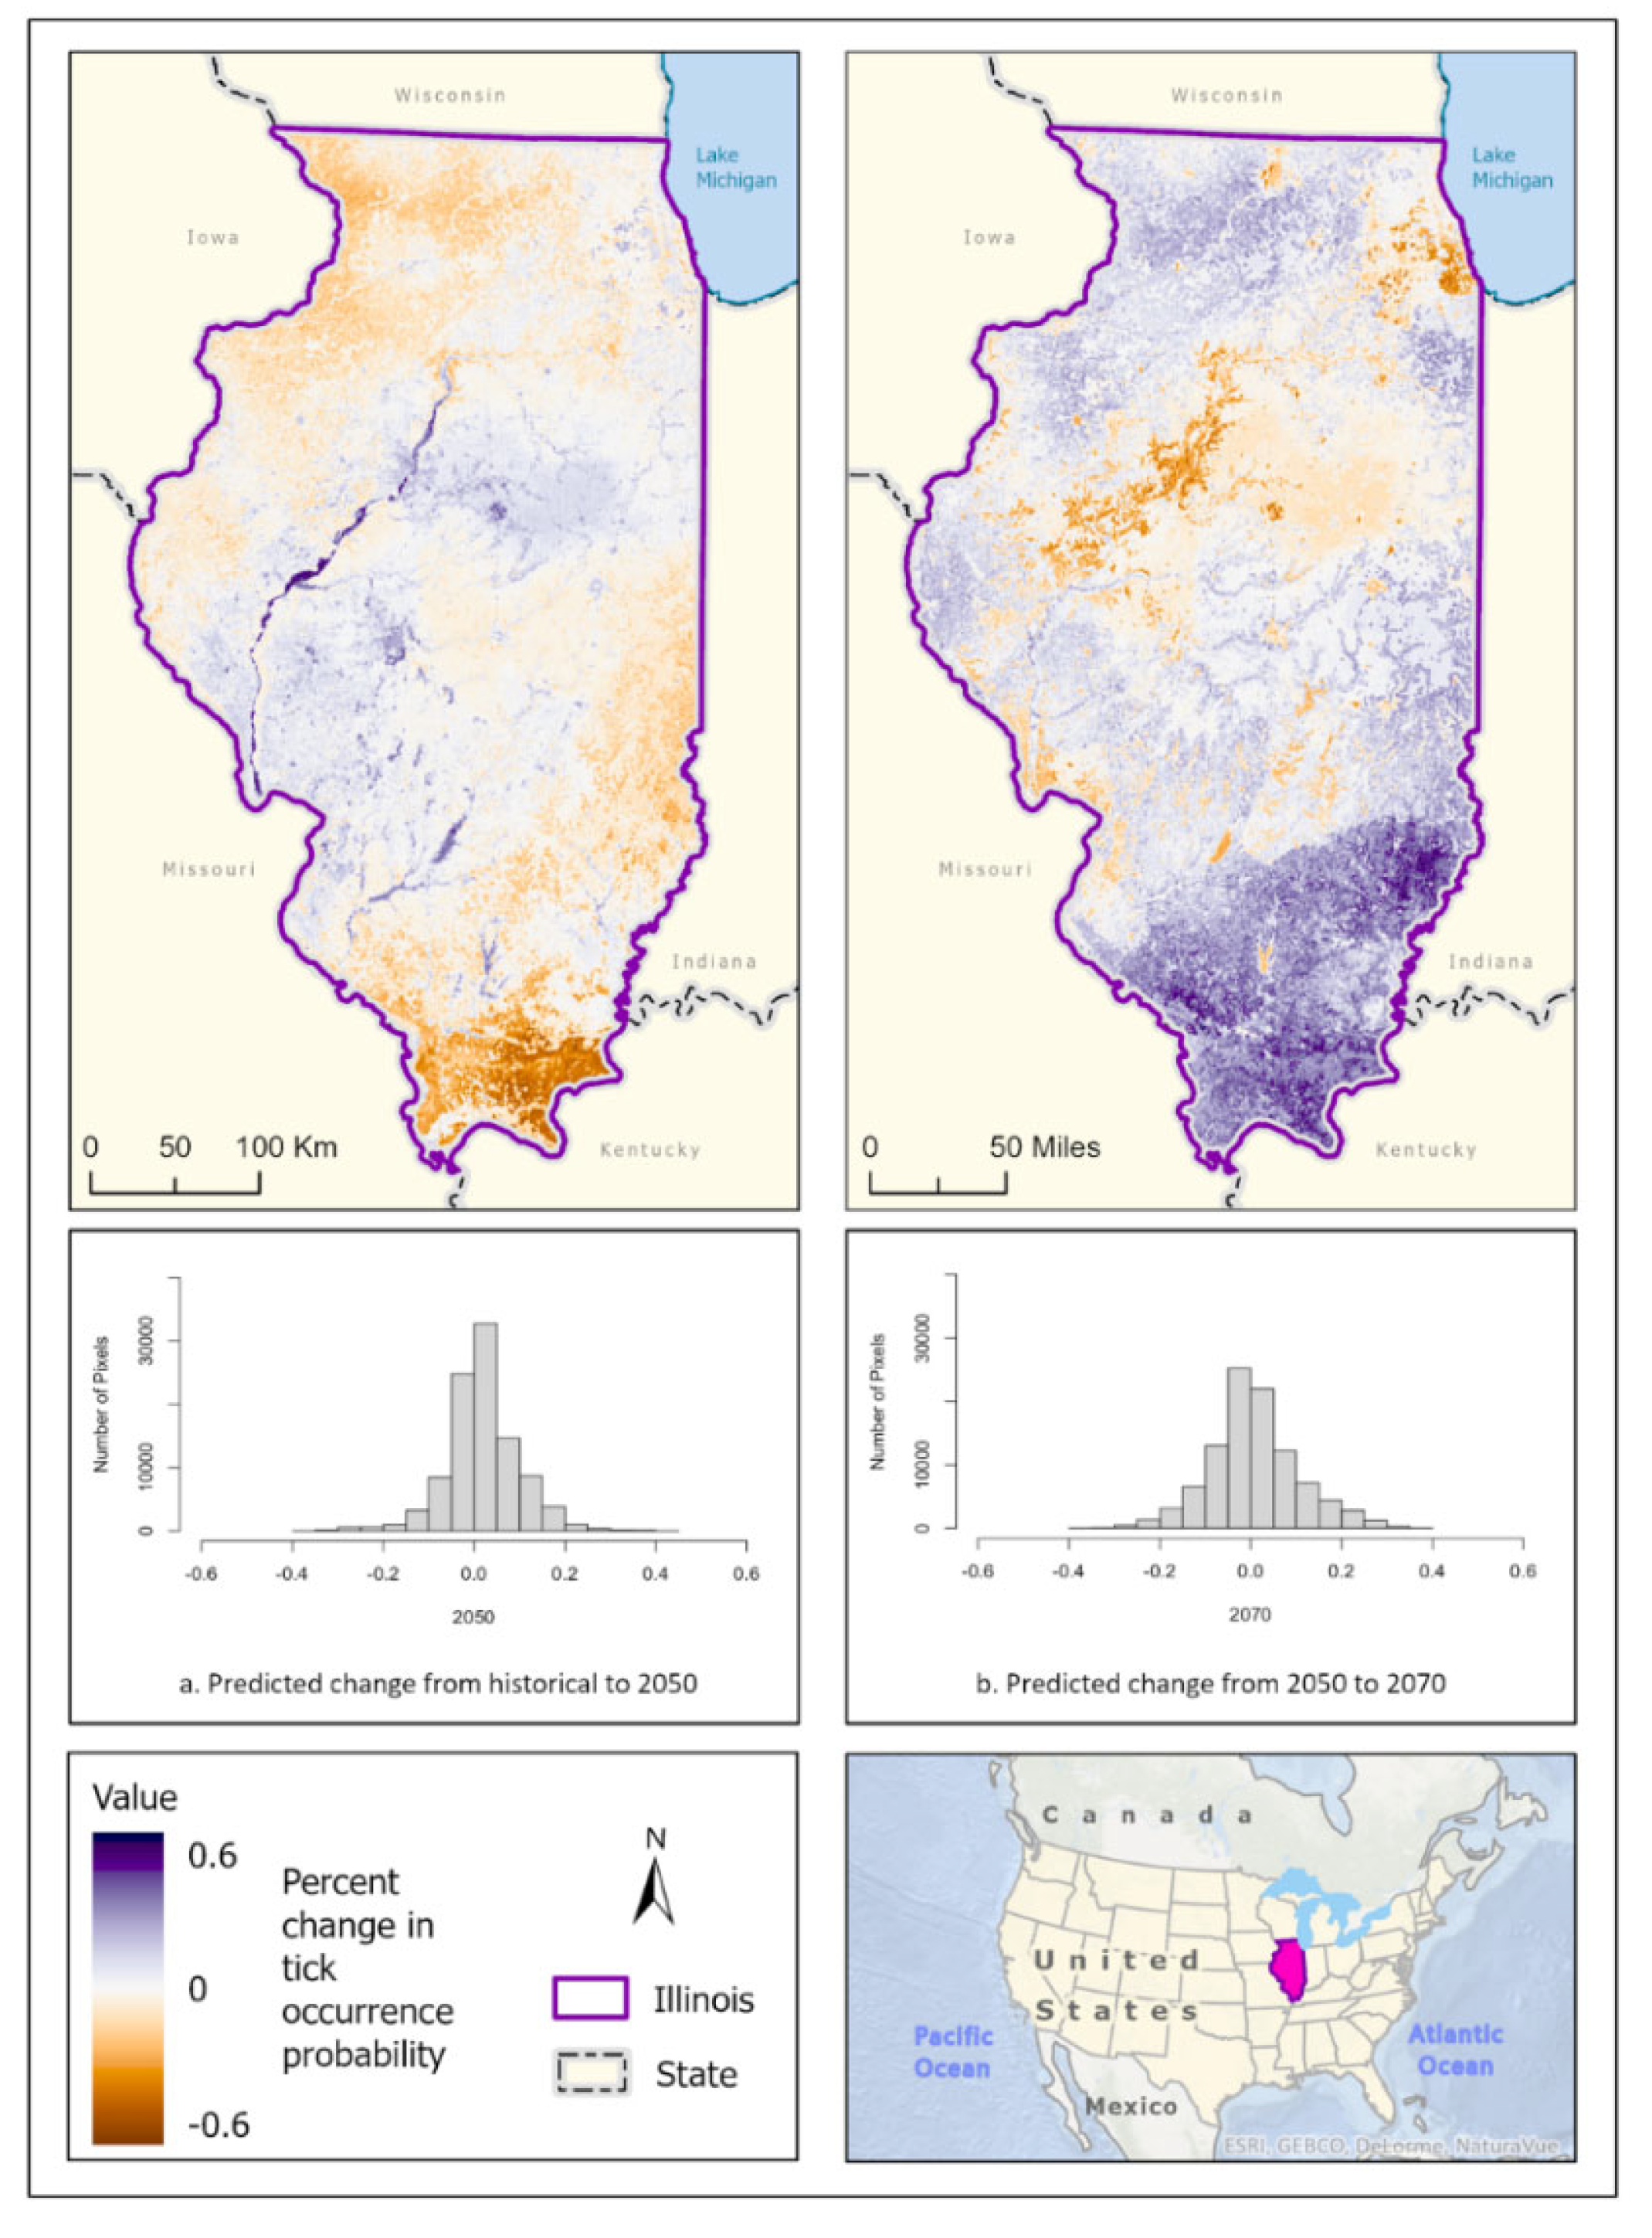
Figure 4.
(a) Mean-weighted ensemble prediction of the probability of A. americanum occurrence in Illinois under historical climate conditions. (b) Mean-weighted ensemble of predicted probability of A. americanum occurrence in Illinois in 2050 projected climate Coupled Model Intercomparison Project phase 5 (CMIP6)/EC-Earth3-Veg Representative Concentration Pathway (RCP) 8.5 average from 2041-2060). (c) Mean-weighted ensemble of future predicted probability of A. americaum occurrence in Illinois in 2070 projected climate (CMIP6)/EC-Earth3-Veg Representative Concentration Pathway (RCP) 8.5 average from 2061- 2080). Darker colors indicate higher likelihood of tick presence.
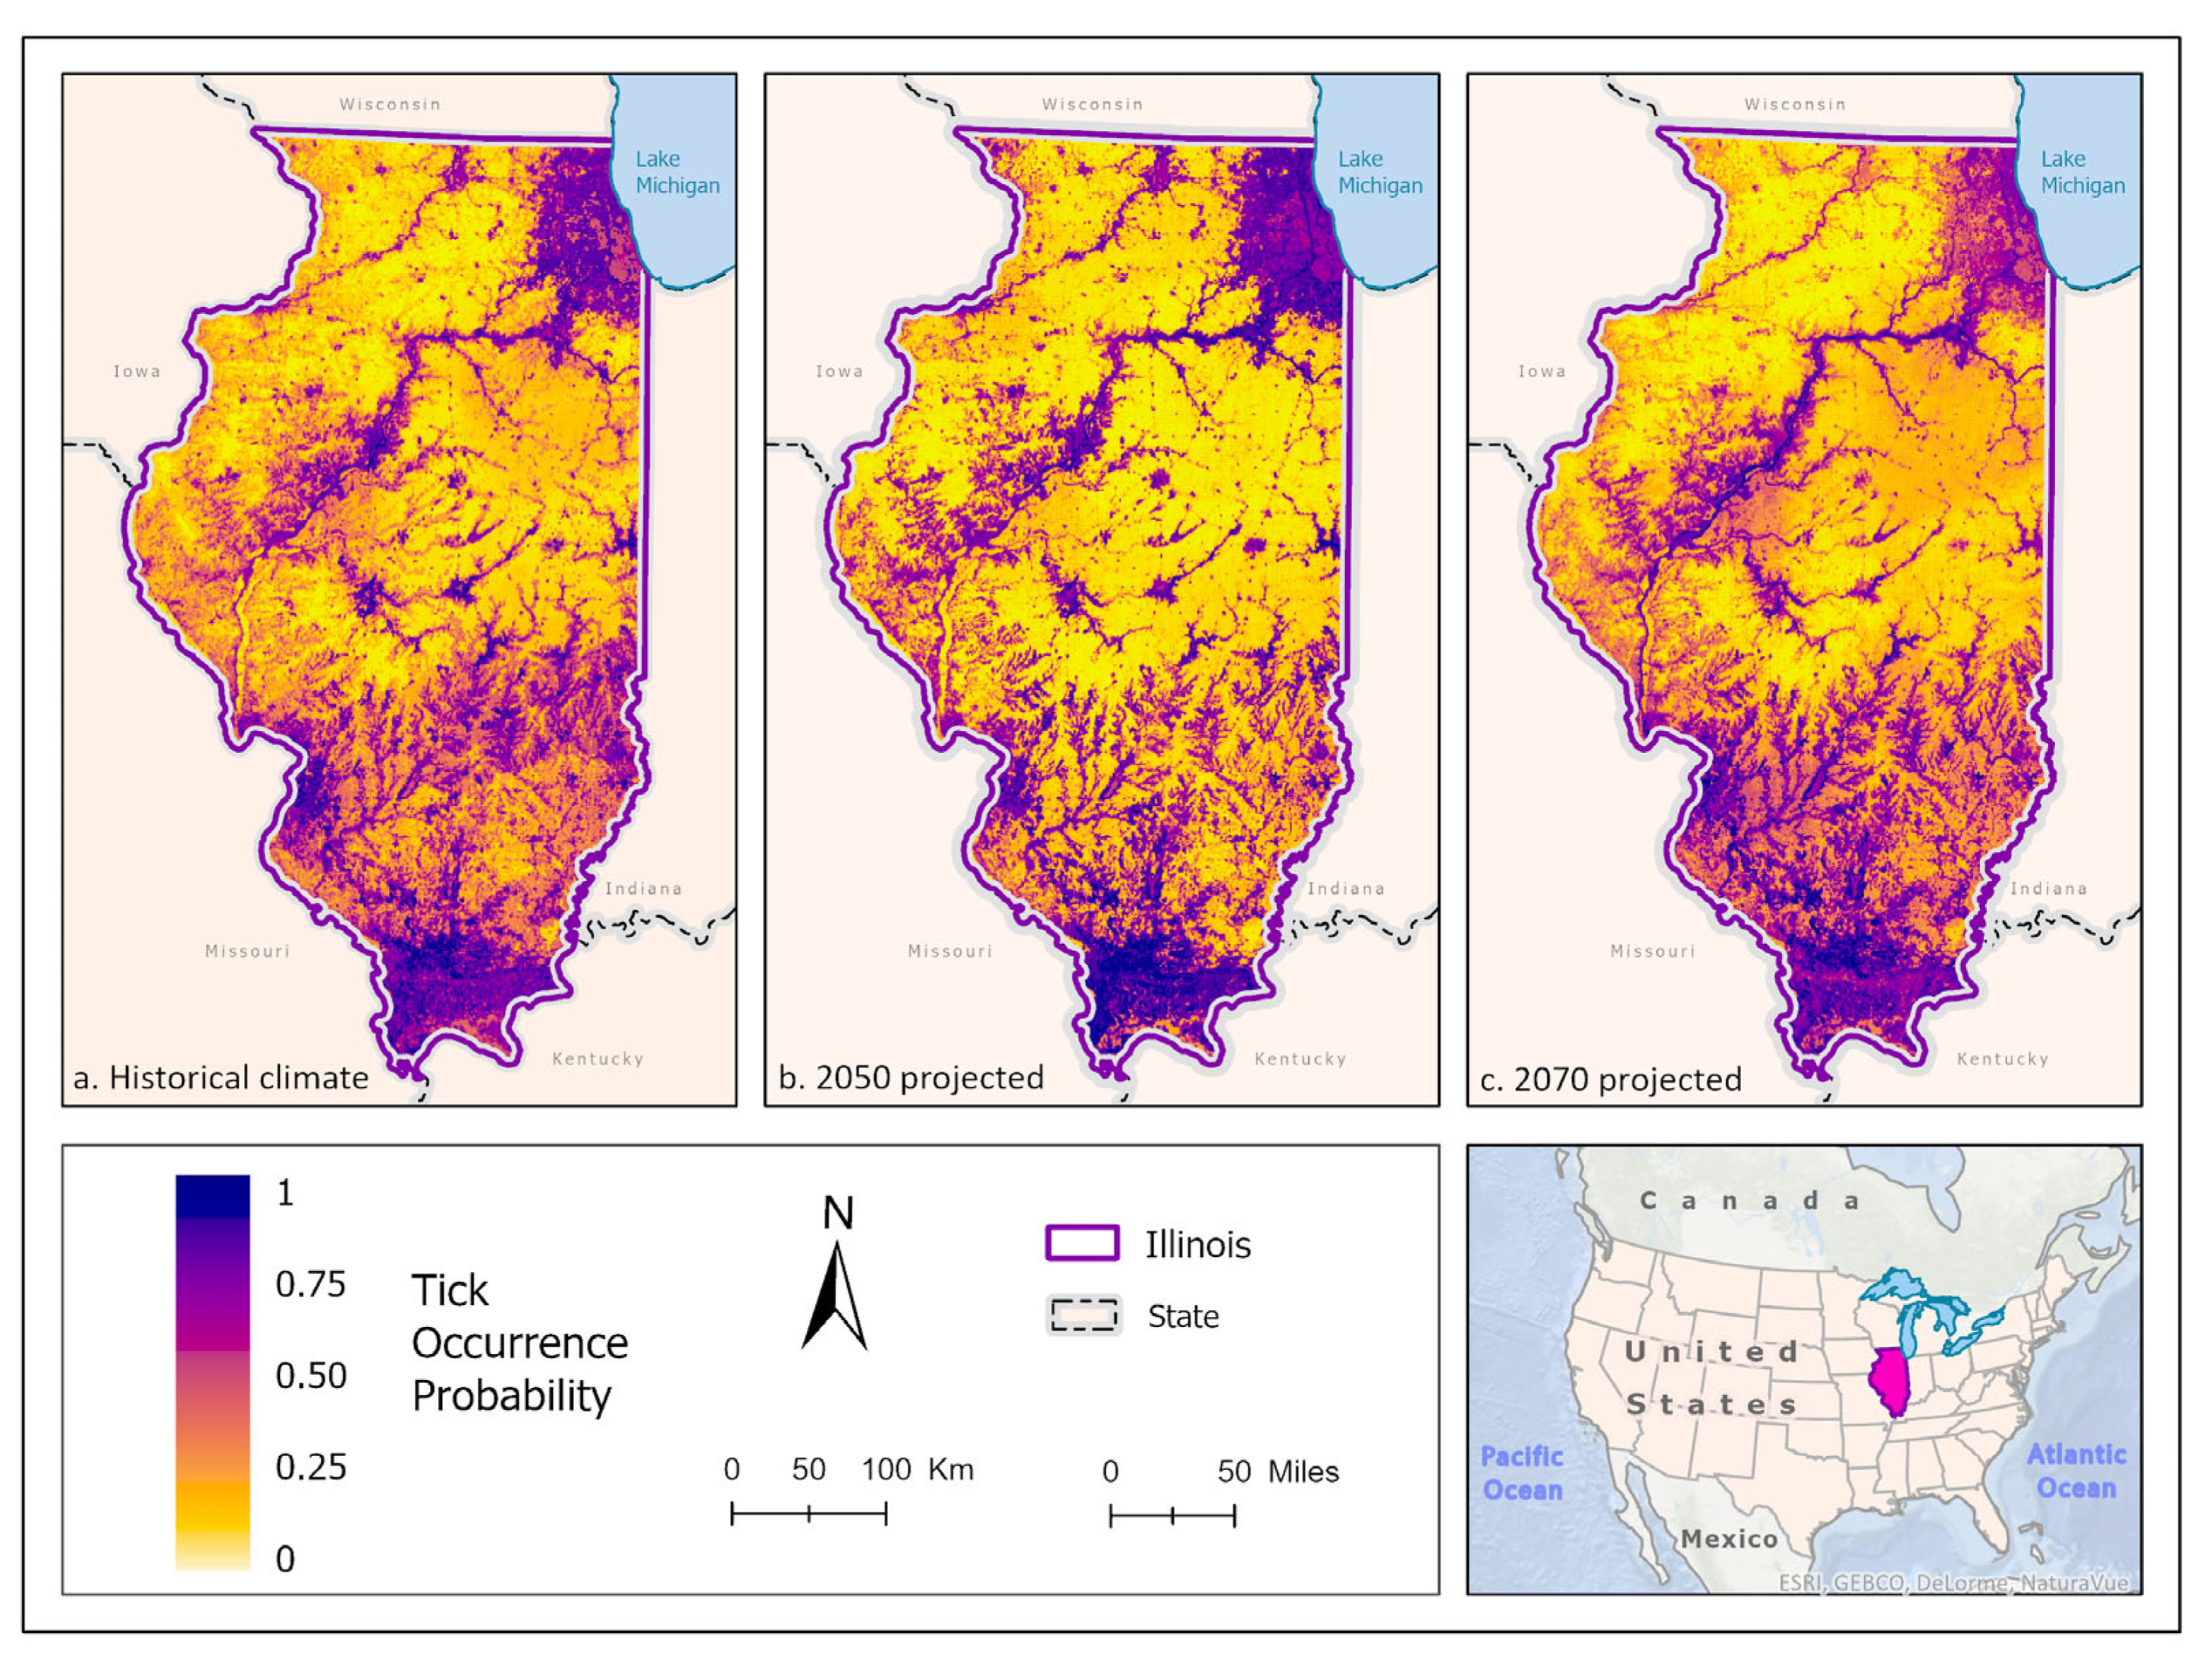
Figure 5.
Percent change in likelihood of A. americanum occurrence between the historical climate and 2050 (left) and from 2050 to 2070 (right). Red shades indicate reduced likelihood of occurrence (negative change), blue shades indicate increased likelihood of occurrence (positive change). The histogram represents the number of pixels (y-axis) containing the binned percentage likelihood change (x-axis) of A. americanum suitable habitat across the map.
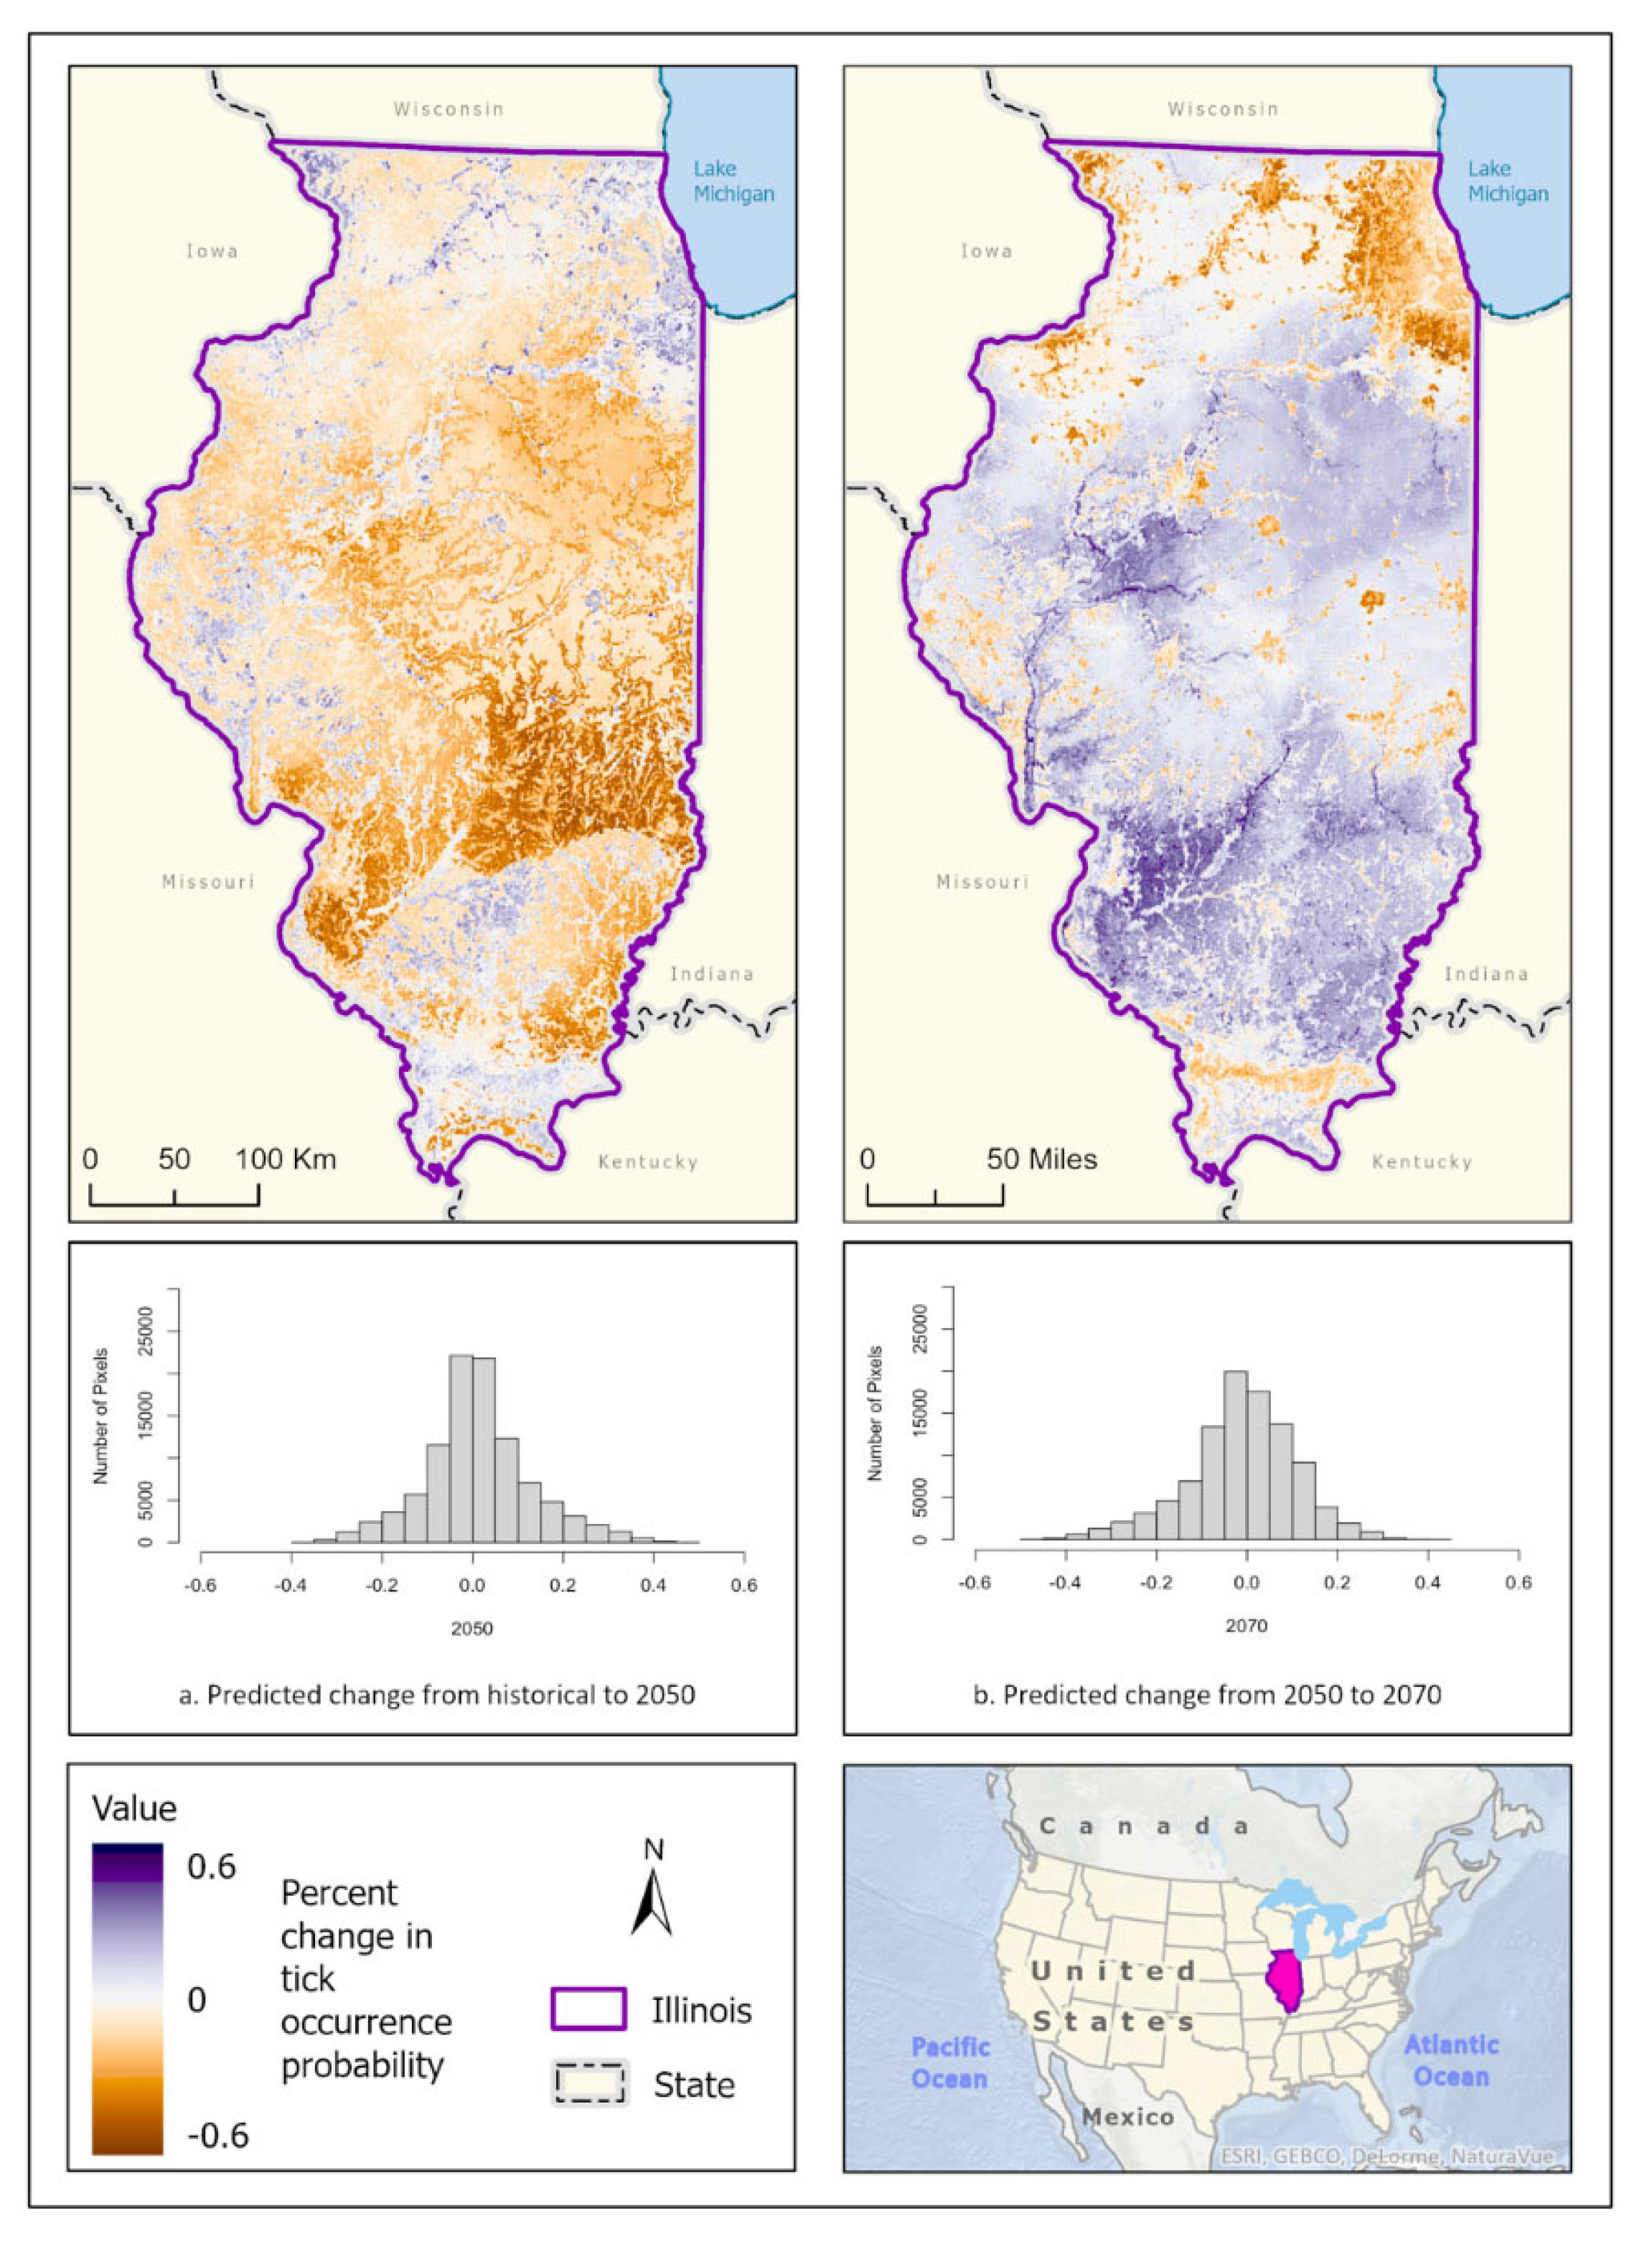
Figure 6.
(a) Mean-weighted ensemble prediction of the probability of D. variabilis occurrence in Illinois under historical climate conditions. (b) Mean-weighted ensemble of predicted probability of D. variabilis occurrence in Illinois in 2050 projected climate Coupled Model Intercomparison Project phase 5 (CMIP6)/EC-Earth3-Veg Representative Concentration Pathway (RCP) 8.5 average from 2041-2060). (c) Mean-weighted ensemble of future predicted probability of D. variabilis occurrence in Illinois in 2070 projected climate (CMIP6)/EC-Earth3-Veg Representative Concentration Pathway (RCP) 8.5 average from 2061- 2080). Darker colors indicate higher likelihood of tick presence.
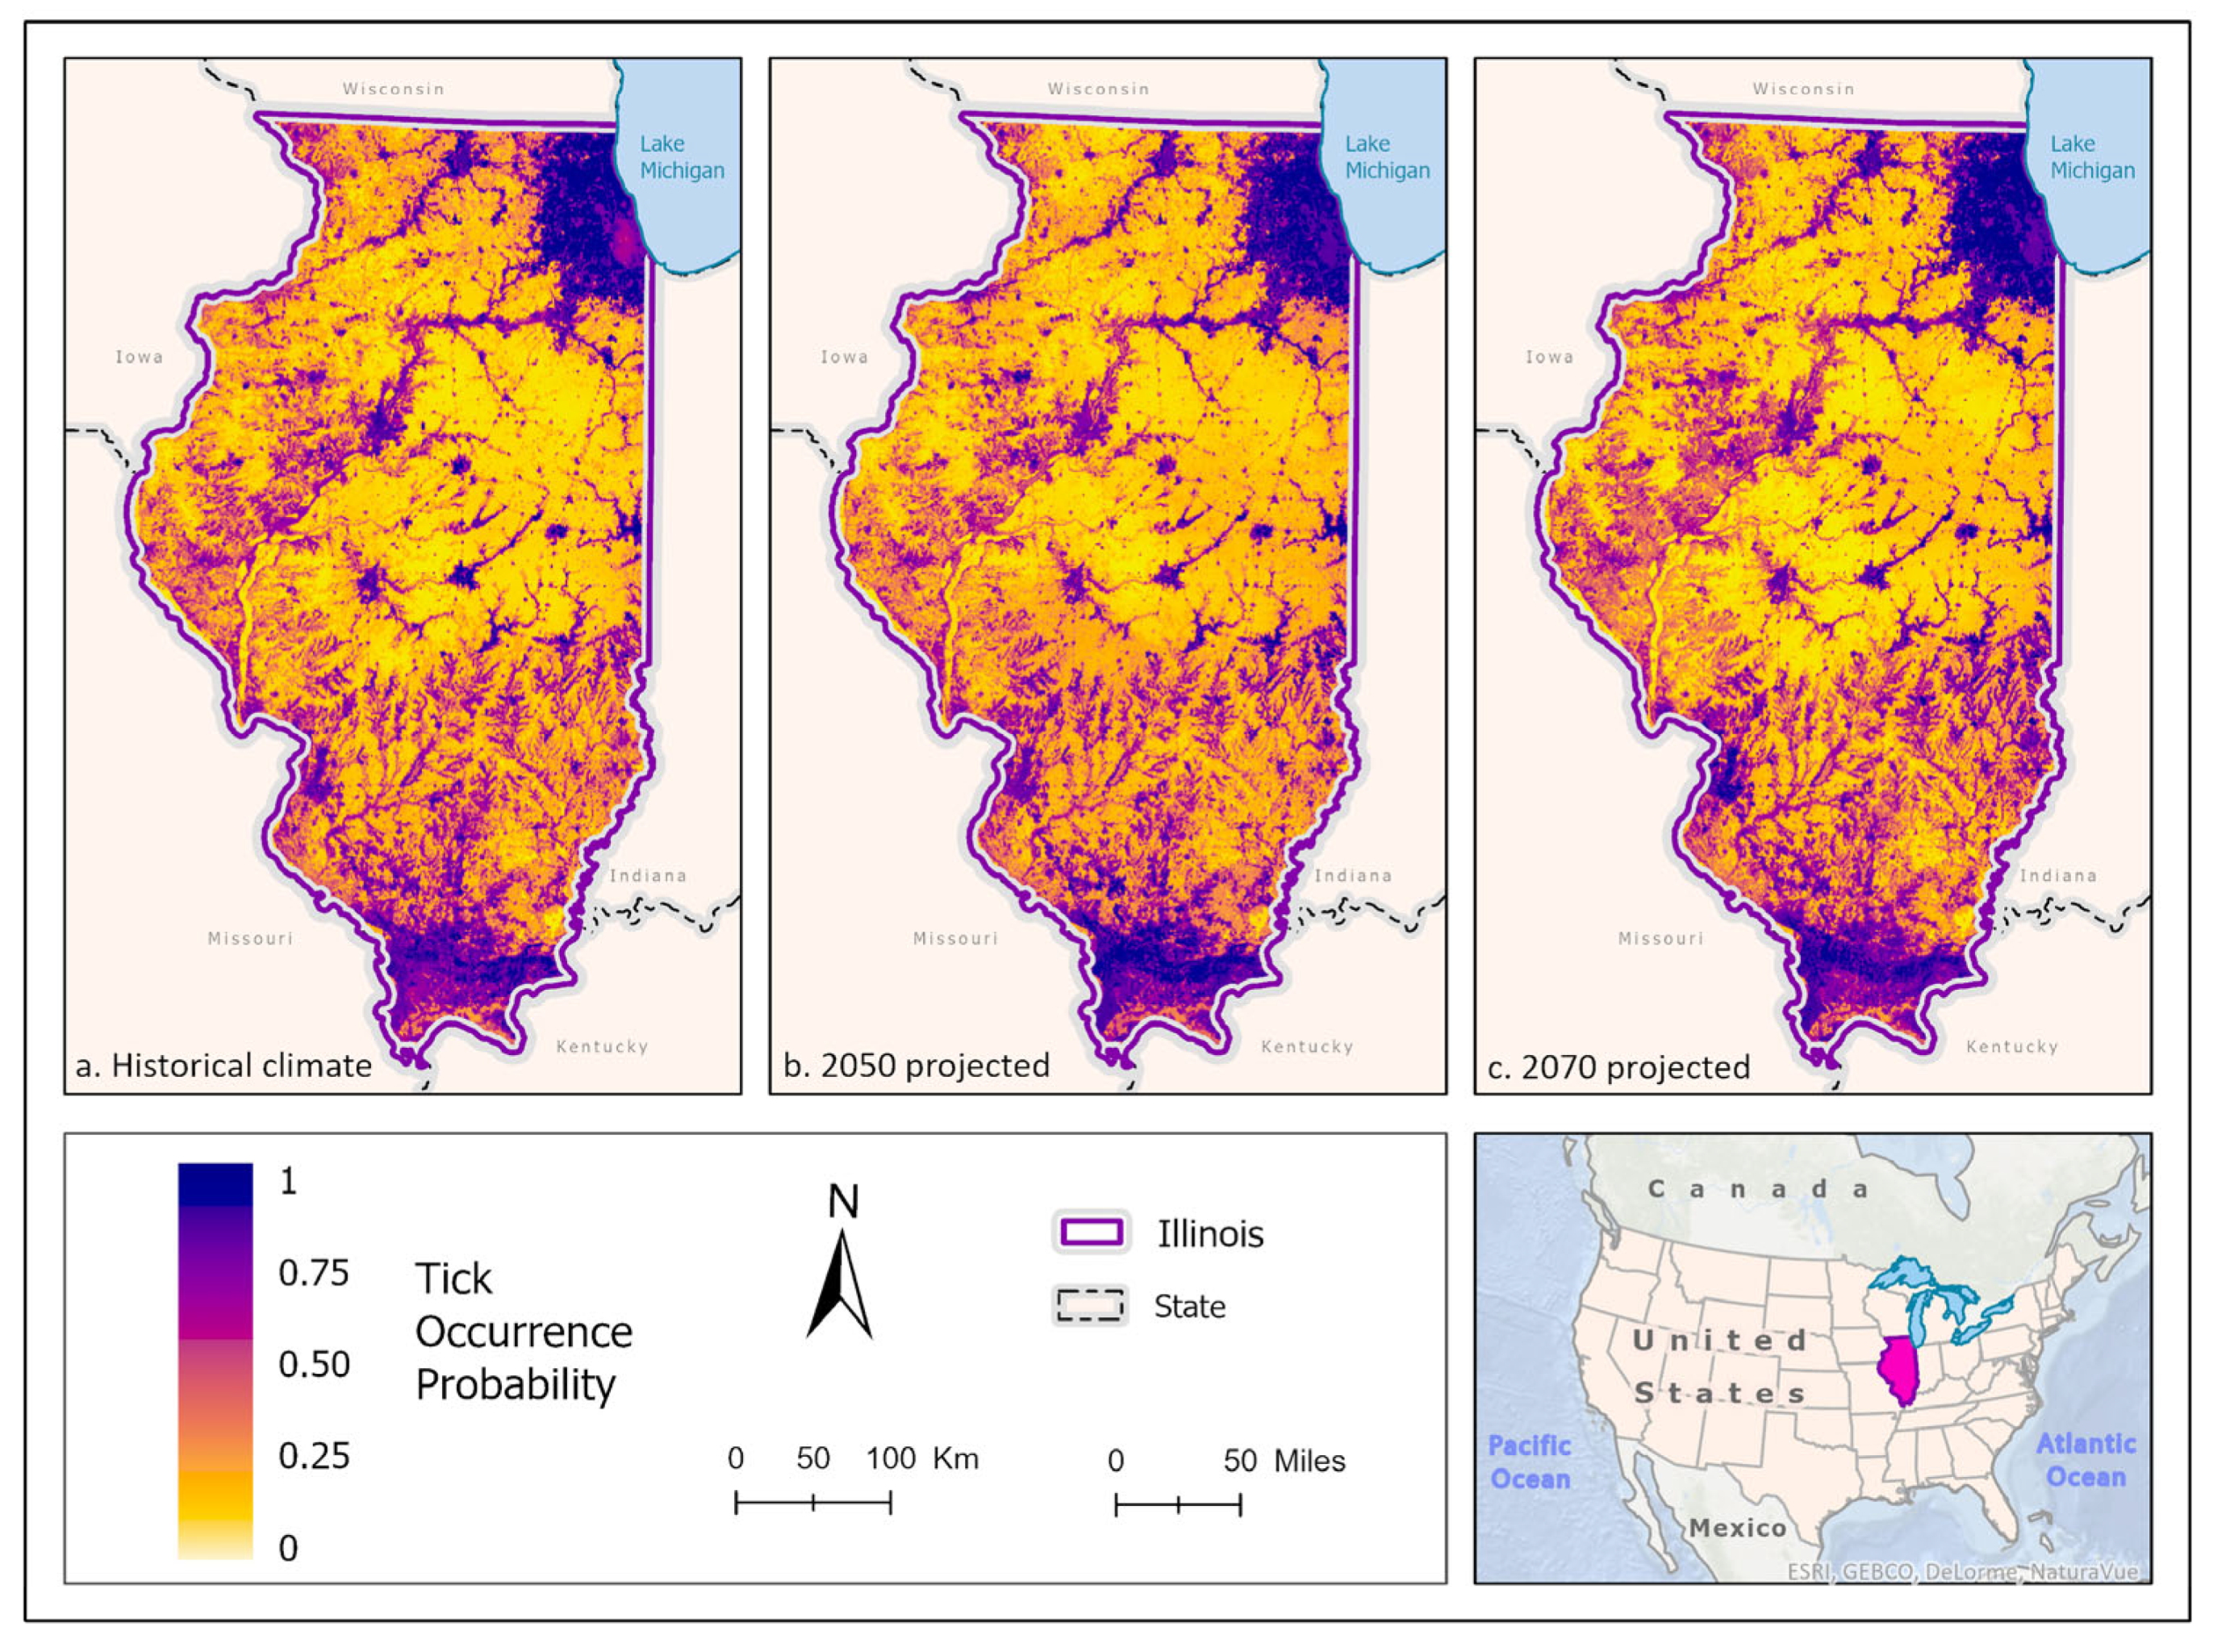
Figure 7.
Percent change in likelihood of D. variabilis occurrence between the historical climate and 2050 (left) and from 2050 to 2070 (right). Red shades indicate reduced likelihood of occurrence (negative change), blue shades indicate increased likelihood of occurrence (positive change). The histogram represents the number of pixels (y-axis) containing the binned percentage likelihood (x-axis) of D. variabilis suitable habitat across the map.
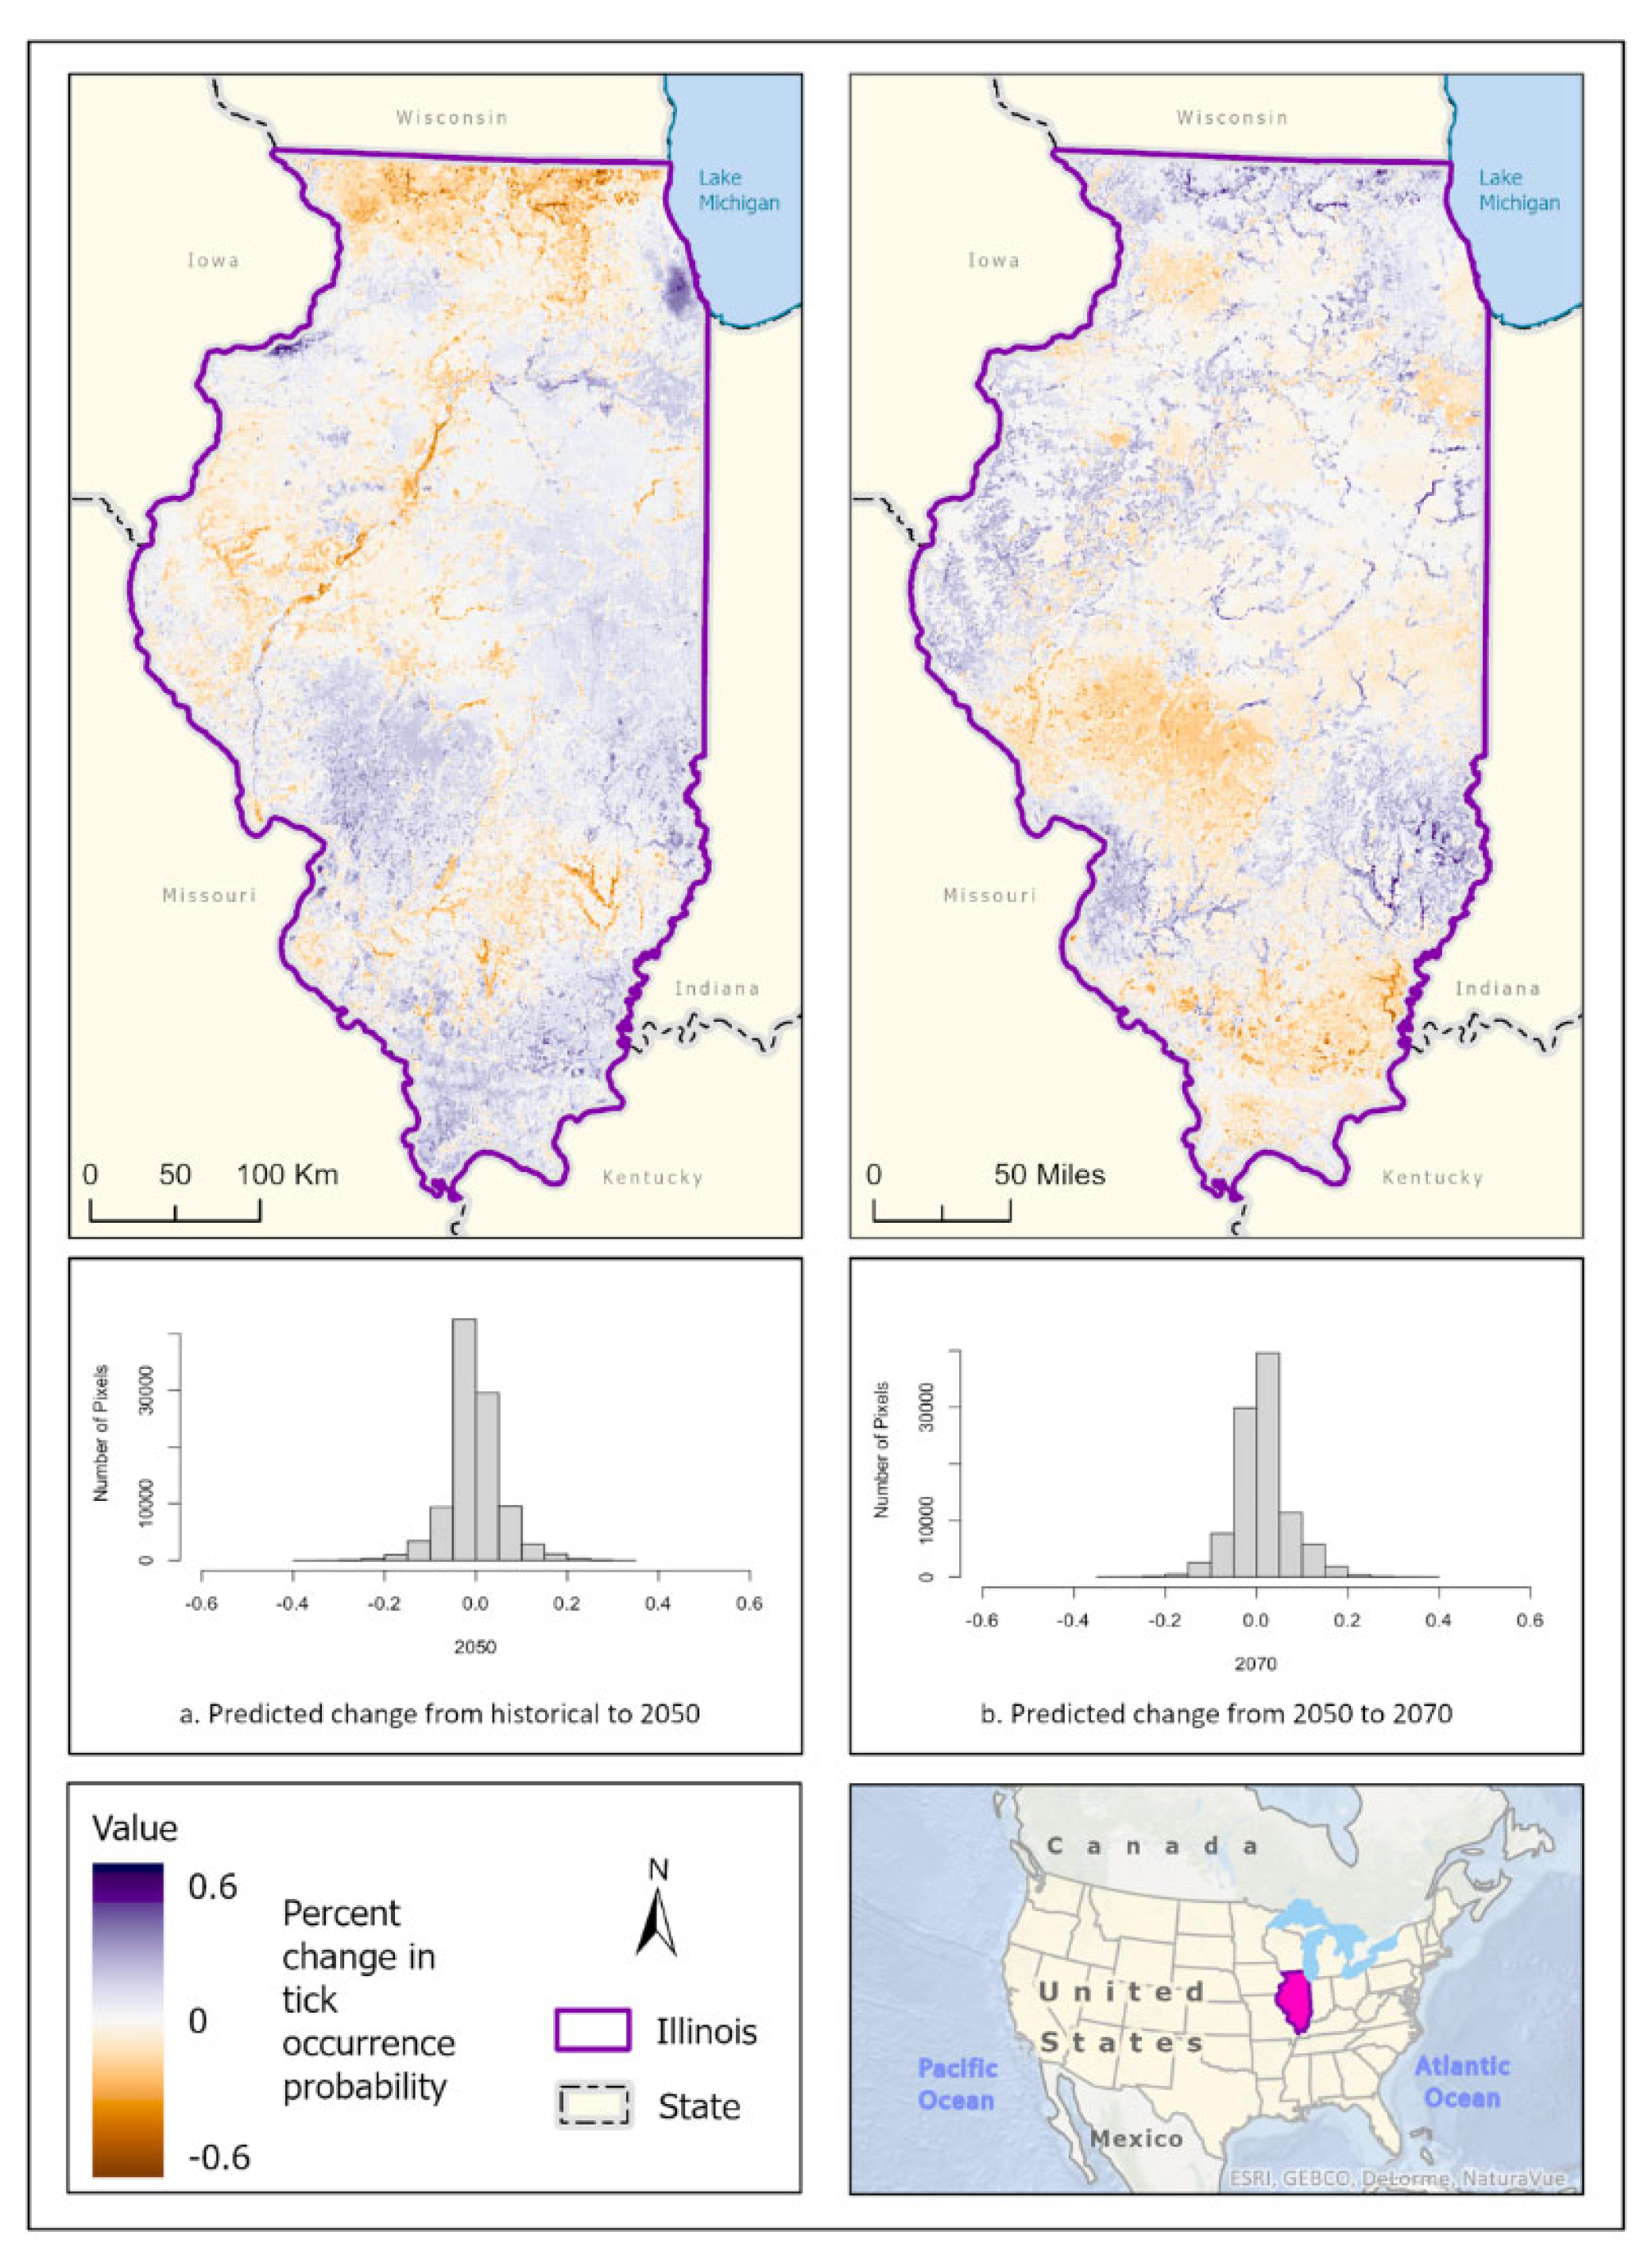
Figure 8.
(a) Mean-weighted ensemble prediction of the probability of A. maculatum occurrence in Illinois under historical climate conditions. (b) Mean-weighted ensemble of predicted probability of A. maculatum occurrence in Illinois in 2050 projected climate Coupled Model Intercomparison Project phase 5 (CMIP6)/EC-Earth3-Veg Representative Concentration Pathway (RCP) 8.5 average from 2041-2060). (c) Mean-weighted ensemble of future predicted probability of A. maculatum occurrence in Illinois in 2070 projected climate (CMIP6)/EC-Earth3-Veg Representative Concentration Pathway (RCP) 8.5 average from 2061- 2080). Darker colors indicate higher likelihood of tick presence.
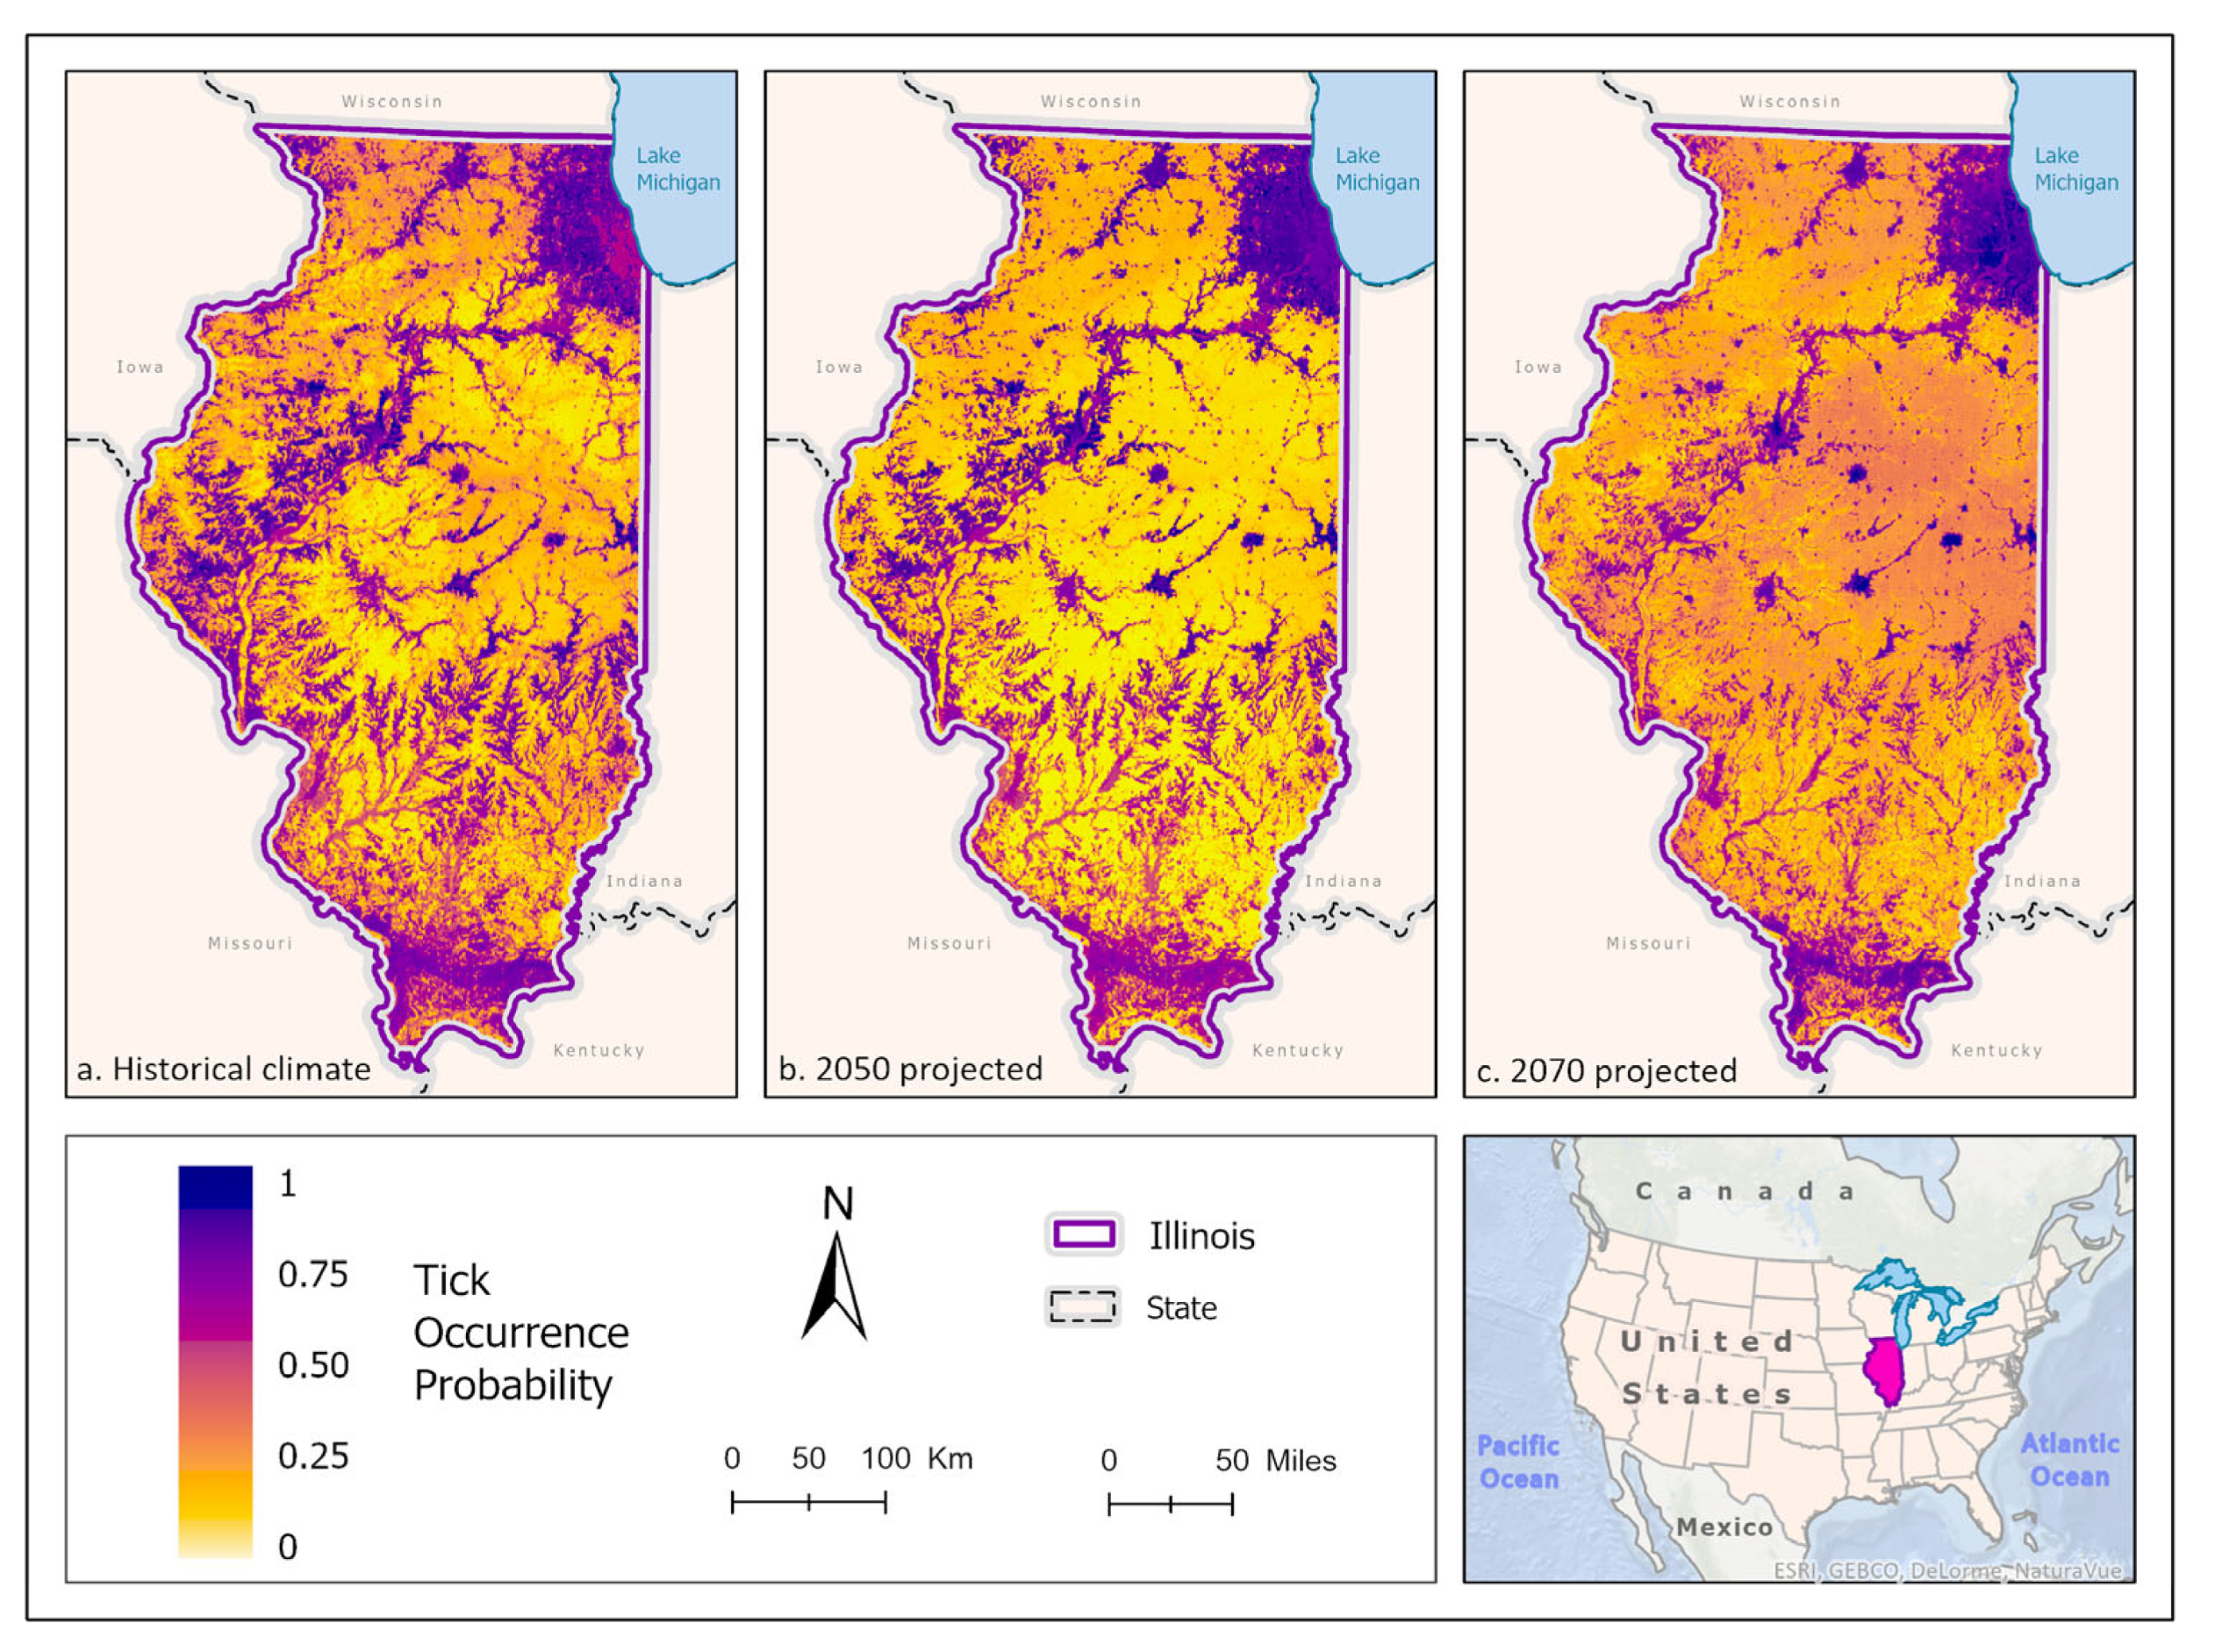
Figure 9.
Percent change in likelihood of A. maculatum occurrence between the historical climate and 2050 (left) and from 2050 to 2070 (right). Red shades indicate reduced likelihood of occurrence (negative change), blue shades indicate increased likelihood of occurrence (positive change). The histogram represents the number of pixels (y-axis) containing the binned percentage likelihood (x-axis) of A. maculatum suitable habitat across the map.
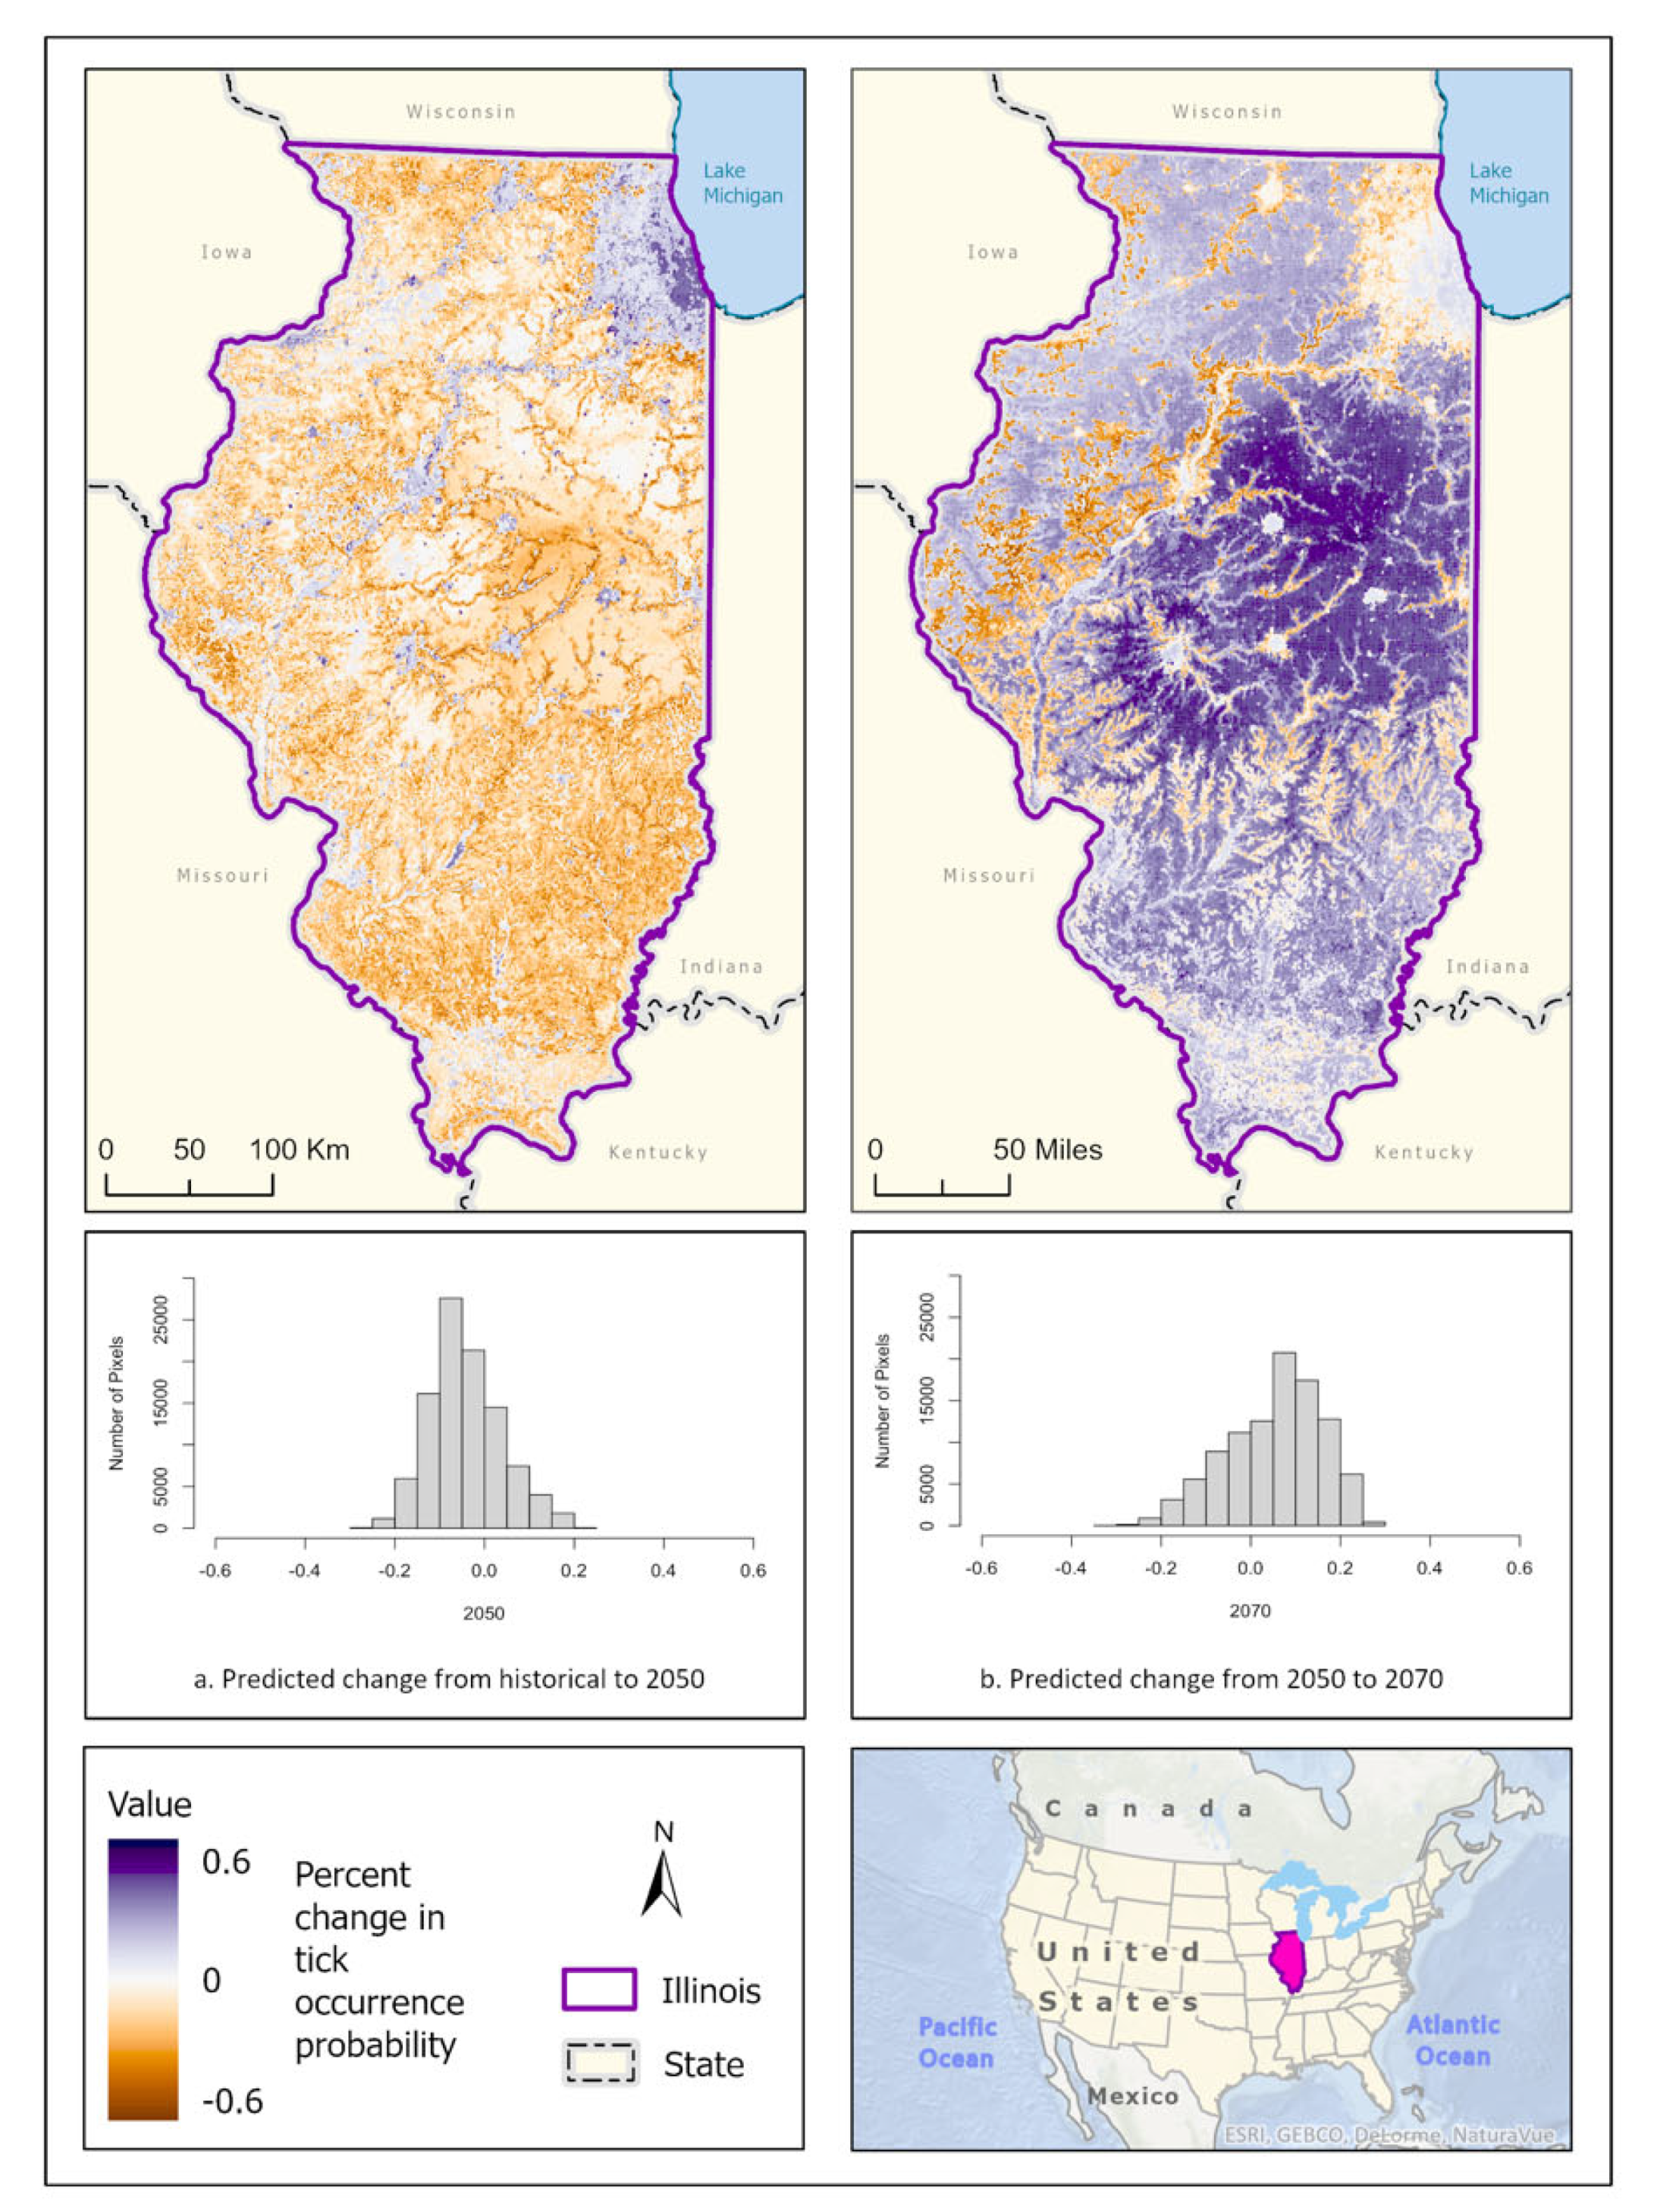

Table 1.
Descriptions and sources of each of the 19 bioclimatic variables (WorldClim) and other environmental predictor variables (n=29) used in model fitting.
Table 1.
Descriptions and sources of each of the 19 bioclimatic variables (WorldClim) and other environmental predictor variables (n=29) used in model fitting.
| VARIABLE | DESCRIPTION | Unit | Source * |
|---|---|---|---|
| BIO1 | Annual Mean Temperature | °C*100 | WorldClim 2.1 |
| BIO2 | Mean Diurnal Range(Mean of monthly (max temp - min temp)) | °C*100 | WorldClim 2.1 |
| BIO3 | Isothermality (BIO2/BIO7) (×100) | % | WorldClim 2.1 |
| BIO4 | Temperature Seasonality (standard deviation ×100) | ° C | WorldClim 2.1 |
| BIO5 | Max Temperature of Warmest Month | °C*100 | WorldClim 2.1 |
| BIO6 | Min Temperature of Coldest Month | °C*100 | WorldClim 2.1 |
| BIO7 | Temperature Annual Range (BIO5-BIO6) | °C*100 | WorldClim 2.1 |
| BIO8 | Mean Temperature of Wettest Quarter | °C*100 | WorldClim 2.1 |
| BIO9 | Mean Temperature of Driest Quarter | °C*100 | WorldClim 2.1 |
| BIO10 | Mean Temperature of Warmest Quarter | °C*100 | WorldClim 2.1 |
| BIO11 | Mean Temperature of Coldest Quarter | °C*100 | WorldClim 2.1 |
| BIO12 | Annual Precipitation | mm | WorldClim 2.1 |
| BIO13 | Precipitation of Wettest Month | mm | WorldClim 2.1 |
| BIO14 | Precipitation of Driest Month | mm | WorldClim 2.1 |
| BIO15 | Precipitation Seasonality (Coefficient of Variation) | mm | WorldClim 2.1 |
| BIO16 | Precipitation of Wettest Quarter | mm | WorldClim 2.1 |
| BIO17 | Precipitation of Driest Quarter | mm | WorldClim 2.1 |
| BIO18 | Precipitation of Warmest Quarter | mm | WorldClim 2.1 |
| BIO19 | Precipitation of Coldest Quarter | mm | WorldClim 2.1 |
| Elevation | Height above sea level | m | USGS SRTM |
| Deer habitat | Suitable white-tailed deer habitat | Presence/absence | USGS GAP Analysis |
|
Landcover CLASS |
Water, developed, impervious, barren, forest, grassland, cropland, wetland | % | NLCD 2019 |
* WorldClim [http://www.worldclim.com], USGS SRTM [https://www.usgs.gov/centers/eros/science], USGS Gap Analysis [https://gapanalysis.usgs.gov/apps/species-data-download/], NLCD [https://www.mrlc.gov/data/nlcd-2019-land-cover-conus].
Table 2.
Mean best fit single model evaluation metrics for the predicted historic occurrence in Illinois of the four tick species modeled. Bolded numbers denote the AUC/correlation/true skill statistic (TSS) score/deviance for the best fit model for that species. To be included in ensemble models, an individual model must display an AUC of at least 0.75, and a TSS of at least 0.50. A dash indicates that an algorithm did not display complete (100%) model run success percentage for that period.
| Species | Ixodesscapularis | Amblyomma americanum | Dermacentor variabilis | Amblyomma maculatum | Ixodesscapularis | Amblyomma americanum | Dermacentor variabilis | Amblyomma maculatum | Ixodesscapularis | Amblyomma americanum | Dermacentor variabilis | Amblyomma maculatum | Ixodesscapularis | Amblyomma americanum | Dermacentor variabilis | Amblyomma maculatum | |
|---|---|---|---|---|---|---|---|---|---|---|---|---|---|---|---|---|---|
| Number of occurrence (presence) points | 62 | 99 | 290 | 15 | 62 | 99 | 290 | 15 | 62 | 99 | 290 | 15 | 62 | 99 | 290 | 15 | |
| Number of pseudo-absence points | 70 | 100 | 300 | 20 | 70 | 100 | 300 | 20 | 70 | 100 | 300 | 20 | 70 | 100 | 300 | 20 | |
|
Evaluation Metric |
AUC | Correlation | TSS | Deviance | |||||||||||||
| Algorithm * | GLM | 0.88 | 0.86 | 0.84 | 0.60 | 0.67 | 0.64 | 0.61 | 0.21 | 0.71 | 0.67 | 0.71 | 0.45 | 1.85 | 1.13 | 1.02 | 7.26 |
| BRT | 0.89 | 0.89 | 0.85 | - | 0.68 | 0.68 | 0.63 | - | 0.72 | 0.72 | 0.63 | - | 0.99 | 1.00 | 1.04 | - | |
| CART | 0.81 | - | 0.81 | 0.70 | 0.57 | - | 0.56 | 0.36 | 0.59 | - | 0.57 | 0.47 | 1.46 | - | 1.21 | 2.68 | |
| MaxEnt | 0.88 | 0.87 | 0.87 | 0.75 | 0.66 | 0.64 | 0.65 | 0.43 | 0.71 | 0.68 | 0.65 | 0.64 | 0.96 | 0.97 | 0.93 | 1.38 | |
| RF | 0.89 | 0.89 | 0.87 | 0.76 | 0.68 | 0.69 | 0.65 | 0.43 | 0.72 | 0.71 | 0.65 | 0.61 | 0.87 | 0.85 | 0.90 | 1.29 | |
| MARS | 0.74 | 0.81 | 0.84 | 0.66 | 0.44 | 0.55 | 0.60 | 0.28 | 0.49 | 0.59 | 0.59 | 0.41 | 13.0 | 3.32 | 1.09 | 21.8 | |
| SVM | 0.89 | 0.86 | 0.86 | 0.80 | 0.68 | 0.64 | 0.64 | 0.54 | 0.72 | 0.66 | 0.63 | 0.71 | 0.88 | 0.94 | 0.94 | 1.32 | |
* GLM = Generalized linear models; BRT = Bayesian regression trees; CART = classification and regression tree; MaxEnt = Maximum entropy; RF = random forest; MARS = multivariate adaptive regression splines; SVM = support vector machines.
Table 3.
Relative percent contribution of habitat suitability variables in best fit models for each tick species across the three climate scenarios. Current climate models were fit using the historical data representing the average climate measurements from 1970-2000 at 1km resolution. Future climate models were fit with mean projections of these data at a 1km resolution using Coupled Model Intercomparison Project phase 5 (CMIP6)/ EC-Earth3-Veg Representative Concentration Pathway (RCP) 8.5 for 2050 (average from 2041-2060) and 2070 (average from 2061- 2080). All landscape variables represent percentage of that landcover, except for elevation which is measured in meters. The top three most important variables in the model prediction are bolded for each period. Variables that were not included in a model due to collinearity are denoted with a dash.
|
Environmental Variable * |
Tick Species | |||||||||||
|
Ixodes scapularis |
Amblyomma americanum |
Dermacentor variabilis |
Amblyomma maculatum | |||||||||
| Climate Scenario | ||||||||||||
| Hist. | 2050 | 2070 | Hist. | 2050 | 2070 | Hist. | 2050 | 2070 | Hist. | 2050 | 2070 | |
| Barren | 2.5 | 1.3 | 1.5 | 1.7 | 2.8 | 1.4 | 1.0 | 1.7 | 0.5 | 2.6 | 2.3 | 9.8 |
| Cropland | 1.0 | 1.2 | 1.5 | 1.9 | 1.3 | 4.5 | 0.7 | 0.6 | 0.8 | 10.0 | 3.1 | 8.6 |
| Developed | 0.7 | 1.5 | 0.9 | - | - | - | 1.6 | 1.2 | 0.8 | 10.3 | 6.2 | 7.6 |
| Deer Habitat | - | - | - | 3.9 | 2.1 | 2.4 | - | - | - | - | - | - |
| Elevation | 1.8 | 2.1 | 0.6 | 3.1 | 3.1 | 6.2 | 1.0 | 3.8 | 1.2 | - | - | - |
| Forest | 16.5 | 27.2 | 28.0 | 11.8 | 21.8 | 11.8 | 30.4 | 26.5 | 30.0 | 29.1 | 50.0 | 45.3 |
| Grass/Shrub | 3.9 | 2.8 | 1.7 | 0.5 | 1.0 | 0.7 | 0.8 | 0.5 | 0.4 | 2.3 | 1.6 | 7.7 |
| Water | 1.0 | 0.8 | 0.7 | 3.6 | 0.3 | 0.2 | 0.5 | 0.5 | 0.4 | 1.7 | 0.6 | 0.6 |
| Wetland | 10.8 | 6.3 | 13.6 | 17.9 | 4.1 | 7.3 | 12.7 | 12.3 | 11.1 | 10.1 | 0.9 | 13.1 |
| BIO2 | - | - | - | 1.8 | 4.2 | 3.1 | 2.5 | 3.4 | 4.2 | - | - | - |
| BIO5 | 1.5 | 1.7 | 2.1 | - | - | - | - | - | - | - | ||
| BIO7 | 0.7 | 0.6 | 2.1 | - | - | - | 0.7 | 1.4 | 1.7 | - | - | - |
| BIO8 | 1.5 | 0.5 | 0.9 | 0.9 | 1.1 | 0.4 | 1.1 | 1.1 | 0.6 | - | - | - |
| BIO9 | 0.6 | 1.2 | 2.5 | 0.9 | 0.9 | 0.8 | 0.7 | 0.8 | 0.5 | - | - | - |
| BIO10 | - | - | - | - | - | - | 0.8 | 0.7 | 0.6 | - | - | - |
| BIO13 | - | 1.7 | 0.9 | 1.3 | 0.7 | 0.8 | 0.7 | 0.9 | 0.3 | - | - | - |
| BIO15 | - | - | - | 2.4 | 2.9 | 1.2 | - | - | - | 2.8 | 3.9 | 6.8 |
| BIO18 | 3.0 | 2.0 | 3.0 | 0.5 | 0.3 | 0.8 | 0.9 | 1.2 | 1.2 | 2.8 | 7.8 | 10.4 |
* BIO1, BIO3, BIO4, BIO6, BIO11, BIO12, BIO14, BIO16, BIO17, BIO19, and impervious surface were not included in any models due to multicollinearity issues among variables. BIO2 = Mean Diurnal Range (Mean of monthly (max temp – min temp)), BIO5 = Max Temperature of Warmest Month, BIO7 = Temperature Annual Range (BIO5-BIO6), BIO8 = Mean Temperature of Wettest Quarter, BIO9 = Mean Temperature of Driest Quarter, BIO10 = Mean Temperature of Warmest Quarter, BIO13 = Precipitation of Wettest Month, BIO15=Precipitation Seasonality (Coefficient of Variation) , BIO18 = Precipitation of Warmest Quarter.
Disclaimer/Publisher’s Note: The statements, opinions and data contained in all publications are solely those of the individual author(s) and contributor(s) and not of MDPI and/or the editor(s). MDPI and/or the editor(s) disclaim responsibility for any injury to people or property resulting from any ideas, methods, instructions or products referred to in the content. |
© 2024 by the authors. Licensee MDPI, Basel, Switzerland. This article is an open access article distributed under the terms and conditions of the Creative Commons Attribution (CC BY) license (https://creativecommons.org/licenses/by/4.0/).
Copyright: This open access article is published under a Creative Commons CC BY 4.0 license, which permit the free download, distribution, and reuse, provided that the author and preprint are cited in any reuse.


