
Submitted:
11 January 2023
Posted:
12 January 2023
You are already at the latest version
Abstract
This paper studies pandemic viruses that spread during the period (1759–2020) according to solar activity cycles. Our findings and results include the following: (1) The severity of a pandemic correlates negatively with the strength of solar activity; (2) Pandemic viruses are classified into three types based on their compatibility with solar activity associations. Most of them spread through the quiet Sun, where viruses survive better in cold and rainy weather, and in stable geomagnetic fields without strong disturbances; (3) The emergence of new strains of influenza viruses was manifested in two ways. First, the annual epidemics due to antigenic drift. Second, pandemics recur every 1–12 solar cycles (about 11–120 years) due to viral reassortment of new subtypes, which results in antigenic shifts; (4) Pandemic viruses have two groups according to their recurring period: first, recurring in nine solar cycles; second, recurring in twelve solar cycles. Furthermore, we reassort pandemic viruses from their previous spread in the same periodic classification. Moreover, we derive a periodicity formula for each subtype of the pandemic virus as a spread date.
Keywords:
Space weather
; Solar terrestrial connection
; Climate change
; Solar cycle
; Environment
; Epidemiology
1. Introduction
Astronomically, the annual spread of seasonal epidemic viruses depends on the annual seasons, which depend on the inclination of the Earth’s equator on the ecliptic plane, or the projection angle of sunlight on Earth. On the same day of each year, the slope of the sunlight (i.e., the altitude angle of the sun) is approximately the same. However, the weather is not the same. Because the climate varies according to interior and exterior factors. Solar activity is an important exterior factor. Solar activity varies in cycles. It is called a “solar cycle”. The shortest solar cycle is about 11 years. Solar activity is measured in terms of the sunspot number, which considers the number of single or groups of sunspots.
Most of the viruses’ subtypes that spread in the season annually are called “epidemic viruses”, such as seasonal influenza. Some viruses do not spread seasonally each year but over irregularly long periods. These viruses are called “pandemic viruses”. World Health Organization (WHO) debates about “Elusive definition of pandemic influenza”. The US Centers for Disease Control and Prevention (1 March 2009) declares about the new pandemic of Swine flu (H1N1) that the requirements for an Influenza Pandemic are connected to the capability to infect humans, cause serious illness, and spread easily from human to human. It is noticed by researchers that pandemic spreads recur every long period, as we will explain shortly in this section. Previous studies correlated pandemic viruses with solar activity, especially during a quiet sun (called a solar minimum too). Ref. [1] presented a prediction method based on accumulating the various lags or anticipations of the nearest sunspot maximum in a plot and a table. Solar activity provides an environment sometimes suitable for viruses’ spread. The spread of pandemic viruses recurs according to solar cycles [1,2,3,4,5,6,7,8,9,10,11].
The cyclic variations of solar irradiance are found to correlate with the mean daily sunspot number [12]. The solar ultraviolet radiation (UV) that is not suitable for viruses also varies with solar activity. The authors of [13,14,15] suggest that the inactivation of viruses in the environment by solar UV radiation plays a role in the seasonal occurrence of influenza. Ultraviolet A radiation (UVA) in sunlight is much less photochemically active and therefore generally less harmful than ultraviolet B radiation (UVB) [16]. Solar activity creates a suitable environment for viruses on Earth [17], impacting the geomagnetic field and causing geomagnetic disturbance [18]. In addition, magnetically guided viruses stamp the targeted infection of single or groups of cells. The genes of cells are exposed to a weak magnetic field (MF) [17]. Extremely low frequency weak magnetic fields enhance the resistance of NN tobacco plants to the tobacco mosaic virus and elicit stress-related biochemical activities [19]. The Maunder Minimum could have had some effect on solar activity on Earth's climate during the period 1650–1715 when there was very little sunspot activity [20]. Thus, solar activity coupled with climate led to tabulations of sunspot numbers as an indication of solar activity.
The authors of ref. [21] concluded that the solar changes have contributed to small climate oscillations occurring on time scales of a few centuries. Previous research [12,21,22,23,24,25,26,27,28,29,30,31,32,33,34] looked into the relationship between solar activity and global temperature. They found the global average rate of ionization is produced by cosmic rays in the atmosphere. However, the Intergovernmental Panel on Climate Change (IPCC) reported that, at the moment, the effect of solar activity on the climate seems very limited. They disagree with most global temperature forecasts about the trend toward Earth’s low temperatures. In addition, they found that long-term variations in the global average surface temperature have a similar cyclic component. Some scientists disputed the results of ref. [21], although many studies agreed with their results. According to NASA [35], the variations of air temperature and water vapor pressure exhibit similar behavior and parallel approximately [32]. The phenomenon of global warming is caused by excessive CO2 emissions, while the current rising trend in the concentration of greenhouse gases, including CO2, is natural and correlates with solar activity and Earth’s orbit [31,32].
According to the association between solar activity and climate change, several scientists assume that we are going to a cold epoch or little ice age [12,21,22,23,24,25,26,27,28,34,36]. The climatic change is caused during the epoch of the Gleissberg cycle, which reaches about 80–120 years [26,27,28].
Viruses survive better in cold weather because it has a protective gel-like coating that allows them to survive in the air and be passed from person to person. In the past 300 years, 10 pandemics have occurred. The points of origin were suggested as China, Russia, and Asia. The analytic data indicates that Europe and America are considered a focus of spread, especially in the winter season [2].
The interval of time between pandemics varies from a decade (1889–1900 and 1957–1968) to some 50 years (1729–1733 and 1781–1782); the interval has not significantly increased or decreased over time, suggesting that increased population and travel are not determining factors. The interval between pandemics in the period from 1700 to 1889 was approximately 50–60 years, and for the period since 1889, it is 10–40 years [37]. Therefore, to be brief, it is unrewarding to attempt to seek a pattern for pandemics that will allow predictions, but it is self-evident from the history of pandemics that each year that passes brings the next pandemic one year closer. The World Health Organization (WHO) believes that the world is closer to another influenza pandemic than ever since 1968 when the last of the 20th century’s three pandemics swept the globe. The March 2005 plan includes guidance on roles and responsibilities in preparedness and response; information on pandemic phases; and recommended actions before, during, and after a pandemic [37].
The new era beginning in the third thousand years, starting from the year 2000, indicates new types of pandemics other than flu pandemics. Three types of coronavirus pandemics occurred during 2003–2004 (SARS), 2013–2014 (MERS), and 2019–2020 (COVID–19), as mentioned by [37]. Nevertheless, the scientists did not predict the accurate spread time of coronavirus COVID–19, when, and where? Epidemic viruses, such as all types of influenza, were discovered to spread at certain times each year. It is a temporal and spatial phenomenon [37]. Epidemics have recurred with a highly predictable seasonality [38], which is felt predominantly during the winter months. They stated that, in northern latitudes, influenza viruses circulate from November to March, while in the southern hemisphere, influenza occurs primarily from May to September. Annual epidemics have been studied [2] and found the spread of epidemic viruses coincides with the rainy season.
A few studies have correlated the spread of pandemic viruses with solar activity. They found that some subtypes of the pandemic viruses are spread through the quiet Sun (solar minimum) [1,2,3,4,5,6,7,8,9,10,11]. In this paper, we discuss the correlation of pandemic viruses to solar activity cycles. In addition, we suggest an accurate prediction model for specific subtypes of pandemic viruses.
2. Approach and Methodology
2.1. A listing of pandemic viruses
The first solar activity cycle, as manifested by the 11–year variation in the number of spots and faculae, has been observed systematically since 1749. Sunspots have now been available since approximately 1750 at the Royal Observatory of Belgium, Brussels (WDC-SILSO). Here, in the current study, we depend on this observed data, where the Maunder Minimum appears, a period where the solar activity was practically null. The intensity of the activity cycle, as measured by its peak in the annual mean sunspot count, is not the same from one cycle to another. The inspection of Figure 1 (blue curve) reveals the modulation of the envelope of the maxima of about 80–120 years. This period is known as the Gleissberg cycle [26].
Table 1 contains a list of pandemic viruses that are recurring or repeating within each solar activity. We notice that pandemic viruses such as influenza or coronaviruses correlate with weak solar cycles. We found that most of these pandemic viruses were spread during the quiet sun. This result agrees with previous studies [1], which have studied fewer pandemic cases than us. But we found some of these viruses were spread during the active sun too. They did not report that. We found that the pandemic viruses that cause the highest severity of the pandemic are spread during weaker solar cycles, especially in the Gleissberg cycle, such as the periods 1800–1820, 1900–1920, and 2020.
This result indicates that weak solar cycles have higher pandemic severity and vice versa. I.e., we have weaker pandemic severity every 11 years and stronger pandemic severity every ~80 –120 years according to the period of the solar Gleissberg cycle. Thus, we expect that we will face a lower severity pandemic of viruses in the next solar maximum (i.e., in the year ~2025) and a higher severity pandemic of viruses in the next solar minimum (i.e., in the year ~2031) similar to coronavirus COVID–19 and/or Spanish virus (H1N1).
2.2. Pandemic year prediction
According to the foundations in the previous section and Table 1, it is concluded that pandemic viruses will be recurring in a periodic cycle. We listed the distinct of each subtype listed in Table 1 with their spread dates as shown in Table 2. We discovered that some spread periodic cycles differ from one subtype to the others. The subtypes H1N1, H2N2, and H3N2 have had a lot of years of spread. Then we can develop an accurate formula for these predictions of spread years. Other subtypes have little spread time, so the prediction of spread time for them will have lower accuracy. We have new subtypes such as H7N9, Victoria, and COVID–19. They have one record of spread time. We can consider them as a reassortment of the Spanish flu (H3N8 or H2N2).
Most of the subtypes have recurring or periodic cycles equal to nine solar cycles (one hundred years). The subtype H3N2 has a period equal to 18 solar cycles. It duplicates the period of the nine solar cycles. Then we can consider its period is 9 solar cycles by considering half of its period is not recorded in the table.
We can classify the periodic cycles of pandemic viruses into two types:
- Recurring in nine solar cycles: such as H2N2, H5N1, H1N2, H1N3, H3N8, and H7N9. We can consider that H0N1 has a nine-periodic solar cycle instead of eight solar cycles. H3N2 assumed nine solar cycles. We can include the subtypes Victoria and COVID–19 in this group by assuming these subtypes are a reassortment of Spanish flu (H3N8 or H2N2), but COVID–19 had recombination issues with spike genes or proteins.
- Recurring in twelve solar cycles: we have the subtype H1N1 only in this group. We can consider this period equal to 6 solar cycles for early alarms for humans.
The accuracy of these periods depends on the available data collected in Table 2.
Thus, we can develop a formula to predict the spread time for each subtype of the pandemic virus. Our method depends on the start time of each solar cycle. The most we can talk about, the quiet sun does not occur on a specific date, it takes a period of maybe 2 years. Here we will consider that this solar minimum will occur on a specific date, so we can estimate it. We must take into account that the spread time may happen before or after the calculated day.
To begin, we must convert the solar cyclic number to the date and vice versa. The conversion from the solar cycle number to its start date (i.e., year) can be determined by the following formula
Y0 is the initial year. It equals 1744.4. P0 is the length of the solar cycle. P0 is equal to 11.075. C is the solar cycle number, and Y is the year. This formula is proposed to determine the start date of the specified solar cycle number. The constants Y0 and P0 are calculated by the fitting of solar cycle parameters recorded in Table 1.
Y = Y0 + P0 × C
The inverse conversion from the start year of the solar cycle to the solar cycle number can be determined from:
C = -157.43 + 0.090253 × Y
Then, we can put a prediction formula for a pandemic year as follows:
where Cp is the pandemic solar cycle for the specified subtype, it equals C in equation 2. C0 is the initial solar cycle of a specified pandemic subtype virus (i.e., the first date of spread in Table 1). n is the spread number of pandemic subtypes of viruses; it equals 0, 1, 2,…, ∞. The value 0 indicates the first spread time listed in Table 2, 1 indicates the second spread time, and so on. P is the periodic factor. It is considered constant for each subtype of viruses. This value is listed in Table 1. After calculating the value of Cp by using equation 2. Then we can substitute this value in equation 1 to calculate its spread year.
Cp = C0 + n × P
We can substitute Equation (3) into equation 1 to get the final formula:
Y = 1744.4 + 11.075 (C0 + n × P)
Some of the subtypes of pandemic viruses are spread during the active Sun. Then Y must be corrected by adding the interval between solar maximum and solar minimum (A). Solar maximum interval A equals ~5 years (i.e., ~0.5 solar cycle). It may be greater or smaller than 5. It varies from one solar cycle to another. But it is considered here to be equal to 5 solar cycles for a solar maximum. This imposition will result in a significant error of about 2–3 years in the prediction equation (5). The appropriate value of A can be set to adjust the value according to the expected solar activity strength. Thus, the final formula will be
Y = 1744.4 + 11.075 (C0 + n × P) + A
For some of the pandemics of the solar minimum, A becomes equal to 0. But for pandemic spread at solar maximum, A becomes equal to 5. Some of the pandemic viruses may have a custom A value. We must take it into account.
For example, the first spread of subtype H3N8 was in 1808 (C0=6), and 1889 (C0=1). It has a periodic factor that equals 8 solar cycles (P=7). If we assumed that A equals 0, then
The first spread (n=0):
Y = 1744.4 + 11.075 (6 + 0 × 7) + 0 = 1810.85 [1808 H3N8]
The second spread (n=1):
Y = 1744.4 + 11.075 (6 + 1 × 7) + 0 = 1888.375 [1889 H3N8]
We can show that the difference between both spread times of equations (5–1) and (5–2) equals 77.525, which means the length of the cycle per year. It is included in the equation (5–1) of the first spread time (6 + 0 × 7). It is defined in equation 3.
We can repeat the same example of subtype H3N8 by assuming a periodic factor that equals 9 solar cycles (P=9) and A that equals -2, then
Y = 1744.4 + 11.075 (7 + 0 × 9) - 2 = 1819.925
The second spread (n=1):
Y = 1744.4 + 11.075 (7 + 1 × 9) - 2 = 1919.6 [Spanish flu]
The third spread (n=2):
Y = 1744.4 + 11.075 (7 + 2 × 9) - 2 = 2019.275 [Recombination of coronavirus COVID–19]
The fourth spread (n=3):
Y = 1744.4 + 11.075 (7 + 3 × 9) - 2 = 2120.95 [predicted for the future]
The difference between spread times equals 99.675, which differs from the previous example. Table 2 shows the periodicity length of pandemic viruses. Its value varies from one subtype to another.
Another example: the subtype H2N2 was spread three times, 1759 (C0=1), 1858 (C0=10), and 1958 (C0=19). We can check the prediction of its spread times as follows:
The first spread (n=0):
Y = 1744.4 + 11.075 (1 + 0 × 9) + 4 = 1759.475
The second spread (n=1):
Y = 1744.4 + 11.075 (1 + 1 × 9) + 4 = 1859.15
The third spread (n=2):
Y = 1744.4 + 11.075 (1 + 2 × 9) + 4 = 1958.825
The fourth spread (n=3):
Y = 1744.4 + 11.075 (1 + 3 × 9) + 4 = 2058.5
We expect that we will face a pandemic virus in the next solar maximum (~2025). Besides, we will face a pandemic virus in the next solar minimum. We can calculate the start time of the next solar cycle 26 by using equation 1 as follows:
Y = 1744.4 + 11.075 × 26 = 2032.35
Most of our estimated spread times of pandemic viruses get an error of about 2–3 years. Then we can consider A is equal to 2 to give an accurate pandemic date.
2.3. Seasonal epidemic of viruses
The seasonal epidemic of viruses is recurring each year. The breakdown of the “peak months of flu activity” over 34 years between 1982 and 2016 is shown in Table 3 occurs during their months [39]:
1. February was the peak month for flu activity in 14 of the 34 flu seasons, making it the most common month for peak flu activity.
2. December followed February, with the highest flu activity in seven of the 34 flu seasons.
3. March is third, with flu activity peaking this month in six seasons during the 34–season period.
4. January was the least common month to facilitate peak flu activity, with the flu peaking this month in only five of the 34 flu seasons.
Every season plays out differently, but typically the peak of the cold and flu season is between December and February. In fact, according to the Centers for Disease Control and Prevention (CDC), for 34 years dating back to 1982, February was the peak month of flu activity during 14 seasons. The annual epidemics are due to antigenic drift.
The most common strain of seasonal flu is A/H3N2, A/H1N1, and B Number of infected peoples: 5–15% (340 million – 1 billion) [36], 3–11% or 5–20% (240 million–1.6 billion) [37,40].
We compared the time series of the global weather parameters, during the period 1999–2021, obtained from the European Centre for Medium-Range Weather Forecasts (ECMWF), with the Peak Month of Flu Activity, which represents the spread of the epidemic viruses during the period 1982–1983 through 2017 –2018, that obtained from the CDC. It is shown in Figure 2.
Plot A of Figure 2 represents the global 2–meter temperature. It shows that the spread of the epidemic has a negative correlation with temperature. A suitable environment for flu activity is the cold areas. While the hot area is not a suitable environment for the spread of epidemic viruses.
Plot B represents the global wind speed. As can be seen from this figure, fast winds help the spread of epidemic viruses more than slow winds. Therefore, the speed of virus spread can be expected in terms of wind speed. Therefore, the spread of viruses is higher in winter than in summer because winds record their highest speeds in winter. Viruses that spread in the summer tend to spread more slowly. This is because the wind speeds in the summer are slow.
Plot C represents the global surface pressure. This figure gives an important result. Because it is shown clearly that both curves move in parallel proximally. This means that the suitable environment for the spread and survival of viruses is at a pressure of between 9743 and 9752 millibar during the months from December to February. While air pressure lower than 9742 is considered unsuitable for the survival of viruses.
This indicates that the appropriate environment for viruses is areas of high pressure. Low-pressure times or areas are unsuitable environments for viruses to live. Therefore, it is possible to set the rooms at a certain pressure so as not to allow the life of viruses. We believe that it is a suitable method that can be used as an alternative to the ultraviolet radiation that sterilizes places of viruses. We found that pressures that are lower than 9742 millibars on average are a guarded environment from viruses.
Plot D represents the global total precipitation. The Peak month of flu activity increases with average rainfall. This result indicates that rainy weather is a suitable environment for epidemic viruses. According to this fact, we can expect that the peak months of flu activity will increase or decrease each year according to the total precipitation. The rainfall varies from year to year. It depends on solar activity as an external force. The weak solar cycles that occurred during every century, in particular, caused a more severe century of rainy weather than the strong solar cycle epochs.
3. Discussions and Conclusions
The solar activity cycles are an important external source of the variability in the atmospheric environment on Earth that sometimes becomes suitable for the spread of pandemic viruses. Two emerging new strains of influenza viruses were manifested in two ways. Annual epidemics (seasonal epidemics) are due to antigenic drift, and pandemics occur at 1–12 solar cycle (about 11 to 108 years) intervals due to new virus subtypes resulting from virus reassortment.
The pandemic could grow due to an increased population and mobility. New medical treatments and better medical care and the effect of mobility over the years have reduced the likelihood. In the current study, emphasis was placed on developing a mathematical formula for calculating the onset of pandemic spread times for forecasting purposes.
We tabled a list of pandemic viruses that occurred during the period 1759–2020. Each subtype of the pandemic virus was discovered to reoccur in each solar activity (every about 11 years). We notice that pandemic viruses correlate with solar activity. Most of these pandemic viruses have been spread during the quiet Sun. A minor number of these pandemic viruses have been spread during the active sun.
The severity level of the pandemic has a negative correlation with the strength of the solar cycle. The higher severity of the pandemic occurs during weak solar cycles, especially weaker ones such as each solar Gleissberg cycle (i.e., every nine solar cycles, which equals about a hundred years). Weak solar cycles occurred during the periods 1800–1820, 1900–1920, and 2020. Besides, we found that the pandemic viruses spread around the quiet sun during weak solar cycles. During strong solar cycles, pandemic viruses spread around the active Sun. The recurring pandemic viruses have two types: (1) recurring in nine solar cycles: such as H2N2, H5N1, H1N2, H1N3, H3N8, and H7N9. We can consider that H0N1 has a nine periodic solar cycle instead of eight solar cycles. H3N2 assumed nine solar cycles. We can include the subtypes Victoria and coronavirus COVID–19 in this group by assuming these subtypes are a reassortment of Spanish flu (H3N8 or H2N2); (2) recurring in twelve solar cycles. We have the subtype H1N1 only in this group. We can consider its period to be six solar cycles of early warnings for humans.
The pandemic viruses, which are associated with the quiet Sun start their spread in cold regions (i.e., temperate or subtropical zones, such as European cities). The pandemic viruses that are associated with the active Sun started their spread in hot regions (i.e., tropical zones such as near-equatorial cities). We expect that the globe will face a lower severity pandemic of viruses in the next solar maximum (i.e., in around the year 2025), and a higher severity pandemic of viruses in the next solar minimum (i.e., in around the year 2031), similar to the coronavirus COVID–19 and Spanish virus (H1N1).
A previous study [1] suggested a method to predict the spread time of pandemic viruses according to the nearest sunspot maximum. Their study did not modulate a prediction for pandemic viruses for a specific subtype of any virus. Unlike the study of [1], we suggest a mathematical formula that can predict the start time of the pandemic virus spread for each subtype as a function of (5).
In addition, the spread of the epidemic has a negative correlation with temperature. A suitable environment for flu activity is the cold areas. While the hot area is not a suitable environment for the spread of epidemic viruses. Fast winds help the spread of epidemic viruses more than slow winds.
Additionally, the suitable environment for the life of viruses is high atmospheric pressure. While the lower atmospheric pressure is an unsuitable environment for the spread of pandemic and epidemic viruses, we suggested that a pressure lower than 9740 millibars, on average, is a good pressure for guarding against viral infections.
Also, rainy weather is a suitable environment for pandemic and epidemic viruses. Therefore, the relative humidity helps the viruses to live. The dry air is an unsuitable environment for virus spread.
3.1. Physical motivation and connection
There is no doubt that many events may recur and coincide, but the correlation coefficient does not mean that both things are physically related, but it’s just simultaneous. Our case differs, although the sunspot number SSN is not a physical proxy. The SSN, which is devoted to solar activity, represents the value of solar outputs and their variation, be it radiation or even plasma particles. In fact, solar activity does not mean that the spread of viruses depends only on temperature (solar irradiance) alone. Although the influence of fluctuations in the solar irradiance due to solar activity, which naturally has an 11–year cyclic, turns out to be of the order of 0.1% (a small amount), this small difference is very influential on the earth's weather. So, the temperatures and weather parameters vary on the same day annually, and this is caused by the change in the solar irradiance due to solar activity as an external factor, albeit a slight change. It is worth noting that temperature variation through the year and seasonal variation is due to the Earth’s rotation and inclination. This inclination changes markedly every thousand years as a result of aberration and nutation, and there are other changes. But all of them have been ineffective over the decades. Without solar activity, the temperature could be considered constant each year on the same day.
The variation of solar activity during its period (11 years) is followed by a disturbance in the Earth’s field. This solar activity does not mean that a tiny change causes solar irradiance. But it does mean that a big change in the amount of ejected plasma particles is output from the sun, such as solar wind, coronal mass ejections (CMEs), and solar protons. Space weather scientists took up the study of this ejected plasma. As what arrives from it causes a strong impact on the earth's weather, as well as some natural phenomena, such as magnetic field disturbances, cyclones, flash floods, torrential rain, forest fires, and others.
The disturbance is high in the magnetosphere, while it becomes weak in the troposphere and near the surface. In Addition, this solar activity causes a variation in the weather’s parameters in the troposphere [41].
Experimentally, the viral studies [17,19,20] concluded that a magnetic field guides virus stamping for the targeted infection of single or groups of cells. Gene cells are exposed to a weak magnetic field (MF) [17]. Extremely low frequency weak magnetic fields enhance the resistance of NN tobacco plants to the tobacco mosaic virus and elicit stress-related biochemical activities [19]. Thus, this indicates that the slight change in the Earth's magnetic field contributes to, influences, and provokes the spread of pandemic viruses.
According to ref. [41], the ejected solar plasma, which varies according to solar activity, causes a tiny variation in the weather, such as total precipitation, temperature, surface pressure, wind speed, relative humidity, and others. These weather parameters are already influencing the spread of the epidemic and pandemic viruses. The precipitation, which is forced by solar activity as an external factor, is a suitable environment for viruses’ spread. This means that the nearby coastal regions and rainy regions have higher severity than other regions. The virus's spread time can be predicted according to solar activity prediction. It agrees with the conclusion of [42], which found that aerosolization from the sea surface is largely associated with organic matrices of transparent exopolymeric particles.
Also, ref. [40] found that SARS-CoV-2 aerosolized from infected patients and deposited on surfaces could remain infectious outdoors for a considerable time during the winter in many temperate-zone cities, with continued risk for re-aerosolization and human infection.
These particles may assist in the persistence and viability of viruses and bacteria in the upper atmosphere during long-distance transport. The temperature and relative humidity are predictable parameters that are followed by solar activity, and the global temperature is correlated with solar activity [12,21,22,23,24,25,26,27,28,29,30,31,32,33]. Also, some previous studies considered that solar ultraviolet rays coming from the sun are the main source that acts as a germicide and works to sterilize the environment [15,16]. In addition, our conclusion agrees with previous studies that found the spread of influenza has been correlated with rainy seasons [37,38], and transmission of viruses was found to be dependent on both temperature and relative humidity [43,44,45].
6. Recommendations
We should be on guard for the next few years because next year will be the quiet solar activity that is associated with higher severity levels of pandemic viruses. We expect that the next solar minimum (round of 2030) will also face a higher severity of pandemic viruses. Accordingly, we recommend that scientists excavate deep into the icebergs in Greenland and Antarctica to expect the future spread of subtypes of pandemic viruses.
We recommend creating an air pressure lower than 9742 millibars (on average) in buildings, houses, rooms, or hospitals to create unsuitable environments for viruses to live. It guards people against viral infections.
This method may be a suitable alternative to UV radiation, which may not permeate all bodies, and which requires specific wavelengths for each virus subtype. While atmospheric pressure is one way which means that can permeate the entire place, it is suitable for all subtypes of viruses at the same time.
We also confirm that the results of this study do not mean that the viruses spreading in the current epoch are 100% natural. This study is just examining the appropriateness and finding the suitable environment and timing for the spread of viruses. This means that the spread of viruses at current times may be natural and may be an exploitation of the suitable timing or the suitable environment by some parties. This requires an investigation by competent authorities.
Author Contributions
Conceptualization, R.M.; Data curation, R.M., and H.M.M.; Formal analysis, R.M., H.M.M., and E.M.B.M.; Funding acquisition, R.M.; Investigation, all authors; Methodology, R.M., E.M.B.M.; Software, R.M.; Writing – original draft, R.M.; Writing – review, al authors; Writing – editing, all authors; publication fees, R.M; All authors have read and agreed to the published version of the manuscript.
Acknowledgments
Authors thank data source providers: World Data Center - Sunspot Index and Long-term Solar Observations (WDC-SILSO) for sunspot numbers (http://sidc.be/silso/), the European Centre for Medium-Range Weather Forecasts (ECMWF) (https://www.ecmwf.int/), and the Centers for Disease Control and Prevention (CDC) for data of Peak Month of Flu Activity of seasonal epidemics (https://www.cdc.gov/flu/about/season/flu-season.htm). The authors thank Dr. Prof. Essam Ghamry for suggesting that some references be added to improve the paper.
Availability of data and materials
Mawad, Ramy; et al., 2022, "Solar activity - Pandemic viruses", https://doi.org/10.7910/DVN/CBJK2T, Harvard Dataverse, V1.
References
- Tapping, KF, Mathias RG; Surkan DL. Influenza pandemics and solar activity. Canadian Journal of Infectious Diseases, 2001, 12, 61–62.
- Potter CW. A history of influenza, Journal of Applied Microbiology, 2001, 91, 572-579. [CrossRef]
- Yeung JWK. A hypothesis: Sunspot cycles may detect pandemic influenza A in 1700–2000 A.D., Medical Hypotheses, 2006, 67,5, 1016-1022. [CrossRef]
- Vaquero JM, Gallego MC. Sunspot numbers can detect pandemic influenza A: The use of different sunspot numbers. Medical Hypotheses, 2007, 68, 1189–1190. [CrossRef]
- Karim LM, AL-Kazzaz AL, Hafedh MA, Hafedh AA. Viruses from space and its relation with solar activity. Journal of College of Education 2011, 3, 229–236.
- Karim LM, Abbas MH. The relation between influenza pandemics and solar activity, Iraqi Journal of Science, 2014, Vol 55, No.2A, pp:556-560. https://www.iasj.net/iasj/download/a49b81dbb1450abd.
- Towers, S. Sunspot activity and influenza pandemics: a statistical assessment of the purported association, Epidemiology, and Infection, 2017, 145 2640-2655. [CrossRef]
- Wickramasinghe NC, Edward J Steele, Wainwright M, Gensuke Tokoro, Manju Fernando and Jiangwen Qu. Sunspot Cycle Minima and Pandemics: The Case for Vigilance?, J. Astrobiol Outreach, 2017, 5 1000159. [CrossRef]
- Wickramasinghe NC, Wickramasinghe NT, Senanayake S, et al., Space weather and pandemic warnings? Current Science, 2019:117, 232.
- Qu J, Wickramasinghe NC. The world should establish an early warning system for new viral infectious diseases by space-weather monitoring. MedComm (2020). 2020 Jul 23;1:423-426. PMID: 32838395. [CrossRef]
- Qu J; Wickramasinghe NC. The world should establish an early warning system for new viral infectious diseases by space-weather monitoring?, MedComm (2020). 2020 Dec; 1: 423–426. [CrossRef]
- Erlykin AD, Sloan TAW, Wolfendale. Solar activity and the mean global temperature, Environ. Res. Lett. 2009 4, 014006.
- Lytle CD, Sagripanti JL. Predicted Inactivation of Viruses of Relevance to Biodefense by Solar Radiation, Journal of virology, 2005, 14244–14252. [CrossRef]
- Jose-Luis Sagripanti, C David Lytle. Estimated Inactivation of Coronaviruses by Solar Radiation With Special Reference to COVID-19, Photochemistry and Photobiology, 2020, 96: 731–737.https://onlinelibrary.wiley.com/doi/epdf/10.1111/php.13293.
- WKH Al-Hashemi, DSh Zageer. HK Risan. Estimation the Efficiency of Sunlight UV on Inactivation COVID-19 Virus, Egyptian journal of chemistry, 64 - Serial Number 7, pp 3225-3234, July 2021. [CrossRef]
- de Gruij, F.R.; Jan C. van der L., Environment and health: 3. Ozone depletion and ultraviolet radiation. CMAJ. 2000, 163, 851–855.
- Schubert, R.; Herzog, S.; Trenholm, S.; et al. Magnetically guided virus stamping for the targeted infection of single cells or groups of cells. Nat Protoc, 2019, 14, 3205–3219. [Google Scholar] [CrossRef] [PubMed]
- Mawad R, Youssef M, Yousef SM, Abdel-Sattar W, Quantized variability of Earth’s magnetopause distance, J. Modern Trends in Phys. R., 2014, 14, 105–110. [CrossRef]
- Zaporozhan V, Ponomarenko A. Mechanisms of Geomagnetic Field Influence on Gene Expression Using Influenza as a Model System: Basics of Physical Epidemiology. Int. J. Environ. Res. 2010, 7, 938–965. [CrossRef]
- Trebbi G, Borghini F, Lazzarato L, Torrigiani P, Calzoni L, Betti L. Extremely low frequency weak magnetic fields enhance resistance of NN tobacco plants to tobacco mosaic virus and elicit stress-related, Bioelectromagnetics, 2007, 28 214-223. [CrossRef]
- Feulner, G. Are the most recent estimates for Maunder Minimum solar irradiance in agreement with temperature reconstructions? Geophys. Res. Lett., 2011, 38, L16706. [Google Scholar] [CrossRef]
- Friis-Christensen E, Lassen K. Length of the Solar Cycle: An Indicator of Solar Activity Closely Associated with Climate. Science, 1991, 254, 8–700. [CrossRef]
- Laut P, Solar activity and terrestrial climate: an analysis of some purported correlations, JASTP, 65, 801– 812, 2003.
- Damon PE and Laut P, Pattern of Strange Errors Plagues Solar Activity and Terrestrial Climate Data, Eos, Vol. 85, No. 39, 2004.
- Bard E, Frank, M. Climate change and solar variability: What's new under the sun? Earth and Planetary Science Letters, 2006, 248, 1–14. [CrossRef]
- Yousef SM. The solar Wolf-Gleissberg cycle and its influence on the Earth. ICEHM2000, Cairo University, Egypt, 2000, 267- 293.
- Yousef SM. Expected cooling of the Earth and its implications on good security, Bulletin De L. Institute Egypte, Tom LXXX, 2014, 53-82.
- Yousef SM. Solar induced climate changes and cooling of the earth, Conference of Modern Trends in Physics Research, World Scientific, 2011, 296-308. [CrossRef]
- Campuzano SA, De Santis A, Pavon-Carrasco FJ, Osete ML, Qamili E. New perspectives in the study of the Earth’s magnetic field and climate connection: The use of transfer entropy. PLoS ONE 13: e0207270, 2018. [CrossRef]
- Yousef SM. Solar Induced Climate Changes on Millennium, Century and Solar Cycle scales. In Proceedings of the 4th IAGA Symposium, Hurghada, Egypt, 20–24 March 2016; Available online: http://iaga.cu.edu.eg/index.htm.
- Mawad, R. On the correlation between Earth's orbital perturbations and oscillations of sea level and concentration of greenhouse gases, J. Modern Trends in Phys. 2015, 15, 1–9. [Google Scholar] [CrossRef]
- Mawad R. Yousef S, Teama DG, Abdel-Sattar W, The impact of the earth's orbital perturbation on the global warming, AGU 2018 Fall Meeting, 2018. abstract 465021.
- Zhen Li, Jianping Y, Yunfei X, Jian C, Yankai B, Hanqing C. Multiresolution Analysis of the Relationship of Solar Activity, Global Temperatures, and Global Warming, Advances in Meteorology, 2018, 2078057. [CrossRef]
- Yousef SM, Ramy M, Robaa SM, Doaa GT, Moheb M, El-Dine RS, Elfaki H. Right now we are on the Brink of an Ice Age in Europe and America and a Rainy Epoch on the Sahara and Arabia, AGU 2018 Fall Meeting, Washington, 2018, 468811.
- NASA Earth observatory in 1999. https://www.earthobservatory.nasa.gov/features/BOREASAlbedo/albedo_3.php.
- Akasofu, S. On the recovery from the Little Ice Age. Natural Science, 2010, 2, 1211–1224. [Google Scholar] [CrossRef]
- WHO, World Health Organization. Pandemic Influenza Preparedness and Response: A WHO Guidance Document. 2009.
- Shek LP, Lee BW. Epidemiology and seasonality of respiratory tract virus infections in the tropics. Paediatr Respir Rev, 2003, 4: 105–111.
- Viboud C, Alonso WJ, Simonsen L. Influenza in tropical regions. PLoS Med, 2006, 3: e89. [CrossRef]
- CDC Centers for Disease Control and Prevention, How CDC Estimates the Burden of Flu Illness Averted by Vaccination, 2019. https://www.cdc.gov/flu/vaccines-work/how-cdc-estimates.
- Mawad R, Fathy M, Ghamry E. The Simultaneous Influence of the Solar Wind and Earth’s Magnetic Field on the Weather. Universe. 2022; 8:424. [CrossRef]
- Tokars JI, Rolfes MA, Foppa IM, Reed C. An evaluation and update of methods for estimating the number of influenza cases averted by vaccination in the United States. Vaccine, 2018, 36, 7331–7337. [CrossRef]
- Aller JY, Kuznetsova MR, Jahns CJ, Kemp PF. The sea surface microlayer as a source of viral and bacterial enrichment in marine aerosols. J Aerosol Sci., 2005, 30, 801–12. [CrossRef]
- Lowen, AC, Mubareka S, Steel J, Palese P. Influenza Virus Transmission Is Dependent on Relative Humidity and Temperature. PLOS Pathogens, 2007, 3, e151. [CrossRef]
- Pica N, Chou YY, Bouvier NM, Palese P. Transmission of influenza B viruses in the guinea pig. J. Virol, 2012, 86, 4279–4287.
Figure 1.
The lower panel is the sunspot number SSN, blue points are the SSN, and there is a smooth line in the blue line. Pandemic viruses are marked by black and red that occurred during quiet sun and active sun, respectively.
Figure 1.
The lower panel is the sunspot number SSN, blue points are the SSN, and there is a smooth line in the blue line. Pandemic viruses are marked by black and red that occurred during quiet sun and active sun, respectively.
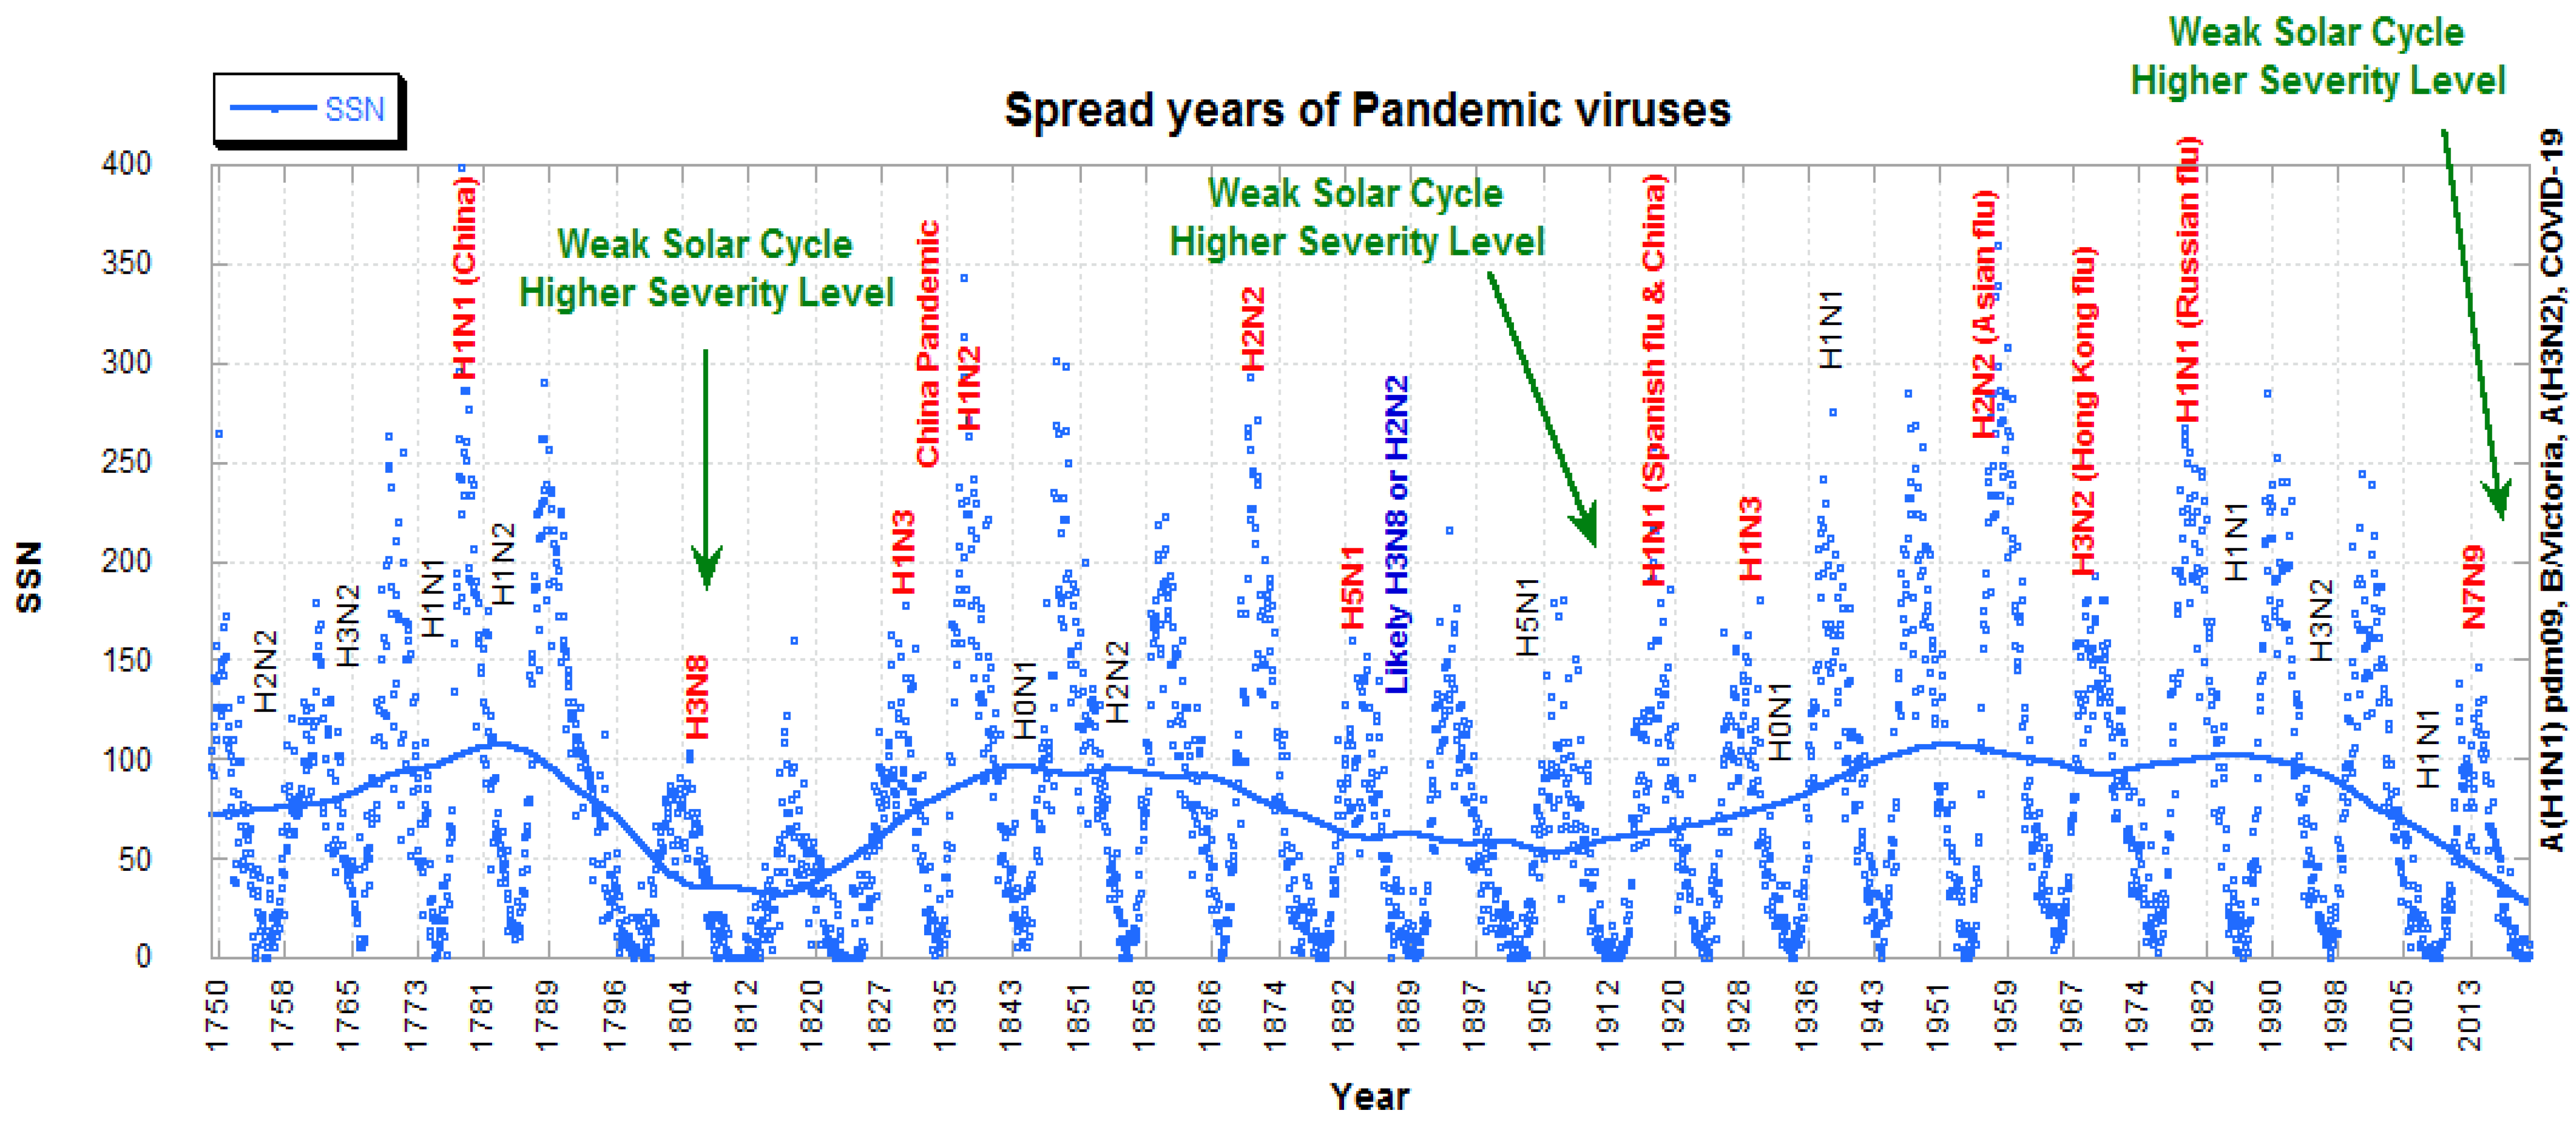
Figure 2.
The monthly time series of the Peak Month of Flu Activity (red line) during the period 1982–1983 through 2017-2018 was obtained from the CDC. It is associated with monthly average values of global weather parameters obtained from ECMWF during the period 1999–2021 as follows. A) the monthly global 2–meter temperature average. B) The monthly global wind speed average C) the average monthly global surface pressure. D) the monthly total global precipitation average.
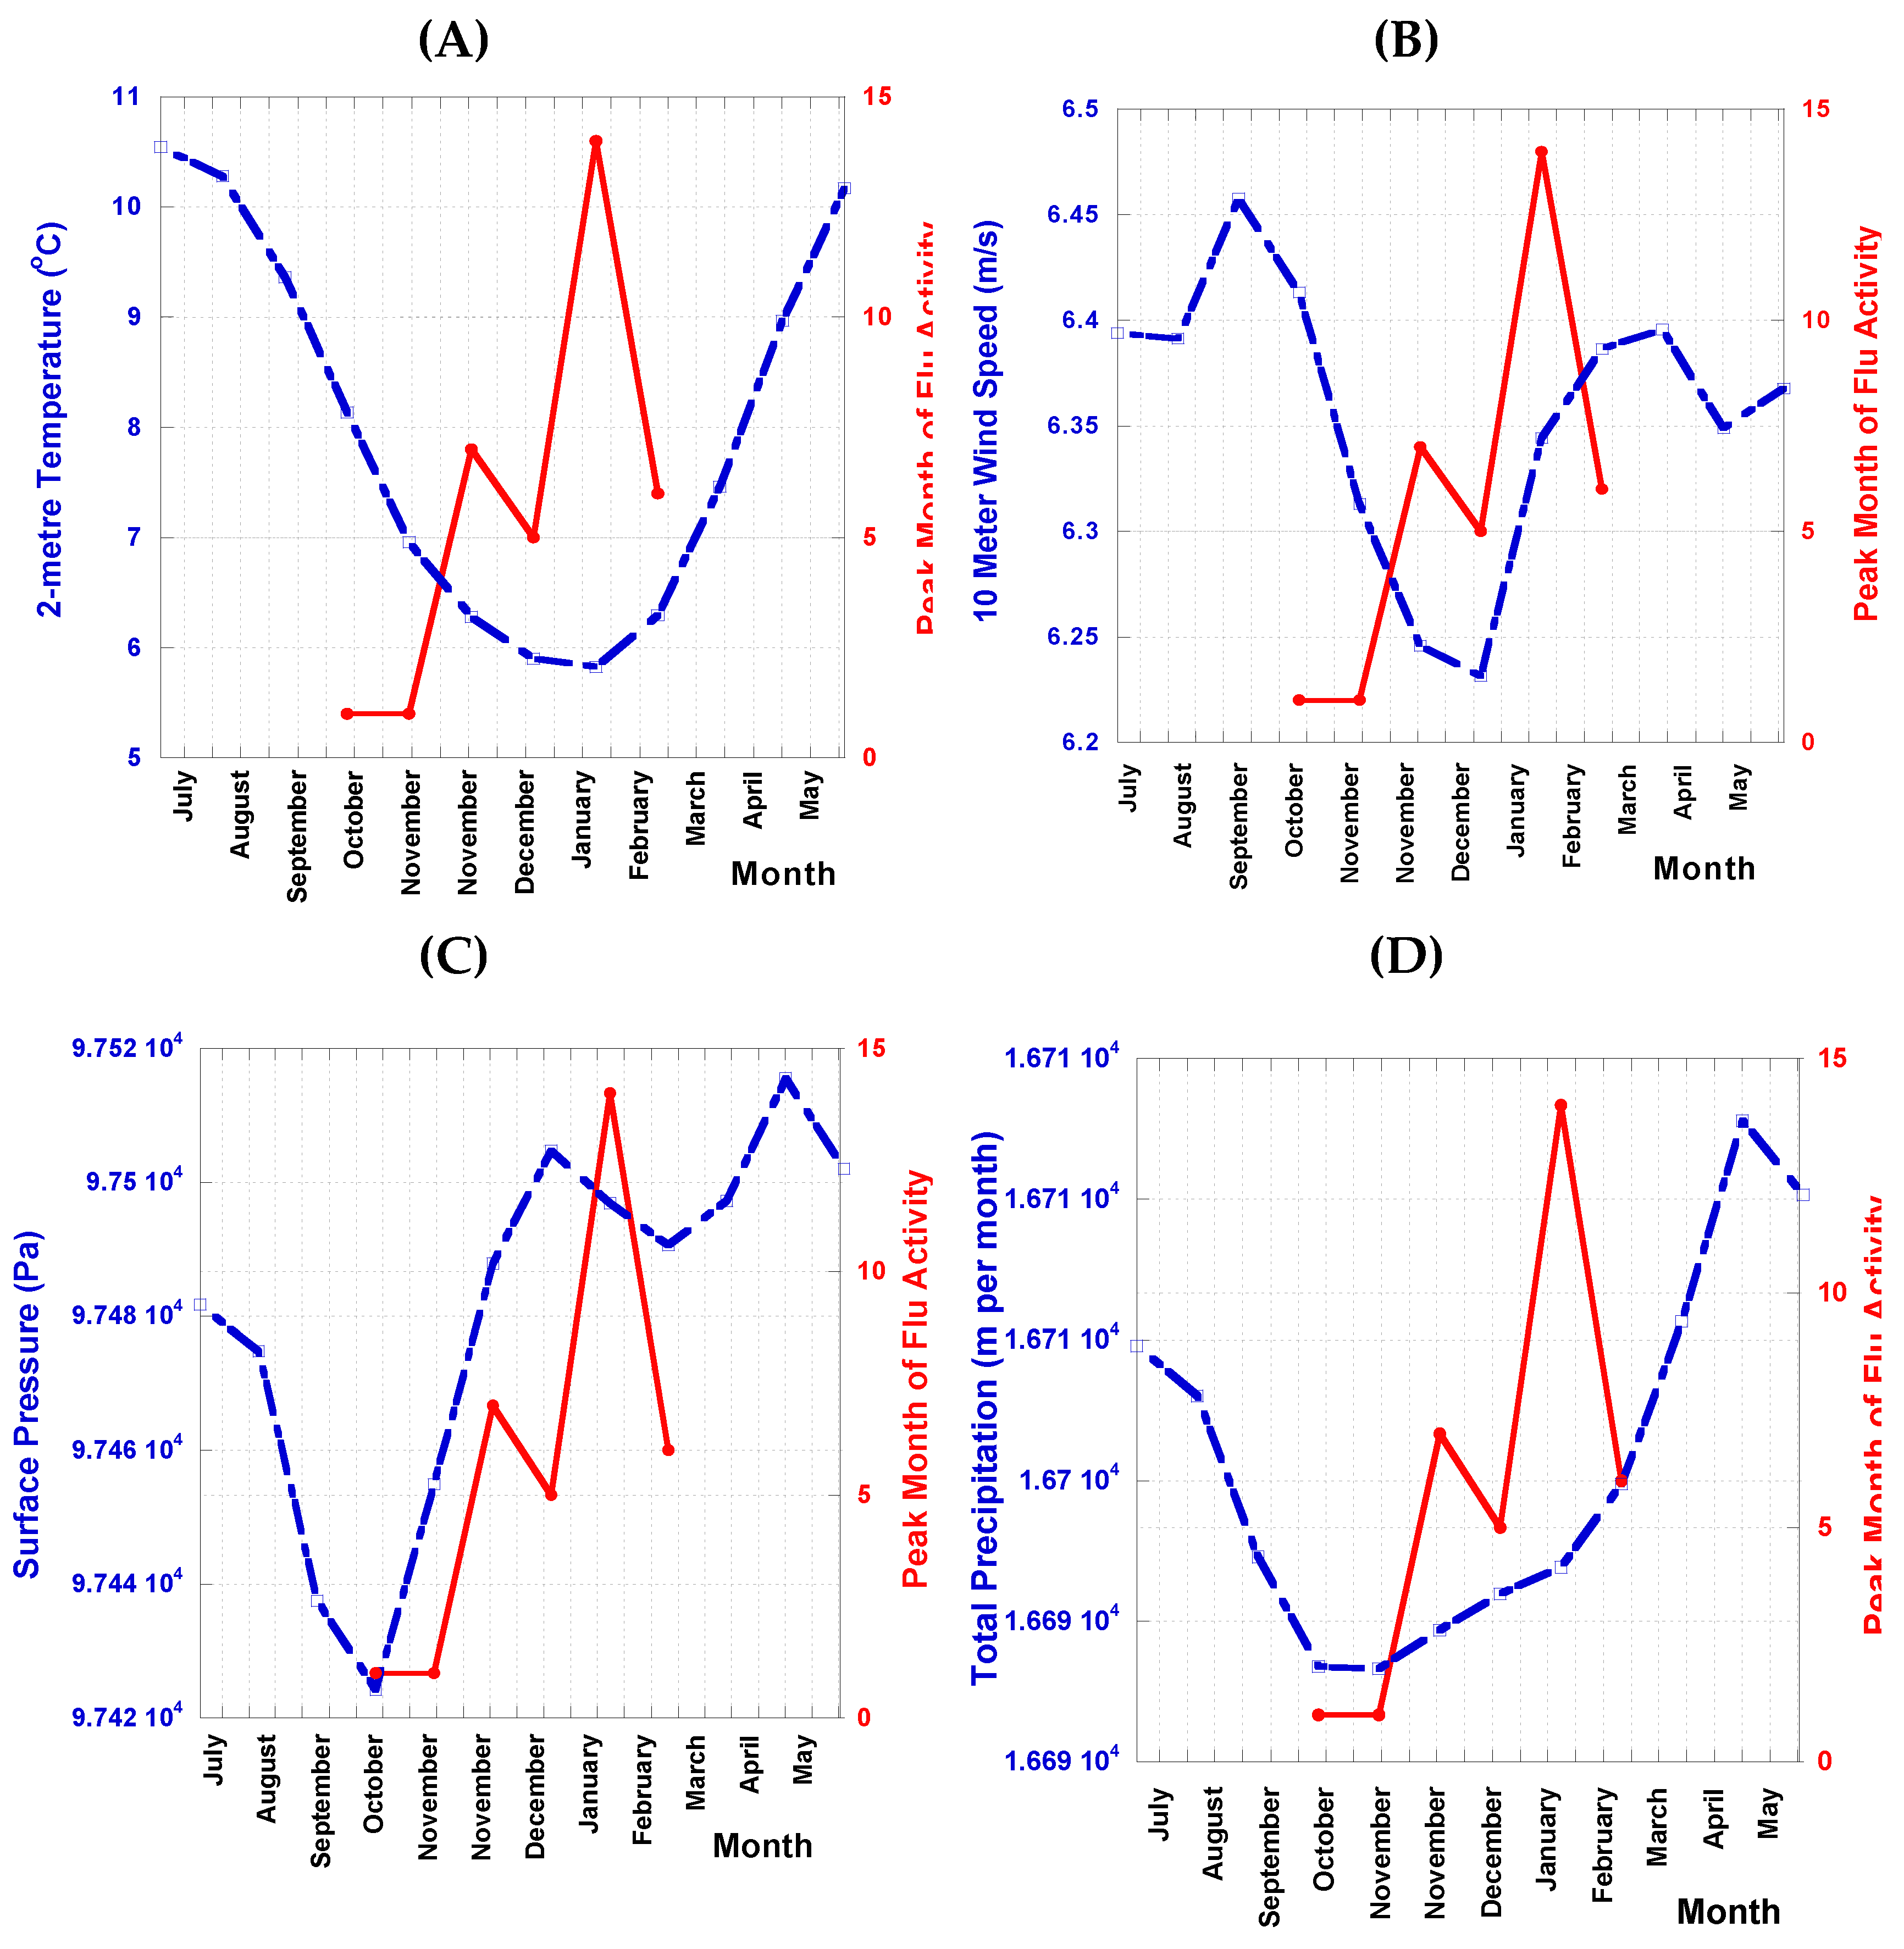

Table 1.
Spread times of pandemic viruses, collected by the authors from historical records and ref. [1,2,7,38]. Solar activity data is collected from concrete data by SILSO, NASA.
| Solar Cycle | Pandemic Infections at quiet Sun | Pandemic Infections at active Sun | Start (Minimum) | Smoothed minimum ISN (start of cycle) | Maximum | Smoothed maximum ISN | Time of Rising (years) | Duration (years) | Spotless days | ||
| Subtype | Year | Subtype | Year | ||||||||
| 1 | H2N2 | 1759 | 1755–02 | 14.0 | 1761–06 | 144 | 6.3 | 11.3 | |||
| 2 | H3N2 | 1767 | 1766–06 | 18.6 | 1769–09 | 193 | 3.3 | 9.0 | |||
| 3 | H1N1 | 1776 | H1N1 | 1781–1782 | 1775–06 | 12.0 | 1778–05 | 264 | 2.9 | 9.3 | |
| 4 | H1N2 | 1791 | 1784–09 | 15.9 | 1788–02 | 235 | 3.4 | 13.6 | |||
| 5 | 1798–04 | 5.3 | 1805–02 | 82 | 6.8 | 12.3 | |||||
| 6 | H3N8 | 1808 | 1810–08 | 0.0 | 1816–05 | 81 | 5.8 | 12.8 | |||
| 7 | H1N3 | 1831 | 1823–05 | 0.2 | 1829–11 | 119 | 6.5 | 10.5 | |||
| 8 | China (winter) | 1830–1833 | H1N2 | 1837 | 1833–11 | 12.2 | 1837–03 | 245 | 3.3 | 9.7 | |
| 9 | H0N1 | 1848 | 1843–07 | 17.6 | 1848–02 | 220 | 4.6 | 12.4 | |||
| 10 | H2N2 | 1858 | 1855–12 | 6.0 | 1860–02 | 186 | 4.2 | 11.3 | 561 | ||
| 11 | H2N2 | 1873 | 1867–03 | 9.9 | 1870–08 | 234 | 3.4 | 11.8 | 942 | ||
| 12 | H5N1 | 1886 | 1878–12 | 3.7 | 1883–12 | 124 | 5.0 | 11.3 | 872 | ||
| 13 | Likely H3N8 or H2N2 | 1889–1890 | 1890–03 | 8.3 | 1894–01 | 147 | 3.8 | 11.8 | 782 | ||
| 14 | H5N1 | 1904 | 1902–01 | 4.5 | 1906–02 | 107 | 4.1 | 11.5 | 1007 | ||
| 15 | H1N1 | 1918–1920 | 1913–07 | 2.5 | 1917–08 | 176 | 4.1 | 10.1 | 640 | ||
| 16 | H1N3 | 1930 | 1923–08 | 9.4 | 1928–04 | 130 | 4.7 | 10.1 | 514 | ||
| 17 | H0N1 | 1935 | 1933–09 | 5.8 | 1937–04 | 199 | 3.6 | 10.4 | 384 | ||
| 18 | 1944–02 | 12.9 | 1947–05 | 219 | 3.3 | 10.2 | 382 | ||||
| 19 | H2N2 | 1957–1958 | 1954–04 | 5.1 | 1958–03 | 285 | 3.9 | 10.5 | 337 | ||
| 20 | H3N2 | 1968–1969 | 1964–10 | 14.3 | 1968–11 | 157 | 4.1 | 11.4 | 285 | ||
| 21 | H1N1 | 1977–1978 | 1976–03 | 17.8 | 1979–12 | 233 | 3.8 | 10.5 | 283 | ||
| 22 | H1N1 | 1991 | 1986–09 | 13.5 | 1989–11 | 214 | 3.2 | 9.9 | 257 | ||
| 23 | H3N2 | 1997 | H5N1 | 2002–2003 | 1996–08 | 11.2 | 2001–11 | 180 | 5.3 | 12.3 | 619 |
| 24 | H1N1 | 2009–2010 | H7N9 | 2015 | 2008–12 | 2.2 | 2014–04 | 116 | 5.3 | In progress | 817 |
| 25 | A(H1N1) pdm09, B/Victoria, A(H3N2),COVID–19 | 2019–2020 | 2020–04 | (3.46 as of August 2019) | |||||||
Table 2.
The periodicity of epidemic viruses.
| Virus subtype | Acronyms name | Repeat times | Spread years | C0 | P | 11-year periodicity | Repeats count at Active Sun |
Spread years |
| H1N1 | 1918 flu pandemic(Spanish flu) | 7 | 1776, 1781. 1918, 1977. 1991, 2009, 2019 | 3 | 6 | Every 12/6 cycles | 1 | 1918–1920 |
| H2N2 | 1889–1890 flu pandemic(Asian flu) (Asiatic influenza) |
5 | 1759, 1858, 1873, 1889, 1957 | 1 | 9 | Very 9 cycles, may repeat/extend after 3 years | 1 | 1957–1958 |
| H3N2 | Influenza A virus(Hong Kong flu) | 4 | 1767, 1968, 1997, 2019 | 2 | 9 | Every 18 cycles, may repeat every 3/2 | 1 | 1968–1969 |
| H5N1 | Influenza A virusAvian influenza Bird flu | 3 | 1886, 1904, 2002 | 12 | 9 | Every 9 cycles | 1 | 2002–2003 |
| H0N1 | 1918 influenzaSpanish flu | 2 | 1848, 1935 | 9 | 8 | Every 8 cycles | ||
| H1N2 | Influenza A virus subtype H1N2 (A/H1N2)(Bird flu) | 2 | 1791, 1837 | 4 | – | Unknown | ||
| H1N3 | influenza A virus subtype H1N1 (A/H1N1)1977 Russian flu pandemic(Spanish flu) | 2 | 1831, 1930 | 7 | 9 | Every 9 cycles | ||
| H3N8 | Influenza A virus(Equine flu) | 2 | 1808, 1889 | 6 | 7 | Every 7 cycles | ||
| H7N9 | Influenza A virus subtype H7N9 (A/H7N9)Avian influenza A H7 viruses(Bird flu virus) | 1 | 2015 | 24 | – | Unknown | 1 | 2015 |
| Victoria | Influenza B virus | 1 | 2019 | 25 | – | Unknown | ||
| Covid-19 | Coronavirus pandemic | 1 | 2019 | 25 | – | Unknown |
Table 3.
Months of flu activity from 2010 to 2020 according to the CDC.
| Flu Season | 2019–2020 | 2018–2019 | 2017– 2018 | 2016–2017 | 2015–2016 | 2014–2015 | 2013–2014 | 2012–2013 | 2011–2012 | 2010–2011 |
| Peak | Mid-February | January and February | Mid-March | Mid-March | Late December | Late December | Late December | Mid-March | Early February | |
| Most common strain | , B/Victoria | H3N2 & H1N1 | (H3N2 | H3N2 | 2009 H1N1 | H3N2 | 2009 H1N1 | H3N2 | H3N2 | H3N2 |
Disclaimer/Publisher’s Note: The statements, opinions and data contained in all publications are solely those of the individual author(s) and contributor(s) and not of MDPI and/or the editor(s). MDPI and/or the editor(s) disclaim responsibility for any injury to people or property resulting from any ideas, methods, instructions or products referred to in the content. 
|
© 2023 by the authors. Licensee MDPI, Basel, Switzerland. This article is an open access article distributed under the terms and conditions of the Creative Commons Attribution (CC BY) license (http://creativecommons.org/licenses/by/4.0/).
Copyright: This open access article is published under a Creative Commons CC BY 4.0 license, which permit the free download, distribution, and reuse, provided that the author and preprint are cited in any reuse.


