Submitted:
18 September 2024
Posted:
18 September 2024
You are already at the latest version
Preprints on COVID-19 and SARS-CoV-2
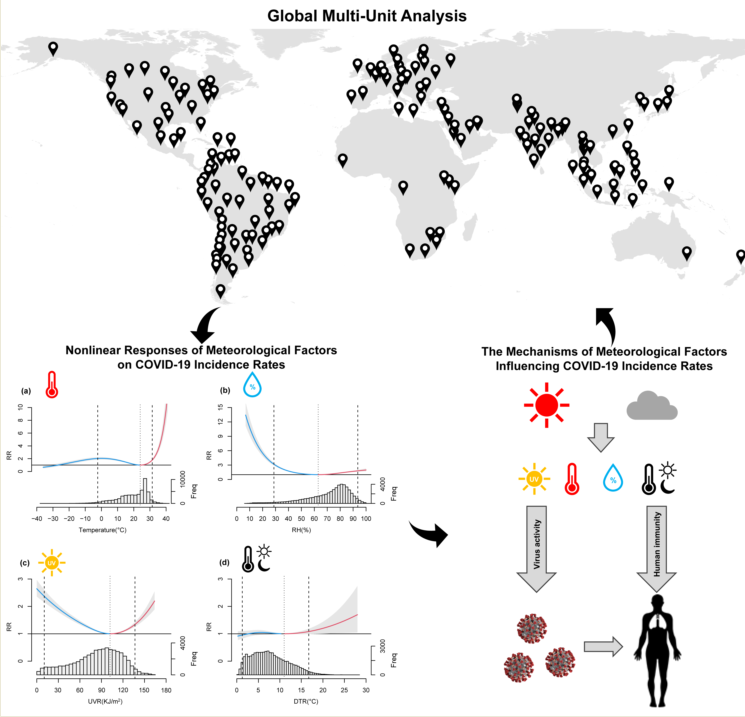
Abstract
The COVID-19 pandemic has significantly impacted human health and daily life. Meteorological factors play a crucial role in virus transmission. Understanding these factors is critical for pandemic control, yet debates continue due to variations in research methods and data. This study uses a global dataset and focuses on administrative units smaller than 10,000 km². The relationship between daily COVID-19 incidence rates and meteorological factors—including temperature, relative humidity (RH), ultraviolet radiation (UVR), and diurnal temperature range (DTR)—was analyzed across 173 units in 62 countries. The results revealed significant nonlinear responses and lag effects between incidence rates and the meteorological factors. Key inflection points were observed at 0°C and 24°C for temperature, 63% for RH, 102 KJ/m² for UVR, and 15°C for DTR. Below 0°C, infection risk increased with rising temperatures; from 0°C to 24°C, risk decreased; and above 24°C, risk escalated rapidly. RH below 63% correlated inversely with infection risk, while above 63%, the correlation was positive. Infection risk decreased with UVR below 102 KJ/m² but increased beyond this threshold. These nonlinear responses are primarily driven by the differential effects of these factors on virus survival, transmission, and human immunity. Conditions around 24°C, 63% RH, 102 KJ/m² UVR, and DTR below 15°C appear optimal for human immunity, correlating with lower infection risk. High temperature and low UVR prompted immediate infection responses, while low temperatures, high UVR, and larger DTR showed delayed effects. These findings provide new, more reliable evidence for understanding the mechanisms driving COVID-19 pandemic dynamics and for preventing the future normalization of the epidemic.
Keywords:
COVID-19
; meteorological factors
; distributed lag nonlinear model (DLNM)
; global
; Nonlinear Response
1. Introduction
The spread of COVID-19 has posed a significant threat to human health and has profoundly impacted the global economy, social order, and international relations. By the end of 2021, over 280 million individuals worldwide had contracted COVID-19, with the death toll surpassing 5.45 million [1]. However, WHO estimates suggest that the total number of deaths directly or indirectly attributable to the COVID-19 pandemic between January 1, 2020, and December 31, 2021, is around 14.9 million [2,3,4]. In May 2023, the WHO declared that COVID-19 no longer constitutes a "Public Health Emergency of International Concern" [5], signaling some easing of the global situation. Nevertheless, localized outbreaks persist, and the pandemic may continue to impact human health and lifestyles for years to come.
Although scientists have developed a relatively comprehensive understanding of COVID-19's biological characteristics, transmission routes, and clinical manifestations, their understanding of the interactions between the pandemic and natural environmental factors remains limited. Since the onset of the pandemic, human and social factors—including population density, hygiene practices, and behavior patterns—have garnered significant attention as major determinants of its spread [6,7,8,9,10]. In the context of globalization, these social factors have profoundly influenced the pandemic's global transmission patterns. In fact, natural environmental factors, especially meteorological factors, also play a crucial and irreplaceable role in the pandemic's occurrence and progression [11,12,13,14,15]. Research indicates that meteorological factors are closely associated to the epidemic patterns of infectious diseases [16,17,18,19,20]. Factors such as temperature, humidity, precipitation, wind speed, and ultraviolet radiation significantly influence pathogen survival, transmission vector activity, and host susceptibility in humans and other animals [21,22,23,24]. These factors also modify outdoor activity patterns, indirectly influencing the spread of the pandemic [22].
During the early stages of the pandemic, numerous studies aimed to explore and elucidate how meteorological factors affect COVID-19 transmission patterns and speed [25,26,27,28]. The motivation for these studies partly stems from historical observations of seasonal patterns in respiratory diseases such as influenza, and from understanding the interactions between other coronaviruses (such as SARS and MERS) and environmental conditions [13,15,29,30]. These studies aim to provide a scientific basis for public health decision-making by analyzing the relationships between meteorological factors and the pandemic.
However, existing studies on the relationship between meteorological factors and COVID-19 transmission often yield inconsistent and sometimes highly controversial findings, particularly concerning temperature, humidity, and ultraviolet radiation(UVR). Temperature can affect the stability and transmissibility of SARS-CoV-2 through various mechanisms, influencing the COVID-19 incidence rates. Early studies suggested that respiratory viruses, including some coronaviruses, tend to be more prevalent in winter, partly because low temperatures extend viral survival in respiratory droplets and reduce human immunity, thereby increasing susceptibility to infection [31]. Although experimental studies confirm that low temperatures can enhance the stability of SARS-CoV-2, and high temperatures may accelerate its inactivation, the relationship between temperature and COVID-19 transmission remains complex. Some studies suggest a negative correlation between temperature and COVID-19 incidence rates in certain regions [32,33,34,35,36], while others have observed outbreaks and transmission even in high temperature tropical areas [37,38,39,40]. Several studies indicate that the relationship between temperature and COVID-19 incidence rates is non-linear, exhibiting varied epidemic patterns across regions and seasons [41,42,43,44]. A large diurnal temperature range(DTR) can impact the immune system, increasing the risk of infection—a pattern also observed in COVID-19 cases [45,46]. Most studies have identified a negative correlation between humidity and COVID-19 incidence rates, as dry air can weaken the human body’s innate immune response, reducing respiratory defense capacity. UVR has a virus-inactivating effect, particularly in outdoor environments. Accordingly, most studies have reported a negative correlation between UVR exposure and COVID-19 incidence rates [47,48,49,50], although some have noted a positive correlation [32]. Research on the effects of wind speed [51], air pressure [52,53], cloud cover [54], and precipitation [52,55] on COVID-19 transmission remains relatively limited, and findings have varied across different regions.
These discrepancies are likely due to multiple factors. The first factor is the choice of study unit size: in many studies, units of analysis are often too large, particularly in global studies where countries are used as the primary units [52,56,57]. This approach can complicate the assignment of meteorological indicators due to substantial environmental variations within each unit. The second factor is the scope of these studies: some focus on a single country or province [33,37,58], while others concentrate on specific regions [59,60,61]. Variations in climate types, population density, and hygiene conditions across regions may differentially influence the spread of the pandemic, contributing to inconsistent findings. The third factor is insufficient data representativeness: even when smaller units, such as cities, are selected globally [32,41], issues like an inadequate number of data points or uneven distribution persist, affecting the overall validity of study results. At the city or regional level, sparse data can result in misunderstandings or overgeneralizations about the relationship between the pandemic and meteorological factors. Furthermore, some studies consider lag and cumulative effects, while others do not; some apply nonlinear models, whereas most depend on linear models.
To address these challenges, we integrated data from multiple sources and chose study units (cities, counties, or countries smaller than 10,000 km²) to maximize research scope and ensure an even spatial distribution. We ultimately chose 173 units across 62 countries globally (covering six continents and four climate zones) and utilized the DLNM to analyze the relationship between daily COVID-19 incidence rates and meteorological factors, incorporating both lag and cumulative effects. This study aims to provide new insights into the factors and mechanisms driving COVID-19 transmission, thereby contributing to more effective pandemic prevention strategies and mitigation of future epidemics.
2. Materials and Methods
2.1. Study Area and Period
To minimize statistical errors arising from the discrepancy between the number of confirmed COVID-19 cases and meteorological indicators in overly large administrative units, we selected study units smaller than 10,000 km², such as countries, regions, states, provinces, counties, or cities. Additionally, to mitigate extreme fluctuations in daily reported COVID-19 cases in sparsely populated areas and ensure a more uniform distribution of study units, we further selected units with larger populations that more accurately represent their regions. In total, 173 units were selected across 62 countries worldwide (Figure 1 and Supplementary Materials Table S1). Given that the pandemic had only just begun in 2020, global control measures were neither timely nor effective, making the spread of COVID-19 more susceptible to natural factors. Furthermore, because the pandemic had not yet spread globally during the first two months of 2020, we selected the period from March 1, 2020, to February 28, 2021, to encompass a full seasonal cycle as comprehensively as possible.
2.2. Data Collection
Data on confirmed COVID-19 cases were aggregated from multiple sources: the COVID-19 Open Dataset (COD) [62], the Unified Environment-Epidemiology Database from Johns Hopkins University Center for Systems Science and Engineering (JHU CSSE)[63], and official public health records from various countries. The COD and JHU datasets provide epidemiological data for 232 and 191 countries or regions, respectively, including state- and provincial-level data for 62 and 27 countries or regions, and city- and county-level data for 23 and 9 countries or regions. Given the differences in time series length for new confirmed cases and population sizes among countries, we utilized all available data within the selected period, normalized by population size, to calculate daily incidence rates. The meteorological data were sourced from the European Centre for Medium-Range Weather Forecasts (ECMWF) Fifth Generation Atmospheric Reanalysis Dataset (ERA5), which has a grid resolution of 0.25×0.25° [64].
2.3. Methods
Meteorological factors often exert a lagged effect on health outcomes. Given the typical 1-14 day incubation period of COVID-19, along with an additional 1-7 day delay from symptom onset to reporting, it is essential to analyze the lagged effects of meteorological factors on COVID-19 incidence rates. Traditional time-series models typically account for impacts within a specific timeframe; however, merely including exposure levels over consecutive days without considering lagged effects can result in high collinearity and biased outcomes. To address this issue, the Distributed Lag Nonlinear Model (DLNM)—an extension of the generalized additive model—uses cross-basis functions to represent the distribution of the dependent variable across both exposure and lag dimensions. The DLNM comprehensively evaluates both the lagged and nonlinear effects of exposure factors, providing a more robust framework for analyzing the impact of meteorological factors on COVID-19 transmission dynamics [65]. The model is formulated as follows:
In formula (1), a time-series quasi-Poisson regression model is employed to estimate the associations between incidence rates and meteorological factors, expressed as relative risk (RR). In the model, logYt denotes the logarithmic transformation of the daily COVID-19 incidence rate on day t; cb() represents cross-basis functions; Xt indicates the value of meteorological factors on day t; lag signifies the maximum lag period, which is set to 14 days; vardf and lagdf represent the degrees of freedom for the spline and lagged spline functions, respectively, both set to 3; fun represents the natural cubic spline function, and ns() denotes natural cubic splines. Datet reflects the length of the time series for each region, used to capture daily fixed effects, while df represents the degrees of freedom for the time trend, set to 7. Regioni represents categorical variables for different regions to account for random effects, while Dow captures day-of-week effects, indicating the influence of different weekdays. Sensitivity analyses were performed to evaluate the robustness of these modeling choices.
For these statistical analyses, R version 4.2.1 was used, and the DLNM was constructed using the 'dlnm' package.
3. Results
3.1. Descriptive Analysis
Table 1 provides the descriptive statistics of COVID-19 incidence rates and meteorological factors across the 173 study units from March 1, 2020, to February 28, 2021. The highest cumulative incidence rate was observed in Boa Vista, Brazil (217,288.7 cases per million), and the lowest in Taiwan, China (3.1 cases per million). The highest daily incidence rate was recorded in Curitiba, Brazil, on December 16, 2020 (8,184.2 cases per million). The study regions span 114 degrees of latitude and 325 degrees of longitude, with elevations ranging from -2 m to 2,850 m, and encompass a wide range of climate types, from tropical to polar and humid to arid. Temperature ranges from -36.1°C to +41.2°C, relative humidity (RH) from 6.9% to 100%, DTR from 0.2°C to 28.1°C, daily precipitation from 0 mm to 410 mm, UVR from 0.4 KJ/m² to 164.8 KJ/m², surface pressure from 72.9 kPa to 104.1 kPa, wind speed from 0.3 m/s to 13.8 m/s, and cloud cover from 0% to 100%. The extensive geographic and climatic diversity of the analyzed regions enhances the representativeness and reliability of the study findings.
3.2. Nonlinear Relationships and Lagged Effects between COVID-19 Transmission and Meteorological Factors
The model results showed that temperature, RH, UVR, and DTR provided a better model fit compared to other factors, which exhibited a lower fit. Therefore, subsequent analyses will focus on these four variables. Figure 1 depicts the cumulative lagged exposure-response curves between temperature, RH, UVR, DTR, and incidence rates, emphasizing the reference values for each variable (temperature at 24°C, RH at 63%, UVR at 102 KJ/m², and DTR at 11°C) and their critical values under extreme conditions. The results indicated that, within a 14-day lag period, temperature had two inflection points for COVID-19 incidence rates: 0°C and 24°C. At extremely low temperatures, the risk of COVID-19 infection was minimized; as temperature increased, the risk rose gradually, peaking at 0°C. As temperature continued to increase, the risk declined, reaching a trough at 24°C. Beyond 24°C, the risk of infection escalated rapidly with further temperature increases (Figure 2a). For RH below 63%, the infection risk was inversely correlated with RH, decreasing rapidly as RH increased and reaching a minimum at 63%. When RH exceeded 63%, the risk of infection gradually increased with further increases in RH (Figure 2b). For UVR below 102 KJ/m², the risk of infection decreased as UVR increased. However, when UVR exceeded 102 KJ/m², the risk of infection rose with further increases in UVR, reaching its minimum at 102 KJ/m² (Figure 2c). The DTR showed two inflection points (6°C and 11°C). The overall risk of infection remained lower when DTR was below 15°C; however, once DTR exceeded 15°C, the risk of COVID-19 infection increased in tandem with DTR (Figure 2d).
Figure 3 presents the exposure-lag-response contour plots for the four factors, demonstrating the exposure-response relationships across different lag periods and the lag-response relationships at the 2.5% and 97.5% percentiles of the meteorological variables (temperature: -2°C and 31°C, RH: 29% and 94%, UVR: 10 KJ/m² and 136 KJ/m², DTR: 1°C and 17°C). These plots reflected the impact of lag periods on infection risk under extreme conditions. The results indicated: (1) Temperature: Under low temperature conditions (-40°C to 10°C), the RR gradually increased with the length of the lag period, peaking at a 14-day lag. In contrast, under high temperature conditions (above 30°C), the RR decreased with increasing lag time. (2) RH: For both high and low RH conditions, the RR reached its lowest point at a 7-day lag and its highest points at 0-day and 14-day lags. (3) UVR: Under low UVR conditions (<30 KJ/m²), the RR decreased as lag time increased. Conversely, under moderate (50-100 KJ/m²) and high UVR conditions (>120 KJ/m²), the RR increased with longer lag times. (4) DTR: Regardless of whether the DTR was large or small, the RR consistently increased with the length of the lag period.
4. Discussion
The analysis indicated that the risk of COVID-19 infection was lowest at 24°C. As temperatures deviated from this value, either increasing or decreasing, the risk rose, with a critical threshold at 0°C. Below 0°C, the risk gradually decreased, reaching its lowest point at temperatures below -25°C, which was even lower than the risk at 24°C. These findings are consistent with those reported by Yuan et al. [43], Lyu et al. [66], and Pan et al. [67]. Our study also found that high temperatures had an immediate effect on COVID-19 incidence, while low temperatures exhibited a delayed impact. Studies on temperature-related health effects show that high temperatures typically influence outcomes within a few days, whereas low temperatures can have effects lasting 3 to 4 weeks [68,69,70]. The impact of temperature on COVID-19 transmission can be explained from several perspectives. First, temperature influences the survival and release of viruses. Experimental studies have demonstrated that SARS-CoV-2 is more stable in cold conditions but becomes more sensitive to high temperatures [23]. Another study found that coronaviruses are inactivated more rapidly at 20°C than at 4°C [30]. Moreover, research indicates that SARS-CoV-2 can survive for up to one hour at 60°C and requires 15 minutes at 92°C (near boiling point) for complete inactivation [71]. Second, temperature can affect the human immune system. Low temperatures weaken immune cell function in the respiratory tract by reducing blood supply, while high temperatures can inhibit CD8 T cell responses and antibody production, leading to decreased immunity [31]. Finally, temperature affects human behavior, particularly mobility and indoor time. Both extreme heat and cold can increase the time spent indoors, thereby facilitating the spread of SARS-CoV-2 [72]. The factors driving changes in COVID-19 incidence under varying temperature conditions differ. In low temperature conditions, the virus survives more easily, heightening the risk of infection. In high temperature settings, although the virus's activity and survival time are diminished, the reduced adaptive immune response in high temperatures [71] may increase the risk of infection. Thus, when temperatures exceed 24°C, the risk of COVID-19 infection increases with rising temperatures, primarily due to the associated decrease in immunity. Additionally, in extreme cold conditions (below -25°C), reduced opportunities for social interaction inhibit the spread of COVID-19, contributing to the observed low infection risk in such conditions.
The analysis of DTR indicated that the risk of infection was lower when DTR was small but increased with longer lag periods as DTR became larger. This pattern may be due to consecutive days of large DTR inducing greater physiological stress, leading to increased secretion of stress hormones like cortisol. Prolonged exposure to elevated levels of these stress hormones can suppress immune cell function and weaken immunity [73,74], thereby potentially increasing the risk of COVID-19 infection.
RH showed a threshold effect at 63% regarding COVID-19 incidence rates, with elevated infection risk occurring in both high and low RH conditions, but more pronounced in low RH. Possible mechanisms include: dry air compromising the mucociliary clearance of the respiratory tract by reducing the capacity of ciliated cells to secrete mucus and remove viral particles, thereby weakening respiratory defenses [31]; increased aerosol content during dry seasons [75], given that aerosols are a significant transmission route for COVID-19 [76,77,78]; low humidity causing evaporation that forms floating droplets, which enhance aerosol particle aggregation and increase the risk of viral inhalation [21,69]; and high humidity hindering heat dissipation, raising body temperature, affecting physiological functions, and potentially fostering the growth and spread of certain pathogens, thereby lowering immune response. Additionally, multiple experimental studies indicate that both enveloped and non-enveloped viruses are most efficiently inactivated under moderate humidity conditions [79,80,81], likely due to the accumulation of chemical substances in aerosols under these conditions, which disrupt the structural and functional integrity of viruses, resulting in their inactivation [82].
Although most studies suggest a negative correlation between UVR and COVID-19 transmission, our study found that when UVR exceeded 102 KJ/m², the risk of infection increased as UVR levels rise further. This trend could be associated with the harmful effects of high-intensity UVR on the immune system. Although moderate UVR conditions is beneficial to health, excessive exposure in high UVR conditions may intensify the negative impact of UVR on the immune system, potentially raising the risk of COVID-19 infection [83]. Furthermore, the effect of low UVR appeared to be immediate, while the impact of high UVR showed a delayed response. This suggests that UVR levels below 102 KJ/m² primarily exert a virucidal effect, whereas levels above 102 KJ/m² may begin to harm immune function.
To ensure the robustness of the results, we conducted a sensitivity analysis. Model parameters were set based on the Akaike Information Criterion (AIC) to avoid overfitting or omitting important information. Several trials were conducted, and the results showed that adjusting the spline and lag degrees of freedom for meteorological variables (within the range of 3-10) did not significantly alter the exposure-response relationship, model fit, or AIC values. Additionally, adjustments to the degrees of freedom for time trends (3-14) yielded consistent results.
5. Conclusions
COVID-19 infection risk exhibits significant nonlinear responses and lag effects to temperature, RH, UVR, and DTR. The relationship curves between COVID-19 infection risk and these factors reveal one to two inflection points (temperature: 0°C and 24°C; RH: 63%; UVR: 102 KJ/m²; DTR: 6°C and 11°C). At extreme low temperature, around 24°C, RH around 63%, UVR around 102 KJ/m², and smaller DTR, the risk of COVID-19 infection is lower. The infection risk response to these factors varies across different ranges. Below 0°C, the infection risk rises with temperature; between 0°C and 24°C, the risk decreases as temperature increases; above 24°C, the risk rapidly escalates with rising temperatures. When RH is below 63%, infection risk is negatively correlated with RH; when above 63%, it is positively correlated, with the lowest risk around 63%. At UVR levels below 102 KJ/m², infection risk declines as UVR increases; above 102 KJ/m², it rises with further UVR increases, with the lowest risk at 102 KJ/m². A DTR below 15°C is generally associated with lower infection risk; above 15°C, the risk increases as the DTR widens. These nonlinear responses are linked to the varying effects of these factors on virus survival, transmission, and human immunity. temperatures around 24°C, RH near 63%, UVR around 102 KJ/m², and DTR below 15°C represent conditions closer to the optimal range for human immunity and are therefore associated with a lower COVID-19 infection risk. The response of COVID-19 incidence to high temperatures and low UVR is immediate, whereas the responses to low temperatures, high UVR, and extreme DTR exhibit some degree of lag.
This study has limitations. Given the considerable climatic variations across global regions, further in-depth and systematic investigations are necessary to better understand the relationships between meteorological factors and incidence rates across various climate zones.
Supplementary Materials
The following supporting information can be downloaded at the website of this paper posted on Preprints.org. Detailed information on raw data is shown in the supplement (Tables S1).
Author Contributions
H.Z.: Writing–Original draft, Methodology, Software, Data curation, Visualization. J.W.: Conceptualization, Funding acquisition, Project administration, Supervision. Z.L: Writing–review and editing, Validation. All authors have read and agreed to the published version of the manuscript.
Funding
This research was funded by Jiangsu Center for Collaborative Innovation in Geographical Information Resource Development and Postgraduate Research & Practice Innovation Program of Jiangsu Province, grant number KYCX23_1711.
Data Availability Statement
The raw data supporting the conclusions of this article will be made available by the authors on request.
Conflicts of Interest
The authors declare no conflicts of interest.
References
- WHO. 2024. Available online: https://data.who.int/dashboards/covid19/cases (accessed on 30 August 2024).
- WHO. 2022. Available online: https://www.who.int/news/item/05-05-2022-14.9-million-excess-deaths-were-associated-with-the-covid-19-pandemic-in-2020-and-2021 (accessed on 30 August 2024).
- Adam, D. The Pandemic’s True Death Toll: Millions More than Official Counts. Nature 2022, 601, 312–315. [CrossRef]
- Wang, H.; Paulson, K. R.; Pease, S. A.; Watson, S.; Comfort, H.; Zheng, P.; Aravkin, A. Y.; Bisignano, C.; Barber, R. M.; Alam, T.; et al. Estimating Excess Mortality Due to the COVID-19 Pandemic: A Systematic Analysis of COVID-19-Related Mortality, 2020–21. The Lancet 2022, 399, 1513–1536. [CrossRef]
- WHO. 2023. Available online: https://www.who.int/director-general/speeches/detail/who-director-general-s-opening-remarks-at-the-media-briefing---5-may-2023 (accessed on 30 August 2024).
- Matteson, N. L.; Hassler, G. W.; Kurzban, E.; Schwab, M. A.; Perkins, S. A.; Gangavarapu, K.; Levy, J. I.; Parker, E.; Pride, D.; Hakim, A.; et al. Genomic Surveillance Reveals Dynamic Shifts in the Connectivity of COVID-19 Epidemics. Cell 2023, 186, 5690-5704.e20. [CrossRef]
- Li, Y.; Campbell, H.; Kulkarni, D.; Harpur, A.; Nundy, M.; Wang, X.; Nair, H. The Temporal Association of Introducing and Lifting Non-Pharmaceutical Interventions with the Time-Varying Reproduction Number (R) of SARS-CoV-2: A Modelling Study across 131 Countries. Lancet Infect. Dis. 2021, 21, 193–202. [CrossRef]
- Flaxman, S.; Mishra, S.; Gandy, A.; Unwin, H. J. T.; Mellan, T. A.; Coupland, H.; Whittaker, C.; Zhu, H.; Berah, T.; Eaton, J. W.; et al. Estimating the Effects of Non-Pharmaceutical Interventions on COVID-19 in Europe. Nature 2020, 584, 257–261. [CrossRef]
- Hsiang, S.; Allen, D.; Annan-Phan, S.; Bell, K.; Bolliger, I.; Chong, T.; Druckenmiller, H.; Huang, L. Y.; Hultgren, A.; Krasovich, E.; et al. The Effect of Large-Scale Anti-Contagion Policies on the COVID-19 Pandemic. Nature 2020, 584, 262–267. [CrossRef]
- Li, M.; Zhang, Z.; Cao, W.; Liu, Y.; Du, B.; Chen, C.; Liu, Q.; Uddin, Md. N.; Jiang, S.; Chen, C.; et al. Identifying Novel Factors Associated with COVID-19 Transmission and Fatality Using the Machine Learning Approach. Sci. Total Environ. 2021, 764, 142810. [CrossRef]
- Chen, Y.; Xu, Y.; Wang, L.; Liang, Y.; Li, N.; Lourenço, J.; Yang, Y.; Lin, Q.; Wang, L.; Zhao, H.; et al. Indian Ocean Temperature Anomalies Predict Long-Term Global Dengue Trends. Science 2024, 384, 639–646. [CrossRef]
- Chan, K. H.; Peiris, J. S. M.; Lam, S. Y.; Poon, L. L. M.; Yuen, K. Y.; Seto, W. H. The Effects of Temperature and Relative Humidity on the Viability of the SARS Coronavirus. Adv. Virol. 2011, 2011. [CrossRef]
- Gardner, E. G.; Kelton, D.; Poljak, Z.; Van Kerkhove, M.; von Dobschuetz, S.; Greer, A. L. A Case-Crossover Analysis of the Impact of Weather on Primary Cases of Middle East Respiratory Syndrome. BMC Infect. Dis. 2019, 19, 113. [CrossRef]
- Tamerius, J. D.; Shaman, J.; Alonso, W. J.; Bloom-Feshbach, K.; Uejio, C. K.; Comrie, A.; Viboud, C. Environmental Predictors of Seasonal Influenza Epidemics across Temperate and Tropical Climates. PLOS Pathog. 2013, 9, e1003194. [CrossRef]
- Sooryanarain, H.; Elankumaran, S. Environmental Role in Influenza Virus Outbreaks. Annu. Rev. Anim. Biosci. 2015, 3, 347–373. [CrossRef]
- Li, C.; Wu, X.; Ji, D.; Liu, J.; Yin, J.; Guo, Z. Climate Change Impacts the Epidemic of Dysentery: Determining Climate Risk Window, Modeling and Projection. Environ. Res. Lett. 2019, 14, 104019. [CrossRef]
- Tian, H.-Y.; Bi, P.; Cazelles, B.; Zhou, S.; Huang, S.-Q.; Yang, J.; Pei, Y.; Wu, X.-X.; Fu, S.-H.; Tong, S.-L.; et al. How Environmental Conditions Impact Mosquito Ecology and Japanese Encephalitis: An Eco-Epidemiological Approach. Environ. Int. 2015, 79, 17–24. [CrossRef]
- Liu, J.; Wu, X.; Li, C.; Zhou, S. Decline in Malaria Incidence in a Typical County of China: Role of Climate Variance and Anti-Malaria Intervention Measures. Environ. Res. 2018, 167, 276–282. [CrossRef]
- Yin, J.; Gongsang, Q.; Wang, L.; Li, C.; Wu, X. Identification of Vulnerable Populations and Knowledge, Attitude, and Practice Analysis of Echinococcosis in Tibet Autonomous Region of China. Environ. Res. 2020, 190, 110061. [CrossRef]
- Kim, S. W.; Ramakrishnan, M. A.; Raynor, P. C.; Goyal, S. M. Effects of Humidity and Other Factors on the Generation and Sampling of a Coronavirus Aerosol. Aerobiologia 2007, 23, 239–248. [CrossRef]
- Zhao, L.; Qi, Y.; Luzzatto-Fegiz, P.; Cui, Y.; Zhu, Y. COVID-19: Effects of Environmental Conditions on the Propagation of Respiratory Droplets. Nano Lett. 2020, 20, 7744–7750. [CrossRef]
- Matson, M. J.; Yinda, C. K.; Seifert, S. N.; Bushmaker, T.; Fischer, R. J.; van Doremalen, N.; Lloyd-Smith, J. O.; Munster, V. J. Effect of Environmental Conditions on SARS-CoV-2 Stability in Human Nasal Mucus and Sputum. Emerg. Infect. Dis. 2020, 26, 2276–2278. [CrossRef]
- Chin, A. W. H.; Chu, J. T. S.; Perera, M. R. A.; Hui, K. P. Y.; Yen, H.-L.; Chan, M. C. W.; Peiris, M.; Poon, L. L. M. Stability of SARS-CoV-2 in Different Environmental Conditions. The Lancet Microbe 2020, 1, e10. [CrossRef]
- Sagripanti, J.-L.; Lytle, C. D. Estimated Inactivation of Coronaviruses by Solar Radiation With Special Reference to COVID-19. Photochem. Photobiol. 2020, 96, 731–737. [CrossRef]
- Iqbal, N.; Fareed, Z.; Shahzad, F.; He, X.; Shahzad, U.; Lina, M. The Nexus between COVID-19, Temperature and Exchange Rate in Wuhan City: New Findings from Partial and Multiple Wavelet Coherence. Sci. Total Environ. 2020, 729, 138916. [CrossRef]
- Pequeno, P.; Mendel, B.; Rosa, C.; Bosholn, M.; Souza, J. L.; Baccaro, F.; Barbosa, R.; Magnusson, W. Air Transportation, Population Density and Temperature Predict the Spread of COVID-19 in Brazil. PeerJ 2020, 8, e9322. [CrossRef]
- Xie, J.; Zhu, Y. Association between Ambient Temperature and COVID-19 Infection in 122 Cities from China. Sci. Total Environ. 2020, 724, 138201. [CrossRef]
- Cherrie, M.; Clemens, T.; Colandrea, C.; Feng, Z.; Webb, D. J.; Dibben, C.; Weller, R. B. Ultraviolet A Radiation and COVID-19 Deaths: A Multi Country Study. medRxiv 2020. [CrossRef]
- Dai, Q.; Ma, W.; Huang, H.; Xu, K.; Qi, X.; Yu, H.; Deng, F.; Bao, C.; Huo, X. The Effect of Ambient Temperature on the Activity of Influenza and Influenza like Illness in Jiangsu Province, China. Sci. Total Environ. 2018, 645, 684–691. [CrossRef]
- Chan, K. H.; Peiris, J. S. M.; Lam, S. Y.; Poon, L. L. M.; Yuen, K. Y.; Seto, W. H. The Effects of Temperature and Relative Humidity on the Viability of the SARS Coronavirus. Adv. Virol. 2011, 2011, 734690. [CrossRef]
- Moriyama, M.; Hugentobler, W. J.; Iwasaki, A. Seasonality of Respiratory Viral Infections. Annu. Rev. Virol. 2020, 7, 83–101. [CrossRef]
- Nottmeyer, L.; Armstrong, B.; Lowe, R.; Abbott, S.; Meakin, S.; O’Reilly, K. M.; von Borries, R.; Schneider, R.; Royé, D.; Hashizume, M.; et al. The Association of COVID-19 Incidence with Temperature, Humidity, and UV Radiation – A Global Multi-City Analysis. Sci. Total Environ. 2023, 854, 158636. [CrossRef]
- Yin, C.; Zhao, W.; Pereira, P. Meteorological Factors’ Effects on COVID-19 Show Seasonality and Spatiality in Brazil. Environ. Res. 2022, 208, 112690. [CrossRef]
- Sobral, M. F. F.; Duarte, G. B.; da Penha Sobral, A. I. G.; Marinho, M. L. M.; de Souza Melo, A. Association between Climate Variables and Global Transmission of SARS-CoV-2. Sci. Total Environ. 2020, 729, 138997. [CrossRef]
- Liu, J.; Zhou, J.; Yao, J.; Zhang, X.; Li, L.; Xu, X.; He, X.; Wang, B.; Fu, S.; Niu, T.; et al. Impact of Meteorological Factors on the COVID-19 Transmission: A Multi-City Study in China. Sci. Total Environ. 2020, 726, 138513. [CrossRef]
- Shahzad, F.; Shahzad, U.; Fareed, Z.; Iqbal, N.; Hashmi, S. H.; Ahmad, F. Asymmetric Nexus between Temperature and COVID-19 in the Top Ten Affected Provinces of China: A Current Application of Quantile-on-Quantile Approach. Sci. Total Environ. 2020, 736, 139115. [CrossRef]
- Karim, R.; Akter, N. Effects of Climate Variables on the COVID-19 Mortality in Bangladesh. Theor. Appl. Climatol. 2022, 150, 1463–1475. [CrossRef]
- Babu, S. R.; Rao, N. N.; Kumar, S. V.; Paul, S.; Pani, S. K. Plausible Role of Environmental Factors on COVID-19 Transmission in the Megacity Delhi, India. Aerosol Air Qual. Res. 2020, 20, 2075–2084. [CrossRef]
- Colston, J. M.; Hinson, P.; Nguyen, N.-L. H.; Chen, Y. T.; Badr, H. S.; Kerr, G. H.; Gardner, L. M.; Martin, D. N.; Quispe, A. M.; Schiaffino, F.; et al. Effects of Hydrometeorological and Other Factors on SARS-CoV-2 Reproduction Number in Three Contiguous Countries of Tropical Andean South America: A Spatiotemporally Disaggregated Time Series Analysis. IJID Regions 2023, 6, 29–41. [CrossRef]
- Ogaugwu, C.; Mmaduakor, C.; Adewale, O. Association of Meteorological Factors With COVID-19 During Harmattan in Nigeria. Environ. Health Insights 2023, 17, 11786302231156298. [CrossRef]
- Sera, F.; Armstrong, B.; Abbott, S.; Meakin, S.; O’Reilly, K.; von Borries, R.; Schneider, R.; Royé, D.; Hashizume, M.; Pascal, M.; et al. A Cross-Sectional Analysis of Meteorological Factors and SARS-CoV-2 Transmission in 409 Cities across 26 Countries. Nat. Commun. 2021, 12, 5968. [CrossRef]
- Yuan, J.; Wu, Y.; Jing, W.; Liu, J.; Du, M.; Wang, Y.; Liu, M. Non-Linear Correlation between Daily New Cases of COVID-19 and Meteorological Factors in 127 Countries. Environ. Res. 2021, 193, 110521. [CrossRef]
- Yuan, J.; Wu, Y.; Jing, W.; Liu, J.; Du, M.; Wang, Y.; Liu, M. Association between Meteorological Factors and Daily New Cases of COVID-19 in 188 Countries: A Time Series Analysis. Sci. Total Environ. 2021, 780, 146538. [CrossRef]
- Guo, C.; Bo, Y.; Lin, C.; Li, H. B.; Zeng, Y.; Zhang, Y.; Hossain, M. S.; Chan, J. W. M.; Yeung, D. W.; Kwok, K.; et al. Meteorological Factors and COVID-19 Incidence in 190 Countries: An Observational Study. Sci. Total Environ. 2021, 757, 143783. [CrossRef]
- Zha, Q.; Chai, G.; Sha, Y.; Zhang, Z.-G. Impact of Diurnal Temperature Range on Rhinitis in Lanzhou, China: Accounting for COVID-19 Effects. Urban Clim. 2023, 52, 101693. [CrossRef]
- Ding, Y.; Gao, L.; Shao, N.-Y. Non-Linear Link between Temperature Difference and COVID-19: Excluding the Effect of Population Density. J. Infect. Dev. Countr. 2021, 15, 230–236. [CrossRef]
- Guasp, M.; Laredo, C.; Urra, X. Higher Solar Irradiance Is Associated With a Lower Incidence of Coronavirus Disease 2019. Clin. Infect. Dis. 2020, 71, 2269–2271. [CrossRef]
- Merow, C.; Urban, M. C. Seasonality and Uncertainty in Global COVID-19 Growth Rates. Proc Natl. Acad. Sci. U. S. A. 2020, 117, 27456–27464. [CrossRef]
- Isaia, G.; Diémoz, H.; Maluta, F.; Fountoulakis, I.; Ceccon, D.; di Sarra, A.; Facta, S.; Fedele, F.; Lorenzetto, G.; Siani, A. M.; et al. Does Solar Ultraviolet Radiation Play a Role in COVID-19 Infection and Deaths? An Environmental Ecological Study in Italy. Sci. Total Environ. 2021, 757, 143757. [CrossRef]
- Carleton, T.; Cornetet, J.; Huybers, P.; Meng, K. C.; Proctor, J. Global Evidence for Ultraviolet Radiation Decreasing COVID-19 Growth Rates. Proc. Natl. Acad. Sci. U.S.A. 2021, 118, e2012370118. [CrossRef]
- Islam, N.; Bukhari, Q.; Jameel, Y.; Shabnam, S.; Erzurumluoglu, A. M.; Siddique, M. A.; Massaro, J. M.; D’Agostino, R. B. COVID-19 and Climatic Factors: A Global Analysis. Environ. Res. 2021, 193, 110355. [CrossRef]
- Sarkodie, S. A.; Owusu, P. A. Impact of Meteorological Factors on COVID-19 Pandemic: Evidence from Top 20 Countries with Confirmed Cases. Environ. Res. 2020, 191, 110101. [CrossRef]
- Wu, X.; Yin, J.; Li, C.; Xiang, H.; Lv, M.; Guo, Z. Natural and Human Environment Interactively Drive Spread Pattern of COVID-19: A City-Level Modeling Study in China. Sci. Total Environ. 2021, 756, 143343. [CrossRef]
- Ledebur, K.; Kaleta, M.; Chen, J.; Lindner, S. D.; Matzhold, C.; Weidle, F.; Wittmann, C.; Habimana, K.; Kerschbaumer, L.; Stumpfl, S.; et al. Meteorological Factors and Non-Pharmaceutical Interventions Explain Local Differences in the Spread of SARS-CoV-2 in Austria. PLOS Comput. Biol. 2022, 18, e1009973. [CrossRef]
- Tzampoglou, P.; Loukidis, D. Investigation of the Importance of Climatic Factors in COVID-19 Worldwide Intensity. Int. J. Environ. Res. Public Health 2020, 17, 7730. [CrossRef]
- Naffeti, B.; Bourdin, S.; Ben Aribi, W.; Kebir, A.; Ben Miled, S. Spatio-Temporal Evolution of the COVID-19 across African Countries. Front. Public Health 2022, 10. [CrossRef]
- Diouf, I.; Sy, S.; Senghor, H.; Fall, P.; Diouf, D.; Diakhaté, M.; Thiaw, W. M.; Gaye, A. T. Potential Contribution of Climate Conditions on COVID-19 Pandemic Transmission over West and North African Countries. Atmosphere 2022, 13, 34. [CrossRef]
- Chu, B.; Chen, R.; Liu, Q.; Wang, H. Effects of High Temperature on COVID-19 Deaths in U.S. Counties. GeoHealth 2023, 7, e2022GH000705. [CrossRef]
- Bonilla, J. A.; Lopez-Feldman, A.; Pereda, P. C.; Rivera, N. M.; Ruiz-Tagle, J. C. Association between Long-Term Air Pollution Exposure and COVID-19 Mortality in Latin America. PLOS ONE 2023, 18, e0280355. [CrossRef]
- Chelani, A. B.; Gautam, S. The Influence of Meteorological Variables and Lockdowns on COVID-19 Cases in Urban Agglomerations of Indian Cities. Stoch. Environ. Res. Risk Assess. 2022, 36, 2949–2960. [CrossRef]
- Bolaño-Ortiz, T. R.; Camargo-Caicedo, Y.; Puliafito, S. E.; Ruggeri, M. F.; Bolaño-Diaz, S.; Pascual-Flores, R.; Saturno, J.; Ibarra-Espinosa, S.; Mayol-Bracero, O. L.; Torres-Delgado, E.; et al. Spread of SARS-CoV-2 through Latin America and the Caribbean Region: A Look from Its Economic Conditions, Climate and Air Pollution Indicators. Environ. Res. 2020, 191, 109938. [CrossRef]
- Wahltinez, O.; Cheung, A.; Alcantara, R.; Cheung, D.; Daswani, M.; Erlinger, A.; Lee, M.; Yawalkar, P.; Lê, P.; Navarro, O. P.; et al. COVID-19 Open-Data a Global-Scale Spatially Granular Meta-Dataset for Coronavirus Disease. Sci. Data 2022, 9, 162. [CrossRef]
- Badr, H. S.; Zaitchik, B. F.; Kerr, G. H.; Nguyen, N.-L. H.; Chen, Y.-T.; Hinson, P.; Colston, J. M.; Kosek, M. N.; Dong, E.; Du, H.; et al. Unified Real-Time Environmental-Epidemiological Data for Multiscale Modeling of the COVID-19 Pandemic. medRxiv 2021. [CrossRef]
- Hersbach, H.; Bell, B.; Berrisford, P.; Hirahara, S.; Horányi, A.; Muñoz-Sabater, J.; Nicolas, J.; Peubey, C.; Radu, R.; Schepers, D.; et al. The ERA5 Global Reanalysis. Q. J. R. Meteorol. Soc. 2020, 146, 1999–2049. [CrossRef]
- Gasparrini, A.; Armstrong, B.; Kenward, M. G. Distributed Lag Non-Linear Models. Stat. Med. 2010, 29, 2224–2234. [CrossRef]
- Lyu, Y.; Wang, Y.; Jiang, C.; Ding, C.; Zhai, M.; Xu, K.; Wei, L.; Wang, J. Random Forest Regression on Joint Role of Meteorological Variables, Demographic Factors, and Policy Response Measures in COVID-19 Daily Cases: Global Analysis in Different Climate Zones. Environ. Sci. Pollut. Res. 2023, 30, 79512–79524. [CrossRef]
- Pan, J.; Yao, Y.; Liu, Z.; Meng, X.; Ji, J. S.; Qiu, Y.; Wang, W.; Zhang, L.; Wang, W.; Kan, H. Warmer Weather Unlikely to Reduce the COVID-19 Transmission: An Ecological Study in 202 Locations in 8 Countries. Sci. Total Environ. 2021, 753, 142272. [CrossRef]
- Analitis, A.; Katsouyanni, K.; Biggeri, A.; Baccini, M.; Forsberg, B.; Bisanti, L.; Kirchmayer, U.; Ballester, F.; Cadum, E.; Goodman, P. G.; et al. Effects of Cold Weather on Mortality: Results from 15 European Cities within the PHEWE Project. Am. J. Epidemiol. 2008, 168, 1397–1408. [CrossRef]
- Anderson, B. G.; Bell, M. L. Weather-Related Mortality: How Heat, Cold, and Heat Waves Affect Mortality in the United States. Epidemiology 2009, 20, 205–213. [CrossRef]
- Gasparrini, A.; Guo, Y.; Hashizume, M.; Lavigne, E.; Zanobetti, A.; Schwartz, J.; Tobias, A.; Tong, S.; Rocklöv, J.; Forsberg, B.; et al. Mortality Risk Attributable to High and Low Ambient Temperature: A Multicountry Observational Study. The Lancet 2015, 386, 369–375. [CrossRef]
- Pastorino, B.; Touret, F.; Gilles, M.; de Lamballerie, X.; Charrel, R. Evaluation of Heating and Chemical Protocols for Inactivating SARS-CoV-2. bioRxiv 2020. [CrossRef]
- Fares, A. Factors Influencing the Seasonal Patterns of Infectious Diseases. Int. J. Prev. Med. 2013, 4, 128–132.
- Cheng, J.; Xu, Z.; Zhu, R.; Wang, X.; Jin, L.; Song, J.; Su, H. Impact of Diurnal Temperature Range on Human Health: A Systematic Review. Int. J. Biometeorol. 2014, 58, 2011–2024. [CrossRef]
- Sapolsky, R. M.; Romero, L. M.; Munck, A. U. How Do Glucocorticoids Influence Stress Responses? Integrating Permissive, Suppressive, Stimulatory, and Preparative Actions. Endocr. Rev. 2000, 21, 55–89. [CrossRef]
- Zhou, Z.; He, L.; Zhong, Y.; Wang, L.; Qin, W.; Zhang, X. Evaluation and analysis of MODIS and VIIRS satellite aerosol optical depth products over China. China Environ. Sci. 2024, 44, 4211-4229.
- Cai, J.; Sun, W.; Huang, J.; Gamber, M.; Wu, J.; He, G. Indirect Virus Transmission in Cluster of COVID-19 Cases, Wenzhou, China, 2020. Emerg. Infect. Dis. 2020, 26, 1343–1345. [CrossRef]
- Li, Y.; Qian, H.; Hang, J.; Chen, X.; Cheng, P.; Ling, H.; Wang, S.; Liang, P.; Li, J.; Xiao, S.; et al. Probable Airborne Transmission of SARS-CoV-2 in a Poorly Ventilated Restaurant. Build. Environ. 2021, 196, 107788. [CrossRef]
- Greenhalgh, T.; Jimenez, J. L.; Prather, K. A.; Tufekci, Z.; Fisman, D.; Schooley, R. Ten Scientific Reasons in Support of Airborne Transmission of SARS-CoV-2. The Lancet 2021, 397, 1603–1605. [CrossRef]
- Morris, D. H.; Yinda, K. C.; Gamble, A.; Rossine, F. W.; Huang, Q.; Bushmaker, T.; Fischer, R. J.; Matson, M. J.; Van Doremalen, N.; Vikesland, P. J.; et al. Mechanistic Theory Predicts the Effects of Temperature and Humidity on Inactivation of SARS-CoV-2 and Other Enveloped Viruses. eLife 2021, 10, e65902. [CrossRef]
- Kormuth, K. A.; Lin, K.; Qian, Z.; Myerburg, M. M.; Marr, L. C.; Lakdawala, S. S. Environmental Persistence of Influenza Viruses Is Dependent upon Virus Type and Host Origin. mSphere 2019, 4, 10.1128/msphere.00552-19. [CrossRef]
- Yang, W.; Elankumaran, S.; Marr, L. C. Relationship between Humidity and Influenza A Viability in Droplets and Implications for Influenza’s Seasonality. PLOS ONE 2012, 7, e46789. [CrossRef]
- Lin, K.; Marr, L. C. Humidity-Dependent Decay of Viruses, but Not Bacteria, in Aerosols and Droplets Follows Disinfection Kinetics. Environ. Sci. Technol. 2020, 54, 1024–1032. [CrossRef]
- Gallagher, R. P.; Lee, T. K. Adverse Effects of Ultraviolet Radiation: A Brief Review. Prog. Biophys. Mol. Biol. 2006, 92, 119–131. [CrossRef]
Figure 1.
Distribution of 173 study units across 62 countries globally.
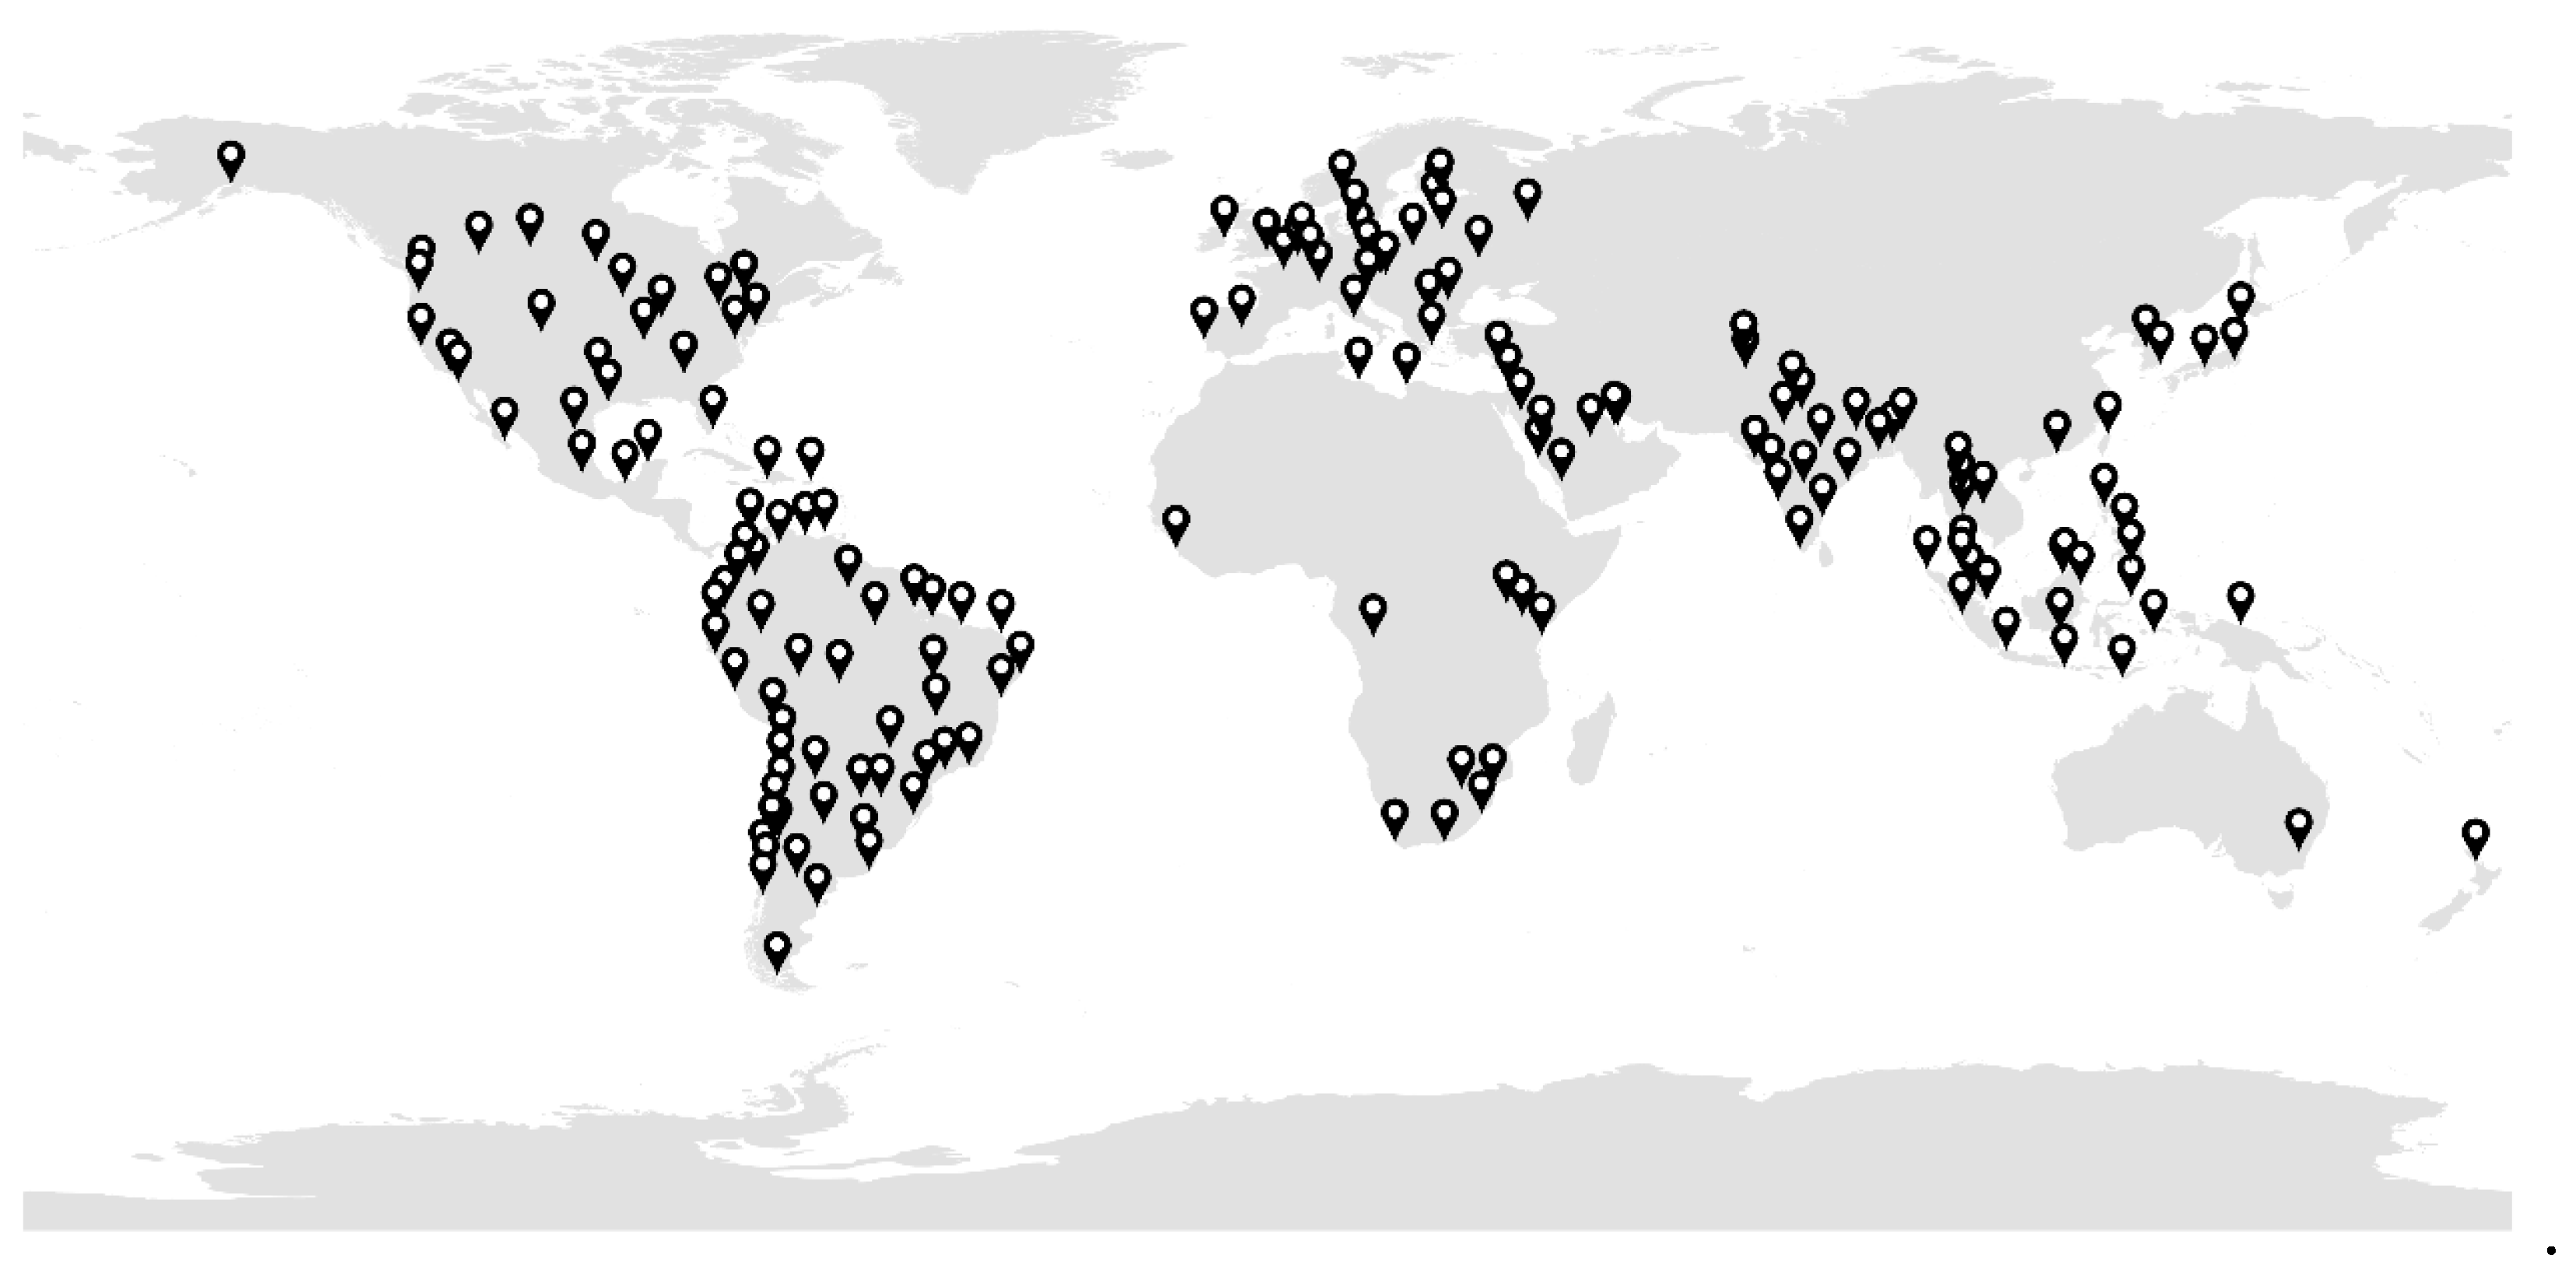
Figure 2.
Cumulative lag Exposure-Response curves of COVID-19 incidence rates with temperature, relative humidity (RH), ultraviolet radiation (UVR), and diurnal temperature range (DTR). Note: The histograms display the distribution of each meteorological factor, with shaded areas representing the confidence intervals of the fitted values; RR denotes relative risk; the dashed lines indicate the 2.5th and 97.5th percentiles of the variable, and the dotted lines represent the reference value of the variable (RR=1); the blue (red) lines represent the cumulative exposure-response curves below (above) the reference values.
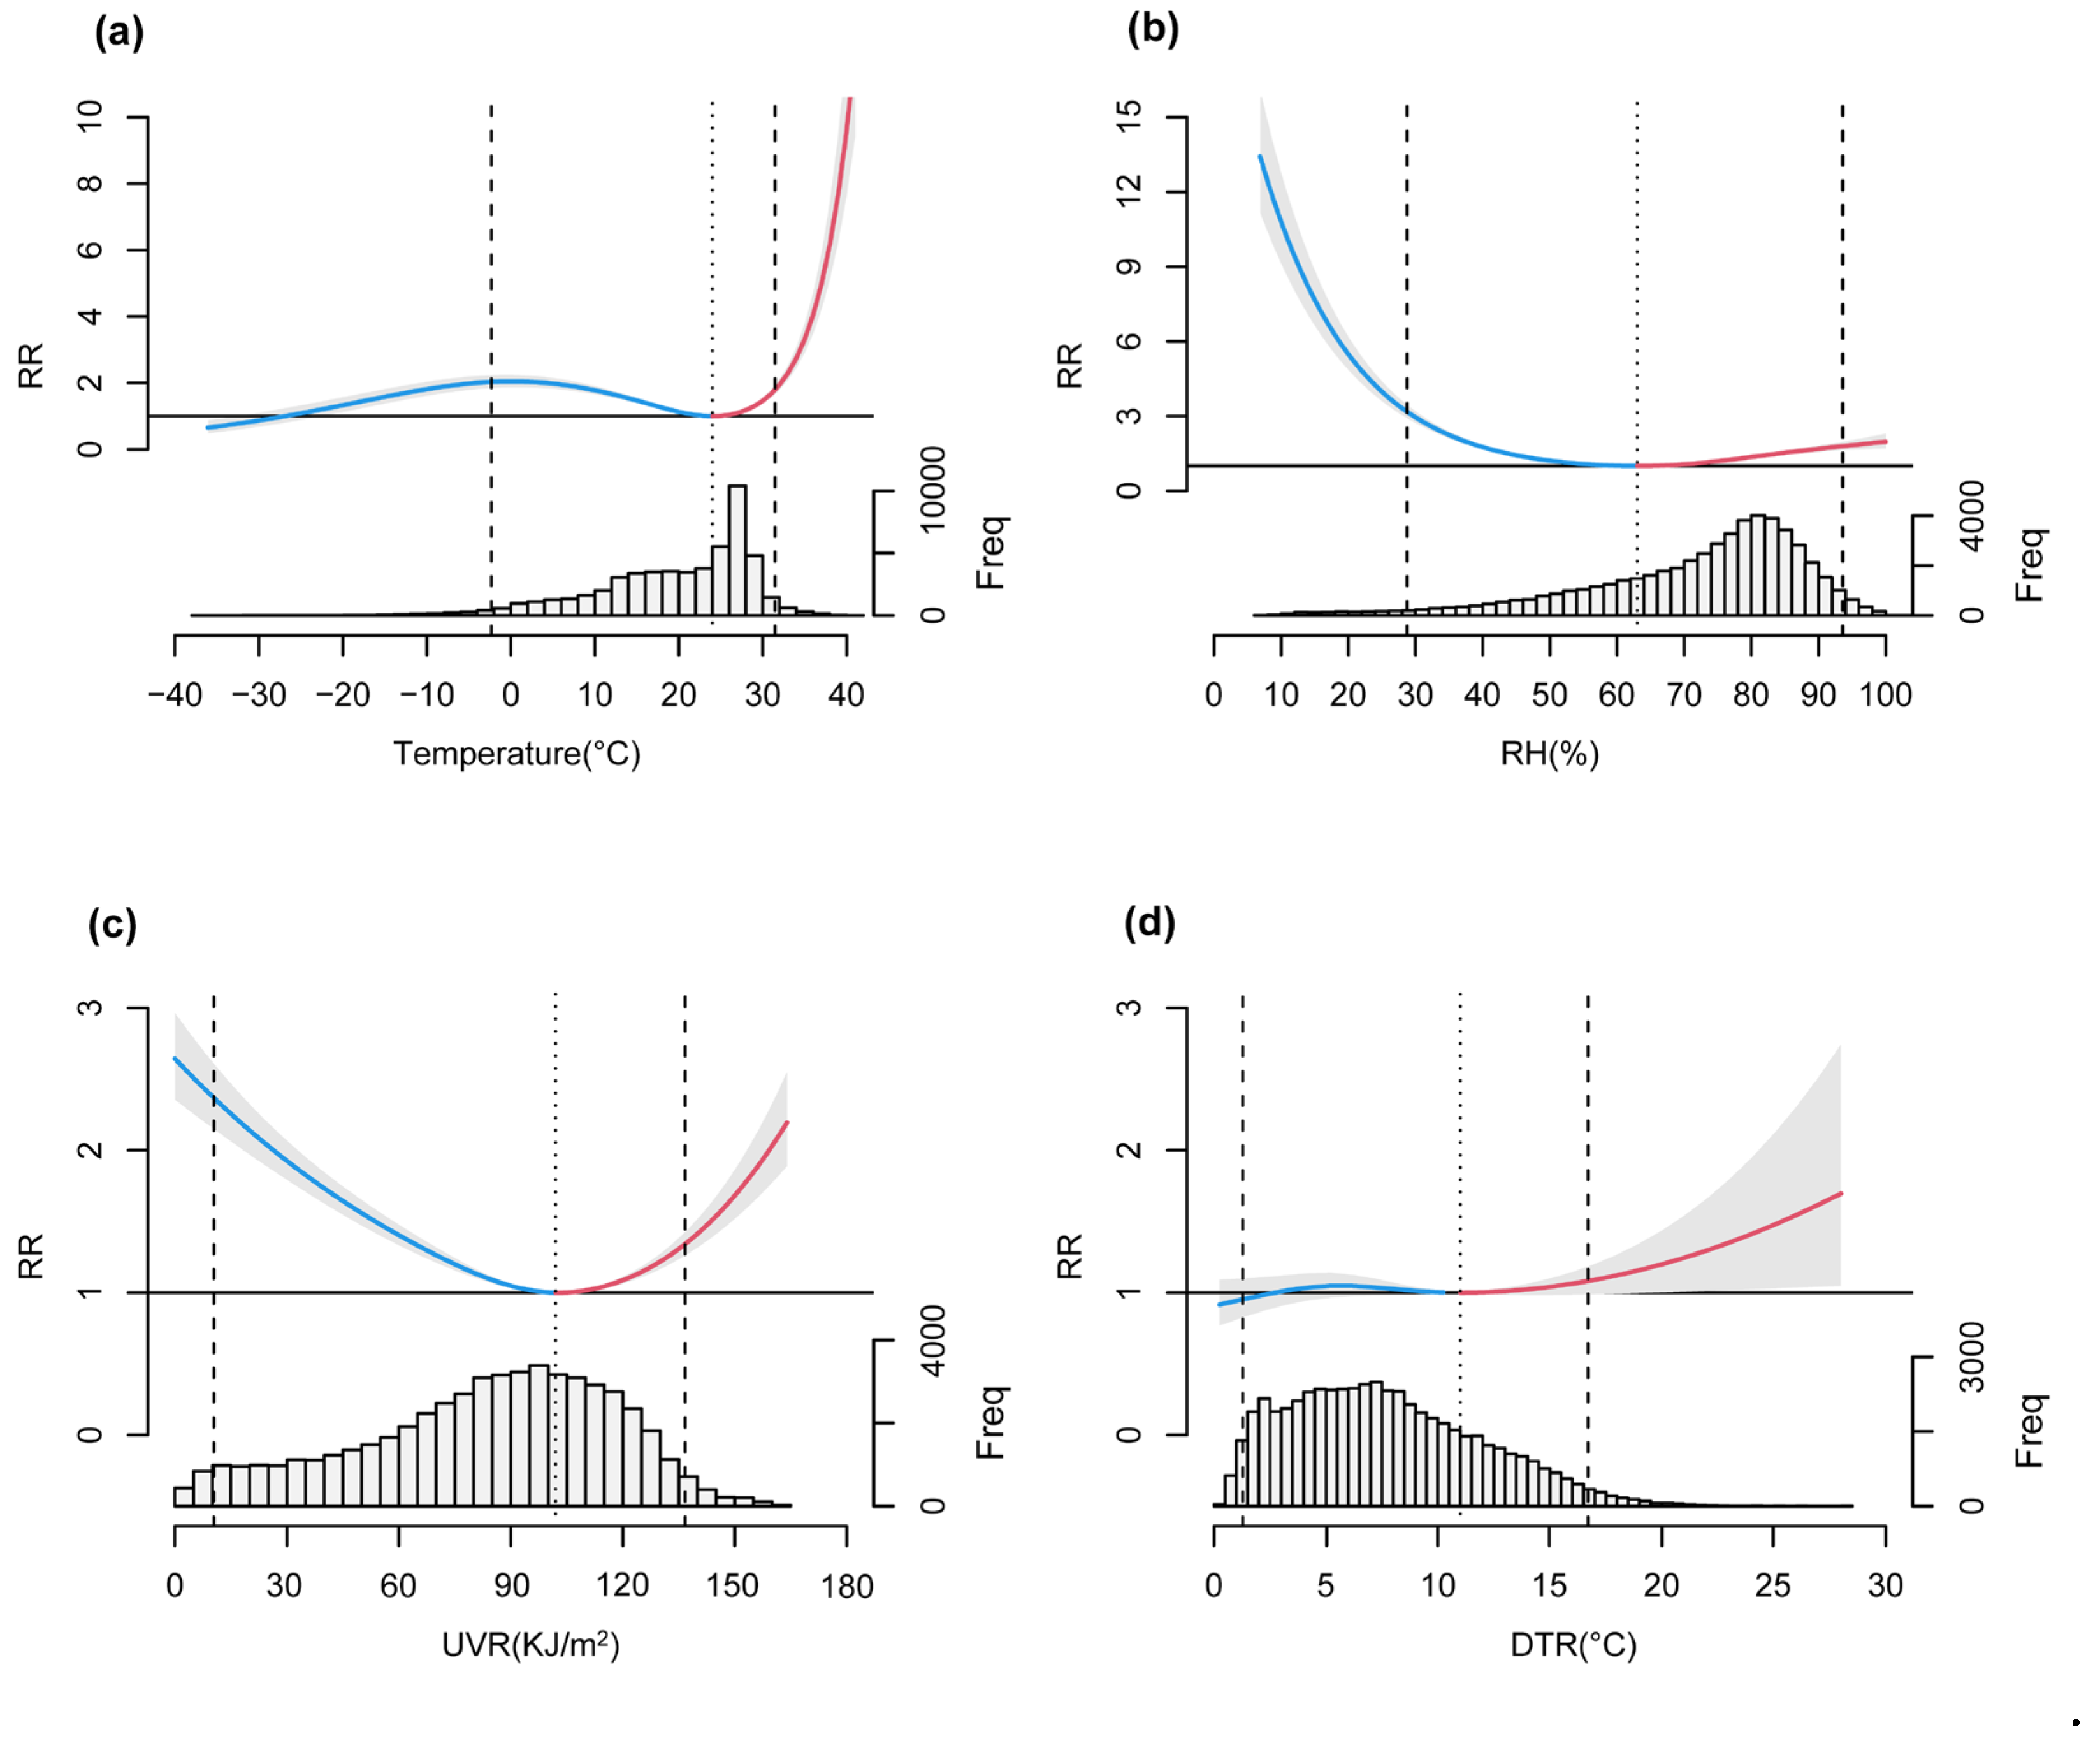
Figure 3.
Exposure-lag-response contour, exposure-response curves at different lag periods, and lag-response relationships at specific meteorological variable values for COVID-19 incidence rates, with respect to temperature, RH, UVR, and DTR. Note: The shaded area represents the confidence interval for the fitted values. In the middle panel, exposure-response curves are drawn for lag days 0, 7, and 14 for different meteorological factors. In the rightmost panel, the blue (red) line represents the lag-response curve for the 2.5th (97.5th) percentile of the meteorological variables.
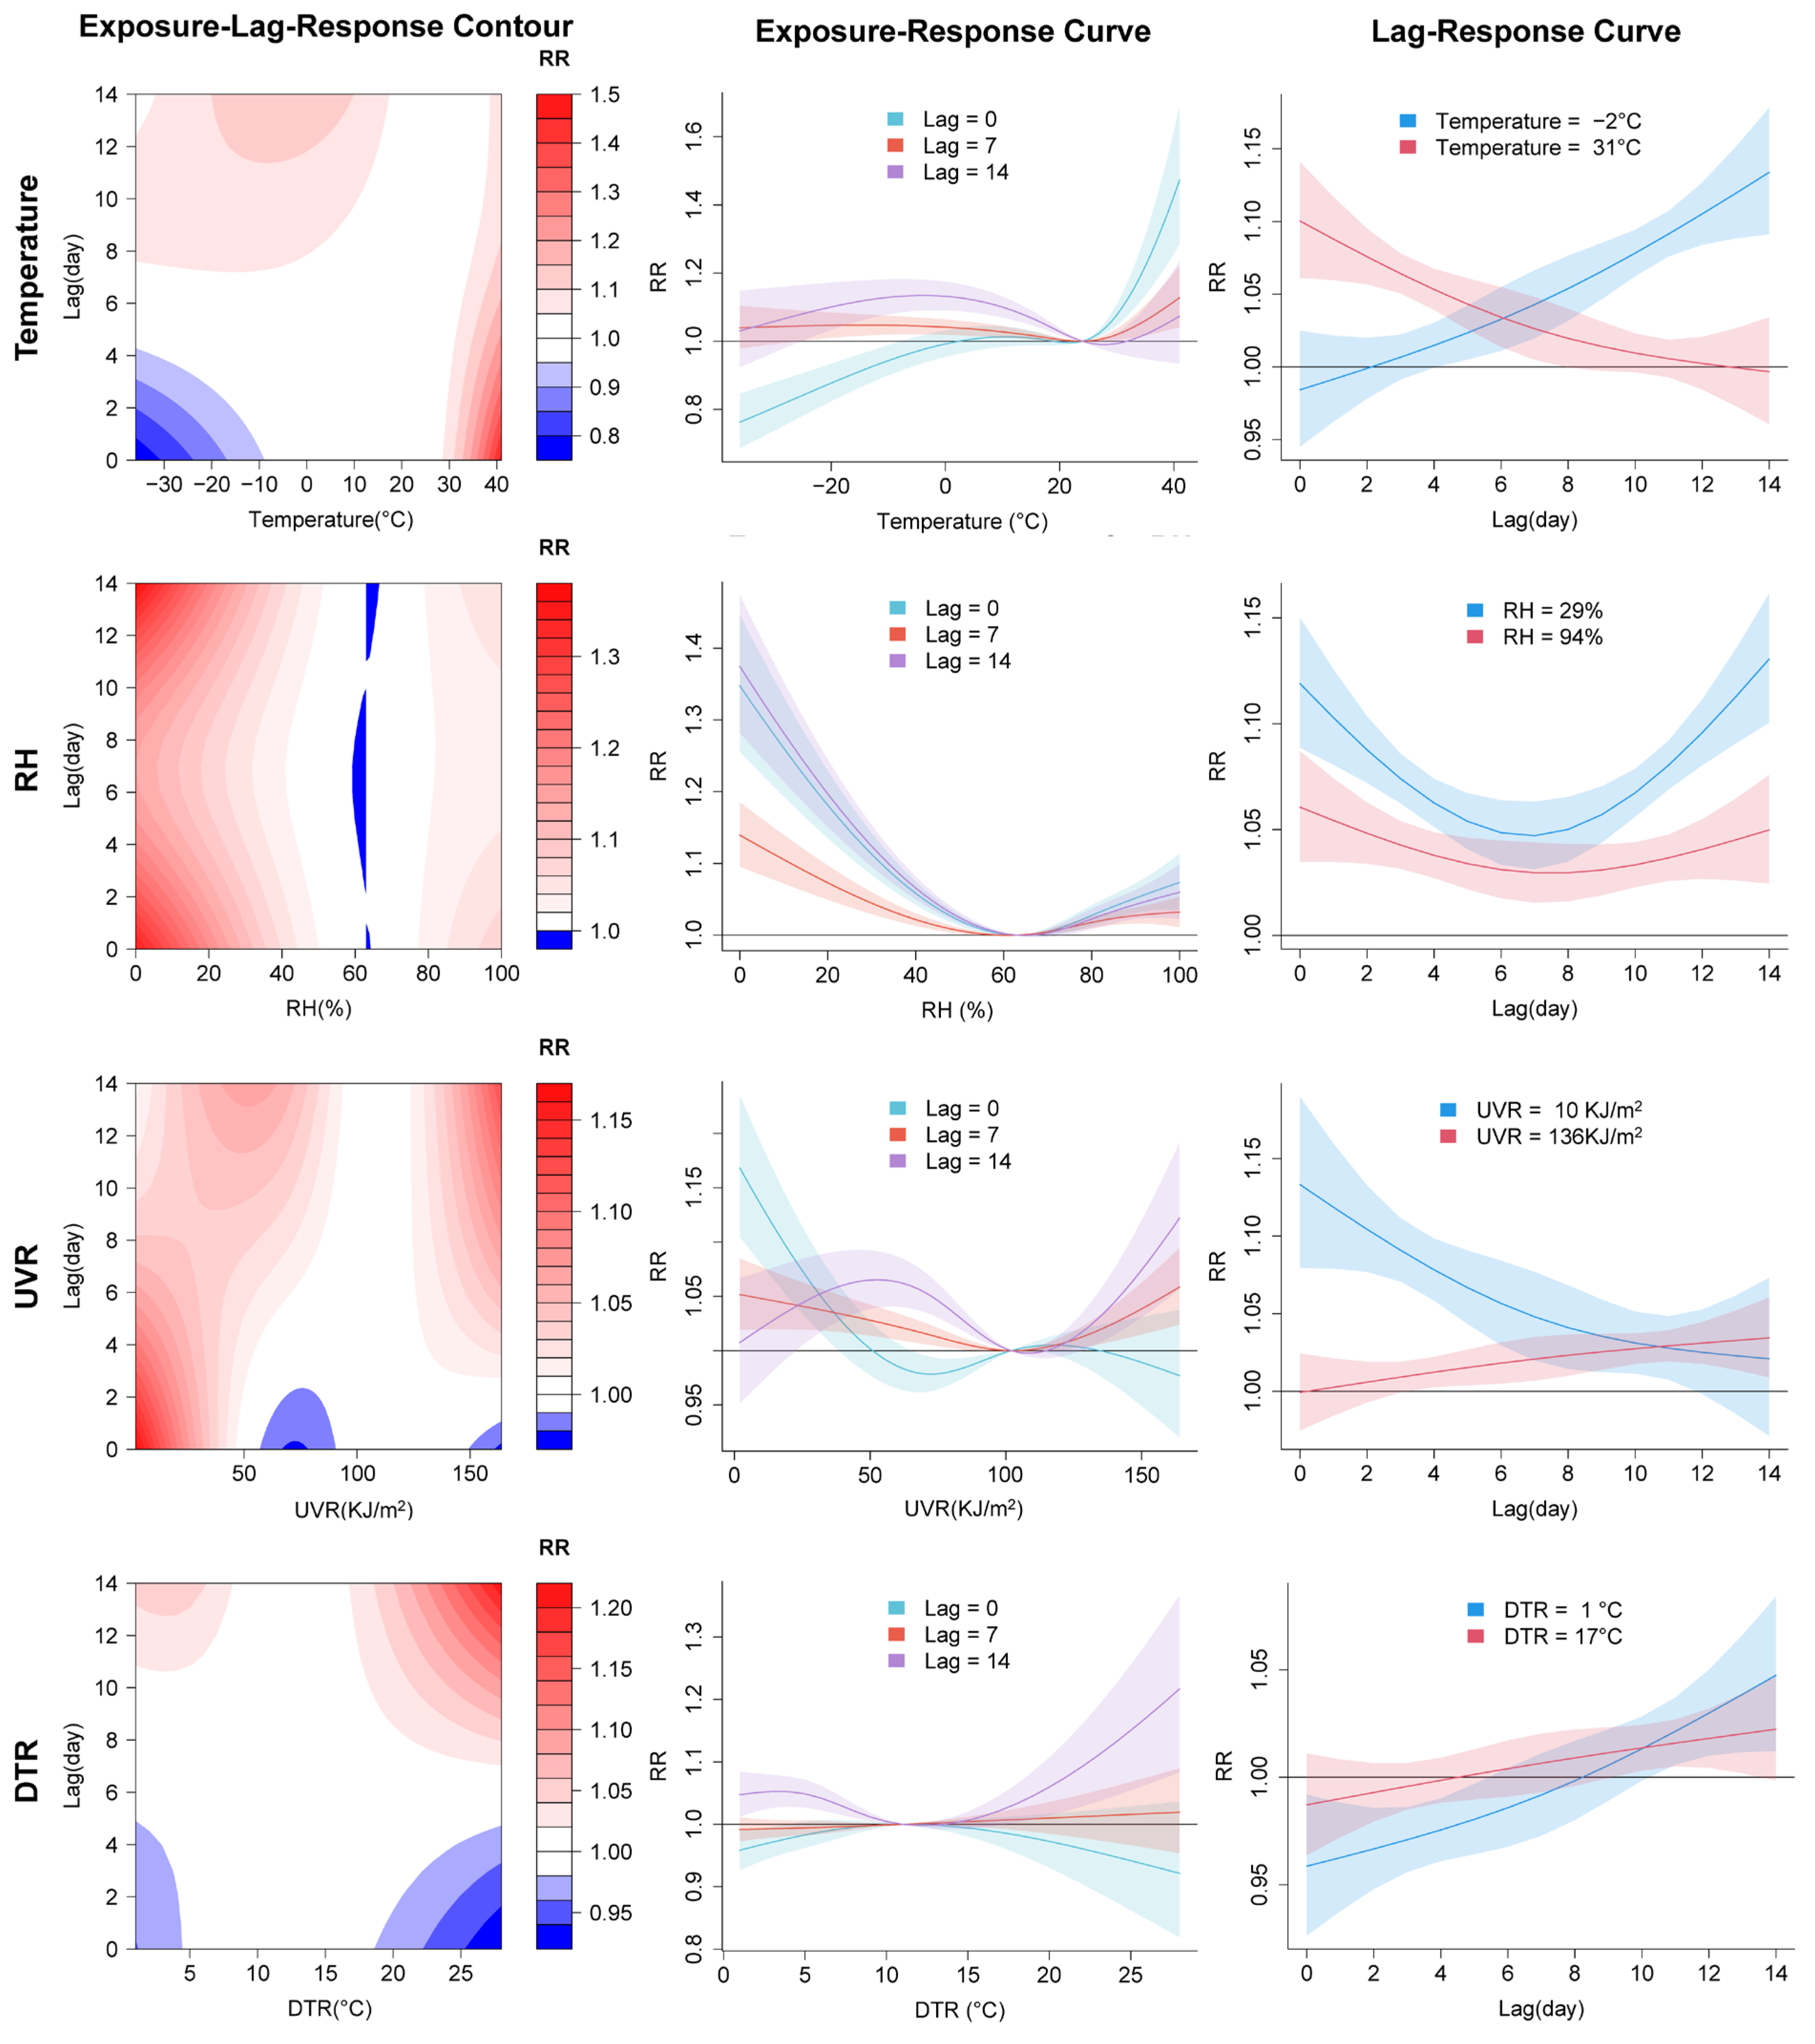

Table 1.
Basic statistics of COVID-19 incidence rates and meteorological factors for 173 study units across 62 countries from March 1, 2020, to February 28, 2021 (n=51,062).
Table 1.
Basic statistics of COVID-19 incidence rates and meteorological factors for 173 study units across 62 countries from March 1, 2020, to February 28, 2021 (n=51,062).
| Types | Variables | Mean | Min | Median | Max |
|---|---|---|---|---|---|
| COVID-19 | Cumulative incidence rate (per million) | 41647.9 | 3.1 | 32969.6 | 217288.7 |
| Daily incidence rate (per million) | 133.7 | 0 | 39.6 | 8184.2 | |
| Meteorological factors | Daily mean temperature (°C) | 19.6 | -36.1 | 22 | 41.2 |
| Diurnal temperature range (°C) | 7.7 | 0.2 | 7.2 | 28.1 | |
| Daily mean relative humidity (%) | 71.6 | 6.9 | 76 | 100 | |
| Daily mean ultraviolet radiation (KJ/m2) | 82.8 | 0.4 | 87.6 | 164.8 | |
| Daily mean surface pressure(kPa) | 97.4 | 72.9 | 99.9 | 104.1 | |
| Daily mean cloud cover (%) | 57.4 | 0 | 62.4 | 100 | |
| Daily mean wind speed (m/s) | 3 | 0.3 | 2.6 | 13.8 | |
| Daily precipitation (mm) | 2.6 | 0 | 0 | 410 |
Disclaimer/Publisher’s Note: The statements, opinions and data contained in all publications are solely those of the individual author(s) and contributor(s) and not of MDPI and/or the editor(s). MDPI and/or the editor(s) disclaim responsibility for any injury to people or property resulting from any ideas, methods, instructions or products referred to in the content. |
© 2024 by the authors. Licensee MDPI, Basel, Switzerland. This article is an open access article distributed under the terms and conditions of the Creative Commons Attribution (CC BY) license (http://creativecommons.org/licenses/by/4.0/).
Copyright: This open access article is published under a Creative Commons CC BY 4.0 license, which permit the free download, distribution, and reuse, provided that the author and preprint are cited in any reuse.


