Submitted:
11 September 2025
Posted:
11 September 2025
You are already at the latest version
Abstract
The emergence of phototrophy is one of the most significant innovations in the history of life, vastly increasing available metabolic energy. Phototrophy is, however, known to have arisen only twice. This raises a curious question: if phototrophy was accessible enough to evolve twice, why has it never arisen again despite billions of years of subsequent evolution? Through physiological modeling, we demonstrate that chlorophototrophy and retinalophototrophy together saturate the bioenergetic landscape available to light-harvesting systems. They represent opposite solutions to key biophysical trade-offs: maximizing efficiency per photon versus maximizing metabolic flux, specialization versus versatility, and sophistication versus simplicity. Together they create an evolutionary priority effect, blocking any newly-arising phototrophic system from succeeding. By revealing the basis of this competitive exclusion, our work sheds light on a general principle - that early innovations can saturate ecological space such that they constrain future evolutionary possibilities, making apparently 'easy' innovations appear as rare events.
Keywords:
photosynthesis
; phototrophy
; priority effects
; evolution
; major transitions in evolution
Introduction
Major evolutionary innovations, from multicellularity to powered flight have repeatedly transformed life on Earth. Understanding how and why these novelties emerge and persist is therefore central to explaining life’s history. These innovations, however, often follow two very different evolutionary paths: while some innovations, like multicellularity[1] and C4 photosynthesis[2], have evolved dozens of times across diverse lineages, others remain restricted to just one or a few groups – occasionally appearing as true evolutionary singularities (e.g., the origin of life or eukaryogenesis)[3]. One potential explanation for this pattern is priority effects: When an innovation first appears, the pioneering lineage may saturate the available ecological niche space, creating competitive barriers that prevent the same innovation from being successful if it evolves in other groups[4,5]. Despite the recognized importance of such niche incumbency in shaping macroevolutionary patterns[6,7,8], the mechanistic basis of priority effects often remains poorly understood[4]. This mechanistic knowledge gap exemplifies a broader challenge in evolutionary biology: bridging the process-pattern divide between ecological interactions and large-scale evolutionary diversification[9,10].
Here, we study how priority effects may manifest mechanistically by studying the physiological bioenergetics of phototrophy. Phototrophy, the ability to use light for metabolic energy, is a major biological innovation that led to an explosion of biomass and biodiversity. However, despite first appearing at least 3.5Ga ago[11,12,13] and being responsible for the vast majority of biomass on Earth[14,15], it is unclear why phototrophy has only ever evolved independently in two forms: chlorophototrophy and retinalophototrophy. This low, but nonzero, diversity of phototrophic origins represents a unique opportunity for study – while not a common evolutionary innovation with sufficient barriers to its evolution to have only appeared twice, phototrophy nonetheless exhibits two separate origins that can be compared to determine the eco-evolutionary relationship between them. Could evolutionary priority effects explain their relationship, and what can we learn about the ecological interactions that engender such priority effects?
To address this question, we develop a mathematical analysis of energy transduction through these modern extant phototrophic metabolisms, and a biophysical model of the trade-offs inherent in their adaptation to different phototrophic ecological niches. We test the hypothesis that these two extant systems are optimized for different ecological conditions and find that they indeed efficiently partition phototrophic niche space between themselves, limiting the opportunity for novel phototrophic lineages to establish themselves. This suggests that the 'dual singularity' of phototrophy exemplifies a fundamental principle: evolutionary innovations can be historically contingent, with early-arising forms constraining the evolutionary possibilities available to later lineages.
Chlorophototrophic and retinalophototrophic pathways originated independently early in the history of life on Earth. They are highly divergent in their structures, compositions, and the forms of chemical energy they make available to cellular metabolism (Figure 1A). Before describing our computational approach for investigating their evolution and interactions, we provide a brief overview of these two phototrophic systems.
Chlorophototrophy drives both energy metabolism and redox chemistry using chlorophyll and bacteriochlorophyll photochemistry. Found in bacteria and in eukaryotic algae in which cyanobacteria have been taken up as chloroplasts, chlorophototrophy is responsible for the vast majority of primary production on the planet[14,15]. The functional unit of chlorophototrophy is the photochemical reaction center (RC; Figure 1A), which are large transmembrane protein complexes descended from an ancestral homodimer[13] that contain a minimum of eight organic pigment and redox cofactor molecules[16,17]. In addition to their defining pigments, all reaction centers contain iron in the form of iron-sulfur clusters, single coordinated iron atoms, or hemes bound to cytochromes[18,19,20,21].
All chlorophototrophic reaction centers generate reducing power via chlorophyll and bacteriochlorophyll photochemistry, which can then be used for either energy metabolism by allowing these reduced electrons to flow through a modified electron transport chain or for carbon/nitrogen fixation via redox chemistry. In the case of energy metabolism, protons are pumped across the active membrane much as in a respiratory electron transport chain. In the case of carbon fixation, a reducing equivalent is conveyed to NADPH while the reaction center is ‘reset’ by pulling an electron from a variety of environmental electron sources (such as dissolved Fe2+ in photoferrotrophs, H2S in green sulfur bacteria, or water in the case of oxygenic photosynthesis). Absorption of a single photon typically pumps two to four protons across the membrane[22,23]. All reaction centers couple a structurally conserved central dimeric core of at least 150 kilodaltons[16] to additional ‘core antenna’ complexes of a hundred kDa or more which increase the absorption cross section per functional unit by funneling light into the reaction center from additional pigments via Förster resonance transfer. These in turn may be coupled to a diverse variety of additional antenna complexes which vary significantly from lineage to lineage[24].
Retinalophototrophy, in contrast, is mediated by a single simple 26-28 kDa transmembrane protein, known as a microbial or ‘type-1’ rhodopsin[25,26,27] (Figure 1A). It is covalently bound to a single pigment molecule known as retinal, derived from the oxidative splitting of a carotenoid via a dioxygenase[28]. In a few cases, such as the xanthorhodopsins, a single additional carotenoid pigment molecule is bound to the exterior of the protein and functions as a miniature integral antenna[29], but rhodopsins are not known to be associated with accessory antenna proteins. Rather than participating in redox chemistry, they directly pump protons across the cell membrane driven by light-induced isomerization of the retinal pigment molecule. Thus unlike chlorophototrophic systems they involve only organic molecules with no iron-containing redox cofactors[30]. Rhodopsins are not known to be used to fix inorganic carbon into biomass in nature because they fail to push membranes to a high enough voltage to reverse electron flow through electron transport chains[31]. However, while these two phototrophic systems are quite different, the total energy transduced by them is similar. The quantity of light absorbed by retinalophototrophs in the ocean is thought to be at least as large as that absorbed by chlorophototrophs[32].
Results
We first examined the physiological trade-offs embodied in chlorophototrophic and retinalophototrophic machinery using data derived from physiological studies of extant taxa based on a literature review[16,20,26,31,33,34,35,36,37,38,39,40,41,42], calculating their machinery’s energy flux per kDa and energy yield per unit light intensity at different light intensities and in the limits of bright and dim light (see Supplement S1 and Table S1). Despite possessing both a faster photocycle and higher energy yield per photon absorbed, chlorophototrophic machinery has a substantially lower maximum specific energy flux per unit mass than microbial rhodopsins (Figure 2A; Table S1). This is principally because of the much larger mass of chlorophototrophic reaction centers and their associated antennas.
Upon analysis of the function of RCs and rhodopsins at a variety of light intensities, we find that the small protein mass and presence of only a single retinal pigment in a rhodopsin ensures a small light absorption cross section which requires intense ambient light for the machinery to be used effectively. The larger size of a reaction center comes with more pigment molecules and a larger light absorption cross section which allows a higher specific energy flux at low light intensities, but this rapidly saturates and is overtaken by rhodopsins at high light intensities (Figure 2B). A clear trade-off between these two pathways exists: while rhodopsins are capable of much higher maximum energy fluxes per unit protein infrastructure at high light levels, RCs are capable of much higher maximum energy yields per unit incident light than retinalophototrophs at low light levels (Figure 2C,D).
Moving on from these well-studied phototrophic organisms, we next examined the fundamental theoretical physiological capabilities of chlorophototrophy and retinalophototrophy using an integrated physiological model of phototrophic energy transduction (Figure 1B, Supplement S1, Table S2). This model takes into account the properties of the conserved catalytic cores at the heart of rhodopsins and reaction centers, variable quantities of associated antenna pigments increasing the light-gathering cross section of the machinery, and both the photodegradation and growth/recycling-mediated dilution of the machinery with time. Light levels were allowed to vary between 0.01 to 4000 micromoles of photons per square meter per second in logarithmic intervals, and the optimal quantity of antenna pigment per catalytic core to optimize specific energy flux of the protein machinery at each light intensity was calculated. The properties of each of these optimal systems was analyzed in terms of specific energy flux per unit protein (protons pumped per second per kDa of protein) and yield per unit incident light (protons pumped per second per kDa of protein per unit of incoming light intensity; see Materials and Methods).
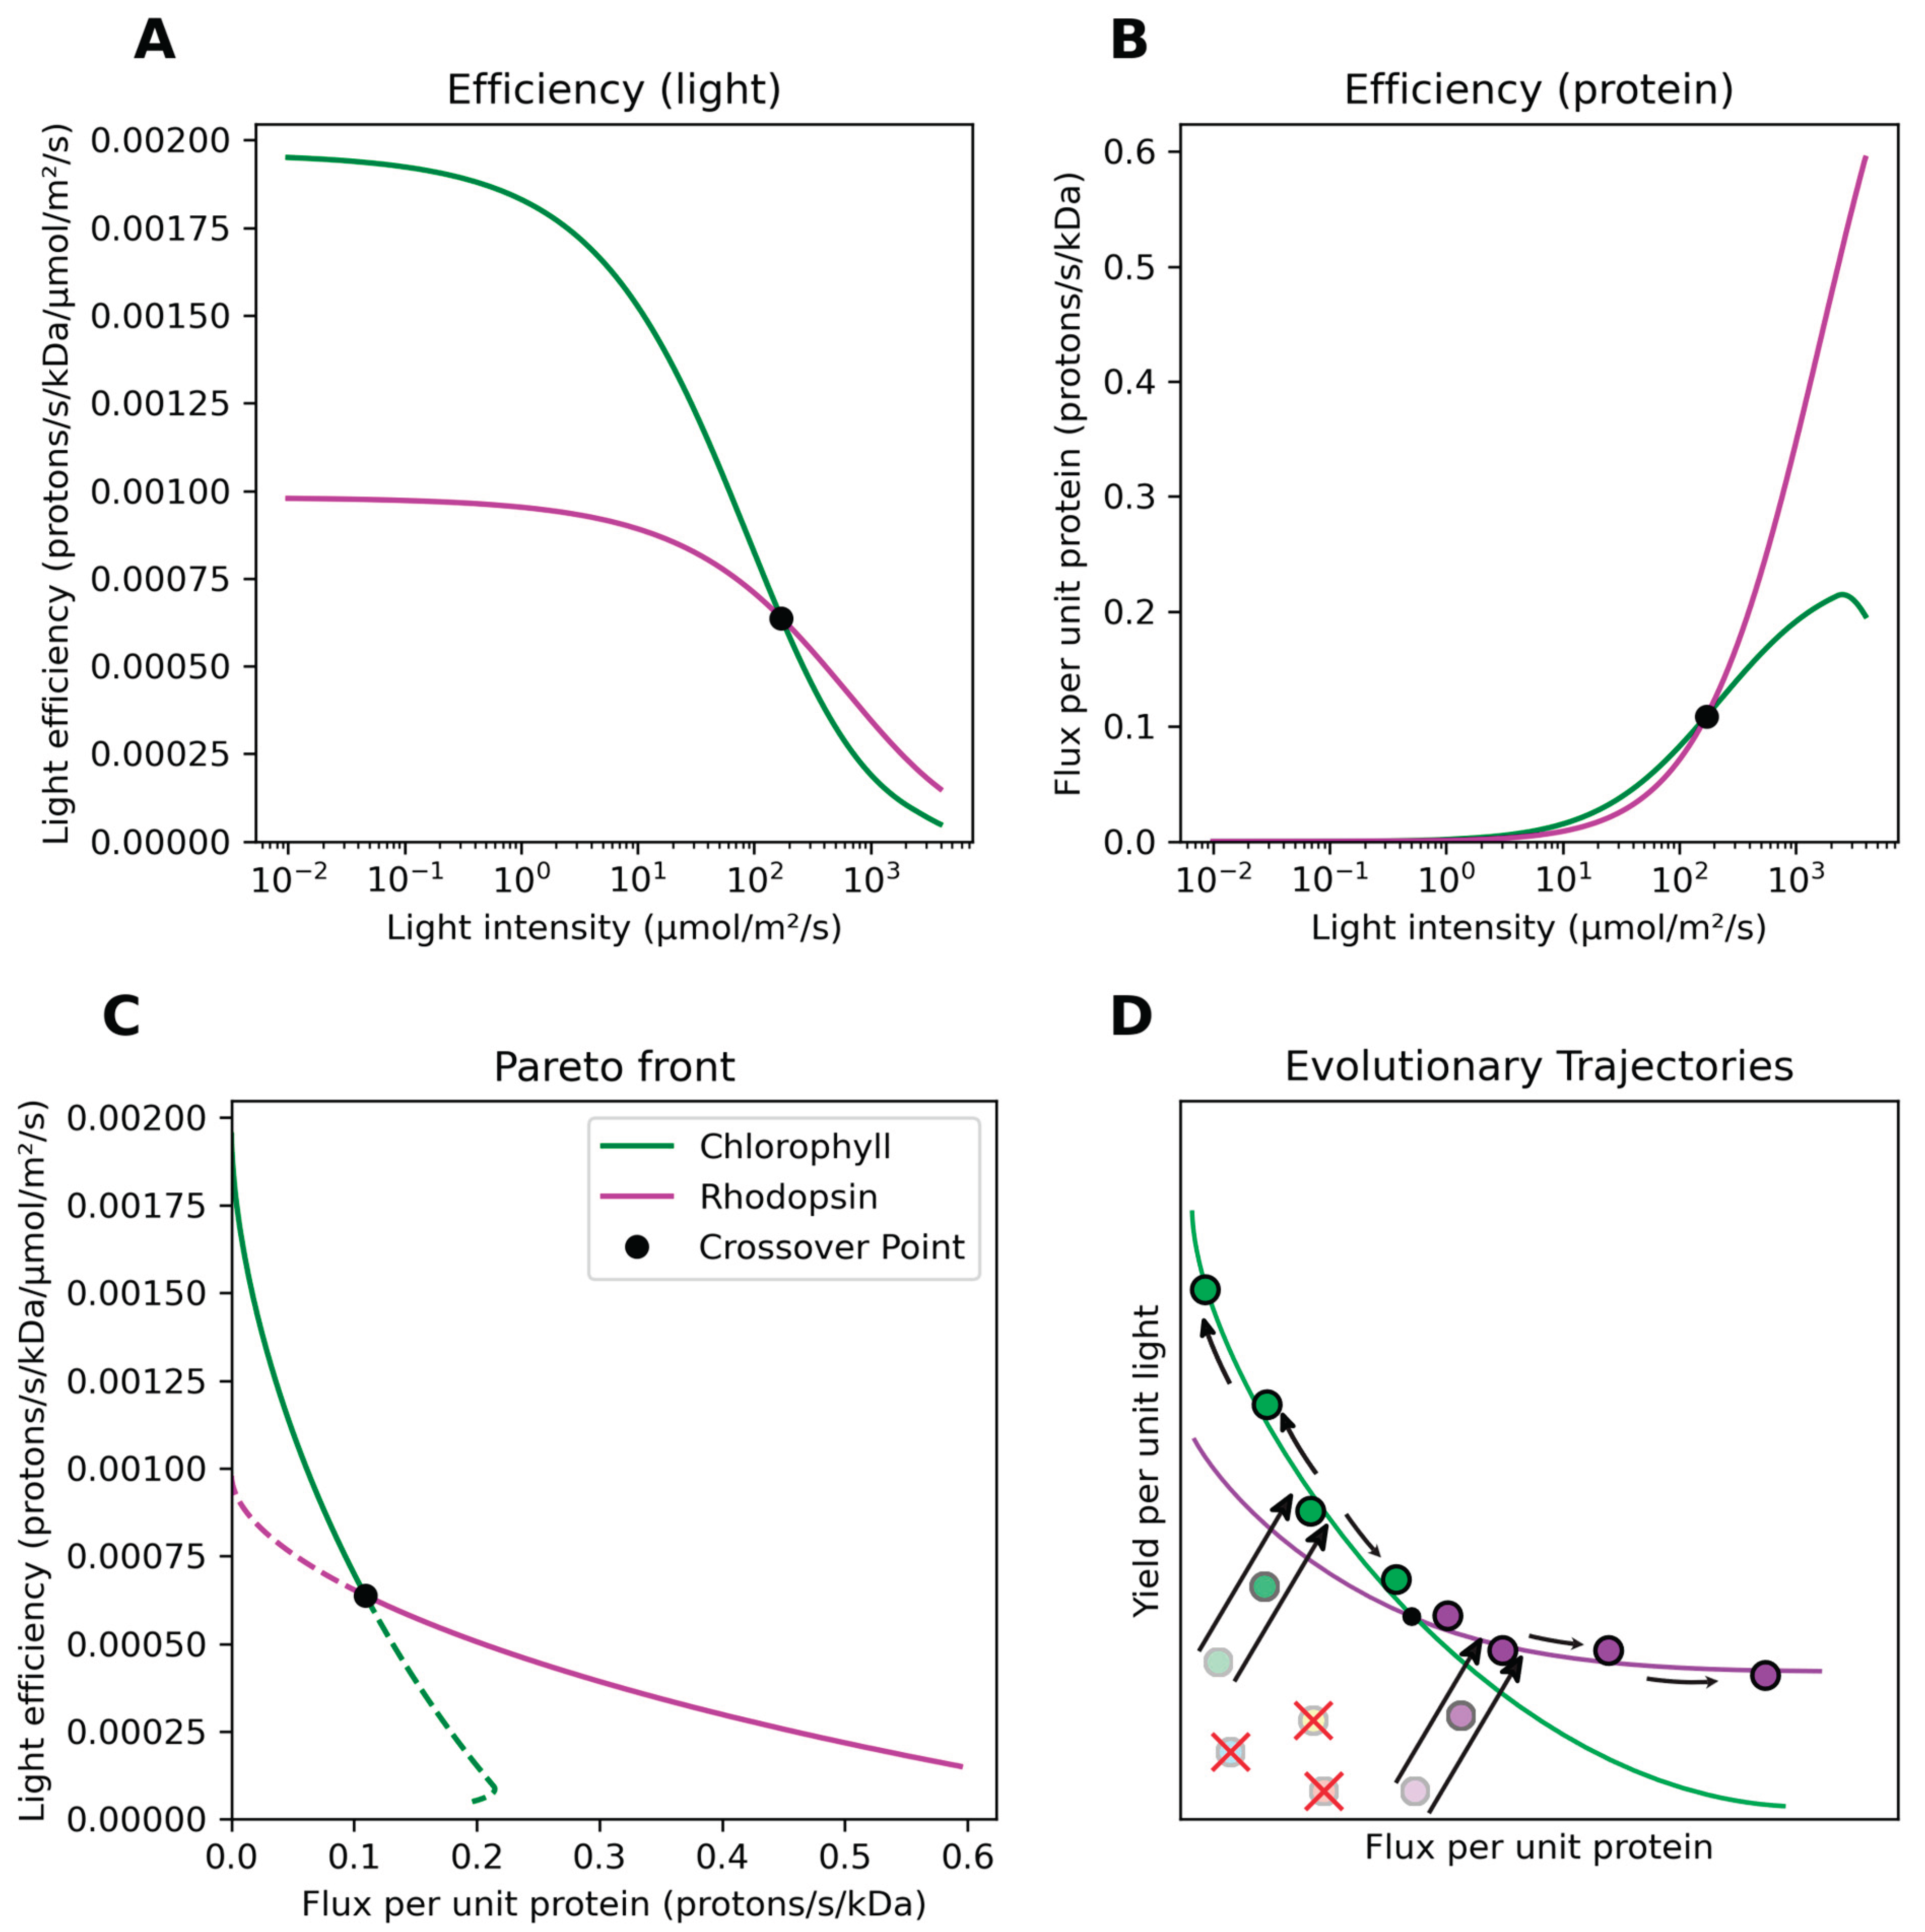
Yield per unit incident light falls nonlinearly as light intensity increases (Figure 3A) due to both saturation of the central catalytic core and drastic decreases in optimal antenna quantity (see Figures S2 and S3). Efficiency per unit protein machinery, conversely, rises nonlinearly as light intensity increases (Figure 3B) due to increased utilization of the catalytic core and a smaller antenna mass, with chlorophototrophs exhibiting a slightly decreased efficiency at the highest light intensities due to photodegradation. Our analysis identifies a crossover point at ca. 186 micromoles of photons per square meter per second (Figure 3A-B). Above this light intensity, both the energy flux per unit infrastructure and energy yield per unit incident light are superior for retinalophototrophy. Below this light intensity, chlorophototrophy instead dominates for both metrics. Light intensity thus determines which phototrophic system will be more efficient, with two defined ‘niches’ – a low light niche with high yield per unit light, and a high light niche with high flux per unit infrastructure.
Our model recapitulates several key aspects of phototrophic metabolism observed in nature. It indicates a theoretical minimum optimal antenna mass of approximately 95 kDa for optimal chlorophototrophs at the crossover point light level (Figure S2), with antenna mass being able to increase without limit at low light levels. The lower chlorophototrophic antenna limit is within approximately 20% of the mass of the smallest intrinsic antennas observed in nature in type I reaction centers, while other chlorophototrophs can indeed exhibit extremely large antenna pigments up to and including ‘chlorosome’ antennas the size of organelles[43]. While we calculate a maximum antenna size of 61 kDa for theoretical antennas associated with rhodopsins at the crossover point, this predicted mass is below the mass of any observed antenna complex and rapidly falls to negligible optimal mass as light intensity increases towards that of full sunlight (see Figure S2). In addition to this, the crossover point at which higher light intensities are dominated by retinalophototrophy corresponds closely with the empirically observed light intensities above which retinal is over-represented in the ocean and chlorophyll is under-represented[32] (see File S1 and Figure S5). Our simple model thus recapitulates key physiological trade-offs underlying variation in organisms filling phototrophic niche space, able to correctly predict the environmental conditions under which either chlorophototrophs or retinalophototrophs should have a physiological and ecological advantage.
Discussion
Phototrophic organisms face a fundamental trade-off between efficiency per unit light and flux per unit infrastructure. The two phototrophic metabolisms that have evolved on Earth have each optimized a different side of this trade-off: chlorophototrophy requires a significant fraction of the proteome to be invested in sophisticated protein machinery which results in a lower energy flux per unit infrastructure but high yield per unit light, while retinalophototrophy results in a high energy flux per unit of simple infrastructure but lower yield per unit light.
As a pathway with high yield per unit light, chlorophototrophy allows the capture of dilute light resources for obligate phototrophs, even in difficult conditions, at the expense of high protein expression and specialization of more of the proteome. As a pathway with a higher flux per unit protein, retinalophototrophy can instead provide a benefit in high light with less total expression of a simple protein, allowing it to be used as a backstop to prevent starvation and increase metabolic flexibility and biomass yield of otherwise heterotrophic organisms without specialization. These two forms of photosystems effectively partition the metabolic niche space available to phototrophs, both in terms of resource availability and in terms of the degree of phototrophic specialization.
By graphing flux per unit protein versus yield per unit resource of optimal phototrophic systems for every tested light intensity, we can create a diagram of phototrophic niche space. It becomes apparent that the optimal physiological machinery for a given environment lies along a Pareto front[44,45] (Figure 3C) with the position along this front dictated by light intensity. Evolution should push novel phototrophic lineages towards this front from any suboptimal starting point they originate from (Figure 3D). Each phototrophic machinery type exhibits its own Pareto front with differing slopes; the point at which they cross indicates the light intensity separating niches in which one or the other is favored for driving phototrophic energy metabolism.
Why has neither phototrophic strategy completely dominated all available niche space? Fundamental architectural limitations of the catalytic cores of each phototrophic system ensure that the extremes of the investment/resource efficiency tradeoff are only accessible to one or the other. Microbial rhodopsins responsible for retinalophototrophy are a small, light-driven proton pump driven by isomerization of a single organic molecule, which only allows a single proton to be pumped per photocycle. Without any sophisticated redox-active cofactors in its structure, rhodopsin cannot be recruited to interact with electron transport chains or redox metabolism. Retinalophototrophy therefore appears to be incapable of evolving to pump more than one proton per photon and efficiently using available light resources, although its small mass means it enjoys a high maximum specific energy flux. Conversely, the chlorophototrophic reaction center appears to be constrained such that it cannot be reduced below a relatively large minimum size. While proteobacterial type II RCs have either lost or never acquired the integrated antenna domains common to other RCs, the core catalytic subunit appears to never mass under approximately 150 kilodaltons or contain fewer than a minimum of eight cofactor molecules. This minimal unit likely cannot be shrunk further while retaining its function in redox metabolism, limiting its maximum energy flux per unit mass even as it enjoys a high efficiency per unit light captured. Due to these architectural constraints, chlorophototrophy and retinalophototrophy coexist via divergent ecological and physiological trade-offs.
This fundamental flux versus yield tradeoff, manifesting in ecological niches of differing resource availability, appears to exist in other non-phototrophic metabolic contexts as well. The difference between respiration and fermentation is an example – respiration can produce several times the ATP per unit substrate consumed while producing less than half the energy flux per unit protein mass[46]. The two most common glycolytic pathways, the Etner-Doudoroff (ED) and Embden-Meyerhof-Parnas (EMP) pathway, share this relationship as well with the EMP pathway producing twice the ATP per unit carbohydrate consumed as the ED pathway, but requiring 5-fold more protein mass[47]. Much as in phototrophy, the lower-flux higher-yield EMP pathway is seen more frequently than the ED pathway in obligate anaerobes which must use glycolysis for energy and obtain higher yield from limited available substrate. This tradeoff can have important effects on growth rates and ecology, with cells requiring less proteome to be devoted to high-flux metabolic machinery able to put more productive capacity towards growth rather than metabolism resulting in a series of widespread ecologically relevant ‘bacterial growth laws’[46,48,49].
As chlorophototrophy and retinalophototrophy dominate the available phototrophic niche space, there exists little opportunity for the establishment of additional phototrophic forms de novo. All modern phototrophs will be distributed along the combined Pareto front[44,45] (Figure 3C); any newly-evolved inefficient phototrophic system will inevitably be strictly inferior to both extant established forms (Figure 3D). As such, chloro- and retinalophototrophy together exhibit strong priority effects[5,7,50,51] – otherwise known as niche incumbency[6] – which limits the establishment and success of novel photosystems which use the same resources as the established systems[7,52] even if such systems were simple to evolve. This suggests a fundamental continuity between local ecological interactions involved niche colonization and succession and patterns of evolutionary innovation at the largest of scales, as has been suggested by Baum et al., 2023[53], and implies that local ecological interactions can drastically shape the long-term history of major evolutionary innovations.
What was the sequence of evolution of these two systems, and why did one that appeared first not suppress the origin of the other in deep time due to this phenomenon of niche incumbency? It is difficult to determine from the paleontological record whether chlorophototrophs or retinalophototrophs evolved first. However, it is possible to deduce a likely sequence of evolution from physiological analyses. While chlorophototrophs are able to use light energy for either pumping protons via an electron transport chain for energy metabolism or the reduction of CO2 into biomass, retinalophototrophs are only capable of using light for energy. They are mechanistically incapable of driving redox reactions directly and fail to push the membrane to a high enough voltage to counteract natural electron transport chains[31], a precondition for driving carbon fixation via reverse electron flow. This means that there is, effectively, a third dimension to the ecological niche of phototrophy representing the ability to fix carbon using light energy. Assuming that the earliest chlorophototrophs engaged in redox chemistry, even a very slow and poorly adapted proto-chlorophototroph would be superior to a retinalophototroph in its ability to fix carbon without geologically provisioned electron sources. This would allow a way around any energy-based priority effect engendered by an established retinalophototroph via a novel carbon fixation method, and an opportunity to evolve until it too became well-optimized and filled its own area of the energy transduction trade-off curve. Our model therefore implies that retinalophototrophy likely evolved before chlorophototrophy, given that carbon fixation allows a proto-chlorophototroph to avoid evolutionary priority effects from retinalophototrophs but not the reverse.
There has been great debate about why some major evolutionary innovations exist only as singularities, while others independently evolve multiple times[3,54,55,56]. Our results suggest that priority effects may play a pivotal role in suppressing the repeated evolution of phototrophy; a phenomenon which may extend to the evolutionary patterns of some other major innovations. The evolution of complex cellular architecture, for example, is considered to have occurred only once on Earth in the form of eukaryogenesis. However, it is unclear if that is because the evolutionary pathway is complex and contingent or because eukaryotes have competitively excluded any secondary origins of such cellular complexity. A similar argument applies to the origin of life itself – is this a difficult process, or did modern life simply rapidly advance to a level of sophistication that scavenged all resources that could otherwise go towards simple novel replicators or protocells? As evidence for priority effects appears replete across biological, spatial, and temporal scales[4], it is possible that such niche incumbency could play a pivotal role in the macroevolutionary landscape of multiple major innovations.
Phototrophy is among the most important innovations in the history of life, fundamentally changing the biosphere. It is unique among major biological innovations in that it has evolved not once, and not many times, but exactly twice. Here we show that the two origins of phototrophy are mechanistically and ecologically complementary, having partitioned phototrophic niche space along a set of trade-offs that prevent either mechanism from becoming dominant. Deep architectural limitations and functional trade-offs inherent to the evolution of metabolic pathways appear to have prevented either chlorophototrophs or retinalophototrophs from occupying all phototrophic niche space individually, creating the opportunity for their stable coexistence. The remarkable fact that phototrophy evolved just twice, producing two ecologically complementary forms, however, reveals how priority effects can shape major innovations. While each established system likely prevented new phototrophic pathways from emerging through competitive exclusion, their fundamental differences in design and function meant neither could eliminate the other, allowing both to persist throughout Earth's history.
It is tempting to take evolutionary rarity as a sign of intrinsic difficulty. Yet this interpretation assumes that evolutionary innovations represent independent rolls of the dice, each with the same low probability of success. Our results challenge this view. Phototrophy may not be intrinsically difficult to evolve, as evidenced by its dual origins through fundamentally disparate routes early in the history of life. Instead, we argue that the rarity of phototrophic innovations reflects the power of evolutionary priority effects: once chlorophototrophy and retinalophototrophy saturated the available metabolic niche space, they created insurmountable competitive barriers for any subsequent phototrophic systems, regardless of how readily such systems might have evolved in their absence. This perspective has profound implications for understanding other major transitions in life's history. The singularity of events like abiogenesis or eukaryogenesis may not reflect vanishingly small probabilities or extraordinary confluences of unlikely circumstances. Instead, these innovations may have evolved with relatively high probability given appropriate conditions, but their first appearance triggered feedback processes that fundamentally altered the selective landscape, preventing future parallel evolution. A trait that evolves easily can still arise only once if its emergence forecloses the ecological opportunities necessary for its repeated evolution. In this light, life's apparent evolutionary singularities may be less contingent than they appear, their rarity stemming not from intrinsic difficulty but from the consequences of priority effects operating across billions of years of Earth history.
Materials and Methods
We first calculated an effective specific energy flux per unit protein investment of different phototrophic systems based on a literature review of vital parameters for anoxygenic chlorophototrophic RCs, oxygenic RCs, and two different microbial rhodopsins (proteorhodopsin and bacteriorhodopsin) [16,20,26,31,33,34,35,36,37,38,39,40,41,42]. Vital parameters included total protein mass per functional unit Mtotal in kDa, the maximum rate Rmax in cycles per second, protons pumped per cycle Np, and the light level at which absorption is at half-maximum Km, in units of micromoles of photons per square meter per second. Using equation 1 we calculated the maximum flux per unit protein at saturating light levels Vmax (protons per second per kDa) (See Table S1, and supplemental equation S1).
We extended this analysis from the maximal energy flux per unit mass to the flux per unit mass at differing light levels based on the absorption cross section and maximum photocycle rate Vmax of different phototrophic machineries (see supplementary file S1 and supplemental equation S2 for a detailed description). We treated light absorption and conversion as a Michaelis-Menten process resulting in equation 2, describing the energy flux per unit protein FP at a given light intensity L.
By dividing the function of the return per unit investment of each phototrophic system by the level of ambient light, we produced equation 3 describing the efficiency per unit ambient light FL, in units of protons pumped per kDa per second per micromole of photons per square meter per second and equation 4 describing the maximum energy flux per kDa per unit ambient light Ymax (Figure 4C, D and equations S3-S4).
In order to examine the theoretical capabilities of retinalophototrophs and chlorophototrophs, and the implications of the trade-offs embodied in either phototrophic system on organismal physiology, evolutionary history, and ecological interactions, we constructed an analytical model of an arbitrary phototrophic system and its photodegradation, recycling, and growth-based dilution[57,58,59,60] (Figure 1B, Supplement S1). This model consists of the central catalytic core of the rhodopsin or reaction center with a constant yield, maximum reaction velocity, and absorption cross section. It is parameterized in terms of yield per cycle Y (protons per cycle), maximum rate Vmax (photocycles per second), mass of catalytic core k (kDa), absorption cross section per catalytic core b (Å2), mass of antenna complexes x (kDa), absorption cross section per unit mass of antenna a (Å2 kDa-1) photodegradation constant D (photon-1), and recycling/dilution rate R (s-1).
The properties of a chlorophototrophic catalytic core were imputed by examining an anoxygenic bacterial type II reaction center, and those of microbial rhodopsins by examining bacteriorhodopsin. The catalytic core is paired with antenna complexes of variable size, whose absorption cross section per unit mass was imputed by examination of the LH2 antenna of a purple nonsulfur bacterium. Both chlorophototrophic reaction centers and rhodopsins were allowed to be paired or not paired with antenna complexes so as to not limit the model to configurations seen today, where only chlorophototrophs have antenna complexes larger than single carotenoid molecules, which could conceivably be due to historical contingency.
Photodegradation properties are taken from Faizi et al., 2018[57]. All parameters were constrained by previous literature and this photodegradation model except for the rate of recycling and dilution of phototrophic machinery by cell growth and division (R) which is highly dynamic depending on cellular doubling time and metabolic state. We took this value to be 0.1 hr-1 in this analysis, corresponding to a protein half-life or cellular doubling time of 6.93 hours, as this growth rate is comparable to those observed for rapidly growing chlorophototrophic algae and close to the upper growth rates modeled in Faizi et al., 2018[57]. Varying this recycling and dilution timescale did not qualitatively impact our results - see supplement S1 and supplemental Figure S4 for sensitivity analysis. See Table S2 for all variables used in this analysis and supplement S1 for calculations of all numerical variables used from a literature review.
The behavior of this model follows Michaelis–Menten kinetics with regards to light absorption by its pigment cross-section and its conversion by the catalytic core - see supplement S1 and equations S5-S10 for a detailed description of this behavior. Both the antenna and the core are also subject to photodegradation. We modified the methods of Faizi et al., 2018[57] to determine the rate of photodegradation of the phototrophic machinery at different light intensities. By combining this rate of photodegradation with a rate of dilution of degraded protein by growth and recycling, we derived the fraction of functional protein - see equations S11-S14. By applying this photodegradation and dilution correction to the flux of energy through the catalytic core, we arrive at equation 5 (see supplemental equation S15) and equation 6 (see supplemental equation S16) describing the flux per unit protein FP (protons per kDa per second) and the yield per unit incident light FL (protons per kDa per second per micromole of photons per square meter per second) of a phototrophic system.
We varied light intensity L the model was exposed to from 0.01 to 4000 micromoles of photons per square meter per second in logarithmic intervals (the upper range is similar to the radiation intensity of full sunlight at the equator). At each light intensity, we numerically optimized the chlorophototrophic and retinalophototrophic model to determine the quantity of antenna x required to maximize energy flux per unit mass, as this optimization likely maximizes growth rate and thus fitness[46,48,49]. The mass of antenna complexes associated with each catalytic core were allowed to vary freely, reflecting the widely varying antenna complexes and antenna stoichiometry to reaction centers observed across the tree of life. We calculated this optimal flux per unit protein FP and energy flux per unit light FL for these optimized systems at all light intensities. We then plotted the efficiency per unit incident light and flux per unit protein infrastructure of optimal chlorophototrophs and retinalophototrophs at all light intensities. See supplemental Figure S4 for a sensitivity analysis of this model to the free parameter of recycling rate, and S6 for an analysis of the relationship between optimal and suboptimal antenna stoichiometries at a given light intensity.
Supplementary Materials
The following supporting information can be downloaded at the website of this paper posted on Preprints.org.
Data Availability
All data used in this work is generated by the included simulation code, which we make
available. We include the generated dataset used for this analysis in the available code.
Code Availability
All python code used in this work is made available upon request, and will be posted
publicly to the Ratcliff laboratory GitHub
Author Contributions
A.J.B.: Conceptualization of project, simulation code and mathematics, data analysis, writing & editing. J.T.S.: Conceptualization of project, writing & editing. W.C.R: Conceptualization of project, writing & editing
Acknowledgements
This work was completed with funding from NIGMS grant IR35GM138030-01, “Using directed evolution to study the origins of multicellular development”
Competing Interests
The authors declare no competing interests.
References
- Herron, M.D., et al., Cellular differentiation and individuality in the ‘minor’multicellular taxa. Biological Reviews, 2013. 88(4): p. 844-861.
- Sage, R.F., T.L. Sage, and F. Kocacinar, Photorespiration and the evolution of C4 photosynthesis. Annual review of plant biology, 2012. 63(1): p. 19-47. [CrossRef]
- De Duve, C., Singularities: landmarks on the pathways of life. 2005: Cambridge University Press.
- Stroud, J., et al., Priority effects transcend scales and disciplines in biology. Trends in Ecology & Evolution, 2024. 39(7): p. 677-688. [CrossRef]
- De Meester, L., et al., Evolving perspectives on monopolization and priority effects. Trends in Ecology & Evolution, 2016. 31(2): p. 136-146.
- Jablonski, D. and J.J. Sepkoski Jr, Paleobiology, community ecology, and scales of ecological pattern. Ecology, 1996. 77(5): p. 1367-1378. [CrossRef]
- Fukami, T., Historical contingency in community assembly: integrating niches, species pools, and priority effects. Annual review of ecology, evolution, and systematics, 2015. 46(1): p. 1-23. [CrossRef]
- Reijenga, B.R., D.J. Murrell, and A.L. Pigot, Priority effects and the macroevolutionary dynamics of biodiversity. Ecology Letters, 2021. 24(7): p. 1455-1466. [CrossRef]
- Stroud, J.T. and W.C. Ratcliff, Long-term studies provide unique insights into evolution. Nature, 2025. 639(8055): p. 589-601. [CrossRef]
- Rolland, J., et al., Conceptual and empirical bridges between micro-and macroevolution. Nature Ecology & Evolution, 2023. 7(8): p. 1181-1193. [CrossRef]
- Walter, M., R. Buick, and J. Dunlop, Stromatolites 3,400–3,500 Myr old from the North pole area, Western Australia. Nature, 1980. 284(5755): p. 443-445.
- Oliver, T., et al., Time-resolved comparative molecular evolution of oxygenic photosynthesis. Biochim Biophys Acta Bioenerg, 2021. 1862(6): p. 148400. [CrossRef]
- Cardona, T., A fresh look at the evolution and diversification of photochemical reaction centers. Photosynth Res, 2015. 126(1): p. 111-34. [CrossRef]
- Field, C.B., et al., Primary production of the biosphere: integrating terrestrial and oceanic components. science, 1998. 281(5374): p. 237-240.
- Sleep, N.H. and D.K. Bird, Niches of the pre-photosynthetic biosphere and geologic preservation of Earth's earliest ecology. Geobiology, 2007. 5(2): p. 101-117. [CrossRef]
- Niwa, S., et al., Structure of the LH1–RC complex from Thermochromatium tepidum at 3.0 Å. Nature, 2014. 508(7495): p. 228-232.
- Noy, D., C.C. Moser, and P.L. Dutton, Design and engineering of photosynthetic light-harvesting and electron transfer using length, time, and energy scales. Biochim Biophys Acta, 2006. 1757(2): p. 90-105. [CrossRef]
- Ward, L.M., T. Cardona, and H. Holland-Moritz, Evolutionary Implications of Anoxygenic Phototrophy in the Bacterial Phylum Candidatus Eremiobacterota (WPS-2). Front Microbiol, 2019. 10: p. 1658.
- Xin, Y., et al., Cryo-EM structure of the RC-LH core complex from an early branching photosynthetic prokaryote. Nature communications, 2018. 9(1): p. 1-10. [CrossRef]
- Fromme, P., P. Jordan, and N. Krauß, Structure of photosystem I. Biochimica et Biophysica Acta (BBA)-Bioenergetics, 2001. 1507(1-3): p. 5-31.
- Nagashima, S. and K.V. Nagashima, Comparison of photosynthesis gene clusters retrieved from total genome sequences of purple bacteria, in Advances in Botanical Research. 2013, Elsevier. p. 151-178.
- Nawrocki, W., et al., The mechanism of cyclic electron flow. Biochimica et Biophysica Acta (BBA)-Bioenergetics, 2019.
- Shikanai, T., Chloroplast NDH: A different enzyme with a structure similar to that of respiratory NADH dehydrogenase. Biochim Biophys Acta, 2016. 1857(7): p. 1015-22. [CrossRef]
- Bryant, D.A. and D.P. Canniffe, How nature designs light-harvesting antenna systems: design principles and functional realization in chlorophototrophic prokaryotes. Journal of Physics B: Atomic, Molecular and Optical Physics, 2018. 51(3): p. 033001.
- Oesterhelt, D. and W. Stoeckenius, Rhodopsin-like protein from the purple membrane of Halobacterium halobium. Nature new biology, 1971. 233(39): p. 149-152. [CrossRef]
- Béja, O., et al., Bacterial rhodopsin: evidence for a new type of phototrophy in the sea. Science, 2000. 289(5486): p. 1902-1906.
- Rozenberg, A., et al., Microbial Rhodopsins: The Last Two Decades. Annual Review of Microbiology, 2021. 75: p. 427-447.
- Sabehi, G., et al., New insights into metabolic properties of marine bacteria encoding proteorhodopsins. PLoS Biol, 2005. 3(8): p. e273.
- Balashov, S.P., et al., Xanthorhodopsin: a proton pump with a light-harvesting carotenoid antenna. Science, 2005. 309(5743): p. 2061-4. [CrossRef]
- Ernst, O.P., et al., Microbial and animal rhodopsins: structures, functions, and molecular mechanisms. Chem Rev, 2014. 114(1): p. 126-63.
- Walter, J.M., et al., Light-powering Escherichia coli with proteorhodopsin. Proceedings of the National Academy of Sciences, 2007. 104(7): p. 2408-2412.
- Gómez-Consarnau, L., et al., Microbial rhodopsins are major contributors to the solar energy captured in the sea. Science advances, 2019. 5(8): p. eaaw8855. [CrossRef]
- Cunningham, F.X., et al., Stoichiometry of photosystem I, photosystem II, and phycobilisomes in the red alga Porphyridium cruentum as a function of growth irradiance. Plant physiology, 1989. 91(3): p. 1179-1187.
- Umena, Y., et al., Crystal structure of oxygen-evolving photosystem II at a resolution of 1.9 Å. Nature, 2011. 473(7345): p. 55-60.
- Zhang, J., et al., Structure of phycobilisome from the red alga Griffithsia pacifica. Nature, 2017. 551(7678): p. 57-63. [CrossRef]
- Scheuring, S. and J.N. Sturgis, Atomic force microscopy of the bacterial photosynthetic apparatus: plain pictures of an elaborate machinery. Photosynthesis research, 2009. 102(2-3): p. 197-211.
- Cherezov, V., et al., Room to move: crystallizing membrane proteins in swollen lipidic mesophases. Journal of molecular biology, 2006. 357(5): p. 1605-1618.
- Kolber, Z.S., et al., Bacterial photosynthesis in surface waters of the open ocean. Nature, 2000. 407(6801): p. 177-179. [CrossRef]
- Lubner, C.E., et al., Solar hydrogen-producing bionanodevice outperforms natural photosynthesis. Proceedings of the National Academy of Sciences, 2011. 108(52): p. 20988-20991.
- Friedrich, T., et al., Proteorhodopsin is a light-driven proton pump with variable vectoriality. Journal of molecular biology, 2002. 321(5): p. 821-838.
- Lanyi, J.K., Proton transfers in the bacteriorhodopsin photocycle. Biochimica et Biophysica Acta (BBA)-Bioenergetics, 2006. 1757(8): p. 1012-1018. [CrossRef]
- Kirchman, D.L. and T.E. Hanson, Bioenergetics of photoheterotrophic bacteria in the oceans. Environmental microbiology reports, 2013. 5(2): p. 188-199. [CrossRef]
- Kouyianou, K., et al., The chlorosome of Chlorobaculum tepidum: size, mass and protein composition revealed by electron microscopy, dynamic light scattering and mass spectrometry-driven proteomics. Proteomics, 2011. 11(14): p. 2867-80.
- Mori, M., E. Marinari, and A. De Martino, A yield-cost tradeoff governs Escherichia coli’s decision between fermentation and respiration in carbon-limited growth. NPJ systems biology and applications, 2019. 5(1): p. 16. [CrossRef]
- Li, Y., D.A. Petrov, and G. Sherlock, Single nucleotide mapping of trait space reveals Pareto fronts that constrain adaptation. Nature ecology & evolution, 2019. 3(11): p. 1539-1551.
- Basan, M., et al., Overflow metabolism in Escherichia coli results from efficient proteome allocation. Nature, 2015. 528(7580): p. 99-104.
- Flamholz, A., et al., Glycolytic strategy as a tradeoff between energy yield and protein cost. Proceedings of the National Academy of Sciences, 2013. 110(24): p. 10039-10044. [CrossRef]
- Scott, M. and T. Hwa, Bacterial growth laws and their applications. Current opinion in biotechnology, 2011. 22(4): p. 559-565.
- Scott, M., et al., Emergence of robust growth laws from optimal regulation of ribosome synthesis. Molecular systems biology, 2014. 10(8): p. 747.
- Connell, J.H. and R.O. Slatyer, Mechanisms of succession in natural communities and their role in community stability and organization. The american naturalist, 1977. 111(982): p. 1119-1144.
- Blount, Z.D., C.Z. Borland, and R.E. Lenski, Historical contingency and the evolution of a key innovation in an experimental population of Escherichia coli. Proceedings of the National Academy of Sciences, 2008. 105(23): p. 7899-7906. [CrossRef]
- Vannette, R.L. and T. Fukami, Historical contingency in species interactions: towards niche-based predictions. Ecology letters, 2014. 17(1): p. 115-124. [CrossRef]
- Baum, D.A., et al., The ecology–evolution continuum and the origin of life. Journal of the Royal Society Interface, 2023. 20(208): p. 20230346.
- Conway Morris, S., The runes of evolution: how the universe became self-aware. 2015: Templeton Press.
- Stroud, J.T. and J.B. Losos, Ecological opportunity and adaptive radiation. Annual Review of Ecology, Evolution, and Systematics, 2016. 47(1): p. 507-532. [CrossRef]
- Miller, A.H., J.T. Stroud, and J.B. Losos, The ecology and evolution of key innovations. Trends in Ecology & Evolution, 2023. 38(2): p. 122-131.
- Faizi, M., et al., A model of optimal protein allocation during phototrophic growth. Biosystems, 2018. 166: p. 26-36.
- Inoue, K., et al., Red-shifting mutation of light-driven sodium-pump rhodopsin. Nature communications, 2019. 10(1): p. 1-11.
- Rehorek, M. and M.P. Heyn, Binding of all-trans-retinal to the purple membrane. Evidence for cooperativity and determination of the extinction coefficient. Biochemistry, 1979. 18(22): p. 4977-4983. [CrossRef]
- She, C., et al., Low-threshold stimulated emission using colloidal quantum wells. Nano letters, 2014. 14(5): p. 2772-2777.
- Yu, L.J., et al., Structural Basis for the Unusual Qy Red-Shift and Enhanced Thermostability of the LH1 Complex from Thermochromatium tepidum. Biochemistry, 2016. 55(47): p. 6495-6504.
- Kimura, Y., et al., Surface of bacteriorhodopsin revealed by high-resolution electron crystallography. Nature, 1997. 389(6647): p. 206-211. [CrossRef]
- Tomasello, G., I. Armenia, and G. Molla, The Protein Imager: a full-featured online molecular viewer interface with server-side HQ-rendering capabilities. Bioinformatics, 2020. 36(9): p. 2909-2911. [CrossRef]
Figure 1.
Divergent phototrophic machineries and their functional models. A) Structural comparison of chlorophyll-based and retinal-based photosystems. Left: Type II reaction center with antenna complex from Thermochromatium tepidum[61]. The catalytic core (orange) contains bacteriochlorophyll pigments (green) that drive electron transport and carbon fixation, while antenna complexes (magenta) with additional pigments (blue) expand light capture. Right: Bacteriorhodopsin, a single transmembrane protein (orange) that pumps one proton per photon using a retinal chromophore (green)[62]. B) Biophysical model parameters corresponding to structural components described above. Each system has an invariant catalytic core (orange, mass k) with maximum reaction rate Vmax and proton yield Y per cycle. Core light absorption is b, while antenna mass x (magenta) provides additional absorption capacity a per unit mass. Environmental parameters include incident light intensity L, protein recycling rate R, and photodegradation constant D. Protein structures in (A) were visualized using Protein Imager[63].
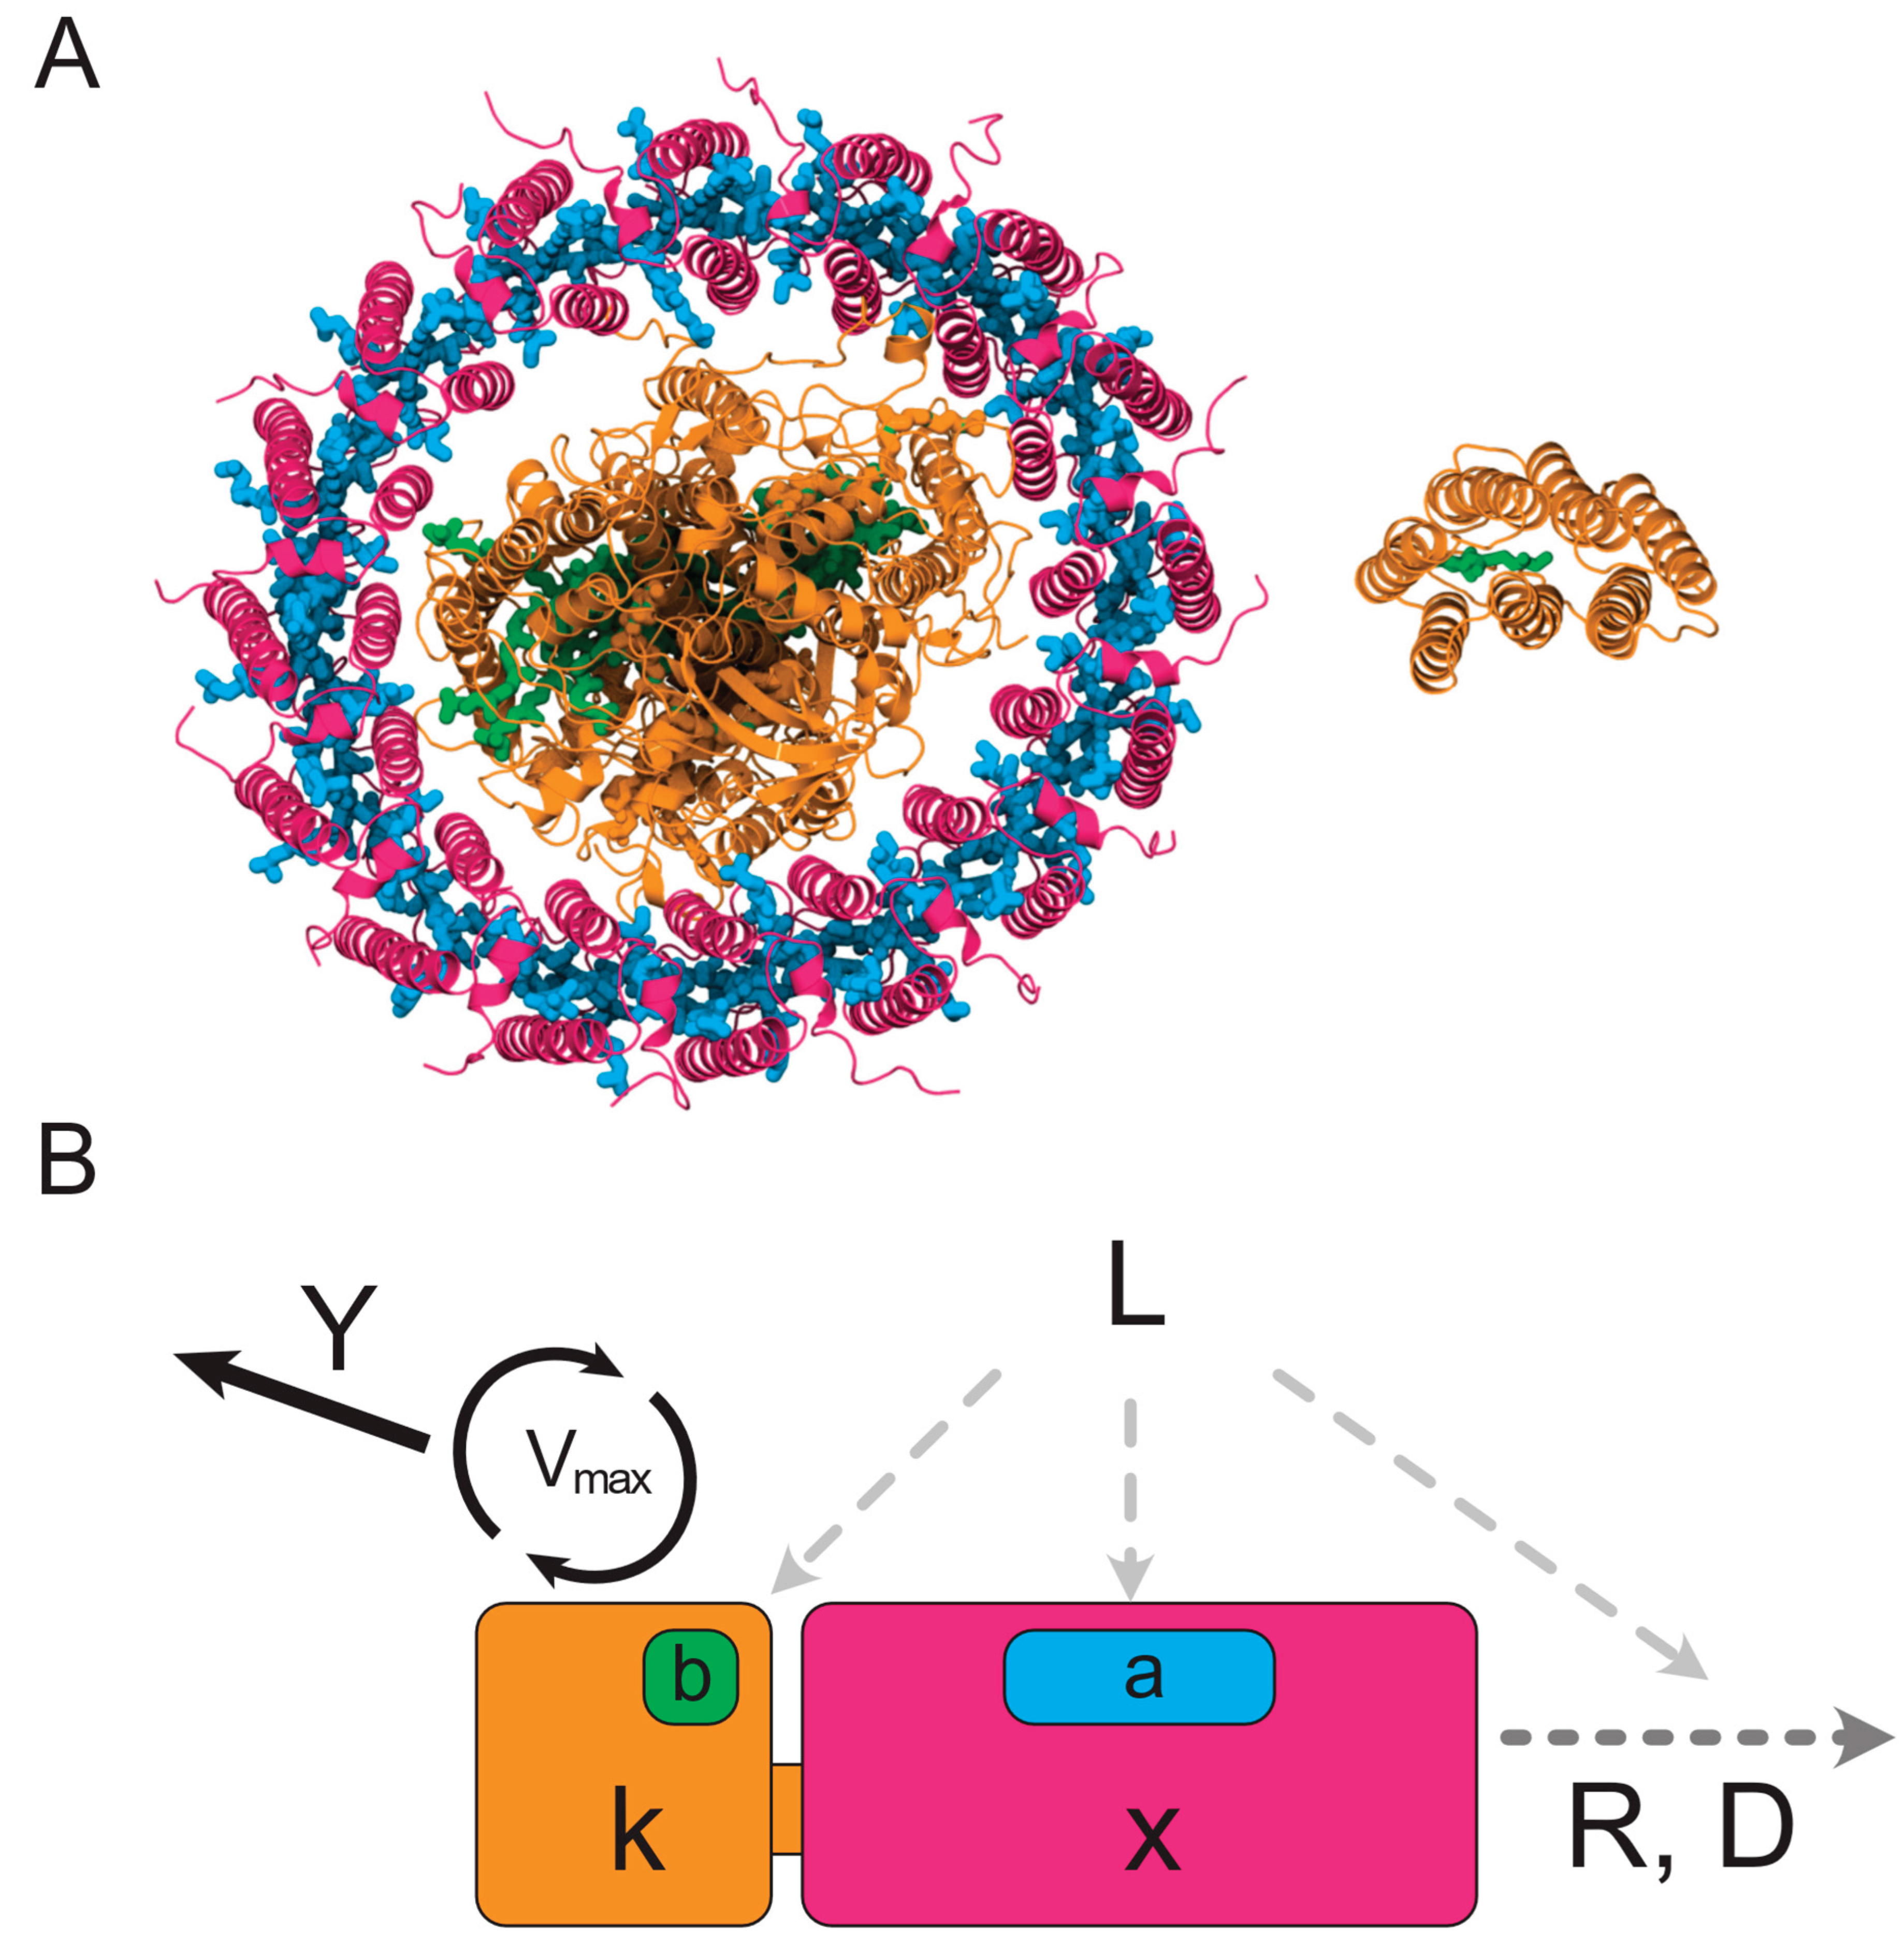
Figure 2.
Physiological comparison between modern chlorophototrophs and retinalophototrophs reveals fundamental differences in how these systems harness light energy. When examining maximum proton flux at saturating light levels (A), retinal-based systems like proteorhodopsin and bacteriorhodopsin dramatically outperform their chlorophyll-based counterparts, achieving much higher specific fluxes per unit of protein mass than either oxygenic or anoxygenic reaction centers. This advantage shifts dramatically across different light conditions (B), where chlorophyll systems demonstrate superior performance at low light intensities but quickly reach saturation, while retinal systems continue to increase their flux as light intensities rise, ultimately achieving higher maximum rates. The underlying reason for this trade-off becomes clear when examining light-use efficiency (C), which shows that chlorophyll systems extract far more energy from each individual photon than retinal systems, with oxygenic reaction centers showing particularly impressive yields per unit of incident light. This pattern persists across the full spectrum of light intensities (D), consistently demonstrating that chlorophototrophs have evolved to maximize energy extraction under scarce light conditions, while retinalophototrophs have specialized for high-flux energy generation when light is abundant.
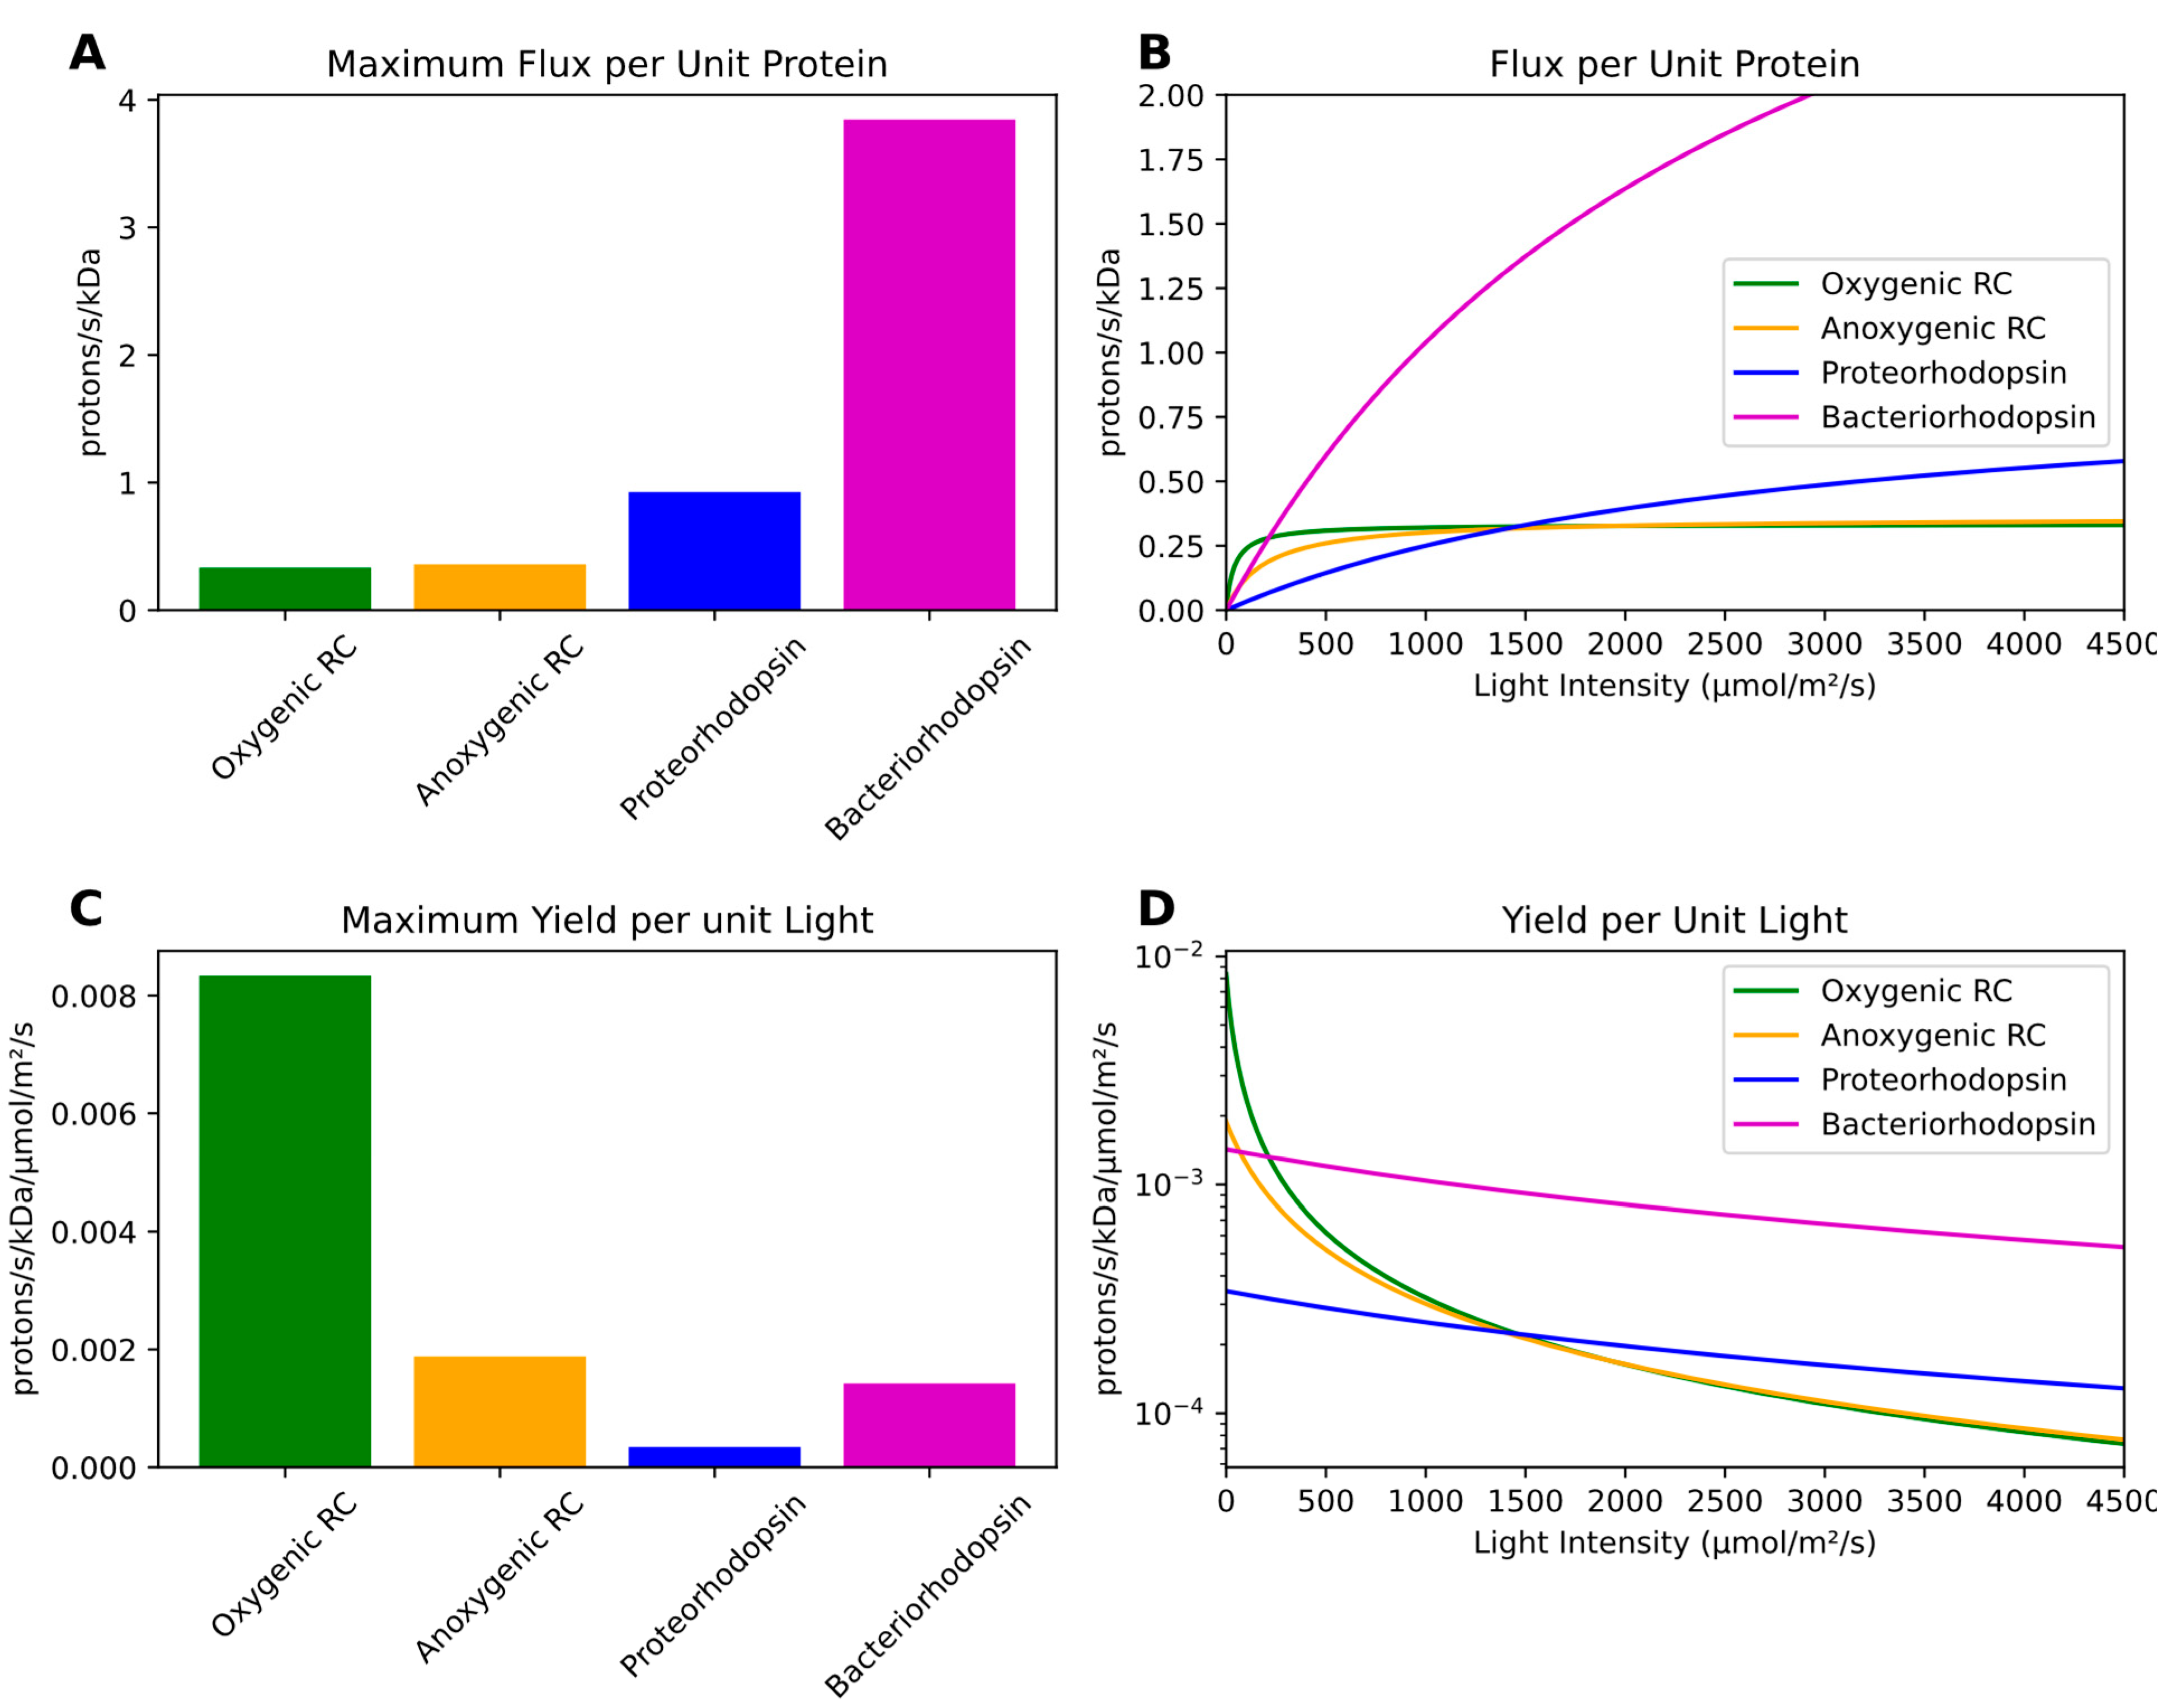
Figure 3.
Fundamental trade-offs in phototrophic machinery dictate ecological interactions and evolutionary trajectories. (A) Optimal chlorophototrophs maximize light efficiency in low light while optimal retinalphototrophs excel in high light. (B) This specialization persists when examining energy flux per unit protein, with each system showing superior flux in the same light conditions. (C) Trade-off between light efficiency and protein efficiency across all light intensities. Each system creates a Pareto front showing the maximum achievable efficiency combinations. The crossing curves demonstrate that chlorophototrophs dominate in some conditions (solid green) while retinalphototrophs dominate in others (solid purple), with non-competitive regions shown as dotted lines. (D) Evolutionary model showing priority effects in photosynthetic diversification. Modern chlorophototrophs (dark green) and retinalphototrophs (dark purple) occupy optimal positions along their respective Pareto fronts. Early, less efficient ancestors (light circles) rapidly evolved toward these optimal curves and diverged into distinct ecologies (arrows). These established systems now prevent evolution of competing pathways (red crosses) because new systems would be initially less efficient and quickly outcompeted.
Disclaimer/Publisher’s Note: The statements, opinions and data contained in all publications are solely those of the individual author(s) and contributor(s) and not of MDPI and/or the editor(s). MDPI and/or the editor(s) disclaim responsibility for any injury to people or property resulting from any ideas, methods, instructions or products referred to in the content. |
© 2025 by the authors. Licensee MDPI, Basel, Switzerland. This article is an open access article distributed under the terms and conditions of the Creative Commons Attribution (CC BY) license (http://creativecommons.org/licenses/by/4.0/).
Copyright: This open access article is published under a Creative Commons CC BY 4.0 license, which permit the free download, distribution, and reuse, provided that the author and preprint are cited in any reuse.


