

Submitted:
14 November 2026
Posted:
16 November 2026
You are already at the latest version
Abstract
In liquid propellant rocket propulsion, the absolute chamber pressure is one of the parameters for preliminary design. In the current study, we quantify the impact of this rocket design parameter (the chamber pressure) on various combustion and nozzle characteristics for three common liquid fuels, which are (1) liquid hydrogen (LH2), (2) liquid methane (CH4), and (3) Rocket Propellant-1 (RP-1), when used with liquid oxygen (LOX) as an oxidizer. The area-to-throat ratio was set to a reasonable value of 10. The range of absolute chamber pressure varies from a low level of 50 bar to a very high level of 350 bar, which allows exploration of rocket performance not typically available in the literature. Twelve properties were computed over this wide range of combustion pressure, which are (1) characteristic velocity, (2) exhaust molecular weight, (3) exhaust isentropic exponent, (4) chamber temperature, (5) exhaust absolute pressure, (6) chamber-to-exit pressure ratio, (7) exhaust temperature, (8) exhaust density, (9) exhaust Mach number, (10) rocket-relative exhaust velocity, (11) ideal specific impulse, and (12) thrust coefficient. The findings of the study show that liquid hydrogen consistently gives much higher exhaust velocity and specific impulse than liquid methane, which is mildly better than RP-1. Also, the results show that the combustion pressure impact is weak for the exhaust molecular weight, rocket-relative exhaust velocity, ideal specific impulse, and characteristic velocity. Increasing the chamber pressure monotonically increases the exhaust isentropic exponent, chamber temperature, exhaust absolute pressure, chamber-to-exit pressure ratio, exhaust temperature, exhaust density, and exhaust Mach number. On the other hand, increasing the chamber pressure monotonically decreases the thrust coefficient.
Keywords:
rocket
; propellant
; LH2
; CH4
; RP-1
1. Introduction
While both Oman (the Sultanate of Oman) and Argentina (the Argentine Republic) have active policies for national civilian space applications, they possess very different operational backgrounds. Oman relies on an accelerated, commercial partnership model to leapfrog traditional development phases [1]. On the other hand, Argentina has decades of mature, indigenous technology manufacturing [2].
1.1. National Civilian Space Plan: Oman versus Argentina
Oman announced its first national space program on 1/January 1st, 2023 [3], covering the decade of 2023–2033, titled Oman’s Space Sector Policy and Executive Program (OSSPEP). This ongoing Omani national space program is backed by Oman Vision 2040 [4], and spearheaded by the Omani Ministry of Transport, Communications, and Information Technology (MTCIT). For example, a joint initiative between MTCIT and Sultan Qaboos University (SQU), the flagship and first university in Oman, started the development of a Space Engineering Lab as a national capacity-building center for education, research, and industry collaboration [5]. The ongoing Omani national space program focuses heavily on downstream services rather than full technological autonomy and large-scale local manufacturing capabilities. Such downstream space services include Earth observation, data analytics, and global commercial launch services. The ongoing Omani national space program leverages the country’s advantageous geographical location (with equatorial proximity and Indian Ocean downrange corridors) to turn the country into a primary regional commercial hub.
Argentina’s current national space plan is the second one, and it is near its end, with a coverage decade of 2016–2027 [6]. The earlier decade phase of the Argentinian national space program was the decade 2004–2015 [7]. On May 28, 1991, the long-running Argentinian civilian space agency CONAE (Comisión Nacional de Actividades Espaciales or National Commission for Space Activities) was established [7] as a replacement for the earlier CNIE (Nacional de Investigaciones Espaciales, or National Committee for Space Research) that was founded within the Argentine Air Forces on January 28, 1960. Argentina focuses strictly on technical sovereignty of the space sector, with its core mandate centering around completing the “entire space cycle”. This means that the country aims to fully design, manufacture, and launch its own satellites from its own territory to support agriculture, climate monitoring, and national safety.
1.2. Capacity to Manufacture Spacecraft or Launch Vehicles: Oman Versus Argentina
Oman has an emerging (mainly outsourced) capacity to manufacture spacecraft or launch vehicles. Oman does not currently have advanced indigenous manufacturing facilities for deep space hardware or rockets. Instead, it relies on global procurement—such as partnering with Airbus to design and build its OmanSat-1, the first Omani Communication satellite.
Argentina is highly capable in terms of the capacity to manufacture spacecraft or launch vehicles. Argentina is an elite space manufacturer with two important state-owned firms. First, there is INVAP (Investigación Aplicada “Applied Research”), which is a technology company founded on September 1, 1976. It specializes in the design, integration, and construction of complex technological systems across nuclear, aerospace, defense, and medical sectors. Second, there is VENG (Vehículo Espacial Nueva Generación “Next Generation Space Vehicle”), which is an aerospace company established on October 19, 1998, but its active operational/commercial started later in 2007. It is affiliated with CONAE (Argentina’s National Commission for Space Activities) and develops space technology and launch vehicles. It designs and builds its own complex satellite systems internally, including the highly advanced SAOCOM radar constellations and the upcoming SABIA-Mar mission. It is also actively manufacturing its own domestic liquid-fueled orbital launch vehicle family, the Tronador II (“Tronador” is the Spanish term for “Thunderer”). The Tronador II is a two-stage liquid-propellant orbital launch vehicle developed by CONAE and its main contractor VENG to achieve domestic satellite launch independence [8].
1.3. Capacity to Launch Spacecraft: Oman Versus Argentina
Oman has demonstrated a successful suborbital launch, while LEO (low Earth orbit) launching is still developing. Oman safely completed its historic, experimental suborbital rocket launch (Duqm-1) in December 2024. While it cannot independently reach low Earth orbit (LEO) yet, Oman is positioning itself to host commercial orbital launch providers, including PLD Space's MIURA 5, with the goal of enabling commercial orbital launch operations from the Omani Etlaq Spaceport in Duqm (a port city and economic hub located on the southeastern coast of Oman, about 550 km south of Muscat) as early as 2027 [9].
Argentina has flown numerous domestic suborbital and experimental vehicles, such as the VEx (Vehículo Experimental “Experimental Vehicle”) series (like VEx-1A, VEx-1A, and VEx-5A) [10]. It currently relies on foreign launchers (like SpaceX Falcon 9 flights) to inject its large satellites into LEO, as the final orbital iteration of its domestic Tronador II launcher is still undergoing active development and testing.
1.4. Active Spaceports: Oman Versus Argentina
Oman features the Etlaq Spaceport (founded in 2022 and publicly announced in January 2023 by Oman’s National Aerospace Services Company “NASCOM”). It is located in the coastal city of Duqm. It is widely recognized as the first commercially accessible spaceport in the Middle East. The complex hosts multi-orbit, multi-vehicle launches (from micro-launchers to heavy vehicles) due to its unique coastal downrange clearance over the Arabian Sea.
Argentina operates space infrastructure such as the Teófilo Tabanera Space Center, located near Córdoba (about 30 km southwest of the inland Córdoba city in central Argentina, and located approximately 700 km northwest of Buenos Aires City). It hosts mission control, satellite integration and testing facilities, ground stations, and launch-vehicle development infrastructure. The country also operates the Punta Indio Space Center. It supports manufacturing, integration, testing, propulsion development, and experimental launch activities related to the Tronador II launcher program. The country also operates launch pads used for test flights near Pipinas (a small town in the Punta Indio District of northeastern Buenos Aires Province, lying about 160 km southeast of Buenos Aires City) and Puerto Belgrano (a major Argentinian naval base in southwestern Buenos Aires Province, located on the Atlantic coast, approximately 650 km southwest of Buenos Aires City). However, it does not currently operate an active, full-scale commercial orbital spaceport on par with the planned commercial scope of Etlaq. Argentina’s indigenous orbital launcher program (Tronador II) remains under development.
1.5. Memorandum of Understanding Between UoB (Oman) and VENG (Argentina)
Al Buraimi Education Services (BES) is the owner and parent company of the University of Buraimi (UoB), a private university in the Sultanate of Oman, located approximately 300 km from Muscat and 120 km from Dubai, adjacent to Al Ain, UAE [11]. As the founding investment entity, Al Buraimi Education Services manages corporate governance, recruitment, and high-level commercial partnerships. Meanwhile, the University of Buraimi (UoB) operates as the academic institution that executes these initiatives on the ground.
On Thursday, January 29, 2026, Al Buraimi Education Services (BES) signed a strategic memorandum of understanding (MoU) with VENG, Argentina’s leading space technology and satellite services company, to advance training, research, and innovation in the space sector. The MoU was signed at the University of Buraimi (UoB) following a meeting and discussion between representatives from BES/UoB and VENG. This partnership supports the development of national capabilities in space technologies and advanced engineering, aligning with Oman’s vision for knowledge-based, future-focused industries. According to the anticipated partnership, the University of Buraimi (UoB) plays a central role in implementing academic programs, training initiatives, and research and development (R&D) projects in collaboration with VENG, ensuring sustainable long-term impact [12].
One of the identified areas of collaboration between BES/UoB and VENG was the design and manufacture of propulsion systems for small satellites, CubeSats, and LEO space missions. This area can be supported by establishing computerized simulations for different space propulsion systems and thrusters under different configurations, which helps in optimization and performance assessment. The current study presents one aspect of such endeavors.
1.6. Objective of the Study
The objective of this study is to quantify how absolute chamber pressure affects the combustion and nozzle performance of three common bipropellant systems: LOX/LH₂, LOX/CH₄, and LOX/RP-1. These are generally considered the three dominant modern non-hypergolic bipropellant combinations.
For a fixed nozzle area-to-throat ratio of 10, the absolute pressure of the combustion chamber (the entrance of the expansion convergent-divergent nozzle) is varied from 50 to 350 bar, and 12 thermodynamic and performance properties are evaluated. This range of chamber pressure is favorably suitable because it spans:
- 1.
-
Moderate-pressure engines: approximately 50-100 bar
- Example: Rocketdyne’s H-1 (LOX/RP-1), used on the first stage of the Saturn I and Saturn IB launch vehicles: ~54 bar
- Example: SpaceX’s Merlin 1D (LOX/RP-1), ~98 bar
- 2.
-
Modern high-performance engines: approximately 100-250 bar
- Example: Blue Origin’s BE-4 (LOX/CH₄), ~134 bar
- Example: Rocketdyne’s Space Shuttle Main Engine (SSME)/RS-25 (LOX/LH2), ~206 bar [13]
- 3.
-
Very high-pressure staged-combustion/full-flow engines: ~250-350+ bar
- Example: Russia’s RD-180 (LOX/RP-1): ~267 bar
- Example: SpaceX’s Raptor (LOX/CH₄): ~300 bar
Therefore, the wide range of 50-350 bar allows observation of the effects of chamber pressure across a broad spectrum of practical engine designs.
The selected area ratio of 10 is also reasonable, although this geometric parameter depends on the application. An area ratio of 10 is typical of launch vehicles operating primarily in the lower atmosphere, compact nozzles, and some booster engines. For air and consistent comparison of propellant combinations under identical conditions, fixing the nozzle area expansion ratio at 10 is acceptable.
The analysis identifies which quantities are sensitive to chamber pressure and compares the relative performance of the three fuel–oxidizer combinations, providing preliminary simulation evidence for future propulsion research under the BES/UoB–VENG collaboration
2. Materials and Methods
Thermochemical calculations were performed with the online implementation of NASA Chemical Equilibrium with Applications (CEA) using the “Rocket” problem option [14]. This simulation tool applies a combination of an iterative chemical equilibrium algorithm (free energy minimization) [15,16,17,18] and a one-dimensional gas dynamics solver [19,20,21]. The software implementation used here is the online CEARUN (revision 4), hosted and maintained by the NASA Glenn Research Center (GRC) [22,23,24,25]. The software computes chemical equilibrium and thermodynamic properties for complex gas and condensed-phase mixtures primarily under the ideal gas approximation [26]. It is a robust and reputable tool and is widely considered the most well-known equilibrium computation software [27]. The simulation assumes a steady flow [28]. This software is free and conveniently available, which encourages its use as an educational tool in higher education for undergraduate modules in chemistry, thermodynamics, and propulsion [29,30].
Three bipropellant combinations were analyzed: liquid oxygen/liquid hydrogen (LOX/LH₂), liquid oxygen/liquid methane (LOX/CH₄), and liquid oxygen/Rocket Propellant-1 (LOX/RP-1). The oxy-combustion oxidizer for all three combinations is liquid oxygen at a cryogenic temperature of 90.15 K (–183.00 °C) [31,32]. Liquid hydrogen is at a deep cryogenic temperature of 20.15 K (–253.00 °C) [33], whereas liquid methane is at a less-severe cryogenic temperature of 111.65 K (–161.50 °C) [34], and RP-1 is at a normal ambient temperature of 298.15 K (25.00 °C) [35,36].
The nozzle exit-to-throat area ratio was fixed at 10, while the absolute chamber pressure varied from 50 to 350 bar. Fixing the nozzle geometry and simulation procedure enabled direct comparison of chamber-pressure effects among the three propellant systems.
For each case, the simulator calculated equilibrium combustion and nozzle-expansion properties. The reported outputs were characteristic velocity, exhaust molecular weight, exhaust isentropic exponent, chamber temperature, absolute exhaust pressure, chamber-to-exit pressure ratio, exhaust temperature, exhaust density, exhaust Mach number, rocket-relative exhaust velocity, ideal specific impulse, and thrust coefficient.
3. Results
The results are divided into 12 subsections that correspond to the 12 investigated properties computed over the wide range of absolute combustion pressure (50-350 bar).
3.1. Characteristic Velocity
The characteristic velocity (commonly designated with the symbol C*) is a performance parameter used in propulsion systems, most commonly in rocket engines and air-breathing combustion chambers in airplanes [37,38]. It measures the efficiency of the combustion process independently of the nozzle design. It is as a measure of the energy available from the combustion process, regardless of the downstream nozzle configurations [39].
If the chamber pressure is designated by the symbol Pc, the throat area is designated by the symbol At, and the propellant mass flow rate is designated by the symbol , then the characteristic velocity is defined in terms of these three quantities as
The above expression can be used to experimentally determine the characteristic velocity. It is also used in the current simulations to estimate the values of the characteristic velocity.
Theoretical analysis (isentropic-flow assumption) shows that a theoretical characteristic velocity can be computed as follows [40]
where γs is the isentropic exponent of the post-combustion propellant gas mixture, R is the specific gas constant of the post-combustion propellant gas mixture, Tc is the absolute temperature of the combustion chamber (the flame temperature), and is a function of γs.
Figure 1 demonstrates the remarkable difference between the characteristic velocity associated with hydrogen and that associated with either methane or RP-1. Hydrogen yields a much larger characteristic velocity at any given chamber pressure. The high characteristic velocity pertaining to hydrogen as a fuel propellant advocates its use technical for superior performance. This is added to the environmental advantage of green and blue hydrogen as clean fuels with no or reduced carbon footprints during its entire life cycle [41,42].
Regarding the qualitative trend, the characteristic velocity continuously increases with the chamber pressure. However, this gain decays as the chamber pressure increases.
Quantitatively, the characteristic velocities at 50 bar absolute chamber pressure for hydrogen, methane, and RP-1 are 2142.9 m/s, 1781.1 m/s, and 1714.5 m/s, respectively. These increase to 2167.8 m/s, 1802.9 m/s, and 1737.6 m/s at 150 bar. They increase further to 2185.6 m/s, 1818.9 m/s, and 1754.8 m/s at 350 bar. Processing these values indicates that the average (over the three fuel propellants) relative gain in the characteristic velocity between 50 bar and 150 bar is 1.24%. This percentage gain is computed as
This percentage gain is very small, and it even drops to 0.90% between 150 bar and 350 bar (despite being twice the width of the range from 50 bar to 150 bar). This percentage gain is computed as
3.2. Exhaust Molecular Weight
Figure 2 demonstrates another remarkable difference between the exhaust molecular weight associated with hydrogen and that associated with either methane or RP-1. Contrary to the characteristic velocity, hydrogen yields a much smaller exhaust molecular weight at any given chamber pressure. The low exhaust molecular weight pertaining to hydrogen as a fuel propellant stems from its small molecule size.
Regarding the qualitative trend, the exhaust molecular weight continuously increases with the chamber pressure. However, this gain decays as the chamber pressure increases.
Quantitatively, the exhaust molecular weights at 50 bar absolute chamber pressure for hydrogen, methane, and RP-1 are 17.443 kg/kmol, 25.211 kg/kmol, and 28.389 kg/kmol, respectively. These increase to 17.578 kmol/kg, 25.459 kg/kmol, and 28.743 kg/kmol at 150 bar. They increase further to 17.668 kg/kmol, 25.638 kg/kmol, and 29.011 kg/kmol at 350 bar. Processing these values indicates that the average (over the three fuel propellants) percentage gain in the exhaust molecular weight between 50 bar and 150 bar is 1.00%. This percentage gain is very small, and it even drops to 0.72% between 150 bar and 350 bar. Thus, the exhaust isentropic exponent for each fuel propellant case can be approximated as a constant (independent of the chamber pressure).
3.3. Exhaust Isentropic Exponent
Figure 3 demonstrates a less-significant difference between the exhaust isentropic exponent (γs) associated with hydrogen and that associated with either methane or RP-1. Contrary to the exhaust molecular weight but similar to the characteristic velocity, hydrogen yields a larger exhaust isentropic exponent at any given chamber pressure. While a lower molecular weight and a lower isentropic exponent are generally preferred to maximize nozzle expansion efficiency [43], hydrogen’s high isentropic exponent acts as a slight thermodynamic penalty [44]. However, it is largely overwhelmed by its massive advantage of having a lower molecular weight than the other two fuel propellants.
Regarding the qualitative trend, the exhaust isentropic exponent continuously increases with the chamber pressure. This rate of increase remains noticeable even at high chamber pressures.
Quantitatively, the exhaust isentropic exponents at 50 bar absolute chamber pressure for hydrogen, methane, and RP-1 are 1.1219, 1.1078, and 1.1028, respectively. These increase to 1.1299, 1.1133, and 1.1072 at 150 bar. They increase further to 1.1363, 1.1178, and 1.1107 at 350 bar. Processing these values indicates that the average (over the three fuel propellants) percentage gain in the exhaust isentropic exponent between 50 bar and 150 bar is 0.54%. This percentage gain is very small, suggesting that the exhaust isentropic exponent can be treated as constant (independent of the chamber pressure). The percentage gain remains at a comparable, but weaker, level of 0.43% between 150 bar and 350 bar.
3.4. Chamber Temperature
Figure 4 demonstrates a noticeable difference between the chamber temperature (Tc) associated with RP-1 and that associated with hydrogen or RP-1. Hydrocarbon liquid RP-1 (refined, rocket-grade kerosene) yields a larger chamber temperature at any given chamber pressure. The higher chamber temperature in the case of RP-1 stems from the dense carbon-carbon bonds [45] and complex molecular structure of RP-1 [46], which release a greater amount of chemical energy per unit volume during oxidation compared to the simpler fuels of methane or hydrogen. The elevated chamber temperature in the case of RP-1 places severe thermal stress on the chamber and downstream wall, thereby demanding advanced regenerative cooling and limiting the operational lifespan of reusable combustion chambers due to accelerated materials degradation and hydrocarbon coking [47].
Regarding the qualitative trend, the chamber temperature continuously increases with the chamber pressure. This gain remains noticeable even at high chamber pressures.
Quantitatively, the chamber temperatures at 50 bar absolute chamber pressure for hydrogen, methane, and RP-1 are 3273.43 °C, 3240.91 °C, and 3360.69 °C, respectively. These increase to 3425.17 °C, 3392.40 °C, and 3531.98 °C at 150 bar. They increase further to 3540.40 °C, 3510.02 °C, and 3667.47 °C at 350 bar. Processing these values indicates that the average (over the three fuel propellants) percentage gain in the chamber temperature between 50 bar and 150 bar is 4.80%. This percentage gain is very small, but it remains at a comparable, but weaker, level of 3.56% between 150 bar and 350 bar.
3.5. Absolute Exhaust Pressure
Figure 5 demonstrates the almost-linear increase in the absolute exhaust pressure (Pe) as the absolute chamber pressure (Pc) increases, regardless of the fuel propellant. This linear behavior is a consequence of compressible flow physics [48] in a supersonic nozzle having a fixed nozzle expansion ratio (exit area to throat area), where the pressure ratio (Pc/Pe) remains theoretically constant for a choked nozzle [49] regardless of the propellant’s throttling level (thus, regardless of the chamber pressure). Although the exhaust isentropic exponent affects this pressure ratio [50], its role is small. Therefore, the absolute exit pressure scales almost identically with chamber pressure across all three fuel propellants, thereby ensuring that ambient pressure mismatches (overexpansion or underexpansion) develop uniformly regardless of the propellant selected [51]. Despite the visually small differences, hydrogen exhibits the smallest exhaust pressure, while RP-1 exhibits the largest exhaust pressure.
Regarding the qualitative trend, the absolute exhaust pressure increases with the chamber pressure almost linearly regardless of the chamber pressure value.
Quantitatively, the absolute exhaust pressures at 50 bar absolute chamber pressure for hydrogen, methane, and RP-1 are 0.78179 bar, 0.79965 bar, and 0.80379 bar, respectively. These increase to 2.3055 bar, 2.3673 bar, and 2.3825 bar at 150 bar. They increase further to 5.3073 bar, 5.4660 bar, and 5.5073 bar at 350 bar. Processing these values indicates that the average (over the three fuel propellants) percentage gain in the absolute exhaust pressure between 50 bar and 150 bar is 195.78% (thus, close to the theoretical value of 100 bar ÷ 50 bar = 200%). This percentage gain affirms the strong linear correlation, but it remains consistent with an additional increase of 130.75% between 150 bar and 350 bar (thus, close to the theoretical value of 200 bar ÷ 150 bar = 133.33%).
3.6. Chamber-to-Exhaust Pressure Ratio
The very similar, almost-linear profiles of the absolute exhaust pressure (Pe) in the previous subsection are manipulated in the current subsection in such a way that magnifies their subtle differences. This is done by transforming the dimensional absolute exhaust pressure to the nondimensional ratio of the absolute chamber pressure to the absolute exhaust pressure (Pc/Pe).
Figure 6 demonstrates how effective this transformation is in terms of amplifying the obscure differences among the three fuel propellant cases, with hydrogen yielding a much higher chamber-to-exhaust pressure ratio, at any given chamber pressure, than methane or RP-1. In vacuum operation (upper stages or launching and in-space maneuvers), a higher (Pc/Pe) ratio is always preferred [52]. In the vacuum of space, the ambient pressure is practically zero (Pa ≈ 0). To extract more kinetic energy from the expanding gas in the nozzle, it is desired to allow the gas to expand as close to zero absolute pressure as possible (Pe → 0) [53]. As (Pe) approaches zero, the pressure ratio (Pc/Pe) approaches infinity. A higher (Pc/Pe) means that the expansion nozzle has successfully converted more of the gas’s internal and pressure energy into directional kinetic energy (thus, useful thrust). This is why hydrogen’s higher (Pc/Pe) ratio is heavily favored for upper-stage space engines [54].
The curves plotted in the figure represent the following function:
The denominator in the above expression is the absolute exhaust pressure that was shown in the previous subsection to be approximately increasing linearly with the absolute chamber pressure (which is the numerator in the above expression). Applying linear regression modeling for the dependence Pe(Pc) in the previous subsection, and combining the results with the above expression gives the following approximate nonlinear expressions for the ratio (Pc/Pe) as a function of the absolute chamber pressure:
Regarding the qualitative trend, the chamber-to-exhaust pressure ratio (Pc/Pe) continuously increases with the chamber pressure. This rate of increase decays as the chamber pressure increases.
Quantitatively, the chamber-to-exhaust pressure ratios (Pc/Pe) at 50 bar absolute chamber pressure for hydrogen, methane, and RP-1 are 63.956, 62.528, and 62.205, respectively. These increase to 65.063, 63.365, and 62.959 at 150 bar. They increase further to 65.947, 64.032, and 63.552 at 350 bar. Processing these values indicates that the average (over the three fuel propellants) percentage gain in the chamber-to-exhaust pressure ratio between 50 bar and 150 bar is 1.43%. This percentage gain is small, but it remains at a comparable, but weaker, level of 1.12% between 150 bar and 350 bar.
3.7. Exhaust Temperature
Figure 7 demonstrates a higher exhaust temperature (Te) associated with RP-1 than that associated with hydrogen or RP-1. While this feature resembles the one made earlier for the chamber temperature, the stronger expansion associated with hydrogen compared to methane made the exhaust temperature for hydrogen lower than that for methane, although this order was reversed in the case of the chamber temperature. Also, the gap between hydrogen and methane is more pronounced in the case of the exhaust temperature compared to the case of the chamber temperature. Because several gas properties, such as the specific heat capacity and the speed of sound, are temperature-dependent [55], the variation profile of the exhaust temperature in response to the increase in the chamber pressure has broader implications beyond the temperature alone.
Regarding the qualitative trend, the exhaust temperature continuously increases with the chamber pressure. This gain decays at high chamber pressures. This diminishing return occurs because higher chamber pressures suppress chemical dissociation in the combustion zone, meaning that as pressure rises, fewer endothermic molecular breakdowns occur to absorb excess energy, which stabilizes the available thermal energy and causes the subsequent gains in exhaust temperature to plateau.
Quantitatively, the chamber temperatures at 50 bar absolute chamber pressure for hydrogen, methane, and RP-1 are 2195.00 °C, 2249.32 °C, and 2372.32 °C, respectively. These increase to 2226.92 °C, 2300.35 °C, and 2442.85 °C at 150 bar. They increase further to 2245.18 °C, 2335.70 °C, and 2495.11 °C at 350 bar. Processing these values indicates that the average (over the three fuel propellants) percentage gain in the exhaust temperature between 50 bar and 150 bar is 2.23%. This small percentage gain decays to 1.50% between 150 bar and 350 bar.
3.8. Exhaust Density
Figure 8 demonstrates the almost-linear increase in the exhaust density (ρe) as the absolute chamber pressure (Pc) increases, regardless of the fuel propellant. This resembles the behavior of the absolute exhaust pressure discussed earlier. The linear scaling of the exhaust density with the exhaust pressure is compatible with the ideal gas law, with a weak effect from the exhaust temperature that increases with a decaying (flattening) rate when the chamber pressure increases. Unlike the three exhaust pressure lines, which were nearly overlapping, the three exhaust density lines are easily distinguishable, with hydrogen featuring the lowest line as implied by its smallest density of the combustion gases.
Regarding the qualitative trend, the exhaust density increases with the chamber pressure almost linearly regardless of the chamber pressure value.
Quantitatively, the exhaust densities at 50 bar absolute chamber pressure for hydrogen, methane, and RP-1 are 0.066450 kg/m3, 0.096123 kg/m3, and 0.103740 kg/m3, respectively. These increase to 0.19496 kg/m3, 0.28166 kg/m3, and 0.30325 kg/m3 at 150 bar. They increase further to 0.44783 kg/m3, 0.64605 kg/m3, and 0.694170 kg/m3 at 350 bar. Processing these values indicates that the average (over the three fuel propellants) relative gain in the characteristic velocity between 50 bar and 150 bar is 192.91% (thus, deviating slightly from a perfect linear relationship with the absolute chamber pressure, which implies a theoretical percentage of 200.00%). Between 150 bar and 350 bar, the average percentage gain in the exhaust density is 129.33% (again, deviating slightly from a perfect linear relationship with the absolute chamber pressure, which implies a theoretical percentage of 133.33%).
3.9. Exhaust Mach Number
Figure 9 shows how the exhaust Mach number associated with hydrogen is larger than that associated with either methane or RP-1. Despite this difference, and despite the exhaust Mach number increasing nonlinearly with a decelerating rate as the chamber pressure increases, the magnitude of these variations is very small. This can be explained by the fixed nozzle expansion ratio, which, for an idealized isentropic supersonic flow with a constant isentropic exponent, also fixes the exhaust Mach number [56]. While the computations performed here are more accurate than this idealized condition [57], their results do not deviate significantly from the idealized scenario.
Regarding the qualitative trend, the exhaust Mach number continuously increases with the chamber pressure. This rate of increase is higher at smaller values of the chamber pressure.
Quantitatively, the exhaust Mach numbers at 50 bar absolute chamber pressure for hydrogen, methane, and RP-1 are 3.056, 3.042, and 3.041, respectively. These increase to 3.070, 3.054, and 3.052 at 150 bar. They increase further to 3.082, 3.063, and 3.061 at 350 bar. Processing these values indicates that the average (over the three fuel propellants) percentage gain in the exhaust isentropic exponent between 50 bar and 150 bar is 0.40%. This percentage gain is very small, suggesting that the exhaust Mach number can be treated as constant (independent of the chamber pressure). The percentage gain remains at a comparable, but weaker, level of 0.33% between 150 bar and 350 bar.
3.10. Rocket-Relative Exhaust Velocity
Figure 10 demonstrates the remarkable difference between the rocket-relative exhaust velocity associated with hydrogen and that associated with either methane or RP-1. Hydrogen yields a much larger rocket-relative exhaust velocity at any given chamber pressure. This elevated exhaust velocity translates directly into a higher specific impulse (Isp), making hydrogen exceptionally efficient. Consequently, space engines utilizing hydrogen can achieve the velocity changes needed for deep-space missions [58] while carrying a significantly lighter propellant mass [59]. The lighter molecules of water vapor (H2O) that dominate the expanding gas in the case of hydrogen fuel propellant explain the intensified velocity because the lighter molecules must move much faster than heavier molecules to carry the same thermal energy. In other words, the exhaust velocity (Ve) is directly proportional to the square root of the absolute exhaust temperature (Te) but inversely proportional to the exhaust molecular weight (MWe) [60]. Mathematically, this is expressed as
Regarding the qualitative trend, the rocket-relative exhaust velocity continuously increases with the chamber pressure. However, this gain flattens as the chamber pressure increases.
Quantitatively, the rocket-relative exhaust velocities at 50 bar absolute chamber pressure for hydrogen, methane, and RP-1 are 3511.4 m/s, 2920.5 m/s, and 2811.1 m/s, respectively. These increase to 3549.2 m/s, 2954.0 m/s, and 2846.8 m/s at 150 bar. They increase further to 3576.0 m/s, 2978.5 m/s, and 2873.3 m/s at 350 bar. Processing these values indicates that the average (over the three fuel propellants) percentage gain in the rocket-relative exhaust velocity between 50 bar and 150 bar is 1.16%. This percentage gain is small. The percentage gain remains at a comparable, but weaker, level of 0.84% between 150 bar and 350 bar.
3.11. Ideal Specific Impulse
The ideal specific impulse, or matched-pressure specific impulse, (Isp) is a scaled form of the rocket-relative exhaust velocity (Ve), with the scaling factor being the constant sea-level gravitational acceleration (g0). Therefore,
The value of (g0) is assigned the value of 9.81 m/s2. Being “ideal” or “matched-pressure” means that this specific impulse is computed under the condition that the gases leave the nozzle with an exhaust pressure (Pe) that is equal to the ambient condition (Pa).
Figure 11 demonstrates the remarkable difference between the ideal specific impulse associated with hydrogen and that associated with either methane or RP-1. Due to this simple scaling, the profiles of the ideal specific impulse become qualitatively identical to those shown earlier for the rocket-relative exhaust velocity.
Regarding the qualitative trend, the ideal specific impulse continuously increases with the chamber pressure. However, this gain decays as the chamber pressure increases.
Quantitatively, the ideal specific impulses at 50 bar absolute chamber pressure for hydrogen, methane, and RP-1 are 357.9 s, 297.7 s, and 286.6 s, respectively. These increase to 361.8 s, 301.2 s, and 290.2 s at 150 bar. They increase further to 364.5 s, 303.6 s, and 292.9 s at 350 bar. Processing these values indicates that the average (over the three fuel propellants) percentage gain in the ideal specific impulse between 50 bar and 150 bar is 1.16%, which is identical to the one reported earlier for the rocket-relative exhaust velocity (given their simple linear-scaling correlation). Similarly, between 150 bar and 350 bar, the percentage gain for the ideal specific impulse is identical to that reported earlier for the rocket-relative exhaust velocity, which is 0.84%.
3.12. Thrust Coefficient
The thrust coefficient (CF) is a dimensionless number that expresses the thrust force (T) in terms of the hypothetical force formed when the absolute chamber pressure (Pc) is applied on the throat area (At). Thus, the thrust coefficient is defined mathematically as [61]
Recalling that the characteristic velocity is defined as , the thrust coefficient can be computed also as
Therefore, we have
Given that the specific impulse is defined as the thrust per unit mass flow rate of the propellant and divided by a reference gravitational acceleration,
the ideal specific impulse can be expressed in terms of the thrust coefficient and characteristic velocity as follows [62]:
Figure 12 shows that the thrust coefficient declines as the chamber pressure increases, regardless of the fuel propellant type. Hydrogen has a distinctively lower value than either methane or RP-1. However, careful assessment of the magnitude of these changes reveals that they are insignificant.
Regarding the qualitative trend, the thrust coefficient continuously decreases with the chamber pressure. This drop is stronger at low chamber pressures.
Quantitatively, the thrust coefficients at 50 bar absolute chamber pressure for hydrogen, methane, and RP-1 are 1.6386, 1.6397, and 1.6396, respectively. These decrease to 1.6373, 1.6385, and 1.6384 at 150 bar. They decrease further to 1.6362, 1.6376, and 1.6374 at 350 bar. Processing these values indicates that the average (over the three fuel propellants) percentage loss in the thrust coefficient between 50 bar and 150 bar is 0.08%. This percentage loss is very small, suggesting that the thrust coefficient can be treated as constant (independent of the chamber pressure). The percentage loss remains at a comparable, but weaker, level of 0.06% between 150 bar and 350 bar. Thus, the relative changes in the thrust coefficient (as a result of increasing the chamber pressure) are nearly zero.
4. Discussion
This section is dedicated to providing a summary of the behavior observed for the 12 properties of the three liquid fuel propellants analyzed here (with liquid oxygen being a common oxidizer for them).
This summary is presented in Table 1.
5. Conclusions
In the current numerical study, the effects of the chamber pressure in a rocket engine with a nozzle expansion ratio of 10 were analyzed over a wide range of 50 bar to 350 bar (absolute pressures). Three common bipropellant systems (LOX/LH₂, LOX/CH₄, and LOX/RP-1) were contrasted. The simulation software used was the well-established Chemical Equilibrium with Applications (CEA) by NASA (United States National Aeronautics and Space Administration). Various qualitative and quantitative insights were highlighted through visual and numerical processing of the raw results.
The study also discussed the status of the space sector in Oman and Argentina, with the possibility of realizing an institutional-level collaboration (between the Omani University of Buraimi and the Argentinian company VENG) in that sector. This potential collaboration motivated the present work. The study focused only on simplified computational modeling, while excluding other important factors, such as materials, costs, and hazards.
The following remarks can be stated based on the findings of the present work.
- The magnitude of the change (either increasing or decreasing) is generally small, with the exception of the exhaust pressure and exhaust density.
- The responses of all investigated combustion/nozzle characteristics show monotonic change with the chamber pressure, with a plateau phenomenon (decaying change toward leveling off) at high chamber pressures.
- The chamber pressure is not an attractive control variable to adjust or optimize the performance of a rocket engine.
- All the investigated combustor/nozzle characteristics increase with the chamber pressure except the thrust coefficient, which decreases.
- Hydrogen tends to provide superior performance, followed by methane, and then RP-1.
Funding
This research received no external funding.
Institutional Review Board Statement
Not applicable.
Informed Consent Statement
Not applicable.
Data Availability Statement
Data are contained within the article.
Conflicts of Interest
The author declares no conflicts of interest.
References
- Pathak, S.; Ningthoujam, A.S. India-Oman Space Cooperation: Opportunities and Challenges. Strateg. Anal. 2025, 49, 342–354. [Google Scholar] [CrossRef]
- Adler, E. The Power of Ideology: The Quest for Technological Autonomy in Argentina and Brazil; University of California Press: Berkeley, California, USA, 1987; ISBN 978-0-520-05485-1. [Google Scholar]
- MTCIT, [Omani Ministry of Transport, Communications and Information Technology] Oman’s Space Sector Policy and Executive Program. Available online: https://mtcit.gov.om/library-3/legislations-policies-8/policies-73/omans-space-sector-policy-and-executive-program-446 (accessed on 13 September 2026).
- Marzouk, O.A. Portrait of the Decarbonization and Renewables Penetration in Oman’s Energy Mix, Motivated by Oman’s National Green Hydrogen Plan. Energies 2024, 17, 4769. [Google Scholar] [CrossRef]
- Mughal, M.R.; Busaidi, S.A.; Al-Lawati, H.; Bourdoucen, H.; Al-Tarhuni, N.; Maashri, A.A.; Ghafri, S.A.; Saadi, A.A.; Al Shoaili, S.H. The Role of the MTCIT–SQU Space Engineering Lab Initiative in Capacity Building for Space Innovation: 2025 IAF Symposium on Emerging Space Ecosystems at the 76th International Astronautical Congress, IAC 2025. IAF Symposium on Emerging Space Ecosystems-Held at the 76th International Astronautical Congress, IAC 2025, 113–117. [Google Scholar] [CrossRef]
- UNIDIR. United Nations Institute for Disarmament Research] Argentina - Space Security Portal. Available online: https://spacesecurityportal.org/states/argentina (accessed on 18 October 2026).
- UN, [United Nations] Argentina National Space Activities Commission (CONAE) | UN-SPIDER Knowledge Portal. Available online: https://un-spider.org/argentina-national-space-activities-commission-conae (accessed on 18 October 2026).
- Propulsion Services. Available online: https://veng.com.ar/en/access-to-space/propulsion-services/ (accessed on 18 October 2026).
- ES, [European Spaceflight] PLD Space Signs Agreement to Launch Miura 5 from Oman. Available online: https://europeanspaceflight.com/pld-space-signs-agreement-to-launch-miura-5-from-oman/ (accessed on 18 October 2026).
- Gunter, K. Gunter’s Space Page │ VEx Family. Available online: https://space.skyrocket.de/doc_lau_fam/vex.htm (accessed on 22 October 2026).
- OO, [Oman Observer] Al Buraimi Educational Services Decreases Capital. Available online: https://www.omanobserver.om/article/77907/Business/al-buraimi-educational-services-decreases-capital (accessed on 18 October 2026).
- UoB, [University of Buraimi] Al Buraimi Education Services and Argentina’s VENG Sign Strategic MoU in the Space Sector. Available online: https://uob.edu.om/en/about/events-news/news/al-buraimi-education-services-and-argentinas-veng-sign-strategic-mou-in-the-space-sector (accessed on 18 October 2026).
- NASA. The RS-25 Engine: Lineage of the Space Launch System Powerhouse - NASA. United States National Aeronautics and Space Administration. Available online: https://www.nasa.gov/image-article/rs-25-engine-lineage-of-space-launch-system-powerhouse/ (accessed on 18 October 2026).
- NASA. CEARUN Rev4. United States National Aeronautics and Space Administration. Available online: https://cearun.grc.nasa.gov/ (accessed on 7 September 2026).
- Gordon, S.; McBride, B.J. Computer Program for Calculation of Complex Chemical Equilibrium Compositions and Applications. Part 1: Analysis; GRC [Glenn Research Center] - NASA [United States National Aeronautics and Space Administration]: Cleveland, Ohio, USA, 1994; pp. 1–58. [Google Scholar]
- McBride, B.J.; Gordon, S. Computer Program for Calculation of Complex Chemical Equilibrium Compositions and Applications II. Users Manual and Program Description; GRC [Glenn Research Center] - NASA [United States National Aeronautics and Space Administration]: Cleveland, Ohio, USA, 1996; pp. 1–184. [Google Scholar]
- Gordon, S.; McBride, B.J. Computer Program for Calculation of Complex Chemical Equilibrium Compositions, Rocket Performance, Incident and Reflected Shocks, and Chapman-Jouguet Detonations Interim Revision; GRC [Glenn Research Center] - NASA [United States National Aeronautics and Space Administration]: Cleveland, Ohio, USA, 1976. [Google Scholar]
- NASA. United States National Aeronautics and Space Administration] Chemical Equilibrium with Applications (CEA). Available online: https://www.nasa.gov/glenn/research/chemical-equilibrium-with-applications (accessed on 6 September 2026).
- Marzouk, O.A. The Sod Gasdynamics Problem as a Tool for Benchmarking Face Flux Construction in the Finite Volume Method. Sci. Afr. 2020, 10, e00573. [Google Scholar] [CrossRef]
- Marzouk, O.A. A Two-Step Computational Aeroacoustics Method Applied to High-Speed Flows. Noise Control Eng. J. 2008, 56, 396. [Google Scholar] [CrossRef]
- Marzouk, O.A. Detailed and Simplified Plasma Models in Combined-Cycle Magnetohydrodynamic Power Systems. Int. J. Adv. Appl. Sci. 2023, 10, 96–108. [Google Scholar] [CrossRef]
- Dever, J.A.; Nathal, M.V.; DiCarlo, J.A. Research on High-Temperature Aerospace Materials at NASA Glenn Research Center. J. Aerosp. Eng. 2013, 26, 500–514. [Google Scholar] [CrossRef]
- Sharp, L.M.; Dietrich, D.L.; Motil, B.J. Microgravity Fluids and Combustion Research at NASA Glenn Research Center. J. Aerosp. Eng. 2013, 26, 439–450. [Google Scholar] [CrossRef]
- Garg, S. Aircraft Turbine Engine Control Research at NASA Glenn Research Center. J. Aerosp. Eng. 2013, 26, 422–438. [Google Scholar] [CrossRef]
- Misra, A.K.; Greenbauer-Seng, L.A. Aerospace Propulsion and Power Materials and Structures Research at NASA Glenn Research Center. J. Aerosp. Eng. 2013, 26, 459–490. [Google Scholar] [CrossRef]
- Cuadra, A.; Huete, C.; Vera, M. Combustion Toolbox: An Open-Source Thermochemical Code for Gas- and Condensed-Phase Problems Involving Chemical Equilibrium. Comput. Phys. Commun. 2026, 320, 110004. [Google Scholar] [CrossRef]
- Bhattacharjee, S.; Paolini, C. Property Evaluation in The Expert System for Thermodynamics (“TEST”) Web Application. Calphad 2009, 33, 343–352. [Google Scholar] [CrossRef]
- Nayfeh, A.H.; Marzouk, O.A.; Arafat, H.N.; Akhtar, I. Modeling the Transient and Steady-State Flow Over a Stationary Cylinder. Proc. 2005, Volume 1, 1513–1523. [Google Scholar] [CrossRef]
- Marzouk, O.A. Benchmarks for the Omani Higher Education Students-Faculty Ratio (SFR) Based on World Bank Data, QS Rankings, and THE Rankings. Cogent Educ. 2024, 11, 2317117. [Google Scholar] [CrossRef]
- Paolini, C.; Bobba, K.; Surana, P.; Bhattacharjee, S. A Java Based Web Application for Performing Chemical Equilibrium Analysis in Thermodynamics Courses. In Proceedings of the Proceedings. Frontiers in Education. 36th Annual Conference, October 2006; pp. 17–22. [Google Scholar]
- Marzouk, O.A. Radiant Heat Transfer in Nitrogen-Free Combustion Environments. Int. J. Nonlinear Sci. Numer. Simul. 2018, 19, 175–188. [Google Scholar] [CrossRef]
- Rodríguez Otero, R.; Morales-Jimenez, S.; Ureña Contreras, K.; Baez Cortes, J. Loxodon-1: Development of the First Liquid Rocket Engine in Puerto Rico. In Proceedings of the ASCEND 2020, November 16 2020; American Institute of Aeronautics and Astronautics: Virtual Event; pp. AIAA 2020–4258. [Google Scholar]
- Liu, Y.; Zhou, P.; Jeong, B.; Wang, H. Design and Optimization of a Type-C Tank for Liquid Hydrogen Marine Transport. Int. J. Hydrogen Energy 2023, 48, 34885–34896. [Google Scholar] [CrossRef]
- Salman, M.N.; Ranjbar, S.F.; Jafari, M.; Talati, F. Efficiency Enhancement in the Liquefied Natural Gas Storage Scheme: Exploring Thermal Performance for Enhanced Energy Storage Solutions. Energy Storage 2024, 6, e70049. [Google Scholar] [CrossRef]
- Nichols, G.; Kweskin, S.; Frericks, M.; Reiter, S.; Wang, G.; Orf, J.; Carvallo, B.; Hillesheim, D.; Chickos, J. Evaluation of the Vaporization, Fusion, and Sublimation Enthalpies of the 1-Alkanols: The Vaporization Enthalpy of 1-, 6-, 7-, and 9-Heptadecanol, 1-Octadecanol, 1-Eicosanol, 1-Docosanol, 1-Hexacosanol, and Cholesterol at T = 298.15 K by Correlation Gas Chromatography. J. Chem. Eng. Data 2006, 51, 475–482. [Google Scholar] [CrossRef]
- Jofre, L.; Urzay, J. Interface Dynamics in the Transcritical Flow of Liquid Fuels into High-Pressure Combustors. In Proceedings of the 53rd AIAA/SAE/ASEE Joint Propulsion Conference, Atlanta, GA, July 10 2017; American Institute of Aeronautics and Astronautics; pp. AIAA 2017–4940. [Google Scholar]
- van Dam, C.P. The Aerodynamic Design of Multi-Element High-Lift Systems for Transport Airplanes. Prog. Aerosp. Sci. 2002, 38, 101–144. [Google Scholar] [CrossRef]
- Marzouk, O.A. Aerial E-Mobility Perspective: Anticipated Designs and Operational Capabilities of eVTOL Urban Air Mobility (UAM) Aircraft. Edelweiss Appl. Sci. Technol. 2025, 9, 413–442. [Google Scholar] [CrossRef]
- Chandler Karp, A.; Jens, E.T. Chapter 2 - Introduction to Rocket Propulsion. In Hybrid Rocket Propulsion Design Handbook; Academic Press: London, UK, 2024; pp. 19–35. ISBN 978-0-12-816199-9. [Google Scholar]
- MIT Rocket Team Nozzle & Combustion Chamber Design Guide. Available online: https://wikis.mit.edu/confluence/pages/viewpage.action?pageId=153816550 (accessed on 21 October 2026).
- Marzouk, O.A. Levelized Cost of Green Hydrogen (LCOH) in the Sultanate of Oman Using H2A-Lite with Polymer Electrolyte Membrane (PEM) Electrolyzers Powered by Solar Photovoltaic (PV) Electricity. E3S Web Conf. 2023, 469, 00101. [Google Scholar] [CrossRef]
- Marzouk, O.A. Performance Analysis of Shell-and-Tube Dehydrogenation Module. Int. J. Energy Res. 2017, 41, 604–610. [Google Scholar] [CrossRef]
- Sutton, G.P.; Biblarz, O. Rocket Propulsion Elements, 9th edition.; John Wiley & Sons Inc: Hoboken, New Jersey, USA, 2017; ISBN 978-1-118-75365-1. [Google Scholar]
- Zucrow, M.J.; Hoffmann, J.D. Gas Dynamics. 2: Multidimensional Flow; Wiley: New York, USA, 1977; ISBN 978-0-471-01806-3. [Google Scholar]
- Kwon, H.; Lele, A.; Zhu, J.; McEnally, C.S.; Pfefferle, L.D.; Xuan, Y.; van Duin, A.C.T. ReaxFF-Based Molecular Dynamics Study of Bio-Derived Polycyclic Alkanes as Potential Alternative Jet Fuels. Fuel 2020, 279, 118548. [Google Scholar] [CrossRef]
- Han, S.; Li, X.; Zheng, M.; Guo, L. Initial Reactivity Differences between a 3-Component Surrogate Model and a 24-Component Model for RP-1 Fuel Pyrolysis Evaluated by ReaxFF MD. Fuel 2018, 222, 753–765. [Google Scholar] [CrossRef]
- Roback, R.; Szetela, E.J.; Spadaccini, L.J. Deposit Formation in Hydrocarbon Fuels. J. Eng. Power 1983, 105, 59–65. [Google Scholar] [CrossRef]
- Marzouk, O.A. Estimated Electric Conductivities of Thermal Plasma for Air-Fuel Combustion and Oxy-Fuel Combustion with Potassium or Cesium Seeding. Heliyon 2024, 10, e31697. [Google Scholar] [CrossRef]
- Stow, S.R.; Dowling, A.P.; Hynes, T.P. Reflection of Circumferential Modes in a Choked Nozzle. J. Fluid Mech. 2002, 467, 215–239. [Google Scholar] [CrossRef]
- Meng, Y.; Shi, J.; Zhou, L.; Zhang, Y.; Wang, Z. Influences of Nozzle Pressure Ratio on Flow Characteristics of Serpentine Multi-Stream Supersonic Nozzle. J. Phys. Conf. Ser. 2024, 2707, 012081. [Google Scholar] [CrossRef]
- Yu, Y.; Yu, T.; Mao, Y.; Yang, Y.; Liang, S. Key Factors Affecting Overexpanded Flow Separation in Design of Large Expansion Ratio Single Expansion Ramp Nozzle. Aeronaut. J. 2025, 129, 717–736. [Google Scholar] [CrossRef]
- Vernacchia, M. Nozzle Flow — Proptools: Rocket Propulsion Design Tools. Available online: https://proptools.readthedocs.io/en/latest/nozzle_tutorial.html (accessed on 17 September 2026).
- Zucker, R.D.; Biblarz, O. Fundamentals of Gas Dynamics; John Wiley & Sons: USA, 2019; Vol. 3, ISBN 978-1-119-48170-6. [Google Scholar]
- Cecere, D.; Giacomazzi, E.; Ingenito, A. A Review on Hydrogen Industrial Aerospace Applications. Int. J. Hydrogen Energy 2014, 39, 10731–10747. [Google Scholar] [CrossRef]
- Marzouk, O.A. Temperature-Dependent Functions of the Electron–Neutral Momentum Transfer Collision Cross Sections of Selected Combustion Plasma Species. Appl. Sci. 2023, 13, 11282. [Google Scholar] [CrossRef]
- Boes, K.; Inhestern, L.B.; Paniagua, G. 1D Modeling of Supersonic Passage Starting Using Air-Water Similarity. In Proceedings of the AIAA SCITECH 2025 Forum, Orlando, FL, January 6 2025; American Institute of Aeronautics and Astronautics; pp. AIAA 2025–2458. [Google Scholar]
- EMRICH, J. PRINCIPLES OF NUCLEAR ROCKET PROPULSION; BUTTERWORTH-HEINEMANN INC: Oxford, UK, 2023; ISBN 978-0-323-90031-7. [Google Scholar]
- Frisbee, R.H. Advanced Space Propulsion for the 21st Century. J. Propuls. Power 2003, 19, 1129–1154. [Google Scholar] [CrossRef]
- Turner, M.J.L. (Ed.) Nuclear Propulsion. In Rocket and Spacecraft Propulsion: Principles, Practice and New Developments; Springer: Berlin, Heidelberg, 2009; pp. 219–269. ISBN 978-3-540-69203-4. [Google Scholar]
- Hill, P.G.; Peterson, C.R. Mechanics and Thermodynamics of Propulsion, 2nd ed.; Addison-Wesley: Reading, Mass, 1992; ISBN 978-0-201-14659-2. [Google Scholar]
- ATI. Rocket Thrust Equation and Launch Vehicles. [Applied Technology Institute. Available online: https://aticourses.com/rocket-thrust-equation-and-launch-vehicles/ (accessed on 21 October 2026).
- Jove-Casulleras, R.; Tristancho, J.; Vera-Flores, C. Technical Constraints for a Low-Cost Femto-Satellite Launcher. In Proceedings of the 49th AIAA Aerospace Sciences Meeting including the New Horizons Forum and Aerospace Exposition, January 4 2011; American Institute of Aeronautics and Astronautics: Orlando, Florida; pp. AIAA 2011–546. [Google Scholar]
Figure 1.
Increasing characteristic velocity due to increasing chamber pressure.
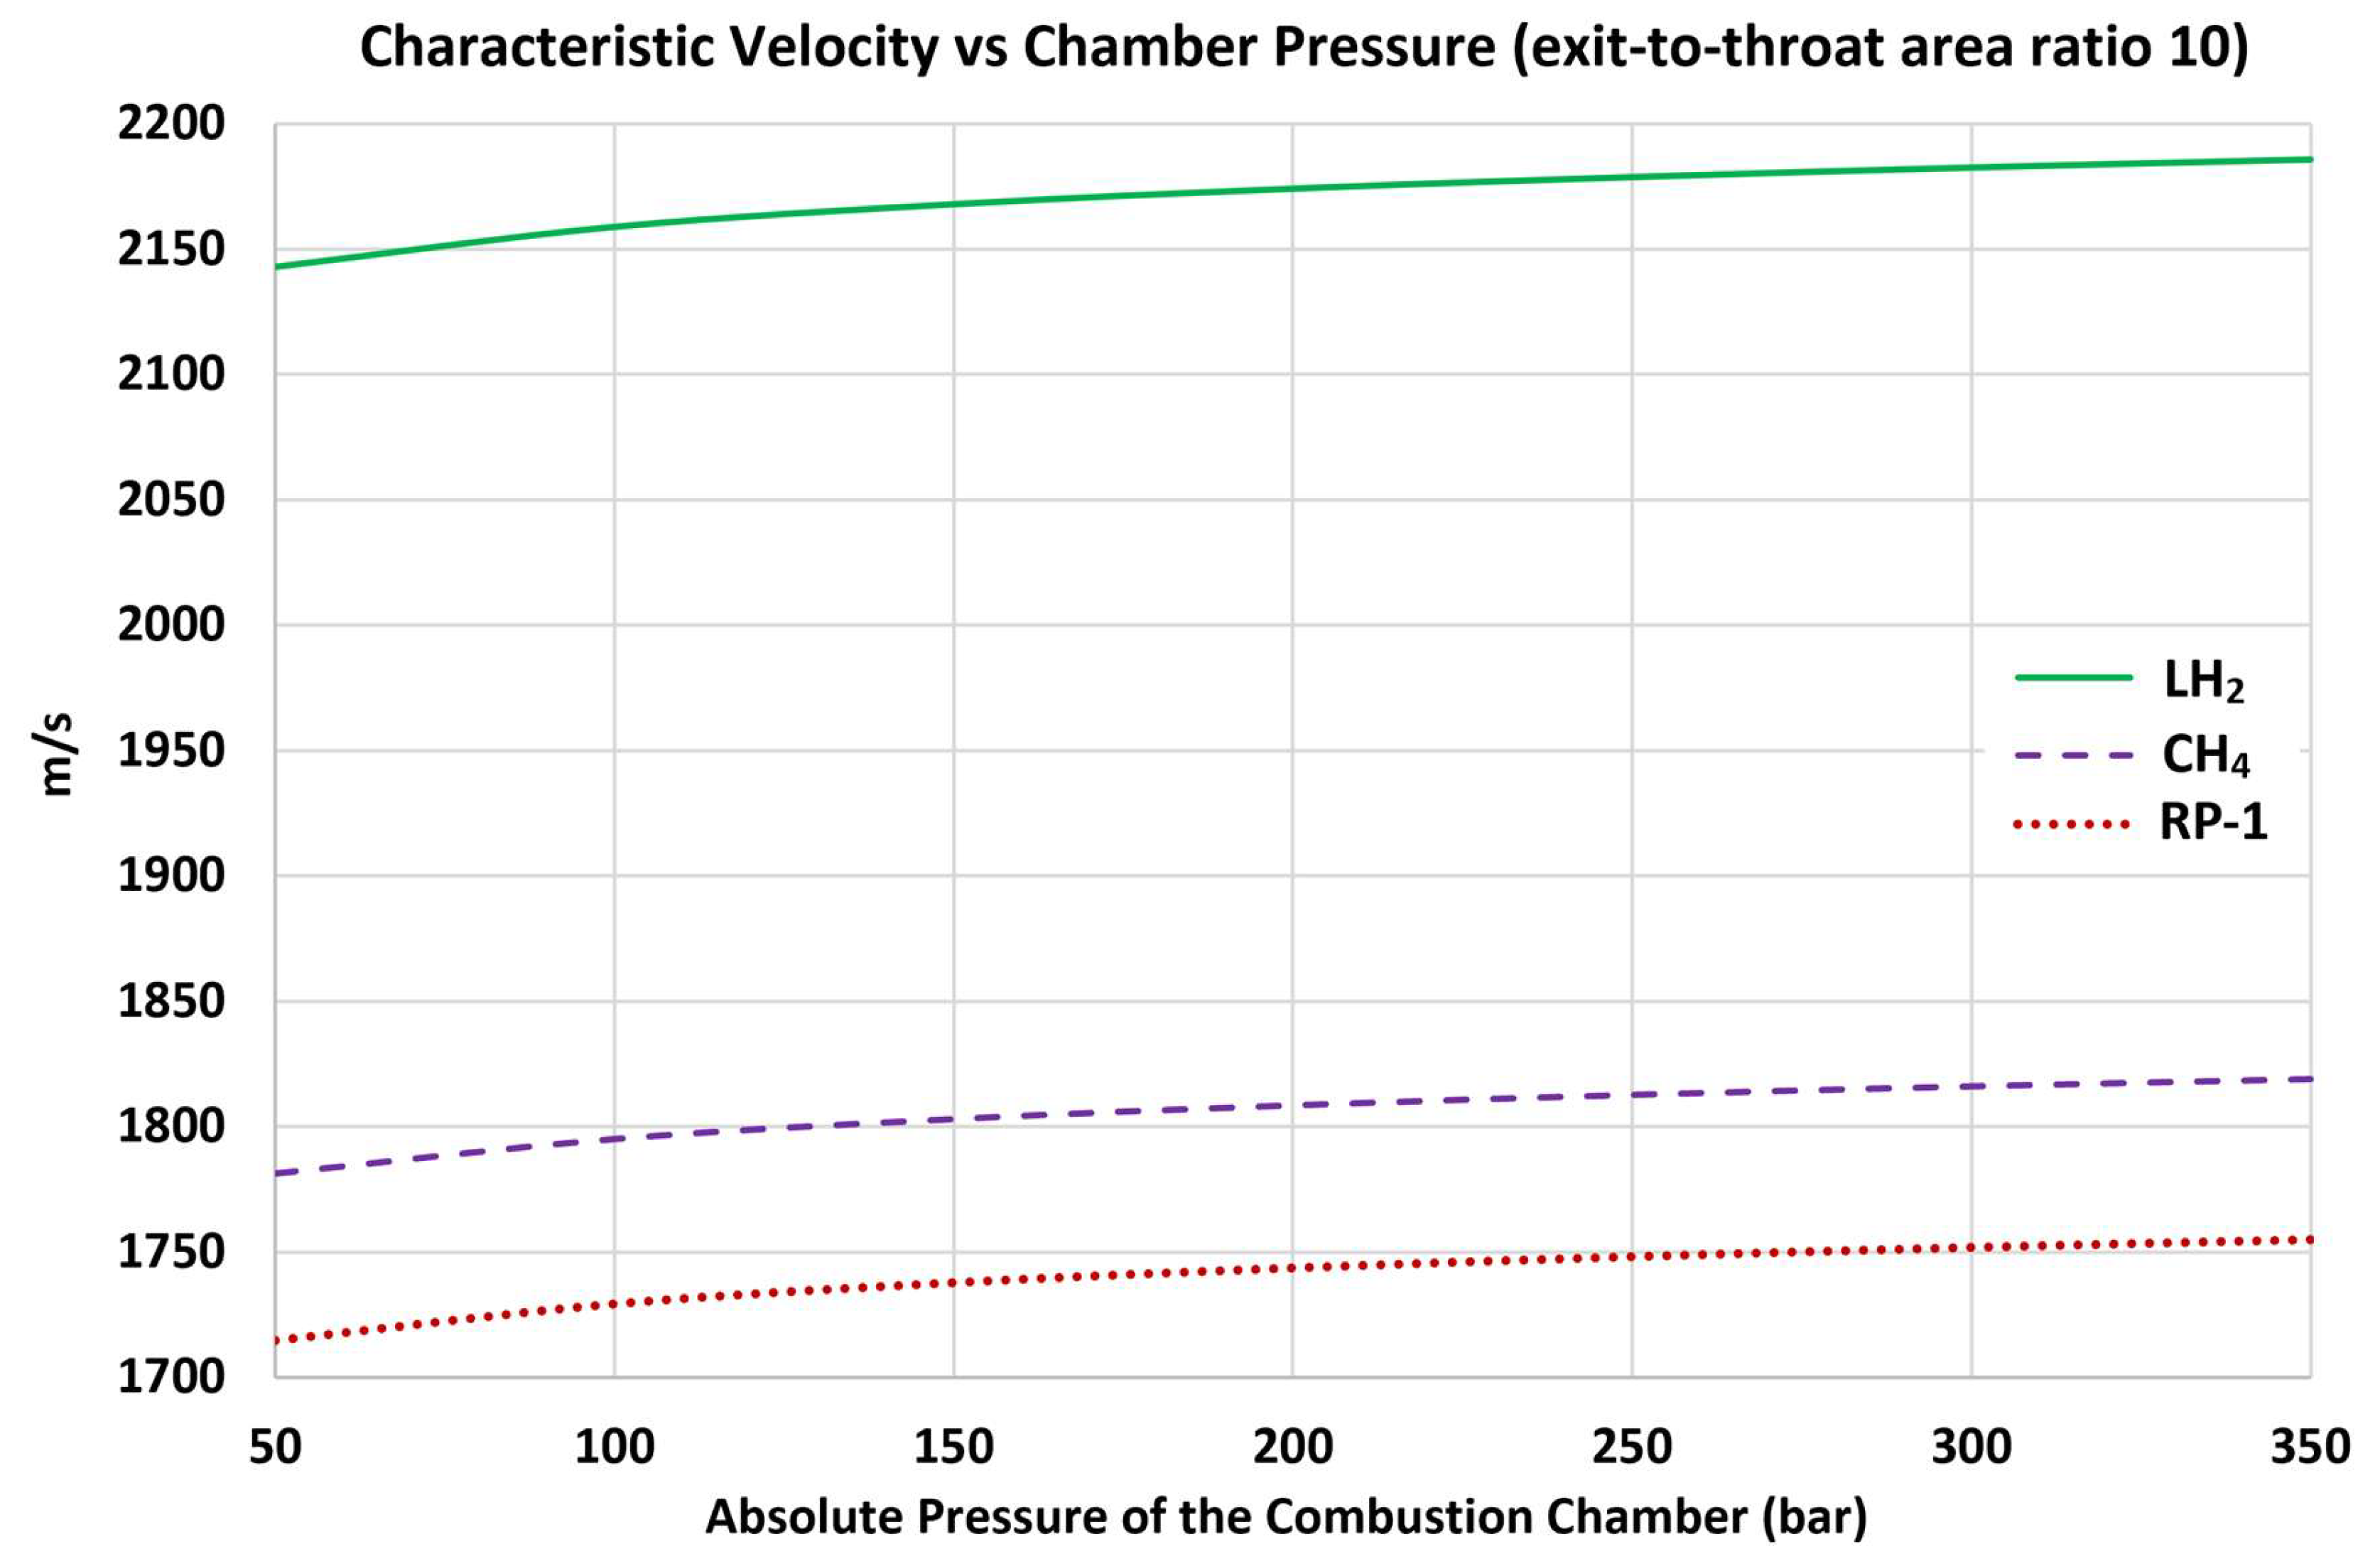
Figure 2.
Increasing exhaust molecular weight due to increasing chamber pressure.
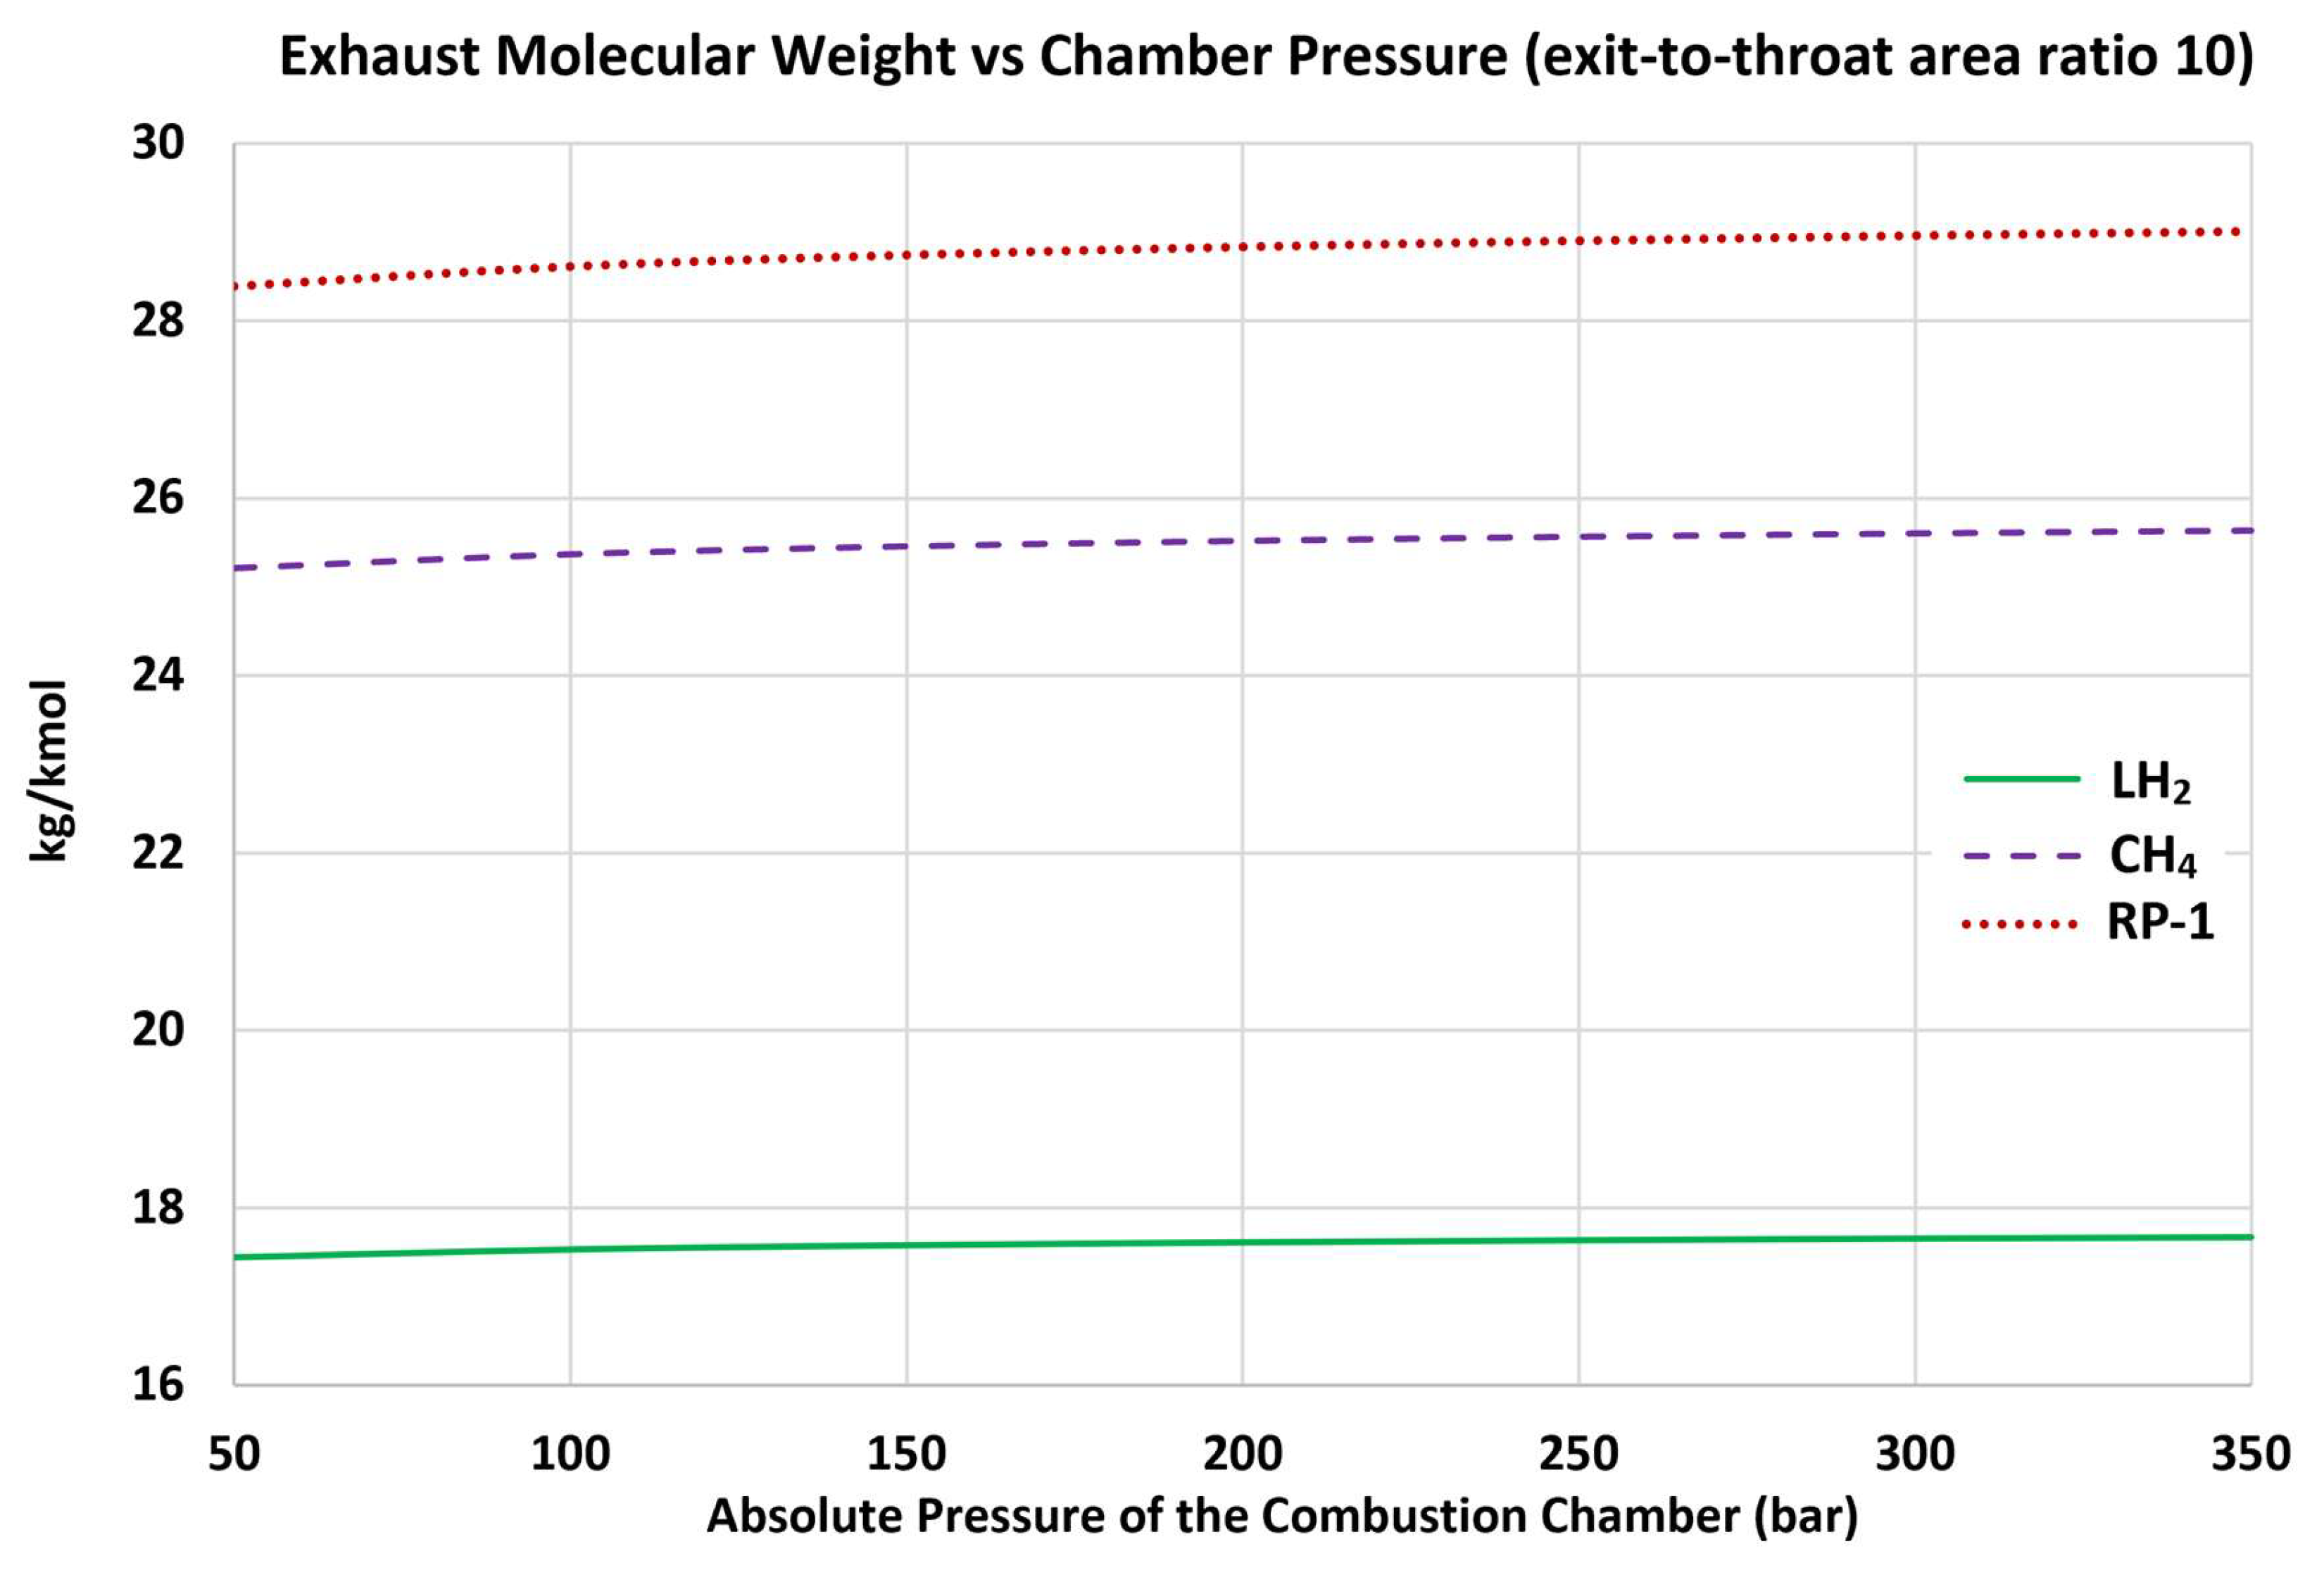
Figure 3.
Increasing exhaust isentropic exponent due to increasing chamber pressure.
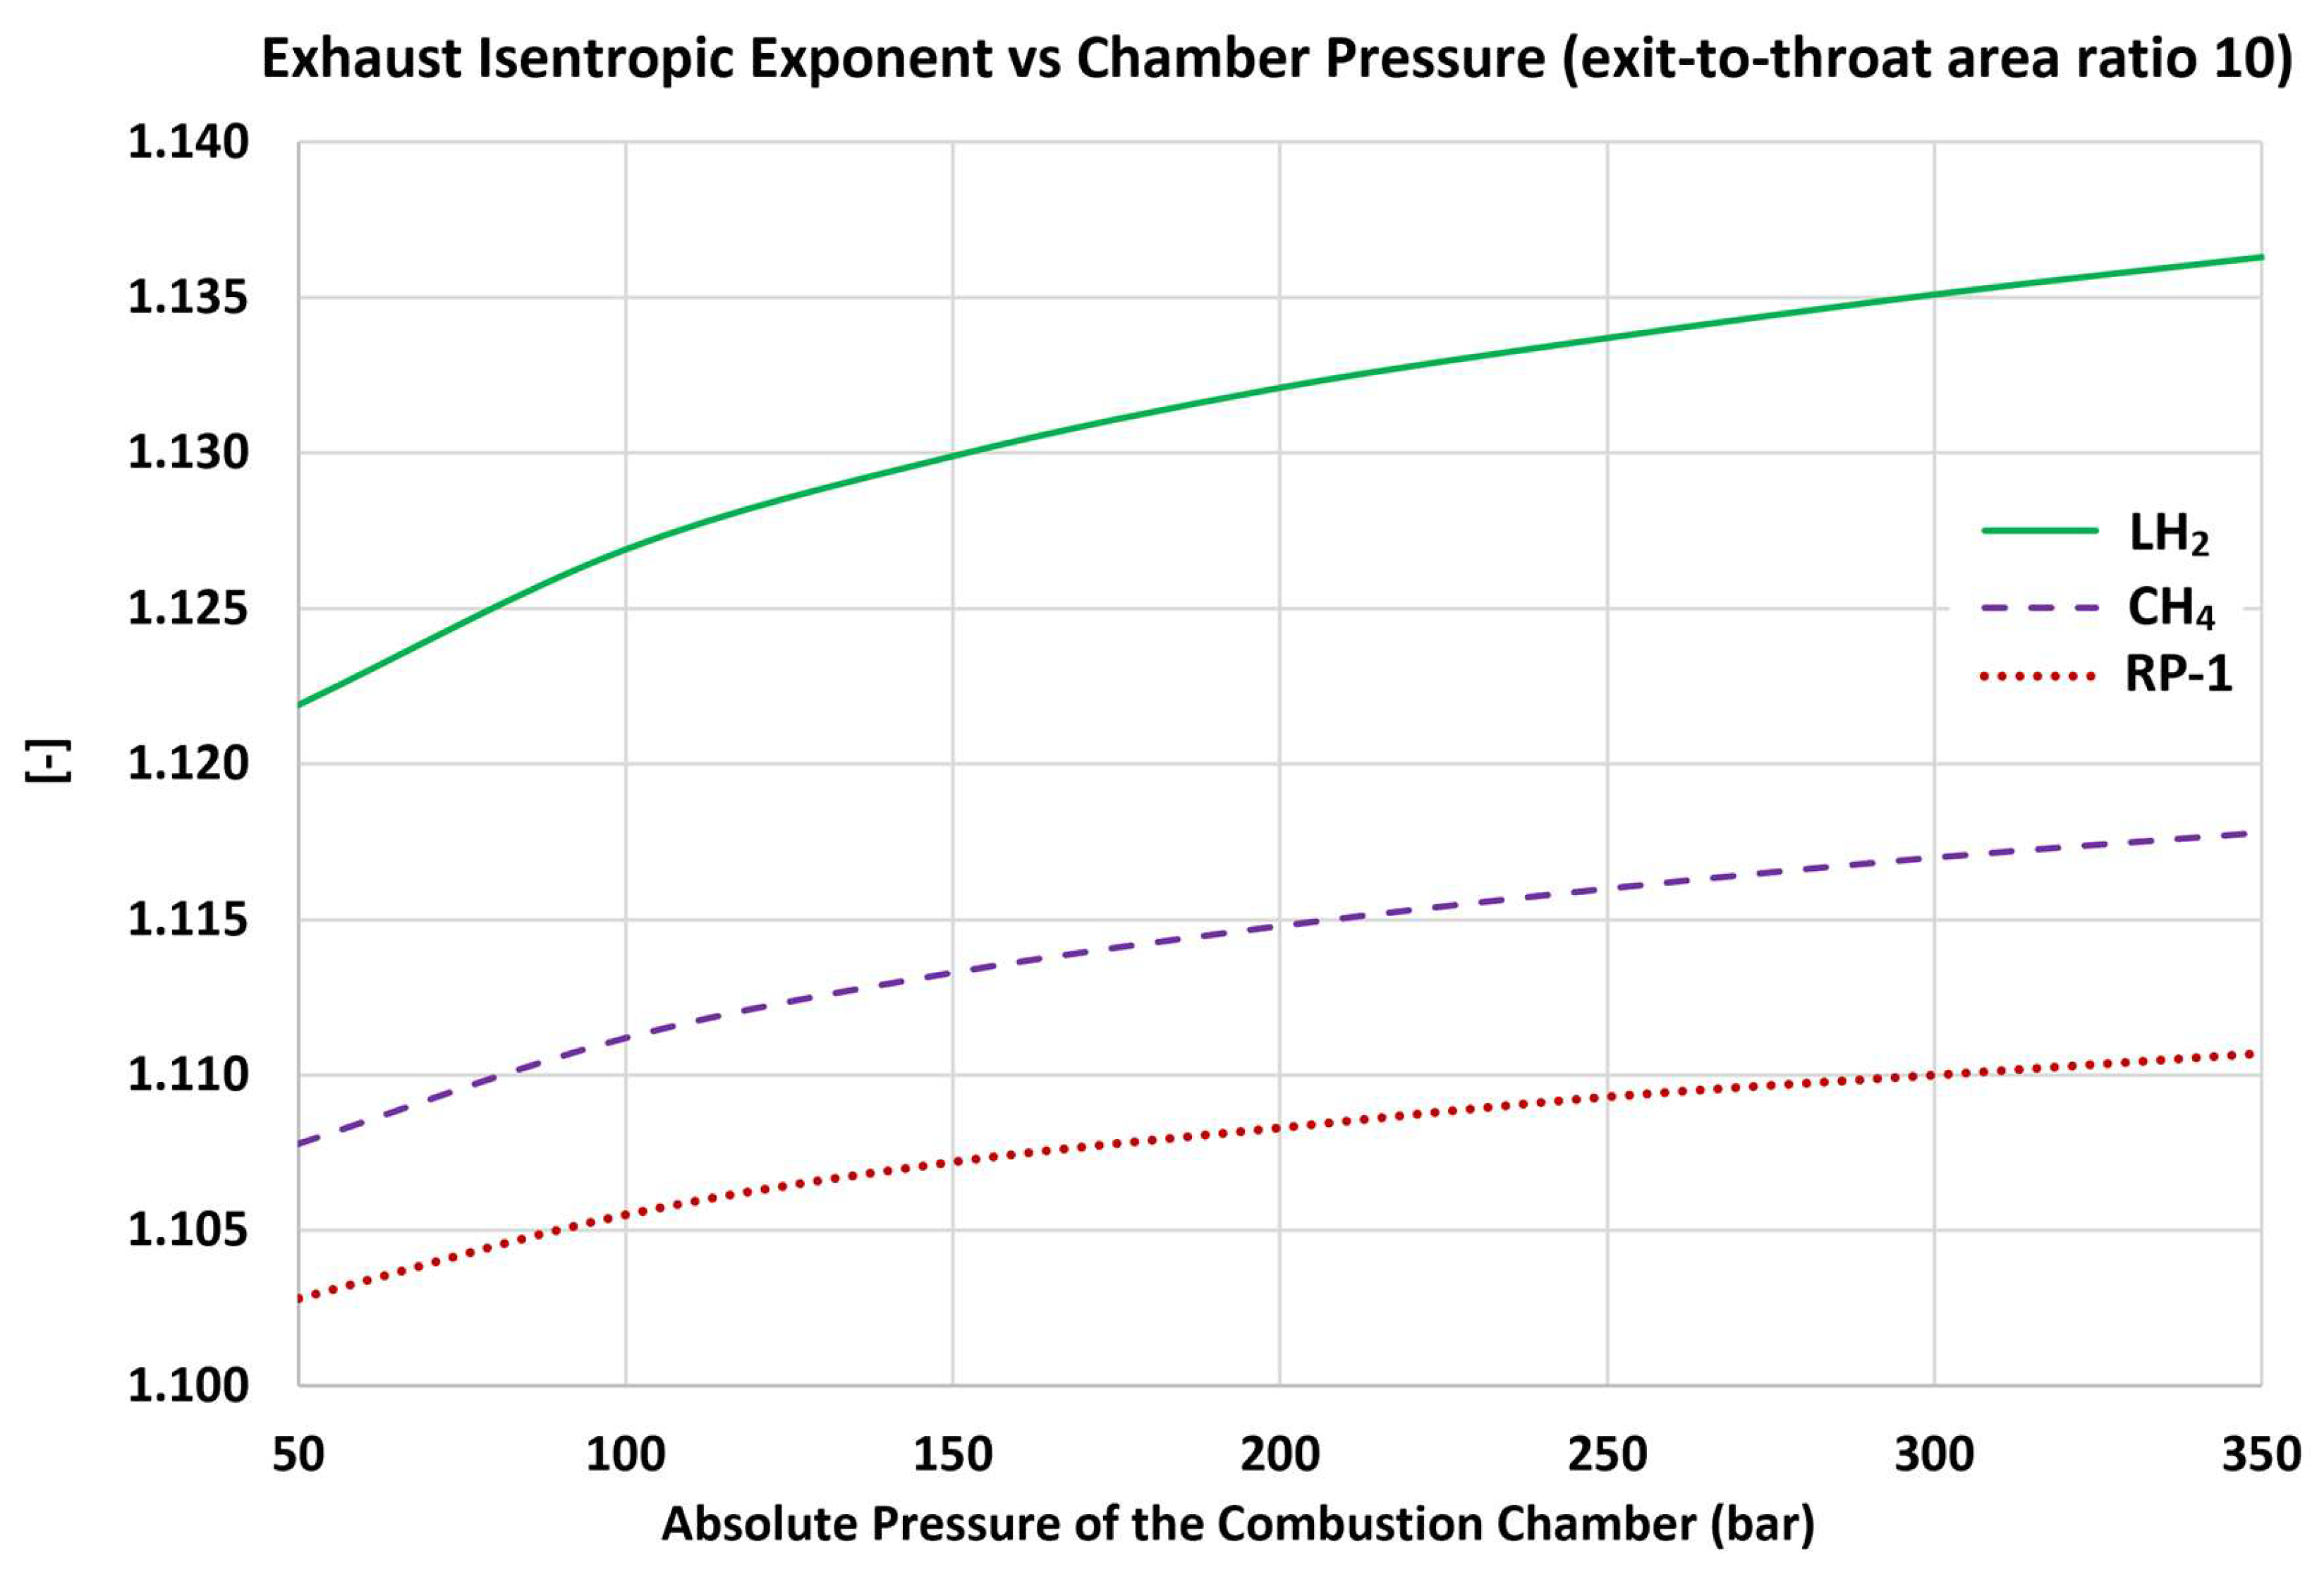
Figure 4.
Increasing chamber temperature due to increasing chamber pressure.
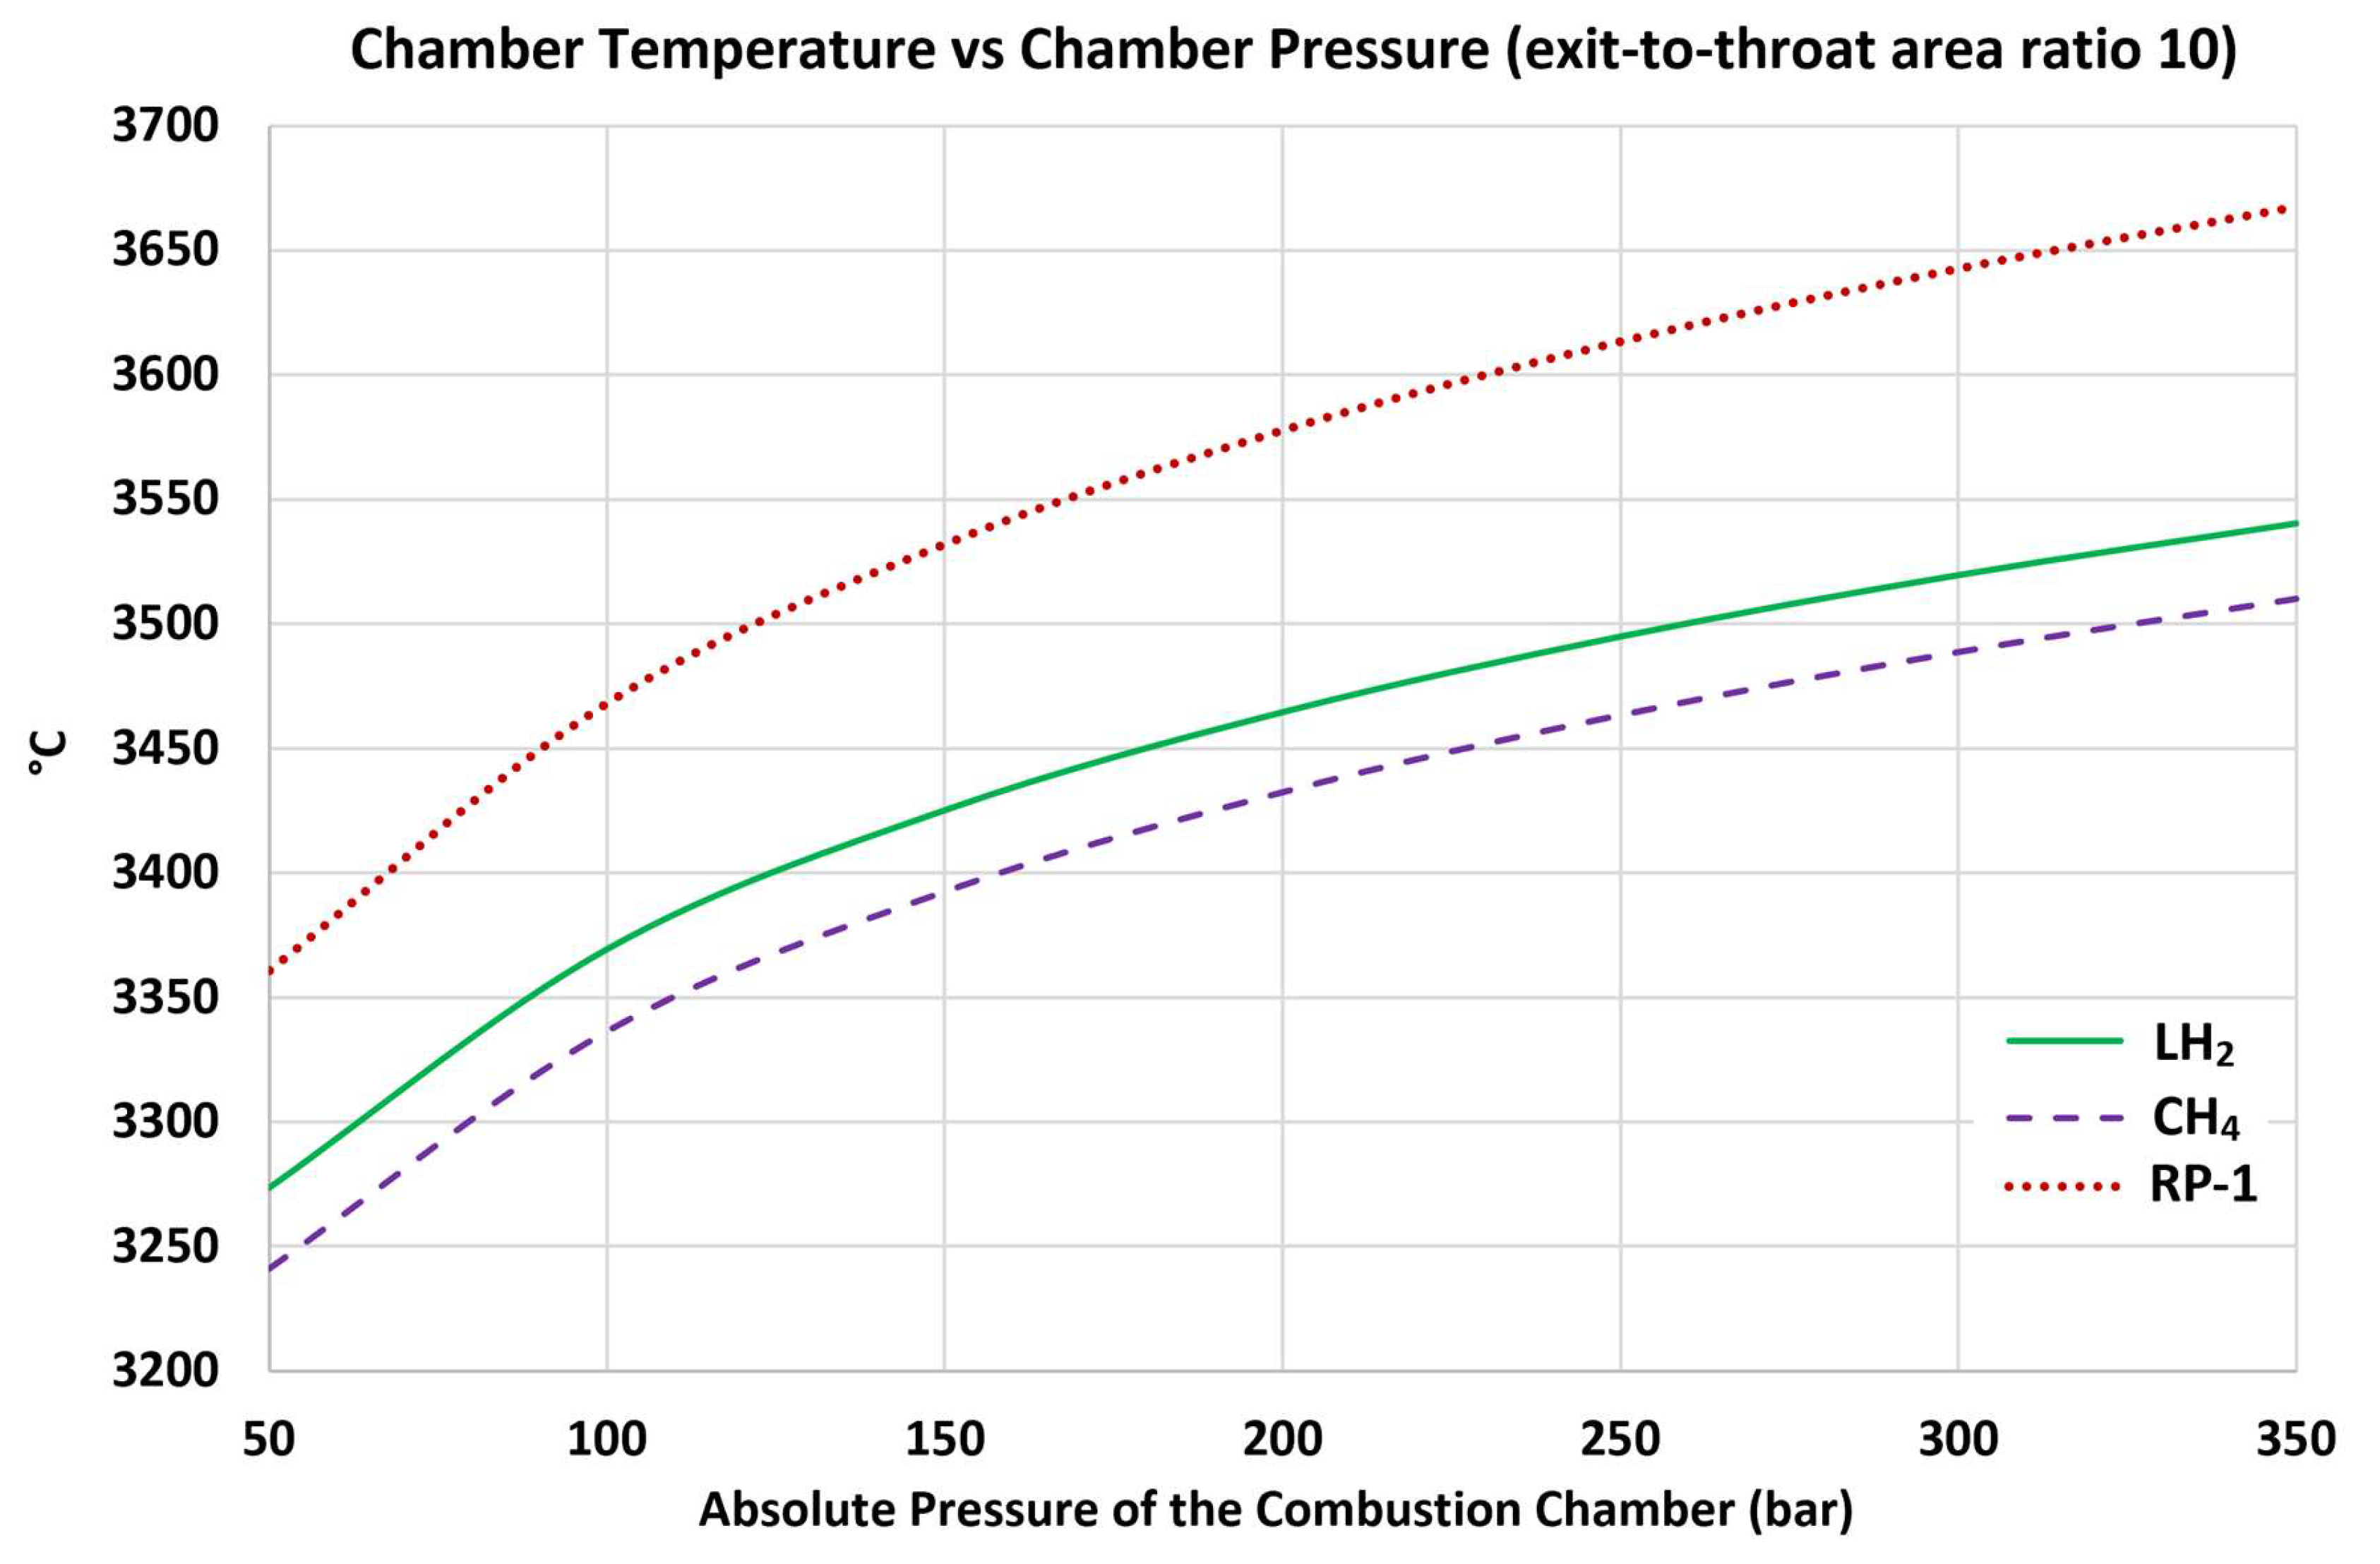
Figure 5.
Increasing absolute exhaust pressure due to increasing chamber pressure.
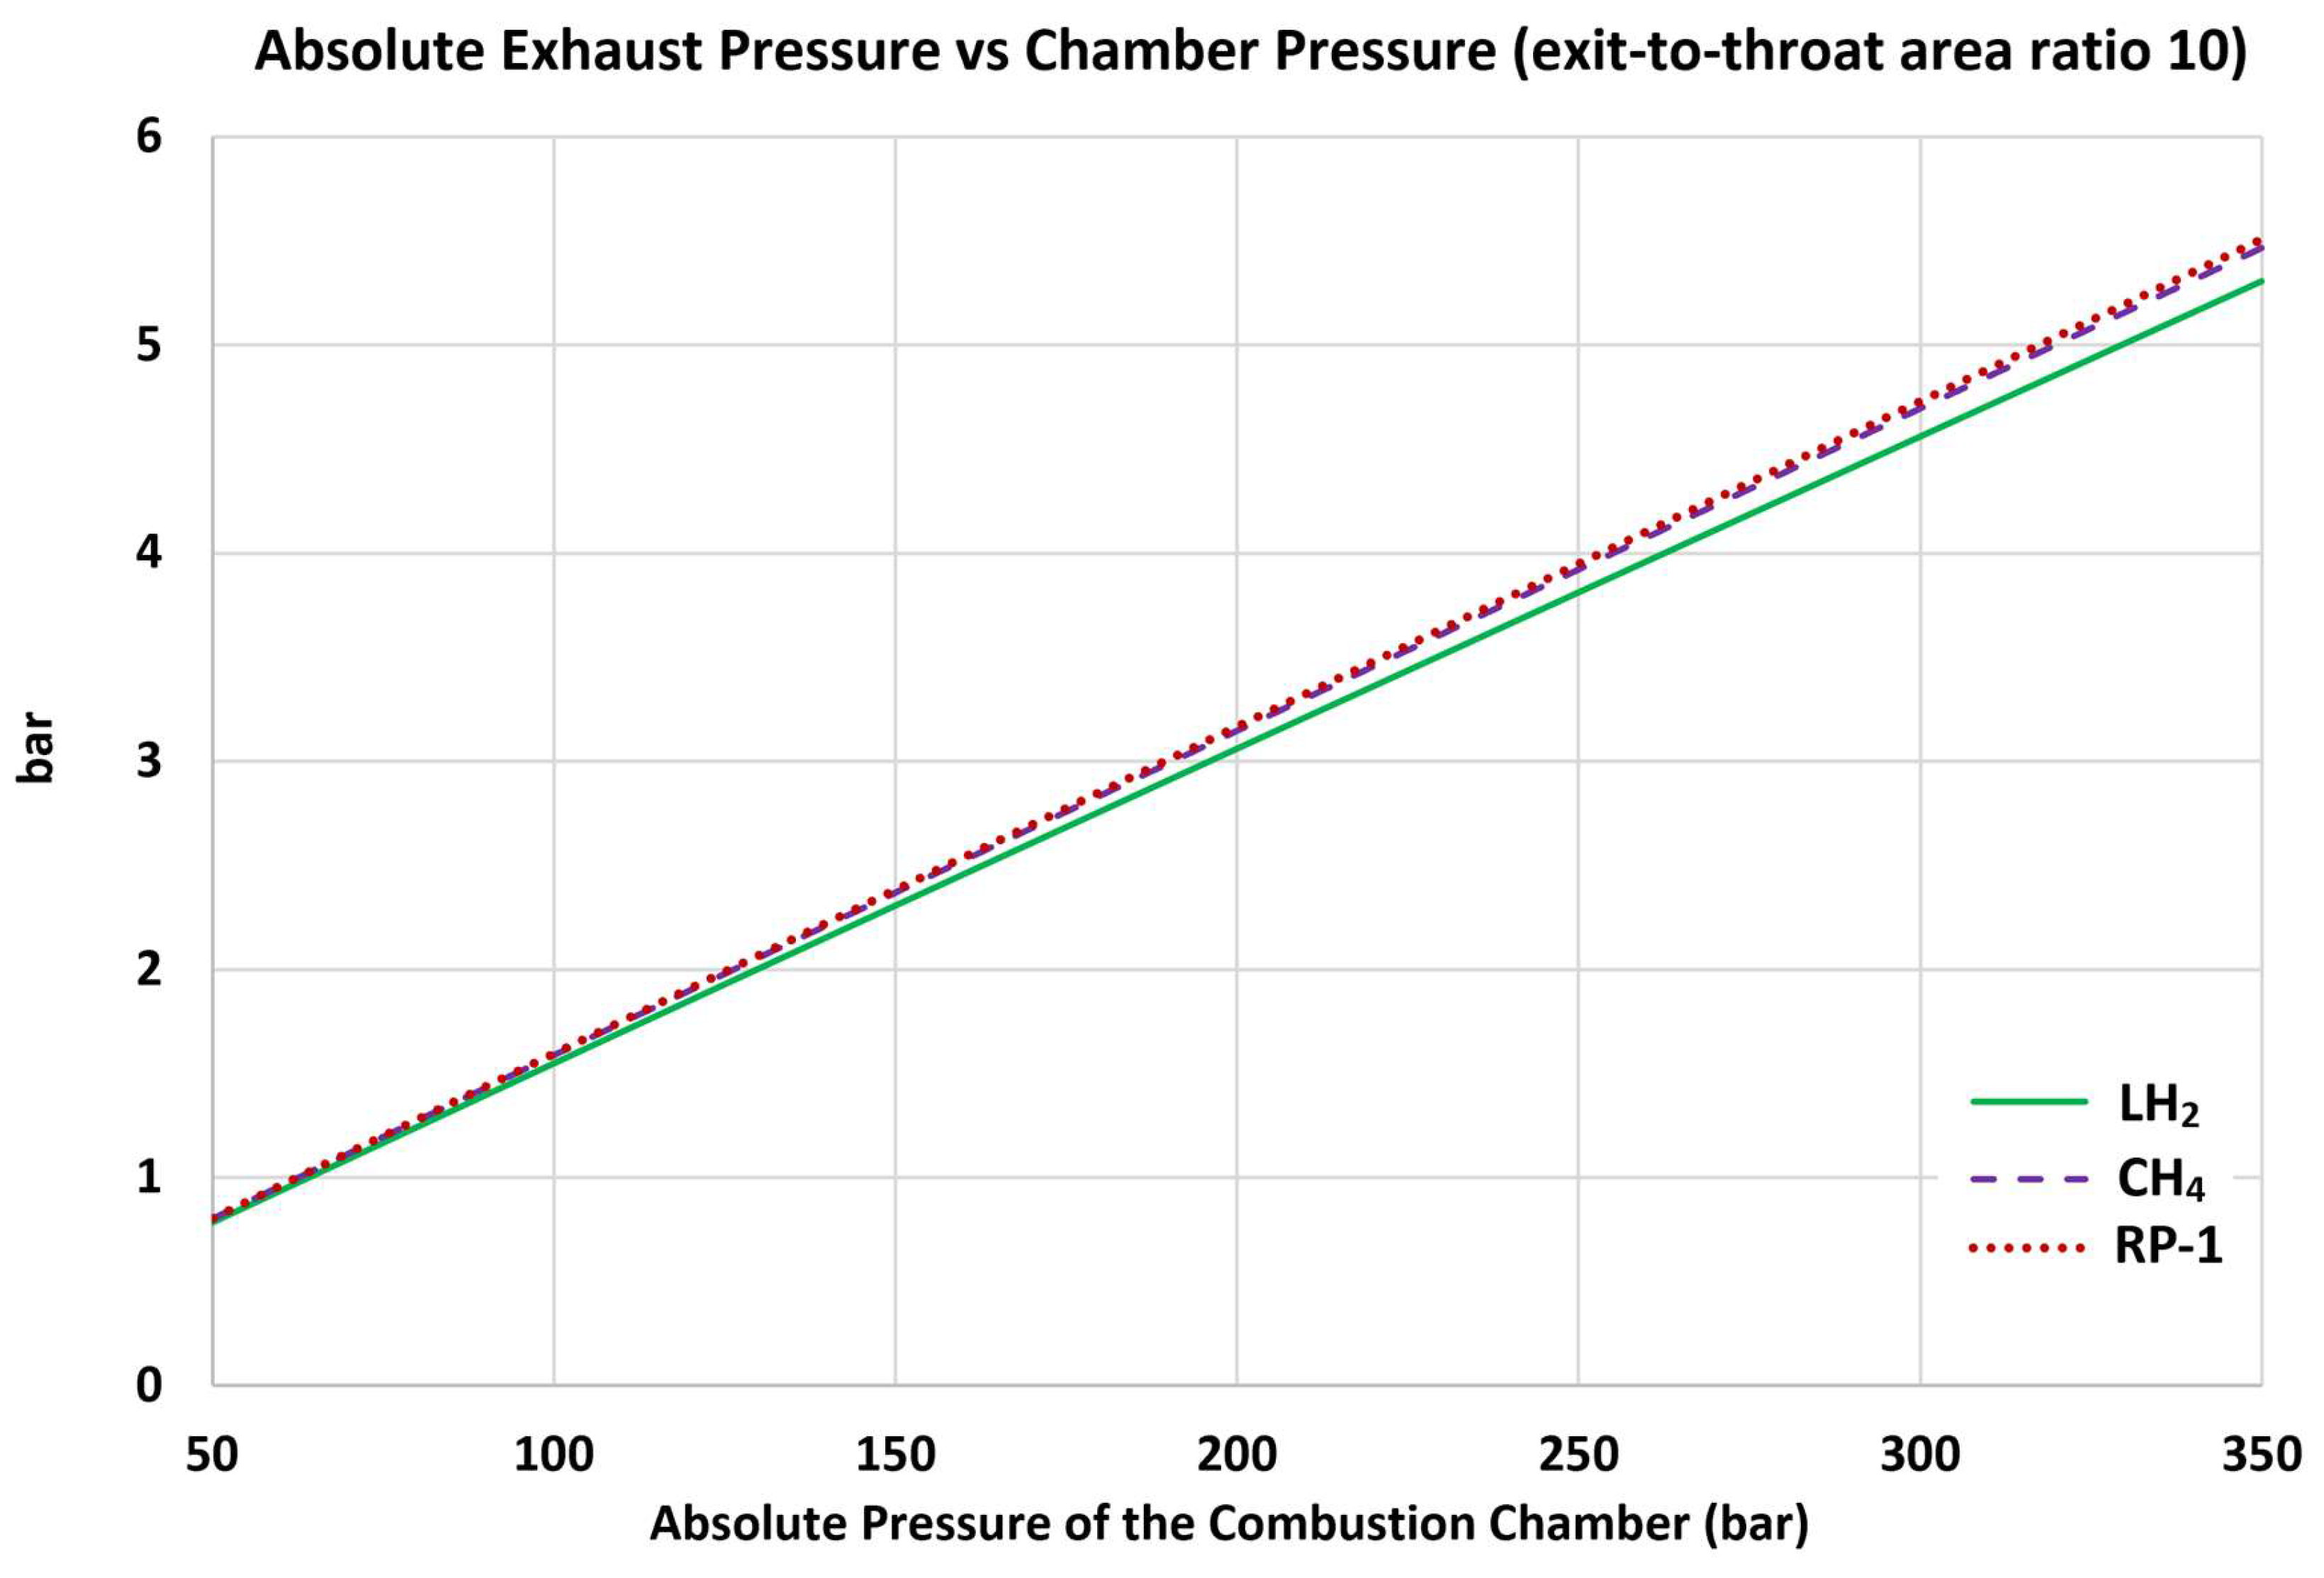
Figure 6.
Increasing chamber-to-exhaust pressure ratio due to increasing chamber pressure.
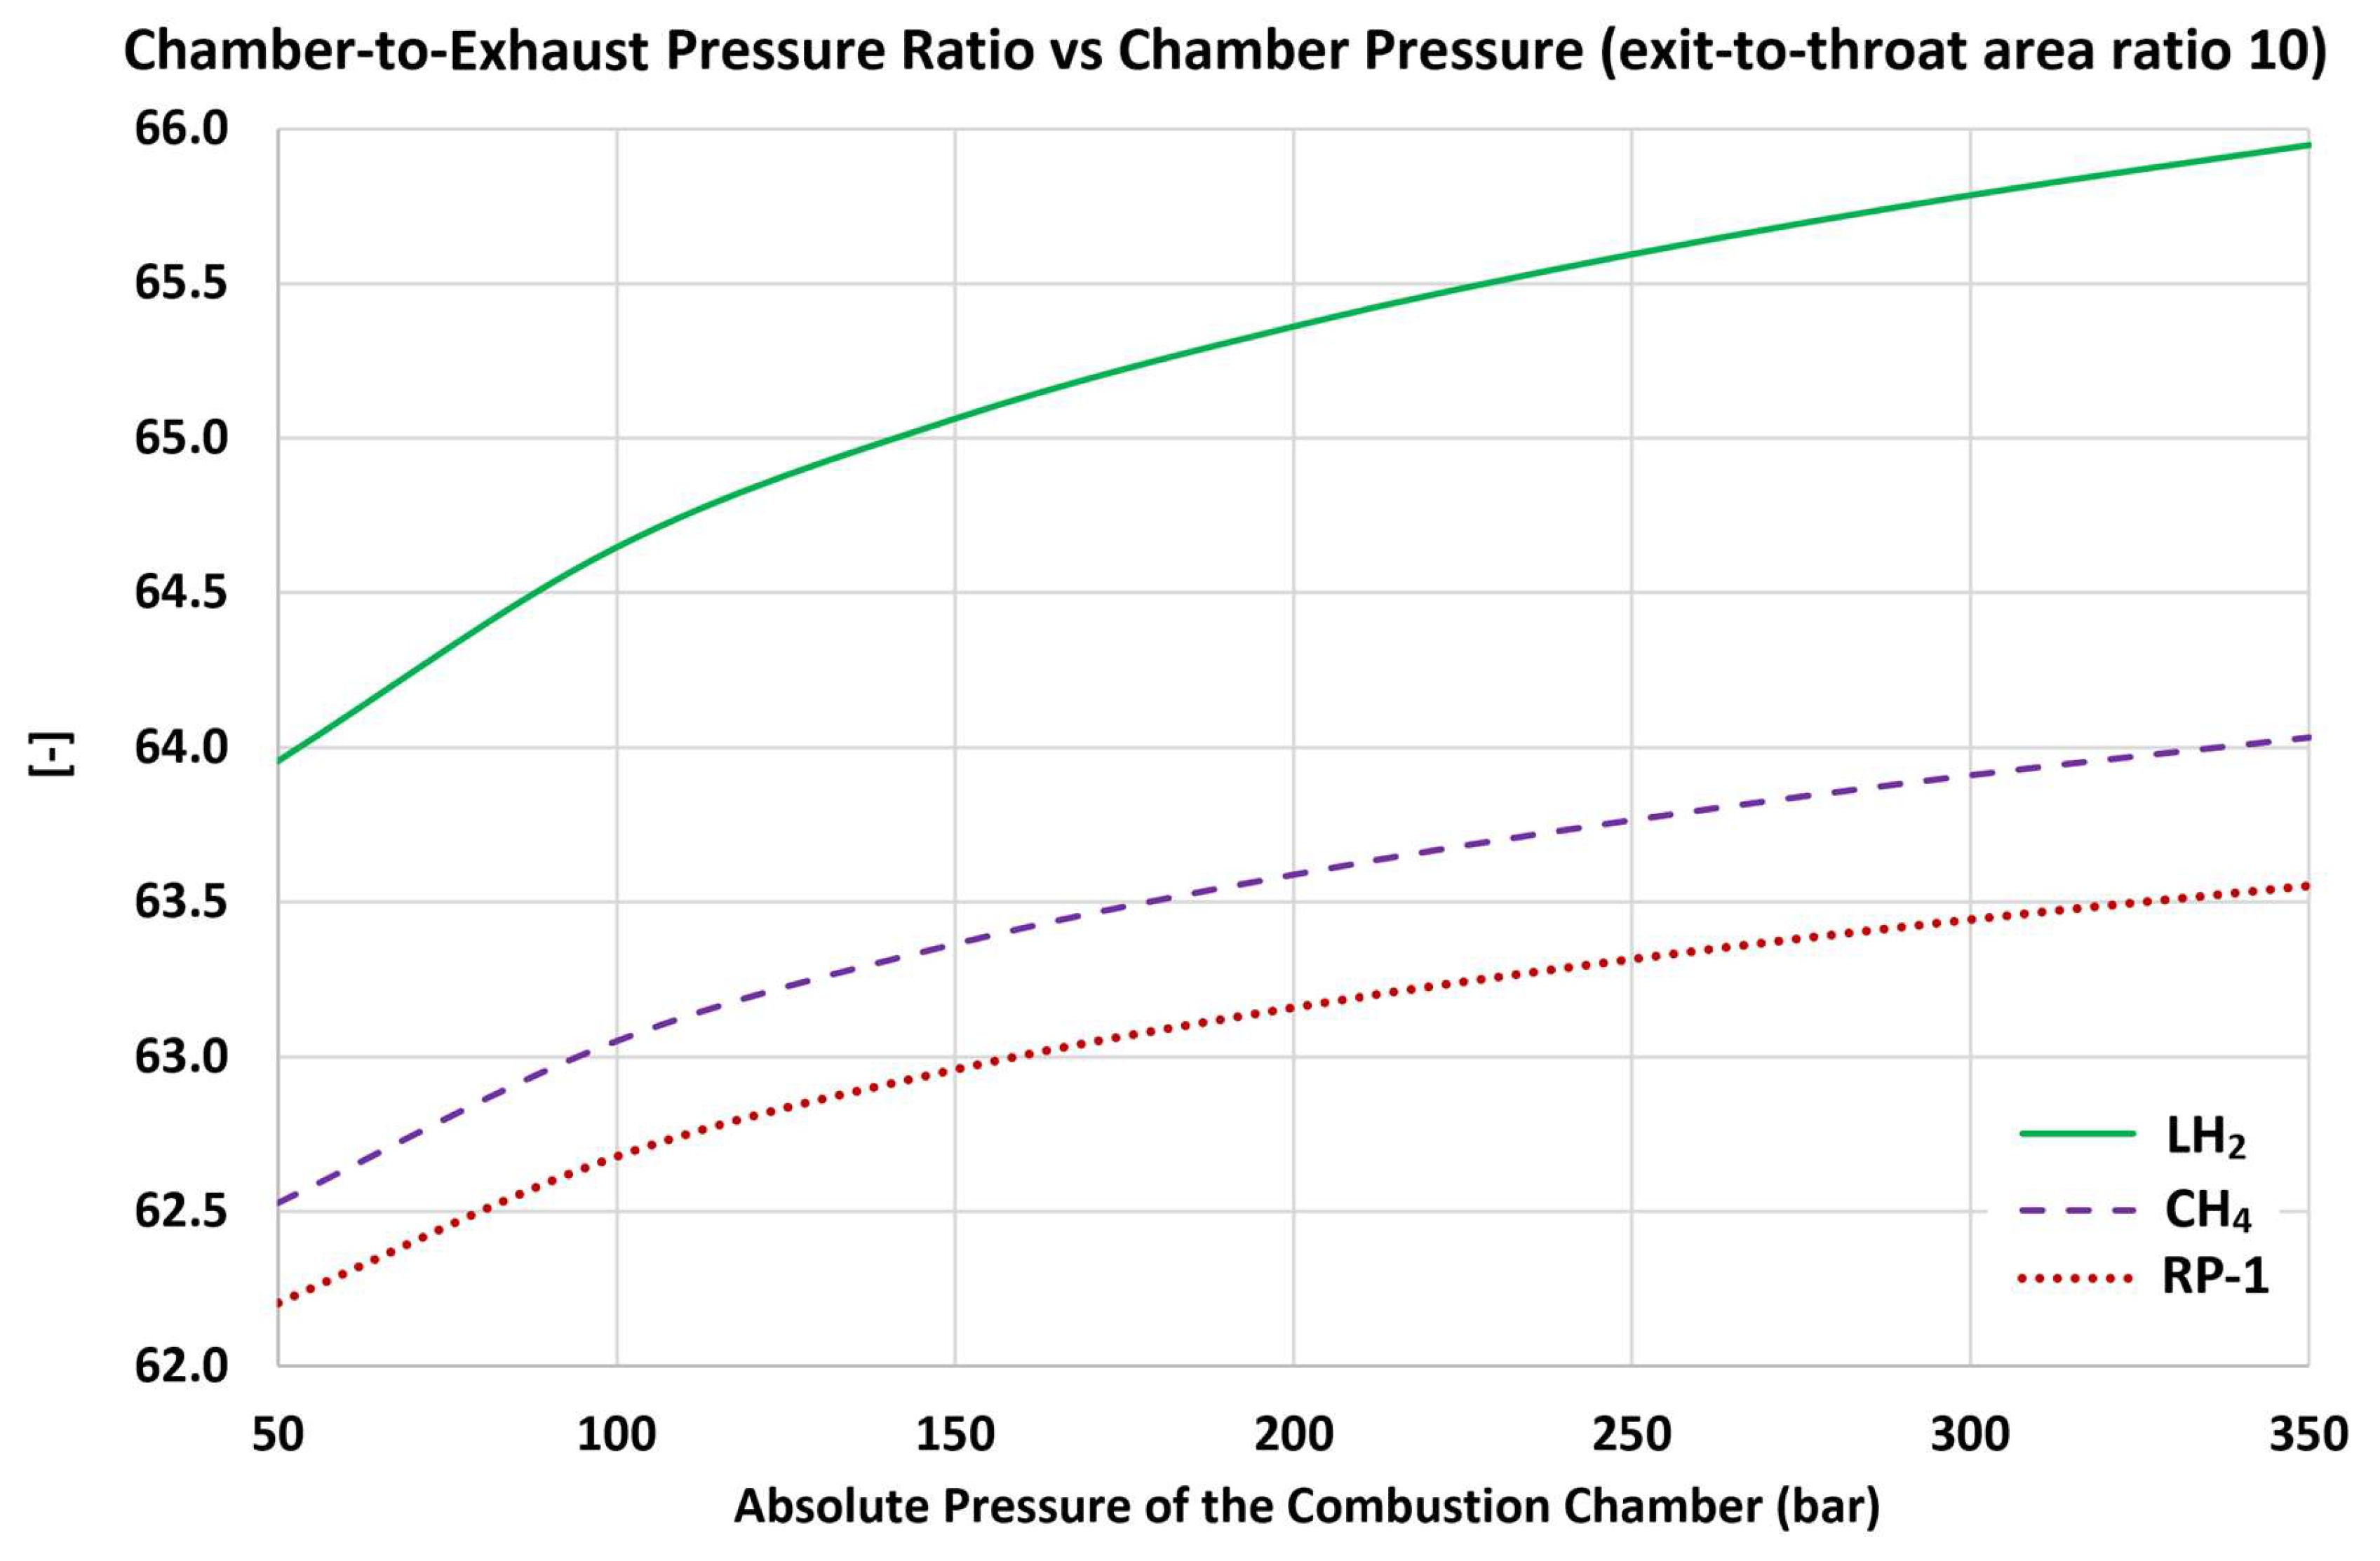
Figure 7.
Increasing exhaust temperature due to increasing chamber pressure.
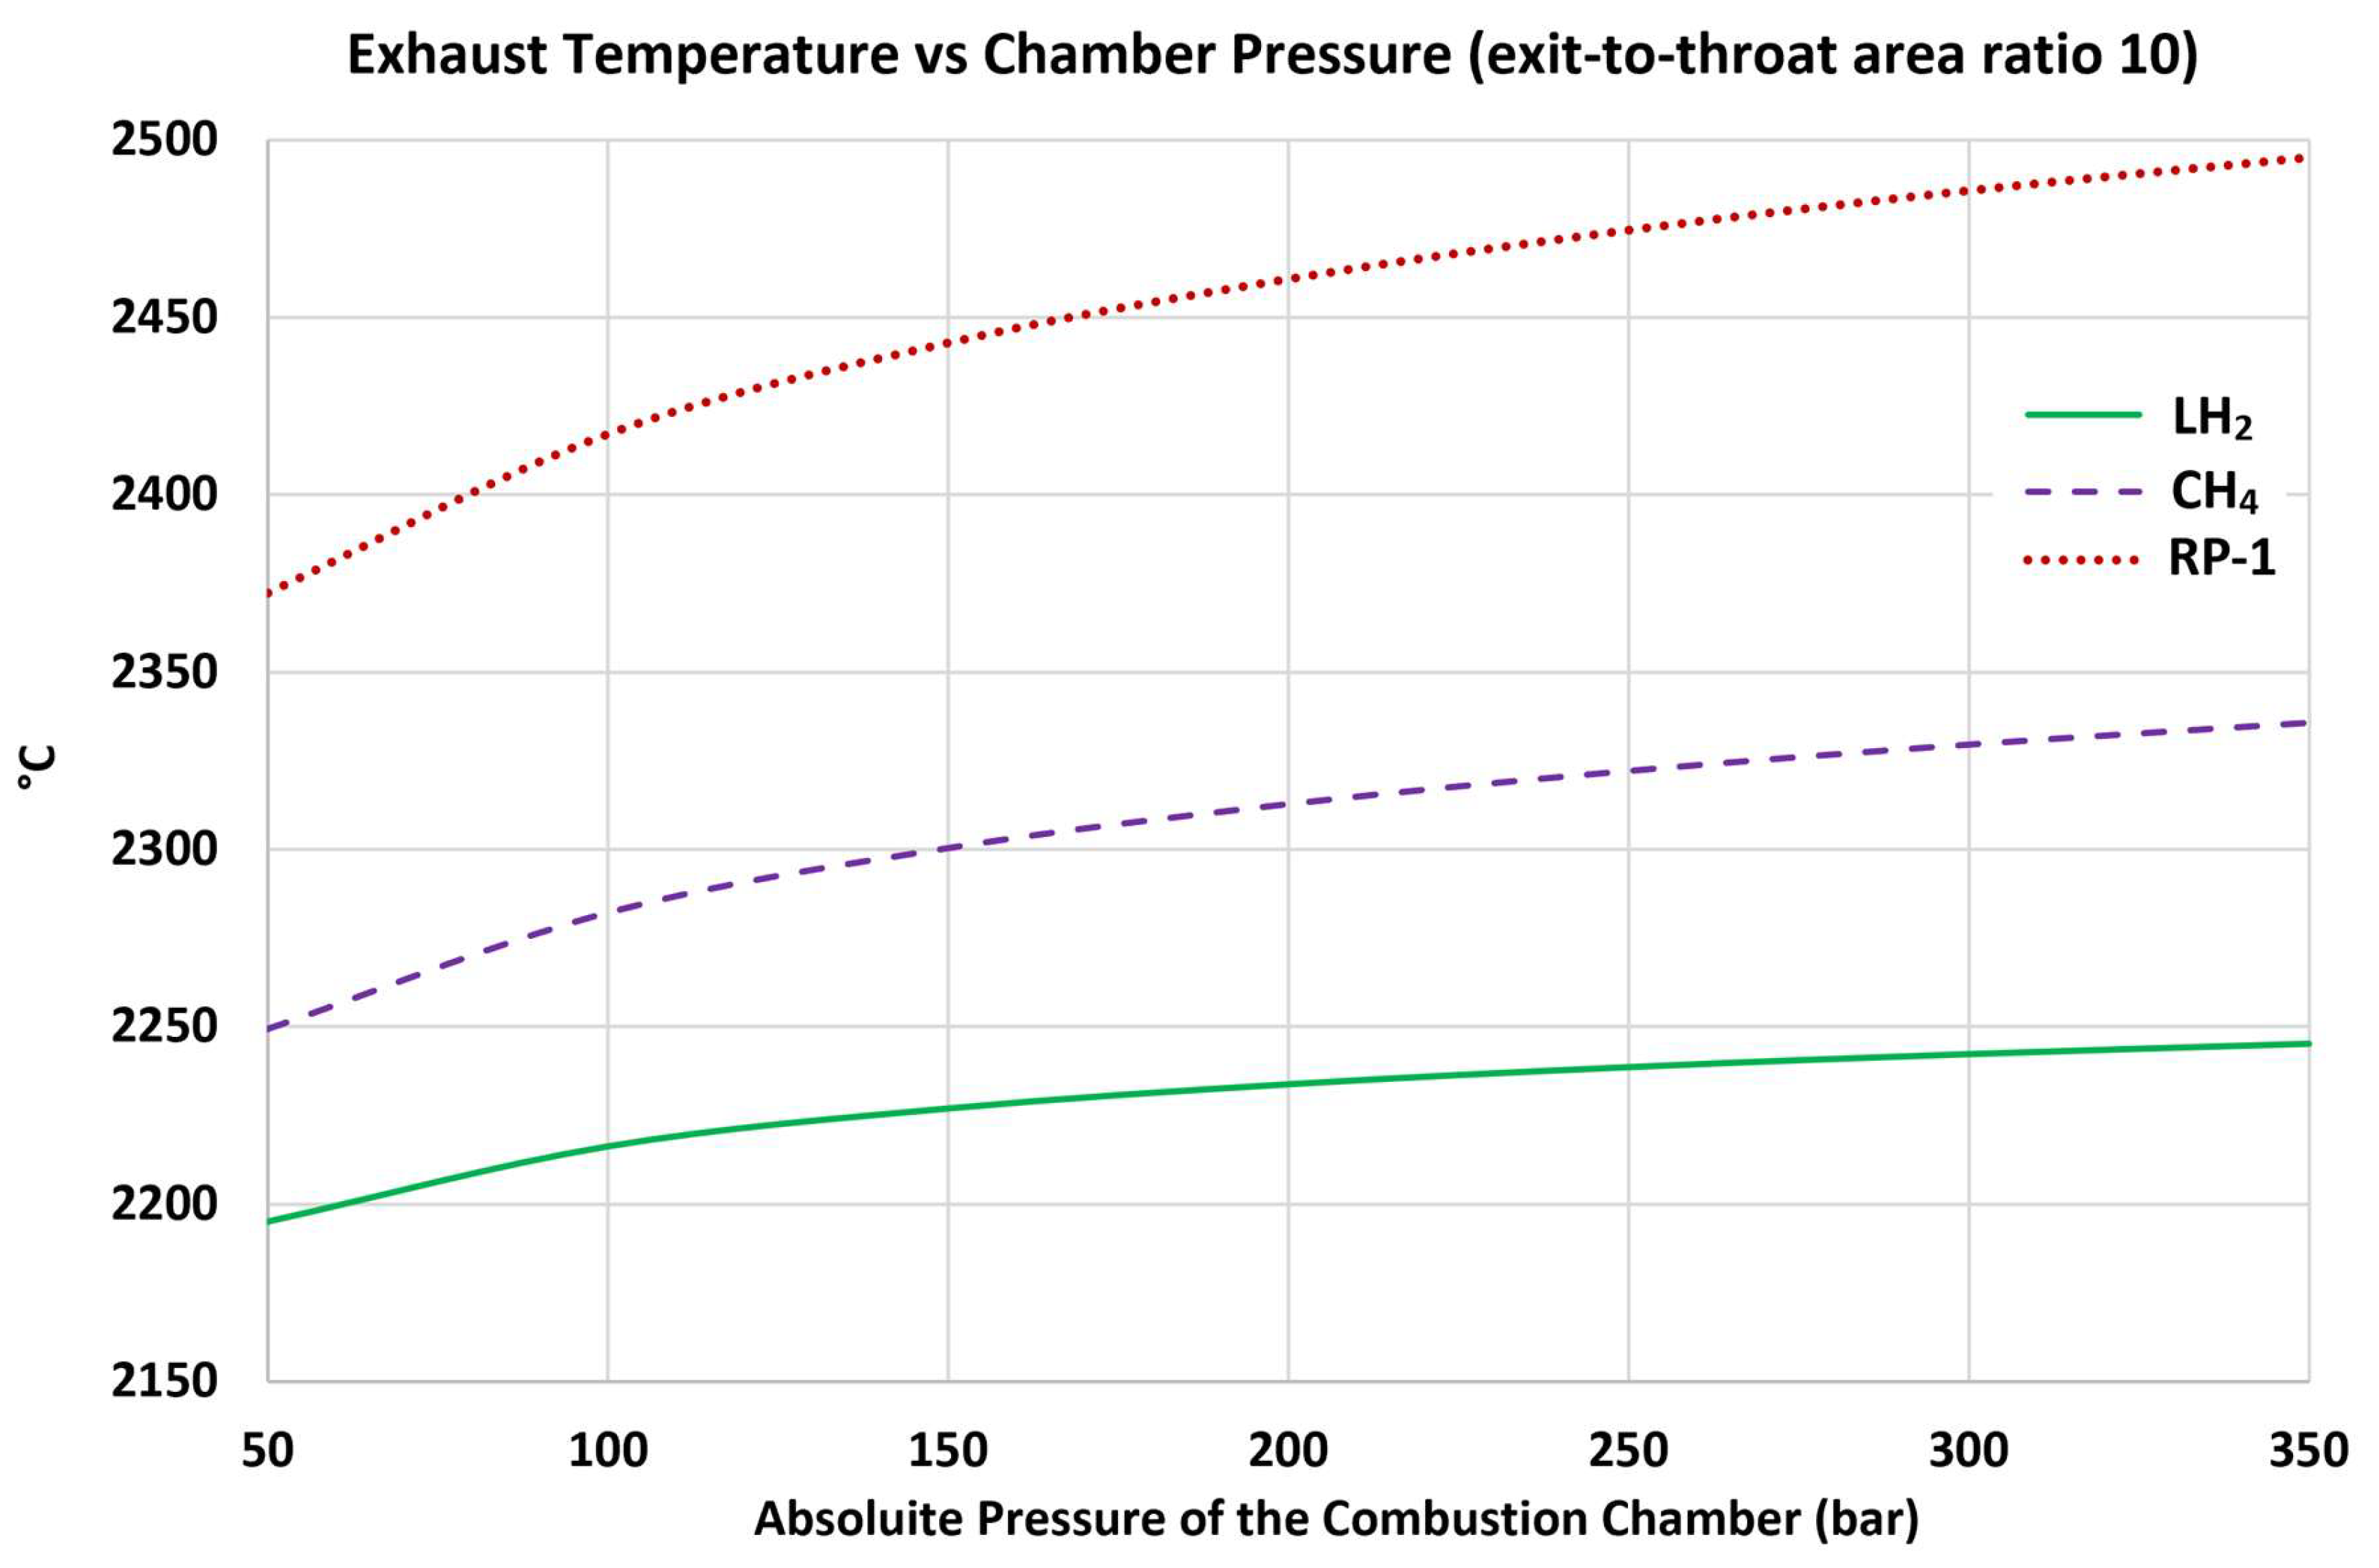
Figure 8.
Increasing exhaust density due to increasing chamber pressure.
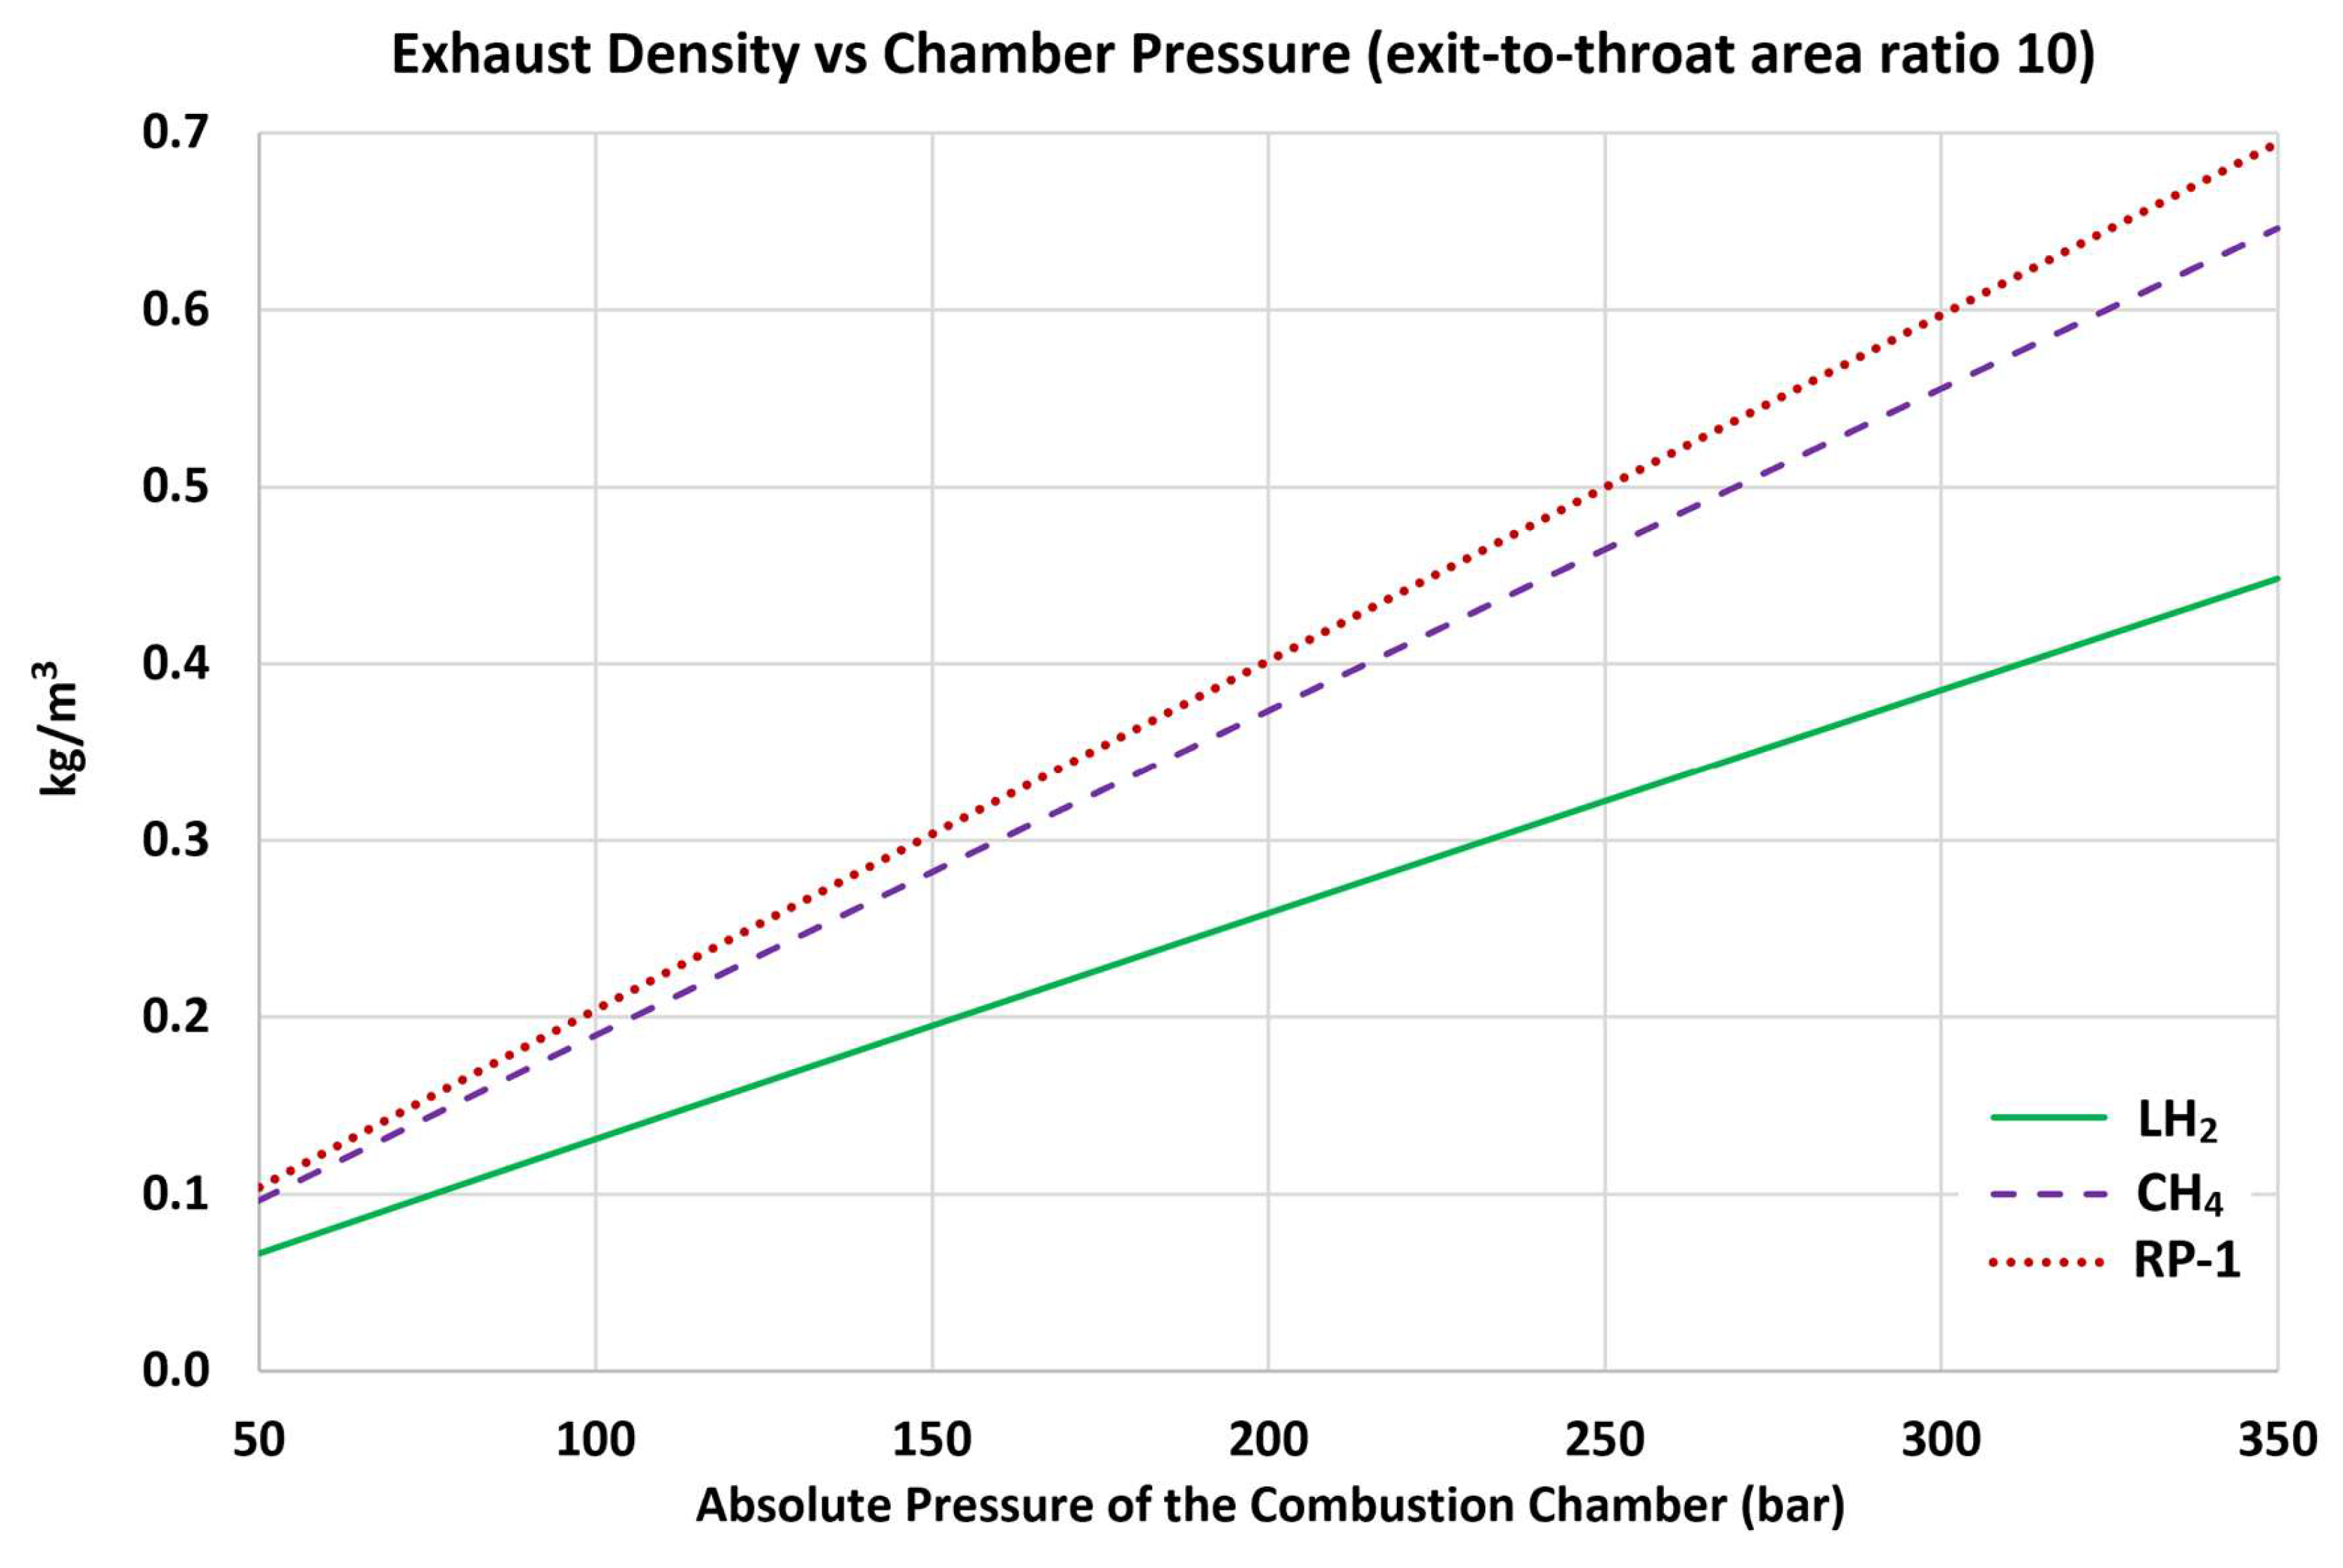
Figure 9.
Increasing exhaust Mach number due to increasing chamber pressure.
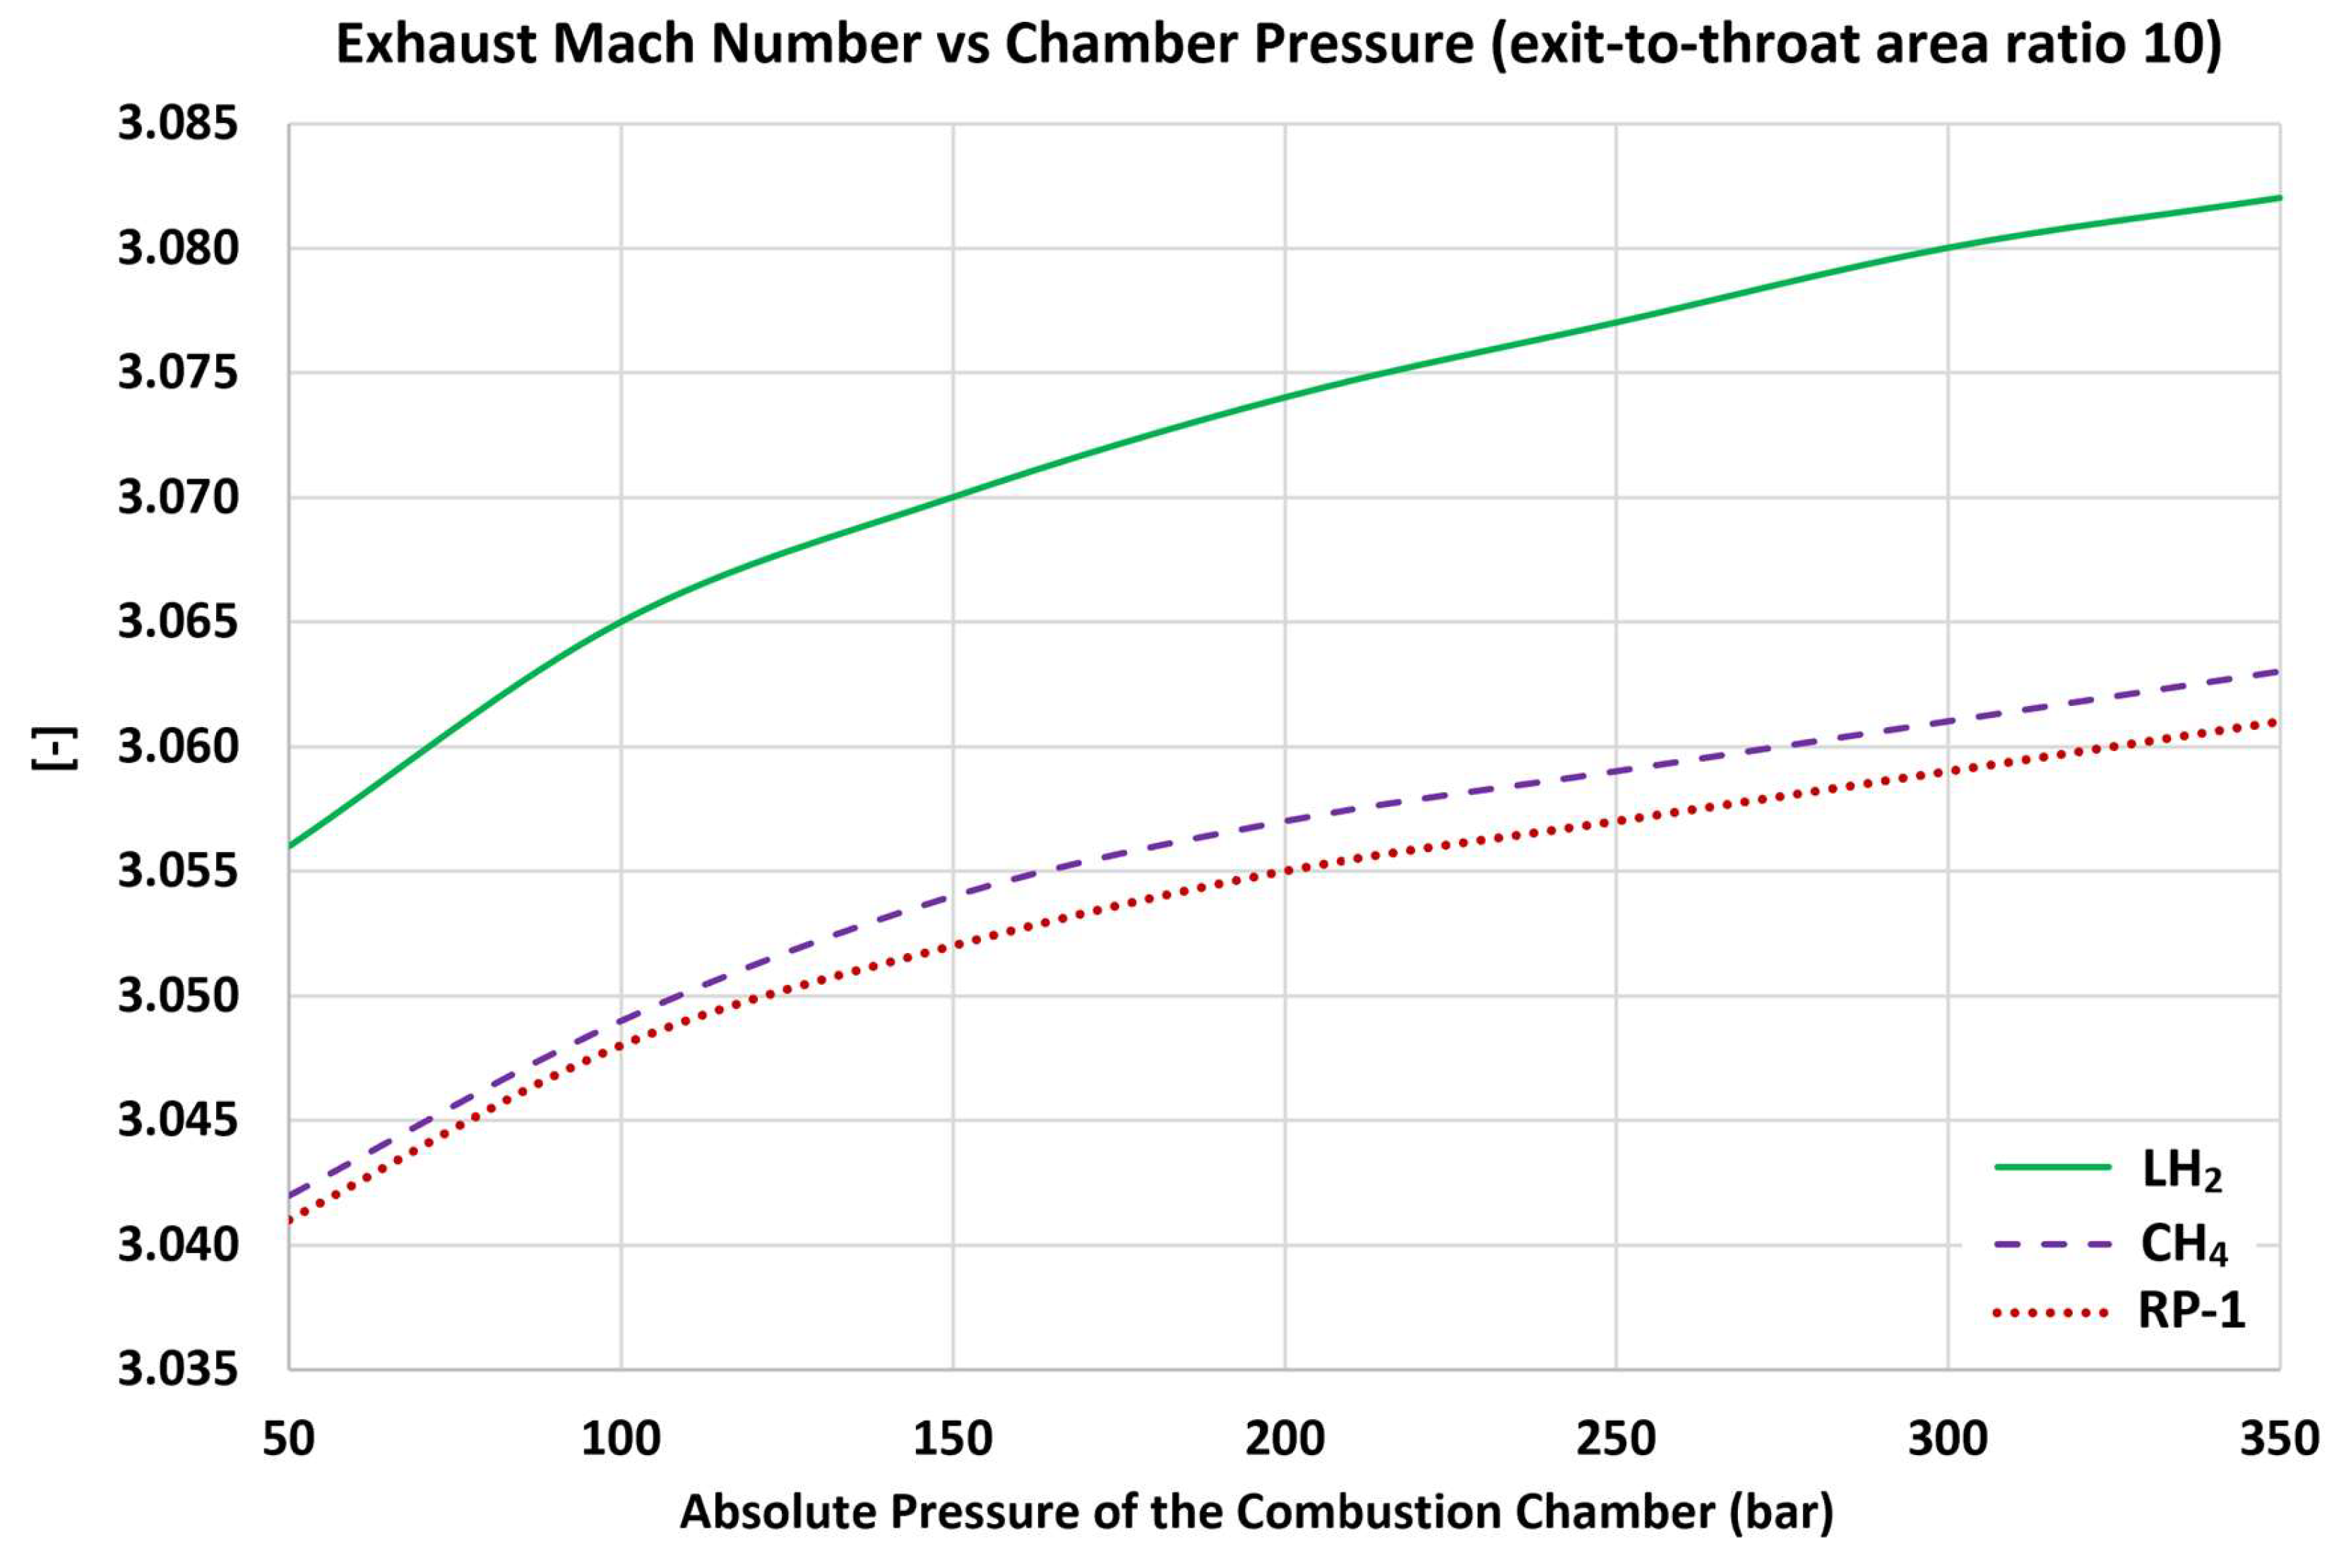
Figure 10.
Increasing rocket-relative exhaust velocity due to increasing chamber pressure.
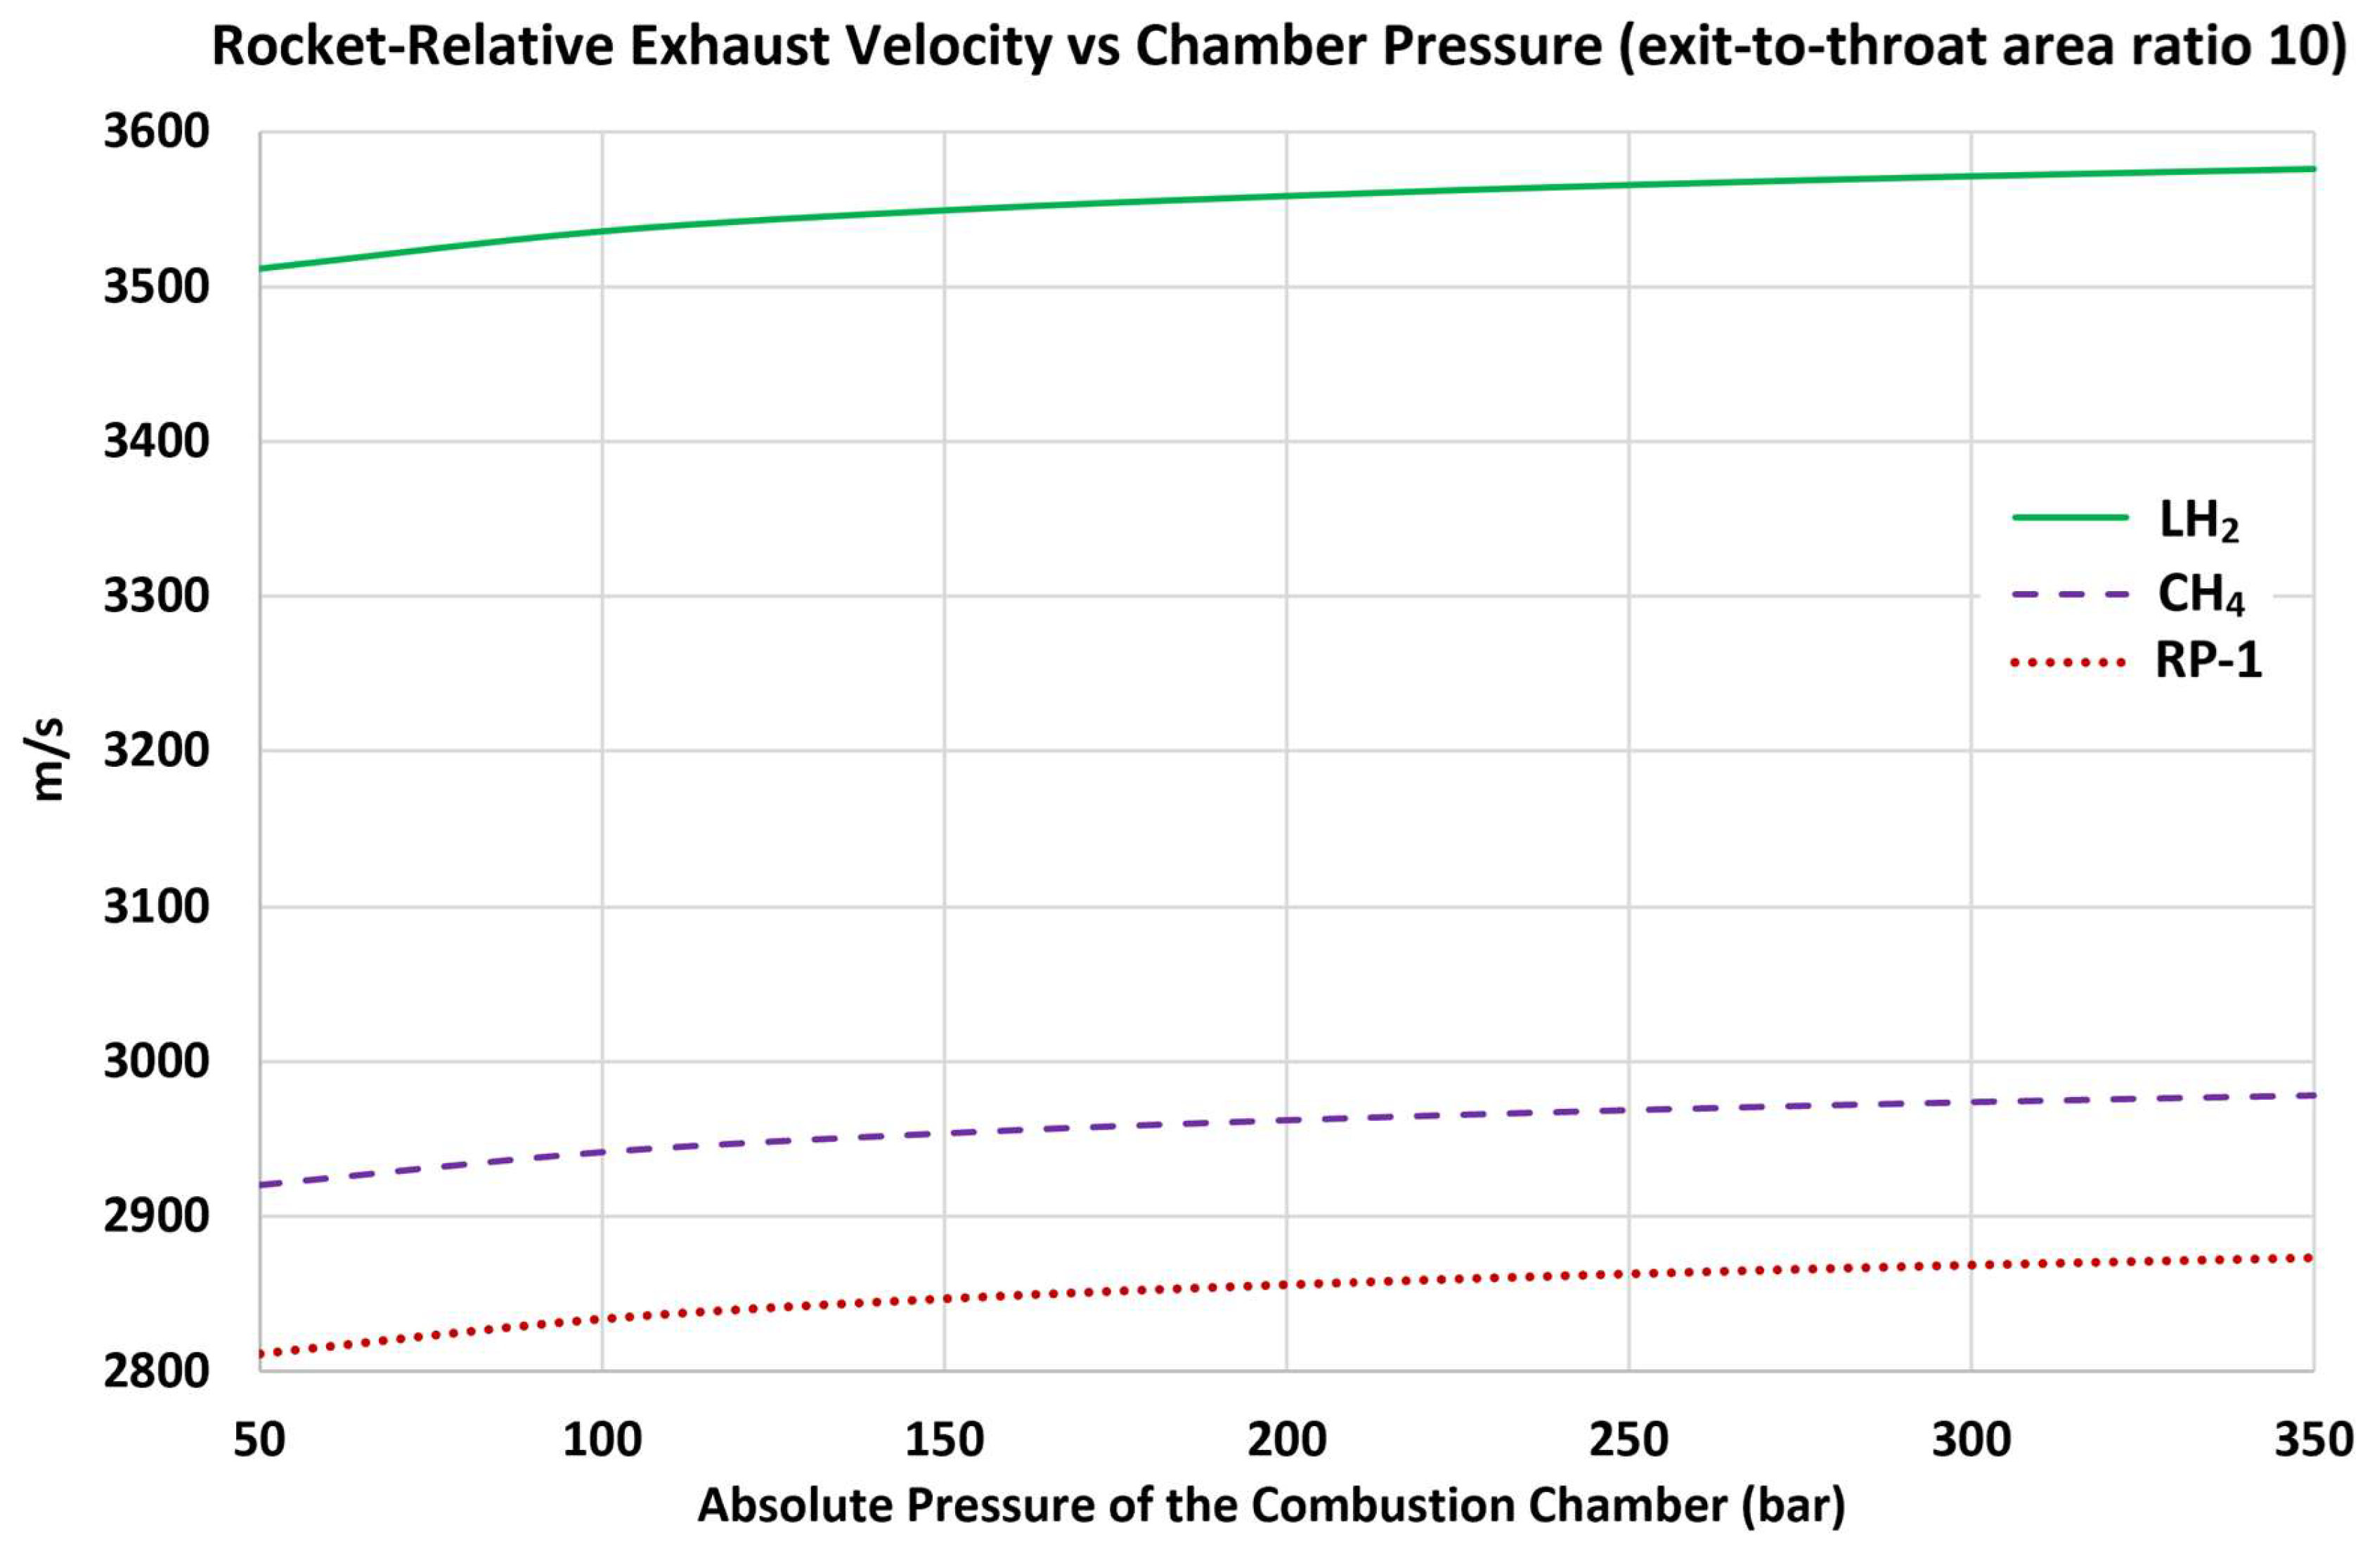
Figure 11.
Increasing ideal specific impulse due to increasing chamber pressure.
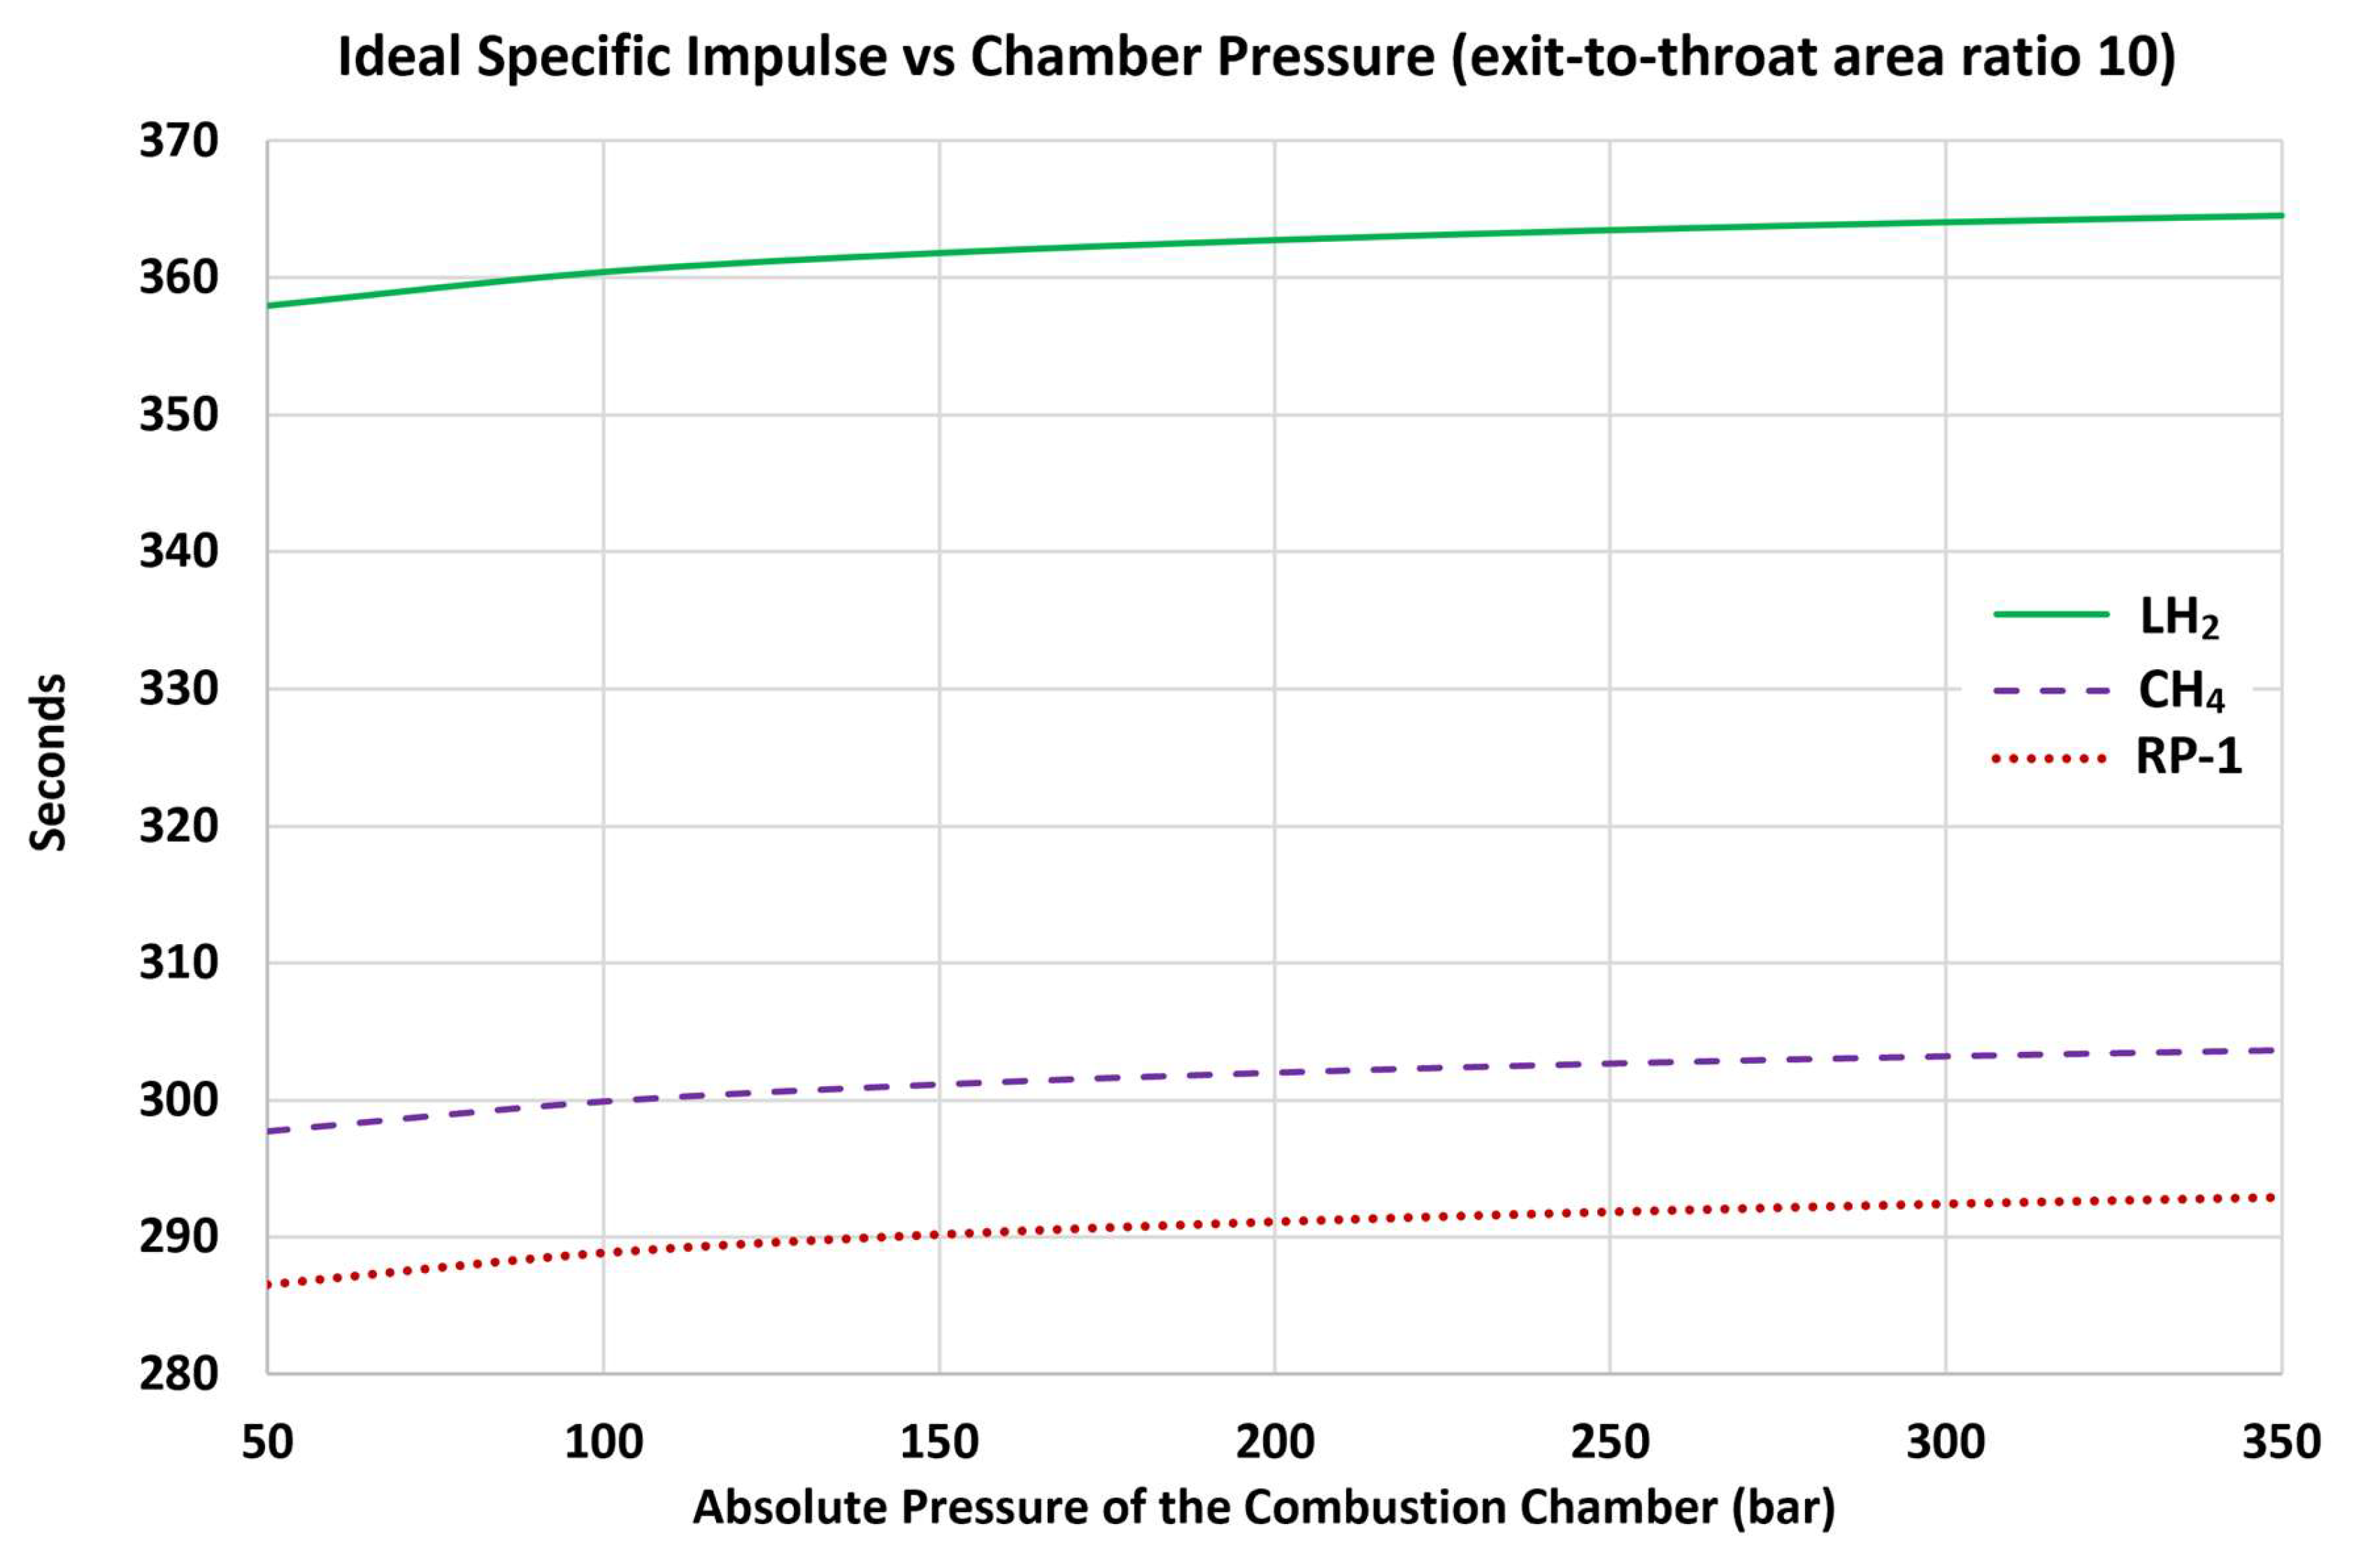
Figure 12.
Decreasing thrust coefficient due to increasing chamber pressure.
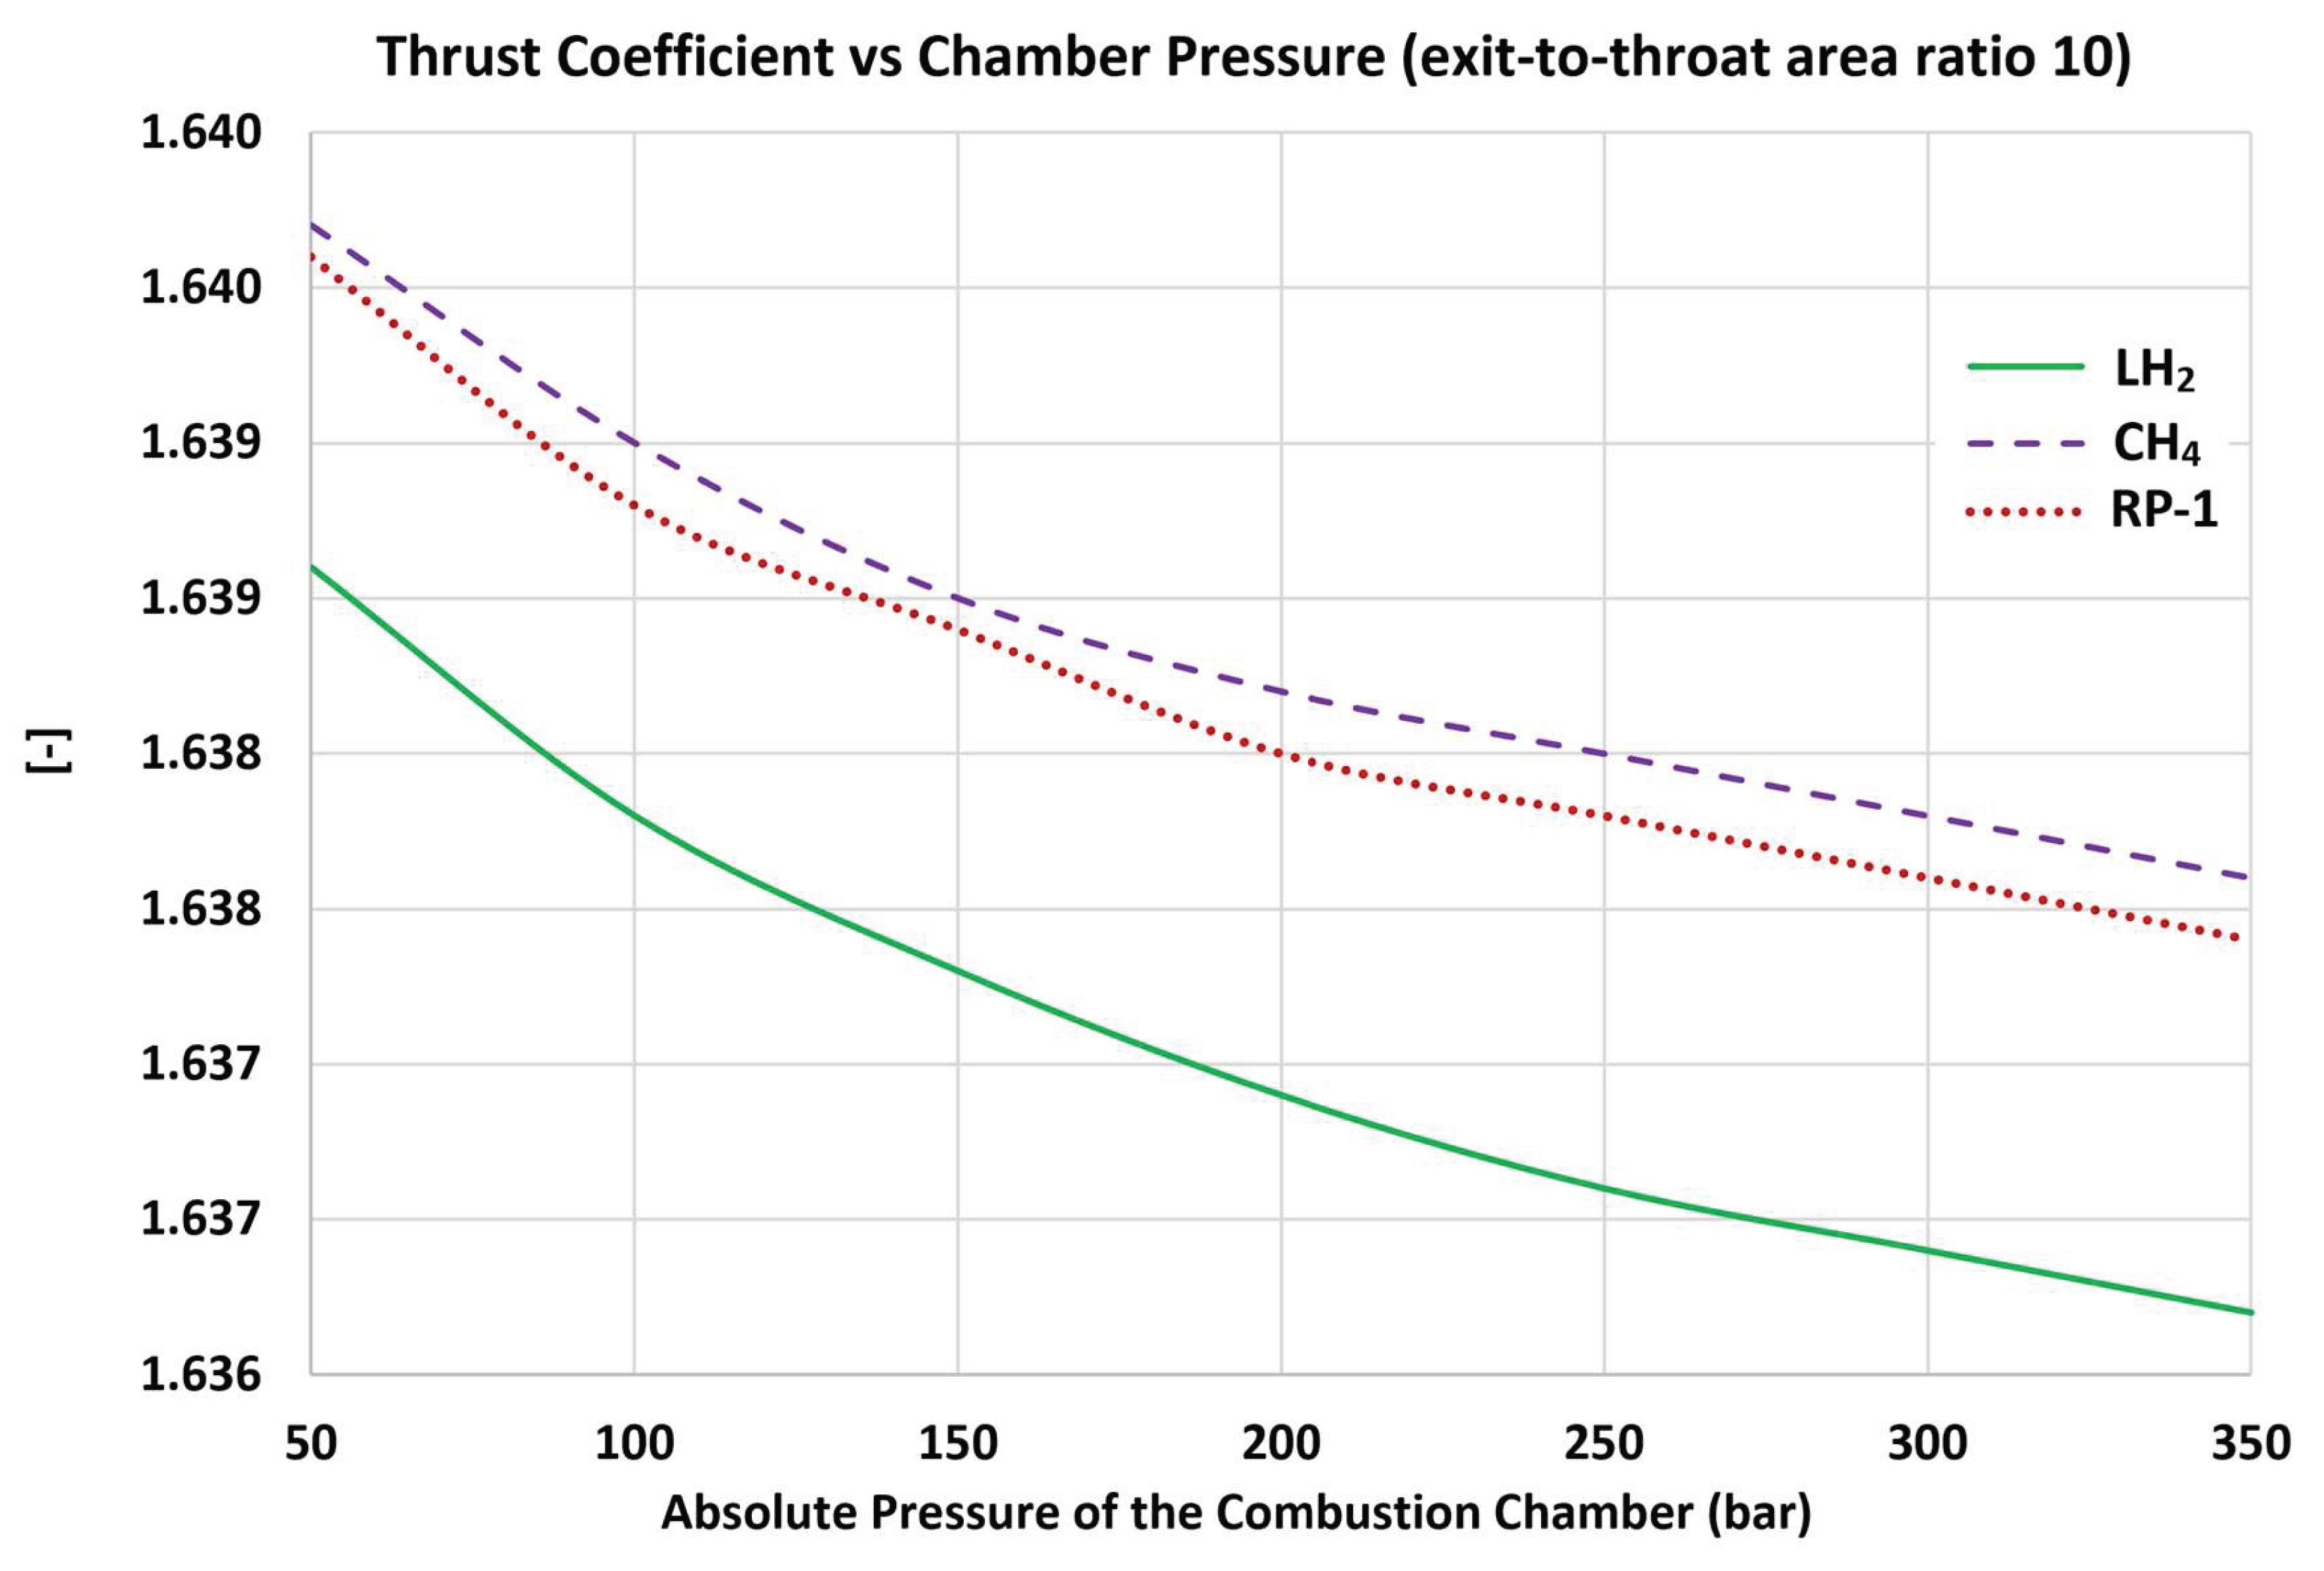

Table 1.
Key features of the 12 investigated characteristics of bipropellant rocket systems.
| Rocket Engine Property | Fuel Giving Highest/Smallest Values |
Overall Trend with the Chamber Pressure (Pc) |
Average %Change (Over Pc Range 50-150 bar) |
Average %Change (Over Pc Range 150-350 bar) |
|---|---|---|---|---|
| characteristic velocity | H2 / RP-1 | nonlinear increase | 1.24% | 0.90% |
| exhaust molecular weight | RP-1 / H2 | nonlinear increase | 1.00% | 0.72% |
| exhaust isentropic exponent | H2 / RP-1 | nonlinear increase | 0.54% | 0.43% |
| chamber temperature | RP-1 / CH4 | nonlinear increase | 4.80% | 3.56% |
| absolute exhaust pressure | RP-1 / H2 | linear increase | 195.78% | 130.75% |
| chamber-to-exhaust pressure ratio | H2 / RP-1 | nonlinear increase | 1.43% | 1.12% |
| exhaust temperature | RP-1 / H2 | nonlinear increase | 2.23% | 1.50% |
| exhaust density | RP-1 / H2 | linear increase | 192.91% | 129.33% |
| exhaust Mach number | H2 / RP-1 | nonlinear increase | 0.40% | 0.33% |
| rocket-relative exhaust velocity | H2 / RP-1 | nonlinear increase | 1.16% | 0.84% |
| ideal specific impulse | H2 / RP-1 | nonlinear increase | 1.16% | 0.84% |
| thrust coefficient | CH4 / H2 | nonlinear decrease | 0.08% | 0.06% |
Disclaimer/Publisher’s Note: The statements, opinions and data contained in all publications are solely those of the individual author(s) and contributor(s) and not of MDPI and/or the editor(s). MDPI and/or the editor(s) disclaim responsibility for any injury to people or property resulting from any ideas, methods, instructions or products referred to in the content. |
© 2026 by the authors. Licensee MDPI, Basel, Switzerland. This article is an open access article distributed under the terms and conditions of the Creative Commons Attribution (CC BY) license (http://creativecommons.org/licenses/by/4.0/).
Copyright: This open access article is published under a Creative Commons CC BY 4.0 license, which permit the free download, distribution, and reuse, provided that the author and preprint are cited in any reuse.