

Submitted:
13 November 2026
Posted:
16 November 2026
You are already at the latest version
Abstract
Field evidence on the performance of circular concrete materials in floating marine structures remains limited. This study presents the design, manufacture and nine-month marine exposure of a reduced-scale floating breakwater prototype measuring 3.40 m × 1.70 m × 1.05 m at the Port of Gijón, Spain. The reinforced shell comprised high-performance concrete in the bottom slab and walls and lightweight aggregate concrete in the top slab, while the core combined cellular concrete with fully encapsulated expanded polystyrene required to satisfy the buoyancy constraints of the reduced-scale prototype. The structure was held in position by a four-line catenary mooring system connected to gravity anchors.Prototype performance was evaluated through biofouling surveys, embedded corrosion-potential measurements, chloride profiling, reinforcement inspection, eddy-current corrosion sensing and acceleration monitoring. Biofouling coverage exceeded 85% on all evaluated surfaces, with mussel-dominated layers up to 35 mm thick. Wet biomass on the two sampled lateral faces ranged from 6.3 to 9.7 kg/m². Highly negative reinforcement potentials at permanently submerged locations were consistent with water-saturated, oxygen-limited concrete and did not, in isolation, demonstrate active corrosion. Chloride content exceeded the applicable 0.6% code limit at reinforcement depth only in the lightweight-concrete top slab near openings introduced for monitoring equipment. Possible localised pitting was observed in this area, but no measurable reduction in reinforcement thickness was detected.Environmental compensation reduced the variability of the eddy-current baseline to a ±135 Ω reference band during the analysed period, although field detection of active corrosion was not demonstrated. Dominant measured frequencies of 0.35–0.45 Hz were broadly consistent, within the estimated ±20% uncertainty, with the calculated rigid-body natural-frequency range, particularly the heave and pitch estimates.The campaign demonstrated satisfactory short-term marine performance of the prototype and identified instrumentation openings as the most critical durability details. The results also provide field evidence on biological colonisation, chloride ingress and sensor operation in a floating circular-concrete structure. Longer exposure under open-sea conditions is required to assess lifecycle durability, corrosion development and the long-term effects of biofouling on hydrodynamic response and mooring loads.
Keywords:
floating breakwater
; circular concrete
; lightweight aggregate concrete
; high-performance concrete
; biofouling
; chloride ingress
; reinforcement corrosion
; corrosion monitoring
; eddy-current sensor
; floating photovoltaics
1. Introduction
Floating photovoltaic (FPV) systems are increasingly being considered for nearshore and offshore sites, where wave loading, station keeping and long-term durability in seawater become governing design issues [1]. One way to increase the operational availability and energy output of marine FPV is to protect the array with an external floating breakwater that attenuates incoming waves. Box- and pontoon-type floating breakwaters are among the most widely studied configurations [2], and reinforced concrete is a natural material choice for such units because of its relatively low material cost, ease of local construction, durability and limited maintenance requirements.
The concept investigated here is a floating breakwater made of new circular concretes, intended to shelter an offshore FPV structure. Two concretes were developed for the shell of the breakwater, a lightweight aggregate concrete (LWAC) and a high-performance concrete (HPC), and a cellular concrete was developed for its core. These mixes were designed using recycled and other secondary materials or by-products, such as recycled aggregates from construction and demolition waste, glass waste, fly ash and ground granulated blast furnace slag, and were characterised and validated at laboratory level [3,4,5]. Laboratory testing, however, cannot reproduce the combined action of seawater, wave motion, tides, sunlight and biological colonisation that a floating structure experiences in service.
Two degradation-related processes are of primary interest for floating reinforced concrete. The first is biofouling, i.e. the accumulation, colonisation and growth of organisms such as bacteria, algae, diatoms, barnacles and mussels on submerged and splash-zone surfaces. For floating structures, fouling adds mass, which reduces freeboard, alters stability and increases hydrodynamic drag, and design standards therefore prescribe marine-growth allowances [6]. Metabolic products of some microorganisms may also contribute to biodeterioration of the cementitious matrix. Conversely, dense fouling layers may act as a physical barrier that limits the ingress of chloride ions [6,7], and bacterially induced calcium carbonate precipitation can seal pores and microcracks [8]. The net effect of biofouling on concrete therefore depends on the balance between detrimental and beneficial contributions and on local exposure conditions.
The second process is chloride-induced corrosion of the reinforcement, widely recognised as the main threat to the durability of reinforced concrete in marine environments. The alkaline pore solution passivates embedded steel, but chlorides from seawater, spray and tidal action penetrate the concrete cover and, once a critical content is reached at the steel surface, break down the passive film and initiate corrosion [9]. Corrosion reduces load-bearing capacity and service life and therefore governs safety, serviceability, maintenance cost and the sustainability of marine assets.
While laboratory studies on recycled and secondary raw materials in concrete are increasingly available, long-term field data from real marine exposure conditions, especially for floating concrete structures, remain very scarce [10]. In addition, embedded and surface-mounted sensors are increasingly proposed for the condition monitoring of marine concrete, but their reliability and environmental sensitivity in real floating deployments are rarely reported [11]
This study addresses these gaps with a reduced-scale floating breakwater prototype made of the circular concretes, moored for approximately nine months in the Port of Gijón (Spain). The objectives were (i) to describe the design, mooring and production of the prototype; (ii) to quantify the biofouling that developed on its surfaces; (iii) to assess the corrosion state of the reinforcement by combining embedded corrosion-potential sensors with chloride profiles and direct inspection; and (iv) to evaluate, under field conditions, an eddy-current corrosion sensor and an accelerometer-based vibration monitoring system. Section 2 describes the prototype and the exposure and monitoring programme, Section 3 presents the results, Section 4 discusses their implications and limitations, and Section 5 summarises the conclusions.
2. Materials and Methods
2.1. Prototype Concept and Materials
The prototype was conceived as a box-shaped, pontoon-type unit [12]. Its shell consists of reinforced HPC in the bottom slab and the side, bow and stern walls, and of reinforced LWAC in the top slab; the inner core consists of cellular concrete enclosed in expanded polystyrene (EPS) (Figure 1). The optimised mix recipes developed in [4] were used: Sample 2 for HPC, Sample 18 for LWAC and Sample 26 for cellular concrete (Table 1). The mixes were upscaled and adjusted for larger production volumes before casting.
The original intention was to use circular cellular concrete alone as the inner core. Stability and buoyancy checks, however, showed that such a prototype would be almost as large as a full-size unit and could not be manufactured. EPS, with a density of approximately 10 kg/m3 and low water absorption, was therefore incorporated into the core; it reduces the weight of the unit and prevents it from sinking in the event of unexpected water absorption by the cellular concrete. The EPS is fully encapsulated: an HPC bottom slab prevents direct contact between the EPS and seawater, thereby avoiding the release of microplastics. The reduced-scale prototype is therefore not fully circular; preliminary calculations indicated that a full-scale breakwater made exclusively of circular mixes would be technically viable and would satisfy the stability and buoyancy design limits [12].
2.2. Sizing
The prototype was sized on the basis of hydrostatic stability and buoyancy, with the following assumptions and criteria:
- wall thickness 0.06 m, top slab thickness 0.06 m and bottom slab thickness 0.1 m;
- material densities as listed in Table 1;
- marine growth with a thickness of 0.06 m and an average density in air of 1325 kg/m3, based on the recommendations in [7];
- metacentric height > 0.25 m in roll, i.e. for motions mostly transverse to the incoming waves with the highest probability;
- freeboard > 0.3 m.
The sizing initially produced a square unit in plan. Because most waves at the site approach from one side, perpendicular to the harbour wall, the length-to-width ratio was set to 2 to ensure stability in that direction. The resulting overall dimensions are 3.40 m × 1.70 m × 1.05 m; the dimensions of the individual elements are given in Table 2.
2.3. Mooring Design
A numerical model of the prototype was built in OrcaFlex to assess loads and motions at the site, including linear radiation and diffraction hydrodynamic coefficients and Froude–Krylov wave loads. Currents, waves and tides were considered; since no site-specific measurements were available, environmental data were taken from the oceanographic service of the Spanish state ports [13]. Station keeping is provided by a four-line catenary spread mooring, each line consisting of a chain section on the seabed connected to a polyester rope attached to a fairlead on the prototype (Figure 2).
The mooring was checked for the ultimate limit state (adequate strength of the individual lines under extreme environmental actions) and the accidental limit state (capacity to withstand the failure of one line). In addition, robustness checks were performed for very low peak periods and relatively high significant wave heights; all loads obtained in these checks, without load factors, were well below the design load of the mooring components. An initial sensitivity analysis, based on 3-hour time-domain simulations with a single, fixed wave seed, was used to select the chain diameter. The anchors were placed at a radius of 100 m in plan to prevent uplift at the anchor points; the 17 m polyester sections connect to 75 m chain sections, giving a relatively loose catenary that allows the unit to move with the waves while minimising the vertical loads imposed by the mooring. A chain diameter of 10 mm and a polyester rope diameter of 20 mm were found to be appropriate (Table 3).
The lines are anchored by gravity (deadweight) anchors. The seabed at the site consists of quarry material dumped and preloaded during port expansion works, whose properties and degree of compaction are unknown. The anchors were therefore designed against sliding following the drained sliding-resistance criterion adopted in [14,15]. The required concrete volume was 2.97 m3 for a smooth and 2.1 m3 for a rough seabed interface; the worst case, 2.97 m3, was adopted. The anchor blocks were cast with a conventional HA-40/B/20/XC2 concrete.
2.4. Production
The prototype was cast in timber moulds, with an outer mould for the shell and a smaller inner mould inserted into it to form the walls and bottom slab. Steel bars and mesh were cut, bent and welded according to the detailed drawings and placed with cover spacers, together with lifting points and connections. The commercial corrosion sensors described in Section 2.7 were fixed to the reinforcement before casting. Casting proceeded in three stages: (1) 1.5 m3 of HPC was produced in a mixer lorry and poured, vibrated and levelled to form the bottom slab and walls; after approximately 24 h the inner mould was removed and small surface defects were repaired with repair mortar; (2) a first layer of EPS was placed on the HPC base and 0.7 m3 of cellular concrete was poured, tamped and levelled to form the core; (3) after approximately 24 h, a second EPS layer and the top-slab reinforcement were placed, a structural polymeric adhesive was brushed onto the top of the HPC walls to improve bonding between hardened HPC and fresh LWAC, and 0.5 m3 of LWAC was poured, vibrated, tamped and levelled. The geometrical volumes installed in the prototype were 1.11, 0.35 and 0.50 m³, while the production batches were 1.5, 0.5 and 0.7 m³, respectively, allowing for casting losses, testing samples and construction tolerances. The unit was demoulded approximately 24 h later and minor surface defects were repaired. No major difficulties occurred during production; the top surface finish was rougher than expected, which is not unusual for LWAC.
2.5. Exposure Site and Deployment
The exposure site is located in the Port of Gijón (El Musel), on the central coast of northern Spain (Asturias), one of the main ports of Atlantic Europe (Figure 3). The prototype, its mooring system, the concrete anchor blocks and a marking buoyage system were transported to the site at the beginning of September 2025. The monitoring devices were mounted on the top surface of the prototype in the week commencing 15 September 2025, together with a solar-powered GPS unit that tracked the position of the prototype and whose solar panel also powered the electronics of the commercial corrosion sensors. The anchor blocks, the four marker buoys and the prototype were installed between 24 and 26 September 2025. The prototype remained moored for approximately nine months and was retrieved on 16 and 17 June 2026; all inspections and sampling described below were carried out after retrieval. Photographs of the prototype after exposure are given in Appendix Appendix A.
2.6. Monitoring and Inspection Programme
Table 4 summarises the monitoring and inspection programme. Its individual components are described below.
2.6.1. Biofouling Assessment
Biofouling was assessed in two ways. First, following ASTM D6990 and ASTM D3623 [16,17], the fouling rating, defined as the percentage of the concrete surface covered by fouling organisms, was evaluated on all exposed surfaces (top, bottom and four lateral surfaces). Second, the fouling was removed from a 1 m2 area on two of the four lateral surfaces, selected as representative of the most heavily fouled areas, and the wet and dry weights of the collected biomass were determined; dry weight was obtained after oven-drying at 80–100 °C to constant weight. In addition, the predominant organisms on each surface were identified visually and the thickness of the fouling layer was measured.
2.6.2. Embedded Corrosion-Potential Sensors
A commercial corrosion monitoring system (Corrochip [18]) was embedded in the prototype before casting. The system provides remote, real-time measurements of physicochemical parameters and estimates of the corrosion rate based on potential step voltammetry; in this study, the corrosion potential (Ecorr) and temperature are reported. Four monitoring points were selected in the zones considered most susceptible to deterioration (Figure 4): P1, the HPC–LWAC interface; P2, the anchorage zone (HPC); P3, the tidal area (HPC); and P4, the top surface (LWAC). Two working electrodes (SC1 and SC2) were installed at each point and one measurement per day was recorded. The monitoring electronics were placed in an enclosure on the top surface and powered by the solar panel; openings were made in the top slab to mount this equipment.
Potentials were measured against a saturated calomel electrode (SCE) and interpreted using the corrosion-risk ranges of UNE 112083 [19] (Table 5), bearing in mind that, according to RILEM TC 154-EMC, potentials in water-saturated concrete with limited oxygen availability can reach highly negative values close to −1 V without implying active corrosion [19].
2.6.3. Chloride Profiles and Inspection Openings
After retrieval and removal of the fouling, the areas of the four monitoring points were inspected visually. Concrete cores with a diameter of 10 cm were then extracted at P1–P4, and concrete powder was obtained from the cores at separate depth intervals with a profile grinder in accordance with EN 14629 [19]. The chloride content of the powder was determined by X-ray fluorescence spectrometry using a portable NITON XL3t 950 GOLDD spectrometer operating in mining mode.
The chloride content (%) by mass of cement of each powder sample was determined using the following equation:

Where:
CCl,cem is the chloride content by mass of cement; CCl,powder is the chloride content measured in the concrete powder; ρconcrete is the concrete density in kg/m3; and mcement is the cement content in kg/m3 of concrete. Chloride contents were compared with the limits of the Spanish structural code [22], which restricts the chloride ion content of concrete to 0.6% by mass of cement for structures exposed to airborne sea salts or located in tidal, splash or spray zones, and to 0.8% for structures permanently submerged in seawater. Finally, inspection openings were made around the monitoring points to examine the reinforcement and the surrounding concrete, and the remaining rebar thickness was measured (nominal diameter 10 mm).
2.6.4. Eddy-Current Corrosion Sensor
A surface-mounted eddy-current sensor node, developed within the project [23], was installed on the top surface above two parallel rebars located approximately 3.5 cm below the surface. The sensor measures Rp, the parallel resistance of an LC resonator coupled to the reinforcement; corrosion products and loss of steel section are expected to increase Rp by weakening the eddy-current response. Two measurement events, each of two consecutive measurements, were recorded per day; each logged value is the median of 300 data points after outlier filtering, and temperature was recorded inside the electronics enclosure. Data were transmitted via a LoRa gateway located approximately 3 km from the prototype and a 4G router. The sensor design, its laboratory validation and the environmental compensation procedure are described in Appendix Appendix B.
2.6.5. Vibration Monitoring
A wireless node with an ADXL355 three-axis accelerometer was mounted on the top surface. It communicated directly with a cloud platform via LTE, which also allowed remote configuration. The records were analysed in the time and frequency domains; the dominant spectral peak was compared with independent estimates of the natural periods of the floating unit [24], and the root-mean-square (RMS) acceleration was used as a measure of motion intensity.
3. Results
3.1. Biofouling
After approximately nine months, all exposed surfaces were extensively fouled, with fouling ratings above 85% on every surface and up to 100% on one lateral surface (Table 6). The lateral surfaces were the most heavily colonised and showed a clear vertical zonation: green algae in the upper zone, brown, green or red algae together with mussels and barnacles in the middle zone, and mussels in the lower zone. The fouling layer thickened with depth, from 5–10 mm (5–15 mm on lateral surface 4) in the upper zone to 15–35 mm in the lower zone. The two sampled lateral surfaces carried a wet biomass of 6.3 and 9.7 kg/m2 and a dry biomass of 2.1 and 4.2 kg/m2. The higher load on lateral surface 2 is likely related to greater wave exposure and enhanced water renewal, whereas the opposite face (lateral surface 1) was more sheltered.
The top surface was covered by a green algal biofilm 12 mm thick, and the bottom surface was colonised mainly by barnacles and microalgae, with a layer 15 mm thick; both carried less biomass, and hence less additional load, than the lateral surfaces. After removal of the fouling, no signs of deterioration were visible on the examined concrete surfaces.
3.2. Corrosion Potential
Ecorr was recorded from 11 September 2025 to 8 April 2026 at P1, P2 and P4, and until 29 November 2025 at P3; thereafter the electronics most likely failed due to water ingress. At all monitoring points the potential dropped sharply a few days after the prototype was launched. Figure 5 and Figure 6 show the records for P1 (HPC–LWAC interface, in the tidal area) and P4 (LWAC top surface, in the aerial area); the records for P2 and P3 are available in the underlying data report.
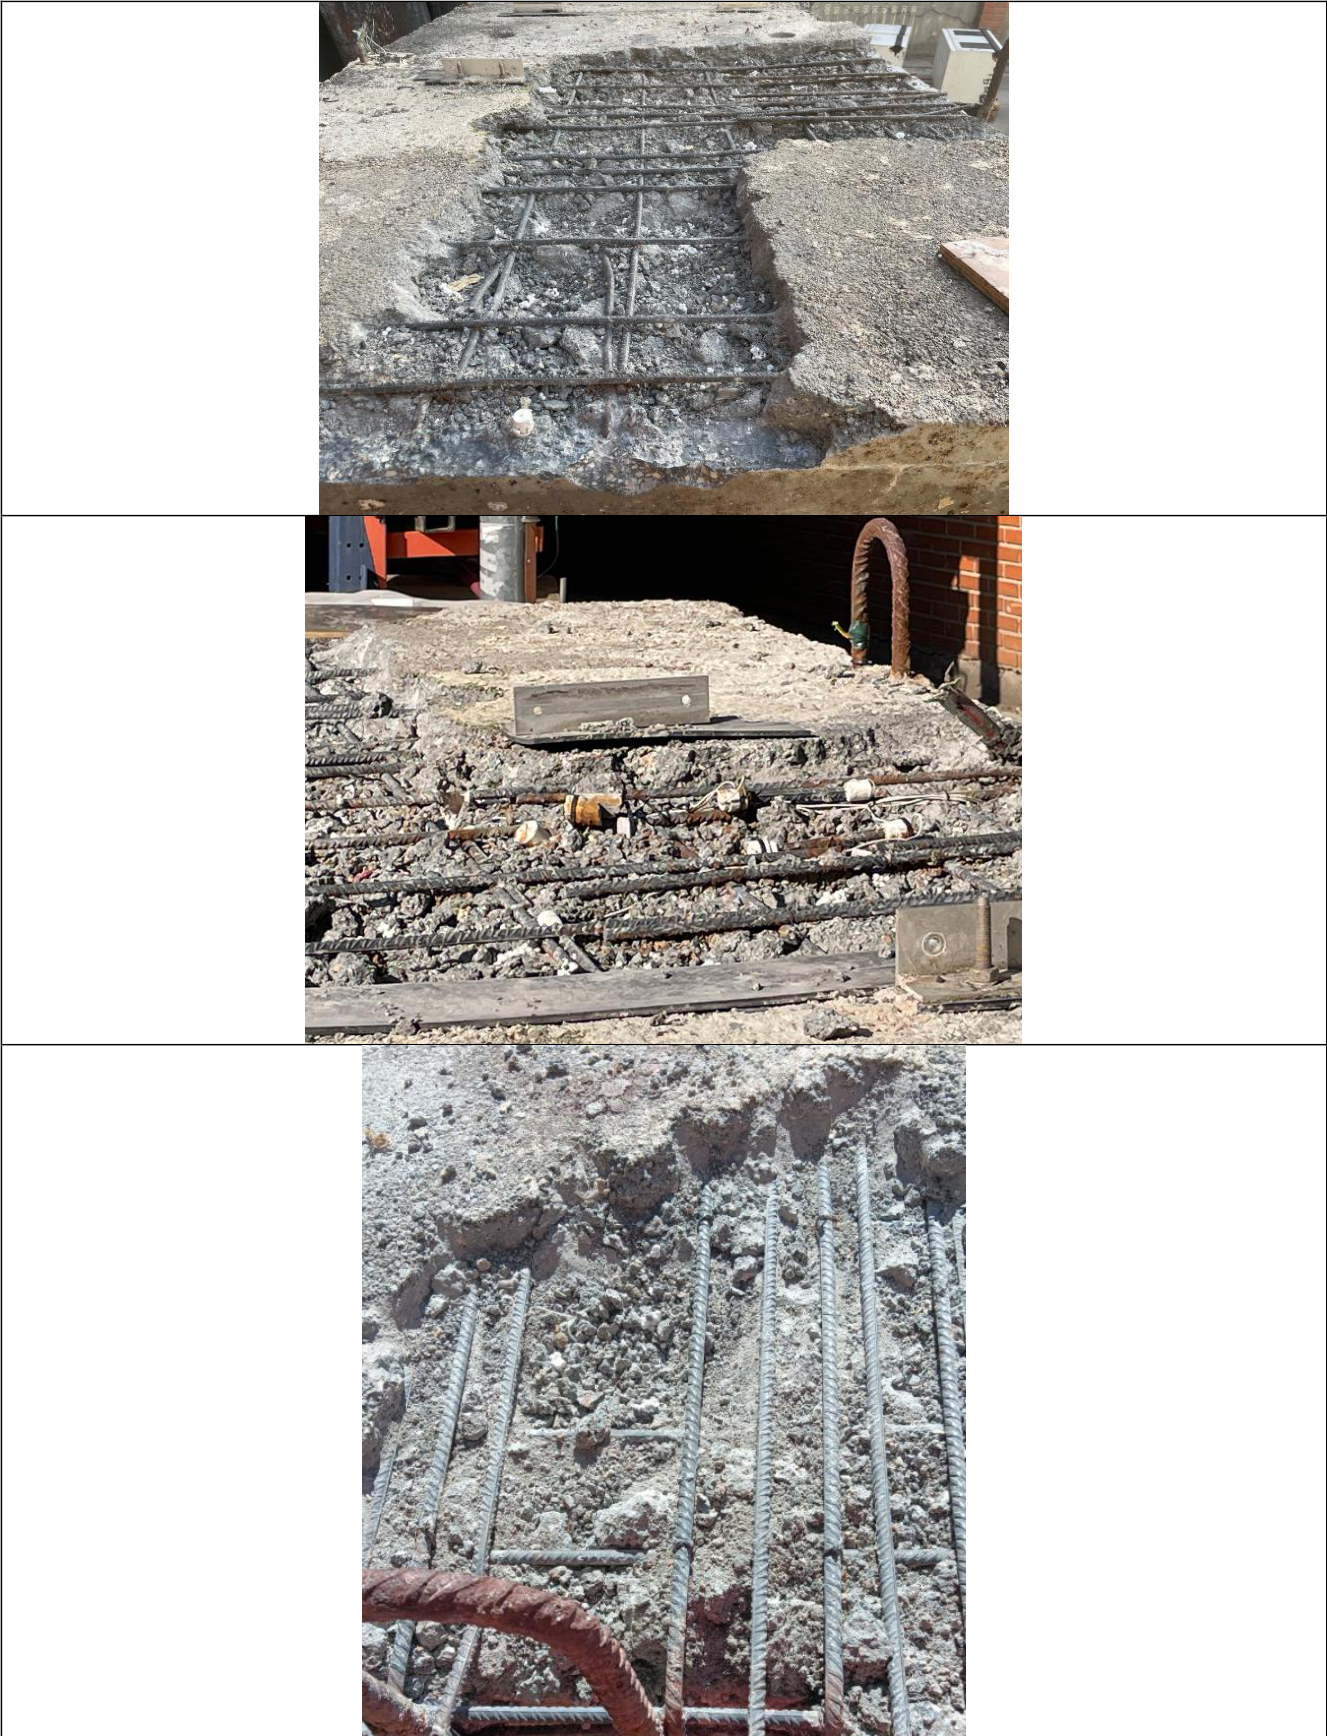
According to Table 5, the negative potentials measured would place all four monitoring points in the range associated with a high probability of corrosion. For P1–P3, which remained almost permanently submerged, such highly negative values are, however, typical of water-saturated concrete with limited oxygen availability [18]. P4, located on the top surface and exposed to greater oxygen availability, also showed negative values together with abrupt variations of Ecorr over time, which may indicate a high risk of corrosion at that location. At P4, the combination of highly negative and variable potentials, elevated chloride content at reinforcement depth and visual indications of possible localised pitting suggested a higher corrosion risk than at P1–P3. Seawater may have entered the top slab through the openings made to mount the electronics enclosure, which may not have been properly sealed (Appendix A).
3.3. Chloride Profiles and Condition of the Reinforcement
The chloride profiles of the cores taken at P1–P4 are shown in Figure 7. As expected, the chloride content decreases with increasing depth from the exposed surface. A chloride content exceeding 0.6% by mass of cement at the depth of the sensors and reinforcement (3 cm) was observed only in the core from P4, in the LWAC top slab. At P1–P3, in the HPC walls, the chloride content at that depth was below this limit.
The inspection openings revealed no visible damage to the concrete or the reinforcement around P1–P3 in the HPC walls (Appendix A). On the top surface, in the area where the electronic equipment and solar panel were installed, signs of possible localised chloride-induced pitting corrosion were detected on the reinforcement and on the corrosion sensors; rebar thickness measurements, nevertheless, showed no measurable loss of reinforcement thickness. The remaining areas of the top surface, which were not affected by seawater, showed no evidence of exposure-related deterioration. The chloride profiles and direct inspection are thus consistent with the interpretation of the potential records given in Section 3.2.
3.4. Eddy-Current Corrosion Sensor
The eddy-current sensor recorded data until 3 January 2026, when the largest RMS acceleration of the deployment coincided with a complete loss of data transmission, later traced to a cable fault at the LC resonator. Because a progressive reduction of Rp (approximately 141 Ω in the 7-day moving median) began around 25 December 2025, coinciding with the onset of vertical movement detected by the accelerometer on 24 December, the analysis was limited to the period 27 September–23 December 2025 (88 days).
The raw Rp signal was strongly influenced by the environment. Over a calibration window from 27 September to 12 November 2025, during which corrosion was assumed not to have initiated, Rp decreased by approximately 0.1006 kΩ per 1 °C increase in temperature, in close agreement with a laboratory-derived coefficient of −0.1158 kΩ/°C; even after temperature compensation, Rp decreased by approximately 1.92 kΩ from the end of September to the end of December. Laboratory experiments on an unreinforced concrete block showed that moisture near the coil and repeated wetting–rewetting cycles also lower Rp (Appendix Appendix B). A falling Rp is the opposite of the response expected from corrosion, so this drift could not be attributed to corrosion.
After sequential compensation of temperature, short-term moisture-related (envelope) variations and the long-term time trend, and filtering with a 7-day moving median, the corrosion-sensitive signal Rp,final oscillated around its baseline with a standard deviation of approximately 45 Ω and remained within a 3σ reference band of approximately ±135 Ω throughout the analysis period, without a sustained step-like deviation (Figure 8). This is consistent with the absence of visible corrosion on the monitored rebars when they were exposed through the inspection openings. The ±135 Ω band is about 70% narrower than the ±448 Ω threshold obtained from the unfiltered compensated signal, and smaller than the Rp change of approximately 278 Ω measured in the laboratory for a mechanically induced reduction of approximately 0.17 mm in rebar diameter.
3.5. Motion Response
Once the prototype was deployed, the accelerometer captured periodic oscillations. Spectral analysis showed that the dominant spectral peak was consistently concentrated in the 0.35–0.45 Hz range on the X, Y and Z axes under different sea conditions (Figure 9). This range is consistent with the independently estimated natural frequencies of the main motion modes of the unit, which carry an uncertainty of ±20% (Table 7), indicating that the dominant spectral peak is related to the natural motion of the floating prototype. The RMS acceleration (Figure 10) quantified the intensity of the motion and identified the most severe conditions experienced during the deployment; it also provides a means of comparing frequencies measured under similar excitation, since changes in sea state can modify the dynamic response without indicating any change in the condition of the structure. The accelerometer node operated reliably throughout the deployment.
4. Discussion
4.1. Biofouling and Its Relevance for Floating Concrete Units
Within one exposure period of approximately nine months, fouling covered practically all surfaces of the prototype. Its distribution reflected local conditions: light availability, together with the nutrient enrichment typical of port waters (e.g. NO3− and PO43−), favoured algae on the top surface and in the upper and middle zones of the lateral faces, while mussels dominated the permanently submerged lower zones, where the thickest and heaviest layers formed. The difference between the two weighed lateral faces suggests that hydrodynamic exposure also matters, although only two faces were weighed and the attribution to wave exposure and water renewal remains qualitative.
For the design of floating concrete units, the most relevant quantity is the added mass. The prototype was sized for a marine-growth layer 0.06 m thick [4]; the largest thickness measured after nine months was 35 mm, in the lower zone of the lateral faces. The design allowance was therefore not exceeded during this exposure. However, the record covers a single, incomplete annual cycle at one location, and fouling communities and thicknesses can continue to develop over subsequent years. The data therefore provide a first site-specific reference rather than a basis for reducing the marine-growth allowance, which was identified as a key driver of the prototype size.
Fouling may also affect durability. Organism layers on concrete have been reported to slow chloride ingress [6,7]. In this study, the heavily fouled, almost permanently submerged HPC walls showed chloride contents below 0.6% by mass of cement at reinforcement depth, but the experiment had no unfouled reference surface, so a protective contribution of the fouling can neither be confirmed nor excluded. Likewise, no evidence of biodeterioration was observed on the cleaned concrete surfaces after nine months, which is too short a period to rule out slower biologically driven processes.
4.2. Corrosion State of the Reinforcement
Taken at face value against the UNE 112083 ranges, the potential records would indicate a high probability of corrosion at all four monitoring points, whereas cores and inspection openings showed sound reinforcement at P1–P3. This discrepancy illustrates a known limitation of potential measurements: in water-saturated, oxygen-limited concrete, highly negative potentials are expected even for passive steel, and potentials should be interpreted together with other information such as chloride content [18]. For permanently or largely submerged floating elements, potential-only monitoring is therefore of limited diagnostic value unless supported by chloride profiling, direct inspection or intensity of corrosion (Icorr) and corrosion rate (vcorr).
The only location with an elevated chloride content at reinforcement depth and possible localised pitting was the top slab near the openings made for the monitoring electronics. The most plausible explanation is seawater entering through these openings, which may not have been properly sealed; the rest of the top surface, which was not affected by seawater, showed no deterioration. Because the LWAC top slab was also the location of these penetrations, the present data cannot separate a possible material effect (LWAC versus HPC) from this detailing effect. The practical lesson is that penetrations, equipment mounts and cable entries through the deck of a floating concrete unit are durability-critical details that must be sealed or avoided, particularly where wave overtopping or spray can reach them.
It should also be noted that the 0.6% and 0.8% values used here are code limits on the chloride content of concrete, not corrosion-initiation thresholds; reported critical chloride contents vary widely with steel, concrete and exposure conditions [9]. The fact that P4 exceeded 0.6% at 3 cm depth while no measurable loss of rebar thickness was found is consistent with corrosion being at most at an early stage at that location.
4.3. Performance of the Monitoring Technologies
The field campaign exposed the reliability problems of electronics on small floating units. The electronics of the commercial corrosion sensors most likely failed because of water ingress, at P3 on 29 November 2025 and at the other points after 8 April 2026, and the eddy-current sensor was lost after a cable fault that coincided with the most severe motion event. The accelerometer node, which communicated directly via LTE, operated throughout. Enclosure sealing, cable routing and strain relief therefore deserve as much attention as sensor accuracy in future floating deployments.
The eddy-current results show that, on a floating structure, environmental effects dominate the raw signal: the temperature effect alone was of the order of 0.1 kΩ/°C, and moisture and repeated wetting were shown in the laboratory to produce a progressive downward drift. The sequential compensation reduced the residual variability of the moving-median signal to a ±135 Ω band, below the approximately 278 Ω change produced in the laboratory by a 0.17 mm reduction in rebar diameter. This indicates that, after compensation, the field noise floor would in principle permit detection of section losses of that order. However, the evidence is limited to baseline stability: no corrosion developed at the monitored rebars, the compensation parameters were derived from a 47-day window assumed to be corrosion-free, and the useful record covers only 88 days. The detection capability therefore remains to be demonstrated on corroding reinforcement, and, as the 3σ band is specific to this deployment, a site-specific calibration period will be needed elsewhere.
The accelerometer data show that the dominant response of the prototype is governed by its rigid-body natural motions, in agreement with the estimated natural frequencies. RMS acceleration proved useful for identifying severe events and, combined with the spectral peak, could support condition monitoring by tracking changes in dynamic response under comparable excitation; because no structural change occurred, this possibility was not tested here.
4.4. Limitations
- A single reduced-scale prototype was tested at one site, without a companion unit made of conventional concrete; the results therefore cannot quantify the performance of the circular concretes relative to conventional mixes.
- The exposure lasted approximately nine months, which is short compared with the corrosion-initiation and fouling-development time scales relevant to the service life of marine structures.
- The prototype core included EPS and was therefore not fully circular; the feasibility of a fully circular full-scale unit is based on preliminary calculations only.
- Corrosion-potential records were interrupted by electronics failures; moreover, neither corrosion-rate estimates nor corrosion-intensity measurements from the commercial system were reported, and the eddy-current record was truncated at 88 days.
- Chloride contents were obtained with a portable X-ray fluorescence spectrometer, and biomass was measured on only two of the four lateral faces.
- The temperature used for compensating the eddy-current signal was measured inside the electronics enclosure rather than at the rebars, and the natural-frequency estimates carry an uncertainty of ±20%.
- No mechanical tests on the exposed concretes after retrieval are reported.
5. Conclusions
A reduced-scale floating breakwater prototype (3.40 m × 1.70 m × 1.05 m) with a reinforced HPC and LWAC shell and a cellular-concrete/EPS core, produced from circular concrete mixes, was designed, moored and exposed for approximately nine months in the Port of Gijón. The main conclusions are as follows:
- The prototype was produced without major difficulties and, held by a four-line catenary chain–polyester mooring with gravity anchors, remained in operation throughout the approximately nine-month exposure.
- Fouling covered more than 85% of all surfaces. The lateral faces were the most heavily fouled, with mussel-dominated lower zones up to 35 mm thick and wet biomass of 6.3–9.7 kg/m2; the top and bottom surfaces carried thinner algal and barnacle layers. The maximum thickness remained below the 0.06 m marine-growth allowance used in sizing.
- Highly negative corrosion potentials at the tidal and submerged monitoring points were consistent with water-saturated, oxygen-limited concrete rather than active corrosion. Cores and inspection openings showed chloride contents below 0.6% by mass of cement at reinforcement depth and the reinforcement in the HPC walls was found to be in sound condition.
- Elevated chloride content and possible localized pitting, without measurable loss of rebar thickness, were found only in the LWAC top slab near openings made for monitoring electronics, pointing to deck penetrations as the critical durability detail of floating concrete units.
- The eddy-current corrosion sensor was strongly affected by temperature, moisture and wetting–drying; after sequential compensation, its signal remained within a ±135 Ω band, consistent with the absence of corrosion, but its ability to detect corrosion in the field remains to be demonstrated.
- The accelerometer operated reliably throughout; the dominant 0.35–0.45 Hz response agreed with the estimated natural frequencies, and RMS acceleration identified the most severe events. Sealing of sensor electronics and cables was the main weakness of the monitoring set-up.
Longer exposures, comparison with conventional concrete and post-exposure mechanical testing are needed before the long-term durability of the circular concretes in floating breakwaters can be reliably assessed.
Author Contributions
Conceptualization, Rafael Ruiz Maestre and Aurora María Casado; methodology, Rafael Ruiz Maestre, Valle Chozas and Aurora María Casado; investigation, Valle Chozas, Aurora María Casado and Ainhoa Cortés; validation, Aurora María Casado and Valle Chozas; formal analysis, Rafael Ruiz Maestre and Aurora María Casado; data curation, Aurora María Casado, Upeksha Chathurani Thibbotuwa, Andoni Irizar, Aitor Olaizola and Ainhoa Cortés; visualization, Rafael Ruiz Maestre; writing, original draft preparation, Balram Panjwani; writing, review and editing, all authors; supervision, Aurora María Casado; project administration, Aurora María Casado and Valle Chozas; funding acquisition, Aurora María Casado.
Funding
This research was funded by the European Union through the Horizon Europe project SUREWAVE, grant agreement No. 101083342.
Institutional Review Board Statement
Not applicable.
Informed Consent Statement
Not applicable.
Data Availability Statement
The underlying data are reported in the public SUREWAVE project reports D4.3 (Breakwater prototype) and D6.4 (long-term validation of the floating concrete breakwater prototype in the marine environment).
Acknowledgments
The authors gratefully acknowledge all partners of the Horizon Europe SUREWAVE consortium, namely SINTEF, ACCIONA, CEIT, Clement Germany, MARIN, Sunlit Sea and ifeu – Institute for Energy and Environmental Research Heidelberg, for their contributions to the development and validation of the floating-breakwater concept. Particular thanks are extended to the teams involved in circular-concrete development, prototype design and manufacture, mooring analysis, marine deployment, biofouling and durability assessment, corrosion sensing, vibration monitoring and data interpretation. The authors also acknowledge the technical and operational support received during the approximately nine-month deployment and recovery of the prototype at the Port of Gijón, Spain.
Conflicts of Interest
The authors declare no conflicts of interest.
Disclaimer
Funded by the European Union. Views and opinions expressed are however those of the author(s) only and do not necessarily reflect those of the European Union. Neither the European Union nor the European Climate, Infrastructure and Environment Executive Agency (CINEA) can be held responsible for them.
Appendix A. Photographs of the Prototype and Inspections
Figure A1.
The prototype after approximately nine months of exposure in the Port of Gijón.
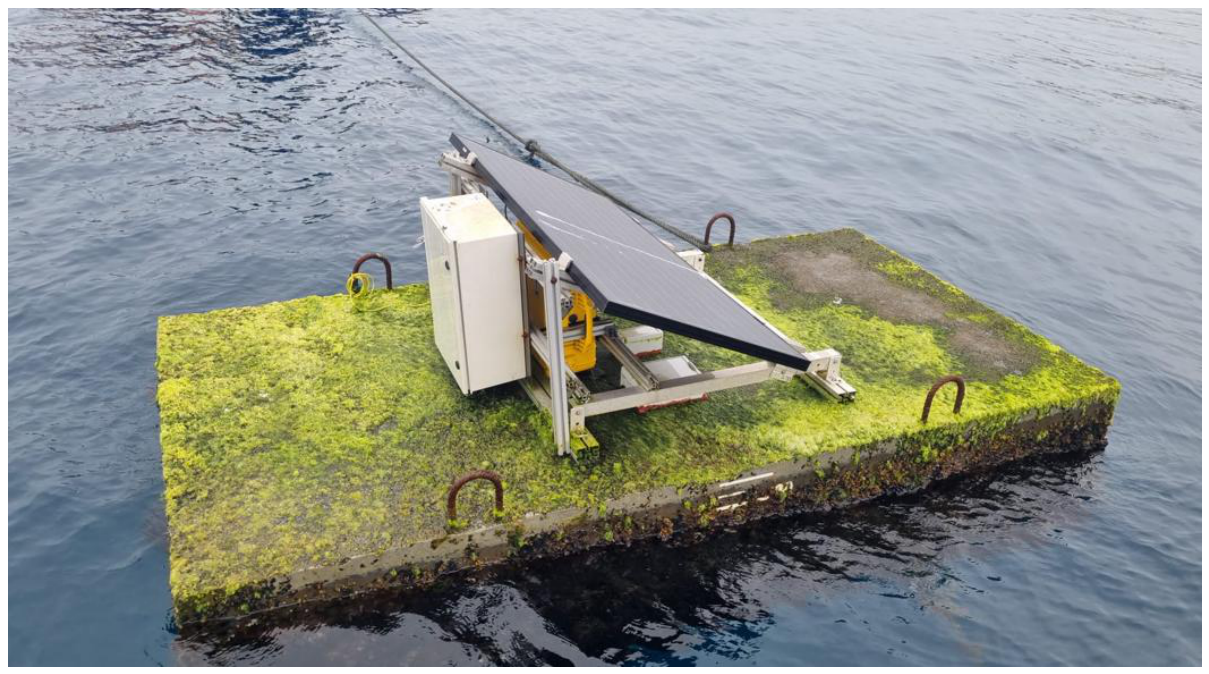
Figure A2.
Openings made in the top slab to mount the electronics enclosure.
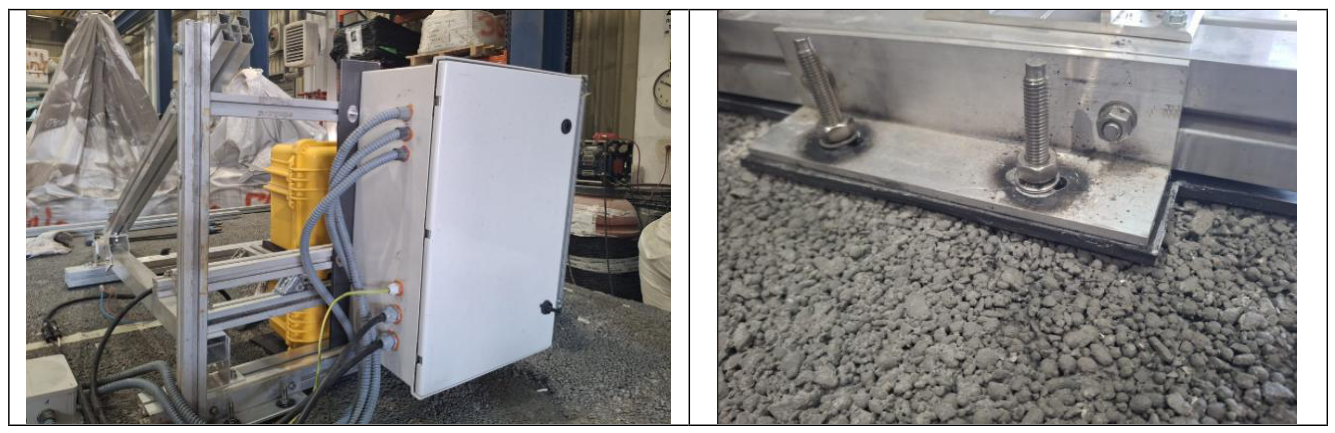
Figure A3.
Inspection openings in the areas of monitoring points P1–P3 in the HPC walls.
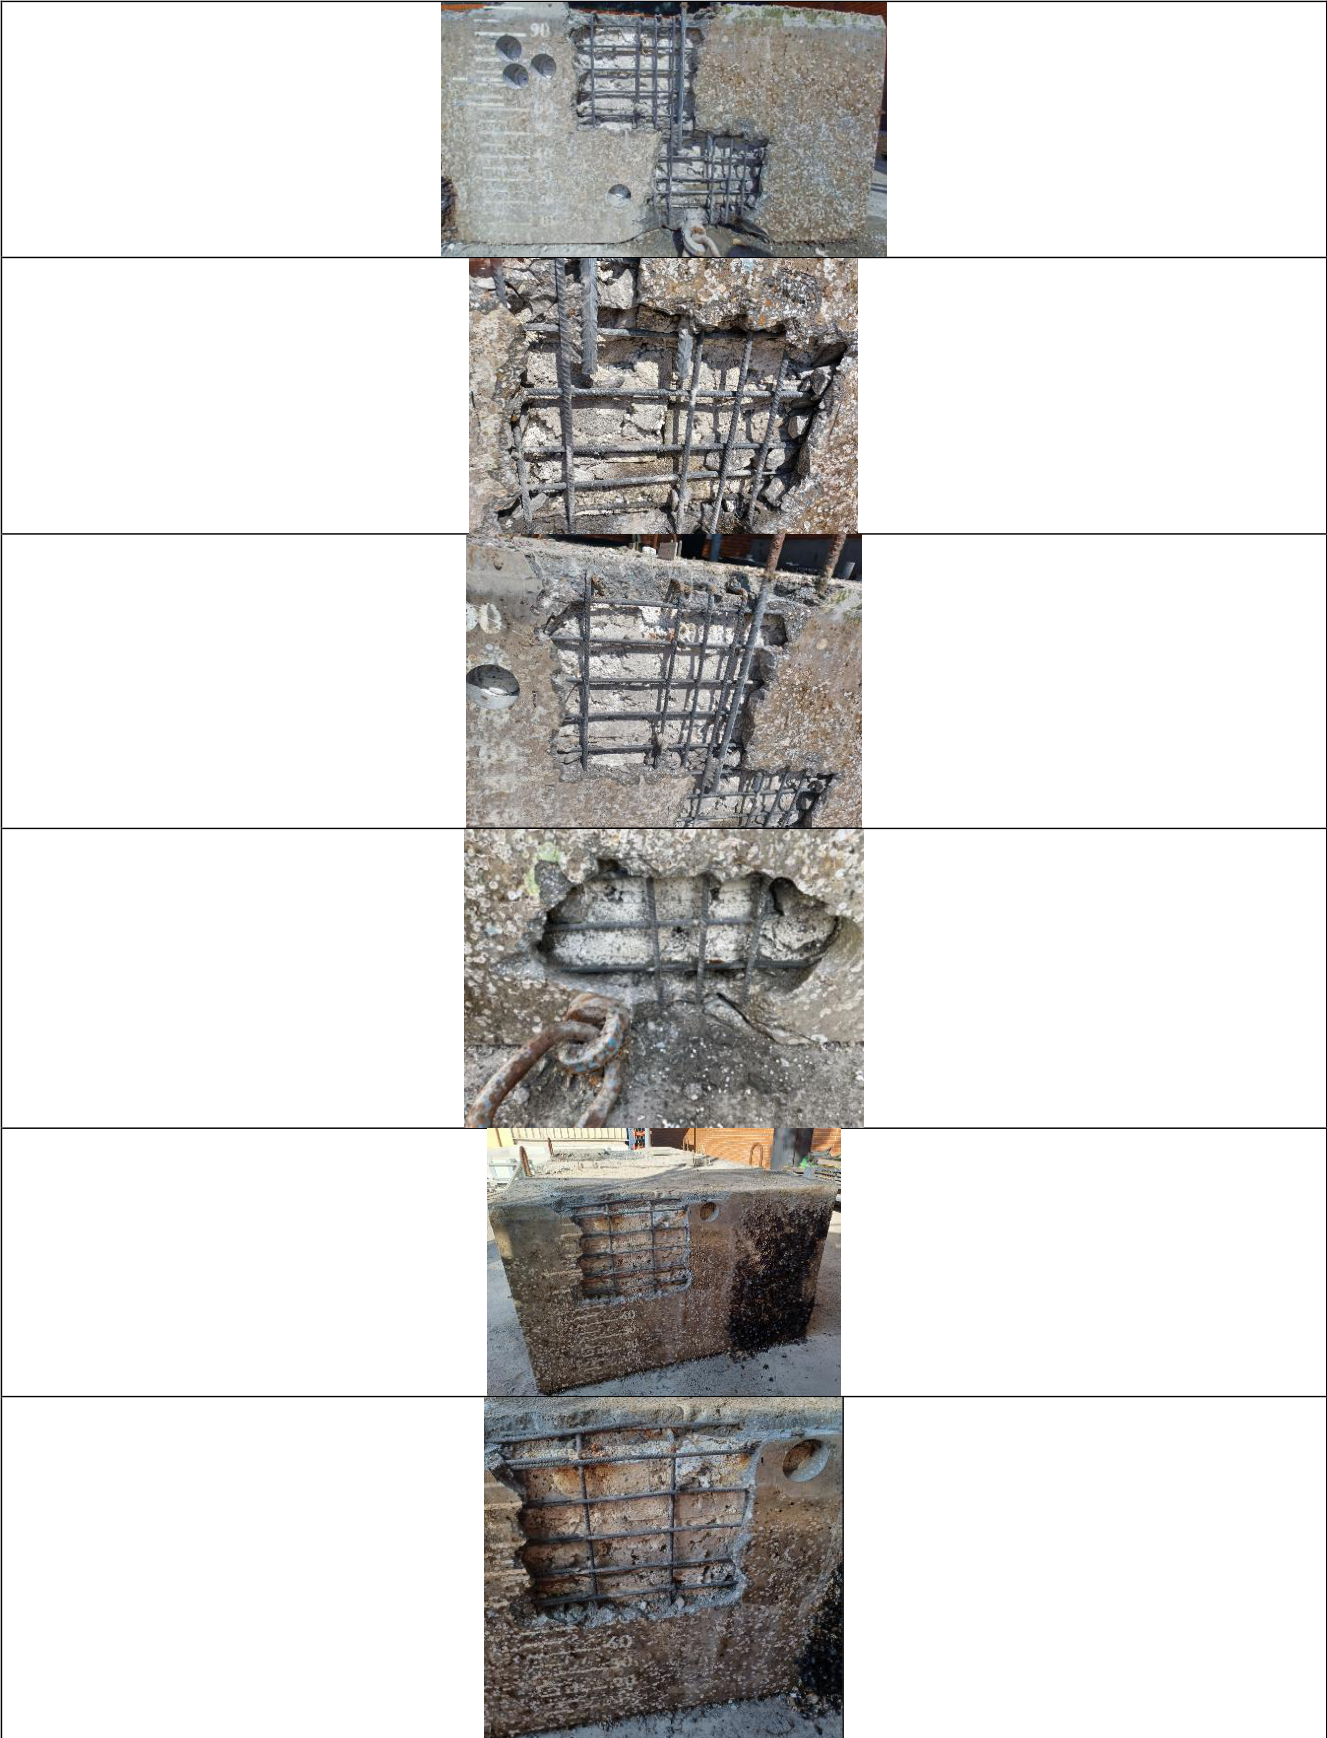
Figure A4.
Inspection openings around monitoring point P4 in the LWAC top slab.
Appendix B. Eddy-Current Sensor: Validation and Environmental Compensation
Laboratory validation. The sensor was validated on a representative concrete block with three reinforcement configurations: single rebar, two parallel rebars and a rebar intersection. The largest changes in Rp relative to a no-rebar condition (defined as 100% corrosion) were approximately 25 kΩ for the intersection and 24 kΩ for the two-rebar configuration, indicating good sensitivity to the reinforcement condition. Displacements of the coil of 1 cm had minimal effect, and aligning the ferrite plate parallel to the rebars maximised the signal; in the field, the sensor was oriented to align with the two parallel rebars. The node was configured for two measurements per day with a sleep period of approximately 12 hours, and power-consumption profiling confirmed that the battery life would exceed the test duration.
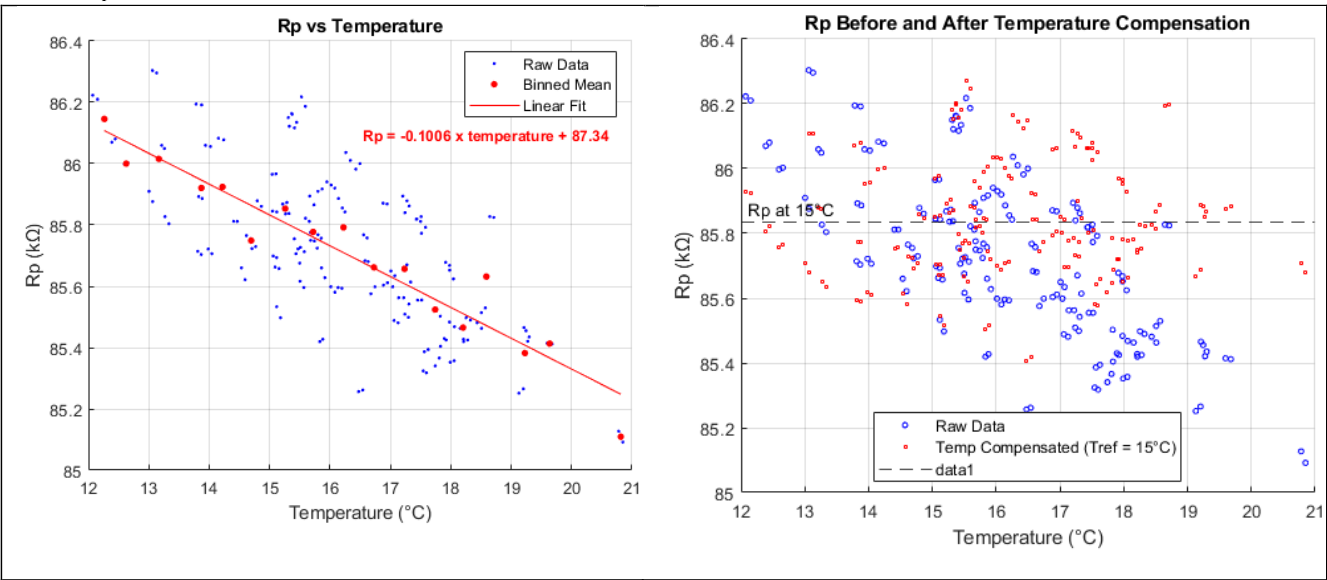
Temperature compensation. Rp values from the calibration window (27 September–12 November 2025, approximately 47 days) were grouped into 0.5 °C bins over the observed range of approximately 12–21 °C (Figure B1). A linear fit to the binned means gave R2 = 0.9282; a quadratic fit gave R2 = 0.9377, but the 95% confidence interval of its quadratic coefficient (p1 = −0.004255; 95% CI [−0.01051, 0.002]) included zero, so the linear model was adopted. The resulting coefficient was a1 = −0.1006 kΩ/°C (95% CI [−0.116, −0.0852]), compared with −0.1158 kΩ/°C from a laboratory study (0–45 °C) evaluated over 10–20 °C. Within each 0.5 °C bin, Rp still varied by approximately ±500 Ω, far more than the 50–60 Ω measurement noise, indicating that other environmental variables, such as moisture, tide and seawater conductivity, also influence Rp. After temperature compensation, Rp decreased by approximately 1.92 kΩ from the end of September to the end of December relative to the reference value Rp,ref = 86.2586 kΩ.
Figure B1.
Temperature dependence of Rp during the calibration period and linear temperature compensation.
Figure B1.
Temperature dependence of Rp during the calibration period and linear temperature compensation.
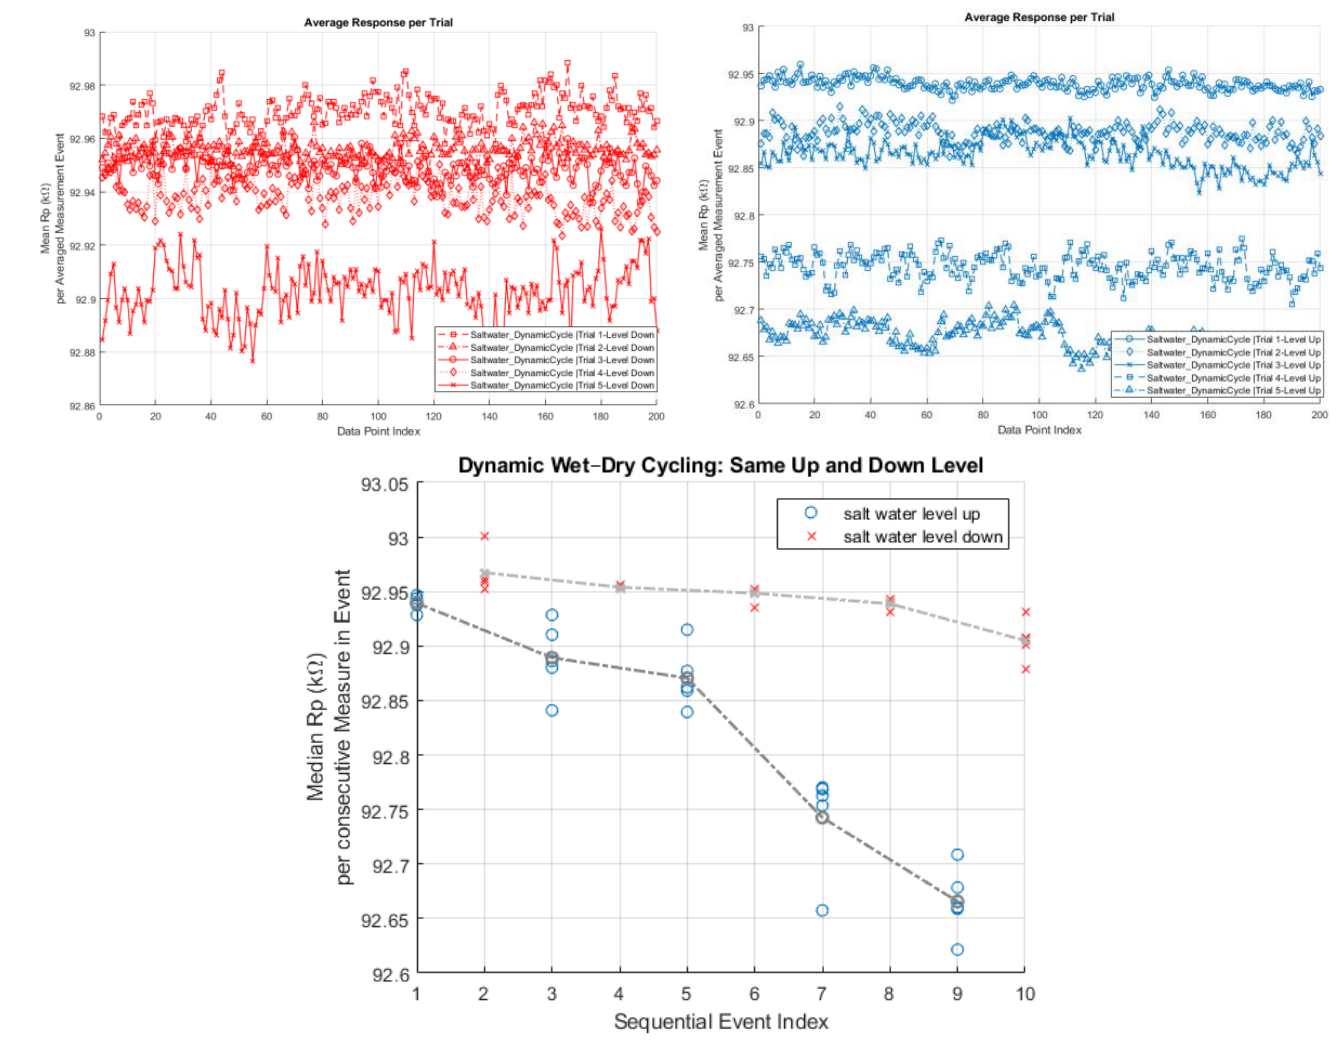
Effect of moisture and wetting–rewetting. A 15 × 15 × 15 cm concrete block without reinforcement was used. In Experiment 01, the block was progressively submerged in distilled water (dry, 5 cm, 11.5 cm and 14 cm water level from the bottom) and the water was then removed. Rp decreased as the water level rose and recovered as water was removed, with a residual hysteresis at the end of the cycle (Figure B2); Rp remained within approximately 92.2–93.6 kΩ, inside the measuring range of 48.481–109.083 kΩ. Because distilled water has a much higher relative permittivity (~80) than dry concrete (~6–8), its presence near the coil increases parasitic capacitance and dielectric losses, lowering Rp even without salt or rebar. In Experiments 02 and 03, the block was cycled in saltwater (35 g/L), with progressively larger drawdowns (1 L to 4 L) or with fixed up and down levels (2 L added and removed per event), respectively. Rp responded immediately to the proximity of the water, and successive wetting–rewetting events progressively lowered the baseline at every fixed level (Figure B3), showing that the downward drift is a concrete-matrix phenomenon associated with cumulative moisture and salt uptake.
Figure B2.
Rp as a function of the distilled-water level around an unreinforced concrete block (Experiment 01), forward (water addition) and reverse (water removal) phases.
Figure B2.
Rp as a function of the distilled-water level around an unreinforced concrete block (Experiment 01), forward (water addition) and reverse (water removal) phases.
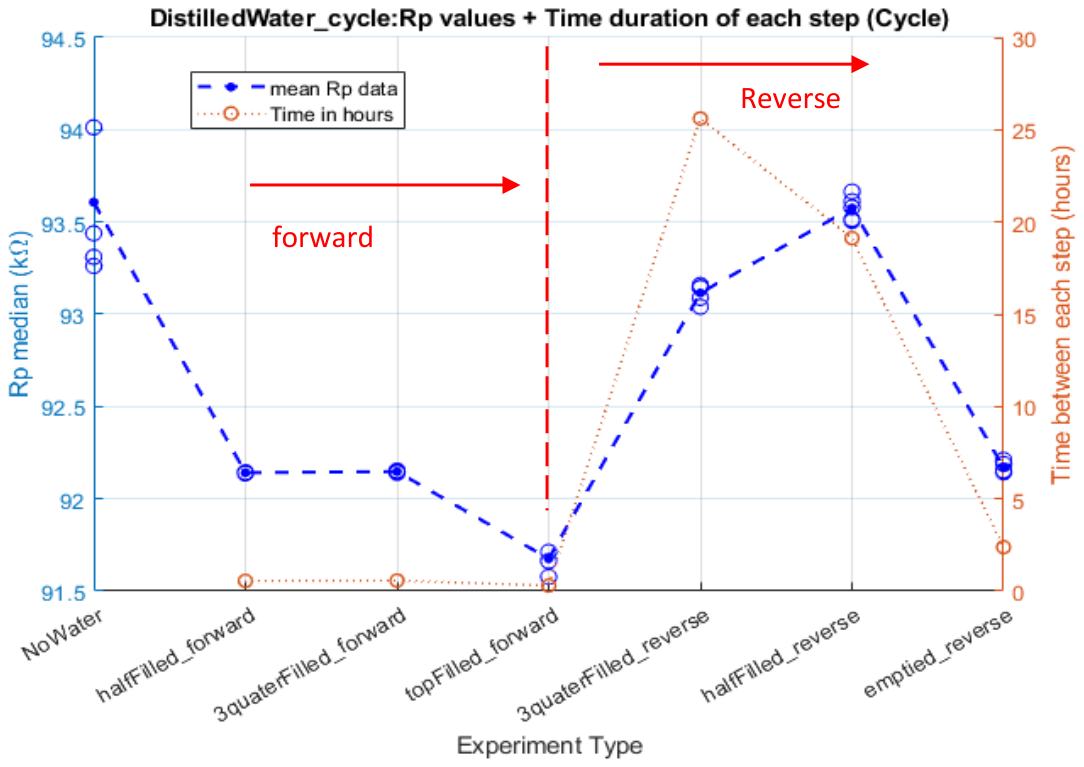
Figure B3.
Rp during repeated saltwater wetting–rewetting cycles at fixed up and down levels (Experiment 03).
Figure B3.
Rp during repeated saltwater wetting–rewetting cycles at fixed up and down levels (Experiment 03).
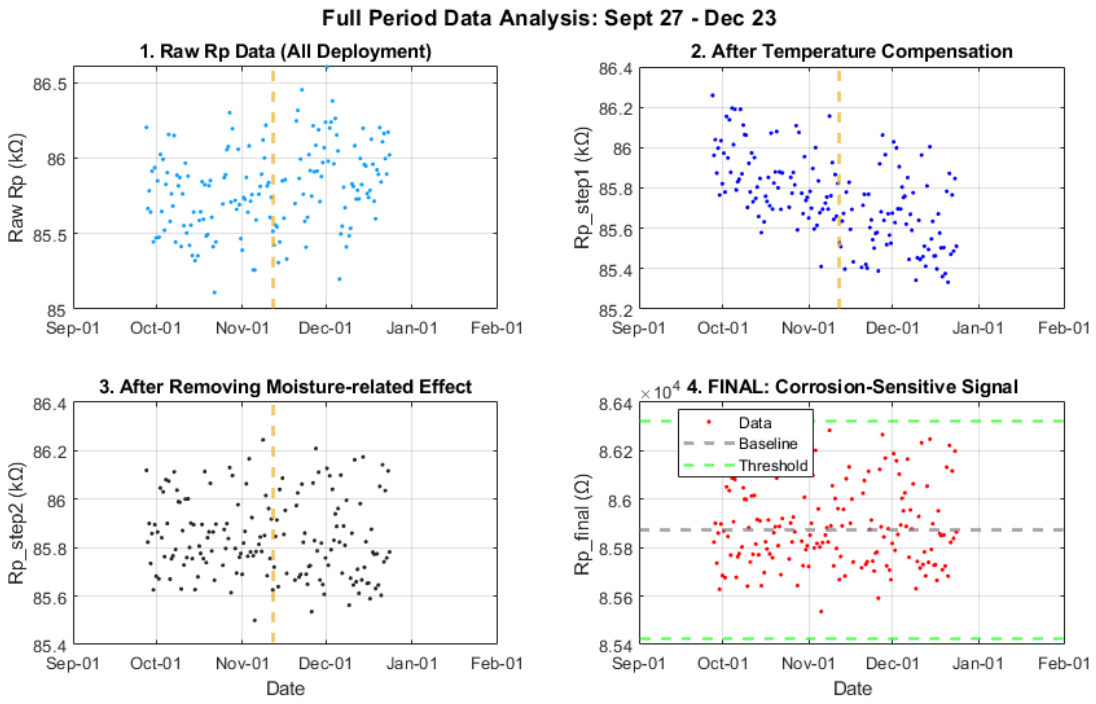
Sequential compensation. Three parameters were extracted from the calibration window and then applied, in order, to the full data set: (1) the temperature coefficient a1 = −0.10057 kΩ/°C with a reference temperature of 15 °C; (2) a moisture-related envelope baseline, computed as the centre ((max + min)/2) of a 7-day rolling window and fixed as the mean of the envelope centres during calibration; and (3) a time-dependent trend a2 = −0.00094 kΩ/day obtained by linear regression of the envelope-corrected signal against time (Table B1). After temperature compensation, the moisture effect explained R2 = 0.7597 of the remaining signal during calibration. Applied to the calibration window, the procedure yielded a stable Rp,final with a mean of 85,847.9 Ω and a standard deviation of 150.9 Ω, which was taken as the non-corroded baseline. Applied to the full 88-day record (Figure B4), Rp,final had a standard deviation of 0.162 kΩ; the 3σ threshold of the unfiltered signal was approximately ±0.448 kΩ, reduced to approximately ±135 Ω after 7-day moving-median filtering. A potential corrosion event would be indicated by a sustained upward shift of the moving median beyond +135 Ω to a new baseline, rather than by a temporary fluctuation.

Table B1.
Parameters of the sequential environmental compensation of the eddy-current signal, derived from the calibration window (27 September–12 November 2025).
Table B1.
Parameters of the sequential environmental compensation of the eddy-current signal, derived from the calibration window (27 September–12 November 2025).
| Step | Effect removed | Parameter |
| 1 | Temperature | a1 = −0.10057 kΩ/°C (reference temperature 15 °C) |
| 2 | Short-term moisture-related envelope | Fixed reference baseline (mean of 7-day envelope centres) |
| 3 | Long-term cumulative drift | a2 = −0.00094 kΩ/day |
| Result | Calibration window | Mean Rp,final = 85,847.9 Ω; standard deviation 150.9 Ω |
| Result | Full record (88 days), 7-day moving median | 3σ band ≈ ±135 Ω |
Figure B4.
Sequential environmental compensation of the eddy-current signal over the full analysis period (27 September–23 December 2025): (a) raw averaged Rp; (b) after temperature compensation; (c) after removal of the moisture-related envelope deviation; (d) Rp,final after time-trend correction.
Figure B4.
Sequential environmental compensation of the eddy-current signal over the full analysis period (27 September–23 December 2025): (a) raw averaged Rp; (b) after temperature compensation; (c) after removal of the moisture-related envelope deviation; (d) Rp,final after time-trend correction.
References
- Claus, R.; López, M. Key issues in the design of floating photovoltaic structures for the marine environment. Renew. Sustain. Energy Rev. 2022, 164, 112502. [CrossRef]
- Dai, J.; Wang, C.M.; Utsunomiya, T.; Duan, W. Review of recent research and developments on floating breakwaters. Ocean Eng. 2018, 158, 132–151. [CrossRef]
- SUREWAVE Project. D4.1: Design and Characterization of the New Circular Material Solutions; Project Report; SUREWAVE Consortium, 2024.
- SUREWAVE Project. D4.2: Development, Validation and Testing at Laboratory Level of the Breakwater Prototype; Project Report; SUREWAVE Consortium, 2024.
- NORSOK N-003:2017+AC:2018. Actions and Action Effects; Standards Norway, 2017.
- Kawabata, Y.; Kato, E.; Iwanami, M. Enhanced long-term resistance of concrete with marine sessile organisms to chloride ion penetration. J. Adv. Concr. Technol. 2012, 10, 151–159. [CrossRef]
- Chlayon, T.; Iwanami, M.; Chijiwa, N. Impacts from concrete microstructure and surface on the settlement of sessile organisms affecting chloride attack. Constr. Build. Mater. 2020, 239, 117863. [CrossRef]
- Jonkers, H.M.; Thijssen, A.; Muyzer, G.; Copuroglu, O.; Schlangen, E. Application of bacteria as self-healing agent for the development of sustainable concrete. Ecol. Eng. 2010, 36, 230–235. [CrossRef]
- Angst, U.; Elsener, B.; Larsen, C.K.; Vennesland, Ø. Critical chloride content in reinforced concrete — A review. Cem. Concr. Res. 2009, 39, 1122–1138. [CrossRef]
- Wichian Chalee, Tieng Cheewaket & Chai Jaturapitakkul, Utilization of Recycled Aggregate Concrete for Marine Site Based on 7-Year Field Monitoring, International Journal of Concrete Structures and Materials, Volume 15, article number 34 (2021), https://link.springer.com/article/10.1186/s40069-021-00473-w.
- José E. Ramón, et al. Real-time corrosion monitoring of an ultra-high performance fibre-reinforced concrete offshore raft by using an autonomous sensor system, Journal of Structural Control and Health Monitoring Structural Control and Health Monitoring, . [CrossRef]
- SUREWAVE Project. D4.3: Breakwater Prototype; Project Report; SUREWAVE Consortium, https://zenodo.org/records/22830370, 2024.
- Puertos del Estado. PORTUS – Oceanographic Data. Available online: https://www.puertos.es/es-es/oceanografia/Paginas/portus.aspx.
- DNV. DNV-RP-F109: On-Bottom Stability Design of Submarine Pipelines; Det Norske Veritas, 2010.
- DNV GL. DNVGL-ST-0126: Support Structures for Wind Turbines; DNV GL, 2018.
- ASTM D6990. Standard Practice for Evaluating Biofouling Resistance and Physical Performance of Marine Coating Systems; ASTM International: West Conshohocken, PA, USA.
- ASTM D3623. Standard Test Method for Testing Antifouling Panels in Shallow Submergence; ASTM International: West Conshohocken, PA, USA.
- Corrochip. About Corrochip. Available online: https://corrochip.com/en/about-corrochip/.
- UNE 112083:2010. Measurement of Free Corrosion Potential on Steel Reinforced Concrete Structures; AENOR: Madrid, Spain, 2010.
- Elsener, B.; Andrade, C.; Gulikers, J.; Polder, R.; Raupach, M. Half-cell potential measurements — Potential mapping on reinforced concrete structures. RILEM TC 154-EMC: Electrochemical techniques for measuring metallic corrosion. Mater. Struct. 2003, 36, 461–471. [CrossRef]
- EN 14629:2007. Products and Systems for the Protection and Repair of Concrete Structures – Test Methods – Determination of Chloride Content in Cured Concrete; CEN: Brussels, Belgium, 2007.
- Real Decreto 470/2021, de 29 de junio, por el que se aprueba el Código Estructural. Boletín Oficial del Estado 2021, no. 190, 10 August 2021. BOE-A-2021-13681.
- Upeksha Chathurani Thibbotuwa et al. Resonant Eddy Current Sensor Design for Corrosion Detection of Reinforcing Steel, Sensors 2024, 24(13), 4211; [CrossRef]
- Ainhoa Cortés, Aritz Dorronsoro, Upeksha Chathurani, Report on monitoring strategy, SUREWAVE D5.4, 2024.
Figure 1.
Concept of the breakwater prototype: reinforced HPC bottom slab and walls, LWAC top slab, and a core of cellular concrete enclosed in expanded polystyrene (EPS).
Figure 1.
Concept of the breakwater prototype: reinforced HPC bottom slab and walls, LWAC top slab, and a core of cellular concrete enclosed in expanded polystyrene (EPS).
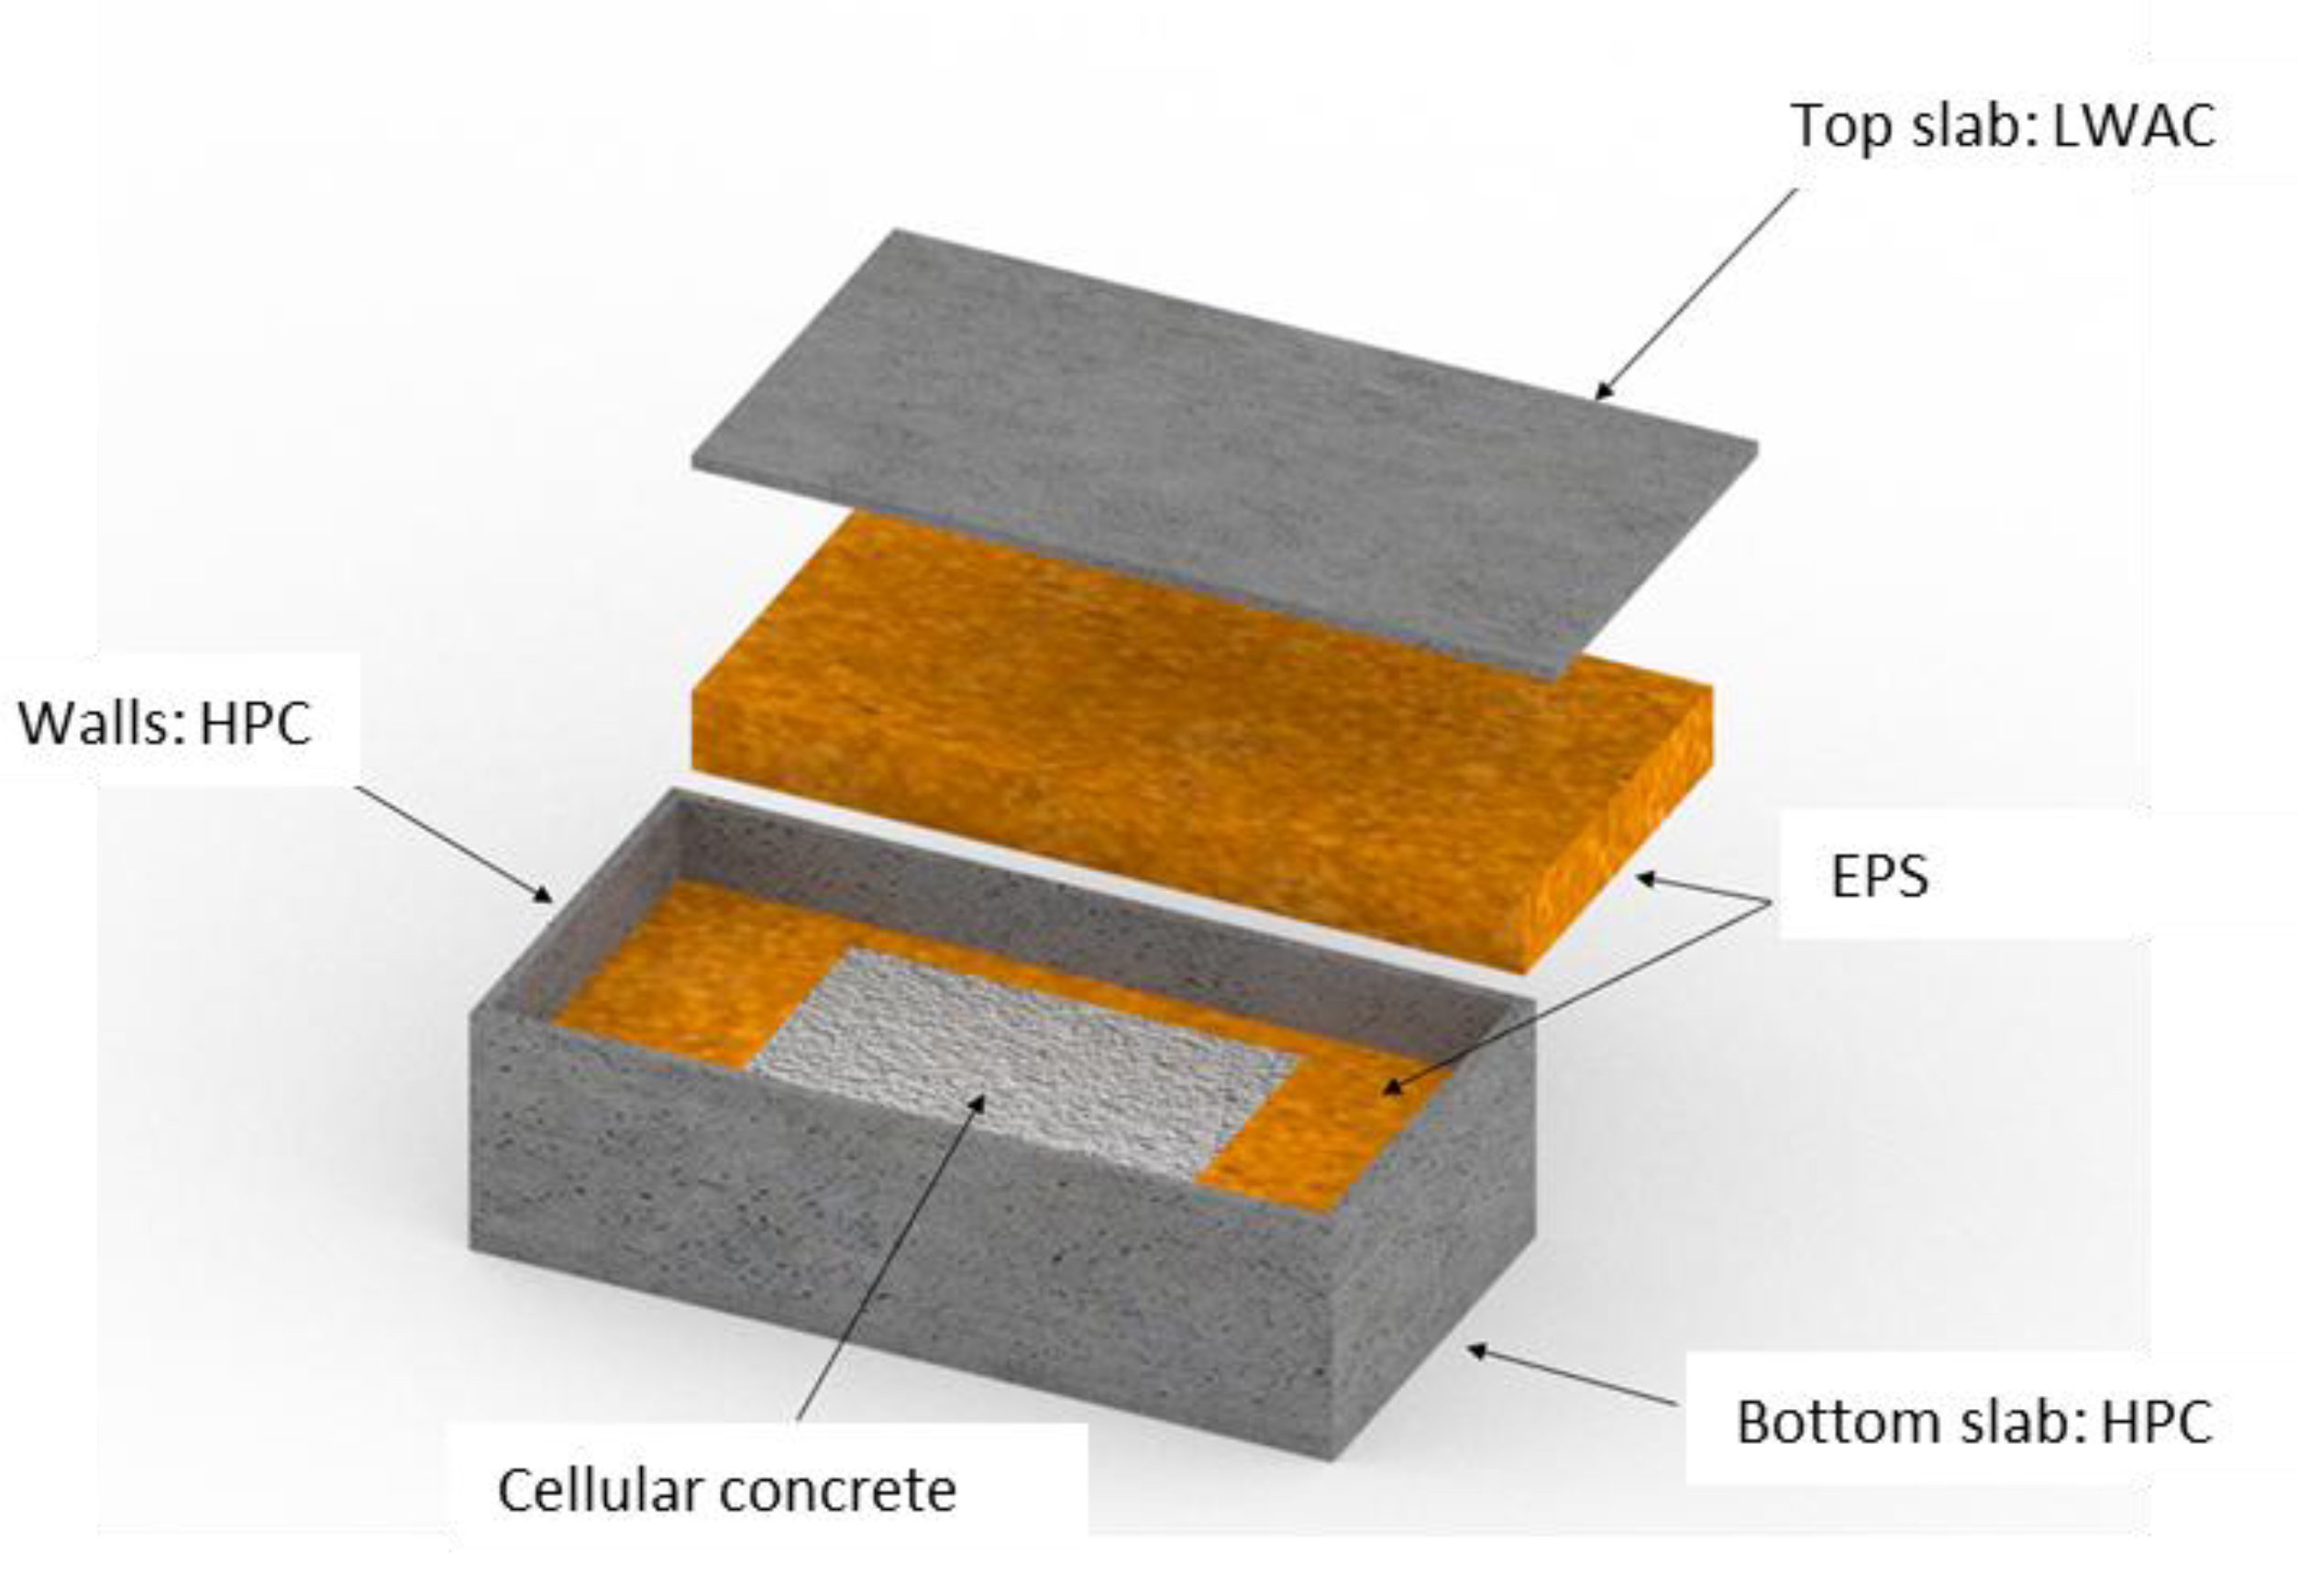
Figure 2.
Four-line catenary spread mooring of the prototype in the OrcaFlex numerical model.
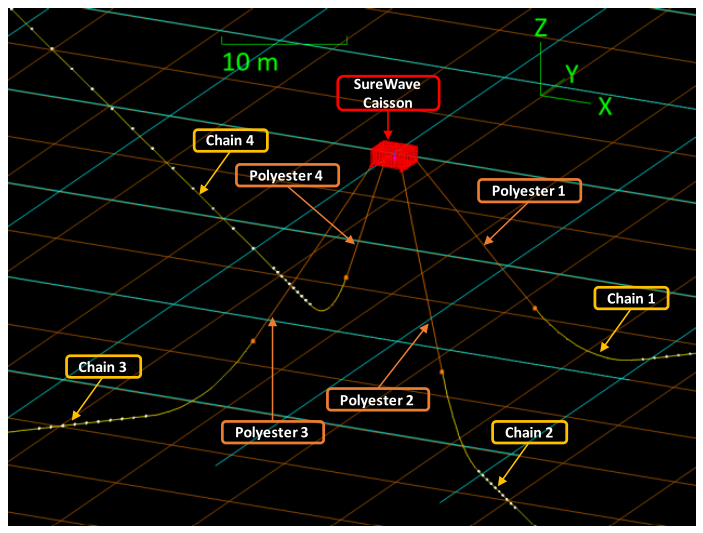
Figure 3.
Satellite view of the Port of Gijón with the deployment location of the prototype (red square).
Figure 3.
Satellite view of the Port of Gijón with the deployment location of the prototype (red square).
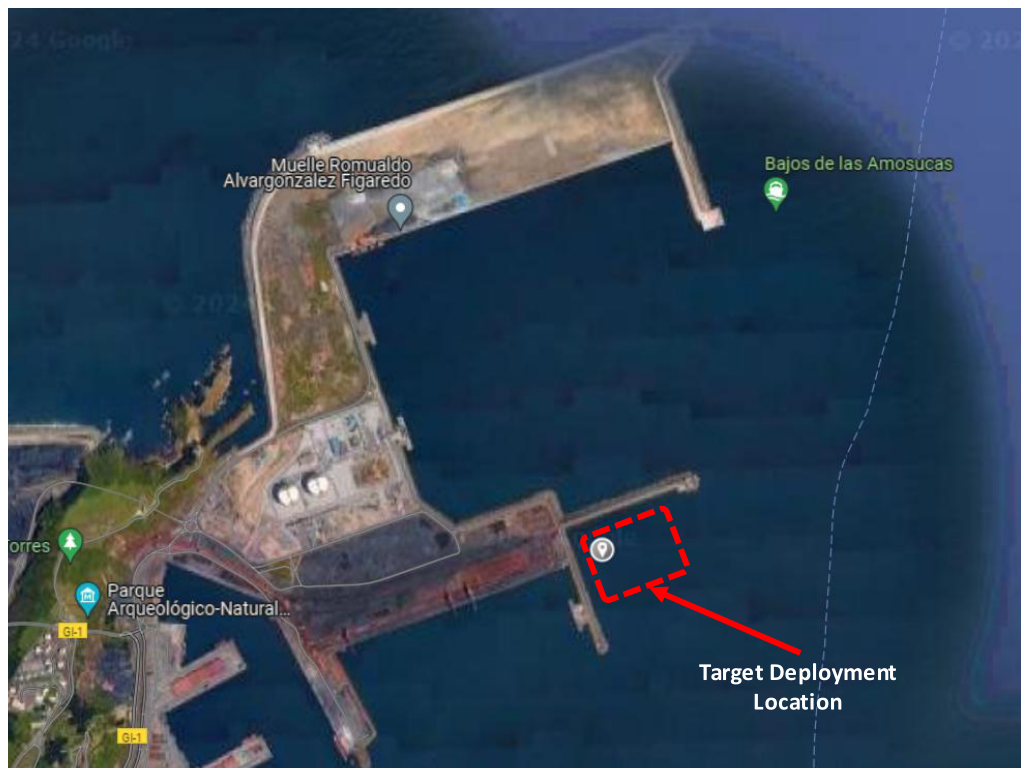
Figure 4.
Locations of the embedded corrosion sensors (monitoring points P1–P4) in the prototype.
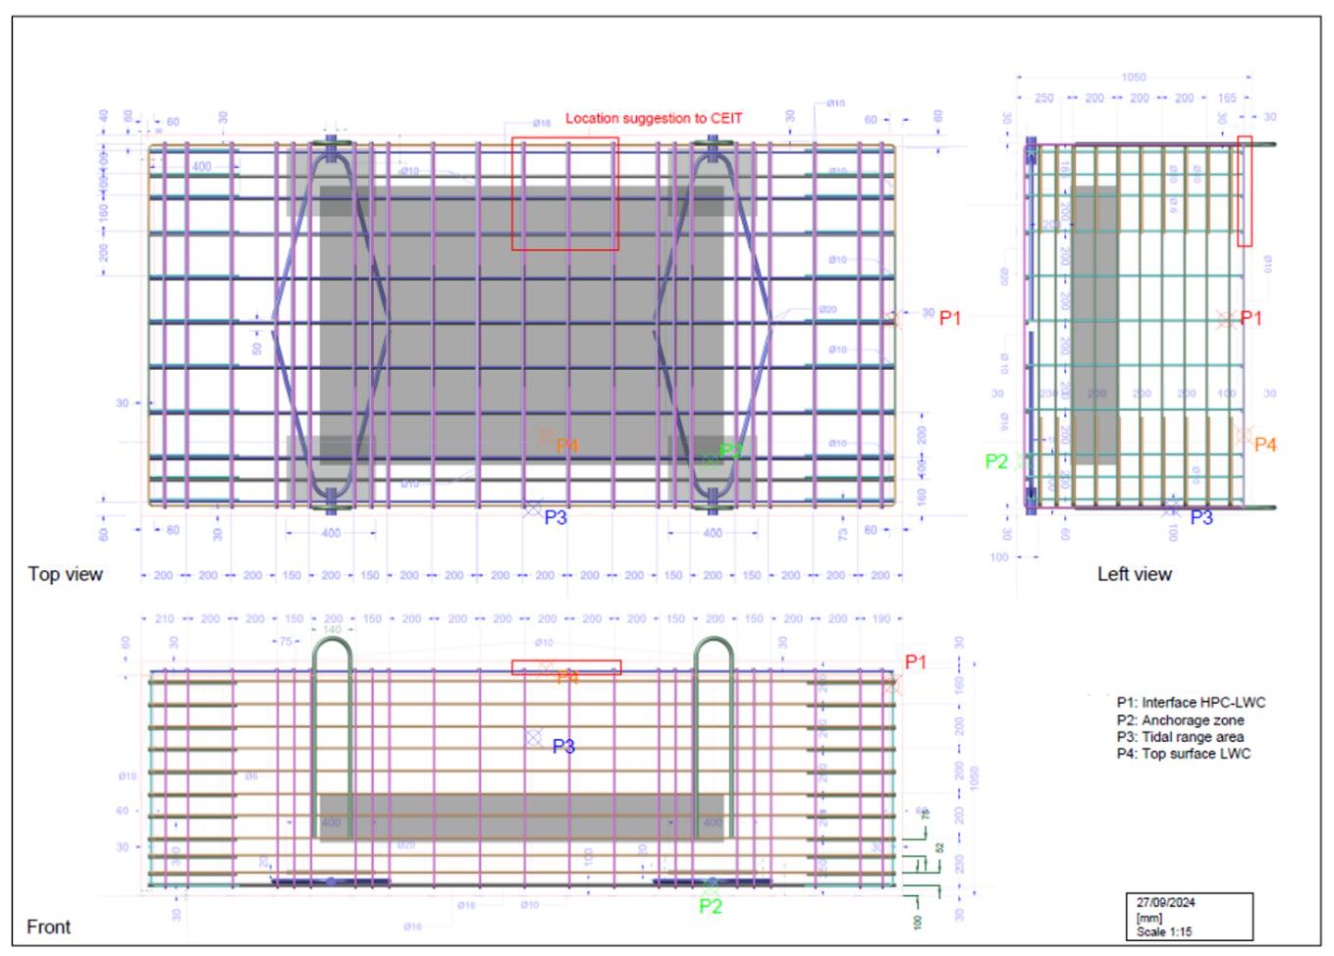
Figure 5.
Temperature and corrosion potential (Ecorr, vs. SCE) at monitoring point P1 (HPC–LWAC interface).
Figure 5.
Temperature and corrosion potential (Ecorr, vs. SCE) at monitoring point P1 (HPC–LWAC interface).
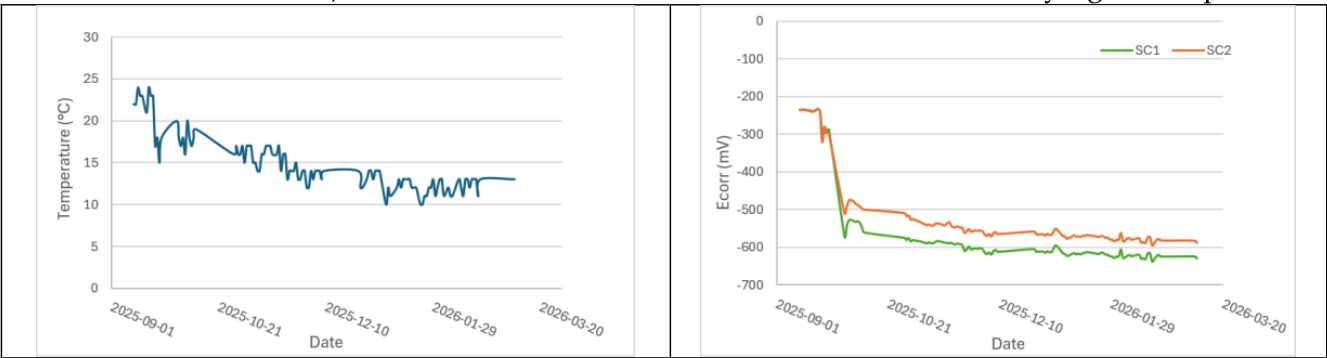
Figure 6.
Temperature and corrosion potential (Ecorr, vs. SCE) at monitoring point P4 (LWAC top surface).
Figure 6.
Temperature and corrosion potential (Ecorr, vs. SCE) at monitoring point P4 (LWAC top surface).
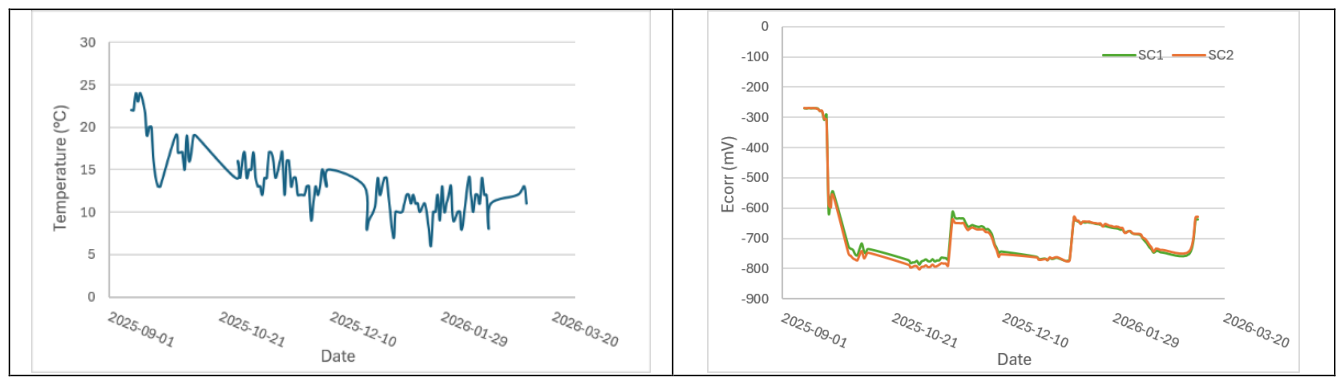
Figure 7.
Chloride content (% by mass of cement) versus depth in the cores taken at monitoring points P1–P4.
Figure 7.
Chloride content (% by mass of cement) versus depth in the cores taken at monitoring points P1–P4.
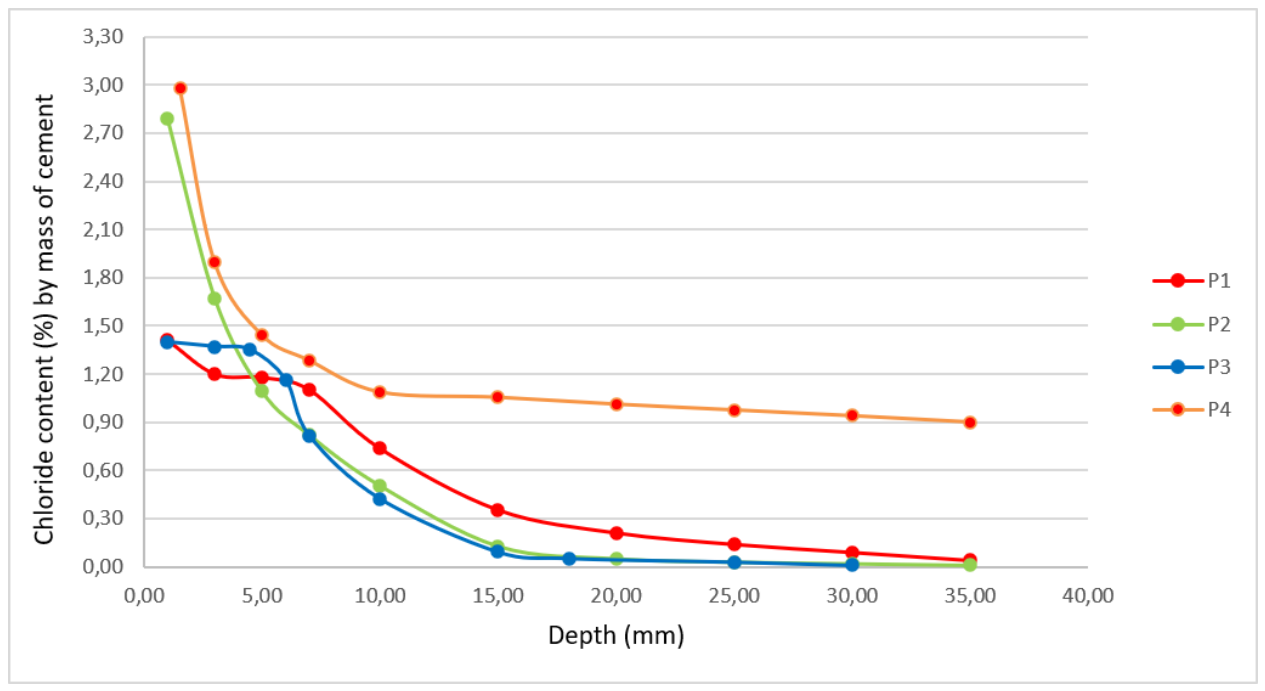
Figure 8.
Corrosion-sensitive eddy-current signal (Rp,final) after sequential environmental compensation and 7-day moving-median filtering, with the ±3σ reference band, 27 September–23 December 2025.
Figure 8.
Corrosion-sensitive eddy-current signal (Rp,final) after sequential environmental compensation and 7-day moving-median filtering, with the ±3σ reference band, 27 September–23 December 2025.
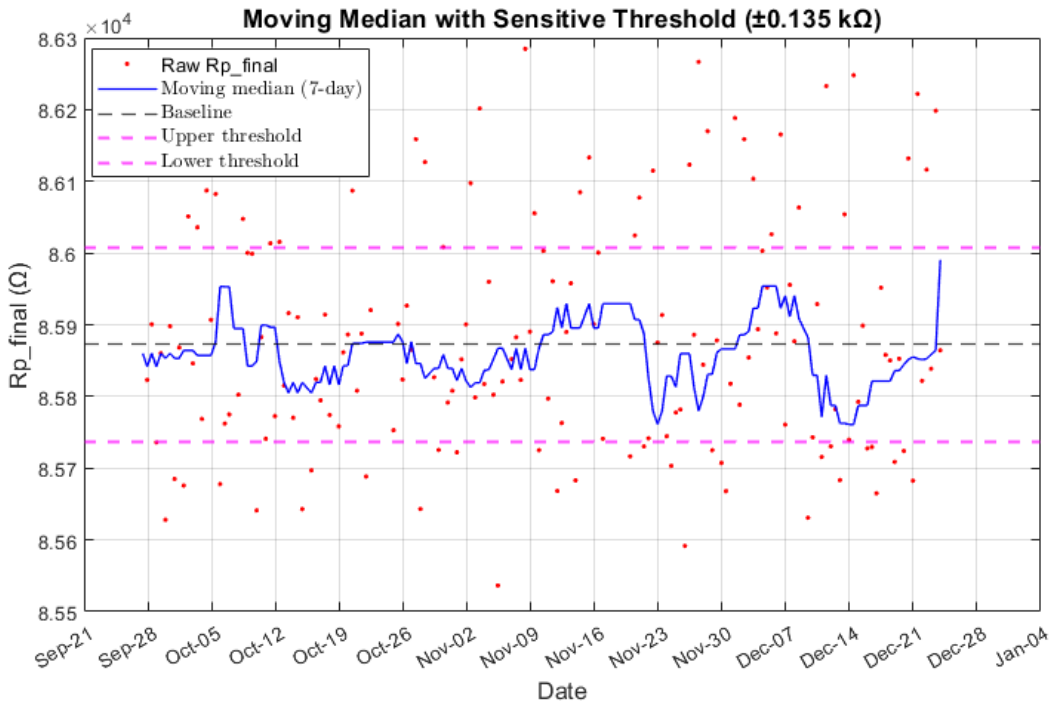
Figure 9.
Evolution of the dominant spectral peak of the measured accelerations along the X, Y and Z axes.
Figure 9.
Evolution of the dominant spectral peak of the measured accelerations along the X, Y and Z axes.
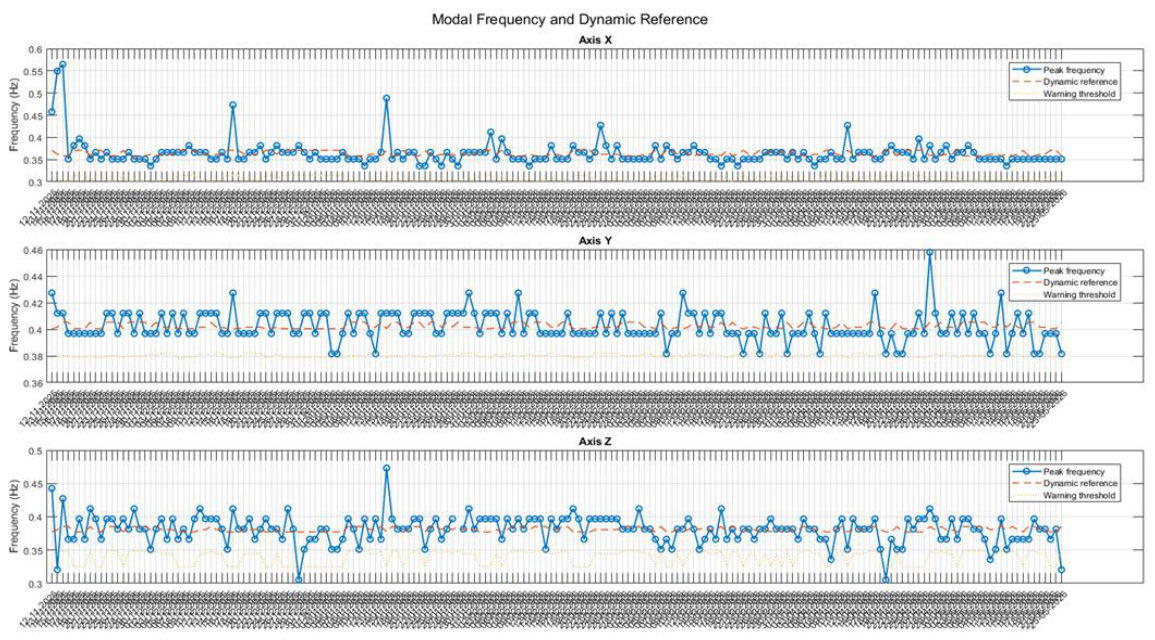
Figure 10.
RMS acceleration of the floating prototype under different motion conditions.
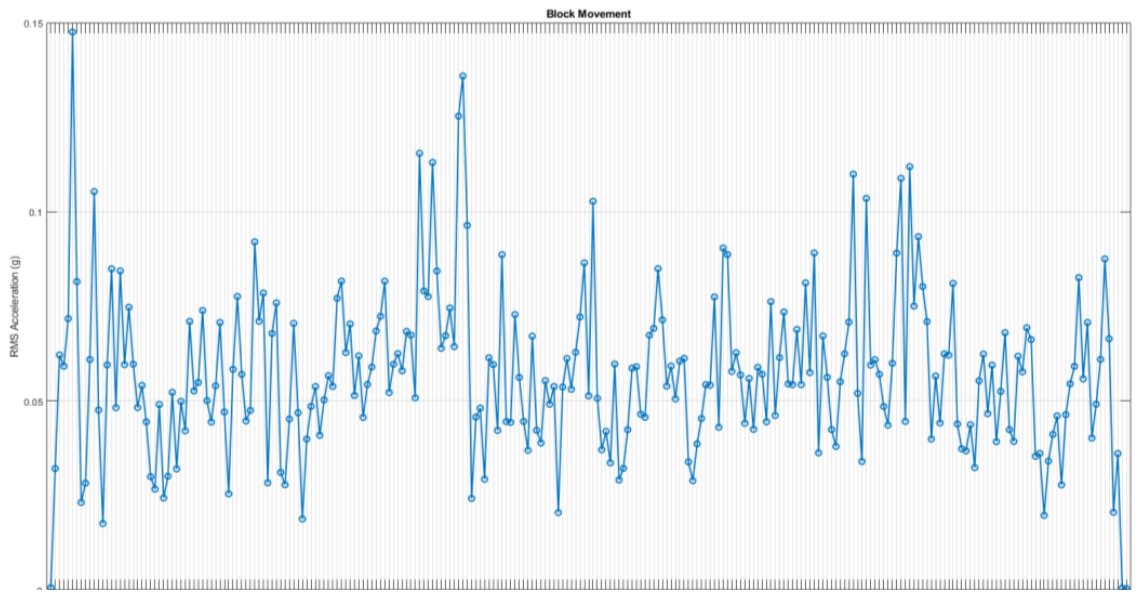
Table 1.
Concretes used in the breakwater prototype. Mix recipes are reported in [4]; densities are the values assumed in the sizing.
Table 1.
Concretes used in the breakwater prototype. Mix recipes are reported in [4]; densities are the values assumed in the sizing.
| Element | Concrete type | Mix recipe [3] | Density (kg/m3) | Volume (m3) |
| Bottom slab + walls | High-performance concrete (HPC) | Sample 2 | 2370 | 1.11 |
| Top slab | Lightweight aggregate concrete (LWAC) | Sample 18 | 1900 | 0.35 |
| Inner core | Cellular concrete | Sample 26 | 365 | 0.50 |
| Core encapsulation | Expanded polystyrene (EPS) | – | 10 | 4.11 |
Table 2.
Main dimensions of the elements of the breakwater prototype [12].
Table 2.
Main dimensions of the elements of the breakwater prototype [12].
| Element | Quantity | Length (m) | Width (m) | Height (m) | Total volume (m3) | Material |
| Bottom slab | 1 | 3.40 | 1.70 | 0.10 | 0.58 | HPC |
| Side walls | 2 | 3.40 | 0.06 | 0.89 | 0.36 | HPC |
| Bow and stern walls | 2 | 0.06 | 1.58 | 0.89 | 0.17 | HPC |
| Top slab | 1 | 3.40 | 1.70 | 0.06 | 0.35 | LWAC |
| Inner core | 1 | 1.78 | 1.26 | 0.22 | 0.50 | Cellular concrete |
| EPS (bow and stern) | 2 | 0.75 | 1.58 | 0.89 | 2.11 | EPS |
| EPS (sides) | 2 | 1.78 | 0.16 | 0.89 | 0.50 | EPS |
| EPS (top and bottom) | 2 | 1.78 | 1.26 | 0.33 | 1.50 | EPS |
Table 3.
Mooring components [12].
Table 3.
Mooring components [12].
| Item | Size | Quantity |
| Polyester rope | 20 mm | 4 |
| Chain section | 10 mm | 4 |
| Chain shackle | 22–10 mm | 16 |
| Deadweight anchor | 2.97 m3 | 4 |
Table 4.
Monitoring and inspection programme.
| Technique | Location | Period / timing | Outcome |
| Fouling rating, organisms, layer thickness | All exposed surfaces | After retrieval (June 2026) | Completed |
| Wet and dry biomass | 1 m2 on two lateral surfaces | After retrieval | Completed |
| Embedded corrosion sensors: Ecorr and temperature, two working electrodes per point, one reading per day | P1–P4 | 11/09/2025–08/04/2026 (P1, P2, P4); until 29/11/2025 (P3) | Electronics likely failed due to water ingress |
| Chloride profiles on cores (Ø 10 cm) | P1–P4 | After retrieval | Completed |
| Inspection openings and rebar thickness | Around P1–P4 | After retrieval | Completed |
| Eddy-current corrosion sensor (Rp), two measurement events per day | Top surface, above two parallel rebars | 27/09/2025–03/01/2026 (analysed to 23/12/2025) | Data loss after cable failure at the LC resonator |
| Three-axis accelerometer | Top surface | Entire deployment | Operational throughout |
Table 5.
Corrosion probability of reinforcing steel as a function of the potential measured against SCE, according to UNE 112083 [19].
Table 5.
Corrosion probability of reinforcing steel as a function of the potential measured against SCE, according to UNE 112083 [19].
| Corrosion probability | Potential versus SCE |
| High, approximately 90% | More negative than -0.350 V |
| Intermediate, approximately 50% | -0.350 V to -0.200 V |
| Low, approximately 10% | More positive than -0.200 V |
Table 6.
Biofouling on the surfaces of the breakwater prototype after approximately nine months of exposure: predominant organisms, fouling rate, layer thickness and biomass.
Table 6.
Biofouling on the surfaces of the breakwater prototype after approximately nine months of exposure: predominant organisms, fouling rate, layer thickness and biomass.
| Predominant fouling organisms |
Fouling rate (%) |
Thickness (mm) | Wet weight (kg/m2) | Dry weight (kg/m2) | |
Top surface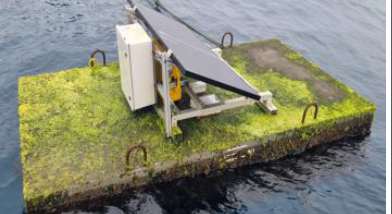
|
Green algae | >90 | 12 | Not measured | Not measured |
Bottom surface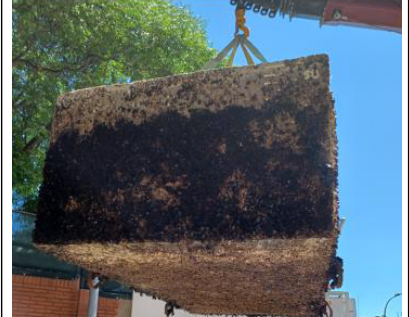
|
Barnacles, microalgae | >95 | 15 | Not measured | Not measured |
Lateral surface (1)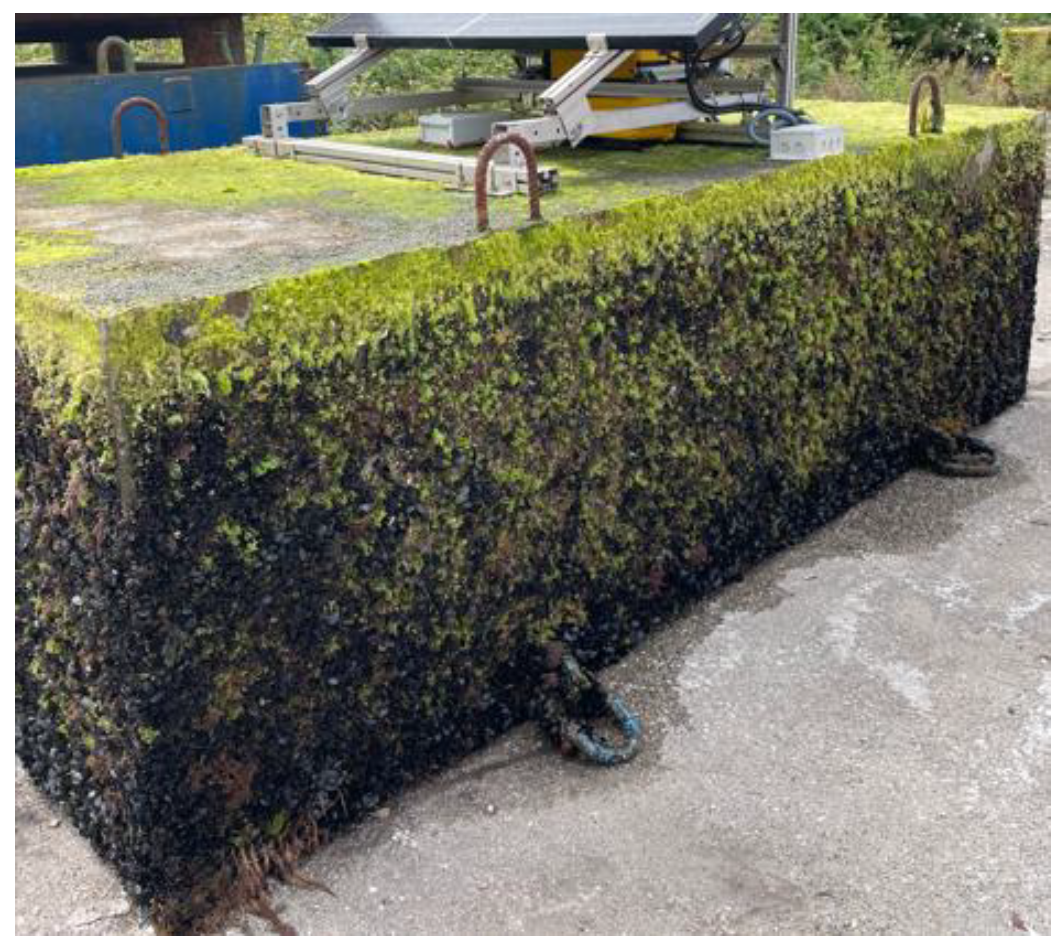
|
Green algae (upper zone) Brown and green algae, mussels and barnacles (middle zone) Mussels (lower zone) |
100 | 5-10 (upper zone) 10-20 (middle zone) 15-30 (lower zone) |
6.3 | 2.1 |
Lateral surface (2)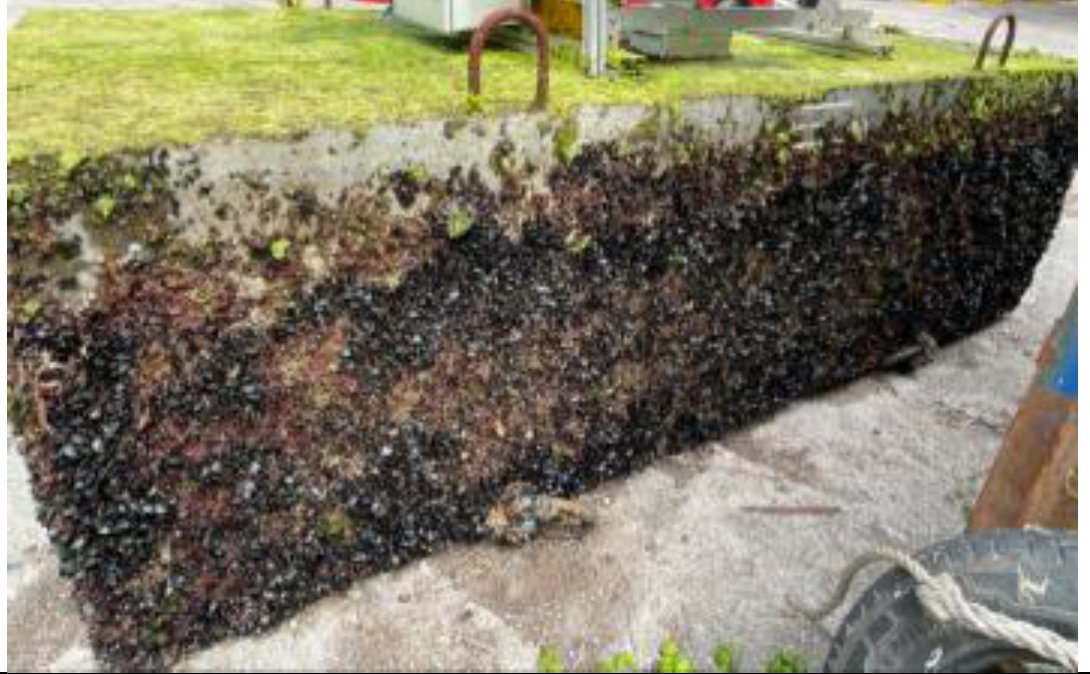
|
Green algae (upper zone) Brown and red algae and mussels (middle zone) Mussels (lower zone) |
>95 | 5-10 (upper zone) 10-25 (middle zone) 25-35 mm (lower zone) |
9.7 | 4.2 |
Lateral surface (3)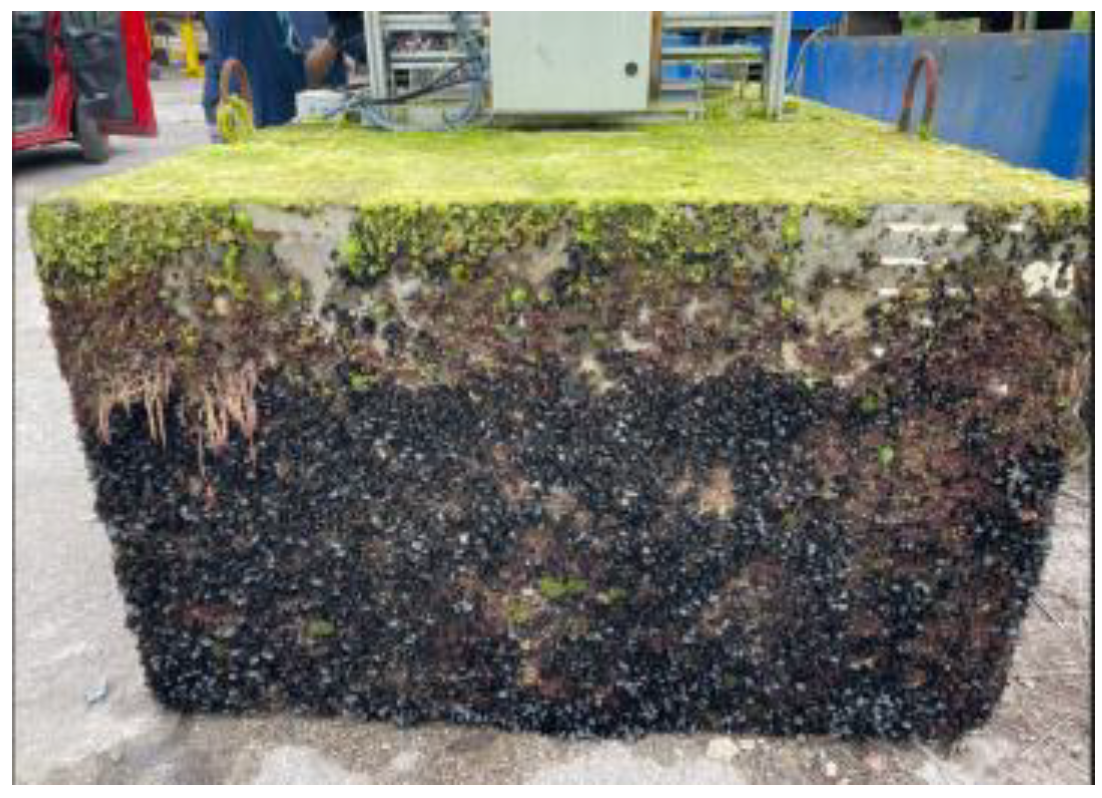
|
Green algae (upper zone) Brown and red algae, mussels and barnacles (middle zone) Mussels (lower zone) |
>90 | 5-10 (upper zone) 10-20 (middle zone) 20-35 mm (lower zone) |
Not measured | Not measured |
Lateral surface (4)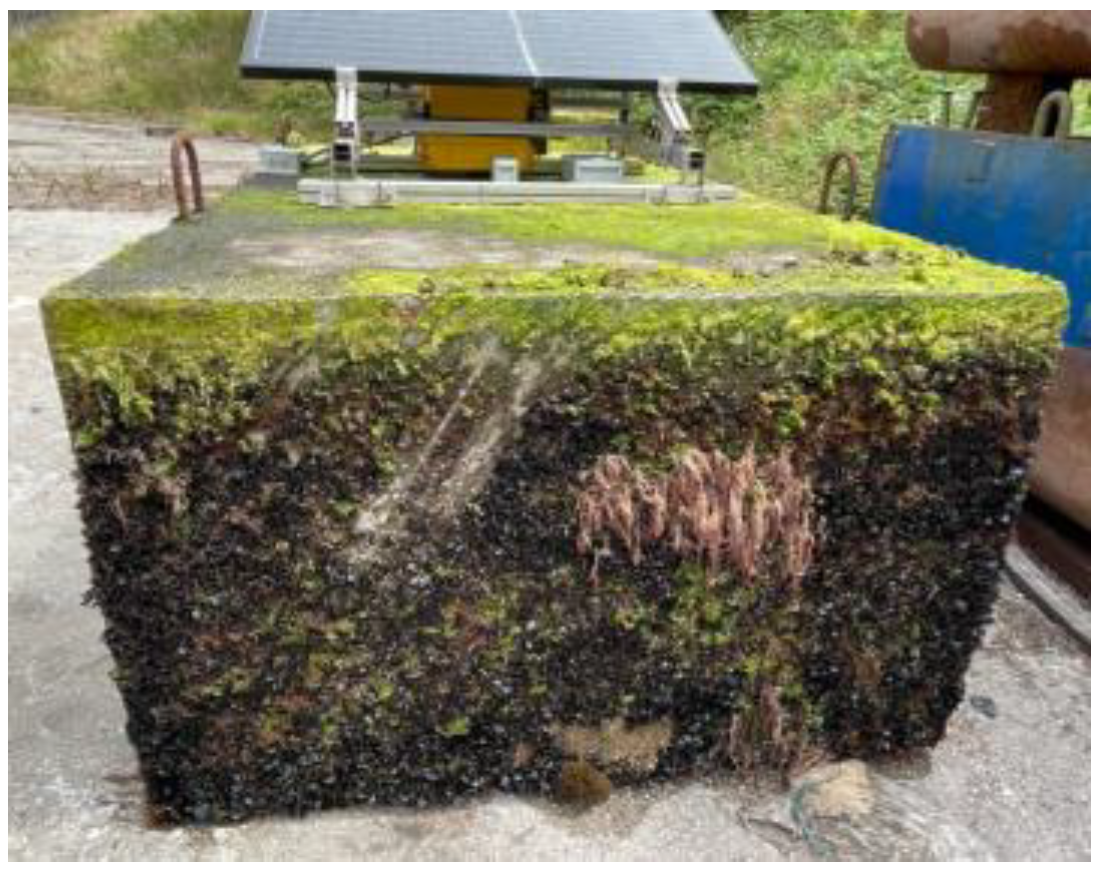
|
Green algae (upper zone) Brown and red algae, mussels and barnacles (middle zone) Mussels (lower zone) |
>85 | 5-15 (upper zone) 10-30 (middle zone) 20-35 mm (lower zone) |
Not measured | Not measured |
Table 7.
Estimated natural periods and frequencies of the main motion modes of the floating prototype (uncertainty ±20%).
Table 7.
Estimated natural periods and frequencies of the main motion modes of the floating prototype (uncertainty ±20%).
| Motion Mode | Natural period (s) | Frequency (Hz) |
| Heave | 2.1 | 0.48 |
| Roll | 3.3 | 0.30 |
| Pitch | 2.2 | 0.45 |
Disclaimer/Publisher’s Note: The statements, opinions and data contained in all publications are solely those of the individual author(s) and contributor(s) and not of MDPI and/or the editor(s). MDPI and/or the editor(s) disclaim responsibility for any injury to people or property resulting from any ideas, methods, instructions or products referred to in the content. |
© 2026 by the authors. Licensee MDPI, Basel, Switzerland. This article is an open access article distributed under the terms and conditions of the Creative Commons Attribution (CC BY) license (http://creativecommons.org/licenses/by/4.0/).
Copyright: This open access article is published under a Creative Commons CC BY 4.0 license, which permit the free download, distribution, and reuse, provided that the author and preprint are cited in any reuse.