

Submitted:
14 November 2026
Posted:
16 November 2026
You are already at the latest version
Abstract
Analytical traceability of agri-food products complements documentary systems by verifying consistency between a product and its declared origin. In this study, the relative distribution of lanthanides was evaluated as geochemical fingerprint to trace provenance information along the rice supply chain, considering matrices subjected to different biological and technological transformations. The concentrations of macroelements, microelements, trace and ultra trace elements were determined by ICP-OES and ICP-MS; the lanthanide profiles of the different stages of the supply chain were normalised to cerium (following a procedure already exploited by the authors in traceability studies) and quantitatively compared using the L parameter, calculated as the sum of the relative differences between Ce-normalised lanthanide concentrations. The investigation included different rice varieties, seeds, plant compartments, brown and white rice, other cereal species and a processed product (pasta made from rice). The results showed that, despite the variations in absolute concentrations and fractionations associated with biological and technological processes, the relative structure of the lanthanide fingerprint remained overall recognisable along the supply chain. Overall, the results highlight the potential of the relative distribution of lanthanides as a complementary tool to link soil, crop, and products through geochemical provenance information.
Keywords:
lanthanides
; geochemical fingerprint
; food traceability
; rice supply chain
; provenance
; ICP-MS
; ICP-OES
1. Introduction
The rice (Oryza sativa) supply chain plays a particularly important role in the Italian and European agri-food system. Italy is in fact the leading rice producer in the European Union [ISTAT 1] and cultivation is strongly concentrated in the areas of Piedmont and Lombardy. Beyond its importance in terms of production volume, Italian rice cultivation is characterised by a rich varietal diversity and a strong connection to local territories, as reflected in protected geographical indications such as Riso di Baraggia Biellese e Vercellese (PDO - Protected Designation of Origin), Riso Nano Vialone Veronese (PGI - Protected Geographical Indication) and Riso del Delta del Po (PGI). In this context, the possibility of verifying the origin of productions and following their path along the supply chain is of particular interest both for the protection of producers and local products and for providing consumers with reliable information on food origin.
Conventional traceability systems are mainly based on the documentation associated with the different stages of the supply chain. These tools can be accompanied by analytical approaches, aimed at identifying intrinsic chemical characteristics of the product attributable to its origin [2]. Among the most studied strategies are the analysis of stable isotopes (SIA) [3,4] and multielement fingerprinting by means of determination of trace and ultra trace elements with inductively coupled plasma (ICP) analysis [5]. In particular, the elemental composition of plant matrices can preserve information relating to the geochemical characteristics of the growth substrate, making it possible to establish a link between the product and its geographical origin.
This principle has also been applied to the geographical traceability of rice. Gonzálvez et al. [6] demonstrated the possibility of obtaining a classification of origin on the basis of the elemental profile, analysing the mineral composition of samples from different geographical areas. Subsequently, Cheajesadagul et al. [7] applied multielement fingerprinting by high-resolution inductively coupled plasma mass spectrometry (HR-ICP-MS) associated with multivariate statistical techniques, for the discrimination of samples of Thai Jasmine rice from different regions and countries. In the same year, Shen et al. [8] showed how some elements present in the grain were related to the mineral composition of the soil of origin. Overall, these studies highlight the potential of elemental composition as a tool to determine the origin of rice, although the approaches have mainly focused on the geographical classification of the final product by elemental concentrations and chemometric analyses. Among the elements that can be used as geochemical markers for studying rice, the possibility of systematically tracking the lanthanide fingerprint through the different matrices of the supply chain is still poorly explored. These elements have very similar chemical properties and, in plants, do not perform specific metabolic functions similar to those of essential elements. Their relative distribution in plant matrices can, therefore, preserve, at least in part, the geochemical characteristics of the soil of origin. The use of the lanthanide distribution as geochemical fingerprint is based on this principle: rather than on the absolute concentrations of the individual elements, the approach considers the shape of their relative distribution, normalised with respect to a reference element, in order to verify whether the characteristic footprint of the soil remains recognisable along the supply chain.
The possibility of using the distribution of lanthanides as a traceability tool has previously been studied in various agri-food supply chains, including wine, hazelnuts, honey, almonds and truffles [9,10,11,12,13]. The results showed that the geochemical information associated with the soil can remain recognisable in the products along the supply chain, although it may undergo fractionation phenomena associated with biological or technological processes. In this context, the rice supply chain represents an interesting system to extend the approach based on the relative distribution of lanthanides. Although studies dedicated to the determination of the geographical origin of rice by multielement fingerprinting and chemometric methods are available, and the relationships between the elemental composition of the grain and the soil of origin have been investigated, the possibilities given by the lanthanide fingerprint is still to be explored.
Based on these premises, the general objective of the present study was to evaluate the potential of the elemental composition and, in particular, of the distribution of lanthanides, as a monitoring and traceability tool along the rice supply chain. Macroelements and microelements, determined by inductively coupled plasma optical emission spectrometry (ICP-OES) and inductively coupled plasma mass spectrometry (ICP-MS), were used to characterise the different matrices, while the relative distribution of lanthanides was used as a geochemical fingerprint of origin.
The study was structured according to progressive levels of complexity. In a first phase, the relationship between soil and seeds of different rice varieties was evaluated; the analysis was then extended to other cereal species grown on the same soil and to products derived from rice processing. Subsequently, complete rice supply chains, including soil, different plant compartments, husks and grain processing products, were considered to evaluate the persistence of the fingerprint in systems characterised by different varieties and cultivation practices.
2. Materials and Methods
2.1. Sample collection
Farms in the production area of Riso di Baraggia Biellese e Vercellese PDO, in the municipalities of Rovasenda (VC) and Casalbeltrame (NO), both in Piedmont (Italy), provided soil samples, plant matrices (seeds, roots, rice husks and straw), and rice (brown and white).
The first part of the study involved four rice varieties organically grown in Rovasenda on the same soil of origin: Rosa Marchetti, Bertone, Dellarole, and Chinese Originario, all cultivated under dry seeding conditions. These samples were used to evaluate the effect of varietal differences and subsequent rice processing on the elemental composition and lanthanide fingerprint. The investigation was also extended to organically grown oats (Avena sativa) and millet (Panicum miliaceum) from the same farm in Rovasenda, to assess the persistence of the lanthanide fingerprint in cereal species other than rice but grown on the same soil. In addition, rice pasta obtained from the Rosa Marchetti supply chain was analysed to verify whether the geochemical information remained recognisable after further technological transformation.
A second experimental set included four complete rice supply chains, differentiated by variety, sowing method and cultivation system: Sant’Andrea variety, organic farming (labelled BIO); Carnaroli variety, conventional farming (TRAD); Venere variety, conventional farming under dry seeding conditions (DRY1); and Sant’Andrea variety, conventional farming under dry seeding conditions (DRY2).
Soil samples were collected at a depth of approximately 30 cm to obtain representative samples of the soil layer affected by the root system and to limit the contribution of potential surface contamination.
2.2. Sample treatment
2.2.1. Soil
The pre-treatment of the soil involved drying the samples at 120 °C overnight, sieving at φ 0.2 mm and subsequent microwave-assisted acid extraction. Aliquots of approximately 0.5 g were transferred to PTFE vessels and treated with 2 mL of 30% H2O2 and 6 mL of aqua regia using a START D Microwave Digestion System (Milestone, Sorisole, Italy). Hydrogen peroxide was added before aqua regia to control the effervescence associated with the treatment of calcareous soils. The temperature was increased from 25 to 180 °C over 10 min and then maintained at 180 °C for 15 min, with the microwave power set to 1200 W. After cooling, the obtained suspension was brought to 50 mL with ultrapure water, centrifuged at 6000 rpm for 10 min, and the supernatant was collected for subsequent determinations. Prior to ICP analysis, the solutions were diluted 1:100 with ultrapure water (HPW).
2.2.2. Rice and other plant matrices
Different pre-treatment techniques were used for the plant matrices, as seeds and rice consist mainly of carbohydrates (about 80%), primarily in the form of starch, and have a low silica content; in contrast, rice husks and straw have a high silica (SiO2) content, accounting for up to 20% by weight of rice husks, mainly in the form of amorphous silica. After separating the plant parts, the samples were ground to a fine powder using a porcelain mortar and pestle and dried in an oven at 80 °C overnight. Two different pre-treatment methods were used: microwave-assisted acid digestion and dry ashing.
- Acid digestion was performed on 0.5 g of straw, rice husks, and rice in PTFE vessels. Then, 1 mL of 30% hydrogen peroxide, 3 mL of 69% nitric acid and 4 mL of HPW were added, and the vessels were placed in a START D Microwave Digestion System (Milestone, Sorisole, Italy). The temperature was increased from 25 to 180 °C over 10 min and then maintained at 180 °C for 15 min, with the microwave power set to 1200 W. The resulting solution was brought to a final volume of 50 mL with HPW in a polypropylene tube. The solutions were then diluted 1:10 with HPW prior to ICP analysis.
- Dry ashing was carried out by weighing approximately 10 g of seeds and rice into a porcelain capsule and placing it in a PYRO 260 microwave ashing system (Milestone, Sorisole, Italy). The heating programme was as follows: the temperature was increased from room temperature to 150 °C over 30 min and maintained at 150 °C for 60 min; subsequently, it was increased to 500 °C over 60 min and maintained at 500 °C for 60 min, increased to 750 °C over 30 min and maintained at 750 °C for 60 min, and finally increased to 900 °C over 60 min and maintained at 900 °C for 60 min. The resulting ash was completely dissolved in 2.0 mL of ultrapure concentrated nitric acid and brought to a final volume of 50 mL with ultrapure water in a polypropylene tube. The solutions were then diluted 1:10 with HPW prior to ICP analysis.
For elements of environmental interest (e.g., As, Cd, Hg and Pb), acid digestion was used for all investigated matrices to avoid potential losses during dry ashing. The resulting solutions were diluted 1:10 with HPW prior to ICP analysis.
2.3. Reagents
To prepare the solutions of the samples and standard solutions, ultrapure water (HPW) was produced with a Milli-Q apparatus (Milford, MA, USA). The resulting resistivity was 18.2 MΩ·cm.
The acids (69% nitric acid and 37% hydrochloric acid) and 30% hydrogen peroxide, all high purity, were purchased from Fluka (Milan, Italy). The multi-element standard solutions for ICP analysis were purchased from Inorganic Ventures (Christiansburg, VA, USA).
Polypropylene vials were used for the storage of samples and standard solutions. An autosampling system was employed for ICP analysis, and polystyrene vials were used. All plastic vials were stored in 1% nitric acid and, when necessary, rinsed with ultrapure water.
2.4. ICP-OES analysis
The determination of major and minor elements was carried out using a SPECTRO Genesis simultaneous ICP-OES spectrometer (SPECTRO Analytical Instruments GmbH, Kleve, Germany) with axial plasma observation. The instrumental parameters were as follows: pump speed, 2.0 mL/min; RF generator, 40 MHz; RF, 1300 W; plasma power, 1400 W; output plasma gas flow, 12 L/min; auxiliary gas flow, 0.90 L/min; nebuliser flow, 0.96 L/min. The elements determined were the following (the emission wavelength used is shown in parentheses): Al (396.152 nm), B (249.773 nm), Ca (317.993 nm), Co (228.616 nm), Cu (324.754 nm), Fe (259.941 nm), K (766.491 nm), Li (670.780 nm), Mg (285.213 nm), Mn (257.611 nm), Na (589.592 nm), Ni (231.604 nm), P (177.495 nm), Rb (420.185 nm), S (180.731 nm), Si (251.612 nm), Sr (460.733 nm), and Zn (213.856 nm). CCS-4 and CCS-5 multi-element standard solutions from Inorganic Ventures (Christiansburg, VA, USA) were used to prepare solutions at concentrations of 10, 5, 1, 0.5, and 0.1 mg/L in 1% nitric acid. Limits of detection (LOD) and limits of quantification (LOQ), calculated as 3 and 10 times the standard deviation of blank measurements respectively, are shown in Table 1.
2.5. ICP-MS analysis
Determination of trace and ultratrace elements was performed with a Thermo Scientific (Waltham, MA, USA) iCAP™ RQ inductively coupled plasma mass spectrometer (ICP-MS) with single-quadrupole technology. The instrument is equipped with an ESI (Omaha, NE, USA) PFA 100 MicroFlow nebuliser, a Peltier-cooled quartz spray chamber, operating at 3 °C, a quartz injector with an inner diameter of 2.0 mm, and a detachable quartz torch. Measurements were made using an ESI (Omaha, NE, USA) SC-4 DX autosampler. To overcome spectral interference, collision cell technology (CCT) with He gas at 3.5 mL/min and a kinetic energy discrimination barrier (KED) of 2 V was used; the CCT-KED device proved to be particularly useful in minimising oxide interference (e.g., 141Pr16O on 157Gd) in the determination of lanthanides. The sensitivity performance was comparable between the standard and KED modes (Ce > 500k cps/ppb in both modes); therefore, the KED mode was used for the determinations. The instrument and accessories were controlled by a PC via the QtegraTM v. 2.10.4345.136 software. The instrumental parameters were as follows: forward power, 1550 W; plasma gas flow, 14.0 L/min; nebuliser gas flow, 0.9 L/min; auxiliary gas flow, 0.8 L/min. Three replicate measurements were performed, for a total acquisition time of 180 s. The following isotopes were used: 45Sc, 47Ti, 51V, 52Cr, 89Y, 90Zr, 95Mo, 133Cs, 137Ba, 139La, 140Ce, 141Pr, 144Nd, 152Sm, 153Eu, 158Gd, 159Tb, 162Dy, 165Ho, 166Er, 169Tm, 174Yb, 175Lu, 178Hf, 181Ta, 182W, 232Th and 238U. 103Rh, 115In and 193Ir were used as internal standards.
Interference due to oxide formation was assessed by verifying that the CeO+/Ce+ ratio was < 0.5% in KED mode. Precision, assessed by a stability test performed before each session by monitoring 7Li, 59Co, 115In, 140Ce and 238U, was better than 2%. Instrumental precision, evaluated on the three replicates performed for each sample, was better than 2% for trace and ultra-trace elements. The overall precision of the method, including both sample preparation and instrumental analysis and evaluated on five independent replicates, was better than 5%.
The background signals were monitored at 5, 101 and 220 m/z to perform a sensitivity test on the analyte masses reported above. The standard multi-element solutions CCS-1, CCS-2, CCS-4, CCS-5 and CCS-6 from Inorganic Ventures (Christiansburg, VA, USA) were used to prepare solutions at 100, 10, 1 and 0.1 μg L−1 in 1% nitric acid. To correct for instrumental drift by interpolation, internal standardisation monitoring was used for the isotopes 103Rh, 115In and 193Ir to obtain a more precise correction; the three isotopes were added to all solutions analysed at a concentration of 10 μg L−1. Table 1 shows the Limits of Detection (LOD) and Limits of Quantification (LOQ), calculated as 3 and 10 times the standard deviation of blank measurements respectively.
2.6. Analysis of certified samples
The performance of the analytical procedures was evaluated using two standard reference materials: NIST SRM 2586 (Trace Elements in Soil Containing Lead from Paint) for soil samples and NIST SRM 1573a (Tomato Leaves) for plant matrices. The corresponding analytical results have been previously reported in [11].
2.7. Data treatment and comparison of lanthanide profiles
The profiles of the lanthanides and of the other elements were compared by normalising their concentrations, subsequently called Ce-normalised data, with respect to Ce, following the methodology already adopted in previous studies [9,10,11,12,13]. Data are expressed as in Equation (1):
where and represent the concentrations of the individual element and Ce, respectively, in a sample. The resulting ratio represents the Ce-normalised concentration of each element. Normalisation allows comparison of the relative shape of the distributions regardless of the differences in absolute concentrations among the matrices, which can be as wide as 2 orders of magnitude from soil to rice. Moreover, the profiles were represented on a logarithmic scale, rather than on a linear scale, to allow a more effective comparison among lanthanides considering that the light members of this group are more concentrated than the heavy members.
The graphical comparison was supplemented by a quantitative assessment among the distributions. We used the L parameter (2), which had already been used by the authors of this work in a previous study [13]. It is calculated as the sum of the relative differences among the Ce-normalised concentrations of the individual lanthanides in the two matrices being compared:
where e represent the Ce-normalised concentrations of the i-th lanthanide in matrices A and B. Lower values of L indicate greater overall similarity among the profiles, whilst increasing values correspond to greater relative divergence. As Ce is the normalising element, its contribution to the calculation is zero. The parameter was used as a continuous comparative index rather than as an absolute threshold for attributing provenance and was interpreted in conjunction with the shape of the distributions. The contribution of each individual lanthanide to the overall L value (dᵢ) was also considered to identify the elements contributing most to the observed divergence among the compared profiles. Individual contributions were expressed as percentages of the L value calculated excluding Eu, consistently with the quantitative interpretation adopted in this study. The exclusion of Eu is due to the possible positive interference caused by Ba oxides (135Ba16O+ and 137Ba16O+) in the determination of Eu (151Eu+ and 153Eu+ respectively) by quadrupole ICP-MS, even by keeping the formation of oxides < 0.5%. The values of L obtained by including this element have, however, been reported for comparison purposes, to assess its impact on the overall deviation of the distributions.
3. Results
3.1. Rice supply chain
The evaluation of supply chain traceability was based on the comparison of Ce-normalised lanthanide profiles and their quantitative divergence, assessed using the L parameter and the individual contributions (dᵢ), as described above.
As an initial example, Figure 1 compares the distributions of all elements determined in the supply chain considering soil, rice seeds, brown rice and white rice. While the other elements showed marked variations in the passage from soil to rice, due to their different roles in the metabolism of rice, the lanthanide distribution showed greater stability of the overall profile structure among the different matrices, due to the fact that they have no role at all in the plant metabolism. The behaviour of Eu reflects indeed the behaviour of Ba, due to the already cited positive interference.
The elemental distributions follow strictly the Oddo-Harkins rule, according to which nuclides with even atomic numbers are more abundant than those with odd atomic numbers immediately before and after [14,15]. As a result, the distributions exhibit a characteristic sawtooth profile, with a general tendency to decrease for the heavy lanthanides. This behaviour is a prerequisite for evaluating the use of the lanthanides distribution as a geochemical fingerprint of origin. The subsequent analyses, therefore, focused on the Ce-normalised distribution of lanthanides to quantify the degree of conservation of the fingerprint and to highlight any fractionation along the different phases of the supply chain.
As part of the traceability study of the rice supply chain, the variability of the elemental composition in the seeds of four varieties of rice from the same soil of origin, located in the municipality of Rovasenda (VC) and cultivated organically, was evaluated. The varieties were Rosa Marchetti, Bertone, Dellarole and Chinese Originario. Subsequently, brown rice and white rice were investigated also, to consider the effect of refining of the grains.
3.2. Seed traceability
In Table 2 the compositions of the seeds show a marked selectivity in the transfer of elements from soil to seeds. P and K represent the most abundant macroelements in seeds: P varies from 2481 to 4398 mg kg−1, while K varies from 1971 to 2719 mg kg−1. Mg is between 940 and 1444 mg kg−1 and Ca between 334 and 363 mg kg−1. Among the microelements, Mn shows the highest concentrations (51.7-80.3 mg kg−1), while Fe, Cu and Zn are present at lower levels. The absolute concentrations differ from those of the soil, confirming that soil-plant transfer is selective and that individual elements are not accumulated in direct proportion to their abundance in the substrate.
Overall, the differences among the four varieties are smaller than the difference between soil and seeds. This makes absolute concentrations useful for the chemical characterisation of samples, but less suitable, when considered individually, to represent unique indicators of origin. For this reason, the traceability assessment was subsequently focused on the relative distribution of lanthanides.
The analysis of the Ce-normalised profiles (Figure 2) shows a good preservation of the relative structure of the lanthanide distribution in the transition from soil to seed. In fact, the four varieties have overall comparable profiles and L values (Table 3), calculated excluding Eu, within a relatively narrow range: 1.33 for Rosa Marchetti, 1.44 for Bertone, 1.66 for Dellarole and 1.35 for Chinese Originario. The proximity of the values obtained for different varieties grown on the same soil represents a particularly interesting result for traceability purposes, since it indicates that the geochemical information associated with the substrate remains recognisable in the seeds despite the different varietal components.
This does not exclude possible effects of variety on the absorption and translocation of individual elements, but highlights that, under the conditions investigated, these differences do not compromise the overall recognition of the lanthanide fingerprint. The observed deviations mainly concern some heavy lanthanides, present at very low concentrations.
3.3. Traceability of the rice chains
Also in brown and white rice (Table 4), P and K represent the most abundant macroelements. In the transition from brown rice to white rice, the Mn content decreases in all four varieties, with particularly marked reductions in Rosa Marchetti and Chinese Originario. Mg also decreases in all varieties, being almost unchanged only in Bertone. P and Fe decrease in Rosa Marchetti, Dellarole and Chinese Originario, while Bertone shows comparable or slightly higher values in white rice. K, on the other hand, shows a variety-dependent trend: it decreases in Rosa Marchetti and Chinese Originario and increases in Bertone and Dellarole. Similarly, Na, Cu and Zn show non-uniform variations.
Overall, the results show that processing markedly modifies the distribution of the mineral components of the caryopsis, with different effects depending on the element and the variety. The absolute concentrations are, therefore, informative for describing the transformations associated with the processing, while the evaluation of the origin was deepened through the relative distribution of lanthanides, verifying whether the structure of the geochemical fingerprint remained recognisable despite these compositional variations.
3.3.1. Traceability of the Rosa Marchetti supply chain
In the Rosa Marchetti chain, the Ce-normalised distribution of lanthanides maintains an overall recognisable structure in the different matrices considered (Figure 3), despite the variations in the concentration magnitude from the soil of origin.
The values of L (Table 5), calculated excluding Eu, are equal to 1.33 in seeds, 2.69 in brown rice and 2.58 in white rice, highlighting the persistence of the information associated with the geochemical fingerprint through plant compartments with different elemental compositions.
The increase in the value of L from seeds to rice shows a greater deviation in the relative distribution of lanthanides with respect to the soil fingerprint, while the transition from brown rice to white rice does not lead to a further increase, since the two values are almost equivalent. The analysis of individual contributions (di) shows that the main deviations affect the heavy lanthanides region, in particular Tm and Lu, whose low concentrations can amplify the relative differences. It must be remembered, in fact, that their quantification derives from measurements close to the LOQ of the instruments, therefore, their contribution to the distribution has a higher variability. The transition to white rice is not associated, in this supply chain, with a greater quantitative variation of the fingerprint.
3.3.2. Traceability of the Bertone supply chain
In the Bertone chain, the Ce-normalised distribution of lanthanides retains an overall recognisable structure in the different matrices analysed (Figure 4).
The values of L (Table 6), calculated excluding Eu, increase from 1.44 in the seeds to 2.98 in brown rice and 3.44 in white rice.
The increase in L from seeds to rice shows a greater deviation in the relative distribution of lanthanides with respect to the soil fingerprint. Unlike the other three varieties considered, in the Bertone supply chain the transition from brown rice to white rice is associated with a further increase in the deviation, with L going from 2.98 to 3.44. The analysis of individual contributions (di) shows that the main deviations affect the heavy lanthanides region. The transition to white rice is associated, in this supply chain, with a greater quantitative variation of the fingerprint, while its overall structure remains recognisable. We can hypothesise that the process of milling brown rice influences the distribution of lanthanides.
3.3.3. Traceability of the Dellarole supply chain
In the Dellarole chain, the Ce-normalised distribution of lanthanides retains an overall recognisable structure in the different matrices analysed (Figure 5).
The values of L (Table 7), calculated excluding Eu, go from 1.66 in seeds to 3.12 in brown rice and 3.05 in white rice.
The increase in L from seeds to rice shows a greater deviation in the relative distribution of lanthanides with respect to the soil fingerprint. The analysis of individual contributions (di) shows that the main deviations concern the heavy lanthanides. The transition from brown rice to white rice, on the other hand, determines a minimal variation of the L parameter, which remains substantially comparable in the two matrices.
3.3.4. Traceability of the Chinese Originario supply chain
In the Chinese Originario chain, the Ce-normalised distribution of lanthanides retains an overall recognisable structure in the different matrices analysed (Figure 6).
The values of L (Table 8), calculated excluding Eu, go from 1.35 in seeds to 2.95 in brown rice and 2.26 in white rice.
The increase in L from seeds to rice shows a greater deviation in the relative distribution of lanthanides with respect to the soil fingerprint. The subsequent transition from brown rice to white rice does not indicate a further increase in the deviation, since L decreases from 2.95 to 2.26. The analysis of individual contributions (di) shows again that the main deviations affect the heavy lanthanides region, in particular Tm and Lu. In this supply chain too, the transition to white rice is not associated with a greater quantitative variation of the fingerprint.
3.3.5. Comparison among the four varieties
The overall comparison among the four varieties (Table 9) shows a common behaviour. In all cases, the seeds show lower L values relative to the soil of origin (1.33–1.66), while slightly higher deviations are observed in brown and white rice, although the general structure of the lanthanide distribution is maintained.
3.4. Other cereal crops and processed products
The investigation was subsequently extended to other cereal crops, oats and millet, grown on the same soil in Rovasenda (VC), in order to evaluate the behaviour of the elemental component and verify whether the lanthanide fingerprint associated with the soil remained recognisable even in plant species other than rice. A processed product, rice pasta, obtained from Rosa Marchetti variety, was also analysed to evaluate the persistence of geochemical information following a further technological transformation.
The comparison among the different matrices shows an overall similar mineral composition for some macroelements, but with specific differences among species (Table 10).
Oats and millet have concentrations of K and P of the same order of magnitude, while oats show higher concentrations of Ca, Fe and Mn than millet and rice. Cu and Zn are present at lower concentrations than macroelements, with variable values among the different matrices.
Rice pasta has higher concentrations than rice for all the elements considered, showing a variation in the mineral composition in the processed product. Overall, these results confirm that the absolute concentrations of macro- and microelements can vary both among different plant species and because of technological transformations. The evaluation was therefore extended to the Ce-normalised distribution of lanthanides, to verify whether, in the face of these compositional differences, the geochemical information associated with the soil remained recognisable.
Figure 7 compares the Ce-normalised profiles of oats and millet with that of rice of the Rosa Marchetti variety, and with the common soil of origin. The overall structure of the lanthanide distribution of the three species is maintained recognisable with respect to the geochemical reference, while showing absolute quantitative deviations in the individual elements.
This behaviour is confirmed by the values of L (Table 11), equal to 2.31 for oats, 2.23 for millet and 2.58 for rice.
Figure 8 shows the evolution of the lanthanide fingerprint from the soil of origin to the rice pasta.
With respect to the soil, L increases from 1.33 in the seeds to 2.69 in brown rice and 2.58 in white rice, while in the rice pasta it reaches a value of 2.65 (Table 12).
The profile of the processed product, therefore, shows an overall deviation very similar to that observed in brown rice and white rice.
3.5. Evaluation of the impact of the variety and the cultivation method
Subsequently, the impact of both the variety and the cultivation method on the variability of the elemental composition was evaluated in four rice supply chains: BIO, relating to the Sant'Andrea variety grown organically; TRAD, relating to the Carnaroli variety grown using the conventional method; DRY1, relating to the Venere variety grown using the conventional method; and DRY2, relating to the Sant'Andrea variety grown using the conventional method. For every supply chain, roots, straw, husks and rice were analysed.
The elemental analysis showed a marked variability of the mineral composition both among the different plant matrices and among the four supply chains considered (Table 13), highlighting a selective distribution of the elements in the different compartments of the plant.
The most evident behaviour concerns Fe, whose concentrations are significantly higher in the roots, with values between 25,175 and 55,244 mg kg−1, compared to straw (298-629 mg kg−1), husks (80.4-220 mg kg−1) and rice (28.6-52.1 mg kg−1). This trend shows a strong compartmentalisation of Fe at the root level and a limited presence of the element in the edible part of the plant.
Mn also shows a highly matrix-dependent distribution. The highest concentrations are generally observed in straw (362-1183 mg kg−1), followed by husks (174-264 mg kg−1), while in rice the values are lower, ranging from 29.8 to 74.7 mg kg−1. In roots, on the other hand, Mn shows greater variability among the supply chains, with concentrations ranging from 89.1 to 473 mg kg−1.
A marked compartmentalisation can also be observed for K, which is particularly abundant in straw, where it reaches concentrations between 5915 and 36,887 mg kg−1. In husks, the values are lower (2096-3314 mg kg−1) and decrease further in rice (509-1997 mg kg−1). Mg and Ca also show differences among the different matrices, confirming an uneven distribution of the mineral component in the different plant compartments. P, on the other hand, also has relatively high concentrations in rice, ranging from 1149 to 2993 mg kg−1.
The comparison between the BIO and DRY2 supply chains, both relating to the Sant'Andrea variety but characterised respectively by organic and conventional cultivation, shows concentrations of the same order of magnitude for different elements in rice. K and P go from 509 to 569 mg kg−1 and from 1149 to 1257 mg kg−1, respectively, while Fe has very similar values (28.6 and 29.9 mg kg−1). Cu and Zn are higher in DRY2, while Mn has a higher concentration in the BIO sample (74.7 mg kg−1) than in DRY2 (50.3 mg kg−1). The comparison, therefore, highlights the presence of common compositional characteristics associated with the same variety, accompanied by specific variations among the two supply chains. Since the systems considered differ in cultivation methods and in the conditions of the respective supply chains, these variations cannot be attributed exclusively to the cultivation method.
Overall, the analysis highlights how the elemental composition effectively describes the phenomena of compartmentalisation and the differences among the matrices of the supply chain, but at the same time shows a variability linked both to the plant sector and to the characteristics of the individual supply chains.
This result reinforces the interest in the use of the relative distribution of lanthanides as complementary information to absolute concentrations, to verify whether the geochemical fingerprint of origin remains recognisable through matrices characterised by very different mineral compositions.
3.5.1. Traceability of the Sant'Andrea supply chain with organic method (BIO)
In the BIO chain, the Ce-normalised distribution of lanthanides maintains an overall recognisable structure in the different matrices considered, although showing variations in the extent of the deviation from the soil of origin (Figure 9).
The L values, calculated excluding Eu (Table 14), are equal to 2.77 in the roots, 1.73 in the straw, 3.41 in the husks and 3.90 in brown rice, highlighting the persistence of the information associated with the geochemical fingerprint through plant compartments characterised by very different elemental compositions.
White rice has the highest deviation in the supply chain, with L equal to 8.13. The analysis of individual contributions (di) shows that this increase is not evenly distributed among lanthanides but affects the heavy lanthanides region to a greater extent, with particularly significant contributions from Tm (11.2%) and Lu (13.7%). The transition to white rice is, therefore, associated, in this supply chain, with a greater quantitative modification of the fingerprint, without causing a complete loss of the characteristic structure of the distribution.
3.5.2. Traceability of the Carnaroli supply chain with conventional method (TRAD)
In the TRAD chain, the distribution of lanthanides maintains a good recognisability with respect to the soil fingerprint in the different matrices considered (Figure 10).
The values of L (Table 15) are equal to 2.04 in the roots, 1.27 in the straw and reach the minimum value in the husks (0.73), which therefore shows a close overall correspondence with the geochemical reference. In brown rice, L increases to 3.92, while white rice has again the highest value in the supply chain, equal to 5.29.
The analysis of individual contributions (di) shows that the deviation observed in white rice is more associated with the heavy lanthanides, in particular Tm (16.9%) and Lu (17.6%). Also in this supply chain, therefore, the transformation to white rice quantitatively modifies some relative ratios among lanthanides, while the overall structure of the fingerprint remains recognisable.
3.5.3. Traceability of the Venere supply chain with conventional method (DRY1)
In the DRY1 chain, relating to the Venere variety grown with the conventional method, the Ce-normalised distribution of lanthanides maintains an overall recognisable structure in the different matrices considered (Figure 11).
The values of L (Table 16), calculated excluding Eu, are equal to 2.31 in the roots, 1.25 in the straw and 1.58 in the husks, showing for the latter two matrices a good overall correspondence with the soil fingerprint. In brown rice, L increases to 3.70, indicating a greater quantitative modification of the profile compared to the other plant matrices.
The analysis of individual contributions (di) shows that the deviation observed in brown rice mainly affects the terminal region of heavy lanthanides, with particularly significant contributions of Tm (17.3%) and Lu (20.5%). Even in the presence of these selective deviations, the general structure of the distribution remains recognisable with respect to the geochemical reference. White rice has not been considered for this supply chain, since the Venere variety is marketed as brown rice.
3.5.4. Traceability of the Sant'Andrea supply chain with conventional method (DRY2)
In the DRY2 chain, relating to the Sant'Andrea variety grown using the conventional method, the lanthanide fingerprint remains overall recognisable in the different matrices analysed (Figure 12).
The L values (Table 17) are equal to 0.86 in the roots, 2.32 in the straw, 1.40 in the husks and 2.58 in brown rice. Particularly interesting is the value observed in the roots, which have the lowest overall deviation in the supply chain and, therefore, a close correspondence with the relative distribution of the soil.
White rice, on the other hand, shows the greatest deviation, with L equal to 6.32, significantly higher than brown rice. The analysis of individual contributions (di) shows that this increase is mainly associated with the heavy lanthanides region, with particularly significant contributions from Tm (18.1%) and Lu (19.3%). Also in this supply chain, therefore, the transition to white rice is associated with a greater quantitative modification of the fingerprint, concentrated mainly in specific portions of the distribution rather than uniformly over the entire profile.
Considered as a whole (Table 18), the four supply chains show a substantial persistence of the geochemical information associated with the soil through the different plant matrices, accompanied by quantitative variations in the fingerprint, the extent of which depends on the sector considered.
In roots, straw and husks, L values generally remain low, although with differences among the individual supply chains, while in brown rice a greater deviation is observed, with values between 2.58 and 3.92. A particularly interesting result emerges from the comparison with white rice. In the three supply chains for which this matrix is available, white rice systematically has the highest L value in each of them: 8.13 in BIO, 5.29 in TRAD and 6.32 in DRY2. The trend observed independently in the three complete supply chains, therefore, indicates that the transition to white rice represents a step associated with a greater quantitative modification of the lanthanide fingerprint.
The analysis of individual contributions (di) provides further information on the nature of this deviation. In rice samples with the highest L values, fractionation is mainly associated with the heavy lanthanides, such as Tm and Lu. The observed deviation, therefore, does not correspond to a uniform variation of the entire distribution, but to selective fractionation phenomena that modify specific portions of the fingerprint or to sensitivity issues in the analytical determination.
4. Discussion
4.1. Seed traceability
The traceability study on seeds showed an interesting result, that is, the geochemical fingerprint of soil is highly preserved in the seeds, apart from the Eu anomaly. The practical consequence is its use to check the provenance of seeds. In fact, in the rice sector, where seed certification is also a relevant element for the requirements of the Common Agricultural Policy (CAP) [16], the availability of analytical tools complementary to the supply chain documentation could be of particular interest. In this perspective, the good correspondence observed among the profiles of the four varieties and the common geochemical reference suggests the potential of the distribution of lanthanides as a complementary analytical tool to verify the consistency of origin of seeds.
4.2. Traceability of the different variety chains
If we extend the traceability study up to the refined rice, the results show how the geochemical fingerprint is only poorly affected by the transformations associated with the formation and processing of the caryopsis. The transition from brown rice to white rice, on the other hand, does not determine a unidirectional variation of L: the value decreases slightly in Rosa Marchetti, Dellarole and Chinese Originario, while it increases in Bertone. The transition to white rice, therefore, seems to quantitatively modulate the fingerprint in a matrix-dependent manner, rather than determining a progressive loss of geochemical information. Overall, the persistence of a recognisable profile structure even in processed products supports the use of the relative distribution of lanthanides as a traceability tool along subsequent stages of the supply chain.
4.3. Other cereal crops and processed products
The relatively narrow range of the L values obtained shows a comparable overall degree of deviation among different cereal species grown on the same soil. The result expands on what was previously observed for the different rice varieties, suggesting that the fingerprint recognition is not limited to the rice species alone. While not excluding specific absorption and fractionation phenomena of the different species, the relative distribution of lanthanides, therefore, retains information attributable to the common geochemical substrate. This result suggests that the geochemical features of soil are the leading factor in the absorption of lanthanides, while the botanical features are less important.
As to the rice pasta, the results obtained show that the further technological transformation required to produce rice pasta does not determine, in the sample analysed, an appreciable increase in the distance from the soil fingerprint. This result is particularly interesting for traceability purposes, since it indicates that the geochemical information recognisable in the rice remains even after a subsequent transformation phase, at least in the conditions investigated.
Overall, the extension of the survey to other cereal species and to a processed product reinforces what it has been observed in the rice supply chains. Oats and millet, although belonging to different species, maintain profiles attributable to the common soil of origin and show L values of the same order of magnitude as rice. Similarly, the transformation of rice into rice pasta does not result in an evident loss of geochemical information. These results highlight the ability of the relative distribution of lanthanides to maintain a recognisable relationship with the soil of origin, even though the matrices are biologically and technologically different.
4.4. Impact of the cultivation method
Even in the case of different cultivation methods, it can be stated that the geochemical fingerprint of soil is well maintained along the chain, even in the presence of small fractionation quantitatively measurable by L and identifiable through the individual contributions (di). The combination of the graphical comparison of distributions, the L index and the analysis of individual contributions therefore makes it possible to follow the evolution of geochemical information along the supply chain and to identify the matrices or transformations associated with the most relevant modifications.
5. Conclusions
The present study highlights the potential of the relative distribution of lanthanides as a complementary tool for traceability in the rice supply chain. Across matrices characterised by different compositions and degrees of transformation, from the soil-plant system to the milled rice, the geochemical fingerprint remained recognisable overall, although showing quantitatively measurable fractionations. The concentrations of macro- and microelements provided useful information for the characterisation of the matrices, while the Ce-normalised distribution of lanthanides allowed more specific tracking of the persistence of provenance information.
The results also show that preservation of the fingerprint should not be interpreted as identity among the distributions. Biological and technological processes can selectively modify the relationships among lanthanides without causing a progressive loss of geochemical information. In this context, the joint use of the L parameter and individual contributions (dᵢ) has allowed not only the distance among the distributions to be quantified, but also the portions of the distribution most affected by fractionation to be identified, frequently located in the region of the heavy lanthanides.
Author Contributions
Conceptualization, F.G., F.B. and G.B.; methodology, F.G., F. B. and M.A.; software, E.C. and M.C.; validation, F.G. and E.C.; formal analysis, F.G., F.B. and M.A.; investigation, F.G., F.B. and M.A.; resources, M.C., G.B. and M.A.; data curation, E.C.; writing—original draft preparation, F.G.; writing—review and editing, M.C. and M.A.; visualization, E.C.; supervision, G.B. and M.A.; project administration, F.G.; funding acquisition, G.B. and M.A. All authors have read and agreed to the published version of the manuscript.
Funding
This research received no external funding.
Institutional Review Board Statement
Not applicable.
Informed Consent Statement
Not applicable.
Data Availability Statement
The raw data supporting the conclusions of this article will be made available by the authors on request.
Acknowledgments
The authors acknowledge the contributions of Una Garlanda farm (Una Garlanda di Stocchi fratelli e C., Cascina dell' Angelo, 13040 Rovasenda, Italy), Carlo Minoia (SA.PI.SE. Cooperativa Agricola, Vercelli, Italy), Goio farm (Riso Goio, via Gattinara 13/A, 13040 Rovasenda, Italy), and Marco Fassone (Cascina Fassone, 13040 Rovasenda, Italy) for providing samples of rice and seeds; Daniele Tenni (Ente Nazionale Risi, Castello d'Agogna, Italy) for providing samples of white rice and husks; Patrizia Vaccino (CREA Cerealicoltura e Colture Industriali, Strada Statale 11 per Torino km 2.5, 13100 Vercelli, Italy) and Giampiero Valè (Università degli Studi del Piemonte Orientale, Dipartimento per lo Sviluppo Sostenibile e la Transizione Ecologica, Piazza Sant'Eusebio, 5 - 13100 Vercelli, Italy) for fruitful suggestions.
Conflicts of Interest
The authors Federica Gulino, Federica Bella, Elisa Calà, Giovanni Bargnesi, and Maurizio Aceto declare no conflicts of interest. Author Giovanni Bargnesi is the director of POLYCULTURAE non-profit organization, which is dedicated exclusively to the study, research, and promotion of biodiversity within agro-ecosystems; it operates, by definition, with no profit-seeking objective. Author Marianna Celsi was employed by the company Sardo Piemontese Sementi Vercelli. She participated in the study according to the role of her company, which was to provide samples for the research and knowledge on the management of the rice chain.
Abbreviations
The following abbreviations are used in this manuscript:
| PDO | Protected Designation of Origin |
| PGI | Protected Geographical Indication |
| ICP-MS | inductively coupled plasma mass spectrometry |
| ICP-OES | inductively coupled plasma optical emission spectrometry |
| BIO | organic farming cultivation method |
| TRAD | conventional farming cultivation method |
| DRY1 | dry seeding cultivation method (no. 1) |
| DRY2 | dry seeding cultivation method (no. 2) |
References
- Istituto Nazionale di Statistica ISTAT. Produzioni agricole e zootecniche – Anno 2025. 2026. [Google Scholar] [PubMed]
- Chen, C.; Yang, X.; Bai, L.; Zhao, S.; Xi, Z.; Hu, Y.; Liu, J.; Zhao, Y.; Liang, K. Research Progress of Traceability Technologies for Large-Scale Geographical Specialty Food Origins. Food Rev. Int. 2026, 42, 4587–4620. [Google Scholar] [CrossRef]
- Ghoshal, S.; Dutta, S.; Shekhar, S.; Tippannanavar, M.; Banerjee, T. Application of Isotope Ratio Mass Spectrometry (IRMS) for Food Authenticity and Food Fraud Detection: A Comprehensive Review. Food Res. Int. 2026, 245, 120512. [Google Scholar] [CrossRef] [PubMed]
- Lee, K.-S.; Shin, W.-J. Recent Advances in Stable Isotope Techniques for the Determination of Geographical Origin of Plant-Based Foods. J. Food Compos. Anal. 2026, 153, 109170. [Google Scholar] [CrossRef]
- Mazarakioti, E.C.; Zotos, A.; Thomatou, A.-A.; Kontogeorgos, A.; Patakas, A.; Ladavos, A. Inductively Coupled Plasma-Mass Spectrometry (ICP-MS), a Useful Tool in Authenticity of Agricultural Products’ and Foods’ Origin. Foods 2022, 11, 3705. [Google Scholar] [CrossRef] [PubMed]
- Gonzálvez, A.; Armenta, S.; De La Guardia, M. Geographical Traceability of “Arròs de Valencia” Rice Grain Based on Mineral Element Composition. Food Chem. 2011, 126, 1254–1260. [Google Scholar] [CrossRef]
- Cheajesadagul, P.; Arnaudguilhem, C.; Shiowatana, J.; Siripinyanond, A.; Szpunar, J. Discrimination of Geographical Origin of Rice Based on Multi-Element Fingerprinting by High Resolution Inductively Coupled Plasma Mass Spectrometry. Food Chem. 2013, 141, 3504–3509. [Google Scholar] [CrossRef] [PubMed]
- Shen, S.; Xia, L.; Xiong, N.; Liu, Z.; Sun, H. Determination of the Geographic Origin of Rice by Element Fingerprints and Correlation Analyses with the Soil of Origin. Anal. Methods 2013, 5, 6177. [Google Scholar] [CrossRef]
- Aceto, M.; Robotti, E.; Oddone, M.; Baldizzone, M.; Bonifacino, G.; Bezzo, G.; Di Stefano, R.; Gosetti, F.; Mazzucco, E.; Manfredi, M.; et al. A Traceability Study on the Moscato Wine Chain. Food Chem. 2013, 138, 1914–1922. [Google Scholar] [CrossRef] [PubMed]
- Calà, E.; Fracchia, A.; Robotti, E.; Gulino, F.; Gullo, F.; Oddone, M.; Massacane, M.; Cordone, G.; Aceto, M. On the Traceability of the Hazelnut Production Chain by Means of Trace Elements. Molecules 2022, 27, 3854. [Google Scholar] [CrossRef] [PubMed]
- Gulino, F.; Calà, E.; Cozzani, C.; Vaccari, L.; Oddone, M.; Aceto, M. On the Traceability of Honey by Means of Lanthanide Distribution. Foods 2023, 12, 1803. [Google Scholar] [CrossRef] [PubMed]
- Gulino, F.; Siragusa, C.; Calà, E.; Gullo, F.; Aceto, M. Tracking the Mandorla Di Avola Almond Variety by Means of ICP Analysis. Foods 2024, 13, 2634. [Google Scholar] [CrossRef] [PubMed]
- Gulino, F.; Calà, E.; Garruto, L.; Toso, C.; Lingua, G.; Cesaro, P.; Rubino, V.; Aceto, M. On the Traceability of Truffles by Means of the Lanthanides Distribution. J. Food Compos. Anal. 2025, 139, 107068. [Google Scholar] [CrossRef]
- Oddo, G. Die Molekularstruktur Der Radioaktiven Atome. Z. Für Anorg. Chem. 1914, 87, 253–268. [Google Scholar] [CrossRef]
- Harkins, W.D. The Evolution of the Elements and the Stability of Complex Atoms. I. a New Periodic System Which Shows a Relation Between the Abundance of the Elements and the Structure of the Nuclei of Atoms. J. Am. Chem. Soc. 1917, 39, 856–879. [Google Scholar] [CrossRef]
- MASAF. Modifica del decreto ministeriale 27 settembre 2023 per quanto concerne i quantitativi minimi per ettaro di sementi certificate per taluni interventi di sostegno accoppiato al reddito 2024. [CrossRef]
Figure 1.
Distribution of elements in soil, seeds, brown rice and white rice (Ce-normalised data).
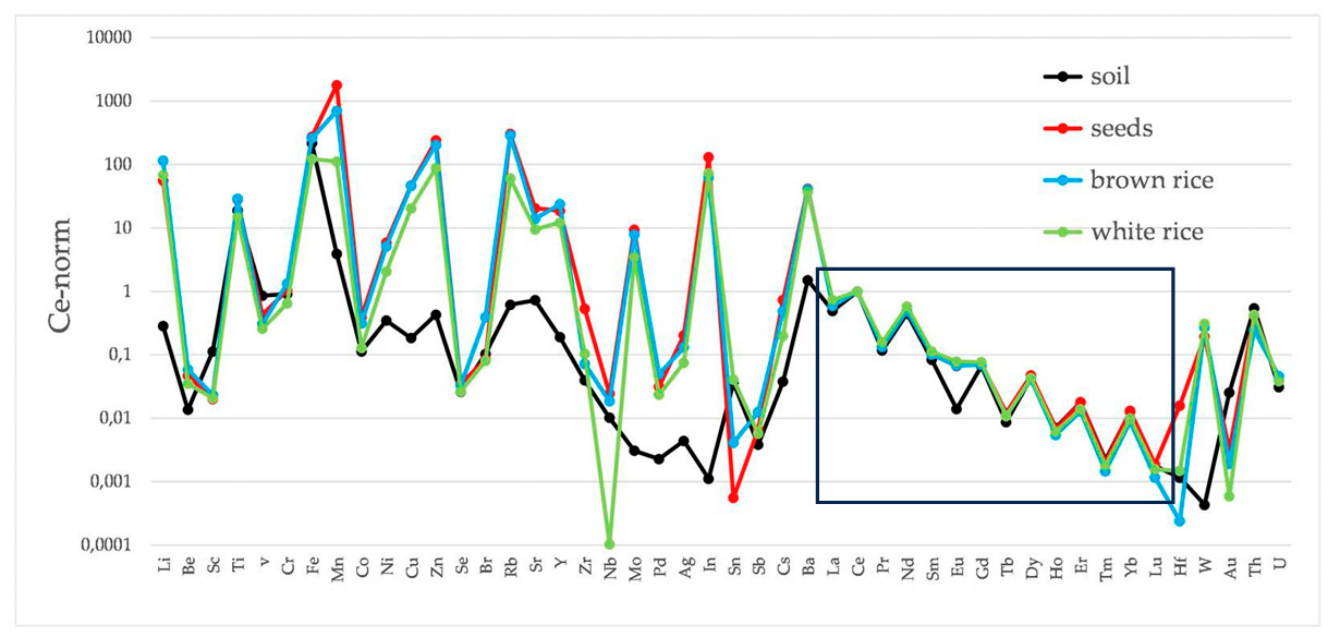
Figure 2.
Ce-normalised distributions of lanthanides in soil and seeds of the considered varieties.
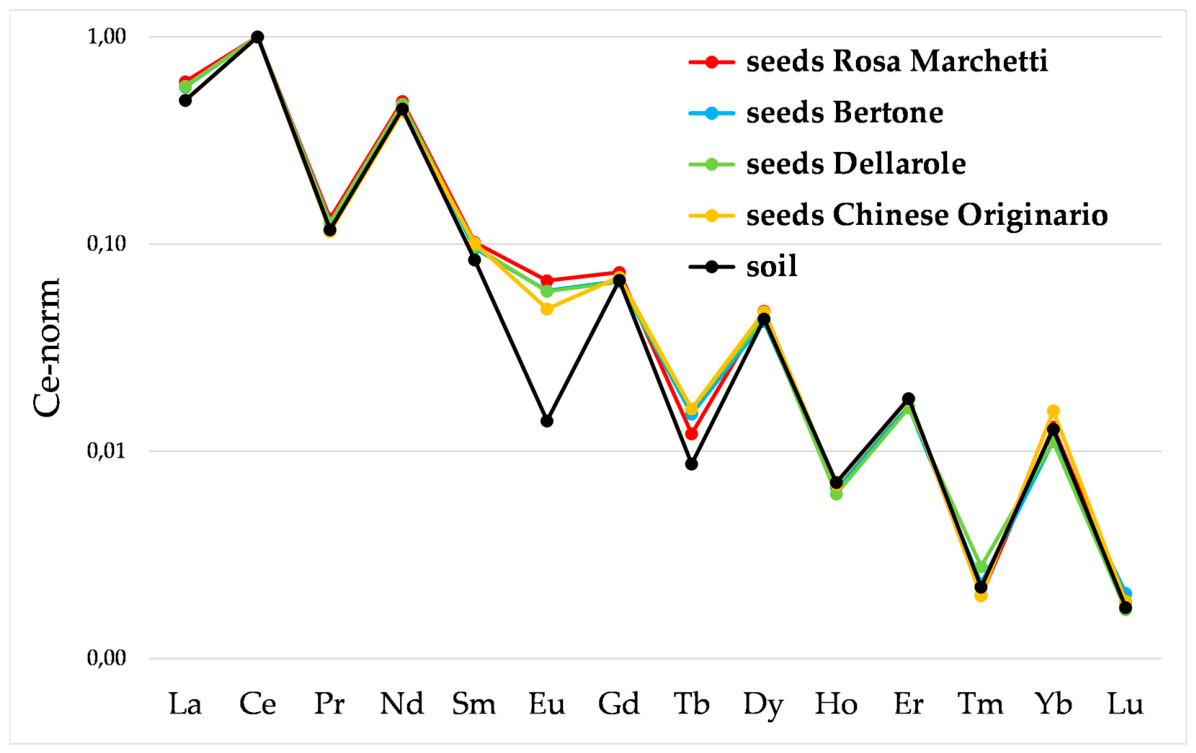
Figure 3.
Ce-normalised distributions of lanthanides in the Rosa Marchetti chain.
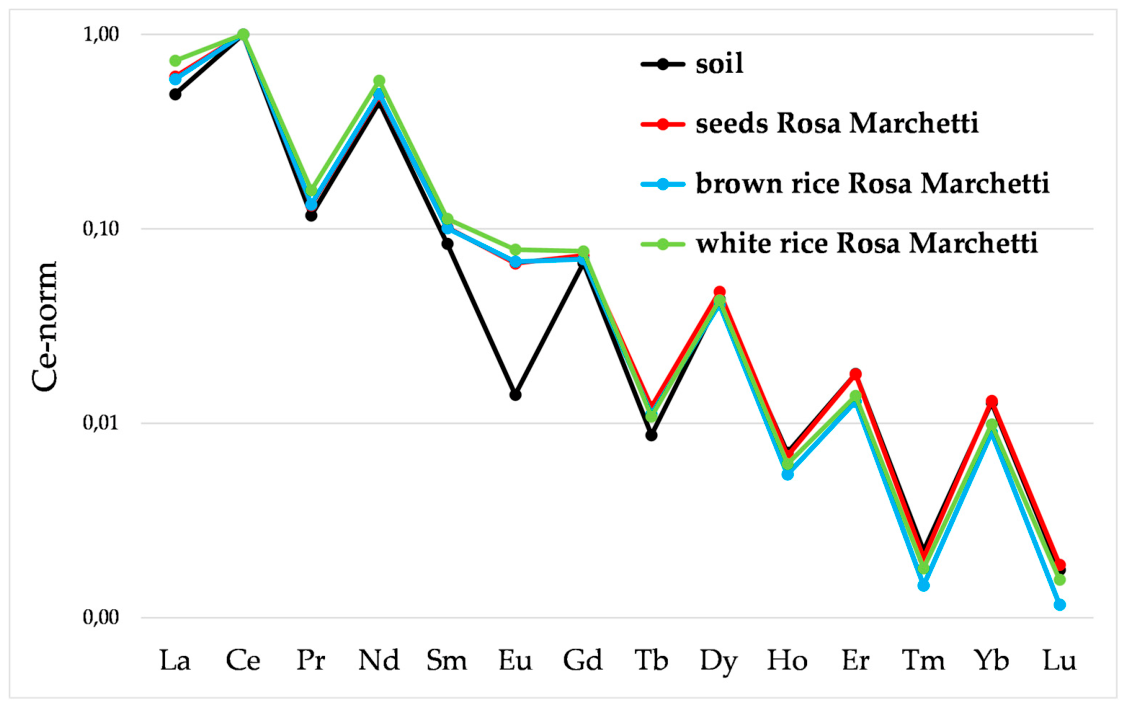
Figure 4.
Ce-normalised distributions of lanthanides in the Bertone chain.
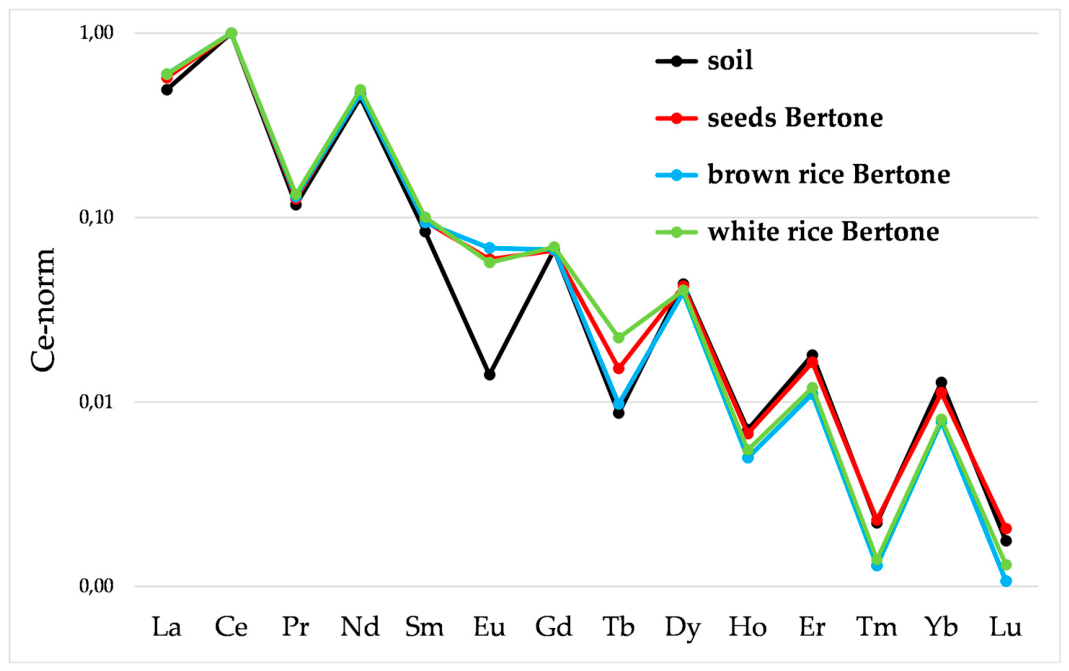
Figure 5.
Ce-normalised distributions of lanthanides in the Dellarole chain.
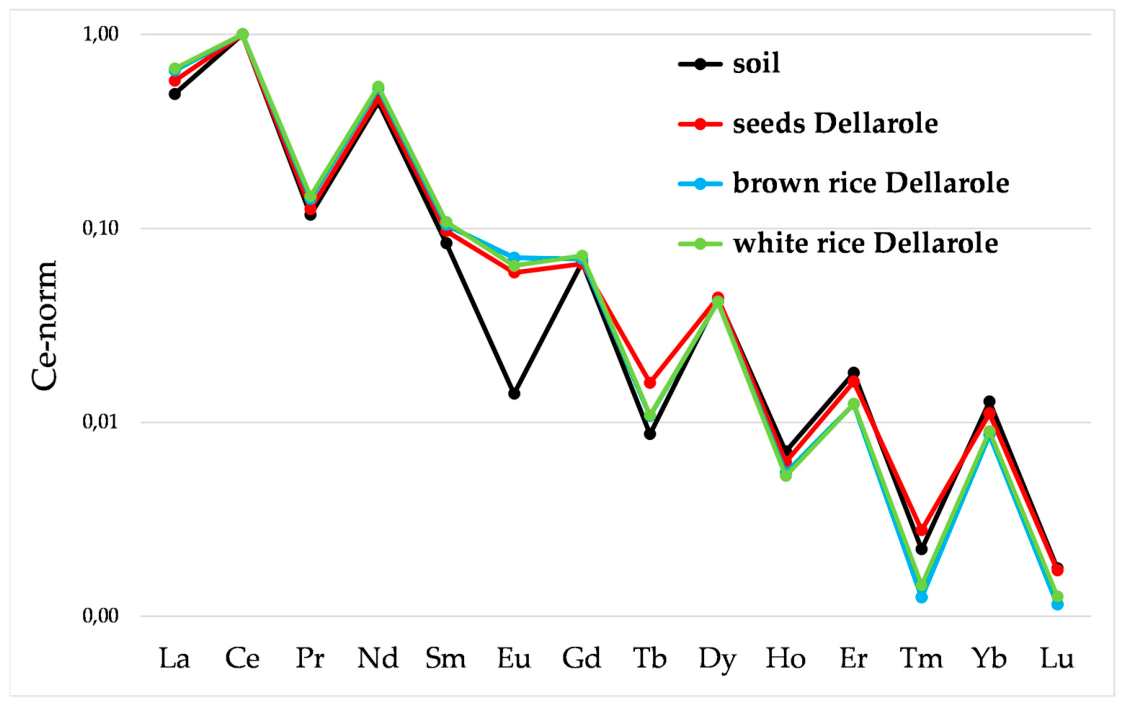
Figure 6.
Ce-normalised distributions of lanthanides in the Chinese Originario chain.
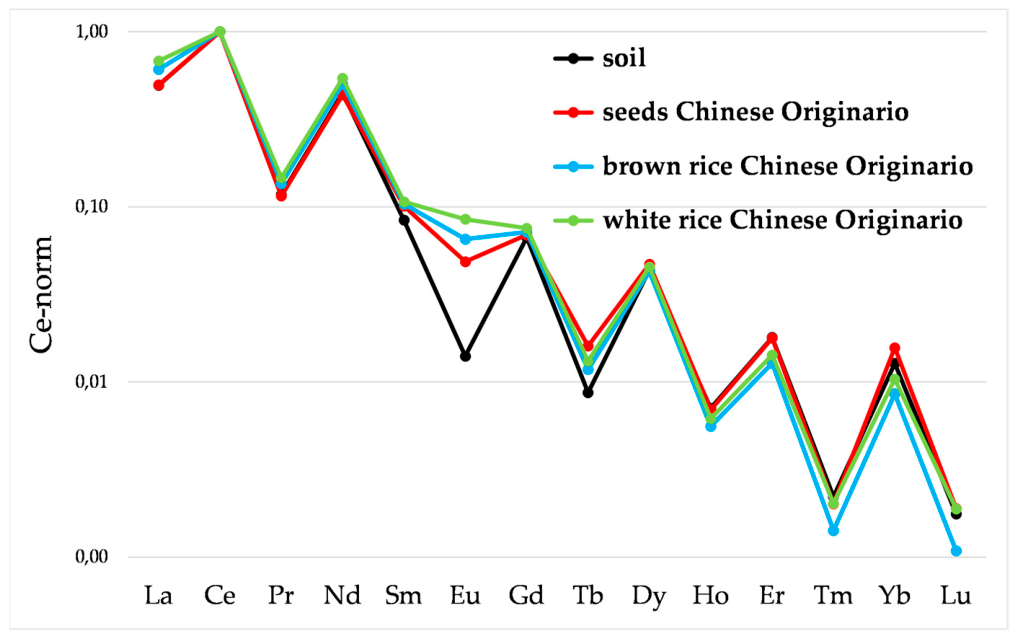
Figure 7.
Ce-normalised distributions of lanthanides in soil, oats, millet and white rice of Rosa Marchetti chain.
Figure 7.
Ce-normalised distributions of lanthanides in soil, oats, millet and white rice of Rosa Marchetti chain.
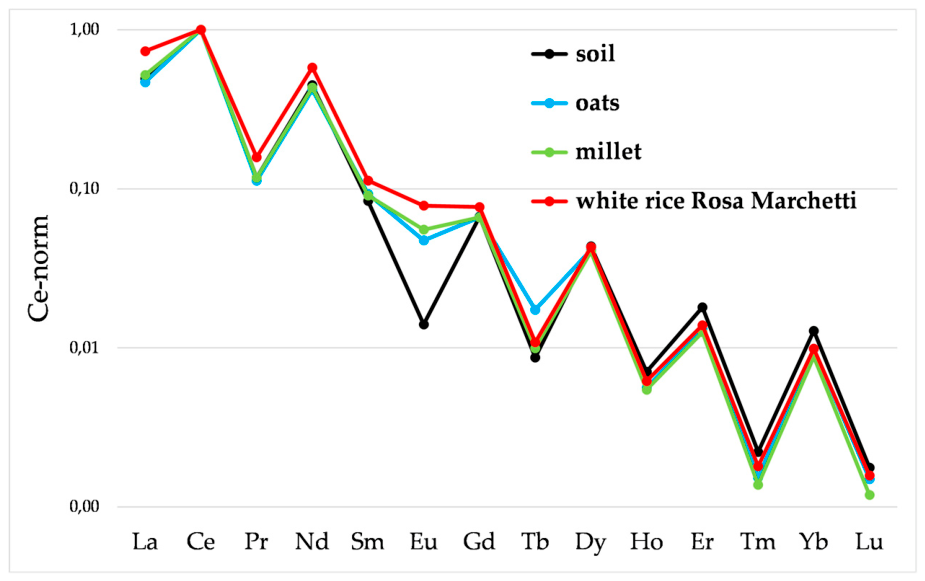
Figure 8.
Ce-normalised distributions of lanthanides from soil to rice pasta of the Rosa Marchetti chain.
Figure 8.
Ce-normalised distributions of lanthanides from soil to rice pasta of the Rosa Marchetti chain.
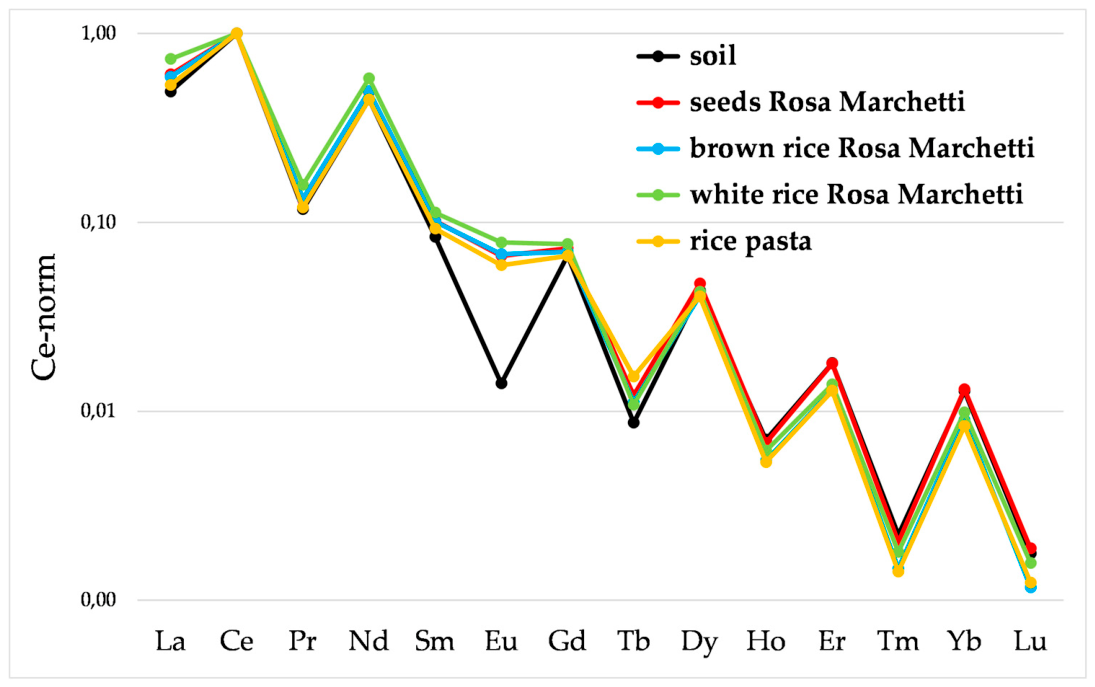
Figure 9.
Ce-normalised distributions of lanthanides in the matrices of the BIO chain (Sant'Andrea, organic method).
Figure 9.
Ce-normalised distributions of lanthanides in the matrices of the BIO chain (Sant'Andrea, organic method).
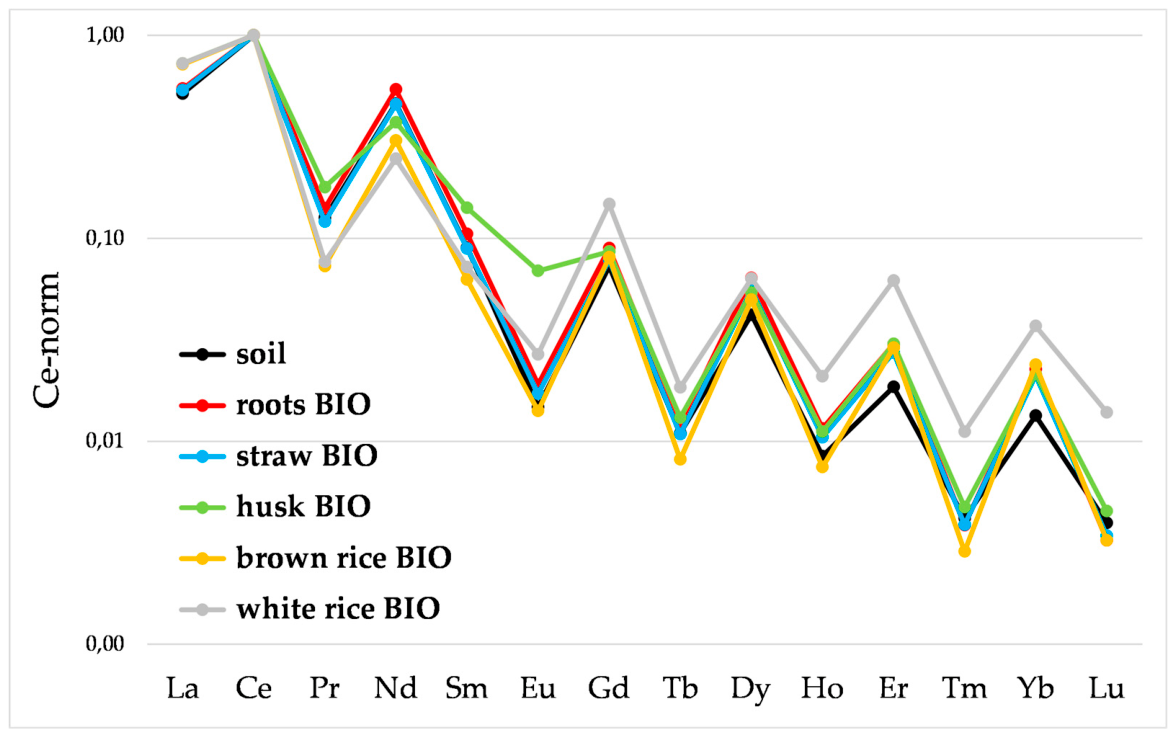
Figure 10.
Ce-normalised distributions of lanthanides in the matrices of the TRAD chain (Carnaroli, conventional method).
Figure 10.
Ce-normalised distributions of lanthanides in the matrices of the TRAD chain (Carnaroli, conventional method).
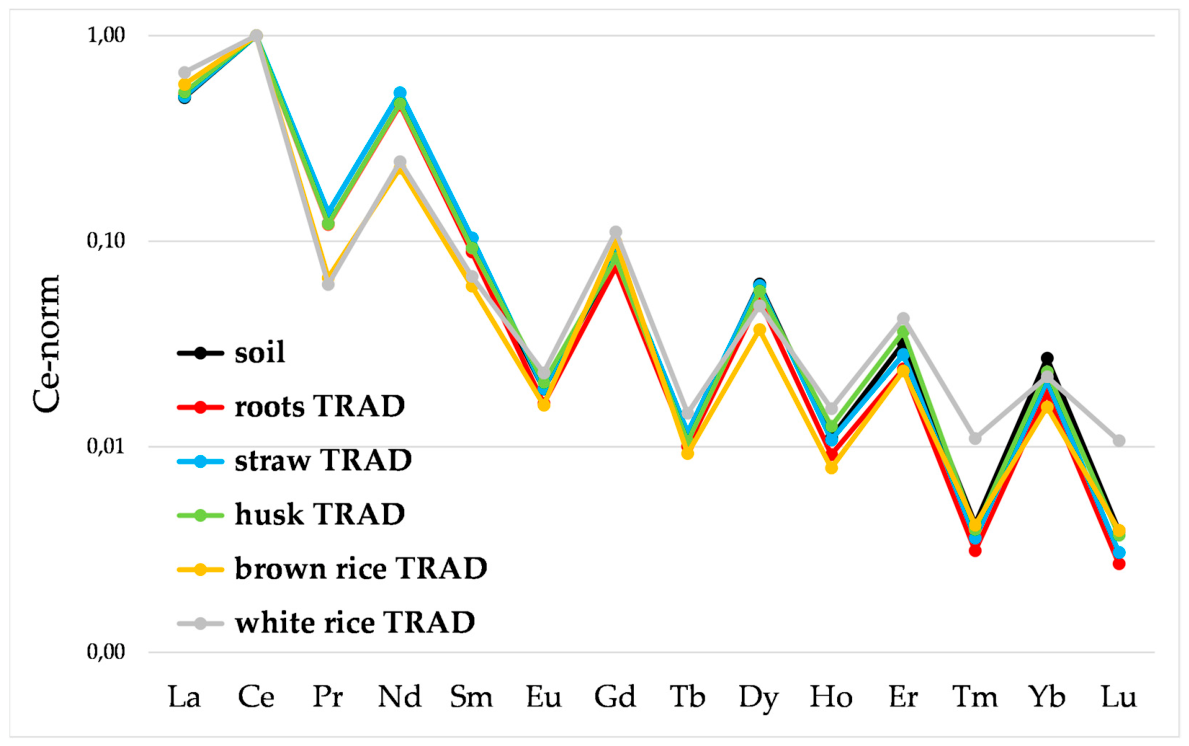
Figure 11.
Ce-normalised distributions of lanthanides in the matrices of the DRY1 chain (Venere, conventional method).
Figure 11.
Ce-normalised distributions of lanthanides in the matrices of the DRY1 chain (Venere, conventional method).
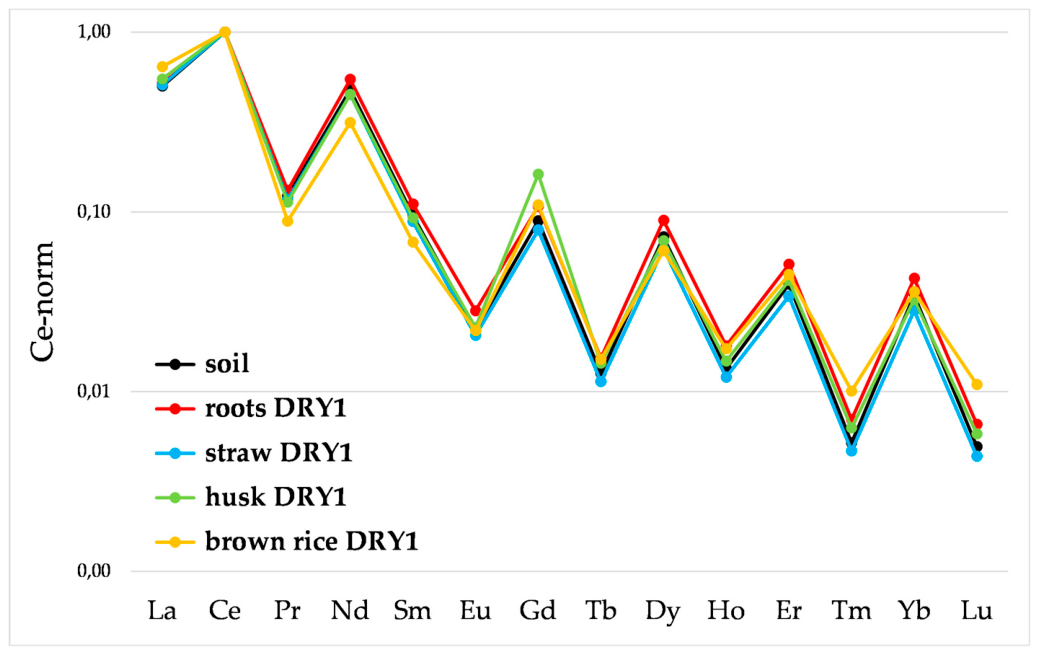
Figure 12.
chain (Sant’Andrea, conventional method).
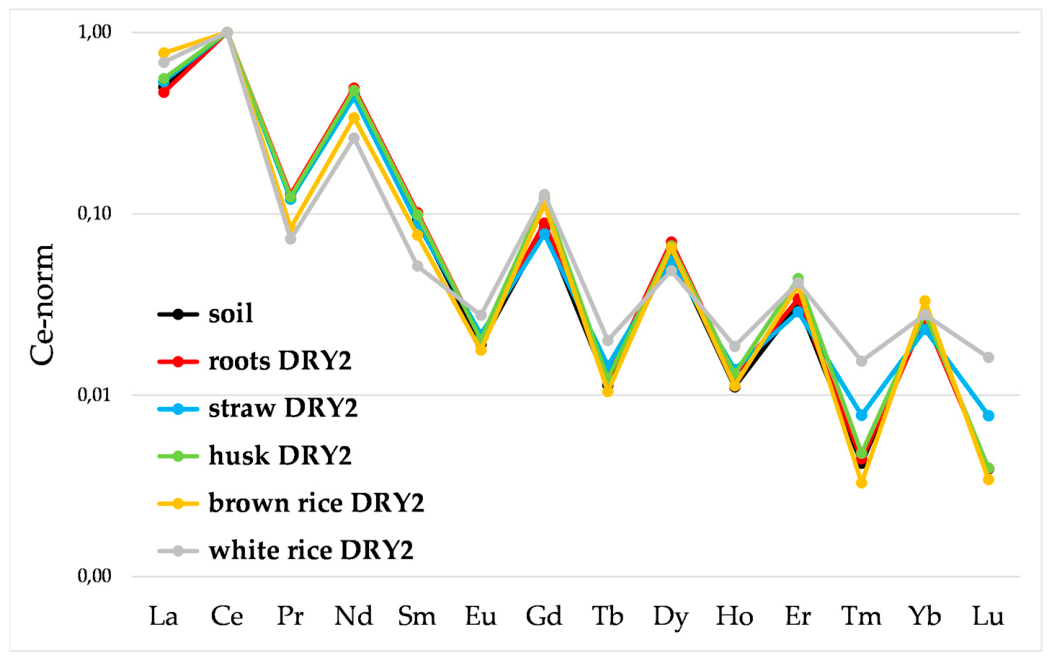

Table 1.
Limits of detection (LOD) and quantification (LOQ) for elements determined by ICP-OES and ICP-MS.
Table 1.
Limits of detection (LOD) and quantification (LOQ) for elements determined by ICP-OES and ICP-MS.
| Elements | LOD | LOQ | Elements | LOD | LOQ |
|---|---|---|---|---|---|
| Al 1 | 0.027 mg L−1 | 0.0945 mg L−1 | Na 1 | 9.9 μg L−1 | 34.65 μg L−1 |
| B 1 | 0.004 mg L−1 | 0.014 mg L−1 | Nd 2 | 0.2 ng L−1 | 0.7 ng L−1 |
| Ba 2 | 0.5 ng L−1 | 1.75 ng L−1 | Ni 1 | 1.4 μg L−1 | 4.9 μg L−1 |
| Ca 1 | 0.019 mg L−1 | 0.0665 mg L−1 | P 1 | 0.24 mg L−1 | 0.84 mg L−1 |
| Ce 2 | 0.6 ng L−1 | 2.1 ng L−1 | Pr 2 | 0.1 ng L−1 | 0.35 ng L−1 |
| Co 1 | 0.67 μg L−1 | 2.345 μg L−1 | Rb 1 | 0.035 mg L−1 | 0.1225 mg L−1 |
| Cr 2 | 0.001 μg L−1 | 0.0035 μg L−1 | S 1 | 0.022 mg L−1 | 0.077 mg L−1 |
| Cs 2 | 0.8 ng L−1 | 2.8 ng L−1 | Sc 2 | 4.65 ng L−1 | 16.275 ng L−1 |
| Cu 1 | 2.5 μg L−1 | 8.75 μg L−1 | Si 1 | 4.3 μg L−1 | 15.05 μg L−1 |
| Dy 2 | 0.2 ng L−1 | 0.7 ng L−1 | Sm 2 | 0.07 ng L−1 | 0.245 ng L−1 |
| Er 2 | 0.03 ng L−1 | 0.105 ng L−1 | Sr 1 | 0.011 mg L−1 | 0.0385 mg L−1 |
| Eu 2 | 0.03 ng L−1 | 0.105 ng L−1 | Ta 2 | 1.6 ng L−1 | 5.6 ng L−1 |
| Fe 1 | 1.6 μg L−1 | 5.6 μg L−1 | Tb 2 | 0.1 ng L−1 | 0.35 ng L−1 |
| Gd 2 | 0.3 ng L−1 | 1.05 ng L−1 | Th 2 | 0.05 ng L−1 | 0.175 ng L−1 |
| Hf 2 | 2.5 ng L−1 | 8.75 ng L−1 | Ti 2 | 0.013 μg L−1 | 0.0455 μg L−1 |
| Ho 2 | 0.1 ng L−1 | 0.35 ng L−1 | Tm 2 | 0.1 ng L−1 | 0.35 ng L−1 |
| K 1 | 8.9 μg L−1 | 31.15 μg L−1 | U 2 | 0.03 ng L−1 | 0.105 ng L−1 |
| La 2 | 0.6 ng L−1 | 2.1 ng L−1 | V 2 | 0.038 μg L−1 | 0.133 μg L−1 |
| Li 1 | 0.6 μg L−1 | 2.1 μg L−1 | W 2 | 3.2 ng L−1 | 11.2 ng L−1 |
| Lu 2 | 0.03 ng L−1 | 0.105 ng L−1 | Y 2 | 1.1 ng L−1 | 3.85 ng L−1 |
| Mg 1 | 3.9 μg L−1 | 13.65 μg L−1 | Yb 2 | 0.02 ng L−1 | 0.07 ng L−1 |
| Mn 1 | 0.3 μg L−1 | 1.05 μg L−1 | Zn 1 | 4.7 μg L−1 | 16.45 μg L−1 |
| Mo 2 | 94.8 ng L−1 | 331.8 ng L−1 | Zr 2 | 4.9 ng L−1 | 17.15 ng L−1 |
1 determined by ICP-OES. 2 determined by ICP-MS.
Table 2.
Concentrations of macro- and microelements in seeds and in the soil of origin.
| Sample | Na tot. [mg Kg−1] |
K tot. [mg Kg−1] |
Mg tot. [mg Kg−1] |
Ca tot. [mg Kg−1] |
P tot. [mg Kg−1] |
Fe tot. [mg Kg−1] |
Mn tot. [mg Kg−1] |
Cu tot. [mg Kg−1] |
Zn tot. [mg Kg−1] |
|---|---|---|---|---|---|---|---|---|---|
| soil | 626 | 5676 | 6189 | 5987 | 910 | 24261 | 439 | 20.2 | 48.8 |
| seeds Rosa Marchetti | 122 | 2297 | 1131 | 343 | 3113 | 9.59 | 62.3 | 1.65 | 8.41 |
| seeds Bertone | 154 | 2719 | 1444 | 351 | 4398 | 18.9 | 74.8 | 2.26 | 11.7 |
| seeds Dellarole | 122 | 2452 | 1195 | 334 | 3418 | 12.8 | 51.7 | 1.48 | 8.90 |
| seeds Chinese Originario | 73.2 | 1971 | 940 | 363 | 2481 | 26.9 | 80.3 | 2.08 | 6.65 |
Table 3.
L values in the comparisons between soil and seeds.
| Seeds | Total L | L without Eu |
|---|---|---|
| seeds Rosa Marchetti/soil | 2.63 | 1.33 |
| seeds Bertone/soil | 2.68 | 1.44 |
| seeds Dellarole/soil | 2.89 | 1.66 |
| seeds Chinese Originario/soil | 2.45 | 1.35 |
Table 4.
Concentrations of macro- and microelements in seeds, brown rice and white rice of the varieties considered.
Table 4.
Concentrations of macro- and microelements in seeds, brown rice and white rice of the varieties considered.
| Sample | Na tot. [mg Kg−1] |
K tot. [mg Kg−1] |
Mg tot. [mg Kg−1] |
Ca tot. [mg Kg−1] |
P tot. [mg Kg−1] |
Fe tot. [mg Kg−1] |
Mn tot. [mg Kg−1] |
Cu tot. [mg Kg−1] |
Zn tot. [mg Kg−1] |
|---|---|---|---|---|---|---|---|---|---|
| soil | 626 | 5676 | 6189 | 5987 | 910 | 24261 | 439 | 20.2 | 48.8 |
| seeds Rosa Marchetti | 122 | 2297 | 1131 | 343 | 3113 | 9.59 | 62.3 | 1.65 | 8.41 |
| seeds Bertone | 154 | 2719 | 1444 | 351 | 4398 | 18.9 | 74.8 | 2.26 | 11.7 |
| seeds Dellarole | 122 | 2452 | 1195 | 334 | 3418 | 12.8 | 51.7 | 1.48 | 8.90 |
| seeds Chinese Originario | 73.2 | 1971 | 940 | 363 | 2481 | 26.9 | 80.3 | 2.08 | 6.65 |
| brown rice Rosa Marchetti | 70.7 | 1107 | 276 | 54.6 | 838 | 8.59 | 19.1 | 1.56 | 6.55 |
| brown rice Bertone | 83.0 | 802 | 449 | 69.6 | 1274 | 8.03 | 16.2 | 1.97 | 5.74 |
| brown rice Dellarole | 60.9 | 585 | 366 | 60.3 | 1053 | 5.81 | 11.6 | 1.37 | 3.82 |
| brown rice Chinese Originario | 58.8 | 1024 | 360 | 56.2 | 1066 | 7.36 | 27.0 | 1.99 | 6.11 |
| white rice Rosa Marchetti | 94.2 | 527 | 238 | 52.5 | 695 | 6.17 | 5.60 | 1.02 | 4.44 |
| white rice Bertone | 123 | 1133 | 448 | 76.9 | 1335 | 8.65 | 11.5 | 2.30 | 7.18 |
| white rice Dellarole | 77.5 | 720 | 265 | 65.0 | 896 | 4.40 | 8.97 | 1.18 | 6.42 |
| white rice Chinese Originario | 57.7 | 671 | 248 | 58.8 | 791 | 3.82 | 10.4 | 1.80 | 5.84 |
Table 5.
L values in the comparisons between soil and rice (Rosa Marchetti chain).
| Comparisons | Total L | L without Eu |
|---|---|---|
| seeds/soil | 2.63 | 1.33 |
| brown rice/soil | 4.00 | 2.69 |
| white rice/soil | 3.97 | 2.58 |
Table 6.
L values in the comparisons between soil and rice (Bertone chain).
| Comparisons | Total L | L without Eu |
|---|---|---|
| seeds/soil | 2.67 | 1.44 |
| brown rice/soil | 4.30 | 2.98 |
| white rice/soil | 4.65 | 3.44 |
Table 7.
L values in the comparisons between soil and rice (Dellarole chain).
| Comparisons | Total L | L without Eu |
|---|---|---|
| seeds/soil | 2.90 | 1.66 |
| brown rice/soil | 4.46 | 3.12 |
| white rice/soil | 4.33 | 3.05 |
Table 8.
L values in the comparisons between soil and rice (Chinese Originario chain).
| Comparisons | Total L | L without Eu |
|---|---|---|
| seeds/soil | 2.45 | 1.35 |
| brown rice/soil | 4.24 | 2.95 |
| white rice/soil | 3.69 | 2.26 |
Table 9.
L values in the comparisons between soil and rice varieties.
| Comparisons | Rosa Marchetti | Bertone | Dellarole | Chinese Originario |
|---|---|---|---|---|
| soil | 1.33 | 1.44 | 1.66 | 1.35 |
| brown rice | 2.69 | 2.98 | 3.12 | 2.95 |
| white rice | 2.58 | 3.44 | 3.05 | 2.26 |
Table 10.
Concentrations of macro- and microelements in other cereal crops and in processed products.
Table 10.
Concentrations of macro- and microelements in other cereal crops and in processed products.
| Sample | Na tot. [mg Kg−1] |
K tot. [mg Kg−1] |
Mg tot. [mg Kg−1] |
Ca tot. [mg Kg−1] |
P tot. [mg Kg−1] |
Fe tot. [mg Kg−1] |
Mn tot. [mg Kg−1] |
Cu tot. [mg Kg−1] |
Zn tot. [mg Kg−1] |
|---|---|---|---|---|---|---|---|---|---|
| oats | 101 | 1138 | 566 | 218 | 1941 | 17.4 | 20.8 | 1.38 | 4.51 |
| millet | 141 | 1045 | 655 | 85.7 | 1926 | 9.35 | 10.6 | 1.94 | 4.96 |
| rice (Rosa Marchetti chain) | 94.2 | 527 | 238 | 52.5 | 695 | 6.17 | 5.60 | 1.02 | 4.44 |
| rice pasta | 182 | 1488 | 983 | 133 | 2869 | 15.7 | 26.4 | 3.20 | 11.2 |
Table 11.
L values in the comparisons between soil and cereals grown on the same soil.
| Cereals | Total L | L without Eu |
|---|---|---|
| oats/soil | 3.40 | 2.31 |
| millet/soil | 3.42 | 2.23 |
| Rosa Marchetti rice/soil | 3.97 | 2.58 |
Table 12.
L values in the comparisons between soil, rise (Rosa Marchetti) and rice pasta.
| Comparisons | Total L | L without Eu |
|---|---|---|
| seeds/soil | 2.63 | 1.33 |
| brown rice/soil | 4.00 | 2.69 |
| white rice/soil | 3.97 | 2.58 |
| rice pasta/soil | 3.88 | 2.65 |
Table 13.
and DRY2 chains.
| Sample | Na tot. [mg Kg−1] |
K tot. [mg Kg−1] |
Mg tot. [mg Kg−1] |
Ca tot. [mg Kg−1] |
P tot. [mg Kg−1] |
Fe tot. [mg Kg−1] |
Mn tot. [mg Kg−1] |
Cu tot. [mg Kg−1] |
Zn tot. [mg Kg−1] |
|---|---|---|---|---|---|---|---|---|---|
| roots BIO | 215 | 1347 | 915 | 3153 | 2996 | 25175 | 89.1 | 66.9 | 101 |
| roots TRAD | 290 | 359 | 1136 | 2999 | 3442 | 42576 | 103 | 138 | 108 |
| roots DRY1 | 255 | 2133 | 1601 | 5116 | 4800 | 55244 | 473 | 107 | 137 |
| roots DRY2 | 716 | 1155 | 1452 | 4015 | 3899 | 44885 | 301 | 124 | 159 |
| straw BIO | 480 | 5915 | 794 | 11878 | 2817 | 629 | 1183 | 13.9 | 171 |
| straw TRAD | 958 | 14981 | 1231 | 4645 | 2238 | 511 | 362 | 30.4 | 120 |
| straw DRY1 | 641 | 11939 | 1140 | 4280 | 731 | 510 | 687 | 24.3 | 150 |
| straw DRY2 | 741 | 36887 | 1295 | 7953 | 2468 | 298 | 1069 | 14.2 | 123 |
| husks BIO | 87.4 | 2311 | 361 | 1959 | 2891 | 220 | 218 | 30.2 | 127 |
| husks TRAD | 79.9 | 2096 | 549 | 2471 | 1246 | 106 | 174 | 109 | 142 |
| husks DRY1 | 99.2 | 3314 | 466 | 1677 | 2857 | 114 | 179 | 35.6 | 166 |
| husks DRY2 | 78.6 | 2253 | 496 | 2067 | 1205 | 80.4 | 264 | 17.8 | 86.8 |
| rice BIO | 22.0 | 509 | 274 | 339 | 1149 | 28.6 | 74.7 | 13.3 | 73.1 |
| rice TRAD | 39.4 | 937 | 564 | 409 | 1695 | 52.1 | 50.8 | 11.8 | 117 |
| rice DRY1 | 32.7 | 1997 | 1316 | 777 | 2993 | 40.8 | 29.8 | 24.6 | 98.5 |
| rice DRY2 | 16.1 | 569 | 291 | 382 | 1257 | 29.9 | 50.3 | 17.6 | 89.9 |
Table 14.
L values in the comparisons among the matrices of the BIO chain.
| Comparisons | Total L | L without Eu |
|---|---|---|
| roots BIO/soil | 3.02 | 2.77 |
| straw BIO/soil | 1.88 | 1.73 |
| husks BIO/soil | 4.71 | 3.41 |
| brown rice BIO/soil | 3.94 | 3.90 |
| white rice BIO/soil | 8.72 | 8.13 |
Table 15.
L values in the comparisons among the matrices of the TRAD chain.
| Comparisons | Total L | L without Eu |
|---|---|---|
| roots TRAD/soil | 2.20 | 2.04 |
| straw TRAD/soil | 1.27 | 1.27 |
| husks TRAD/soil | 0.80 | 0.73 |
| brown rice TRAD/soil | 4.10 | 3.92 |
| white rice TRAD/soil | 5.47 | 5.29 |
Table 16.
L values in the comparisons among the matrices of the DRY1 chain.
| Comparisons | Total L | L without Eu |
|---|---|---|
| roots DRY1/soil | 2.55 | 2.31 |
| straw DRY1/soil | 1.33 | 1.25 |
| husks DRY1/soil | 1.61 | 1.58 |
| brown rice DRY1/soil | 3.71 | 3.70 |
Table 17.
chain.
| Comparisons | Total L | L without Eu |
|---|---|---|
| roots DRY2/soil | 0.93 | 0.86 |
| straw DRY2/soil | 2.45 | 2.32 |
| husks DRY2/soil | 1.47 | 1.40 |
| brown rice DRY2/soil | 2.66 | 2.58 |
| white rice DRY2/soil | 6.68 | 6.32 |
Table 18.
and DRY2 chains.
| Sample | L value BIO | L value TRAD | L value DRY1 | L value DRY2 |
|---|---|---|---|---|
| roots | 2.77 | 2.04 | 2.31 | 0.86 |
| straw | 1.73 | 1.27 | 1.25 | 2.32 |
| husks | 3.41 | 0.73 | 1.58 | 1.40 |
| brown rice | 3.9 | 3.92 | 3.7 | 2.58 |
| white rice | 8.13 | 5.29 | - | 6.32 |
Disclaimer/Publisher’s Note: The statements, opinions and data contained in all publications are solely those of the individual author(s) and contributor(s) and not of MDPI and/or the editor(s). MDPI and/or the editor(s) disclaim responsibility for any injury to people or property resulting from any ideas, methods, instructions or products referred to in the content. |
© 2026 by the authors. Licensee MDPI, Basel, Switzerland. This article is an open access article distributed under the terms and conditions of the Creative Commons Attribution (CC BY) license (http://creativecommons.org/licenses/by/4.0/).
Copyright: This open access article is published under a Creative Commons CC BY 4.0 license, which permit the free download, distribution, and reuse, provided that the author and preprint are cited in any reuse.