
Submitted:
13 November 2026
Posted:
16 November 2026
You are already at the latest version
Abstract
The normalized frequency V of a step-index fiber fixes how many modes it guides, where it reaches cutoff and how tightly the field is confined. Its role in choosing an operating wavelength is nevertheless often misread, because V simply scales as 1/λ. We start from Maxwell’s equations to obtain the guided-mode eigenvalue problem and combine it, in MATLAB, with a Sellmeier description of silica, an exact LP-mode count and illustrative loss and dispersion models. For n1 = 1.48 and n2 = 1.46, V falls between 850 and 1550 nm from 7.17 to 3.93 for a core radius of 4 µm and from 8.96 to 4.91 for 5 µm. Both cores guide 12 modes at 1550 nm and neither is single-mode (cutoff wavelengths 2.53 and 3.17 µm). The asymptotic estimate V2/2 undercounts the modes at small V (8 against 12). The largest single-mode core radius at 1550 nm is 2.5 µm for Δ = 1.34 % but 4.8 µm for Δ = 0.36 %. A Sellmeier-based standard fiber (a = 4.1 µm, Δn = 0.0052) has a cutoff wavelength of 1315 nm, zero dispersion at 1295 nm, D = 17.2 ps nm−1 km−1 and a mode-field diameter of 10.2 µm at 1550 nm, and changing the core radius and index step moves the zero-dispersion wavelength between about 1290 and 1440 nm. Rayleigh scattering is 11 times stronger at 850 nm than at 1550 nm, and a Ge-free pure-silica core lowers the loss near 1550 nm still further. Taken together, V, loss and dispersion, and not V alone, single out the 1550 nm region as the preferred window. The results are also set against recent record losses of 0.1397 dB/km for solid silica and 0.091 dB/km for hollow-core fiber.
Keywords:
single-mode fiber
; normalized frequency
; cutoff wavelength
; LP modes
; step-index fiber
; attenuation
; dispersion
1. Introduction
The use of light for communication dates back to Bell’s photophone of 1880. Practical optical-fiber communication started with the 1966 proposal of Kao and Hockham that glass fibers could carry signals if their attenuation fell below about 20 dB/km [1], a target reached in 1970 by Kapron, Keck and Maurer [2]. Optical fibers were envisioned as optical elements in the early 1960s and developed into practical low-loss waveguides in the early 1970s [3,4,5,6]. They now carry most long-distance traffic, because of their very large bandwidth, immunity to electromagnetic interference and low maintenance cost compared with copper [7,8].
Snitzer [9] first analyzed the guided modes of a cylindrical dielectric waveguide at optical frequencies. Gloge [10] later showed that, under weak guidance, the vector problem reduces to scalar linearly polarized (LP) modes, which remain the basis for fiber design [11,12]. In this description, a step-index fiber is characterized by its core radius a, the core and cladding refractive indices n1 and n2, and the free-space wavelength λ, which combine into a single dimensionless quantity, the normalized frequency V. V governs the number of guided modes, the modal field distribution, the mode-field diameter and bending sensitivity [13,14,15]. Choosing the operating wavelength relative to the fiber’s cutoff is therefore a basic design decision.
Attenuation and dispersion remain the principal limits on transmission distance and data rate [8,16]. Capacity limits imposed by fiber nonlinearity and noise [17] have also pushed research towards new fiber structures, such as multimode and multicore fibers for space-division multiplexing [18], photonic crystal fibers [6,19] and antiresonant hollow-core fibers [20]. At the same time, conventional solid silica fibers have continued to improve: pure-silica-core fibers with low fictive temperature have reached 0.1419 dB/km at 1560 nm [21,22], and 0.1397 dB/km at 1566 nm [23], and a hollow-core fiber has reported 0.091 dB/km at 1550 nm [24]. Reviews of silica fiber loss reduction are given in [25].
Previous studies on optical fibers have reported the normalized frequency as a function of wavelength and then identify the wavelength of smallest V as the optimum. The argument is incomplete because, for fixed core radius (a) and refractive indices (n1 and n2), the normalized frequency V varies inversely with wavelength. Consequently, its minimum necessarily occurs at the longest wavelength (λ) in the selected range, irrespective of the underlying physical behaviour. In practice, the selection of the 1550 nm operating window depends on the combined effects of modal behaviour, wavelength-dependent glass attenuation due to Rayleigh scattering, OH− absorption and intrinsic infrared absorption, and chromatic dispersion [26,27]. A materials-based analysis that integrates these three factors, validates the guided-mode count, and establishes clear design criteria can provide a useful foundation for teaching and preliminary optical-fiber design.
This study examines the modal characteristics and wavelength-dependent performance of step-index optical fibers. It derives the guided-mode eigenvalue equations and establishes an exact LP-mode counting procedure. The effects of wavelength and refractive-index contrast on the normalized frequency V, cutoff wavelength, and guided-mode content are then evaluated for four representative core radii. The analysis also incorporates the wavelength dependence of the glass refractive index through the Sellmeier equation, together with models for chromatic dispersion and optical attenuation. These results are considered alongside recent developments in fiber materials to identify a suitable operating wavelength and establish practical guidelines for fiber design.
The main contributions of this work are fourfold. First, an exact LP-mode count is used to assess the limitations of the commonly applied V2/2 approximation, particularly at low normalized frequencies. Second, a design chart is developed to relate the maximum core radius for single-mode operation to wavelength and refractive-index contrast. Third, a Sellmeier-based model is used to evaluate standard-fiber characteristics, including cutoff wavelength, mode-field diameter, and chromatic dispersion. Finally, an illustrative attenuation model is employed to distinguish the contributions of Rayleigh scattering, OH− absorption, and infrared absorption across the principal optical transmission wavelength bands. Together, these analyses provide a practical framework for understanding the relationships between fiber geometry, material properties, and optical performance.
2. Theory and Materials Background
2.1. Guidance by Total Internal Reflection
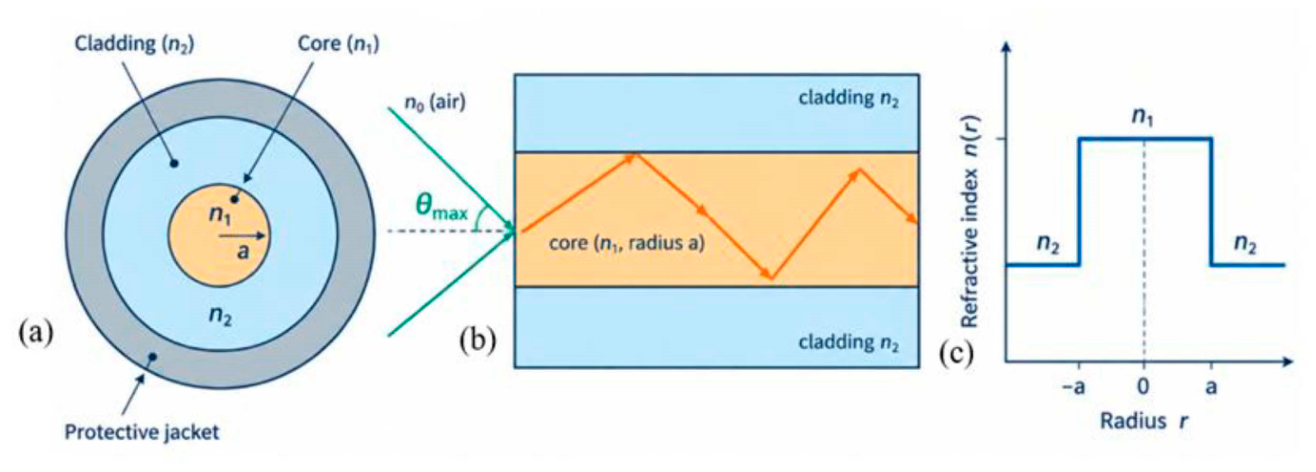
An optical fiber consists of a core, a cladding of slightly lower refractive index, and a protective coating (Scheme 1a) [28,29]. For a core of index n1 surrounded by cladding of index n2 < n1, rays striking the interface at angles larger than the critical angle θC = sin−1(n2/n1) are totally reflected and guided (Scheme 1b) [30,31]. The light-gathering ability is expressed by the numerical aperture NA = n0 sin θmax = √ (n12 − n22), where n0 is the index of the surrounding medium, and the fractional index difference is Δ = (n12 − n22)/(2n12) ≈ (n1 − n2)/n1. In a step-index fiber, the refractive index changes abruptly at the core radius r=a (Scheme 1c), separating the higher-index core from the lower-index cladding. This index profile determines the conditions for light confinement and the modal properties of the fiber.
Scheme 1.
Step-index optical fiber: (a) cross-section; (b) guided ray and acceptance cone; (c) refractive-index profile n(r).
Scheme 1.
Step-index optical fiber: (a) cross-section; (b) guided ray and acceptance cone; (c) refractive-index profile n(r).
2.2. Wave Equation and Field Solutions
In the weakly guiding approximation [10], each Cartesian field component obeys the scalar Helmholtz equation:
∇2ψ + n2k02ψ = 0, with k0 = ω/c = 2π/λ
Seeking solutions of the form ψ = R(r)Φ(φ)Z(z), with Z(z) ∝ exp(−jβz) and Φ(φ) ∝ exp(jlφ), the longitudinal field components satisfy the radial equation,
where β is the propagation constant and l = 0, 1, 2, … is the azimuthal mode number. Inside the core (r < a), n12k02 − β2 = κ2 > 0 and the regular solution is the Bessel function of the first kind, R(r) ∝ Jl(κr). In the cladding (r > a), β2 − n22k02 = γ2 > 0 and the solution that decays with radius is the modified Bessel function Kl(γr), which for large argument behaves as Kl(γr) ∼ exp(−γr)/√(2γr) (an evanescent field). The solutions Il(γr) and Yl(κr) are rejected because they diverge at large r and at r = 0, respectively. Thus,
d2R/dr2 + (1/r) dR/dr + (n2k02 − β2 − l2/r2) R = 0
Ez = A Jl(κr) exp{j(lφ − βz)}, Hz = B Jl(κr) exp{j(lφ − βz)} (r < a)
Ez = C Kl(γr) exp{j(lφ − βz)}, Hz = D Kl(γr) exp{j(lφ − βz)} (r > a)
The transverse components Er, Eφ, Hr, Hφ follow from the curl equations ∇×E = −jωμH and ∇×H = jωεE, with ∂/∂z = −jβ; The radial electric-field component is expressed as,
with ni = n1 in the core and n2 in the cladding.
Er = [−j/(k02ni2 − β2)] [β ∂Ez/∂r + (μω/r) ∂Hz/∂φ]
2.3. Characteristic Equation and the V-Parameter
Continuity of the tangential components Ez, Eφ, Hz and Hφ at r = a yields a homogeneous linear system for the constants A, B, C and D. A non-trivial solution exists only if its determinant vanishes, giving the characteristic equation of the step-index fiber:
where U = κa and W = γa.
(βl/(k0n1))2 (1/U2 + 1/W2)2 = [Jl′(U)/(U Jl(U)) + Kl′(W)/(W Kl(W))] × [Jl′(U)/(U Jl(U)) + (n2/n1)2 Kl′(W)/(W Kl(W))]
The two radial parameters are linked by U2 + W2 = V2, with the normalized frequency as,
V = (2πa/λ) √ (n12 − n22) = (2πa/λ) NA
2.4. LP Modes, Cutoff and Mode Counting
For Δ ≪ 1 the vector modes combine into nearly degenerate linearly polarized modes LPlm [10], and the characteristic equation reduces to:
where b is the normalized propagation constant and the m-th root for a given l defines the mode LPlm. A mode is guided when W > 0; at cutoff W → 0 and the cutoff value of V is,
where jν,m is the mth positive zero of Jν. The mode LP01 has no cutoff, and LP11 is the first higher-order mode, at V = 2.405. LP0m modes are twofold degenerate (two polarizations) and LPlm modes with l ≥ 1 are fourfold degenerate (two polarizations and two orientations). The total number of guided modes at a given V is therefore,
where Θ is the unit step function. Equation (11) is evaluated exactly in this work; the asymptotic form V2/2 is used only for comparison.
U Jl−1(U)/Jl(U) = −W Kl−1(W)/Kl(W), b = 1 − U2/V2 = W2/V2,
Vc(l,m) = jl−1,m, (l ≥ 1); Vc(0,m) = j1,m−1, with j1,0 = 0,
M(V) = Σl,m gl Θ(V − Vc(l,m)), g0 = 2, gl≥1 = 4, M ≈ V2/2 for V≫1,
2.5. Loss and Dispersion Mechanisms
Attenuation in silica fibers, α = (10/L) log10(Pin/Pout) dB/km, arises from Rayleigh scattering (which falls as λ−4 and dominates at short wavelengths), absorption by residual OH− ions (notably near 1.4 µm), absorption by transition-metal impurities, and infrared (multiphoton) absorption beyond about 1.6 µm [15,32]. Radiation and bending losses add to these [31,33]; bend-insensitive designs are standardized in [34]. Dispersion consists of material dispersion, δ(T/L) = −MΔλ with M = (λ/c) d2n/dλ2 (derived in Supplementary A), waveguide dispersion [35], and, in multimode fibers, intermodal dispersion [16,36].
2.6. Materials Considerations
The refractive indices that enter V are material properties and depend on wavelength. For fused silica the index is described accurately by the three-term Sellmeier equation [37]
n2(λ) = 1 + Σi₌13 Bi λ2 / (λ2 − Ci)
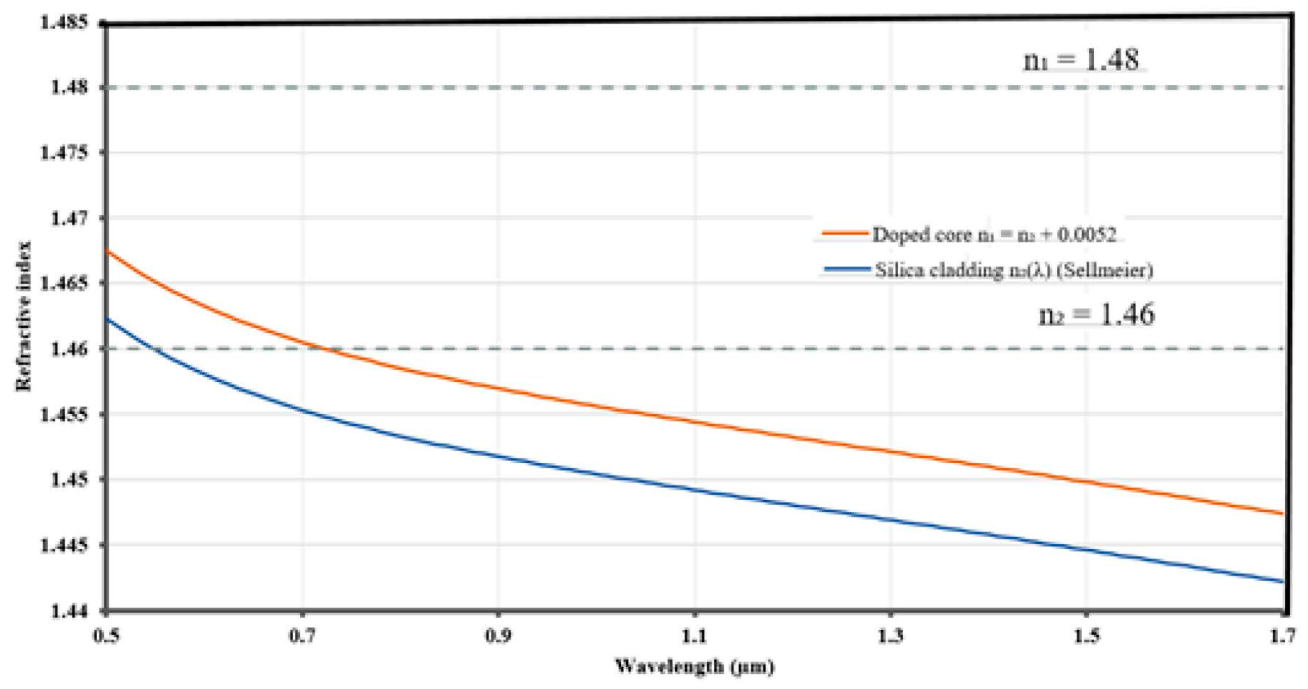
With B1, B2, B3 = 0.6961663, 0.4079426, 0.8974794 and C1, C2, C3 = (0.0684043)2, (0.1162414)2, (9.896161)2 µm2. This gives n = 1.4599 at 550 nm, 1.4525 at 850 nm, 1.4468 at 1310 nm, and 1.4440 at 1550 nm (Figure 1). The cladding index n2 = 1.46 used in the original calculation therefore corresponds to silica in the green, not to the 850–1550 nm band, and the index step of 0.02 (Δ = 1.34 %) is almost four times that of standard single-mode fiber (Δ ≈ 0.35 %).
In practice the core–cladding contrast is produced by doping GeO2, P2O5 and Al2O3 raise the index, whereas fluorine and B2O3 lower it; the index step is of the order of 10−3 per mole percent of GeO2, and composition-dependent Sellmeier coefficients are available for GeO2–SiO2 glasses [38]. Dopants also change the optical loss. Rayleigh scattering arises from frozen-in density and composition fluctuations and varies as αR = CR/λ4, with CR typically 0.7–0.9 dB km−1 µm4 for silica-based fibers [26]. Germania adds concentration fluctuations, so a Ge-free pure-silica core with a fluorine-doped cladding and a low fictive temperature (the temperature at which the glass structure is frozen) gives the lowest scattering. This approach produced the records quoted above [21,22,23], and loss-reduction history is reviewed in [25]. The long-wavelength limit is set by multiphonon (infrared) absorption of the Si–O network, the 1383 nm OH− overtone is removed by dehydration, and the minimum of the sum lies near 1.55 µm [26,39]. Because silica combines a loss minimum at 1.55 µm with mature doping and drawing technology, the discussion below concentrates on silica fibers; the hollow-core fiber of [24] is a notable exception in which the guided light travels almost entirely in air and Rayleigh scattering in glass is largely avoided.

Table 1.
Comparison of representative optical fiber materials, guidance mechanisms, attenuation characteristics, and principal loss mechanisms.
Table 1.
Comparison of representative optical fiber materials, guidance mechanisms, attenuation characteristics, and principal loss mechanisms.
| Fiber type | Material and guidance structure | Approximate attenuation / operating window | Dominant limitation | Refs. |
| Ge-doped silica | Solid core; n1 − n2 ≈ 0.005; Δ ≈ 0.35 | ≈ 0.18 dB/km near 1550 nm (typical commercial fiber) | Rayleigh scattering (dopant-enhanced) | [26,27,39] |
| Pure-silica core | Ge-free silica core; fluorine-doped cladding | 0.1419 dB/km at 1560 nm; 0.1397 dB/km at 1566 nm | Residual Rayleigh scattering, IR edge | [21,22,23,40] |
| Hollow-core anti-resonant fiber (DNANF) | Air core; guidance by thin glass membranes | 0.091 dB/km at 1550 nm; below 0.2 dB/km over 66 THz | Surface scattering, micro bending | [20,24] |
| Fluoride glass (e.g. ZBLAN) | Transparent to about 4 µm | Intrinsic minimum predicted far below silica at 2–3 µm; extrinsic loss dominates in practice | Impurities, crystallization, fragility | [41] |
| Chalcogenide glass (As–S, As–Se) | n ≈ 2.4 and higher; mid-IR to 6 µm and beyond | Typically dB/m rather than dB/km | Impurity bands, scattering | [41] |
| Polymer optical fiber (PMMA; per fluorinated) | Large core (0.5–1 mm); step or graded index | Of the order of 100 dB/km at 650 nm (PMMA); tens of dB/km at 850–1300 nm (perfluorinated) | C–H absorption, scattering | [42,43] |
3. Methods
All calculations were scripted in MATLAB [44] (Supplementary B). The computational workflow is outlined in Scheme 2, and the analysis was conducted using three modelling approaches.
Model A: constant indices (as in the original study)
Equation (7) was evaluated for λ = 850–1550 nm (701 points) with n1 = 1.48 and n2 = 1.46 (NA = 0.2425; Δ = 0.0134) and core radii a = 4, 5, 25 and 50 µm. Cutoff wavelengths follow from Equation (8). The exact LP-mode count was obtained from Equations (10) and (11) using the zeros of Jν, and compared with M ≈ V2/2.
LP eigenvalue solutions
For each l, the roots U of Equation(9), written in the continuous form UJl−1(U) Kl(W) + W Kl−1(W) Jl(U) = 0 with W = √(V2 − U2), were located by sign changes on a grid of 4000 points in 0 < U < V and refined with Brent’s method; b = 1 − U2/V2 was computed for 0.6 ≤ V ≤ 8.
Model B: Sellmeier-based single-mode fiber
To include the material dispersion of the glass, the cladding index n2(λ) was taken from the silica Sellmeier equation and the core index as n1(λ) = n2(λ) + Δn with a wavelength-independent step Δn = 0.0052 (Δ ≈ 0.36 % at 1550 nm) and a = 4.1 µm, which represent a standard Ge-doped single-mode fiber. The dopant-induced change of dispersion [38] is neglected. The mode-field diameter was estimated with the Marcuse approximation [45],
w/a = 0.65 + 1.619 V−3/2 + 2.879 V−6, MFD = 2w
Chromatic dispersion D = Dmat + Dwg was computed with
valid for 1.5 ≤ V ≤ 2.5, where the second expression is the standard empirical fit to Vd2(Vb)/dV2 for a step-index fiber [26,35]; d2n/dλ2 was obtained analytically from the Sellmeier equation, and Dwg is used only where V lies in its validity range. The influence of the core radius and index step was studied by repeating Model B for a = 2.6–6.0 µm and Δn = 0.0040, 0.0052 and 0.0070.
Dmat = − (λ/c) d2n/dλ2, Dwg ≈ − (n2Δ/(cλ)) (0.080 + 0.549 (2.834 − V)2)
Model C: Illustrative attenuation model
Loss was modelled as the sum of Rayleigh scattering, the infrared absorption edge, the OH− peak and a wavelength-independent imperfection term,
with λ in µm and α in dB/km, AIR = 7.81×10¹¹ dB/km and BIR = 48.48 µm (commonly quoted values for silica [26,39]). Two material cases were considered: a conventional Ge-doped core (CR = 0.85 dB km−1 µm4, αOH = 0.35 dB/km, α0 = 0.010 dB/km) and a pure-silica core with low fictive temperature and dehydrated glass (CR = 0.70, αOH = 0, α0 = 0.003). These parameters were chosen to reproduce typical commercial and record values near 1550 nm [21,23,26] and are illustrative, not measured data. Band-averaged losses were computed for the conventional ITU-T bands O (1260–1360 nm), E (1360–1460 nm), S (1460–1530 nm), C (1530–1565 nm), L (1565–1625 nm) and U (1625–1675 nm) [27].
α(λ) = CR/λ4 + AIR exp(−BIR/λ) + αOH exp(−(λ − 1.383)2/(2 × 0.0212)) + α0
Design chart
The largest core radius that remains single-mode, amax = 2.405 λ/(2π NA), was computed for several index contrasts using NA = nref √(2Δ) with nref = 1.444, the silica index at 1550 nm.
Validation
The Sellmeier model reproduces the silica index of 1.4440 at 1550 nm [37]. The LP01 solution of Equation (9) gives b = 0.416 at V = 2.0 and b = 0.531 at V = 2.405, in agreement with the widely used fit b ≈ (1.1428 − 0.996/V)2 [10] (0.416 and 0.531). The LP11 cutoff from Eq. (4) is 2.405, and the exact mode count of Eq. (5) takes the values 2, 6, 12 and 16 for 0 < V < 2.405, 2.405 < V < 3.832, 3.832 < V < 5.136 and 5.136 < V < 5.520, as expected from the LP cutoffs and degeneracies. The standard-fiber model reproduces a dispersion of about 17 ps nm−1 km−1 at 1550 nm, consistent with the values quoted for standard single-mode fiber [27].
4. Results and Discussion
4.1. Variation of V with Wavelength
In all four cases (Figure 2), V decreases smoothly and monotonically with increasing wavelength, following the 1/λ dependence of Eq. (1). Because V ∝ 1/λ at fixed a, n1 and n2, this decrease is a consequence of the definition and does not by itself reveal a physical optimum; the minimum V in any chosen range always lies at its longest wavelength. Table 2 lists the end-point values and the derived quantities. The end-points for a = 4 µm (V ≈ 7.2 at 850 nm and ≈ 3.9 at 1550 nm) agree with the values read from the original plots, and the other radii scale linearly with a.
4.2. LP-Mode Structure and Exact Mode Count
The solutions of Equation (9) give the normalized propagation constant b(V) of each LP mode (Figure 3a). The fundamental LP01 mode exists at all V, while LP11 appears at V = 2.405, LP21 and LP02 at 3.832, LP31 at 5.136, and LP12 at 5.520. In the scalar approximation, LP21 and LP02 share the same cutoff. The exact mode count from Equation (5) is a staircase that follows V2/2 on average (Figure 3b), but at small V the two differ appreciably, as Table 2 shows. At 1550 nm the 4 µm core (V = 3.93) lies just above the LP21/LP02 cutoff and guides 12 modes, not the 8 suggested by V2/2, and at 850 nm the same core guides 30 modes rather than 26. For the 25 and 50 µm cores the asymptotic estimate is within 5 % and 1.5 %, respectively. The exact count is thus recommended whenever V is below about 20.
4.3. Single-Mode Condition
For a = 4 µm and 5 µm, V remains above 2.405 over the entire band, so these fibers are not strictly single-mode between 850 and 1550 nm; they become single-mode only at wavelengths longer than 2.53 µm and 3.17 µm, respectively. At 1550 nm the 4 µm fiber has the smallest V of the four cases and is therefore the closest to single-mode operation. For the same wavelength and index contrast, strictly single-mode guidance requires a core radius below about 2.5 µm (a ≤ 2.405 λ/(2π NA)), or a smaller index step. The 25 µm and 50 µm fibers are clearly multimode throughout.
4.4. Index Contrast as a Design Variable
The single-mode condition depends on the index contrast as strongly as on the wavelength. Figure 4 shows the largest single-mode core radius for five index contrasts, and Table 3 gives the values at 1550 nm. At the contrast of the original calculation (Δ = 1.34 %) the core must be smaller than about 2.5 µm; the 4 and 5 µm points lie well above that curve. A 4 µm core is single-mode at 1550 nm only if Δ ≲ 0.53 %, and a 5 µm core only if Δ ≲ 0.34 %, which is typical of standard fiber.
4.5. Cutoff and Chromatic Dispersion with a Sellmeier-Based Index
Model B (a = 4.1 µm, Δn = 0.0052) has V = 2.04 at 1550 nm and 2.41 at 1310 nm, so the single-mode cutoff wavelength is λ_c = 1315 nm (Figure 5a). Cabled fibers have a lower effective cutoff, and the G.652 standard specifies a cable cutoff of at most 1260 nm [27]. The mode-field diameter is 8.99 µm at 1310 nm and 10.22 µm at 1550 nm; the value at 1310 nm lies within the 8.6–9.5 µm range specified for standard fiber [27]. The material dispersion changes sign at 1273 nm; adding the negative waveguide dispersion moves the zero of the total dispersion to 1295 nm (Figure 5b), slightly below the 1300–1324 nm range of G.652 because of the idealised step profile and the constant index step. At 1550 nm the model gives D = 17.2 ps nm−1 km−1, of which 21.9 is material and −4.8 is waveguide dispersion.
Table 4.
Calculated properties of the Sellmeier-based single-mode fiber (Model B).
| Quantity | Value |
| V at 1310 nm / 1550 nm | 2.41 / 2.04 |
| Cutoff wavelength λ_c | 1315 nm |
| Mode-field diameter at 1310 nm / 1550 nm | 8.99 µm / 10.22 µm |
| Zero of material dispersion | 1273 nm |
| Zero of total dispersion | 1295 nm |
| D at 1310 nm / 1550 nm | 1.3 / 17.2 ps nm−1 km−1 |
4.6. Tuning the Mode Field and the Zero-Dispersion Wavelength
The core radius and index step shift both the mode field and the zero-dispersion wavelength (Figure 6). At 1550 nm and a = 4.1 µm, raising Δn from 0.0040 to 0.0070 reduces the mode-field diameter from 11.6 µm to 9.1 µm and raises V from 1.79 to 2.37 (Figure 6a). The waveguide contribution is negative, so a smaller core or a larger index step moves the zero of the total dispersion to longer wavelengths (Figure 6b): for Δn = 0.0052, λ0 rises from 1293 nm at a = 4.15 µm to 1415 nm at a = 2.8 µm, and for Δn = 0.0070 it reaches 1442 nm at a = 2.6 µm. A zero-dispersion wavelength of 1310 nm is obtained for a ≈ 4.1, 3.8 and 3.5 µm at Δn = 0.0040, 0.0052 and 0.0070, respectively. This is the basis of dispersion-shifted and dispersion-managed fiber designs: dispersion can be moved toward the loss minimum by increasing the waveguide contribution, at the cost of a smaller mode field and higher bending sensitivity. The curves in Figure 6b are limited to 1.5 ≤ V ≤ 2.5, where the empirical waveguide-dispersion fit is valid; larger shifts require the full vector solution.
4.7. Attenuation and the Choice of Core Material
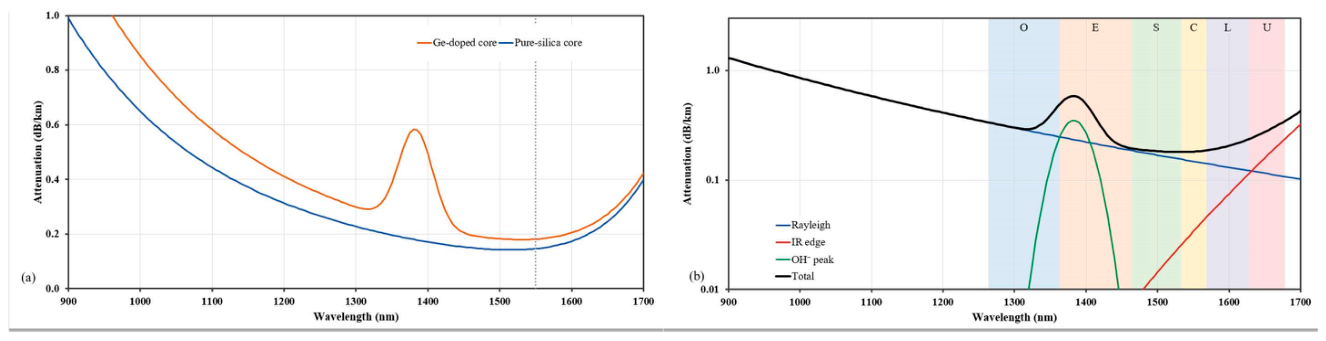
Model C reproduces the well-known loss spectrum of silica (Figure 7a). The Rayleigh term alone is 11 times larger at 850 nm than at 1550 nm, which is why the short-wavelength window is lossy. For the conventional Ge-doped core the loss is 0.30 dB/km at 1310 nm and 0.178 dB/km at 1550 nm, with the minimum at about 1546 nm and an OH− peak of about 0.59 dB/km at 1383 nm. At 1550 nm the loss is made up of 0.147 dB/km Rayleigh scattering, 0.020 dB/km infrared absorption and 0.010 dB/km imperfections; at 1700 nm the infrared edge (0.32 dB/km) dominates (Figure 7b). For the pure-silica core the corresponding values are 0.241 and 0.145 dB/km, with the minimum near 1538 nm. The 18 % lower loss at 1550 nm comes from the lower scattering coefficient and the lower imperfection term of this illustrative case; the OH− band lies outside the 1550 nm window.
Table 5 gives the band-averaged loss of the Ge-doped model. The S, C and L bands have the lowest loss (0.18–0.19 dB/km), the O band is higher because of the λ−4 Rayleigh term (0.33 dB/km), and the E band is dominated by the OH− peak (0.38 dB/km on average) unless low-water-peak glass is used. The U band rises again to 0.26 dB/km because of the infrared edge. The C band, centred near 1550 nm, therefore combines the lowest loss with the widest availability of amplifiers and components, which supports its use as the primary long-haul window.
4.8. Materials Outlook
Recent progress has come mainly from materials and structure rather than from a change of wavelength. By lowering the fictive temperature and removing germania from the core, the record loss of solid silica fiber fell from 0.1419 dB/km at 1560 nm [21,22] to 0.1397 dB/km at 1566 nm [23], and ultra-low-loss pure-silica-core fibers with large effective area are used in submarine systems, where each decibel saved reduces amplifier requirements [40]. Hollow-core anti-resonant fibers go further: 0.091 dB/km at 1550 nm with loss below 0.2 dB/km over 66 THz, compared with about 26 THz for the best solid-core silica fibers [24]. In such fibers almost all of the light travels in air, so V and the silica Sellmeier index no longer describe guidance and the loss limit moves from Rayleigh scattering in glass to surface roughness and micro-bending [20]. For the solid fibers treated here, the trade-off remains the one shown in Figure 4, Figure 5, Figure 6 and Figure 7; a higher index contrast gives tighter confinement and lower bending loss but needs a smaller single-mode core and raises Rayleigh scattering through heavier doping, while a low-contrast, low-dopant design gives lower loss and a larger mode field. Multimode and multicore fibers for space-division multiplexing [18] deliberately operate at large V, so the exact mode counts of Section 4.2 are relevant to their design.
4.9. Practical Design Guidelines
The results translate into simple rules for choosing core radius, index contrast and wavelength for a solid-core silica fiber; the decision sequence is summarized in Scheme 3.
The single-mode condition (Equation (8), Figure 4) is applied first; the cutoff is then compared with the operating window, and dispersion, mode-field diameter, bending loss and the loss budget are checked for the selected material.
Single-mode condition: for a core radius a and wavelength λ, the numerical aperture must satisfy NA ≤ 2.405 λ/(2πa), or equivalently Δ ≤ NA2/(2n2). At 1550 nm with a = 4.1 µm this allows Δ up to about 0.50 %.
Cutoff margin for 1310 nm operation: to keep the fiber cutoff below 1260 nm, the product a·NA must not exceed 0.482 µm; for a = 4.1 µm this means NA ≤ 0.118 (Δ ≤ 0.33 %). This is a conservative fiber-cutoff condition, because the cabled cutoff is lower than the fiber cutoff [27].
Operating V: a V of about 2.0–2.4 at the operating wavelength keeps the fiber single-mode with a mode-field diameter near 9–10 µm; Model B has V = 2.04 and an MFD of 10.2 µm at 1550 nm.
Mode count: for multimode fibres use the exact count of Eq. (5) below V ≈ 20 and V2/2 above it.
Dispersion: to move the zero-dispersion wavelength above 1310 nm, reduce the core radius or raise the index step within the limits of the bending-loss specification (Figure 6b, [33,34]).
Material choice:for the lowest loss at 1550 nm, use the lowest index contrast that still gives acceptable bending loss, minimize germania in the core, and use dehydrated glass so that the OH− peak at 1383 nm does not limit the usable band.
Wavelength: Use 1550 nm when loss is the priority and 1310 nm when chromatic dispersion is the priority; at 850 nm a small core is multimode unless Δ is reduced (Figure 4).
4.10. Limitations
Model A assumes wavelength-independent indices and an ideal step profile. Model B uses the silica Sellmeier index with a constant index step (dopant dispersion is neglected) and an empirical waveguide-dispersion fit valid for 1.5 ≤ V ≤ 2.5. The LP-mode analysis is a weakly guiding approximation and does not resolve the splitting of nearly degenerate vector modes; for the 1.34 % contrast of the original study the approximation is less accurate than for standard fiber. The Model C parameters are illustrative values tuned to typical loss figures and are not measured data. Bending, splicing and micro-bending losses are not modelled. Experimental verification of cutoff wavelength and loss spectra is recommended.
5. Conclusions
This work combined a derivation of the guided-mode problem for a cylindrical step-index fiber with a materials-based calculation of normalized frequency, cutoff, mode content, dispersion and loss, in order to clarify why 1550 nm is the preferred operating window. Starting from Maxwell’s equations, we obtained the characteristic equation, the normalized frequency V = (2πa/λ)√(n12 − n22), the LP eigenvalue equation and the single-mode condition V < 2.405. For n1 = 1.48 and n2 = 1.46, V decreases between 850 and 1550 nm from 7.17 to 3.93 for a 4 µm core, from 8.96 to 4.91 for 5 µm, from 44.8 to 24.6 for 25 µm and from 89.6 to 49.1 for 50 µm. The 4 and 5 µm cores are therefore not strictly single-mode in this band; their single-mode cutoff wavelengths are 2.53 and 3.17 µm. An exact LP-mode count shows that the common estimate V2/2 underestimates the number of guided modes at small V: a 4 µm core at 1550 nm guides 12 modes rather than 8. The estimate becomes accurate to about 1 % only for V of several tens.
The index contrast proved to be as important as the wavelength. At 1550 nm the largest single-mode core radius is 2.5 µm for Δ = 1.34 %, 4.1 µm for Δ = 0.50 % and 4.8 µm for Δ = 0.36 %. A Sellmeier-based model of a standard fiber (a = 4.1 µm, Δn = 0.0052) gives a cutoff wavelength of 1315 nm, zero total dispersion at 1295 nm, a dispersion of 17.2 ps nm−1 km−1 and a mode-field diameter of 10.2 µm at 1550 nm. Changing the core radius and index step moves the zero-dispersion wavelength between about 1290 and 1440 nm, which illustrates how waveguide dispersion can be used in fiber design.
Because V varies as 1/λ, it cannot by itself identify an optimum wavelength; the smallest V always lies at the longest wavelength considered. The preference for 1550 nm follows from combining the reduced modal content with the Rayleigh-limited loss minimum of silica. In the illustrative loss model the band-averaged loss is 0.18 dB/km in the C band, compared with 0.33 dB/km in the O band. Recent records of 0.1397 dB/km for solid silica fiber and 0.091 dB/km for hollow-core fiber show that further improvement is coming from materials and structure rather than from a change of wavelength. Future work should include full vector mode solutions, dopant-dependent Sellmeier coefficients, bending-loss models, and measurements of cutoff wavelength and attenuation to validate the illustrative loss model.
Supplementary Materials
The following supporting information can be downloaded at the website of this paper posted on Preprints.org.
Funding
This research did not receive any specific grant from funding agencies in the public, commercial, or not-for-profit sectors.
Declaration of competing interest
The authors declare that they have no known competing financial interests or personal relationships that could have appeared to influence the work reported in this paper.
Acknowledgments
The authors thank colleagues and family for their support.
Data availability
All results are computed with the MATLAB script in Supplementary B (supplied as fiber-V-parameter_analysis.m) using the parameters stated.
References
- Kao, K.C.; Hockham, G.A. Dielectric-fibre surface waveguides for optical frequencies. Proc. IEE 1966, 113, 1151–1158. [Google Scholar] [CrossRef]
- Kapron, F.P.; Keck, D.B.; Maurer, R.D. Radiation losses in glass optical waveguides. Appl. Phys. Lett. 1970, 17, 423–425. [Google Scholar] [CrossRef]
- . Hecht, City of Light: The Story of Fiber Optics; Oxford University Press: New York, 1999.
- Bass, M. (Ed.) Fiber Optics Handbook: Fiber, Devices, and Systems for Optical Communications; McGraw-Hill/Optical Society of America: New York, 2002. [Google Scholar]
- Li, M.-J.; Nolan, D.A. Optical transmission fiber design evolution. J. Light. Technol. 2008, 26. [Google Scholar] [CrossRef]
- Knight, J.C. Photonic crystal fibres. Nature 2003, 424, 847–851. [Google Scholar] [CrossRef]
- . Kirkland, Light and Optics; Facts on File: New York, 2007.
- Liu, M.M.K. Principles and Applications of Optical Communications; McGraw-Hill: New York, 1996. [Google Scholar]
- Snitzer, E. Cylindrical dielectric waveguide modes. J. Opt. Soc. Am. 1961, 51, 491–498. [Google Scholar] [CrossRef]
- Gloge, D. Weakly guiding fibers. Appl. Opt. 1971, 10, 2252–2258. [Google Scholar] [CrossRef]
- Okamoto, K. Fundamentals of Optical Waveguides, 2nd ed.; Academic Press, 2006. [Google Scholar]
- Snyder, A.W.; Love, J.D. Optical Waveguide Theory; Chapman & Hall: London, 1983. [Google Scholar]
- Ghatak; Sharma, A.; Tewari, R. Understanding Fiber Optics on a PC; Viva Books: New Delhi, 1994. [Google Scholar]
- Thyagarajan, K.; Ghatak, A.K. Fiber Optic Essentials; Wiley: New Jersey, 2007. [Google Scholar]
- Ghatak, K. Thyagarajan, Introduction to Fiber Optics; Cambridge University Press: Cambridge, 1998. [Google Scholar]
- Senior, J.M. Optical Fiber Communications: Principles and Practice; Prentice Hall International: London, 1985. [Google Scholar]
- Essiambre, R.-J.; Kramer, G.; Winzer, P.J.; Foschini, G.J.; Goebel, B. Capacity limits of optical fiber networks. J. Light. Technol. 2010, 28, 662–701. [Google Scholar] [CrossRef]
- Richardson, D.J.; Fini, J.M.; Nelson, L.E. Space-division multiplexing in optical fibres. Nat. Photon. 2013, 7, 354–362. [Google Scholar] [CrossRef]
- . Russell, Photonic crystal fibers. Science 2003, 299, 358–362. [CrossRef]
- Poletti, F. Nested antiresonant nodeless hollow core fiber. Opt. Express 2014, 22, 23807–23828. [Google Scholar] [CrossRef]
- Tamura, Y.; Sakuma, H.; Morita, K.; Suzuki, M.; Yamamoto, Y.; Shimada, K.; Honma, Y.; Sohma, K.; Fujii, T.; Hasegawa, T. Lowest-ever 0.1419-dB/km loss optical fiber. Optical Fiber Communication Conference (OFC), 2017; pp. post–deadline paper Th5D.1. [Google Scholar]
- Tamura, Y. Ultra-low loss Ge-free silica core fiber for submarine transmission. Proc. SPIE 10561, Next-Generation Optical Communication: Components, Sub-Systems, and Systems VII, 2018; p. 105610P. [Google Scholar] [CrossRef]
- Sato, S.; Kawaguchi, Y.; Sakuma, H.; Haruna, T.; Hasegawa, T. Record low loss optical fiber with 0.1397 dB/km. Optical Fiber Communication Conference (OFC), 2024. [Google Scholar]
- Petrovich, M.; Numkam Fokoua, E.; Chen, Y.; Sakr, H.; Adamu, A.I.; Hassan, R.; Wu, D.; Fatobene Ando, R.; Papadimopoulos, A.; Sandoghchi, S.R.; Jasion, G.; Poletti, F. Broadband optical fibre with an attenuation lower than 0.1 decibel per kilometre. Nat. Photon. 2025, 19, 1203–1208. [Google Scholar] [CrossRef]
- Kanamori, H. Transmission loss of optical fibers: achievements in half a century. In IEICE Trans. Commun.; 2020. [Google Scholar] [CrossRef]
- Agrawal, G.P. Fiber-Optic Communication Systems, 4th ed.; Wiley: Hoboken, 2010. [Google Scholar]
- ITU-T. Recommendation G.652: Characteristics of a single-mode optical fibre and cable; International Telecommunication Union. 2016.
- Goure, J.P.; Verrier, I. Optical Fiber Devices; IOP Publishing: London, 2002. [Google Scholar]
- Bailey, D.; Wright, E. Practical Fiber Optics; Newnes, Oxford, 2003. [Google Scholar]
- Getu, G. Experimental technique to characterize macro bending loss in single mode fiber. M.Sc. thesis, Addis Ababa University, 2010. [Google Scholar]
- Gautam, A.K. Dispersion and cutoff characteristics of circular optical waveguide with helical winding. Thesis, Sardar Vallabhbhai National Institute of Technology, 2010. [Google Scholar]
- Dutton, H.J.R. Understanding Optical Communications; IBM International Technical Support Organization, 1998. [Google Scholar]
- Marcuse, D. Curvature loss formula for optical fibers. J. Opt. Soc. Am. 1976, 66, 216–220. [Google Scholar] [CrossRef]
- ITU-T. Recommendation G.657: Characteristics of a bending-loss insensitive single-mode optical fibre and cable; International Telecommunication Union. 2016.
- Gloge, D. Dispersion in weakly guiding fibers. Appl. Opt. 1971, 10, 2442–2445. [Google Scholar] [CrossRef]
- Born, M.; Wolf, E. Principles of Optics; Cambridge University Press: Cambridge, 1999. [Google Scholar]
- Malitson, I.H. Interspecimen comparison of the refractive index of fused silica. J. Opt. Soc. Am. 1965, 55, 1205–1209. [Google Scholar] [CrossRef]
- Fleming, J.W. Dispersion in GeO2–SiO2 glasses. Appl. Opt. 1984, 23, 4486–4493. [Google Scholar] [CrossRef]
- Miya, T.; Terunuma, Y.; Hosaka, T.; Miyashita, T. Ultimate low-loss single-mode fibre at 1.55 µm. Electron. Lett. 1979, 15, 106–108. [Google Scholar] [CrossRef]
- Makovejs, S.; et al. Towards superior transmission performance in submarine systems: leveraging ultralow attenuation and large effective area. J. Light. Technol. 2016, 34, 114–121. [Google Scholar] [CrossRef]
- Tao, G.; Ebendorff-Heidepriem, H.; Stolyarov, A.M.; Danto, S.; Badding, J.V.; Fink, Y.; Ballato, J.; Abouraddy, A.F. Infrared fibers. Adv. Opt. Photon. 2015, 7, 379–458. [Google Scholar] [CrossRef]
- Zubia, J.; Arrue, J. Plastic optical fibers: an introduction to their technological processes and applications. Opt. Fiber Technol. 2001, 7, 101–140. [Google Scholar] [CrossRef]
- Koike, Y.; Koike, K. Progress in low-loss and high-bandwidth plastic optical fibers. J. Polym. Sci. B Polym. Phys. 2011, 49, 2–17. [Google Scholar] [CrossRef]
- The MathWorks, MATLAB, The MathWorks. Natick, MA, USA.
- Marcuse, D. Loss analysis of single-mode fiber splices. Bell Syst. Tech. J. 1977, 56, 703–718. [Google Scholar] [CrossRef]
Figure 1.
Wavelength-dependent refractive indices of silica and the doped core, with constant indices n1=1.48 and n2=1.46 shown for comparison.
Figure 1.
Wavelength-dependent refractive indices of silica and the doped core, with constant indices n1=1.48 and n2=1.46 shown for comparison.
Scheme 2.
Computational workflow for step-index optical-fiber analysis, including input parameters, normalized frequency, modal analysis, field and dispersion calculations, attenuation modelling, and fiber-design outputs.
Scheme 2.
Computational workflow for step-index optical-fiber analysis, including input parameters, normalized frequency, modal analysis, field and dispersion calculations, attenuation modelling, and fiber-design outputs.
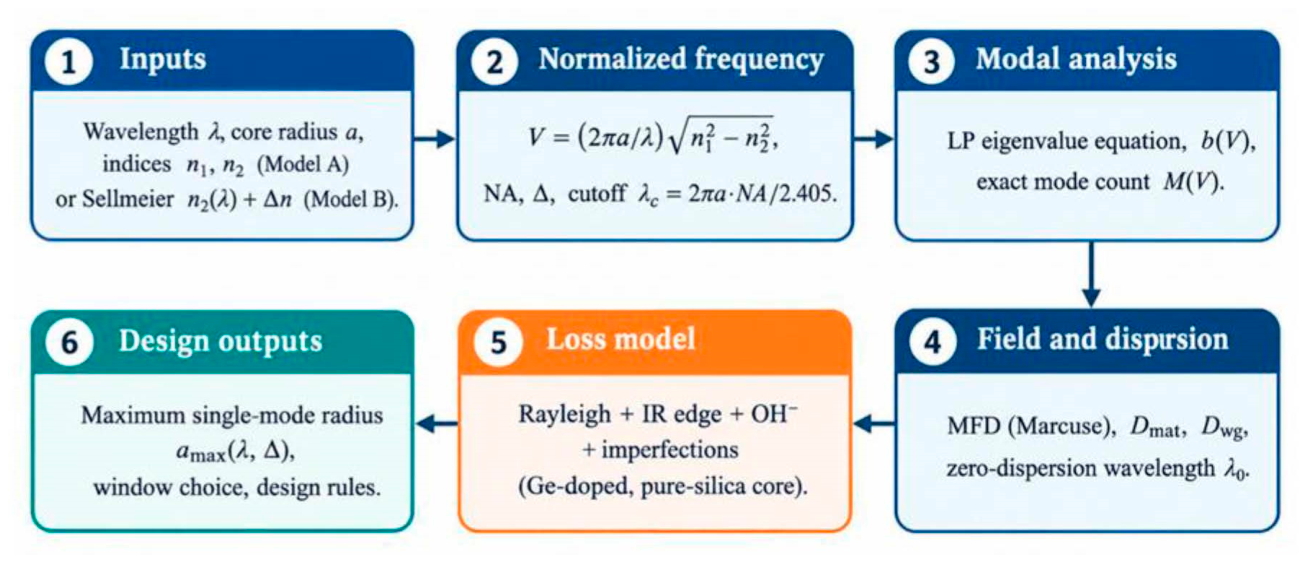
Figure 2.
Normalized frequency V versus wavelength (850–1550 nm) for core radii a = 4, 5, 25 and 50 µm (n1 = 1.48, n2 = 1.46; Model A).
Figure 2.
Normalized frequency V versus wavelength (850–1550 nm) for core radii a = 4, 5, 25 and 50 µm (n1 = 1.48, n2 = 1.46; Model A).
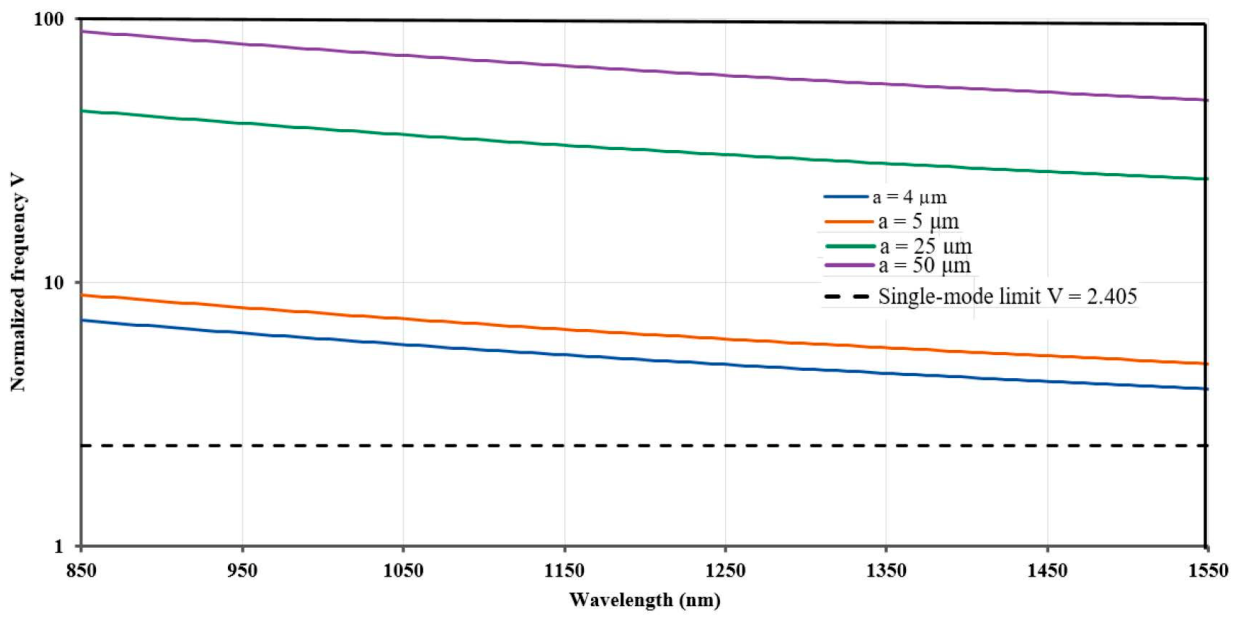
Figure 3.
(a) LP-mode dispersion curves and (b) Mode count, V ≤ 30.
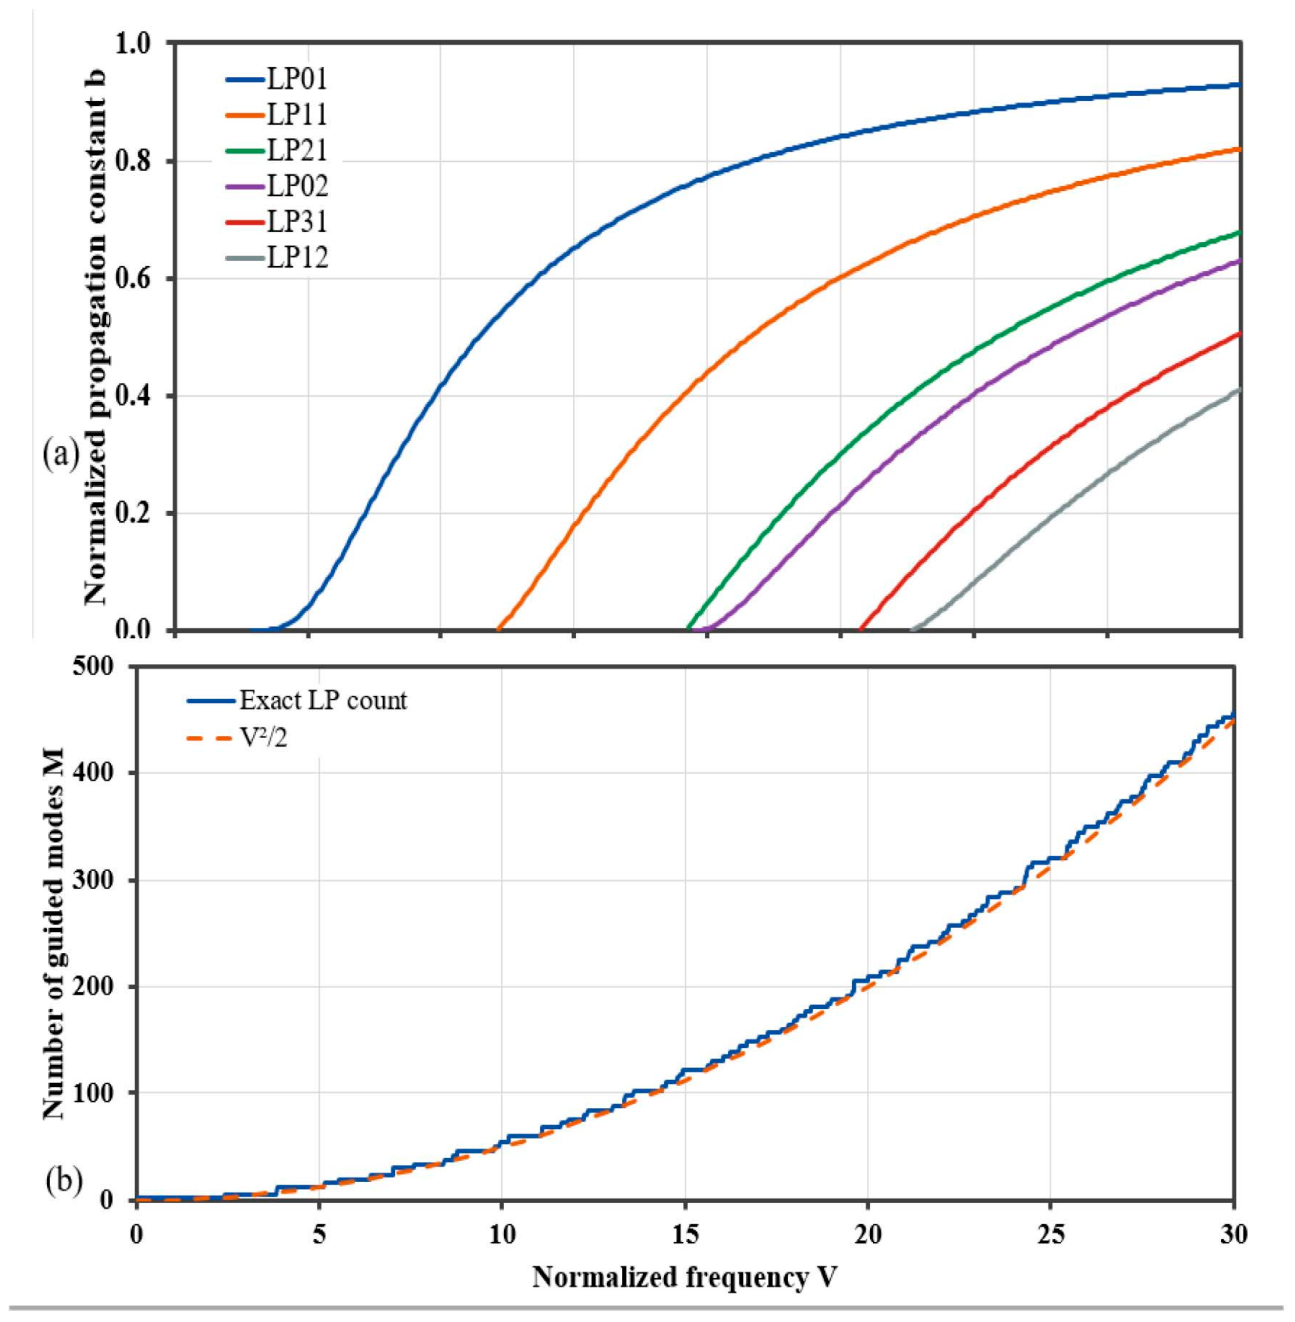
Figure 4.
Maximum single-mode core radius versus wavelength for several index contrasts Δ.
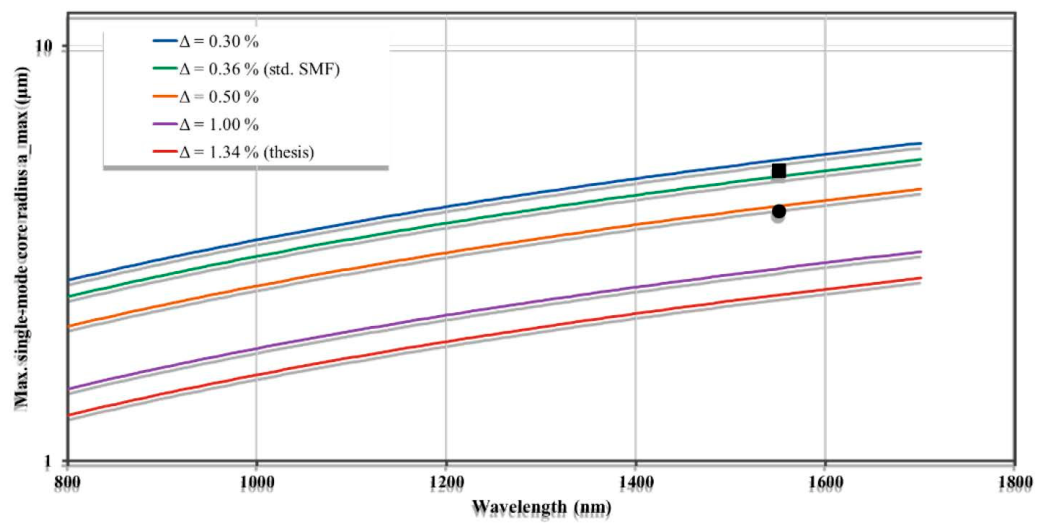
Figure 5.
(a) V (λ), a = 4.1 µm, Δn = 0.0052 and (b) Chromatic dispersion.
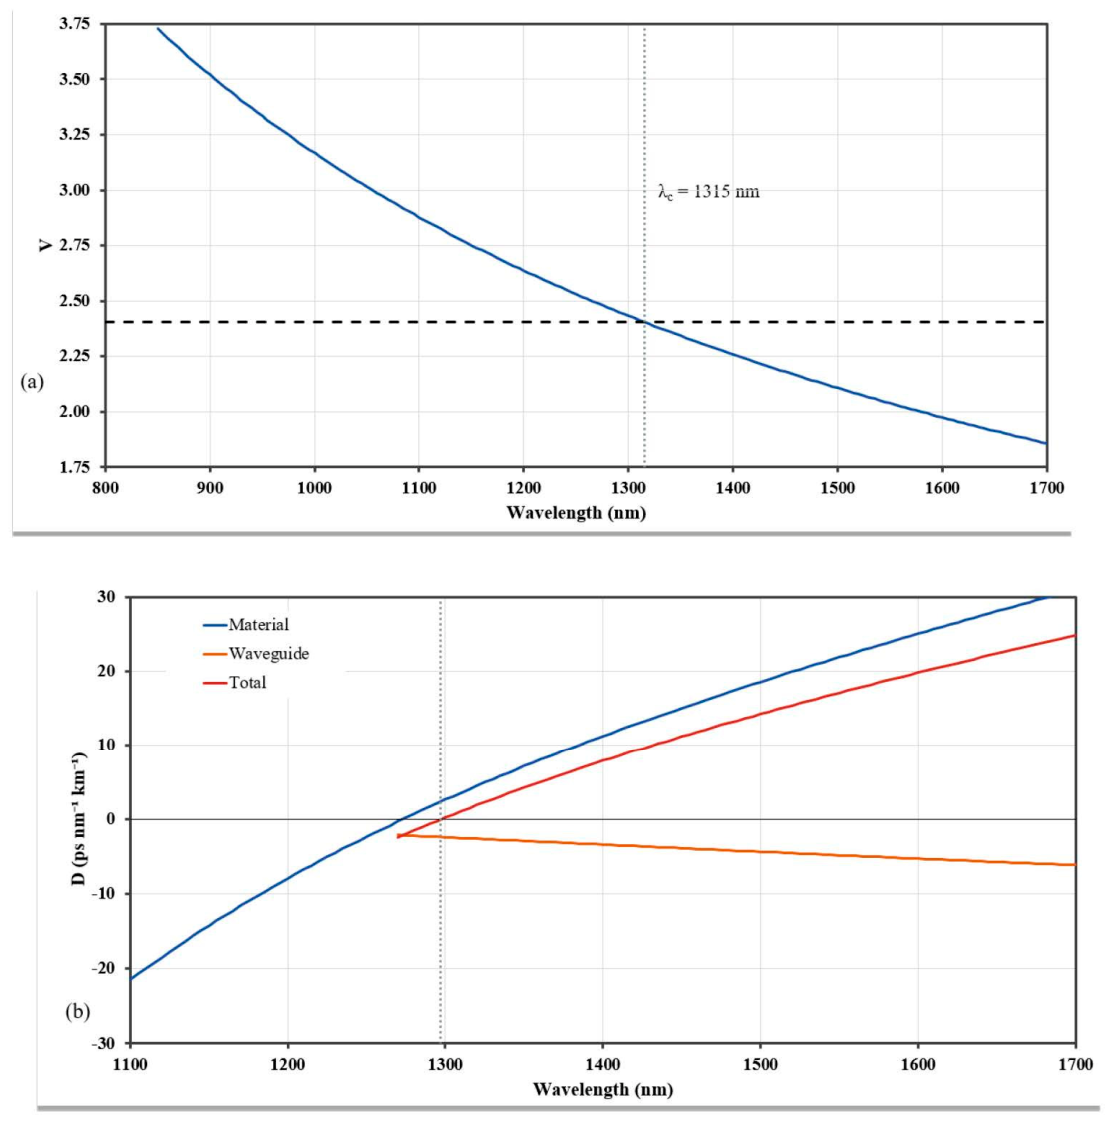
Figure 6.
(a) MFD, a = 4.1 µm (1.2 ≤ V ≤ 2.5), and (b) λ0(points shown where 1.5 ≤ V ≤ 2.5).
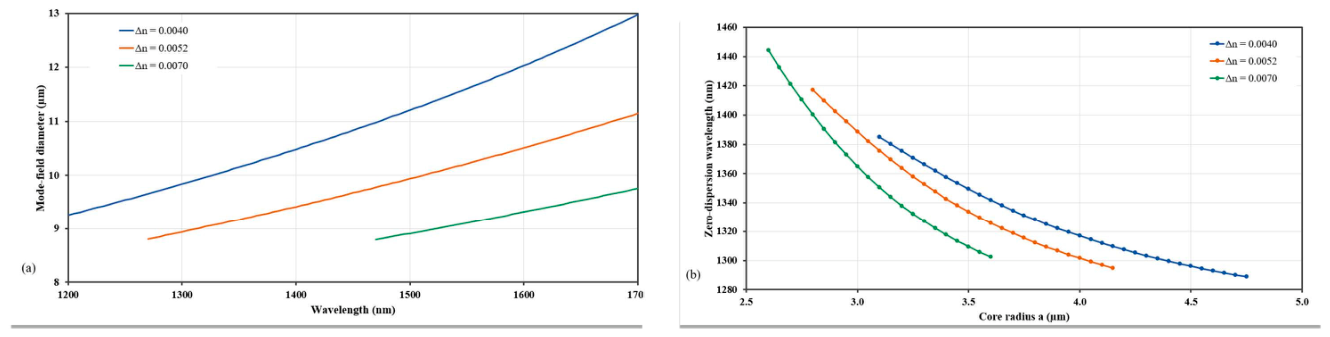
Figure 7.
(a) Total attenuation and (b) individual loss contributions for Ge-doped silica fiber, with ITU-T transmission bands indicated.
Figure 7.
(a) Total attenuation and (b) individual loss contributions for Ge-doped silica fiber, with ITU-T transmission bands indicated.
Scheme 3.
Design sequence for a solid-core silica fiber.
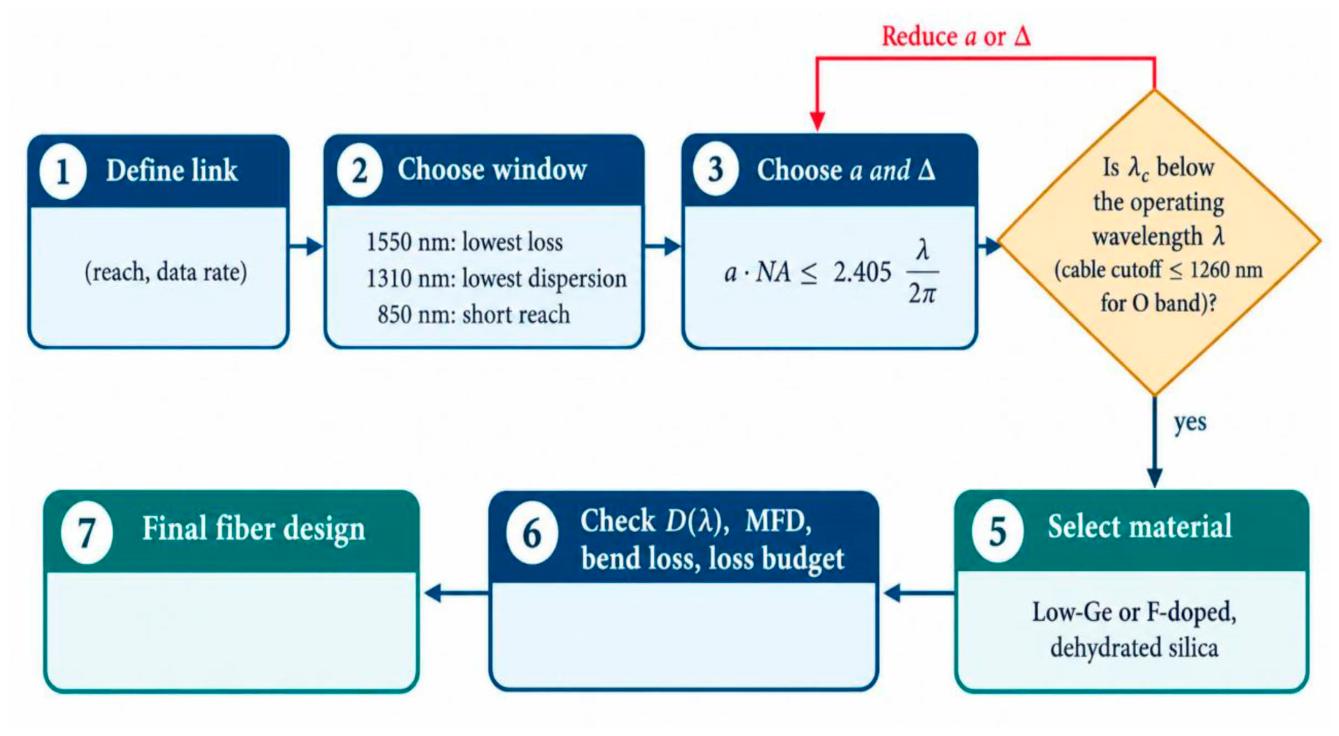
Table 2.
Normalized frequency, number of guided modes (asymptotic V2/2 and exact LP count including degeneracy) and single-mode cutoff wavelength for n1 = 1.48, n2 = 1.46.
Table 2.
Normalized frequency, number of guided modes (asymptotic V2/2 and exact LP count including degeneracy) and single-mode cutoff wavelength for n1 = 1.48, n2 = 1.46.
| a (µm) | V at 850 nm | V at 1550 nm | Modes at 850 nm V2/2 | Modes at 1550 nm V2/2 | Single-mode cutoff λc (µm) | Single-mode at 1550 nm? |
| 4 | 7.17 | 3.93 | 26 / 30 | 8 / 12 | 2.53 | No |
| 5 | 8.96 | 4.91 | 40 / 46 | 12 / 12 | 3.17 | No |
| 25 | 44.8 | 24.6 | 1004 / 1022 | 302 / 316 | 15.8 | No |
| 50 | 89.6 | 49.1 | 4016 / 4038 | 1208 / 1220 | 31.7 | No |
Table 3.
Single-mode core radius limit at 1550 nm for several index contrasts (Model A design chart; NA = nref√ (2Δ), nref = 1.444).
Table 3.
Single-mode core radius limit at 1550 nm for several index contrasts (Model A design chart; NA = nref√ (2Δ), nref = 1.444).
| Δ (%) | NA | amax at 1550 nm (µm) |
| 0.30 | 0.112 | 5.30 |
| 0.36 | 0.123 | 4.84 |
| 0.50 | 0.144 | 4.11 |
| 1.00 | 0.204 | 2.91 |
| 1.34 (original study) | 0.237 | 2.51 |
Table 5.
Band-averaged loss for the conventional Ge-doped core from the illustrative loss model (Model C; ITU-T band edges [27]).
Table 5.
Band-averaged loss for the conventional Ge-doped core from the illustrative loss model (Model C; ITU-T band edges [27]).
| Band | Range (nm) | Mean loss, Ge-doped (dB/km) | Dominant mechanism |
| O | 1260–1360 | 0.33 | Rayleigh scattering |
| E | 1360–1460 | 0.38 | OH− peak (conventional glass) |
| S | 1460–1530 | 0.19 | Rayleigh scattering |
| C | 1530–1565 | 0.18 | Rayleigh scattering |
| L | 1565–1625 | 0.19 | Rayleigh + infrared edge |
| U | 1625–1675 | 0.26 | Infrared edge |
Disclaimer/Publisher’s Note: The statements, opinions and data contained in all publications are solely those of the individual author(s) and contributor(s) and not of MDPI and/or the editor(s). MDPI and/or the editor(s) disclaim responsibility for any injury to people or property resulting from any ideas, methods, instructions or products referred to in the content. |
© 2026 by the authors. Licensee MDPI, Basel, Switzerland. This article is an open access article distributed under the terms and conditions of the Creative Commons Attribution (CC BY) license.
Copyright: This open access article is published under a Creative Commons CC BY 4.0 license, which permit the free download, distribution, and reuse, provided that the author and preprint are cited in any reuse.