

Submitted:
12 November 2026
Posted:
13 November 2026
You are already at the latest version
Abstract
Selenium (Se) is essential for animals and humans but not for higher plants. The farmer may therefore gain nothing from correcting a Se-poor soil, while potential costs arise further down the food chain. An ex-ante cost model for Austria follows the deficit from soil to crop, feed, animal and human and assigns costs by actor (EUR 2025). Without a yield response, Se fertilisation at 10 g ha−1 (EUR 6.84 ha−1) gives the arable producer no return; at the Austrian wheat price, a yield gain of 41 kg ha−1 would make it profitable. Livestock producers add Se to feed at EUR 0.005–0.04 per fattening pig, without effect on cereal foods. Austrian field trials indicate about 4.5 µg of additional daily intake per person from domestic wheat and rye. Treating all 741,200 ha of cereals would cost EUR 5.6 million per year (EUR 0.60 per inhabitant) and would pay for itself if it avoided 0.7–3.7% of the cost of hypothyroidism alone. A co-limitation framework shows where low Se can limit the benefit of iodine, iron, copper, zinc, manganese and vitamin E.
Keywords:
selenium
; externality
; cost incidence
; defensive expenditure
; attributable fraction
; biofortification
; one health
; Austria
1. Introduction
Mineral fertilisation follows the requirements of the crop. Elements that limit yield are applied; elements without an effect on yield are usually not. For selenium, this practice separates the fertilisation decision from its consequences. Selenium is essential for animals and humans and is part of about 25 selenoproteins, among them the glutathione peroxidases, the iodothyronine deiodinases and the thioredoxin reductases [2]. Higher plants do not require it [3,4]. A crop on a Se-poor soil can therefore grow without visible symptoms and still deliver low Se concentrations to animals and people.
Whether Se fertilisation gives the farmer a yield return is an empirical question. Field trials with wheat in the United Kingdom found no yield effect [5]. Two global meta-analyses report effects that depend on dose, crop and site conditions, with positive mean yield responses at low to moderate Se rates and smaller or negative responses at excessive rates [6,7]. Where no yield response occurs, the producer has no private reason to apply Se. Potential downstream costs may then arise later and elsewhere: in feed mills and livestock farms that buy Se additives, in herds in which Se and vitamin E together limit animal health, and in the health system. In Pigou’s terms, the marginal social cost of producing Se-poor biomass is then higher than its marginal private cost [8,9].
Se intake and Se status are low in parts of Europe [10]. EFSA set an adequate intake of 70 µg per day for adults and reported mean adult intakes of 31–66 µg per day in European surveys [11]. The German and Austrian reference values are 70 µg per day for men and 60 µg per day for women [12,13]. For Austria, historical estimates cited by Sager and Hoesch reported intakes of 36–68 µg per day and soil Se concentrations of about 0.2 mg kg−1; cereals grown without Se fertilisation in Lower Austria contained less than 4 to 23 µg Se kg−1 [14]. A review of 37 German studies with 8010 healthy adults found a weighted mean plasma or serum Se concentration of 82 µg L−1 [15], and healthy controls in Lower Austria had 103 µg L−1 [16]. A recent nationally representative survey of Se status in Austria does not exist. The model in this study is therefore an ex-ante policy model. It does not claim that the Austrian population as a whole is Se deficient.
The single links between soil, crop, animal and human are well studied. Agronomic trials report the grain response to Se fertilisers [5,14,17]. Veterinary studies report the joint effect of Se and vitamin E [18,19]. Epidemiological studies relate low Se status to thyroid disease [20,21]. Cost-effectiveness studies evaluate agronomic biofortification against human health outcomes [22]. Finland has added Se to compound fertilisers since 1984 and monitors the transfer to food and plasma [23,24]. For zinc, the soil–crop–animal–human continuum has been described as one system [25].
To the author’s knowledge, after literature searches up to November 2026, no study has followed a Se deficit through this continuum with an economic incidence model that shows, for each node, who could correct the deficit, who has a private incentive to do so and who bears the later cost. This study builds such a model for Austria. It has three aims: (i) to quantify the cost of a Se-poor soil at each node and to name the actor who bears it; (ii) to calculate a private and a social break-even threshold for a Se fertilisation programme similar to the Finnish one; and (iii) to show, in a co-limitation framework based on Liebig’s law of the minimum, where low Se can limit the benefit of other micronutrients.
2. Materials and Methods
2.1. Design and Scope
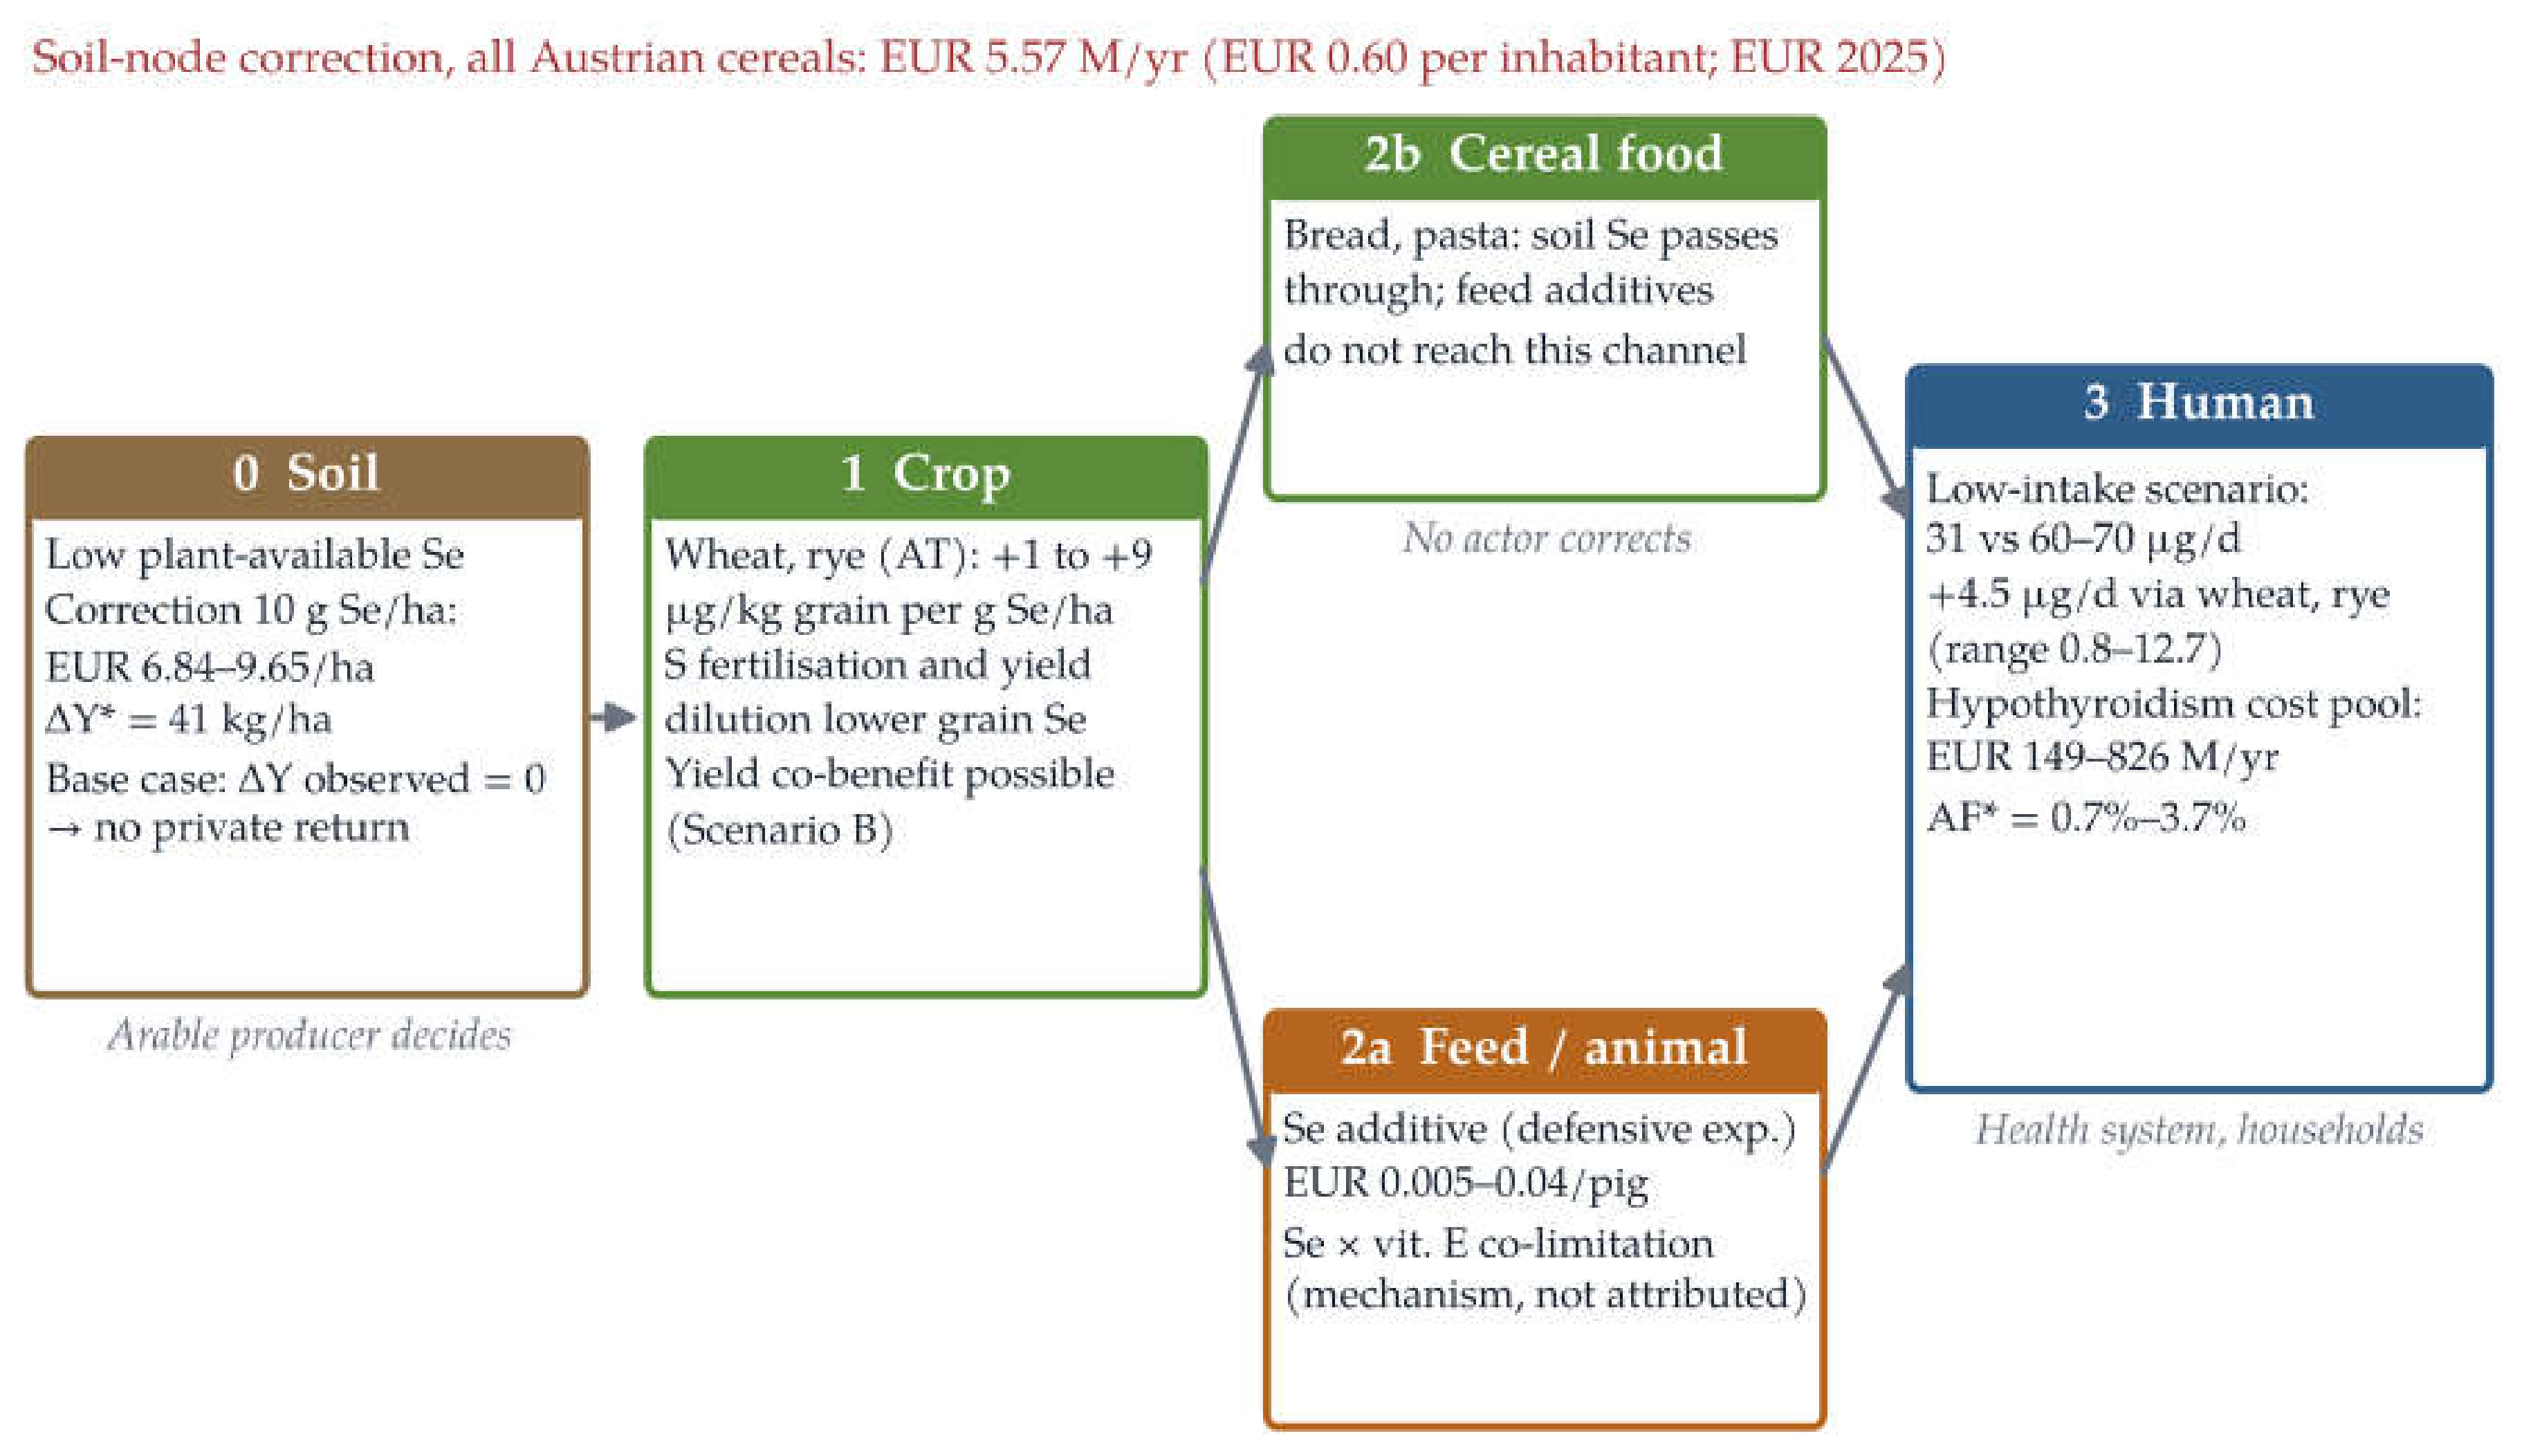
The study is an ex-ante economic model built from published data. It links the evidence along a branched chain (Figure 1): soil (node 0), crop (node 1), a direct channel from cereal food to humans, a feed and animal channel (node 2), and humans (node 3). No new experimental data were collected. Austria was chosen because low Se concentrations have been documented in Austrian agricultural soils and cereals [14], it has no Se fertilisation programme, and its official statistics provide the data needed to scale the model. Soil analyses from single farms were not used. The accredited reports available to the author contain no Se measurement, and Se status cannot be derived from cationic trace elements, because Se speciation and plant availability depend on redox conditions, pH and iron oxides [4].
2.2. Literature Basis
The evidence was collected step by step along the chain and not by a systematic review. For each transition, the quantity needed to reach the next node was searched, and the source closest to Austrian conditions, the most recent source or the official reference value was selected. Web of Science Core Collection, Scopus, PubMed and official statistical and regulatory sources were searched up to November 2026. Older studies were kept where they are still the primary source for a quantity, for example the Austrian field trials on Se uptake in cereals [14] and the factorial trial with Se and vitamin E in dairy cows [18]. Generative AI tools were used for language editing, to support the literature search and to check sources, and to draft the model code and figures; details are given in the Acknowledgments.
2.3. Price Base
All monetary values that enter a calculated ratio are given in EUR at 2025 prices. Medical costs reported in 2015 US dollars [26] were inflated with the US consumer price index for medical care (factor 1.299, 2015 to 2025), and other US dollar values with the all-items CPI-U (factor 1.057, 2023 to 2025) [27]. Both were converted at the 2025 annual average rate of 1 EUR = 1.1300 USD [28]. The sodium selenate price used by Oumer et al. is a supplier quote without a stated price date [22]. It was therefore treated as a source-period price. For harmonisation, 2023 was used as the price year; this is a modelling assumption, and it is covered by the twofold cost range tested in the uncertainty analysis. Animal-health costs that are used only to illustrate a mechanism stay in the price base of their source and are not combined with other values.
2.4. Incidence Framework and Thresholds
At each node, three quantities are separated: the correction cost that would restore adequate Se supply, the defensive expenditure by which an actor compensates for variable or inadequate dietary Se supply, and the remaining downstream burden. The difference between private and social cost follows the Pigouvian identity
where MSC, MPC and MEC are the marginal social, private and external costs [8,9].
MSC = MPC + MEC,
The private threshold is the yield increment at which Se application pays for itself for the arable producer,
where Kha is the cost of Se fertilisation per hectare and P the producer price of grain. ΔY* can always be calculated; the question is whether the observed yield response ΔYobs reaches it. Two scenarios are used. In Scenario A (base case), ΔYobs = 0, as in the wheat trials of Broadley et al. [5]. In Scenario B, a positive yield response occurs, as reported for low Se rates in meta-analyses [6,7], and part of the benefit stays with the producer.
ΔY* = Kha / P,
The social threshold is a break-even attributable fraction. The share of a disease cost that can be attributed to Se status is not known for Austria. It is therefore inverted and not estimated [29]:
where Knat is the national annual programme cost, N the population, p the prevalence and c the annual cost per patient of the costed endpoint. AF* is the share of this cost pool that the programme must avoid to pay for itself. It is a threshold and not an estimate. It does not assume that Se deficiency causes the endpoint, and it is conservative because only one endpoint is costed.
AF* = Knat / (N · p · c),
The additional Se intake through the direct cereal channel is
where D is the Se rate (g ha−1), Qj the per capita consumption of cereal j (kg per year, flour equivalent), rj its grain response (µg kg−1 per g ha−1), s the share of consumed cereals that comes from treated Austrian fields and m the share of the grain response that remains after milling and processing. The channel through foods of animal origin is not modelled, so ΔI is a lower bound of the total effect.
ΔI = (D / 365) · Σj Qj · rj · s · m,
Defensive expenditure at the livestock node is the cost of the Se supplied by feed additives,
where F is the feed or dry-matter intake per animal and period, q the added Se concentration and πSe the price of Se in the additive.
Edef = F · q · πSe,
2.5. Co-Limitation Framework Based on Liebig’s Law
Liebig’s law of the minimum states that plant growth is limited by the scarcest essential resource [30]. For Se it does not apply at the crop node, because plants do not require Se. The study uses the idea only as a heuristic for metabolic pathways in animals and humans. A pathway is classed as possibly limited by Se when (i) it contains a step catalysed by a selenoprotein, (ii) other micronutrients act before or together with this step, and (iii) studies show that the output of the pathway falls when Se is low although the other nutrients are present. This is not an extension of Liebig’s law. Parallel routes, such as catalase for hydrogen peroxide, and regulation, such as in the thyroid axis, weaken the limitation. The framework shows where low Se can limit the functional benefit of nutrients that are present; it does not claim that Se blocks their uptake.
2.6. Parameters
Table 1 lists all inputs. The Se rate of 10 g ha−1 lies within the range of 10–30 g ha−1 recommended for wheat in a global meta-analysis [7] and below the Finnish limit of 15 g Se ha−1 per year from fertilisers [31]. The only peer-reviewed costing found priced sodium selenate at USD 305 kg−1 including transport and applied 24 g ha−1 to supply 10 g Se ha−1, which gives USD 7.32 ha−1 (optimistic) or USD 10.32 ha−1 (pessimistic) [22], or EUR 6.84 and 9.65 ha−1 at 2025 prices. In Finland, Se is mixed into compound fertilisers, so no separate field pass was costed. Additional costs for blending and quality control were not parametrised separately; they are intended to be covered by the twofold range of the cost per hectare in the Monte Carlo analysis. The grain price is EUR 168.50 t−1, the Austrian producer price of soft wheat as an annual average for 2025; milling rye was EUR 163.79 t−1 [32]. The treated area is either the Austrian cereal area of 741,200 ha or all arable land of 1,320,833 ha [33]. Monitoring and administration were set at EUR 0.5 million per year (range 0.25–1.0); this is an assumption of the author.
The grain response comes from field trials in Lower Austria. A selenate-containing NPK fertiliser was applied to winter wheat, winter rye, summer barley and maize on a calcareous phaeozem, a gleyic luvisol and a dystric cambisol, and 0.7–4.7% of the added Se reached the grain [14]. The Se rates were 4.8 and 9.6 g ha−1 for wheat, 3.6 and 7.2 g ha−1 for rye and 3.2 and 6.4 g ha−1 for barley. From the grain concentrations of the control and the high rate, the response per g Se ha−1 was 1.2–6.0 µg kg−1 for wheat (mean 3.4), 1.0–9.3 µg kg−1 for rye (mean 4.9) and 1.3–10.3 µg kg−1 for barley (mean 5.4); values reported as below the detection limit of 4 µg kg−1 were replaced by half the detection limit (2 µg kg−1). Using 0 or 4 µg kg−1 instead changed the primary central intake estimate by about ±2%. The response per g Se ha−1 assumes an approximately linear dose–response over the short extrapolation to 10 g Se ha−1. This assumption matters most for rye, whose highest field rate was 7.2 g ha−1. Using the observed increase at the highest field rate without scaling to 10 g ha−1 gives a primary central intake about 7% lower. The primary estimate uses only wheat and rye, for which both the Se rate and the grain response are reported and which have their own consumption category. Barley is combined with oats and maize in the food balance. Oats were not tested, and for maize the trials report grain concentrations but not the Se rate applied. Maize grain Se rose from 6.6 to 10.9 and 13.1 µg kg−1 on the luvisol and from less than 4 to 10.4 and 19.9 µg kg−1 on the cambisol, the lowest transfer of all cereals [14]. These values confirm the transfer to maize but are not used as a response per g Se ha−1. An exploratory estimate for all cereals uses the barley response for the category barley, oats and maize and the wheat response for other grain. British trials found 16–26 ng g−1 fresh weight per g Se ha−1 without a yield effect [5]; this serves as an external upper bound.
Per capita consumption in 2024/25 was 65.6 kg wheat, 7.4 kg rye, 18.8 kg barley, oats and maize and 1.4 kg other grain [34]. The self-sufficiency rate of 85% is defined as domestic production divided by domestic use and does not measure the domestic origin of consumed cereals [34]; in 2024/25 Austria imported 3.1 and exported 2.4 million t of grain. The origin share s is therefore a scenario parameter with a range of 0.5–1.0. Its central value of 0.75 is the midpoint of this range and not an empirical estimate. The processing-retention factor m, the share of the grain response that remains in flour and bread, was set at 0.85 (range 0.7–1.0). In a British trial, the relation between applied Se and Se in flour and bread was approximately linear, which indicates minimal loss of Se during processing and bread production; Se applied at 10 g ha−1 raised white bread by 155 ng g−1 and wholemeal bread by 185 ng g−1 [35]. The increment in white bread was 0.84 of that in wholemeal bread, so the additional loss from refining to white flour was small. The central value of 0.85 is therefore a modelling assumption consistent with these results, and the range of 0.70–1.00 was tested in the uncertainty analysis.
The costed human endpoint is hypothyroidism. It is used as a cost pool and not as a disease caused by Se. Its prevalence in Europe, including undiagnosed cases, is 3.05% [36]. Undiagnosed hypothyroidism alone was estimated at 4.70% (95% CI 2.98–6.79%) with very high heterogeneity [37]. The Monte Carlo analysis therefore uses a uniform scenario range of 2.0–6.8% to reflect differences between studies and populations; this range is not a confidence interval around the central value of 3.05%. No European cost per patient was found. The US range of USD 460–2555 per patient-year at 2015 prices [26] corresponds to EUR 529–2938 at 2025 prices; the lower bound is used as central value because unit costs in Europe are lower.

Table 1.
Model inputs (EUR 2025): central values, ranges and sources.
| Node | Parameter | Central value | Range | Source |
|---|---|---|---|---|
| 0 | Se rate | 10 g ha−1 | fixed | [7,31] |
| 0 | Cost of Se fertiliser | EUR 6.84 ha−1 | 6.84–13.69 | [22]; ×2 assumption |
| 0 | Producer price, soft wheat 2025 | EUR 168.50 t−1 | — | [32] |
| 0 | Cereal area (rounded official value) / arable area | 741,200 / 1,320,833 ha | scenario | [33] |
| 0 | Monitoring and administration | EUR 0.5 M yr−1 | 0.25–1.0 | assumption |
| 0–1 | Yield response ΔYobs | 0 (Scenario A) | Scenario B | [5,6,7] |
| 1 | Grain response r: wheat / rye (primary) | 3.4 / 4.9 µg kg−1 per g ha−1 | 1.0–9.3 | [14] |
| 1 | Grain response r: barley (exploratory proxy) | 5.4 µg kg−1 per g ha−1 | 1.3–10.3 | [14] |
| 1 | External upper bound r | 26 | 16–26 | [5] |
| 1 | Domestic origin share s | 0.75 (midpoint) | 0.5–1.0 | scenario |
| 1 | Processing retention m | 0.85 | 0.7–1.0 | [35] |
| 1 | Consumption Q: wheat / rye / all cereals | 65.6 / 7.4 / 93.2 kg yr−1 | — | [34] |
| 2 | Added Se in pig feed; feed per pig | 0.3 mg kg−1; 260 kg | 0.2–0.3; 240–290 | [38,39] |
| 2 | Supplemental Se in dairy ration; dry-matter intake | 0.3 mg kg−1 DM; 22 kg DM d−1 | —; 20–25 | [40]; low-Se basal diet and DMI assumed |
| 2 | Se price in feed additive | EUR 300 kg−1 Se | 100–500 | assumption |
| 3 | Population | 9,215,956 | — | [41] |
| 3 | Hypothyroidism prevalence p | 3.05% | 2.0–6.8% | [36,37] |
| 3 | Cost per patient-year c | EUR 529 | 529–2938 | [26,27,28] |
| 3 | Adult intake; reference values | 31–66; 60–70 µg d−1 | — | [11,12] |
2.7. Uncertainty Analysis and Software
The deterministic central case uses the values in Table 1. A Monte Carlo simulation with 100,000 draws varied the cost per hectare (uniform, one to two times the optimistic cost), the monitoring cost (uniform), the cost per patient-year (log-uniform between the bounds), the prevalence (uniform, 2.0–6.8%), the soil-specific grain response of each cereal (drawn from the three Austrian soils), the origin share (uniform, 0.5–1.0) and the processing retention (uniform, 0.7–1.0). A one-at-a-time analysis shows the influence of each input on AF*. The model was written in Python 3.13 with NumPy 2.5 and a fixed random seed of 42. The script reproduces all numerical results underlying the tables and the quantitative figure (Figure 3) of this article (Supplementary File S1); a second script reproduces Figure 1, Figure 2 and Figure 3, of which Figure 1 and Figure 3 use the numerical model output and Figure 2 is the conceptual co-limitation diagram. Both scripts and the output are archived at Zenodo (https://doi.org/10.5281/zenodo.24171208).
3. Results
3.1. Node 0 to Node 1: The Private Threshold
Se fertilisation at 10 g ha−1 costs EUR 6.84–9.65 ha−1 for the Se source. At the Austrian wheat price of EUR 168.50 t−1, the private threshold is ΔY* = 41 kg ha−1. It is 57 kg ha−1 at the pessimistic Se price and 81 kg ha−1 if the cost doubles. In Scenario A, the observed yield response is zero, and the producer loses EUR 6.84 ha−1 in each season. Applied Se has only a small effect in the following year [14], so the cost recurs every year. In Scenario B, yield gains of 50, 100 or 200 kg ha−1 give a private net return of EUR 1.58, 10.01 or 26.86 ha−1. Whether Se fertilisation is an externality or partly a private investment therefore depends on a yield response of a few tens of kilograms per hectare. Field trials with wheat did not show such a response [5], while meta-analyses report it for low Se rates under suitable conditions [6,7]. The Austrian trials did not report yields [14].
Normal crop management can lower grain Se further. Sulphate competes with selenate for uptake, and where sulphur fertilisation raised the yield of wheat, grain Se fell significantly [17]. In the Broadbalk experiment, grain from the unfertilised plot contained more Se than grain from plots with sulphur-containing fertilisers or manure [42], and grain Zn, Fe, Cu and Mg fell after semi-dwarf cultivars with higher yields were introduced [43]. A higher yield can therefore mean a lower Se density in the harvest.
3.2. Node 1 to Node 2: Defensive Expenditure
Livestock producers add Se to feed to compensate for variable or inadequate dietary Se supply, within the EU limit of 0.5 mg total Se kg−1 complete feed [14,39]. Equation (5) gives 48–87 mg of added Se per fattening pig, or EUR 0.005–0.04 per pig. For a dairy cow, the supplemental Se was set at 0.3 mg kg−1 dry matter, the adequate intake of NASEM [40], under the assumption of a low-Se basal diet; with 20–25 kg dry-matter intake per day, this gives 2.2–2.7 g Se per year, or EUR 0.22–1.37 per cow (Table 2). The amounts are small. Feed supplementation would probably continue under a soil programme, because feed formulation also responds to variable raw materials, imported components and safety margins. Grain maize, an important feed grain, showed the lowest Se transfer in the Austrian trials, and its grain would be too low in Se, Cu, Ca and Mn if fed alone [14]. No saving is therefore counted at node 2.
The animal node is used to show co-limitation, not to attribute a cost. In a factorial trial with dairy cows, retained placenta occurred in 17.5% of the cows that received Se alone, vitamin E alone or neither, and in none of the cows that received both [18]. Later meta-analyses focused on vitamin E and confirmed a lower risk of retained foetal membranes; Se supplementation was one of the factors that improved the effect [44,45]. At EUR 123 per case [46], an incidence of 17.5% would correspond to EUR 21.5 per calving. This illustrates the mechanism and is not an expected effect in Austrian herds. Mulberry heart disease in pigs is a counterexample: in a supplemented population, affected pigs had tissue Se and vitamin E within the normal range [47]. The disease is therefore not counted as a burden caused by Se. Where feed supplementation is absent, the soil deficit passes on to the animal. In Finland, milk from organically fed cows contained 50% less Se than conventional milk [23]. Under Central European conditions, foliar Se on maize raised milk Se from 27 to 68 µg L−1, and the value returned to baseline four weeks after the treatment stopped [48].
Table 2.
Costs of a Se-poor soil at each node and the actor who bears them (Austria).
| Node | Actor | Economic category | Amount | Source |
|---|---|---|---|---|
| 0 Soil | Arable producer | Correction cost; private threshold | EUR 6.84–9.65 ha−1 yr−1; ΔY* = 41 kg ha−1; ΔYobs = 0 in Scenario A | [22,32] |
| 1 Crop | None (direct cereal channel) | Uncorrected transfer to food | Grain response: wheat 1.2–6.0, rye 1.0–9.3 µg kg−1 per g Se ha−1 | [14] |
| 2 Feed | Feed mill, pig farm | Defensive expenditure | EUR 0.005–0.04 per fattening pig | Eq. (5) |
| 2 Feed | Dairy farm | Defensive expenditure | EUR 0.22–1.37 per cow and year | Eq. (5) |
| 2 Animal | Dairy farm | Co-limitation (illustration) | Retained placenta 17.5% vs 0% with Se + vitamin E; EUR 123 per case | [18,46] |
| 3 Human | Health system, households | Cost pool of costed endpoint | Hypothyroidism: 281,000 persons; EUR 149–826 million yr−1 | [26,36] |
| 3 Human | Society | Correction at soil node, all cereals | EUR 5.57 million yr−1; EUR 0.60 per inhabitant | Eq. (3) |
Defensive expenditure uses the author’s price assumption for Se in feed additives; because the amounts are small, the result hardly depends on it. EUR 2025, except the case cost from [46] (price base of the source).
3.3. Node 3: Reference-Value Gap and the Direct Cereal Channel
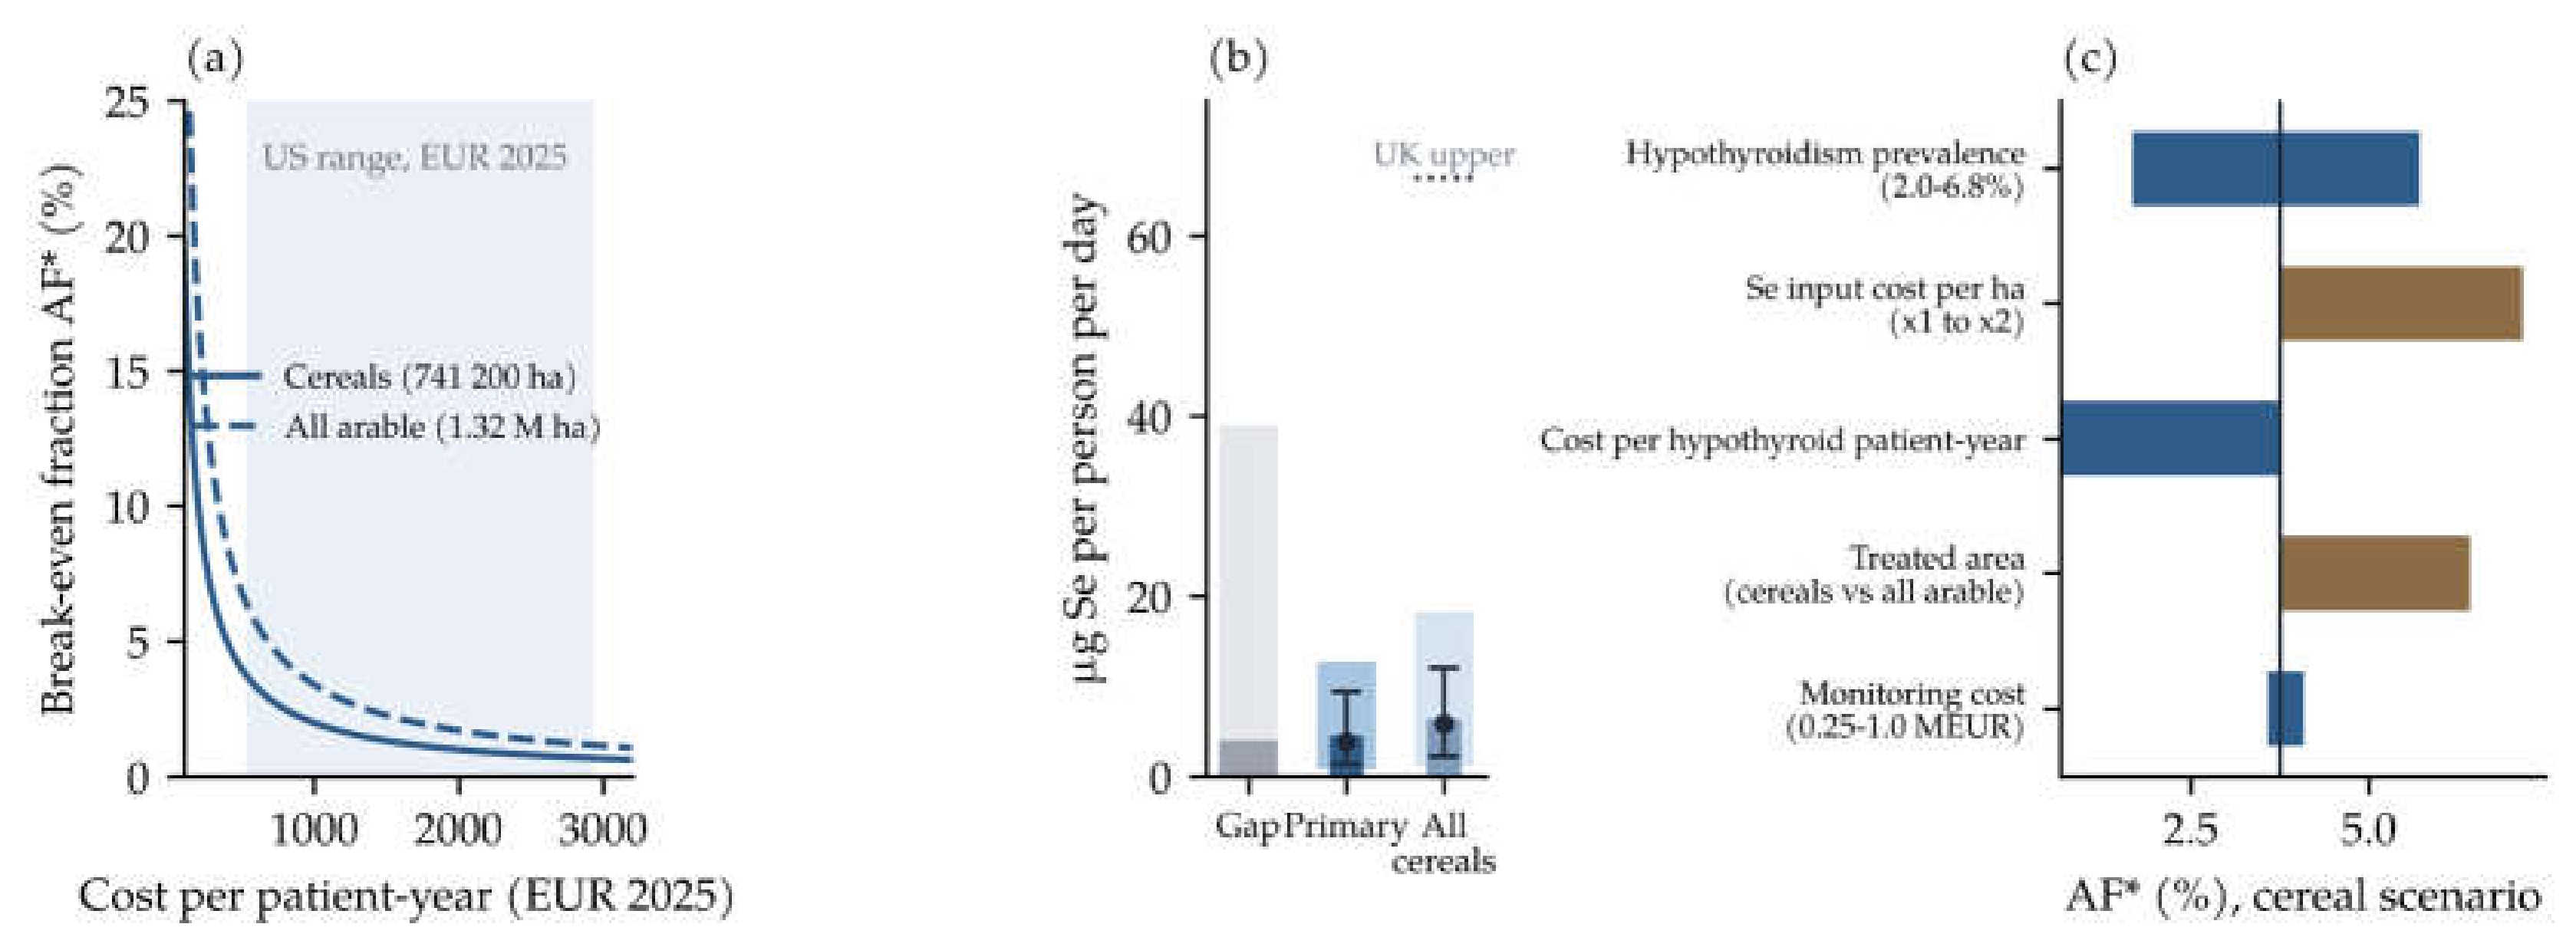
Under the low-intake scenario of 31 µg per day, the gap to the reference value for men is 39 µg per day; at 66 µg per day it is 4 µg per day [11,12]. These are reference-value gaps based on European survey values and not a measured Austrian intake distribution. For domestic wheat and rye, Equation (4) gives an additional intake of 4.5 µg per person and day in the central case, with a range of 0.8–12.7 µg; the Monte Carlo median is 3.9 µg (90% interval 1.4–9.4 µg; Figure 3b). The exploratory estimate for all cereals gives 6.4 µg (range 1.1–18.2 µg; Monte Carlo median 5.8 µg, 90% interval 2.2–12.1 µg). With the upper British response and full domestic origin, the cereal channel would add 66 µg. Under Austrian soil conditions, the direct cereal channel therefore closes only a small part of the gap. In Finland, foods of animal origin supplied more than 70% of Se intake after the programme started [23]. The channel through animal products, which is not modelled here, may therefore carry a large part of the effect.
Feed supplementation does not reach the direct channel. Bread, pasta and other cereal foods carry the Se content of the soil on which the grain grew. People who eat mainly plant foods therefore gain least from the defensive expenditure of the livestock sector. Even with the upper response, baseline intake plus the modelled cereal increment would be about 132 µg per day, before any additional contribution through animal products. This is about half of the tolerable upper intake level of 255 µg per day [49].
3.4. National Break-Even
Treating the Austrian cereal area costs EUR 5.57 million per year in the central case (EUR 7.65 million at the pessimistic fertiliser price), or EUR 0.60 per inhabitant. Each additional µg of daily intake per person from wheat and rye costs about EUR 0.13 per year. Treating all arable land costs EUR 9.54 million, or EUR 1.04 per inhabitant (Table 3). The programme cost covers all cereal hectares, whereas the primary estimate of additional intake uses only wheat and rye. Relative to a programme targeted at bread grain, the resulting AF* is therefore conservative.
At the European prevalence of 3.05%, about 281,000 persons in Austria have hypothyroidism. At EUR 529–2938 per patient-year, the cost pool is EUR 149–826 million per year. Equation (3) gives AF* = 0.7–3.7% for the cereal scenario and 1.2–6.4% for the arable scenario (Table 3; Figure 3a). The avoided cost required equals the annual cost of about 10,500 patient-years at the conservative cost estimate, or about 1900 patient-years at the upper estimate. The required avoided cost need not correspond to prevented cases; in principle it could arise from fewer cases, lower annual management costs or other reductions in the cost pool. The model does not specify a clinical mechanism. The Monte Carlo median of AF* is 1.7% (90% interval 0.6–4.9%) for cereals and 2.9% (1.0–8.4%) for all arable land. The one-at-a-time analysis shows a substantial influence of the Se cost per hectare, the cost per patient-year, the prevalence and the treated area, and a smaller influence of the monitoring cost (Figure 3c). With a European cost of only EUR 100 per patient-year, the threshold for cereals would be 19.8%.
The clinical and epidemiological evidence can be used to judge whether these thresholds are plausible, but not to calculate them. In Se-poor Chinese counties, the prevalence of pathological thyroid conditions was 30.5%, compared with 18.0% in a county with adequate Se supply (median serum Se 57.4 vs 103.6 µg L−1) [20]. Low Se status was a risk factor for new cases of Hashimoto’s thyroiditis (relative risk 3.65, 95% CI 1.03–12.90) [21]. A meta-analysis of randomised trials found that Se supplementation lowered TSH (standardised mean difference −0.21) and thyroid peroxidase antibodies in patients with Hashimoto’s thyroiditis without hormone replacement, but showed no effect on several other outcomes [50]. These results come from populations with lower Se status than in Austria or from supplementation, not from agronomic biofortification, and the additional intake from cereals is modest (Section 3.3). They show that the thresholds are not implausible. They do not show that the thresholds will be reached.
Figure 1.
Branched Se cascade in Austria. Low Se availability in the soil–crop system can propagate to humans through a direct cereal-food channel, which no actor corrects, and through a feed and animal channel, in which livestock producers pay for Se additives. Values are central values or ranges in EUR 2025; the intake value refers to the primary estimate for wheat and rye. AF*, break-even attributable fraction; ΔY*, private break-even yield increment.
Figure 1.
Branched Se cascade in Austria. Low Se availability in the soil–crop system can propagate to humans through a direct cereal-food channel, which no actor corrects, and through a feed and animal channel, in which livestock producers pay for Se additives. Values are central values or ranges in EUR 2025; the intake value refers to the primary estimate for wheat and rye. AF*, break-even attributable fraction; ΔY*, private break-even yield increment.
3.5. Co-Limitation Pathways
Three pathways meet the criteria of Section 2.5 (Table 4; Figure 2). In the thyroid axis, iodine is the substrate of hormone synthesis and iron is part of the haem in thyroid peroxidase. Se is needed in the deiodinases, which convert thyroxine into triiodothyronine, and in the glutathione peroxidases, which protect the thyrocyte from the hydrogen peroxide formed during iodination [51,52]. In regions with combined severe iodine and Se deficiency, iodine must be restored before Se, and the combined deficiency leads to myxoedematous cretinism [51]. Low Se status has been linked to autoimmune thyroiditis, Graves’ disease and goitre [53]. The thyroid axis has regulatory compensation, so the limitation is only partial.
In peroxide clearance, Cu,Zn-dependent SOD1 and Mn-dependent SOD2 convert superoxide into hydrogen peroxide, which is removed by Se-dependent glutathione peroxidases and by catalase, an iron enzyme [54]. Because catalase is a parallel route, low Se slows the clearance but does not stop it. In lipid peroxidation, vitamin E interrupts radical chains in membranes, and glutathione peroxidases reduce lipid hydroperoxides [2,19]. The factorial trial in dairy cows, in which only the combination of Se and vitamin E prevented retained placenta, illustrates this pathway [18]. At the crop node the relation is reversed: sulphur, which plants require, competes with selenate for uptake [17]. In the Austrian trials, Se addition did not change the grain contents of the other essential trace elements [14]. This supports the distinction between uptake and functional use.
Figure 2.
Co-limitation framework based on Liebig’s law of the minimum. Grey: nutrients present before the Se-dependent step; red: Se-dependent step; green: output of the pathway; blue: endpoint when Se is low. Notes in italics show parallel or compensating routes that weaken the limitation. Based on [18,51,54].
Figure 2.
Co-limitation framework based on Liebig’s law of the minimum. Grey: nutrients present before the Se-dependent step; red: Se-dependent step; green: output of the pathway; blue: endpoint when Se is low. Notes in italics show parallel or compensating routes that weaken the limitation. Based on [18,51,54].
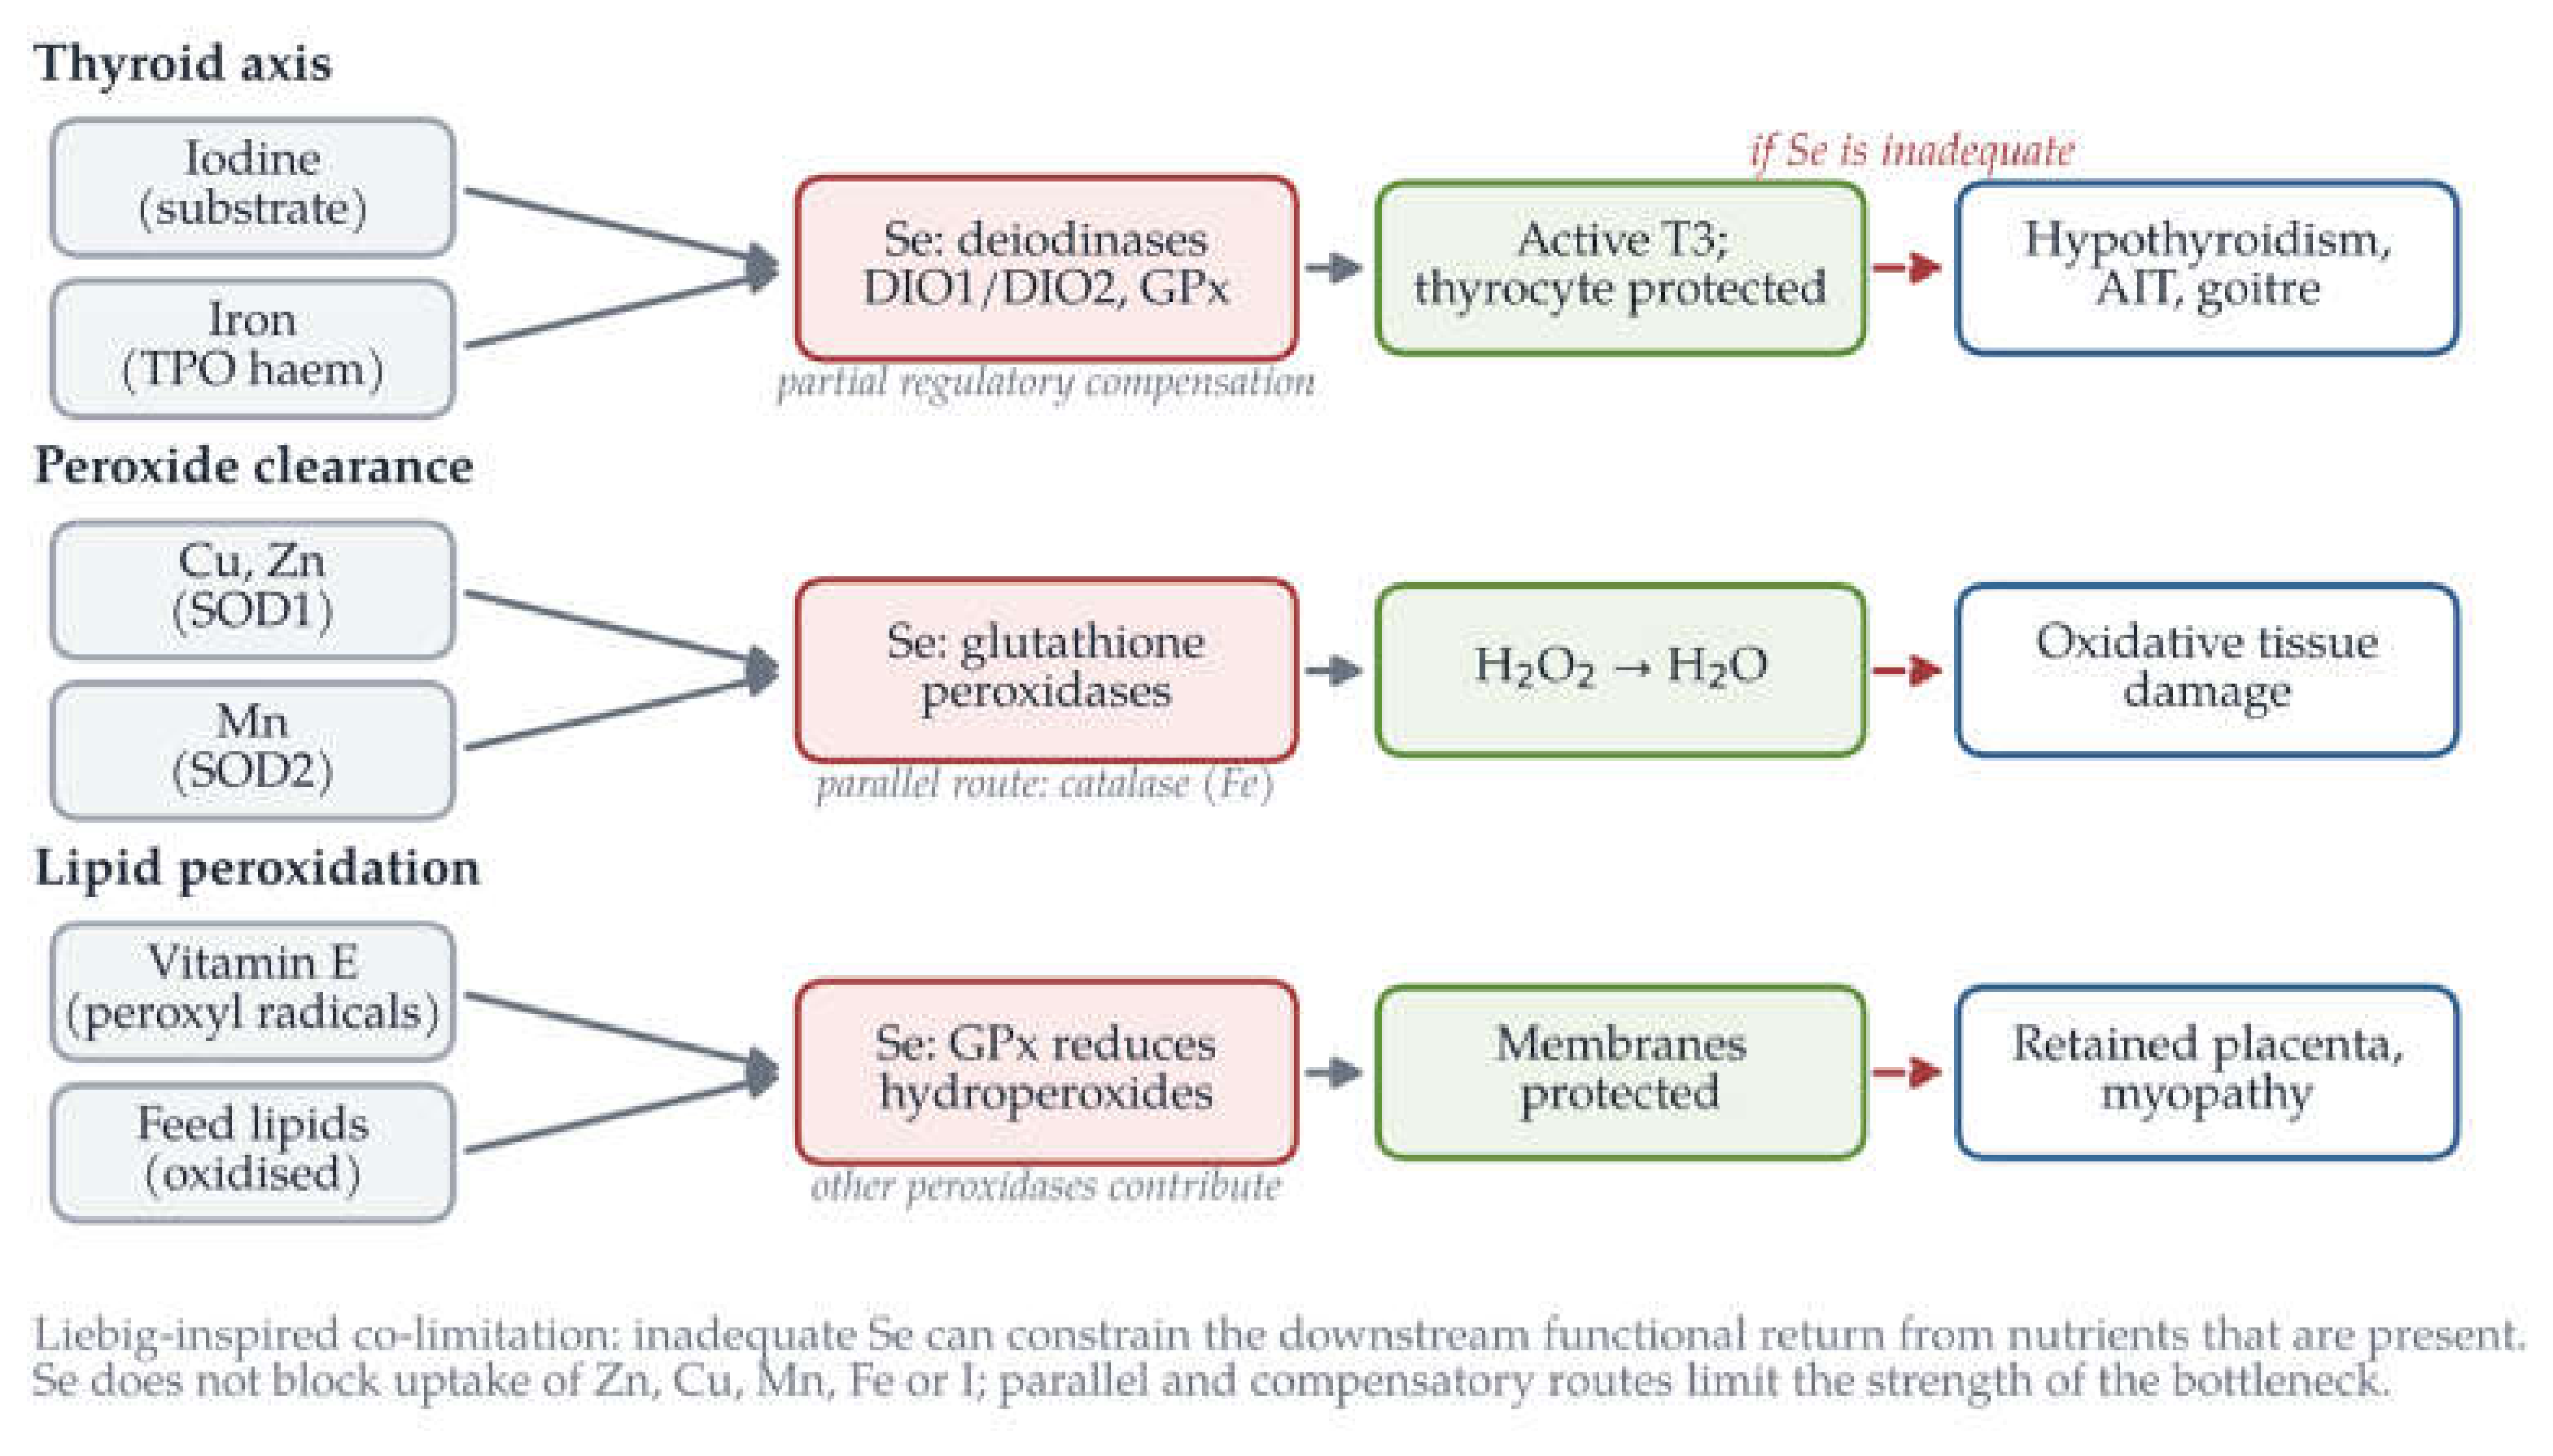
Figure 3.
(a) Break-even attributable fraction AF* as a function of the annual cost per patient for the cereal and arable scenarios (EUR 2025); the shaded band is the US cost range converted to EUR 2025 [26]. (b) Reference-value gap for men under the low- and high-intake scenarios (light and dark grey) and additional intake from domestic cereals: primary estimate for wheat and rye and exploratory estimate for all cereals (dark bar: central case; light bar: range from the Austrian trials; point and whiskers: Monte Carlo median and 90% interval; dotted line: upper British response). (c) One-at-a-time sensitivity of AF* in the cereal scenario; the vertical line is the central value of 3.7%.
Figure 3.
(a) Break-even attributable fraction AF* as a function of the annual cost per patient for the cereal and arable scenarios (EUR 2025); the shaded band is the US cost range converted to EUR 2025 [26]. (b) Reference-value gap for men under the low- and high-intake scenarios (light and dark grey) and additional intake from domestic cereals: primary estimate for wheat and rye and exploratory estimate for all cereals (dark bar: central case; light bar: range from the Austrian trials; point and whiskers: Monte Carlo median and 90% interval; dotted line: upper British response). (c) One-at-a-time sensitivity of AF* in the cereal scenario; the vertical line is the central value of 3.7%.
4. Discussion
4.1. Who Bears the Cost
In the base case without a yield response, the arable producer bears no cost of the Se deficit, and practices that raise yield, such as sulphur fertilisation, can lower grain Se further. Livestock producers pay for Se additives. The cost per animal is small but recurs for every animal. It compensates for variable dietary Se supply, of which the soil deficit is one cause, and it is booked as an ordinary feed cost; farm accounts record expenditure when it occurs, not the value of the costs it prevents [55]. The human node bears the remaining burden for the part of the diet that feed additives do not reach, mainly cereal foods, and for groups outside conventional feeding systems.
The correction is cheap, but no actor has a direct reason to pay for it. The EUR 0.60 per inhabitant and year would have to be paid either by arable producers, who gain nothing in Scenario A, or by a public programme, which has to justify the cost against an endpoint whose Se-attributable share is unknown. The break-even approach does not estimate this share. It calculates the share that would be needed, and for Austria this is a few percent of one cost pool. The private threshold of 41 kg ha−1 is also small. A modest yield gain, or a price premium of similar size, would move part of the correction from the public to the private side.
4.2. Policy Options
The incidence structure points to three instruments, in the order information, incentive and regulation [9]. An adoption subsidy of about EUR 7 ha−1 would offset the producer’s modelled private application cost. A Pigouvian subsidy in the strict sense would instead equal the marginal external benefit of Se fertilisation; this requires an estimate of AF and is not estimated here. A regulatory standard, as in Finland, sets the Se content of compound fertilisers. Austria itself tested a selenate-containing NPK fertiliser with 16 mg Se kg−1 at the request of the Ministry of Health before its planned introduction [14]. Finland introduced the measure in 1984 after an intake of 25 µg per day had been reported. Intake then rose from 0.04 to about 0.08 mg per day per 10 MJ, the Se content of spring cereals rose fifteen-fold, and plasma Se rose from 0.89 to 1.40 µmol L−1 [23]. Current Finnish regulation limits Se from fertilisers to 15 g ha−1 per year and permits only selenate [31]. Coverage is incomplete, because Se-free fertilisers are also used and no Se-containing fertiliser is available for organic farming [56]. A third option is quality-based pricing of feed and food grain, which would let producers receive part of the benefit and would turn ΔY* into a price premium.
Both too little and too much Se can cause harm [2,53]. A soil-based programme allows dose control at population level through a regulated rate per hectare and monitoring, unlike uncoordinated individual supplementation; the transfer into grain is also small [5,14]. Monitoring of foods and of population status, as carried out in Finland since 1985 [23], is included in the programme cost of this model.
4.3. Contribution and Relation to Existing Work
Several parts of this analysis are established: Se biofortification, the link between soil, crop, animal and human, the role of Se in thyroid metabolism, cost-effectiveness analyses of agronomic biofortification [22] and threshold analysis with attributable fractions [29]. The new element is their combination in one model: an incidence model by actor along a branched continuum, which links defensive expenditure, the private threshold ΔY* and the social threshold AF* to the question of who could correct the deficit, who has an incentive to do so and who bears the later cost. The co-limitation framework adds a heuristic link between Se and the functional benefit of other micronutrients, which an analysis of one nutrient alone would not capture.
4.4. Limitations
Seven limitations should be stated. (i) AF* is a threshold and not an estimate of the effect of Se fertilisation in Austria. (ii) Only hypothyroidism is costed, with US cost data converted to EUR 2025; European costs are probably lower, which was tested down to EUR 100 per patient-year. (iii) The grain response comes from one Austrian trial series with three soils. The primary estimate is limited to wheat and rye; for maize the Se rate was not reported, and the exploratory estimate for all cereals uses barley as a proxy. The response also depends on application form and timing [6]. (iv) The origin share of consumed cereals is not known and was treated as a scenario parameter. (v) Austrian intake and status are not known from representative biomonitoring, so the reference-value gap is based on scenarios. (vi) The processing retention is based on one British trial, and defensive expenditure uses an assumed price for Se in feed additives; the conclusions do not depend on either. (vii) The channel through animal products and the effects in organic and pasture-based herds are not quantified, so the total change in intake, the possible benefit and the exposure cannot be fully estimated. Se measurements in soil, grain, feed and blood along one Austrian supply chain, together with yield records, would allow ΔYobs and AF to be estimated instead of assumed or inverted.
5. Conclusions
Where a Se-poor soil produces no measurable yield loss, the farmer bears no private yield cost from the deficit. Potential costs move downstream and later: to livestock producers as recurring defensive expenditure, and to people whose cereal-based diet is not reached by feed additives. The private threshold for Se fertilisation is small, 41 kg ha−1 at the Austrian wheat price of 2025, so a modest yield gain would move part of the cost to the producer. For Austria, Se-enriched fertilisation of all cereals would cost about EUR 5.6 million per year, or EUR 0.60 per inhabitant, add about 4.5 µg of daily Se intake through domestic wheat and rye, and pay for itself if it avoided 0.7–3.7% of the cost of hypothyroidism alone. Low Se can limit the functional benefit of iodine, iron, copper, zinc, manganese and vitamin E, although parallel and compensating pathways reduce this effect. In the base case, the model identifies the structure of a potential negative externality: the actor who could intervene upstream receives no private yield return, while part of any Se-attributable downstream burden would accrue to other actors. The Finnish experience shows that it can be corrected at the soil node within a narrow and monitored range.
Supplementary Materials
The following supporting information can be downloaded at the website of this paper posted on Preprints.org, File S1: Model code (S1_se_cascade_model.py; Python 3.13, NumPy 2.5, random seed 42), model output (S1_results.json) and figure code (S2_make_figures.py), which reproduce all numerical model results and Figure 1, Figure 2 and Figure 3; Figure 1 and Figure 3 use the model output, and Figure 2 is conceptual. The same files are archived at Zenodo, https://doi.org/10.5281/zenodo.24171208.
Author Contributions
Conceptualization, methodology, software, formal analysis, investigation, data curation, writing—original draft preparation, writing—review and editing, visualization, D.O. The author has read and agreed to the published version of the manuscript.
Funding
This research received no external funding.
Institutional Review Board Statement
Not applicable. The study uses only published and official data.
Informed Consent Statement
Not applicable.
Data Availability Statement
No new primary data were generated. All inputs are listed in Table 1 with their sources. The model script, the figure script and the model output are openly available at Zenodo, https://doi.org/10.5281/zenodo.24171208, under the MIT licence (code) and CC BY 4.0 (output).
Acknowledgments
During the preparation of this manuscript, the author used Claude (Anthropic; versions of August–November 2026) and ChatGPT (OpenAI; versions of August–November 2026) for the purposes of language editing and grammar correction, support of the literature search and source checking, and drafting of the model code and figures. The author has reviewed and edited the output and takes full responsibility for the content of this publication.
Conflicts of Interest
The author is the owner of OSENUM Ges. für Energie- und Umweltmanagement e.U. (Vienna, Austria), which markets the mycorrhizal soil product Mykosoil. Mykosoil contains no selenium. The product is not mentioned, tested or evaluated in this study, and no product-specific data were used. The author declares no other conflicts of interest.
References
- Osada, D. The Biological Nutrient Cycle as an Economic Determinant: Soil – Food/Feed – Animal – Human and the Cost of Micronutrient Deficiency. Conference abstract sciforum-188861. In 2026 International Conference on Agricultural Sciences (ICAS 2026), Bologna, Italy, 21–23 October 2026; MDPI: Basel, Switzerland, 2026. Available online: https://sciforum.net/event/ICAS2026 (accessed on 12 November 2026).
- 2. Rayman, M.P. Selenium and human health. Lancet 2012, 379, 1256–1268. [CrossRef]
- Rengel, Z.; Cakmak, I.; White, P.J., Eds. Marschner’s Mineral Nutrition of Plants, 4th ed.; Academic Press: London, UK, 2022.
- White, P.J.; Broadley, M.R. Biofortification of crops with seven mineral elements often lacking in human diets—Iron, zinc, copper, calcium, magnesium, selenium and iodine. New Phytol. 2009, 182, 49–84. [CrossRef]
- Broadley, M.R.; Alcock, J.; Alford, J.; Cartwright, P.; Foot, I.; Fairweather-Tait, S.J.; Hart, D.J.; Hurst, R.; Knott, P.; McGrath, S.P.; et al. Selenium biofortification of high-yielding winter wheat (Triticum aestivum L.) by liquid or granular Se fertilisation. Plant Soil 2010, 332, 5–18. [CrossRef]
- Huang, R.; Bañuelos, G.S.; Zhao, J.; Wang, Z.; Farooq, M.R.; Yang, Y.; Song, J.; Zhang, Z.; Chen, Y.; Yin, X.; et al. Comprehensive evaluation of factors influencing selenium fertilization biofortification. J. Sci. Food Agric. 2024, 104, 6100–6107. [CrossRef]
- Yan, G.; Wu, L.; Hou, M.; Jia, S.; Jiang, L.; Zhang, D. Effects of selenium application on wheat yield and grain selenium content: A global meta-analysis. Field Crops Res. 2024, 307, 109266. [CrossRef]
- Pigou, A.C. The Economics of Welfare; Macmillan: London, UK, 1920.
- Schläpfer, F.; Vatn, A. Regulation of externalities: Rights, options, and procedure. Front. Environ. Econ. 2023, 2, 1188700. [CrossRef]
- Stoffaneller, R.; Morse, N.L. A review of dietary selenium intake and selenium status in Europe and the Middle East. Nutrients 2015, 7, 1494–1537. [CrossRef]
- EFSA Panel on Dietetic Products, Nutrition and Allergies (NDA). Scientific Opinion on Dietary Reference Values for selenium. EFSA J. 2014, 12, 3846. [CrossRef]
- Kipp, A.P.; Strohm, D.; Brigelius-Flohé, R.; Schomburg, L.; Bechthold, A.; Leschik-Bonnet, E.; Heseker, H. Revised reference values for selenium intake. J. Trace Elem. Med. Biol. 2015, 32, 195–199. [CrossRef]
- Österreichisches Gesundheitsportal. Selen. Available online: https://www.gesundheit.gv.at/leben/ernaehrung/vitamine-mineralstoffe/spurenelemente/selen.html (accessed on 12 November 2026).
- Sager, M.; Hoesch, J. Selenium uptake in cereals grown in Lower Austria. J. Cent. Eur. Agric. 2006, 7, 71–78. Available online: https://hrcak.srce.hr/17344 (accessed on 12 November 2026).
- Liaskos, M.; Fark, N.; Ferrario, P.G.; Engelbert, A.K.; Merz, B.; Hartmann, B.; Watzl, B. First review on the selenium status in Germany covering the last 50 years and on the selenium content of selected food items. Eur. J. Nutr. 2023, 62, 71–82. [CrossRef]
- Wimmer, I.; Hartmann, T.; Brustbauer, R.; Minear, G.; Dam, K. Selenium levels in patients with autoimmune thyroiditis and controls in Lower Austria. Horm. Metab. Res. 2014, 46, 707–709. [CrossRef]
- Stroud, J.L.; Li, H.F.; Lopez-Bellido, F.J.; Broadley, M.R.; Foot, I.; Fairweather-Tait, S.J.; Hart, D.J.; Hurst, R.; Knott, P.; Mowat, H.; et al. Impact of sulphur fertilisation on crop response to selenium fertilisation. Plant Soil 2010, 332, 31–40. [CrossRef]
- Harrison, J.H.; Hancock, D.D.; Conrad, H.R. Vitamin E and selenium for reproduction of the dairy cow. J. Dairy Sci. 1984, 67, 123–132. [CrossRef]
- Hosnedlova, B.; Kepinska, M.; Skalickova, S.; Fernandez, C.; Ruttkay-Nedecky, B.; Malevu, T.D.; Sochor, J.; Baron, M.; Melcova, M.; Zidkova, J.; et al. A summary of new findings on the biological effects of selenium in selected animal species—A critical review. Int. J. Mol. Sci. 2017, 18, 2209. [CrossRef]
- Wu, Q.; Rayman, M.P.; Lv, H.; Schomburg, L.; Cui, B.; Gao, C.; Chen, P.; Zhuang, G.; Zhang, Z.; Peng, X.; et al. Low population selenium status is associated with increased prevalence of thyroid disease. J. Clin. Endocrinol. Metab. 2015, 100, 4037–4047. [CrossRef]
- Wu, Q.; Wang, Y.; Chen, P.; Wei, J.; Lv, H.; Wang, S.; Wu, Y.; Zhao, X.; Peng, X.; Rijntjes, E.; et al. Increased incidence of Hashimoto thyroiditis in selenium deficiency: A prospective 6-year cohort study. J. Clin. Endocrinol. Metab. 2022, 107, e3603–e3611. [CrossRef]
- Oumer, A.; Joy, E.J.M.; De Groote, H.; Broadley, M.R.; Gashu, D. Burden of selenium deficiency and cost-effectiveness of selenium agronomic biofortification of staple cereals in Ethiopia. Br. J. Nutr. 2024, 132, 1110–1122. [CrossRef]
- Alfthan, G.; Eurola, M.; Ekholm, P.; Venäläinen, E.-R.; Root, T.; Korkalainen, K.; Hartikainen, H.; Salminen, P.; Hietaniemi, V.; Aspila, P.; Aro, A. Effects of nationwide addition of selenium to fertilizers on foods, and animal and human health in Finland: From deficiency to optimal selenium status of the population. J. Trace Elem. Med. Biol. 2015, 31, 142–147. [CrossRef]
- Eurola, M.; Alainen, T.; Berlin, T.; Ekholm, P.; Erlund, I.; Hietaniemi, V.; Mannio, J.; Mykkänen, S.; Pulkkinen, M.; Root, T.; et al. Report of the Selenium Working Group 2022; Natural Resources and Bioeconomy Studies 89/2022; Natural Resources Institute Finland (Luke): Helsinki, Finland, 2022. Available online: http://urn.fi/URN:ISBN:978-952-380-534-7 (accessed on 12 November 2026).
- Bolan, N.; Srinivasarao, C.; Rocco, C.; Bolan, S.; Mansoor, S.; Wani, O.A.; Ahmad, P.; Weiss, D.; Northover, G.; Sánchez-Palacios, J.T.; et al. Zinc in soil–crop–animal–human health continuum. Adv. Agron. 2025, 189, 1–61. [CrossRef]
- Hepp, Z.; Lage, M.J.; Espaillat, R.; Gossain, V.V. The direct and indirect economic burden of hypothyroidism in the United States: A retrospective claims database study. J. Med. Econ. 2021, 24, 440–446. [CrossRef]
- U.S. Bureau of Labor Statistics. Consumer Price Index for All Urban Consumers: All Items (CPI-U) and Medical Care (CUUS0000SAM), U.S. City Average. Retrieved from FRED, Federal Reserve Bank of St. Louis. Available online: https://fred.stlouisfed.org/series/CUUS0000SAM (accessed on 12 November 2026).
- European Central Bank. Euro Foreign Exchange Reference Rates, Annual Average 2025 (USD 1.1300), as Published by Suomen Pankki. Available online: https://www.suomenpankki.fi/en/statistics/interest-rates-and-exchange-rates/exchange-rates/average-annual-exchange-rates-for-the-year-2025/ (accessed on 12 November 2026).
- Yi, Z.; Owusu-Edusei, K.; Flem, E.; Feemster, K.; Elbasha, E.H. Economic evaluation of PCV21 use in populations with increasing serotype 4 invasive pneumococcal disease in the US: An attributable fraction threshold analysis. Infect. Dis. Ther. 2026, 15, 1893–1912. [CrossRef]
- van der Ploeg, R.R.; Böhm, W.; Kirkham, M.B. On the origin of the theory of mineral nutrition of plants and the law of the minimum. Soil Sci. Soc. Am. J. 1999, 63, 1055–1062.
- Ministry of Agriculture and Forestry of Finland. Decree 964/2023 on Fertiliser Products, Section 9 (Selenium). Available online: https://www.finlex.fi (accessed on 12 November 2026).
- Statistik Austria. Land- und forstwirtschaftliche Erzeugerpreise, Jahresdurchschnitt 2025; Statistik im Fokus 1.1; Statistik Austria: Vienna, Austria, 2026. Available online: https://www.statistik.at/fileadmin/publications/SB_1-1_EP-13_2025.pdf (accessed on 12 November 2026).
- Statistik Austria. Feldfruchternte 2025; Statistik im Fokus 1.12; Statistik Austria: Vienna, Austria, 2025. Available online: https://www.statistik.at/fileadmin/publications/SB_1-12_Feldfruchternte_2025.pdf (accessed on 12 November 2026).
- Statistik Austria. Versorgungsbilanzen für pflanzliche Produkte 2024/2025; Statistik im Fokus 1.27; Statistik Austria: Vienna, Austria, 2026. Available online: https://www.statistik.at/fileadmin/publications/SB_1-27_Versorgungsbilanzen-pflanzliche-Produkte-2024-25.pdf (accessed on 12 November 2026).
- Hart, D.J.; Fairweather-Tait, S.J.; Broadley, M.R.; Dickinson, S.J.; Foot, I.; Knott, P.; McGrath, S.P.; Mowat, H.; Norman, K.; Scott, P.R.; et al. Selenium concentration and speciation in biofortified flour and bread: Retention of selenium during grain biofortification, processing and production of Se-enriched food. Food Chem. 2011, 126, 1771–1778. [CrossRef]
- Garmendia Madariaga, A.; Santos Palacios, S.; Guillén-Grima, F.; Galofré, J.C. The incidence and prevalence of thyroid dysfunction in Europe: A meta-analysis. J. Clin. Endocrinol. Metab. 2014, 99, 923–931. [CrossRef]
- Mendes, D.; Alves, C.; Silverio, N.; Batel Marques, F. Prevalence of undiagnosed hypothyroidism in Europe: A systematic review and meta-analysis. Eur. Thyroid J. 2019, 8, 130–143. [CrossRef]
- National Research Council. Nutrient Requirements of Swine, 11th rev. ed.; National Academies Press: Washington, DC, USA, 2012. [CrossRef]
- Commission Implementing Regulation (EU) 2019/49 of 4 January 2019 Concerning the Authorisation of Sodium Selenite, Coated Granulated Sodium Selenite and Zinc-L-Selenomethionine as Feed Additives for All Animal Species. Off. J. Eur. Union 2019, L 10, 2–7.
- National Academies of Sciences, Engineering, and Medicine. Nutrient Requirements of Dairy Cattle, 8th rev. ed.; The National Academies Press: Washington, DC, USA, 2021. [CrossRef]
- Statistik Austria. Bevölkerung zu Jahresbeginn 2026 (endgültige Ergebnisse). Press release, 29 June 2026. Available online: https://www.statistik.at/fileadmin/announcement/2026/08/20260629Demographie.pdf (accessed on 12 November 2026).
- Fan, M.-S.; Zhao, F.-J.; Poulton, P.R.; McGrath, S.P. Historical changes in the concentrations of selenium in soil and wheat grain from the Broadbalk experiment over the last 160 years. Sci. Total Environ. 2008, 389, 532–538. [CrossRef]
- Fan, M.-S.; Zhao, F.-J.; Fairweather-Tait, S.J.; Poulton, P.R.; Dunham, S.J.; McGrath, S.P. Evidence of decreasing mineral density in wheat grain over the last 160 years. J. Trace Elem. Med. Biol. 2008, 22, 315–324. [CrossRef]
- Bourne, N.; Laven, R.; Wathes, D.C.; Martinez, T.; McGowan, M. A meta-analysis of the effects of vitamin E supplementation on the incidence of retained foetal membranes in dairy cows. Theriogenology 2007, 67, 494–501. [CrossRef]
- Moghimi-Kandelousi, M.; Alamouti, A.A.; Imani, M.; Zebeli, Q. A meta-analysis and meta-regression of the effects of vitamin E supplementation on serum enrichment, udder health, milk yield, and reproductive performance of transition cows. J. Dairy Sci. 2020, 103, 6157–6166. [CrossRef]
- Wicaksono, A.; van den Borne, B.H.P.; Aardema, H.; van Werven, T.; Hogeveen, H.; Steeneveld, W. Estimating the costs of interrelated reproductive disorders in dairy farms. J. Dairy Sci. 2025, 108, 8508–8528. [CrossRef]
- Shen, H.; Thomas, P.R.; Ensley, S.M.; Kim, W.-I.; Loynachan, A.T.; Halbur, P.G.; Opriessnig, T. Vitamin E and selenium levels are within normal range in pigs diagnosed with mulberry heart disease and evidence for viral involvement in the syndrome is lacking. Transbound. Emerg. Dis. 2011, 58, 483–491. [CrossRef]
- Praus, L.; Ducháček, J.; Mrština, T.; Kaplan, L.; Sekaninová, J.; Janků, M.; Száková, J.; Tlustoš, P.; Stádník, L.; Cihlářová, K. Preliminary study: From biofortified maize to cow milk enriched with selenium: An on-farm strategy using selenium-enriched silage. Czech J. Anim. Sci. 2025, 70, 415–427. [CrossRef]
- EFSA Panel on Nutrition, Novel Foods and Food Allergens (NDA). Scientific opinion on the tolerable upper intake level for selenium. EFSA J. 2023, 21, e07704. [CrossRef]
- Huwiler, V.V.; Maissen-Abgottspon, S.; Stanga, Z.; Mühlebach, S.; Trepp, R.; Bally, L.; Bano, A. Selenium supplementation in patients with Hashimoto thyroiditis: A systematic review and meta-analysis of randomized clinical trials. Thyroid 2024, 34, 295–313. [CrossRef]
- Zimmermann, M.B.; Köhrle, J. The impact of iron and selenium deficiencies on iodine and thyroid metabolism: Biochemistry and relevance to public health. Thyroid 2002, 12, 867–878. [CrossRef]
- Köhrle, J. Selenium, iodine and iron—Essential trace elements for thyroid hormone synthesis and metabolism. Int. J. Mol. Sci. 2023, 24, 3393. [CrossRef]
- Winther, K.H.; Rayman, M.P.; Bonnema, S.J.; Hegedüs, L. Selenium in thyroid disorders—Essential knowledge for clinicians. Nat. Rev. Endocrinol. 2020, 16, 165–176. [CrossRef]
- Ighodaro, O.M.; Akinloye, O.A. First line defence antioxidants—Superoxide dismutase (SOD), catalase (CAT) and glutathione peroxidase (GPX): Their fundamental role in the entire antioxidant defence grid. Alex. J. Med. 2018, 54, 287–293. [CrossRef]
- Hien, T.; Schwartz, C.; Garcia, S. From soil sciences to soil economics: A cross-analysis of natural capital and soil ecosystem service provision. Environ. Sci. Policy 2025, 169, 104088. [CrossRef]
- Finnish Food Authority (Ruokavirasto). Seleenilannoitus [Selenium Fertilisation]. Available online: https://www.ruokavirasto.fi/kasvit/lannoitevalmisteet/laatuvaatimukset/seleeni/ (accessed on 12 November 2026).
Table 3.
National break-even of Se-enriched fertilisation in Austria (EUR 2025).
| Indicator | Cereals (741,200 ha) | All arable land (1,320,833 ha) |
|---|---|---|
| Annual programme cost, central (pessimistic price) | EUR 5.57 M (7.65 M) | EUR 9.54 M (13.25 M) |
| Cost per inhabitant and year | EUR 0.60 | EUR 1.04 |
| Hypothyroidism cost pool, EUR 529–2938 per patient-year | EUR 149–826 M | EUR 149–826 M |
| AF*, deterministic | 0.7–3.7% | 1.2–6.4% |
| AF*, Monte Carlo median (90% interval) | 1.7% (0.6–4.9%) | 2.9% (1.0–8.4%) |
| Required avoided cost in patient-year equivalents (EUR 529) | ≈10,500 | ≈18,000 |
| Benefit–cost ratio if AF = 1% | 0.27–1.48 | 0.16–0.87 |
| Benefit–cost ratio if AF = 5% | 1.33–7.41 | 0.78–4.33 |
| Benefit–cost ratio if AF = 10% | 2.67–14.82 | 1.56–8.66 |
AF*, break-even attributable fraction (Equation (3)). Only hypothyroidism is costed, so AF* is the share of the benefit that would have to come from this single cost pool.
Table 4.
Co-limitation pathways in which low Se can limit the functional benefit of other micronutrients.
Table 4.
Co-limitation pathways in which low Se can limit the functional benefit of other micronutrients.
| Pathway | Nutrients needed before or together with Se | Se-dependent step | Effect when Se is low | Compensation; endpoint and evidence |
|---|---|---|---|---|
| Thyroid axis | Iodine (substrate); iron (haem of thyroid peroxidase) | Deiodinases DIO1, DIO2; GPx in thyrocyte | Less T3 from the iodine supplied; oxidative stress in the gland | Partial regulatory compensation; hypothyroidism, AIT, goitre [21,50,53] |
| Peroxide clearance | Cu, Zn (SOD1); Mn (SOD2); Fe (catalase) | Glutathione peroxidases | Slower clearance of H2O2 formed by SOD | Parallel route via catalase; oxidative damage [54] |
| Lipid peroxidation | Vitamin E; dietary lipids | GPx reduction of lipid hydroperoxides | Vitamin E alone not sufficient under co-limitation | Other peroxidases contribute; retained placenta 17.5% vs 0% [18] |
| Crop uptake (reverse) | Sulphur (required by plants) | None in the plant; selenate competes with sulphate | S fertilisation that raises yield can lower grain Se | No cost to the producer; cost moves downstream [17,42] |
AIT, autoimmune thyroiditis; GPx, glutathione peroxidase; SOD, superoxide dismutase; T3, triiodothyronine.
Disclaimer/Publisher’s Note: The statements, opinions and data contained in all publications are solely those of the individual author(s) and contributor(s) and not of MDPI and/or the editor(s). MDPI and/or the editor(s) disclaim responsibility for any injury to people or property resulting from any ideas, methods, instructions or products referred to in the content. |
© 2026 by the authors. Licensee MDPI, Basel, Switzerland. This article is an open access article distributed under the terms and conditions of the Creative Commons Attribution (CC BY) license (http://creativecommons.org/licenses/by/4.0/).
Copyright: This open access article is published under a Creative Commons CC BY 4.0 license, which permit the free download, distribution, and reuse, provided that the author and preprint are cited in any reuse.