

Submitted:
09 November 2026
Posted:
12 November 2026
You are already at the latest version
Abstract
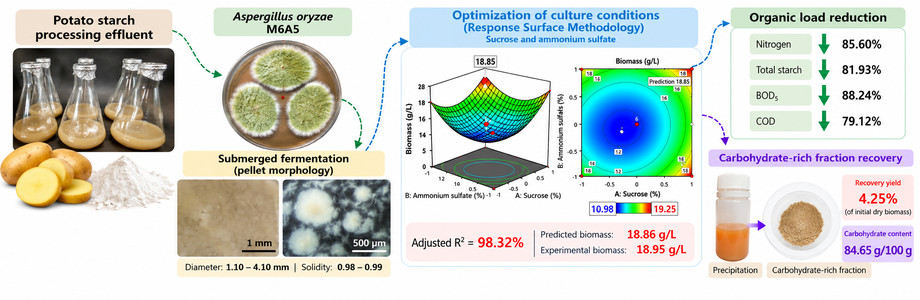
Potato starch processing effluents contain organic matter and nutrients that can support fungal growth and enable waste valorization. This study evaluated biomass production, pellet morphology, organic load reduction, and recovery of a carbohydrate-rich fraction during cultivation of Aspergillus oryzae M6A5 in potato starch processing effluent. Culture conditions were first screened using a one-factor-at-a-time approach, after which sucrose and ammonium sulfate concentrations were optimized using response surface methodology. The quadratic model showed a high goodness of fit (adjusted R² = 98.32%) and predicted a maximum biomass concentration of 18.86 g/L within the optimization region defined by coded factor levels from −1 to +1. Experimental validation under the selected conditions yielded 18.95 g/L, closely matching the predicted value. All analyzed structures were classified as smooth filamentous pellets, with diameters ranging from 1.10 to 4.10 mm and solidity values of 0.98–0.99. Fermentation reduced nitrogen and total starch concentrations by 85.60% and 81.93%, respectively, while five-day biochemical oxygen demand (BOD₅) and chemical oxygen demand (COD) decreased by 88.24% and 79.12%, respectively. The recovered carbohydrate-rich fraction represented 4.25% of the initial dry biomass and contained 84.65 g total carbohydrates per 100 g of biomass. Overall, A. oryzae M6A5 effectively combined fungal biomass production with substantial organic load reduction and recovery of a carbohydrate-rich fraction, supporting the potential use of potato starch processing effluent as a substrate for integrated fungal valorization.
Keywords:
Aspergillus oryzae
; potato starch processing effluent
; fungal biomass
; submerged fermentation
; pellet morphology
; waste valorization
1. Introduction
Aspergillus oryzae is widely used in biotechnology to produce enzymes, organic acids, and other metabolites for food processing and fermentation. These include α-amylase, proteases, lipases, cellulases, glucoamylases, malic acid, citric acid, succinic acid, fumaric acid, pyruvic acid, kojic acid, myristic acid, ergosterol, ergothioneine, L-tyrosine, L-phenylalanine, L-tryptophan, and xylitol [1,2,3,4,5,6,7,8,9]. Its ability to grow on complex substrates while producing hydrolytic enzymes and other metabolites makes A. oryzae particularly useful in food biotechnology and in bioprocesses based on food-processing materials and residual streams.
The fungal biomass generated during A. oryzae fermentation can also be considered a process product rather than simply a byproduct. Within a fungal cell factory framework, this biomass can be recovered for use in food ingredients, biotechnological products, and materials [10,11,12].
A. oryzae biomass contains cell wall polysaccharides, including chitin and glucans, as well as proteins, lipids, and minerals [13], and it may also contain essential amino acids and fatty acids [8]. This composition makes biomass produced from agro-industrial residues a potential source of nutritional ingredients, functional components, and biomaterials [14].
Structural polysaccharides are among the components recoverable from A. oryzae biomass. Glucans may account for approximately 34.29% of cell dry weight, while chitin may represent approximately 11.54% under submerged fermentation conditions. Chitosan extraction yields of approximately 10% have also been reported [15,16,17]. β-Glucans have been studied for nutritional and biological applications and for their effects on viscosity, gelation, and food matrix structure [18]. Other Glucan- and chitin-containing fungal biomass has also been investigated for biodegradable films with barrier properties, extending its potential use to food-related materials and packaging applications [19].
Residual fungal biomass and other byproducts from biotechnological processes may be used in low-value applications or discarded, even though they may still contain recoverable components. Integrated biorefinery strategies can recover additional products from these streams and improve resource use within a circular bioeconomy framework [20,21]. This is especially relevant for residual streams from food processing, which may retain nutrients that can support microbial growth.
Potato starch processing generates liquid waste streams, with reported wastewater volumes of 5–12 m³ per metric ton of potatoes processed [22]. These effluents contain organic matter and nutrients, including magnesium, potassium, sodium, calcium, sulfur, and phosphorus, as well as vitamins C, B1, B2, B6, and E [23]. Reported protein and sugar contents range from 0.93% to 1.57% and from 0.5% to 0.8%, respectively, with a fat content of approximately 0.2% [24]. Reported chemical oxygen demand (COD) values range from 10000 to 33856.90 mg/L, while biochemical oxygen demand (BOD) values are reported at approximately 11635 mg/L [25,26], indicating a high organic load.
Although these effluents require adequate management before discharge, their carbon, nitrogen, and other nutrients may also support fungal cultivation. A. oryzae has a long history of use in traditional food fermentation and is generally recognized as safe (GRAS). Traditional applications include producing miso, shoyu, tane-koji, and sake [27,28,29].
Previous studies have also evaluated A. oryzae biomass production using potato protein liquor and other agro-industrial residual streams, where fungal growth may reduce organic load by assimilating carbohydrates, nitrogen, and other soluble compounds [27,28,29,30,31]. Fungal cultivation may therefore combine biomass production with partial reduction of the organic load in food-processing effluents.
From an engineering standpoint, process performance also depends on fungal morphology and cultivation conditions. In submerged fermentation, filamentous fungi can grow as pellets, clumps, or dispersed mycelium, and these growth forms affect broth properties, mass transfer, nutrient availability, and process productivity [32,33,34]. Pellet size, density, and internal structure can influence oxygen and substrate diffusion and may affect biomass production [35,36,37]. Morphology also affects downstream operations because pelletized and dispersed biomass differ in handling and recovery.
Food-processing residual streams may not provide the nutrient balance required for maximum biomass production, making process optimization an important engineering step. Adjusting nutrient supplementation can improve biomass production while retaining the effluent as the main culture matrix. Considering biomass production, fungal morphology, organic load reduction, and recovery of a carbohydrate-rich fraction together provides a broader view of process performance and biomass valorization.
Within a food bioprocess engineering framework, this study investigated integrating potato starch processing effluent utilization and biomass valorization using A. oryzae M6A5, focusing on biomass production, morphological characteristics, organic load reduction, and recovery of a carbohydrate-rich fraction.
2. Materials and Methods
2.1. Materials
Liquid effluent from potato starch processing was collected from the Starch Processing Pilot Plant at Universidad Politécnica Estatal del Carchi (UPEC), located at the San Francisco Experimental Farm in Huaca, Carchi, Ecuador. Samples collected on three consecutive production days (50 L/day) were pooled and thoroughly homogenized. The resulting composite sample was distributed into 1-L polyethylene bottles and stored at −18 °C until use. Before each experiment, the required volume was thawed and used as the culture medium.
Aspergillus oryzae M6A5 was isolated from cereal grain samples and identified by sequencing the internal transcribed spacer (ITS) region at the Molecular Microbiology Laboratory of UPEC. The strain was cryopreserved in 30% (v/v) glycerol until use. The ITS sequence was deposited in the National Center for Biotechnology Information (NCBI) GenBank database under accession number PQ108904 and is available at https://www.ncbi.nlm.nih.gov/nuccore/PQ108904
Unless otherwise specified, reagents were of analytical grade. Sucrose, molasses, and potato starch used as carbon sources were purchased locally.
2.2. Inoculum Preparation
Spores were harvested from A. oryzae M6A5 cultures grown on potato dextrose agar (PDA) at 27 °C for 5–7 days. Twenty milliliters of sterile water were added to each plate, and the spores were gently dislodged with a sterile inoculating loop. The resulting spore suspension was adjusted to 5 × 10⁶ spores/mL and used to inoculate the submerged cultures [38,39].
2.3. Optimization for Biomass Production
Submerged fermentation was conducted in 250-mL Erlenmeyer flasks fitted with cotton plugs. Each flask contained 100 mL of potato starch processing effluent, whereas unsupplemented effluent served as the control. Supplemented media followed the experimental conditions described below. After sterilization at 121 °C for 20 min, the media were cooled and inoculated with 3 mL of spore suspension containing 5 × 10⁶ spores/mL [40].
A one-factor-at-a-time (OFAT) approach initially assessed the effects of cultivation time, initial pH, temperature, and carbon and nitrogen sources on biomass production [41]. Temperature and initial pH were examined using unsupplemented effluent. The tested temperatures were 25, 30, 35, and 40 °C, and the initial pH values were 2, 3, 4, 5, 6, and 7. Initial pH adjustment used 0.5 N HCl or 0.5 N NaOH.
Glucose, sucrose, molasses, and potato starch served as carbon sources, whereas ammonium chloride, ammonium sulfate, yeast extract, and urea served as nitrogen sources. Carbon-source experiments contained no additional nitrogen supplementation, while nitrogen-source experiments contained no additional carbon supplementation. Each source was evaluated at 0.5, 1.0, or 1.5 g/100 mL of culture medium. Cultures were incubated at 25 °C for 4 days at an initial pH of 6.
Subsequent experiments examined sucrose concentrations of 0, 0.2, 0.4, 0.6, 0.8, 1.0, 2.0, and 3.0 g/100 mL and ammonium sulfate concentrations of 0, 0.2, 0.4, 0.6, 0.8, 1.0, 1.2, and 2.0 g/100 mL. All cultures were incubated in an orbital shaking incubator (BOECO, Berlin, Germany) at 150 rpm.
Sucrose and ammonium sulfate were selected for further optimization by response surface methodology (RSM) using a central composite design (CCD) [42]. The design included two independent cultures for each noncentral point and six independent cultures at the center point. Experimental runs followed a randomized order generated by the design software. The resulting quadratic model was analyzed using Design-Expert software, version 13 (trial version; Stat-Ease Inc., USA).
Model fit was evaluated using analysis of variance (ANOVA), tests of model and term significance, and a lack-of-fit test. The coefficient of determination (R²), adjusted R², and adequate precision were also examined [42].
The fitted response surface model defined the biomass-maximizing condition within a restricted optimization region corresponding to coded sucrose and ammonium sulfate levels from −1 to +1. Experimental validation used two independent cultures at the selected factor levels. Agreement between observed biomass concentrations and the model prediction was then assessed [42].
2.4. Changes in Culture Medium Composition and Organic Load
Total solids were determined by drying 10 mL of homogenized sample in preweighed porcelain dishes at 105 °C to constant weight. Suspended solids were estimated by centrifuging 50 mL of homogenized sample in a 100-mL centrifuge tube at 3000 × g for 10 min, then drying the recovered solids at 105 °C to constant weight. Soluble solids were estimated from the difference between total solids and solids recovered by centrifugation. Ash content was obtained by incinerating the total solids in a muffle furnace at 575 °C until a light gray or white ash remained [43].
Nitrogen content was determined by the Kjeldahl method. A 10-mL aliquot of culture medium was mixed with 15 mL of concentrated H₂SO₄ and two Kjeldahl catalyst tablets and digested at 420 °C for 1 h. Distillation of the digest released ammonia, which was collected in 25 mL of 4% (w/v) boric acid containing Shiro–Tashiro mixed indicator. A total of 100 mL of distillate was collected and titrated with 0.1 N HCl [30].
Total starch was determined using the iodine method. Samples were treated with 52% perchloric acid, and absorbance was recorded at 600 nm. Starch concentration was calculated from a calibration curve prepared with starch standards [44]. Total sugars were quantified by the phenol–sulfuric acid method, whereas reducing sugars were measured by the 3,5-dinitrosalicylic acid (DNS) method [45]. Absorbance readings were obtained at 490 and 540 nm, respectively, and sugar concentrations were calculated from glucose calibration curves.
Five-day biochemical oxygen demand (BOD₅) was determined from dissolved oxygen depletion during incubation at 20 °C for 5 days. Samples were diluted to fall within the appropriate measurement range and transferred to airtight 300-mL BOD bottles. Dissolved oxygen was measured before and after incubation at 20 °C for 5 days. BOD₅ was calculated from the decrease in dissolved oxygen concentration, accounting for the dilution factor, and expressed as mg O₂/L. Chemical oxygen demand (COD) was determined using the closed reflux method. Briefly, 3 mL of diluted sample was mixed with 2 mL of K₂Cr₂O₇ and 4 mL of H₂SO₄ and digested at 150 °C for 2 h using an ECO 16 thermoreactor (VELP, Rome, Italy). After cooling, COD was measured using an S-220 UV/VIS spectrophotometer (BOECO, Berlin, Germany) and expressed as mg O₂/L.
Chemical composition and organic load were measured before and after fermentation. The percentage reductions in chemical parameters and organic load were calculated from the initial and final concentrations using the following equation [(C0 − Cf)/C0] × 100, where C0 and Cf represent the concentrations before and after fermentation, respectively [46].
2.5. Biomass Determination
Harvested biomass was washed with deionized water to remove residual culture medium and dried at 105 °C to constant weight. To assess growth kinetics, biomass was harvested at 48-h intervals from three independent culture flasks per sampling time. Dry biomass concentration was calculated as follows: Biomass concentration (g/L) = ( P/V), where P represents the dry weight of the recovered biomass (g) and V represents the initial volume (L) [47].
2.6. Morphological Characterization of Biomass
Biomass morphology was characterized at the end of fermentation using a stereomicroscope (Stemi 305, ZEISS, Germany) equipped with an AxioCam MRc5 camera (ZEISS, Germany). A 5-mL aliquot of pellet-containing culture medium was transferred to a Petri dish containing 40 mL of 0.9% (w/v) saline solution to disperse the pellets before imaging. Multiple images were acquired under top illumination against a black background. The analysis included 100 pellets per sample, with pellet diameter reported in millimeters [48].
Mycelial morphology was classified as dispersed biomass, mycelial clumps, or pellets. Pellet classification included smooth, densely packed, compact with protruding hyphae, loosely packed, core–shell, and filamentous morphologies [49]. Surface area, equivalent volume, surface-to-volume ratio (A/V), and solidity were also calculated [37]. Image processing and morphological characterization were performed using the open-source software ImageJ (version 1.54). Images were converted to 8-bit grayscale, and an intensity threshold was automatically determined using Otsu’s method. The resulting binary images were analyzed using the Analyze Particles function in ImageJ.
Hyphae, spores, and reproductive structures were examined at 400× magnification using a trinocular light microscope (Primostar 3, ZEISS, Germany) equipped with an Axiocam 208 color camera (ZEISS, Germany) [35].
2.7. Extraction and Purification of the β-Glucans-Rich Fraction
Dried mycelium was ground using a rotor mill (Tecnal R-TE-651/2, Brazil). Soxhlet extraction with 95% ethanol for 3 h removed the lipid fraction, followed by washing with hexane. After drying, the defatted residue underwent hot-water extraction at a solid-to-liquid ratio of 1:40 (w/v), 121 °C, and 15 psi for 1 h. The extraction was repeated three times, and the extracts were filtered through a 72-μm nylon mesh. The filtrate was centrifuged at 2000 × g for 15 min using a benchtop centrifuge (HERMLE Z206A, Hermle Labortechnik, Berlin, Germany). The resulting supernatant was concentrated to one-fifth of its original volume and precipitated with 80% ethanol at a 1:6 (v/v) ratio for 24 h at 4 °C. Centrifugation at 2,000 × g for 15 min recovered the precipitate [50,51].
The precipitated fraction was purified by successive washes with an acetone–ether mixture (1:1, v/v) and 99% ethanol, using an acetone–ether mixture-to-ethanol ratio of 1:3 (v/v) per portion of precipitate. Deproteinization was performed five times using a chloroform–n-butanol mixture (CHCl₃:n-BuOH, 5:1, v/v). The fraction was reprecipitated with 99% ethanol, dialyzed against distilled water for 72 h using a membrane with a molecular weight cutoff of 12–14 kDa, and lyophilized [52]. The extraction yield of β-glucans was calculated as, ((P1/P) × 100, where P1 represents the dry weight of the β-glucan-enriched fraction and P represents the initial dry weight of the filamentous fungal mycelium [51].
2.8. Preliminary Chemical Characterization of the β-Glucan-Enriched Fraction
The proximate composition of the carbohydrate-rich fraction was determined using methods described in the Official Methods of Analysis of AOAC International (2019) [53]. Moisture content was determined using Method 925.10, and total nitrogen was quantified by the Kjeldahl method following AOAC Method 2001.11. Crude protein content was estimated from total nitrogen using a conversion factor of 6.25. Crude fat and ash contents were determined according to Methods 2003.06 and 923.03, respectively. Total carbohydrate content was calculated by difference, subtracting the sum of the percentages of moisture, total fat, total protein, and ash from 100 (Total carbohydrates (%) = 100 − [moisture + crude fat + crude protein + ash])
2.9. Statistical Analysis
One-way analysis of variance (ANOVA) was used to compare responses across the experimental conditions evaluated in the OFAT experiments. Fisher’s least significant difference (LSD) test was used for pairwise comparisons of group means. Statistical significance was assessed at a 95% confidence level (p ≤ 0.05) [42]. Experiments were performed using three independent replicates unless otherwise specified. The CCD and model validation experiments used the replication schemes described in Section 2.3. Results are presented as the mean ± standard deviation. Statistical analyses were performed using Statgraphics XVI. Figures were generated in R using RStudio version 2025.05.1+513.
3. Results
3.1. Effects of Cultivation Time, Temperature, and Initial pH on Biomass Production
Biomass production depended on both cultivation temperature and time (Figure 1A). Biomass concentration increased during the first two days at all temperatures evaluated, but it increased most at 25 °C, where biomass reached a maximum of 10.28 g/L on day 4. At this time point, biomass concentration was significantly higher than at the other temperatures (p ≤ 0.05). After day 4, biomass declined progressively, although cultures at 25 °C remained higher than those grown at higher temperatures. The lowest biomass concentration at the end of cultivation occurred at 35 °C (2.71 g/L).
Initial pH also affected biomass production (Figure 1B), with significant differences among treatments (p ≤ 0.05). Biomass ranged from 1.16 g/L at an initial pH of 2 to 6.73 g/L at pH 6. Cultures initiated between pH 3 and 7 showed a marked pH increase, reaching final values above 8, whereas the culture initiated at pH 2 remained strongly acidic.
3.2. Effects of Carbon Source Supplementation and Sucrose Concentration on Biomass Production
Carbon supplementation significantly affected biomass production compared with the unsupplemented effluent (p ≤ 0.05) (Figure 2A). The control produced the lowest biomass concentration (6.55 g/L), whereas sucrose supplementation produced the highest value (10.39 g/L). Potato starch also supported relatively high biomass production (10.03 g/L), indicating that A. oryzae M6A5 can use both soluble and polymeric carbon sources under the tested cultivation conditions.
Sucrose concentration had a nonlinear effect on biomass production (Figure 2B). Biomass increased from the unsupplemented condition to a maximum of 6.38 g/L at 0.4 g/100 mL sucrose and then declined at higher concentrations. The 0 and 0.2 g/100 mL treatments did not differ significantly, whereas the remaining comparisons differed significantly (p ≤ 0.05). Accordingly, 0.4 g/100 mL was selected as the sucrose concentration for subsequent experiments.
3.3. Effects of Nitrogen Source Supplementation and Ammonium Sulfate Concentration on Biomass Production
Nitrogen source significantly affected biomass concentration (p ≤ 0.05) (Figure 3A). Ammonium sulfate produced the highest biomass concentration (6.61 g/L), whereas urea produced the lowest (4.74 g/L). Ammonium chloride and yeast extract produced intermediate responses.
Biomass production also depended on ammonium sulfate concentration (Figure 3B). Biomass increased from 3.10 g/L without supplementation to a maximum of 7.53 g/L at 0.8 g/100 mL and declined at higher concentrations.
3.4. Optimization by Response Surface (RSM) for Biomass Production
The central composite design produced biomass concentrations ranging from 10.98 to 19.25 g/L (Table 1). The highest experimental value, 19.25 g/L, occurred at the axial sucrose point corresponding to 0.67 g/100 mL sucrose and 0.8 g/100 mL ammonium sulfate. Model predictions remained close to the observed responses throughout the experimental design.
All regression coefficients in the quadratic model were statistically significant (p ≤ 0.05), supporting the inclusion of linear, quadratic, and interaction terms. Based on these terms, the quadratic regression equation describing biomass production by A. oryzae M6A5 in coded units is expressed as follows:
where YBiomasa is the predicted biomass concentration (g/L), and X1 and X2 are the coded sucrose and ammonium sulfate concentrations, respectively.
YBiomasa= 11.59 + 1.34X1 + 0.6344X2 − 0.5592X1X2 + 2.77X1X1 + 3.08X2X2,
The analysis of variance (ANOVA) presented in Table 2 shows that the quadratic model was statistically significant (F = 247.61, p ≤ 0.05). The model had a coefficient of determination (R²) of 98.72% and an adjusted R² of 98.32%. The lack-of-fit test was not significant (p = 0.1197).
The three-dimensional response surface (Figure 4A) revealed a curved quadratic surface rather than a linear plane, confirming interaction effects between sucrose and ammonium sulfate concentrations (p-value ≤ 0.05; F-value = 16.54). The two-dimensional contour plot (Figure 4B) further illustrated the region of maximum biomass production. Higher biomass concentrations corresponded to the red region of the surface plot.
3.5. Changes in Culture Medium Composition and Organic Load
Fermentation with A. oryzae M6A5 significantly decreased all measured culture-medium parameters (p ≤ 0.05) (Table 3). Among the compositional variables, nitrogen showed the largest reduction (85.60%), closely followed by soluble solids (84.43%) and total starch (81.93%). Total sugars showed the smallest decrease among the measured carbon-related components.
BOD₅ showed the largest overall decrease in organic-load indicators, falling by 88.24%, while COD decreased by 79.12%. Both changes were statistically significant (p ≤ 0.05). These reductions confirm that fungal cultivation markedly reduced the measured organic load in the culture medium.
3.6. Morphological Characterization
A. oryzae M6A5 formed well-defined pellets under the selected cultivation conditions (Figure 5A–C). All observed structures (100%) were classified as filamentous and smooth pellets (Table 4). Pellet diameters ranged from 1.10 to 4.10 mm, and solidity values of 0.98–0.99 were consistent with smooth, nearly convex outlines in the segmented images (Figure 5D–E).
3.7. Yield and Preliminary Chemical Characterization of the β-Glucan-Enriched Fraction
The recovered fraction represented 4.25% of the initial dry mycelial mass (Table 5). Total carbohydrates were the predominant component, accounting for 84.65 g/100 g of the recovered fraction. The remaining measured components occurred at considerably lower levels, indicating that the recovery procedure concentrated carbohydrate material relative to protein, fat, and ash.
4. Discussion
Among the temperatures tested, 25 °C supported the highest biomass concentration in potato starch processing effluent. This result contrasts with a previous study using cheese whey as a substrate for submerged fermentation, in which A. oryzae produced 5.29 g/L of biomass [14].
This temperature-dependent response may reflect changes in the expression of genes involved in sugar and membrane lipid metabolism [54], as well as differences in substrate composition and cultivation parameters [31]. The temperature and cultivation time that maximize biomass concentration may differ among strains, substrates, and cultivation systems.
The decline in biomass concentration after day 4 may reflect a transition from active growth to a stage characterized by reduced nutrient availability and increased cellular maintenance requirements. Previous research shows that prolonged cultivation can limit A. oryzae biomass productivity in soybean whey, whereas optimizing incubation time allows maximum biomass production within shorter cultivation periods [41]. Similarly, nutrient limitation has been associated with reduced metabolic activity [2]. These findings suggest that biomass decline after reaching its maximum may relate to progressive nutrient depletion, utilization of intracellular reserves, redistribution of carbon toward cellular maintenance rather than new biomass formation, and accumulation of metabolic byproducts in the culture medium.
The higher biomass production at pH 6 and the restricted growth at pH 2 align with previous findings that adjusting the initial pH to 5 accelerated A. oryzae growth in soybean whey, whereas an initial pH of approximately 3.7 significantly delayed biomass production [41]. Initial pH has also been reported to affect fungal biomass production in potato protein liquor [28]. Responses to initial pH may differ with substrate composition and changes in medium chemistry during cultivation. Under highly acidic conditions, the increased energy required to maintain cytosolic pH homeostasis may reduce the energy available for growth and cellular biosynthesis [41].
A progressive increase in pH during soybean whey fermentation has been associated with acid consumption in the medium [41]. Similarly, during submerged cultivation of A. oryzae in cheese whey, pH increased from 7.19 to 8.02 [14]. This pattern is consistent with the final pH values above 8 observed for strain A. oryzae M6A5. Changes in organic acid metabolism, nitrogen metabolism, and proton balance could contribute to alkalinization [41], although this study did not determine their contributions.
The response to different carbon sources is consistent with the metabolic versatility reported for A. oryzae. Biomass production has been demonstrated on complex carbohydrate substrates such as oat flour [55], while recombinant A. oryzae strains have produced similar biomass concentrations using glucose, sucrose, fructose, and xylose [56]. Carbon-source-dependent differences may involve regulation of sugar transport and hydrolytic enzyme expression. The transcription factor CreA participates in carbon metabolic regulation in A. oryzae [57], while starch and maltooligosaccharides can induce amylolytic systems, and glucose can participate in carbon catabolite repression [58]. These mechanisms may explain the observed response, although we did not measure carbon uptake, enzyme activity, or gene expression in A. oryzae M6A5.
Increasing sucrose above this concentration did not further increase biomass production. Similar responses have been reported for A. oryzae, where biomass can plateau despite continued residual sucrose, suggesting another nutritional or physiological factor becomes limiting [41,56]. In potato starch processing effluent, responses to both sucrose and starch matter because they show that fungal growth can use different carbon sources while the effluent remains the main culture matrix.
The higher biomass production achieved with ammonium sulfate suggests that Aspergillus oryzae M6A5 efficiently utilized this nitrogen source. Industrial A. oryzae strains have been reported to differ in their growth responses to nitrogen sources. Ammonium salts can support growth, whereas nitrate utilization may be limited in some strains by alterations in the nitrate transporter gene crnA [59]. Similarly, ammonium sulfate and ammonium chloride have produced different biomass responses during cultivation of A. oryzae on pomegranate-processing byproducts [60].
Ammonium assimilation may explain the response to ammonium sulfate supplementation. NADP-dependent glutamate dehydrogenase can incorporate ammonium into α-ketoglutarate to form glutamate, which donates amino groups in amino acid biosynthesis [54]. Differences in nitrogen transport and assimilation may contribute to strain-specific growth responses [59]. However, this pathway was not measured in A. oryzae M6A5 and therefore provides physiological context rather than direct evidence for the observed biomass response.
The decrease above 0.8 g/100 mL suggests that additional nitrogen did not promote further growth under these conditions. Previous studies have shown that nitrogen supplementation and carbon-to-nitrogen balance can influence A. oryzae growth and biomass composition [54,60].
In the optimization process, the highest biomass concentration obtained in the design falls within the 4.90–23.24 g/L range previously reported for A. oryzae in other submerged cultivation systems (Li et al., 2021; Pratama et al., 2025; Rousta et al., 2021). Differences among studies may reflect variations in fungal strain, substrate composition, and cultivation conditions. These results show that potato starch processing effluent supported biomass production by A. oryzae M6A5.
Differences among studies likely reflect variation in fungal strain, substrate composition, nutrient supplementation, and cultivation conditions. In the present system, the results show that potato starch processing effluent supported comparatively high fungal biomass production after nutrient supplementation.
The lack-of-fit test was not significant, providing no evidence of lack of fit relative to the pure error estimated from replicated design points. The high adjusted R² indicates that the fitted model accounted for most of the variation in the observed biomass concentrations.
The response surface showed pronounced curvature, indicating that biomass production depended on both sucrose and ammonium sulfate concentrations rather than increasing linearly with either nutrient (Figure 4). Within the deliberately restricted optimization region defined by coded factor levels from −1 to +1, the model predicted a maximum biomass concentration of 18.86 g/L with both factors at +1. Experimental validation under these conditions yielded 18.95 g/L, corresponding to a relative difference of only 0.48% from the predicted value. This close agreement supports the model’s predictive performance within the selected optimization region.
In the changes in culture medium composition and organic load, the reduction in nitrogen indicates substantial removal of soluble nitrogen from the culture medium during fungal growth. Previous studies using A. oryzae in residual-stream cultivation have also reported nitrogen utilization during biomass formation [27,62]. Fungal cells can use nitrogen to form amino acids, proteins, and other nitrogen-containing cellular components [54,62]. Although the present study did not directly quantify incorporation into biomass, the concurrent increase in fungal biomass and decrease in medium nitrogen are consistent with nutrient utilization during cultivation.
Starch also underwent one of the largest reductions among the measured carbon sources. This aligns with the strong amylolytic capacity of A. oryzae, whose amylolytic enzymes hydrolyze starch into lower-molecular-weight carbohydrates available for fungal growth [58]. Aspergillus can also use nutrients from starch-containing wastewater in microbial biomass production systems [8].
Similar reductions have been reported in other fungal systems. A 92.08% decrease in COD was obtained during cocultivation of A. oryzae and Chlorella pyrenoidosa in starch wastewater [63], while reductions of 95% in BOD and 92% in COD were reported during A. oryzae cultivation in whey supplemented with a lactase preparation [62]. Differences among these systems should be interpreted cautiously because substrate composition, initial organic load, fungal strain, supplementation, and process configuration differ substantially.
The concurrent decreases in nutrients, solids, BOD₅, and COD suggest that the fungus consumed or transformed some of the organic matter in the effluent, with some of this material potentially contributing to biomass formation. This relationship matters from a food bioprocess engineering perspective because biomass production and partial reduction of organic load occurred in the same fermentation step.
Despite the high percentage reductions, residual BOD₅ and COD concentrations remained elevated after fermentation. The process should therefore be considered a valorization and pretreatment step, rather than a stand-alone treatment capable of producing an effluent suitable for direct discharge. Additional treatment would be required if the intended final objective were compliance with wastewater discharge standards.
In morphological characterization, the pellet dimensions are comparable to those reported for A. oryzae cultivated in potato dextrose broth, where firm pellets approximately 2.1–4.3 mm in diameter developed depending on flask volume and agitation conditions [64]. Other cultivation conditions have also produced pellets approximately 3–4 mm in diameter for this species [65].
The high solidity values indicate that the segmented pellet outlines were close to convex and contained relatively few surface irregularities. Solidity alone, however, does not establish improved mass transfer. Pellet size, geometry, porosity, and internal organization can all influence oxygen and nutrient diffusion through fungal aggregates [37]. Larger pellets may experience stronger internal diffusion limitations than smaller pellets, depending on their structure and the hydrodynamic conditions of the cultivation system [66].
Pellet formation in filamentous fungi depends on the interaction among strain characteristics, inoculum properties, pH, medium composition, oxygen availability, and hydrodynamic conditions. Flask volume and agitation can affect both pellet size and firmness, while pH-associated changes in spore surface charge can alter aggregation behavior [8,64]. Under the conditions used here, an initial pH of 6, agitation at 150 rpm, and the optimized medium composition supported the formation of well-defined pellets, although we did not examine the individual contribution of each factor to morphology.
The absence of conidia and the predominance of vegetative hyphae indicate that the examined biomass remained primarily mycelial under the selected cultivation conditions. Sporulation in A. oryzae depends on developmental regulation and transcription factors such as NsdC [67,68], but the regulatory basis for the absence of spores in M6A5 was not investigated.
From a processing perspective, pelletized growth may offer practical advantages over highly dispersed mycelial biomass. Dispersed filamentous growth can increase broth viscosity and complicate oxygen transfer and solid–liquid separation, whereas pelletized biomass can be easier to recover from the fermentation broth [31,64]. The pellet morphology observed for M6A5 may therefore help downstream biomass handling, although we did not directly measure filtration, settling, rheological behavior, or recovery efficiency.
The recovery yield falls within the 3.03–13.97% range previously reported for fractions recovered from A. oryzae biomass [16,69]. Differences in yield among studies may arise from strain-specific biomass composition, cultivation conditions, pretreatment, extraction conditions, precipitation, and purification procedures.
The predominance of carbohydrates and low proportion of noncarbohydrate constituents are consistent with a carbohydrate-rich fraction. Purified or enriched fungal polysaccharide fractions have been described as having total carbohydrate contents above 80%, along with comparatively low levels of protein, lipid, and ash [70]. Therefore, the composition supports describing the recovered material as carbohydrate-rich and suggests that β-glucans may be among its constituents.
However, proximate analysis alone cannot establish β-glucan identity, concentration, purity, linkage type, or molecular structure. Therefore, based on the present data, the recovered material should not be considered a purified β-glucan fraction. Confirmation would require targeted compositional and structural analyses, including monosaccharide profiling, molecular-weight distribution, branching, and glycosidic-linkage characterization. If β-glucans are confirmed, β-(1→3), β-(1→6), and other relevant linkages would need to be characterized before specific functional properties could be inferred.
Additional characterization is also required before proposing food-related applications. Microbiological analyses would be needed to establish microbial quality and safety, while rheological studies could determine viscosity, flow behavior, thickening capacity, and gel-forming properties. These measurements matter because researchers have investigated fungal polysaccharides, including β-glucans, for food and biomaterial applications. At this stage, recovery of the carbohydrate-rich fraction should therefore be considered an additional route for biomass valorization rather than evidence of a specific end-use application.
Additional limitations include the absence of specific microbiological and rheological assessments of the recovered fraction. Microbiological testing is needed to assess microbial quality and safety, while rheological measurements could establish viscosity, flow behavior, thickening capacity, and gel-forming properties relevant to proposed applications.
Recovering a carbohydrate-rich fraction from A. oryzae M6A5 biomass provides an additional route for investigating biomass valorization. Researchers have investigated fungal polysaccharides, including β-glucans, for applications in foods and biomaterials. Suitability for these applications requires confirmation of the fraction’s composition and structure, followed by application-specific performance and safety assessments.
Potato starch processing effluent contains residual nutrients that can support fungal growth, so this stream can be used as a cultivation matrix rather than treated only as waste. In this study, its use supported Aspergillus oryzae M6A5 biomass production while simultaneously reducing part of the organic load. This combination links management of a food-processing residual stream with the production of recoverable fungal biomass, enabling further fractionation and valorization within an integrated process.
Process performance also depended on cultivation conditions, nutrient supplementation, and fungal morphology. Response surface methodology provided a quantitative basis for defining the combined effects of sucrose and ammonium sulfate on biomass production, while pellet characterization supplied information relevant to mass transfer, biomass handling, and downstream recovery. Considering substrate composition, process optimization, morphology, and organic load reduction together provides a more complete assessment of how this food-industry effluent can be incorporated into a controlled fermentation system.
The study’s main strength is its integrated evaluation of biomass production, nutrient optimization, pellet morphology, organic load reduction, and recovery of a carbohydrate-rich fraction within the same process. This broadens the assessment beyond fungal growth alone and provides information relevant to both process development and biomass valorization.
Nevertheless, the experiments were conducted at laboratory scale, and these conditions do not fully reproduce the hydrodynamic behavior, oxygen-transfer limitations, mixing patterns, shear forces, and mass-transfer gradients expected in larger fermentation systems. In addition, the recovered fraction was characterized only at a preliminary compositional level, and its β-glucan content, molecular structure, microbiological quality, rheological behavior, and functionality remain to be established. Pilot-scale studies in controlled bioreactors are therefore needed to determine whether biomass productivity, pellet morphology, organic load reduction, and fraction recovery can be maintained during scale-up and to evaluate process performance under conditions closer to potential food-industry application.
5. Conclusions
Aspergillus oryzae M6A5 used potato starch processing effluent as a culture matrix for fungal biomass production, showing that this food-processing residual stream can be incorporated into a bioprocess rather than considered only as a waste. Optimizing sucrose and ammonium sulfate supplementation improved biomass production, and the close agreement between predicted and experimental responses supported the model’s adequacy within the selected optimization region.
The formation of well-defined pellets is relevant because this morphology may facilitate biomass handling and downstream recovery. At the same time, the reductions observed in nitrogen, starch, BOD₅, and COD indicate that biomass production can be combined with partial reduction of the organic load of the effluent, supporting its use as a pretreatment and valorization step within an integrated process
Recovering a carbohydrate-rich fraction from the fungal biomass adds a second level of valorization. Its high carbohydrate content supports further investigation of this material for food-related and biotechnological applications; however, researchers must establish its composition, molecular structure, functionality, rheological behavior, and microbiological quality before proposing any specific food use.
Overall, the study provides a food bioprocess engineering basis for integrating potato starch processing effluent utilization, fungal biomass production, partial effluent pretreatment, and biomass fraction recovery in a single process. Further evaluation in controlled pilot-scale bioreactors is required to determine how mixing, oxygen transfer, hydrodynamics, pellet morphology, biomass productivity, and fraction recovery behave during scale-up.
Author Contributions
Conceptualization, M.A., D.A. and S.S.; methodology, M.A., D.A. and S.S.; validation, S.S. and M.A.; formal analysis, M.A., D.A. and S.S.; investigation, M.A., D.A. and S.S.; data curation, S.S.; writing— original draft preparation, M.A. and D.A.; writing—review and editing, M.A., D.A. and S.S.; visualization, D.A.; supervision, S.S. and M.A.; project administration, M.A.; funding acquisition, M.A. All authors have read and agreed to the published version of the manuscript.
Funding
This research was funded by the Center for Research and Technology Transfer of the Polytechnic State University of Carchi, Ecuador. The project was approved with Resolution No. 081-CI-2020-CSUP.
Institutional Review Board Statement
Not applicable.
Informed Consent Statement
Not applicable.
Data Availability Statement
Data are contained within the article.
Acknowledgments
We thank the Department of Research and Technology Transfer of UPEC for allowing the development of this research.
Conflicts of Interest
The authors declare that they have no conflicts of interest.
References
- Braia, M.; Cabezudo, I.; Barrera, V.L.; Anselmi, P.; Meini, M.-R.; Romanini, D. An Optimization Approach to the Bioconversion of Flour Mill Waste to α-Amylase Enzyme by Aspergillus Oryzae. Process Biochem. 2021, 111, 102–108. [CrossRef]
- Hartmann, L.; Martin, M.C.; Neumann, A.; Holtmann, D.; Ochsenreither, K. Understanding the Role of pH Regulation and Neutralizing Agents in Organic Acid Production and Growth of Aspergillus Oryzae. Biotechnol. Bioeng. 2026, 123, 116–133. [CrossRef]
- Ji, S.B.; Ra, C.H. Effect of Solid-State Fermented Brown Rice Extracts on 3T3-L1 Adipocyte Differentiation. 2023, 33, 926–933. [CrossRef]
- Mu, Y.; Li, Y.; Wu, Y.; Wang, D.; Zhang, L.; Xu, Y. The Key Proteolytic Enzyme Analysis of Industrial Aspergillus Oryzae at Solid-State Koji Fermentation with a Local Database Extension. Food Biosci. 2024, 58, 103738. [CrossRef]
- Niu, C.; Xing, X.; Yang, X.; Zheng, F.; Liu, C.; Wang, J.; Li, Q. Isolation, Identification and Application of Aspergillus Oryzae BL18 with High Protease Activity as Starter Culture in Doubanjiang (Broad Bean Paste) Fermentation. Food Biosci. 2023, 51, 102225. [CrossRef]
- Shen, X.; Lei, C.; Zhang, A.; Wang, L.; Chen, D.; Qi, L.; Hu, Y.; Chen, G.; Ran, H.; Yin, W.-B. Stimulating Novel and Bioactive Metabolite Production by Cocultivation of Two Fungi-Aspergillus Oryzae and Epicoccum Dendrobii. J. Agric. Food Chem. 2024, 72, 16825–16834. [CrossRef]
- Vieira, B.F.; Bueno, L.C.G.; Ferrari, L.D.; Masarin, F.; de Paula, A.V.; Andrade, G.S.S. A Novel Pre-Treatment of Brewery Spent Grains Using Mycelium-Bound Cellulase from Aspergillus Oryzae for Biogas Production. Biomass Bioenergy 2025, 194, 107691. [CrossRef]
- Wang, L.; Tian, X.; Xue, P.; Deng, Y.; Gao, R.; Hu, Z. Enhanced Production of Ergothioneine in Aspergillus Oryzae. Appl. Microbiol. Biotechnol. 2025, 109, 143. [CrossRef]
- Li, J.; Sun, C.; Shen, Z.; Tian, Y.; Mo, F.; Wang, B.; Liu, B.; Wang, C. Untargeted Metabolomic Profiling of Aspergillus Sojae 3.495 and Aspergillus Oryzae 3.042 Fermented Soy Sauce Koji and Effect on Moromi Fermentation Flavor. LWT 2023, 184, 115027. [CrossRef]
- Borkertas, S.; Viskelis, J.; Viskelis, P.; Streimikyte, P.; Gasiunaite, U.; Urbonaviciene, D. Fungal Biomass Fermentation: Valorizing the Food Industry’s Waste. Fermentation 2025, 11. [CrossRef]
- Garg, S. The Importance of Fungal Biotechnology for Sustainable Applications. Trends Biotechnol. 2026, 44, 79–91. [CrossRef]
- Wösten, H.A.B. Filamentous Fungi for the Production of Enzymes, Chemicals and Materials. Curr. Opin. Biotechnol. 2019, 59, 65–70. [CrossRef]
- Svensson, S.E.; Wijayarathna, E.R.K.B.; Kalita, N.K.; Hakkarainen, M.; Zamani, A. Development of Hydrogels from Cell Wall of Aspergillus Oryzae Containing Chitin-Glucan and Wet Spinning to Monofilaments. Int. J. Biol. Macromol. 2024, 278, 134285. [CrossRef]
- Kaya, B.; Güneşer, O.; Taherzadeh, M.J.; Karagül Yüceer, Y.; Sar, T. Enhancing Nutritional Value and Flavor Profiles of Whey Powder through Fungal Fermentation with Aspergillus Oryzae and Neurospora Intermedia. Food Sci. Technol. Int. 2026, 32, 724–737. [CrossRef]
- Raethong, N.; Jeennor, S.; Anantayanon, J.; Wannawilai, S.; Vongsangnak, W.; Laoteng, K. Reconstruction of a Genome-Scale Metabolic Model for Aspergillus Oryzae Engineered Strain: A Potent Computational Tool for Enhancing Cordycepin Production. Int. J. Mol. Sci. 2025, 26, 6906. [CrossRef]
- Utama, G.L.; Dio, C.; Sulistiyo, J.; Yee Chye, F.; Lembong, E.; Cahyana, Y.; Kumar Verma, D.; Thakur, M.; Patel, A.R.; Singh, S. Evaluating Comparative β-Glucan Production Aptitude of Saccharomyces Cerevisiae, Aspergillus Oryzae, Xanthomonas Campestris, and Bacillus Natto. Saudi J. Biol. Sci. 2021, 28, 6765–6773. [CrossRef]
- Zamli, M.; Akmal, M.; Ahmad, F.; Hisham, F. Piezoelectric Performance of Microbial Chitosan Thin Film Derived from Aspergillus Oryzae. Int. J. Renew. Energy Dev. 2022, 11, 1157–1164. [CrossRef]
- Mykhalevych, A.; Polishchuk, G.; Nassar, K.; Osmak, T.; Buniowska-Olejnik, M. β-Glucan as a Techno-Functional Ingredient in Dairy and Milk-Based Products—A Review. Molecules 2022, 27, 6313. [CrossRef]
- Pérez-Bassart, Z.; Martínez-Abad, A.; Reyes, A.; López-Rubio, A.; Fabra, M.J. Ultrasound-Treatment as a Promising Strategy to Develop Biodegradable Films Obtained from Mushroom Waste Biomass. Food Hydrocoll. 2023, 135, 108174. [CrossRef]
- Dalgıç, A.C.; Atlı, B.; Yamaç, M. Integration of Process Simulation and Design of Experiments for the Techno-Economic Optimization of Chitosan and Mold Extract Recovery from Waste Fungal Biomass. Waste Manag. 2026, 211, 115296. [CrossRef]
- Wikandari, R.; Hasniah, N.; Taherzadeh, M.J. The Role of Filamentous Fungi in Advancing the Development of a Sustainable Circular Bioeconomy. Bioresour. Technol. 2022, 345, 126531. [CrossRef]
- Shi, H.; Li, L.; Guo, R.; Ma, Y.; Li, Y.; Wang, Y.; Wang, J.; Feng, F. Protein Recovery from Potato Starch Wastewater by Combined Process of MCM-41/PSF Ultrafiltration and PT-MCM-41/PSF Nanofiltration Composite Membrane. J. Environ. Chem. Eng. 2025, 13, 117286. [CrossRef]
- Bzducha-Wróbel, A.; Pobiega, K.; Błażejak, S.; Kieliszek, M. The Scale-up Cultivation of Candida Utilis in Waste Potato Juice Water with Glycerol Affects Biomass and β(1,3)/(1,6)-Glucan Characteristic and Yield. Appl. Microbiol. Biotechnol. 2018, 102, 9131–9145. [CrossRef]
- Kot, A.M.; Blazejak, S.; Kurcz, A.; Gientka, I. Biodegradation of Deproteinized Potato Wastewater and Glycerol during Cultivation of Rhodotorula Glutinis Yeast. Electron. J. Biotechnol. 2015, 18, 428–432. [CrossRef]
- Xiaoting, L.; Jinqin, H.; Jinyin, L.; Huanjun, Q.; Jinyu, X.; Jianxin, J.; Tianning, W. Irrigation with Potato Starch Processing Wastewater: Effects on Soil Quality and Corn Growth. Chin. Agric. Sci. Bull. 2021, 37, 106. [CrossRef]
- Shang, G.; Xu, G.; Ren, J.; Yu, J.P.; Cai, W.; Cui, K.; Jin, P.; Guo, K. A Cathodic Electro-Fermentation System for Enhanced Methane Production from High-Concentration Potato Starch Industrial Wastewater. J. Water Process Eng. 2024, 59, 105006. [CrossRef]
- Uwineza, C.; Bouzarjomehr, M.; Parchami, M.; Sar, T.; Taherzadeh, M.J.; Mahboubi, A. Evaluation of in Vitro Digestibility of Aspergillus Oryzae Fungal Biomass Grown on Organic Residue Derived-VFAs as a Promising Ruminant Feed Supplement. J. Anim. Sci. Biotechnol. 2023, 14, 120. [CrossRef]
- Sar, T.; Larsson, K.; Fristedt, R.; Undeland, I.; Taherzadeh, M.J. Demo-Scale Production of Protein-Rich Fungal Biomass from Potato Protein Liquor for Use as Innovative Food and Feed Products. Food Biosci. 2022, 47, 101637. [CrossRef]
- Asadollahzadeh, M.; Ghasemian, A.; Saraeia, A.; Resalati, H.; Taherzadeh, M.J. Production of Fungal Biomass Protein by Filamentous Fungi Cultivation on Liquid Waste Streams from Pulping Process. BioResources 2018, 13, 5013–5031. [CrossRef]
- Serba, E.; Pimenov, N.; Mochalina, P.; Overchenko, M.; Borscheva, Yu.; Sharikov, A.; Rimareva, L. Production of Aspergillus Oryzae RCAM 01133 Biomass with Increased Protein and Polysaccharides Content Using By-Products of Food Industry. 2020, 290–300. [CrossRef]
- Sar, T.; Uwineza, C.; Taherzadeh, M.J.; Mahboubi, A. Evaluating Scale-Up Cultivation Modes for Aspergillus Oryzae Biomass Production Using VFA-Rich Effluents from Agro-Industrial Residues. BioTech 2025, 14, 76. [CrossRef]
- Veiter, L.; Rajamanickam, V.; Herwig, C. The Filamentous Fungal Pellet—Relationship between Morphology and Productivity. Appl. Microbiol. Biotechnol. 2018, 102, 2997–3006. [CrossRef]
- Li, L.; Liang, T.; Liu, W.; Liu, Y.; Ma, F. A Comprehensive Review of the Mycelial Pellet: Research Status, Applications, and Future Prospects. Ind. Eng. Chem. Res. 2020, 59, 16911–16922. [CrossRef]
- Antecka, A.; Bizukojc, M.; Ledakowicz, S. Modern Morphological Engineering Techniques for Improving Productivity of Filamentous Fungi in Submerged Cultures. World J. Microbiol. Biotechnol. 2016, 32, 193. [CrossRef]
- Hernández-Cruz, T.M.; Legorreta-Castañeda, A.J.; García-Gutiérrez, K.; Carballo-Sánchez, M.P.; Guerra-Sánchez, G.; Olicón-Hernández, D.R. Fungal Pellets of Pleurotus Ostreatus and Rhizopus Stolonifer for Biotechnological Applications: Characterization and Production Optimization Using Taguchi Methodology. Curr. Res. Biotechnol. 2024, 7, 100226. [CrossRef]
- Cao, L.; El Mashad, H.M.; Pan, Z.; Zhang, R. Production of Filamentous Fungal Biomass (Aspergillus Awamori) in Pellet Form from Almond Hull Extract. Food Bioprocess Technol. 2025, 18, 8735–8750. [CrossRef]
- Wucherpfennig, T.; Hestler, T.; Krull, R. Morphology Engineering - Osmolality and Its Effect on Aspergillus Niger Morphology and Productivity. Microb. Cell Factories 2011, 10, 58. [CrossRef]
- Panchanawaporn, S.; Chutrakul, C.; Jeennor, S.; Anantayanon, J.; Laoteng, K. Development of Aspergillus Oryzae BCC7051 as a Robust Cell Factory Towards the Transcriptional Regulation of Protease-Encoding Genes for Industrial Applications. J. Fungi 2025, 11, 6. [CrossRef]
- Rousta, N.; Hellwig, C.; Wainaina, S.; Lukitawesa, L.; Agnihotri, S.; Rousta, K.; Taherzadeh, M.J. Filamentous Fungus Aspergillus Oryzae for Food: From Submerged Cultivation to Fungal Burgers and Their Sensory Evaluation—A Pilot Study. Foods 2021, 10, 2774. [CrossRef]
- Souza Filho, P.F.; Nair, R.B.; Andersson, D.; Lennartsson, P.R.; Taherzadeh, M.J. Vegan-Mycoprotein Concentrate from Pea-Processing Industry Byproduct Using Edible Filamentous Fungi. Fungal Biol. Biotechnol. 2018, 5, 5. [CrossRef]
- Pratama, F.; Rahardja, R.T.; Rachmadi, A.R.; Salam, W.Q.; Kho, K.; Adelie, A.; Devanthi, P.V.P. Optimizing Mycoprotein Production by Aspergillus Oryzae Using Soy Whey as a Substrate. J. Fungi 2025, 11, 349. [CrossRef]
- Montgomery, D.C. Design and Analysis of Experiments, EMEA Edition; John Wiley & Sons, Incorporated, 2021; ISBN 1-119-81697-1.
- Souza Filho, P.F.; Zamani, A.; Taherzadeh, M.J. Edible Protein Production by Filamentous Fungi Using Starch Plant Wastewater. Waste Biomass Valorization 2019, 10, 2487–2496. [CrossRef]
- Lage-Yusty, M.; Simal-Lozano, J.; GÓMEZ, G.S. Determinación de Almidón En Alimentos. 1983.
- Miller, G.L. Use of Dinitrosalicylic Acid Reagent for Determination of Reducing Sugar. Anal. Chem. 1959, 31, 426–428. [CrossRef]
- Kovo, A.S.; Alaya-Ibrahim, S.; Abdulkareem, A.S.; Adeniyi, O.D.; Egbosiuba, T.C.; Tijani, J.O.; Saheed, M.; Okafor, B.O.; Yusuff, A.S. Column Adsorption of Biological Oxygen Demand, Chemical Oxygen Demand and Total Organic Carbon from Wastewater by Magnetite Nanoparticles-Zeolite A Composite. Heliyon 2023, 9, e13095. [CrossRef]
- Osadolor, O.A.; Jabbari, M.; Nair, R.B.; Lennartsson, P.R.; Taherzadeh, M.J. Effect of Media Rheology and Bioreactor Hydrodynamics on Filamentous Fungi Fermentation of Lignocellulosic and Starch-Based Substrates under Pseudoplastic Flow Conditions. Bioresour. Technol. 2018, 263, 250–257. [CrossRef]
- Cairns, T.C.; Feurstein, C.; Zheng, X.; Zheng, P.; Sun, J.; Meyer, V. A Quantitative Image Analysis Pipeline for the Characterization of Filamentous Fungal Morphologies as a Tool to Uncover Targets for Morphology Engineering: A Case Study Using aplD in Aspergillus Niger. Biotechnol. Biofuels 2019, 12, 149. [CrossRef]
- Tung, T.Q.; Miyata, N.; Iwahori, K. Growth of Aspergillus Oryzae during Treatment of Cassava Starch Processing Wastewater with High Content of Suspended Solids. J. Biosci. Bioeng. 2004. [CrossRef]
- Zeng, Y.-J.; Yang, H.-R.; Wu, X.-L.; Peng, F.; Huang, Z.; Pu, L.; Zong, M.-H.; Yang, J.-G.; Lou, W.-Y. Structure and Immunomodulatory Activity of Polysaccharides from Fusarium Solani DO7 by Solid-State Fermentation. Int. J. Biol. Macromol. 2019, 137, 568–575. [CrossRef]
- Gao, C.; Wang, Y.; Wang, C.; Wang, Z. Antioxidant and Immunological Activity in Vitro of Polysaccharides from Gomphidius Rutilus Mycelium. Carbohydr. Polym. 2013, 92, 2187–2192. [CrossRef]
- Costa, C.R.L. de M.; Menolli, R.A.; Osaku, E.F.; Tramontina, R.; de Melo, R.H.; do Amaral, A.E.; Duarte, P.A.D.; de Carvalho, M.M.; Smiderle, F.R.; Silva, J.L. da C.; et al. Exopolysaccharides from Aspergillus Terreus: Production, Chemical Elucidation and Immunoactivity. Int. J. Biol. Macromol. 2019, 139, 654–664. [CrossRef]
- Latimer, G. Association of Official Analytical Chemists (AOAC) Official Methods of Analysis. AOAC Wash. DC USA 2019, 21st Edition, 223–225.
- Mano, J. Fast and Easy Edible Protein Production by Nitrogen-Supplemented Koji Fermentation. Npj Sci. Food 2025, 9, 150. [CrossRef]
- Rousta, N.; Larsson, K.; Fristedt, R.; Undeland, I.; Agnihotri, S.; Taherzadeh, M.J. Production of Fungal Biomass from Oat Flour for the Use as a Nutritious Food Source. NFS J. 2022, 29, 8–15. [CrossRef]
- Jeennor, S.; Anantayanon, J.; Panchanawaporn, S.; Chutrakul, C.; Vongsangnak, W.; Laoteng, K. Efficient de Novo Production of Bioactive Cordycepin by Aspergillus Oryzae Using a Food-Grade Expression Platform. Microb. Cell Factories 2023, 22, 253. [CrossRef]
- Ogasawara, N.; Oka, H.; Tanaka, M.; Gomi, K.; Shimizu, M.; Kato, M.; Nakano, H.; Kojima, T. Genome-Wide Characterization of CreA-Mediated Transcriptional Regulation in Aspergillus Oryzae under Carbon Catabolite Derepression. Biosci. Biotechnol. Biochem. 2025, 90, 99–108. [CrossRef]
- Tanaka, M.; Gomi, K. Induction and Repression of Hydrolase Genes in Aspergillus Oryzae. Front. Microbiol. 2021, 677603. [CrossRef]
- Miki, S.; Sakai, K.; Nakagawa, T.; Tanaka, T.; Liu, L.; Yamashita, H.; Kusumoto, K.-I. Analysis of Nitrogen Source Assimilation in Industrial Strains of Aspergillus Oryzae. J. Biosci. Bioeng. 2024, 137, 231–238. [CrossRef]
- Braho, V.; Sar, T.; Taherzadeh, M.J. Cultivation of Edible Filamentous Fungi on Pomegranate By-Products as Feedstocks to Produce Mycoprotein. Syst. Microbiol. Biomanufacturing 2024, 4, 675–686. [CrossRef]
- Li, J.-S.; Chew, Y.-M.; Lin, M.-C.; Lau, Y.-Q.; Chen, C.-S. Enhanced Glucosamine Production from Aspergillus Oryzae NCH-42 via Acidic Stress under Submerged Fermentation. CyTA - J. Food 2021, 19, 614–624. [CrossRef]
- Nakamura, M.; Hattori, R.; Suzuki, S.; Mano, J. Upcycling Whey through the Production of Edible Aspergillus Oryzae Cell Biomass. Biosci. Biotechnol. Biochem. 2025, 89, 1640–1648. [CrossRef]
- Wang, S.-K.; Yang, K.-X.; Zhu, Y.-R.; Zhu, X.-Y.; Nie, D.-F.; Jiao, N.; Angelidaki, I. One-Step Co-Cultivation and Flocculation of Microalgae with Filamentous Fungi to Valorize Starch Wastewater into High-Value Biomass. Bioresour. Technol. 2022, 361, 127625. [CrossRef]
- Khalatbari, S.; Sotaniemi, V.-H.; Leiviskä, T. Introducing a Dual Approach to Industrial Wastewater Reclamation and Microalgae Harvesting by Filamentous Fungus. J. Environ. Chem. Eng. 2025, 13, 116035. [CrossRef]
- Oviedo-Albarracín, C.; Chacón-Navarrete, H.; Cámara-Martos, F.; Bermúdez-Luque, A.; Koysuren, B.; Nitin, N.; Fotidis, I.; Yan, Y.; Moreno-García, J. Increasing the Lipid Content of Filamentous Fungi: Potential Alternatives to Conventional Meat through Culture Medium Modification and High-Lipid Yeast Immobilization. Food Bioprocess Technol. 2025, 18, 10789–10805. [CrossRef]
- Zuo, H.; Ji, L.; Pan, J.; Chen, X.; Gao, C.; Liu, J.; Wei, W.; Wu, J.; Song, W.; Liu, L. Engineering Growth Phenotypes of Aspergillus Oryzae for L-Malate Production. Bioresour. Bioprocess. 2023, 10, 25. [CrossRef]
- Chu, H.T.; Sofeo, N.; Jebamony, J.J.; Arumugam, P. The Cys2-His2 Zinc Finger Transcription Factor NsdC Regulates Hyphal Branching, Conidiation and Mycelial Pellet Morphology in Aspergillus Oryzae. Fungal Genet. Biol. 2025, 180, 104019. [CrossRef]
- Lin, S.; Qin, H.; Zhang, X.; Li, W.; Liu, M. Inhibition of Aspergillus Oryzae Mycelium Growth and Conidium Production by Irradiation with Light at Different Wavelengths and Intensities. Microbiol. Spectr. 2021, 9, 10.1128/spectrum.00213-21. [CrossRef]
- Ji, S.B.; Ra, C.H. Coproduction of Enzymes and Beta-Glucan by Aspergillus Oryzae Using Solid-State Fermentation of Brown Rice. J. Microbiol. Biotechnol. 2021, 31, 1028–1034. [CrossRef]
- Synytsya, A.; Novák, M. Structural Diversity of Fungal Glucans. Carbohydr. Polym. 2013, 92, 792–809. [CrossRef]
Figure 1.
Biomass production from Aspergillus oryzae M6A5. A. Effect of cultivation temperature and time on biomass production. B. Effect of initial pH on biomass production. Values represent the mean of three determinations ± standard deviation. * or different letters indicate statistically significant differences in biomass values at the 95% confidence level.
Figure 1.
Biomass production from Aspergillus oryzae M6A5. A. Effect of cultivation temperature and time on biomass production. B. Effect of initial pH on biomass production. Values represent the mean of three determinations ± standard deviation. * or different letters indicate statistically significant differences in biomass values at the 95% confidence level.
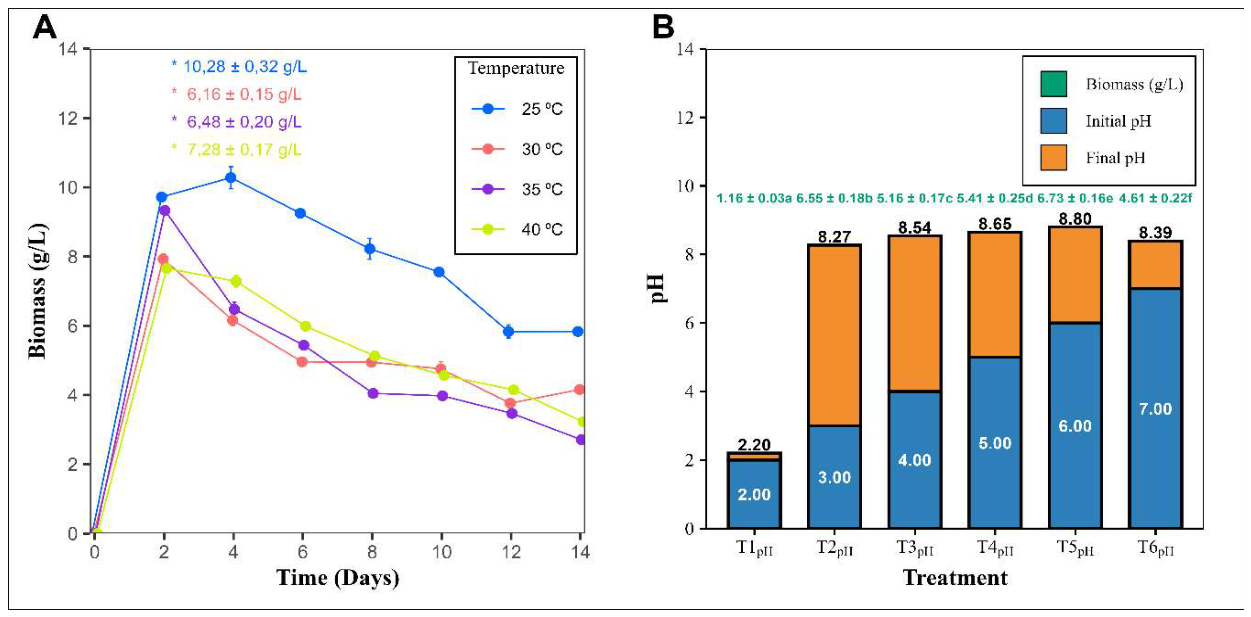
Figure 2.
Biomass production from Aspergillus oryzae M6A5. A. Effect of carbon source on biomass production. B. Effect of sucrose concentration on biomass production. Values represent the mean of three determinations ± standard deviation. Different letters indicate statistically significant differences in biomass values at the 95% confidence level.
Figure 2.
Biomass production from Aspergillus oryzae M6A5. A. Effect of carbon source on biomass production. B. Effect of sucrose concentration on biomass production. Values represent the mean of three determinations ± standard deviation. Different letters indicate statistically significant differences in biomass values at the 95% confidence level.
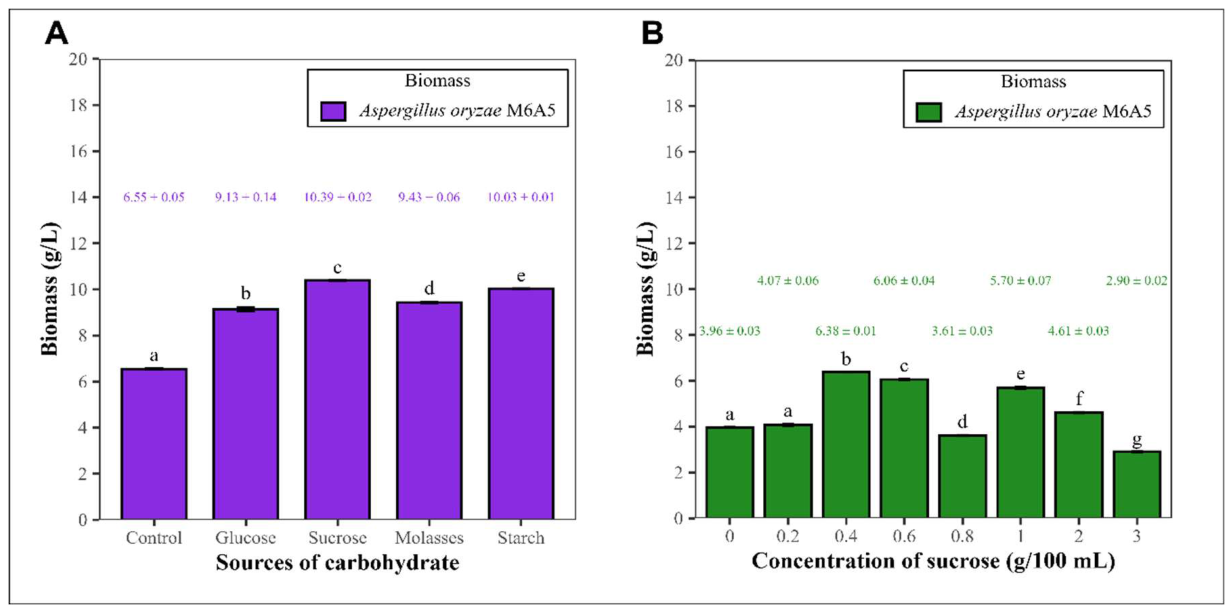
Figure 3.
Biomass production from Aspergillus oryzae M6A5. A. Effect of nitrogen source on biomass production. B. Effect of ammonium sulfate concentration on biomass production. Values represent the mean of three determinations ± standard deviation. Different letters indicate statistically significant differences in biomass values at the 95% confidence level.
Figure 3.
Biomass production from Aspergillus oryzae M6A5. A. Effect of nitrogen source on biomass production. B. Effect of ammonium sulfate concentration on biomass production. Values represent the mean of three determinations ± standard deviation. Different letters indicate statistically significant differences in biomass values at the 95% confidence level.
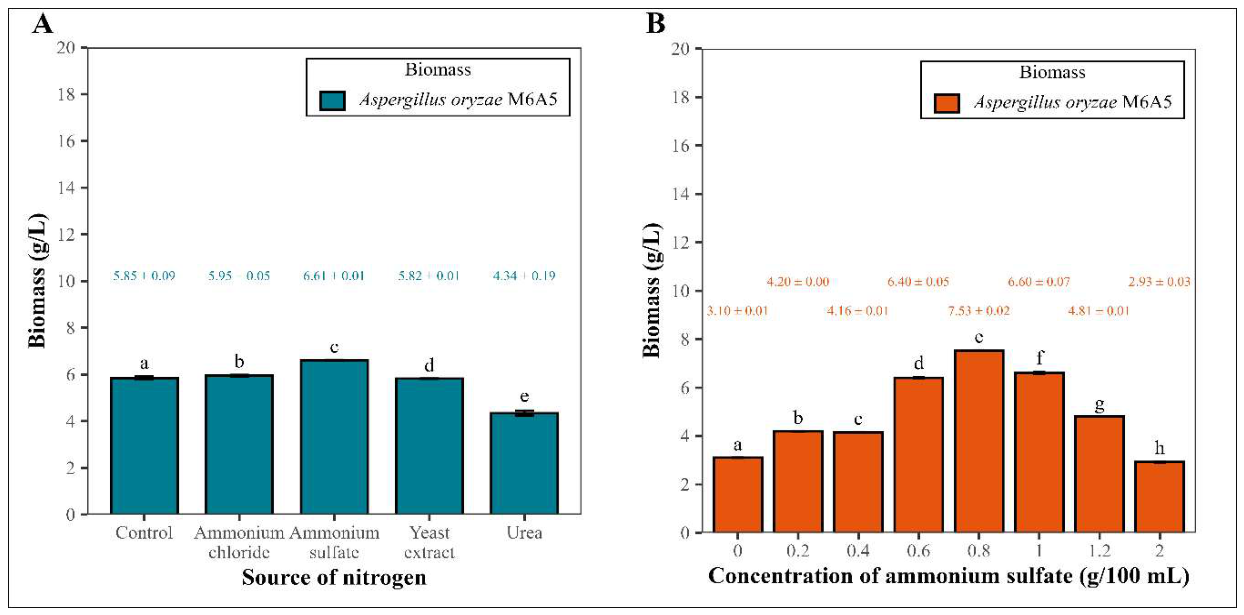
Figure 4.
Response surface plots for the optimization of biomass production by Aspergillus oryzae M6A5. (A) Three-dimensional response surface plot. (B) Two-dimensional contour plot. Both plots illustrate the interaction between sucrose and ammonium sulfate and the maximum biomass response obtained.
Figure 4.
Response surface plots for the optimization of biomass production by Aspergillus oryzae M6A5. (A) Three-dimensional response surface plot. (B) Two-dimensional contour plot. Both plots illustrate the interaction between sucrose and ammonium sulfate and the maximum biomass response obtained.
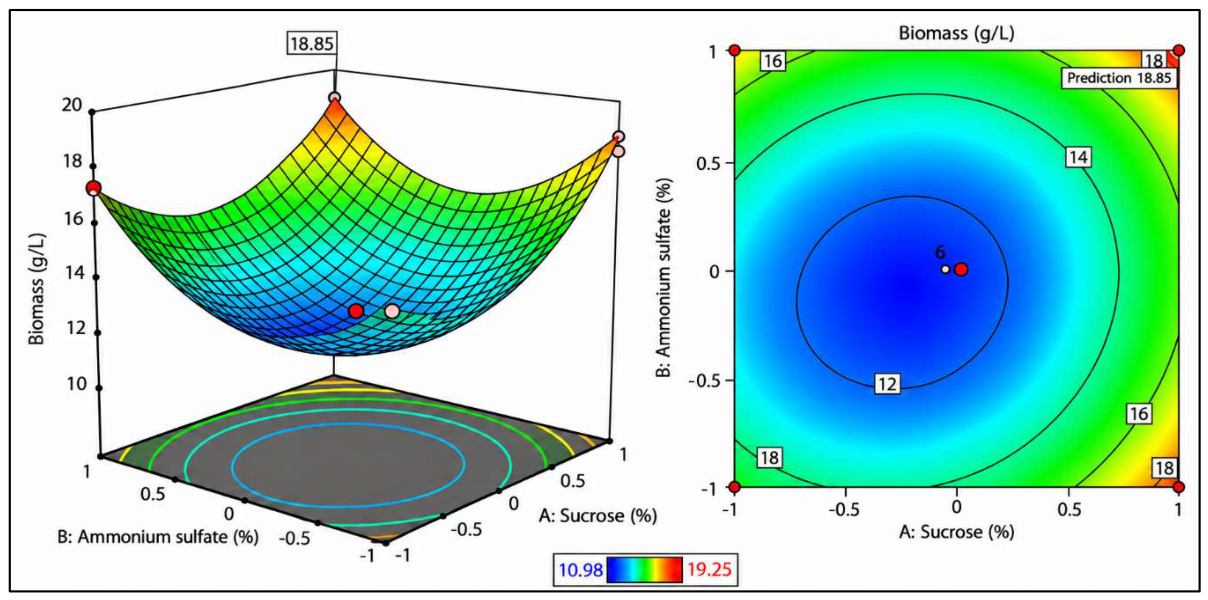
Figure 5.
Morphological characteristics of Aspergillus oryzae M6A5. A. Pellets in liquid culture. B-C. Individual pellets. D-E. Intact pellets at 400× total magnification. F-G. Hyphae at 400× total magnification.
Figure 5.
Morphological characteristics of Aspergillus oryzae M6A5. A. Pellets in liquid culture. B-C. Individual pellets. D-E. Intact pellets at 400× total magnification. F-G. Hyphae at 400× total magnification.
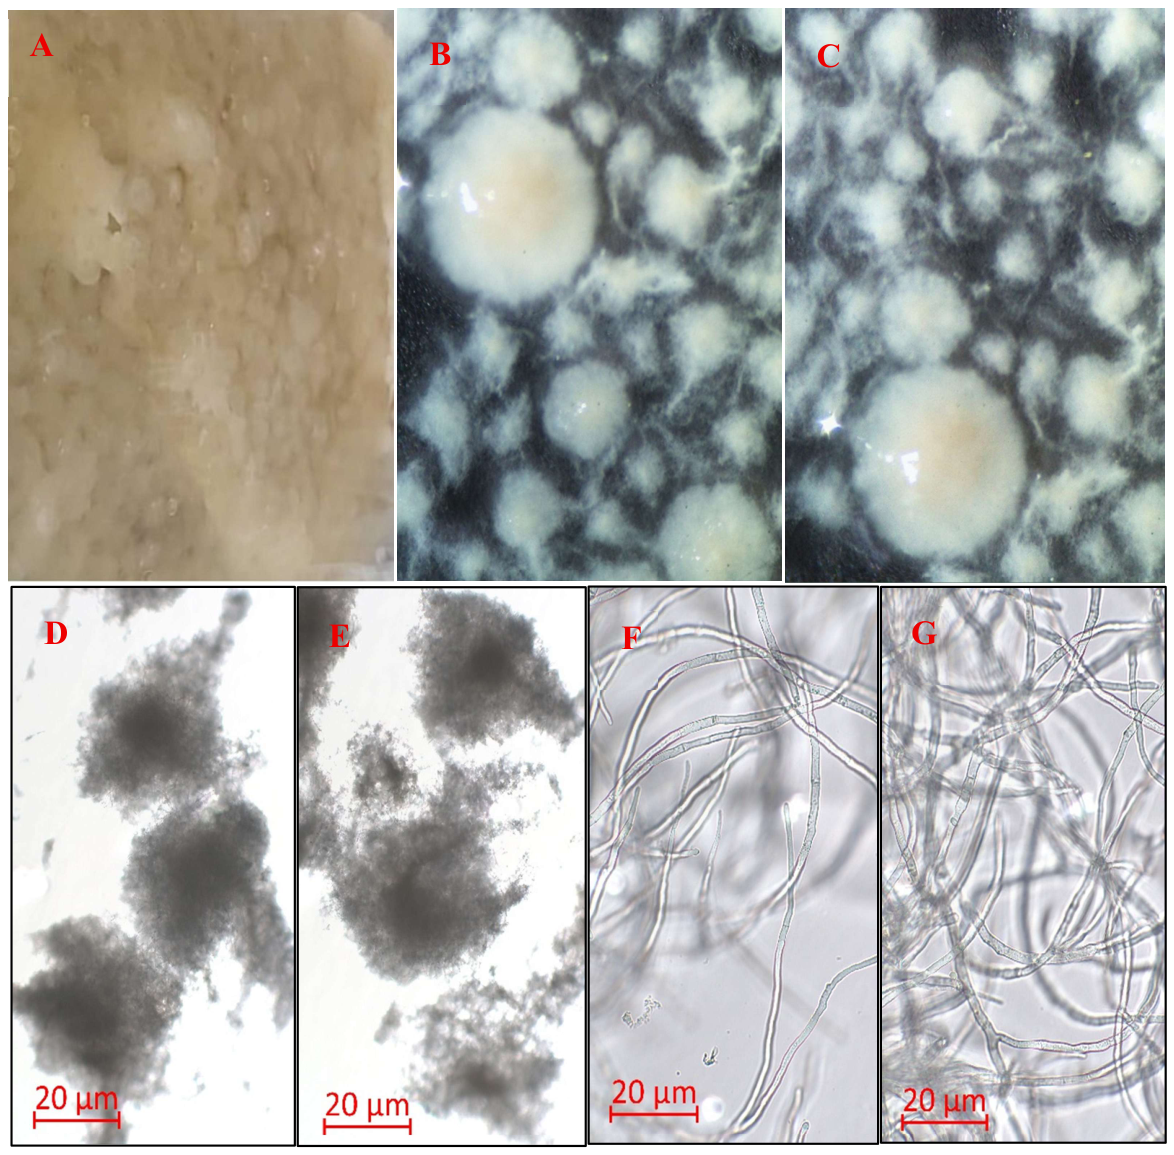

Table 1.
Experimental design matrix and response of the central composite design for optimizing biomass production by Aspergillus oryzae M6A5.
Table 1.
Experimental design matrix and response of the central composite design for optimizing biomass production by Aspergillus oryzae M6A5.
| Run Order | Independent Variables | Response: Biomass (g/L) | ||
| X1: SC1 | X2: ASC2 | Measured Biomass | Predicted Biomass | |
| 1 | -1 (0.2) | -1 (0.6) | 14.51 | 14.91 |
| 2 | 1 (0.6) | -1 (0.6) | 18.10 | 18.70 |
| 3 | -1 (0.2) | 1 (1.0) | 17.10 | 17.29 |
| 4 | 1 (0.6) | 1 (1.0) | 18.79 | 18.85 |
| 5 | -1.41 (0.12) | 0 (0.8) | 15.54 | 15.24 |
| 6 | 1.41 (0.67) | 0 (0.8) | 19.25 | 19.02 |
| 7 | 0 (0.4) | -1.41 (0.52) | 17.34 | 16.85 |
| 8 | 0 (0.4) | 1.41 (1.08) | 18.73 | 18.64 |
| 9 | 0 (0.4) | 0 (0.8) | 11.99 | 11.59 |
| 10 | 0 (0.4) | 0 (0.8) | 11.93 | 11.59 |
| 11 | 0 (0.4) | 0 (0.8) | 10.98 | 11.59 |
| 12 | -1 (0.2) | -1 (0.6) | 14.65 | 14.91 |
| 13 | 1 (0.6) | -1 (0.6) | 18.68 | 18.70 |
| 14 | -1 (0.2) | 1 (1.0) | 17.34 | 17.29 |
| 15 | 1 (0.6) | 1 (1.0) | 18.78 | 18.85 |
| 16 | -1.41 (0.12) | 0 (0.8) | 15.32 | 15.24 |
| 17 | 1.41 (0.67) | 0 (0.8) | 19.17 | 19.02 |
| 18 | 0 (0.4) | -1.41 (0.52) | 17.10 | 16.85 |
| 19 | 0 (0.4) | 1.41 (1.08) | 18.58 | 18.64 |
| 20 | 0 (0.4) | 0 (0.8) | 11.50 | 11.59 |
| 21 | 0 (0.4) | 0 (0.8) | 11.00 | 11.59 |
| 22 | 0 (0.4) | 0 (0.8) | 12.12 | 11.59 |
All experimental runs were conducted at 25 °C, an initial pH of 6, a cultivation time of 4 days, and an agitation speed of 150 rpm, using 100 mL of culture medium in 250-mL Erlenmeyer flasks. ¹ Sucrose concentration, expressed as grams per 100 mL of culture medium. ² Ammonium sulfate concentration, expressed as grams per 100 mL of culture medium. Values in parentheses represent the actual ( ) uncoded factor levels.
Table 2.
Analysis of variance for the quadratic model of Aspergillus oryzae M6A5 biomass concentration.
Table 2.
Analysis of variance for the quadratic model of Aspergillus oryzae M6A5 biomass concentration.
| Source | Degrees of freedom | Sum of squares | Mean square | F-value | p-value |
| Model | 5 | 187.737 | 37.547 | 247.61 | < 0.05 |
| Linear | 2 | 35.127 | 17.564 | 115.82 | < 0.05 |
| Sucrose | 1 | 28.694 | 28.694 | 189.22 | < 0.05 |
| Ammonium sulfate | 1 | 6.434 | 6.434 | 42.43 | < 0.05 |
| Square | 2 | 150.102 | 75.051 | 494.92 | < 0.05 |
| Sucrose*Sucrose | 1 | 86.723 | 86.723 | 571.90 | < 0.05 |
| Interaction of 2 factors | 1 | 2.507 | 2.507 | 16.54 | < 0.05 |
| Sucrose*Ammonium sulfate | 1 | 2.507 | 2.507 | 16.54 | < 0.05 |
| Error | 16 | 2.426 | 0.152 | ||
| Lack of fit | 3 | 0.852 | 0.284 | 2.34 | 0.1197 |
| Pure error | 13 | 1.575 | 0.121 | ||
| Total | 21 | 190.163 |
R-square (R2): 98.72%, adjusted R-square (adjR2): 98.32%, adequate precision: 36.56.
Table 3.
Characterization of the culture medium used to achieve maximum biomass production by Aspergillus oryzae M6A5 before and after submerged fermentation.
Table 3.
Characterization of the culture medium used to achieve maximum biomass production by Aspergillus oryzae M6A5 before and after submerged fermentation.
| Parameter | Fermentation by A. oryzae | ||
| Initial | Final | Reduction (%) | |
| Total solids1 | 4.96 ± 0.34a | 1.01 ± 0.01b | 79.64 ± 0.21 |
| Suspended solids1 | 2.74 ± 0.37a | 0.82 ± 0.11b | 70.07 ± 0.15 |
| Soluble solids1 | 2.22 ± 0.09a | 0.19 ± 0.05b | 84.43 ± 0.05 |
| Ash1 | 0.32 ± 0.01a | 0.17 ± 0.02b | 46.88 ± 0.10 |
| Nitrogen1 | 1.25 ± 0.78a | 0.18 ± 0.00b | 85.60 ± 0.65 |
| Total sugars2 | 341.38 ± 0.23a | 165.07 ± 0.15b | 51.65 ± 0.41 |
| Reducing sugars2 | 66.12 ± 0.29a | 17.98 ± 0.12b | 72.81 ± 0.83 |
| Total starch2 | 3616.54 ± 0.21a | 653.66 ± 0.00b | 81.93 ± 0.15 |
| Biochemical oxygen demand (BOD5)3 | 12406.28 ± 3.71a | 1458.79 ± 0.00b | 88.24 ± 2.01 |
| Chemical oxygen demand (COD)3 | 25960.41 ± 2.28a | 5420.94 ± 3.55b | 79.12 ± 3.13 |
Values are expressed as the mean ± standard deviation of three determinations. Different letters indicate statistically significant differences between values measured before and after fermentation for each parameter, at a 95% confidence level (p ≤ 0.05). ¹ g/100 mL; ² mg/100 mL; ³ mg/L.
Table 4.
Morphological parameters of Aspergillus oryzae M6A5 Pellets.
| Parameters | Aspergillus oryzae |
| Biomass morphology | Pellets |
| Pellet classification | Filamentous and smooth |
| Percentage of structures | 100 |
| Diameter range1 | 1.10 – 4.10 |
| Solidity range | 0.98 – 0.99 |
| Surface area range2 | 3.80 - 52.81 |
| Mean surface area2 | 15.05 ± 8.19 |
| Equivalent volume range3 | 0.70 - 36.09 |
| Mean equivalent volume of individual pellets3 | 6.02 ± 5.66 |
| Surface area-to-volume ratio range (A/V)4 | 1.46 - 5.45 |
| Mean surface area-to-volume Ratio (A/V)4 | 2.98 ± 0.71 |
| Hyphal length5 (µm) | 91 – 1785 |
| Spore Diameter5 (µm) | Not observed |
¹ Diameter expressed in millimeters (mm). ² Surface area expressed in square millimeters (mm²). ³ Equivalent volume expressed in cubic millimeters (mm³). ⁴ Surface area-to-volume ratio and mean surface area-to-volume ratio expressed in inverse milimeter (mm-1). 5 Hyphal length and spore diameter expressed in micrometers (µm).
Table 5.
Extraction yield and proximate composition of the β-glucan-rich fraction recovered from Aspergillus oryzae M6A5 biomass.
Table 5.
Extraction yield and proximate composition of the β-glucan-rich fraction recovered from Aspergillus oryzae M6A5 biomass.
| Parameters | β-glucan-enriched fractionfrom Aspergillus oryzae M6A5 |
| Yield | 4.25 ± 0.21 |
| Moisture | 12.13 ± 0.21 |
| Ash | 1.33 ± 0.16 |
| Nitrogen | 0.21 ± 0.02 |
| Crude protein | 1.31 ± 0.10 |
| Crude fat | 0.52 ± 0.05 |
| Total carbohydrates | 84.65 ± 0.04 |
The values represent the average of three determinations ± the standard deviation. The values are expressed as percentages (g/100 g).
Disclaimer/Publisher’s Note: The statements, opinions and data contained in all publications are solely those of the individual author(s) and contributor(s) and not of MDPI and/or the editor(s). MDPI and/or the editor(s) disclaim responsibility for any injury to people or property resulting from any ideas, methods, instructions or products referred to in the content. |
© 2026 by the authors. Licensee MDPI, Basel, Switzerland. This article is an open access article distributed under the terms and conditions of the Creative Commons Attribution (CC BY) license (http://creativecommons.org/licenses/by/4.0/).
Copyright: This open access article is published under a Creative Commons CC BY 4.0 license, which permit the free download, distribution, and reuse, provided that the author and preprint are cited in any reuse.