

Submitted:
06 November 2026
Posted:
10 November 2026
You are already at the latest version
Abstract
Training-hour indicators appear in human-capital sustainability reporting, but disclosure presence does not show which workforce groups are represented or whether information is consistent. Guided by stakeholder theory, this study examines disclosure depth, category granularity, worker visibility and two-year consistency in Malaysian listed palm-oil companies. Quantitative content analysis of public documents covers 85 company-years in 2023 and 2024, including 72 category-level observations and 31 companies with qualifying disclosures in both years. Relevant training information appeared in all 85 observations. Numerical hours appeared in 77 (90.6%), category-level values in 72 (84.7%) and separately named numerical worker-category hours in 44 (51.8%). The category-level observations contained 27 company-defined label patterns, with a median of four categories. In the paired subset, category structure was stable in 27 companies (87.1%), coded reporting-perimeter grouping in 28 (90.3%) and the hour unit in all 31. Five companies changed category structure or disclosure basis. Broad coverage therefore coexisted with heterogeneous classifications and incomplete numerical visibility of workers. This study contributes a disaggregated account of what a prescribed human-capital indicator makes observable. It does not assess stakeholder use, training effectiveness, employee experience or workforce outcomes.
Keywords:
corporate sustainability reporting
; human-capital disclosure
; employee training
; workforce visibility
; disclosure quality
; reporting consistency
; palm oil
; Malaysia
1. Introduction
1.1. Background and Significance of Human-Capital Reporting
Corporate sustainability reporting provides public information about workforce-related practices and the organisational conditions through which companies maintain their activities. Human-resource development is part of sustainable human-resource management, and employee training is a recurring topic in corporate reporting [1,2,3]. Training-hour disclosures can therefore contribute to a documentary account of how companies describe workforce development.
Reported hours remain a bounded indicator. They describe a quantity of reported training activity, not its quality, accessibility, learning outcomes or effect on employees. This study examines the information made available in company reports and does not assess training programmes or workforce outcomes [3].
1.2. Reporting Problem and Research Gap
Disclosure presence does not resolve the interpretive problem faced by a report user. A narrative statement, an aggregate total, an average and category-level hours provide different levels of numerical detail, while category labels, denominators and organisational boundaries may remain unclear. Existing measures of disclosure extent therefore cannot by themselves show which workforce groups are numerically visible or whether the same reporting basis is retained across years.
A separately named worker category with numerical hours makes that group visible in the selected table, whereas a worker label without a value, a narrative mention or inclusion in a broader category provides a different type of evidence. The absence of a separate worker category cannot establish that workers received no training, and a reported worker value cannot establish training adequacy.
Malaysian research has examined the extent and content of human-capital and sustainability disclosure [6,7,8,9]. Hanapi et al. provide a broader sectoral baseline through a sustainability-reporting index covering 56 Malaysian agriculture and plantation companies and 75 disclosure elements from 2016 to 2023 [13]. This literature establishes the reporting context, while disclosure-quality research distinguishes information availability from specificity and consistency [4,5]. It does not answer how a single prescribed training indicator is structured across company-defined workforce groups.
The study addresses a measurement and comparability gap within that literature. Rather than treating training-hour disclosure as a binary item, it distinguishes numerical specificity, company-stated category structure, separately visible worker groups, reporting scope and two-year continuity. This design shows what a common indicator makes observable and where the report leaves interpretation unresolved. It does not infer employee experience from corporate documents.
1.3. Malaysian Palm-Oil Reporting Context
Bursa Malaysia’s Sustainability Reporting Guide, third edition, lists total training hours by employee category as common indicator C6(a) under labour practices [10]. The study codes C6(a)-type or equivalent employee-training disclosures for analysis. A coded relevant disclosure is not, by itself, a finding of regulatory compliance.
Bursa Malaysia introduced its Enhanced Sustainability Reporting Framework in phases. Common sustainability matters for Main Market issuers began for financial years ending on or after 31 December 2023, while prescribed sustainability disclosures for ACE Market issuers began for financial years ending on or after 31 December 2024 [14]. The 2023 and 2024 observations therefore span different implementation stages rather than one uniform reporting regime.
Studies of Malaysian palm-oil companies have examined broader environmental, social and governance reporting and employee development [11,12]. Together with the wider agriculture and plantation index [13], this work establishes a sectoral reporting context. The current analysis focuses on the structure and visibility of employee training-hour information within that context.
1.4. Research Question, Objectives and Contribution
The research question is as follows. How do Malaysian listed palm-oil companies report employee training hours, how detailed are these disclosures across company-defined employee categories, and how consistent are the disclosures between 2023 and 2024 among companies represented in both years?
RO1 examines the presence and numerical depth of employee training-hour disclosure across the 85 eligible company-years in 2023 and 2024. RO2 examines the category-level disclosures, including their granularity, worker visibility and stated scope. RO3 examines the consistency of reporting structure and basis across the 31 companies with qualifying category-level disclosure in both years.
The contribution is a census-based account of the reporting architecture attached to one human-capital indicator. It separates disclosure presence, numerical specificity, category granularity, worker visibility and temporal consistency, thereby linking the broad disclosure literature to the narrower question of how workforce classifications and reporting boundaries accompany reported hours. These are documentary reporting characteristics, not measures of training performance or stakeholder decisions.
2. Theoretical and Conceptual Framework
2.1. Stakeholder Theory
Stakeholder theory provides the study’s theoretical foundation. Donaldson and Preston distinguish descriptive, instrumental and normative aspects of the theory [15]. This study draws on its normative aspect in a limited way. Employees are relevant stakeholders in information about workforce development, while other report users may need that information to understand a company’s stated practices. The theory motivates attention to whose activity is made visible in the report.
Prior Malaysian research has used stakeholder expectations to examine human-capital disclosure [7]. The current study does not measure stakeholder salience, employee expectations, engagement, information use or whether reports meet stakeholder needs. Stakeholder theory frames why workforce visibility matters; it does not supply evidence about the effects of disclosure.
2.2. From Theory to the Conceptual Framework
The conceptual framework translates this concern into report-level attributes. It distinguishes whether relevant training information is present, whether hours are numerical, how many company-defined categories are reported, whether worker groups have separately named numerical values, what organisational scope and measure basis are stated, and whether these attributes remain consistent across two years. This separation follows research that treats disclosure quality and numerical specificity as distinct from disclosure presence [4,5].
These attributes describe what can be observed in the documents. Category labels, scope and reporting continuity are not employee-level measures, and the framework does not posit a causal path from disclosure to training quality or workforce outcomes. The analytical relationships and denominators are specified in the Methods section.
3. Materials and Methods
3.1. Research Design
The study uses a longitudinal, secondary-data quantitative content analysis of publicly available annual, integrated and sustainability reports and corresponding Bursa filings. The eligible frame is a census of 44 issuers contributing 42 company-years in 2023 and 43 in 2024, rather than a sampled survey. Reports are coded at company-year level, and the resulting classifications are summarised using counts, percentages and category-count statistics. Limited qualitative coding preserves company-stated employee labels and reporting scope. No employee-level records or perceptual measures are used.
Content analysis has established precedent in Malaysian human-capital and sustainability-reporting research [6,8,9,13]. Here, its application is focused on the observable structure of training-hour disclosures. The study does not use regression, hypothesis testing or an explanatory model of reporting behaviour. Descriptive differences across years are reported as characteristics of the eligible reporting frame.
3.2. Population, Study Period and Unit of Analysis
The eligible population comprises Malaysian listed issuers with an operating oil-palm business during the relevant financial year. The frame contains 44 unique issuers, contributing 42 eligible company-years for 2023 and 43 for 2024, giving 85 observations overall. Eligibility is year-specific. The full frame is therefore not a balanced panel of all issuers in both years. The supplementary issuer and observation registers identify the issuers, eligible years and retained inclusion decisions.
The primary unit of analysis is the company-year, defined as one issuer in one financial year. Employee categories are report-level characteristics rather than employee observations. The study does not contain employee-level records, headcount-weighted estimates of training access, or a sample of individual workers. References to companies in the two-year consistency analysis identify within-company pairs, not additional observations beyond the corresponding company-years.
The observation period remains 2023 and 2024 even where a later report supplies an explicitly identified comparative figure for an earlier year. Observation year and source-document year are recorded separately. Later publication does not create a new observation year, and a comparative figure is not counted a second time.
3.3. Documentary Sources and Issuer Eligibility
Issuer selection used listing status and evidence of an operating oil-palm business, including plantation estates, fresh fruit bunch operations, mills or upstream plantation subsidiaries. The frame includes plantation issuers and additional or historical listed issuers meeting that operating-business criterion. Current listing status at extraction was not substituted for eligibility in the observation year. Johor Plantations Group and MKH Oil Palm (East Kalimantan) enter only in 2024 because they were not yet listed in 2023. Boustead Plantations contributes only 2023 following its delisting during 2024. FGV remains eligible for both observation years despite subsequent delisting. These year-specific decisions are retained in the issuer register; availability of a training value does not establish eligibility.
The source hierarchy prioritised an issuer’s official annual, integrated or sustainability report and the corresponding Bursa filing. A matched filing or reproduction was retained only where the official route was inaccessible, with the issuer identity, document title and provenance limitation recorded. Within the document, the selected employee-training presentation had to identify the observation year, hour measure and employee categories. Equivalent disclosures outside the C6(a) performance table were eligible. Directors-only training or employee headcounts were not substituted for employee training hours. A more detailed or differently scoped table was recorded as an alternative rather than automatically replacing the selected basis.
Original-year reports and later official comparative disclosures were both used. A later source was eligible only when its year column or accompanying text explicitly assigned the information to the earlier observation year; publication date alone was insufficient. The source register records the selected presentation and the reason or limitation where an original, later or alternate source differed. The selected basis was kept fixed for within-company consistency coding, while alternative values, category labels and scope statements remained separate. No universal rule that the latest report overrides the original was imposed. Each company-year is counted once, and explicit restatement markers are distinguished from retrospective sourcing.
3.4. Operational Definitions and Coding
Coding proceeded at company-year level. The report and source locator were identified first, followed by the displayed year, training unit and measure basis. Relevant training disclosure records employee-training information, including narrative descriptions, policies and non-hour measures. Numerical training-hour disclosure requires at least one actual numerical hour value assigned to the observation year and may be a total or an average. Training expressed in man-days was not converted to hours. Numerical specificity therefore remains separate from category-level qualification.
The disclosure-form decision follows the information available in the selected presentation. Category-level qualification requires numerical total training hours assigned to identifiable company-stated employee categories. An aggregate employee total, including totals divided only by business division, is total-only when employee categories are not identified. Average hours without category totals are average-only, even if averages are displayed by employee category. Relevant narrative or non-hour measures without numerical hours form a separate non-numerical group; absence of relevant information is a further state. This rule retains 72 category-level observations and excludes 13 from RO2 only, comprising three total-only, two average-only and eight non-numerical observations. Their identifiers and reasons are available in RO2_Exclusions.
Employee categories retain the company’s wording, capitalisation and qualification. Category granularity counts distinct labels in the selected displayed structure, excluding aggregate totals and repeated occurrences of the same label across segment rows. A displayed label with unavailable data remains part of the reporting structure but is not a verified numerical value. Exact label patterns are formed from the distinct selected labels in their retained order, separated by semicolons. RO2_Structures supplies the pattern and count for each qualifying company-year. Neither label spelling nor granularity establishes occupational equivalence, and the number of displayed categories is distinct from the number of numerical rows released for calculation.
Worker visibility requires an explicit separately identifiable worker or labour label, such as General Workers, Labour, Operational Workers or Field Workers. Non-executive or staff labels are not reclassified as workers by inference. The mutually exclusive states distinguish a worker category with numerical hours, a separately named category with “No Data Provided”, a narrative-only worker mention, visibility only in an alternate C6(a) presentation and no separate worker label in the selected disclosure. A source-reported numerical zero remains a numerical disclosure; a dash, blank or unavailable-data label does not. Alternate-table visibility is recorded without replacing the selected within-company basis.
Reporting scope records the organisational population and training basis stated for the selected disclosure. General report-level group coverage is recorded as such and does not establish independently verified indicator-specific coverage. Consolidation for Table 2 retains specific operational, subsidiary, geographical, segment and training-basis descriptions before the general group/report class; expressly unresolved perimeters remain unresolved. Scope_Groups documents the mapping from retained source wording to the eight reported groups. For RO3, category structure, count, worker state, organisational perimeter, reporting duration, disclosure basis and units are examined separately. Harn Len’s financial-period versus financial-year difference concerns duration, not proof of a changed organisational perimeter. The reported 28 / 2 / 1 grouping is retained with that qualification.
3.5. Analytical Datasets and Numerical-Pair Safeguard
RO1 uses the complete census of 85 company-years to assess disclosure presence and numerical depth. RO2 uses the 72 category-level numerical company-years. The remaining 13 stay within RO1 and are excluded only from RO2. RO3 consists of the 31 companies with qualifying category-level disclosures in both years, contributing 62 company-years. The membership flags are supplied in Observations and the company-level register in RO3_Consistency. Numerical extraction completeness is not a substitute for disclosure qualification.
RO3 membership is not conditioned on unchanged categories or reporting scope. Such changes are evidence for the consistency analysis. The separate 26-company, 52-company-year pool is a technical numerical-pair validity pool only. It is neither a research-objective denominator nor a substantive construct, and it does not replace the 31-company RO3 subset.
Technical pairing requires compatible category definitions, organisational scope, reporting duration, training basis and hour units. Changed or ambiguous structures are retained in RO3 but are not forced into a like-for-like numerical comparison. For a company in the 26-company technical pool, actual pair release further requires both year values and their exact labels and units to pass the recorded source check, review of relevant restatement markers and clearance of outstanding pair-affecting discrepancies. Pair_Readiness supplies that separate decision. Only Negeri Sembilan Oil Palms, Kretam Holdings and United Malacca meet it for Table S1. No additional company or restricted value is released by the disclosure analysis. The selection and composition of the RO1, RO2 and RO3 samples and the nested technical-pair pool are summarised in Figure 1.
3.6. Data Provenance and Verification
The extraction records link an immutable issuer-code/year identifier to document title, page or section, source URL, observation year, source-document year, exact category labels, units, measure basis and stated scope. The current source register records retrieval on 5 October 2026; item-level check dates and methods are retained in the supporting records. The Source_Register sheet supplies the selected document locator for every company-year, and Category_Values links numerical and unavailable-data rows to the same identifiers. Retrospective and restatement flags are recorded separately. A restatement is coded only where the selected training disclosure or its applicable note explicitly marks a revision; absence means no such marker was identified in the reviewed source.
Second checking revisited the identified report section or year column to check the label, period, unit and transcription, then compared the resulting code with the observation and membership registers. PDF text rereading and visual page checks are recorded separately. A visual check is claimed only where the retained record documents one. Because the rechecks were not performed by an independent second coder, no inter-coder reliability coefficient is reported. Disagreements between presentations were logged with the selected basis and any numerical restriction rather than resolved by changing a reported value.
OpenAI ChatGPT (Luna 6) was used to support literature organisation, documentary data extraction and coding support, calculation cross-checking, language and grammar refinement, manuscript drafting support and consistency checking. Microsoft Excel was used for data organisation and descriptive calculations. AI-assisted readings were checked against source locators and recorded evidence; inaccessible or contradictory records remained restricted. The authors controlled eligibility, operational definitions, source-selection decisions and interpretation. The authors reviewed and verified the manuscript, underlying sources and reported findings and take full responsibility for the final content. The Excel workbook retains row-level records and check methods; AI-generated text was not treated as an independent source or substituted for missing reported observations.
No missing value was estimated, interpolated or imputed. Blanks, dashes and “No Data Provided” remained non-numerical, while an expressly reported numerical zero was retained as zero. Man-days were not converted, averages were not multiplied by inferred headcounts and incompatible totals were not repaired by arithmetic reconciliation. Unresolved scope was not filled by inference. Contradictions, Unresolved_Values and Pair_Readiness preserve the resulting limitations, so that a reader can distinguish disclosure coding from the narrower release of exact numerical pairs.
3.7. Analytical Procedures
RO1 frequencies describe relevant disclosure, numerical hours, qualifying category-level disclosure and worker-visibility states. Overall percentages use 85 company-years; year-specific percentages use 42 for 2023 and 43 for 2024. Mutually exclusive disclosure-form categories are distinguished from overlapping information-depth characteristics. Differences in year-specific proportions are descriptive and do not establish within-company change across the whole census.
RO2 summaries use 72 company-years. Category-count distributions, the median, mean and range describe reporting granularity. Exact label-pattern counts describe heterogeneity without merging categories on assumed occupational equivalence. Worker-visibility states and consolidated reporting-scope groups are reported separately. Percentages are presented to one decimal place.
RO3 summaries use 31 companies. Within-company classifications cover category structure and count, broad worker-visibility status, reporting perimeter, disclosure basis and units. Material change classes retain companies with changed reporting architecture. Retrospective sourcing and explicit restatement are reported as provenance characteristics, not as workforce changes. Broad worker-visibility stability is distinguished from exact terminology stability.
Unrestricted numerical pairing is screened separately for compatible category basis, organisational scope, training or disclosure basis, reporting-period length and units, together with retained source-verification restrictions. Only released pairs are used in Table S1. Absolute change is the 2024 value minus the 2023 value; percentage change divides that difference by the 2023 value and multiplies by 100. These quantities describe matched reported categories within the released companies. They are not used for sector-wide inference or cross-company performance ranking.
3.8. Sensitivity Analyses
To assess whether the main findings remained consistent under different coding and data-selection rules, three descriptive sensitivity analyses were conducted. First, 22 company-year observations obtained from later-year reports were temporarily excluded to examine whether retrospective reporting affected the findings. Second, the RO2 analysis was restricted to 63 observations with a clearly identified reporting scope, excluding nine observations where the scope remained unresolved. Third, worker visibility was examined using two definitions. The strict definition required a separately identified worker category with numerical training hours, while the broader definition also included worker categories identified without numerical values or in an alternative training table. These checks assessed whether the findings changed under different reasonable conditions. The original RO1, RO2 and RO3 datasets remained unchanged, missing values were not estimated, and numerical comparisons that had not met the verification requirements remained excluded.
4. Results
4.1. Disclosure Depth Across the Full Census
Relevant C6(a)-type or employee-training disclosure appeared in all 85 eligible company-years. Numerical training-hour information appeared in 77, or 90.6%, and qualifying category-level numerical information in 72, or 84.7%. Three observations provided total-only disclosure, two average-only disclosure and eight narrative-only or non-hour disclosure without numerical training hours. No observation lacked relevant training disclosure.
Numerical disclosure accounted for 36 of 42 observations in 2023 and 41 of 43 in 2024. Category-level numerical disclosure accounted for 32 of 42 and 40 of 43 respectively. The category-level proportions were 76.2% and 93.0%, with a difference of 16.8 percentage points. These figures describe the year-specific frames.
Separately named numerical worker-category hours appeared in 44 of 85 company-years, or 51.8%. Two more observations separately named workers but recorded “No Data Provided”; five named workers only narratively, and one provided worker visibility only in an alternate C6(a) table. Thirty-three observations had no separate worker label in the selected training disclosure. Numerical worker visibility was 47.6% in 2023 and 55.8% in 2024. Table 1 reports the full classifications, and Figure 2 displays the selected information-depth levels using the same census denominator.
4.2. Employee-Category Granularity, Worker Visibility and Reporting Scope
Among the 72 RO2 company-years, the median number of reported categories was four and the mean was 3.85, with a range from three to eight. Forty observations used four-category structures, representing 55.6% of the dataset. Twenty-four used three categories, five used five, two used six and one used eight.
Forty-four of the 72 observations, or 61.1%, separately named a worker category with numerical hours. Two separately named workers but reported “No Data Provided”, and one provided worker visibility only in an alternate C6(a) table. The selected disclosure structures therefore separately named workers in 46 observations, or 63.9%, while 25 observations did not separately name workers in the selected disclosure.
The largest consolidated scope group was group or report scope, covering 50 observations, or 69.4%. Exact perimeter remained unresolved in nine, or 12.5%. Other source-coded groups covered segment-specific or changing segment bases, operational and support-service units, specified Kretam operations, training-specific or health-and-safety bases, Malaysia-only operations, and a group scope covering Malaysia and Indonesia.
The dataset contained 27 distinct exact company-stated category-label patterns. The most frequent pattern was “Management; Executive; Non-executive/Technical Staff; General Workers”, recorded in 25 observations, or 34.7%. Exact patterns include differences in capitalisation and wording as well as differences in the number and composition of labels. Table 2 preserves all retained patterns alongside granularity, worker visibility and reporting scope. Figure 3 shows the category-count distribution.
4.3. Two-Year Reporting Consistency
Across the 31 RO3 companies, 27 retained the same selected category structure and four changed it. The corresponding proportions were 87.1% and 12.9%. Twenty-eight companies retained the same source-coded reporting perimeter, two changed segment or disclosure perimeter, and one had a reporting-period or related basis difference. All 31 retained the hour unit. Disclosure basis was stable in 27 and changed in four. Table 3 presents these dimensions and the source-year characteristics.
Broad worker-visibility status was unchanged in 29 companies, or 93.5%. Seventeen had numerical worker visibility in both years. Eleven had no separately visible worker category in the selected table in either year, and one separately named workers with “No Data Provided” in both years. Two moved from numerical worker visibility in 2023 to no separate worker category in the selected 2024 disclosure. No company moved from absent worker visibility to new numerical visibility. One additional company changed worker terminology while preserving numerical visibility.
Twenty-six companies retained stable category structure and disclosure basis. Five had a material change in one or both dimensions. TSH Resources changed category structure and count while retaining disclosure basis. Harn Len retained category structure but changed reporting or disclosure basis. PLS Plantations changed category structure, count and disclosure basis while retaining perimeter. Kuala Lumpur Kepong and Batu Kawan changed category structure, disclosure basis and reporting perimeter. Table 4 reports the mutually exclusive within-company classes. Figure 4 summarises stable dimensions, with broad worker-visibility stability distinguished from exact label continuity.
Twenty-one selected 2023 observations were sourced retrospectively, representing 67.7% of the 31-company subset. One selected 2024 observation was sourced retrospectively, or 3.2%. Two companies explicitly restated the selected 2023 comparative figures; none explicitly restated the selected 2024 figures. These source characteristics remain separate from the observation years and from the reporting-change classes.
4.4. Restricted Numerical-Pair Analysis
The technical numerical-pair pool contains 26 companies, but only three passed the retained unrestricted pair-readiness gate, representing 11.5% of that pool. Table S1 presents the released within-company category-level changes for Negeri Sembilan Oil Palms, Kretam Holdings and United Malacca. The three-company evidence was not used to infer a sector-wide training trend. It does not change the denominators used for RO1, RO2 or RO3.
4.5. Sensitivity Checks
Three sensitivity analyses were conducted to assess whether the main findings remained consistent under different data-selection and coding rules.
First, excluding retrospective observations. After removing 22 company-year observations obtained from later-year reports, 63 observations remained, including 50 qualifying for RO2. Numerical training-hour disclosure was found in 55 of the 63 observations (87.3%), compared with 77 of 85 (90.6%) in the original dataset. Category-level numerical disclosure was found in 50 of 63 observations (79.4%), compared with 72 of 85 (84.7%) originally. Separately identified worker categories with numerical training hours appeared in 32 of 63 observations (50.8%), compared with 44 of 85 (51.8%) in the original dataset.
Second, excluding observations with unclear reporting scope. Within RO2, nine observations were excluded because the organisational scope of their training disclosures remained unresolved. Among the remaining 63 observations, 37 (58.7%) separately reported numerical training hours for worker categories, compared with 44 of 72 (61.1%) in the original RO2 dataset.
Third, applying a broader definition of worker visibility. The original definition counted only separately identified worker categories with numerical training hours. The broader definition also included worker categories identified without numerical values or in alternative training tables. Under this definition, worker visibility increased from 44 of 85 observations (51.8%) to 52 of 85 (61.2%) in the full dataset, and from 44 of 72 (61.1%) to 47 of 72 (65.3%) in RO2.
Overall, the sensitivity analyses produced some differences in the reported percentages, but the main finding remained consistent. Although employee training information was widely disclosed, numerical training hours for separately identifiable worker categories were not consistently available. These additional analyses did not change the original RO1, RO2 or RO3 populations.
5. Discussion
5.1. Stakeholder Perspective and Disclosure Visibility
From the normative stakeholder perspective used here, the central finding concerns the visibility of workforce information in corporate reports. Relevant training information appeared in all 85 company-years, but separately named numerical worker-category hours appeared in 44 (51.8%). The reports therefore made the topic broadly visible while representing worker groups numerically in only about half of the census. This finding concerns documentary availability and does not establish how any report was used.
This distinction develops the disclosure-quality concern identified by Minutiello and Tettamanzi [4]. Liu distinguishes the availability of numerical ESG information from its standardisation in a study of ESG-rating divergence [5]. The present analysis concerns a narrower reporting characteristic. A common training-hour topic coexisted with company-defined labels and differing or unresolved reporting boundaries. Numerical totals could therefore leave workforce classifications unobserved. The study does not test ratings or a regulatory mechanism, but refines the measurement problem by showing which categorical and scope information accompanies the quantity.
The higher 2024 proportions do not establish that Bursa requirements caused improved disclosure. The annual frames differ, the observation period is short and the design contains no counterfactual analysis. Nor is the relevant-disclosure classification a complete compliance assessment. The defensible inference concerns the information in the selected records. Even where coverage is high, a reader cannot assume that the report provides category-level detail or separately identifiable worker hours.
5.2. Standardised Indicator, Heterogeneous Workforce Classifications
A common training-hour indicator did not correspond to a single workforce classification. The 27 exact label patterns make this variation visible, although their meaning requires care. Some patterns differ typographically; others distinguish local and foreign workers, include contractor workers, subdivide management or separate business-segment categories. The exact-pattern count must therefore not be read as 27 substantively different occupational systems. It records the classifications as communicated to report users.
The median of four categories does not resolve this heterogeneity. Two reports can contain four categories while defining different groups, and two similar labels can cover different workforces. Category counts describe granularity, not the substantive equivalence of categories. Treating every non-executive label as a worker group would create a common classification that the source documents do not establish.
Company-specific classifications may reflect legitimate differences in organisational hierarchy, business activities or employment arrangements. Label diversity therefore does not by itself establish poor reporting. The interpretation problem arises when a report leaves category coverage unexplained or does not show how a changed classification relates to the earlier year.
Hanapi et al. provide an important broader reporting-index baseline [13]. The present analysis adds a different level of observation by retaining the labels through which a single indicator is operationalised. It shows how standardisation of the reported topic can coexist with variation in the classifications attached to numerical values. This is a measurement issue for users who wish to interpret the social and human-capital dimension of sustainability reporting across issuers.
5.3. Workforce Visibility in Human-Capital Sustainability Reporting
Worker visibility concerns whether a reported group can be separately identified, not whether the group received an adequate quantity of training. Absence of a separate label cannot establish exclusion from training, while a numerical worker value cannot establish the quality or accessibility of learning. The analysis therefore identifies a limit in public observability rather than an employee-level outcome.
Within RO2, 61.1% of company-years provided numerical worker visibility. Naming workers without providing data made the classification visible but left the quantity unavailable. Alternate-table visibility supplied information elsewhere in a report but did not make the selected basis identical to that alternative. These states should remain separate because they enable different questions to be answered by a reader.
Hronová and Špaček examine employee development within a broader corporate-reporting framework that includes training and education disclosures [3]. Their framework establishes the place of employee development among reported sustainable HRM practices. The present analysis examines the internal structure of one such indicator by separating numerical hours, displayed categories and worker visibility. Malaysian studies of human-capital reporting and stakeholder expectations also examine broader reporting content [7,8]. Here, the evidence concerns which groups can be identified from a selected training table. No stakeholder or user survey was undertaken, so additional visibility is not shown to alter decisions or assessments.
5.4. Stability and Change Across Consecutive Reports
The evidence separates cross-company heterogeneity from within-company temporal consistency. Most RO3 companies retained the same selected category structure and reporting perimeter over two years. That stability can support continuity of interpretation within a company even where its classifications differ from those used elsewhere. Commonality across firms and stability across years are consequently different properties of reported information.
The distinction also applies to reporting duration. An unchanged organisational population can be reported for periods of different lengths, while an unchanged year label does not establish the same training basis. Harn Len’s financial-period versus financial-year distinction is retained as a basis difference. The perimeter percentage must consequently be read within the source-coded grouping rather than as uniform assurance of like-for-like annual quantities.
Stable structure does not necessarily indicate complete workforce visibility. Eleven companies lacked a separate worker category in the selected table in both years, and one retained “No Data Provided” for workers. Their broad status was stable, but numerical worker observability remained limited. Stability should therefore be evaluated alongside what is being kept stable.
The five materially changed companies illustrate why report architecture must be examined before numerical change. An increase in categories may provide additional detail, but can also alter the basis on which earlier and later values are read. Changes in training or reporting basis and perimeter introduce further restrictions. Retaining these companies within RO3 allows the changes themselves to be analysed. Excluding them to obtain unchanged numerical pairs would answer a narrower question and obscure part of the consistency evidence.
Retrospective sourcing introduces another boundary. The study assesses documentary consistency using selected explicitly identified observation-year information. It does not reconstruct what every user could have observed from the original report at the time of publication. Later comparative figures and explicit restatements may affect that historical information set. The relatively high stability found here must be interpreted within the retained source-selection rules.
5.5. Practical Implications
For report users, the findings support reading each training-hour value together with its employee-category label, measure basis and organisational boundary. Separately named numerical worker-category hours appeared in 44 of 85 company-years. A broader label or “No Data Provided” should not be interpreted as evidence of zero training, and the three released numerical pairs do not support company rankings or sector-wide trend claims.
For companies, clearer reporting would define the employee categories used, state the population covered by the training indicator and distinguish zero from unavailable information. The exact perimeter remained unresolved in nine of 72 category-level observations, while two company-years named workers but recorded “No Data Provided”. A short explanation of the measure and any boundary change would make reported values easier to interpret.
For standard setters and exchanges, the five companies that changed category structure or disclosure basis among the 31 paired firms point to the value of a year-to-year bridge. Guidance could request definitions of categories and scope, together with explanations when the reporting basis changes, while allowing companies to retain appropriate job labels.
Only three companies passed the unrestricted numerical-pair gate, so the released changes are illustrative matched-category evidence rather than a basis for judging company performance. The recommendations concern information clarity and do not imply improved decisions or workforce results.
5.6. Limitations
The two-year window provides evidence about the 2023 and 2024 reporting environment only. It cannot establish a long-term trend, and the findings should not be transferred automatically to later reporting regimes. The census covers the defined listed palm-oil operating-business frame; it does not represent all Malaysian employers or all palm-oil operations. RO3 conditions temporal findings on qualifying category-level disclosure in both years. Its 31 companies therefore do not describe the continuity of reporting among every issuer in the full census.
Company-defined classifications limit occupational equivalence. The 27 exact patterns include textual as well as structural differences, and separately visible worker categories cannot be equated with all blue-collar employees. No employee-level denominators were used to infer participation, access or the distribution of training opportunities. Exact reporting perimeter remained unresolved for nine RO2 company-years and was not inferred.
Retrospective sourcing is substantial, particularly for selected 2023 observations. Observation-year and source-year distinctions preserve the study period but do not reproduce the complete original-publication information set. Source-check methods also differ. Same-assistant rechecks do not establish independent-coder agreement, and incomplete visual or numerical verification remains a provenance limitation. Completed disclosure classifications do not establish verification of every exact-hour calculation. A zero explicit-restatement count means that no marked restatement was identified in the reviewed selected disclosure, not that no revision could have occurred elsewhere.
Unrestricted numerical pairing is available for only three companies after the retained gate. Those pairs cannot support sector-wide numerical-change claims or company performance rankings. Finally, corporate disclosure is not an employee-level measure. Training-hour reporting does not measure learning quality, effectiveness, satisfaction, career development or improved human-capital sustainability. Informational usefulness is assessed through observable reporting characteristics, not directly tested through user behaviour.
6. Conclusions
Across 85 company-years, all observations contained relevant training information, 77 reported numerical hours, 72 reported category-level values and 44 separately named numerical worker-category hours. The category-level disclosures contained 27 company-defined label patterns, with a median of four categories. Among 31 paired firms, category structure was stable in 27, coded reporting-perimeter grouping in 28 and the hour unit in all 31. The findings show broad topic coverage alongside heterogeneous classifications and incomplete numerical worker visibility.
The study contributes a disaggregated account of what a human-capital reporting indicator makes observable. It shows broad topic coverage alongside heterogeneous classifications and incomplete numerical worker visibility, and it identifies category definitions, indicator-specific scope statements and year-to-year explanations as the information needed for more cautious comparison. The analysis does not establish stakeholder use, training effectiveness or workforce outcomes.
Supplementary Materials
The following supporting information can be downloaded at the website of this paper posted on Preprints.org. Supplementary materials accompanying the article include a coded observation workbook with the 85-company-year frame, coding dictionary, issuer and source registers, RO2 exclusions and structures, scope classifications, RO3 consistency records, category values, discrepancy and verification records, numerical-pair restrictions, and the sensitivity-analysis calculations. A traceability register identifies the ten released matched category pairs and their source-page locators. Supplementary Table S1 presents the technically valid within-company category-level training-hour changes. Corporate source reports are identified through publication URLs and page locators rather than reproduced.
Author Contributions
Conceptualization, D.D., A.A. and M.Y.A.; Methodology, D.D., A.A. and M.Y.A.; Investigation, D.D. and M.Y.A.; Data Curation, D.D. and M.Y.A.; Formal Analysis, D.D., A.A. and M.Y.A.; Validation, D.D., A.A. and M.Y.A.; Writing - Original Draft Preparation, D.D. and M.Y.A.; Writing - Review & Editing, D.D., A.A. and M.Y.A.; Visualization, D.D. and M.Y.A.; Supervision, A.A.; Project Administration, D.D., A.A. and M.Y.A.
Funding
Management and Science University provided funding for this research.
Institutional Review Board Statement
Ethical review and approval were not required for this study because it relied exclusively on publicly available corporate documents and secondary documentary data and did not involve human participants or identifiable private data.
Informed Consent Statement
Not applicable.
Data Availability Statement
The coded observations, coding dictionary, issuer and analytical membership registers, source locators, category records, sensitivity calculations and retained numerical restrictions are provided in the supplementary workbook accompanying this article. Supplementary Table S1 is provided separately. Observation year and source-document year are distinguished. Restricted numerical records remain available for audit but are not treated as released pairs. The source register identifies the original corporate reports; no repository DOI or public deposit is claimed.
Acknowledgments
The authors gratefully acknowledge the support of the Research Management Centre, Graduate School of Management, and Faculty of Business Management and Professional Studies, Management and Science University. OpenAI ChatGPT (Luna 6) supported literature organisation, documentary data extraction and coding support, calculation cross-checking, language and grammar refinement, manuscript drafting support and consistency checking. Microsoft Excel supported data organisation and descriptive calculations. AI-assisted outputs were not accepted automatically. The authors reviewed and verified the underlying sources, extracted data, coding decisions, calculations, methodological decisions, interpretations and final manuscript content and take full responsibility for the accuracy and integrity of the work.
Conflicts of Interest
The authors declare no conflicts of interest. The funder had no role in the study design, data collection, analysis or interpretation, manuscript preparation, or the decision to publish the results.
References
- Piwowar-Sulej, K. Core functions of sustainable human resource management. A hybrid literature review with the use of H-Classics methodology. Sustain. Dev. 2021, 29, 671–693. [Google Scholar] [CrossRef]
- Piwowar-Sulej, K. Human resources development as an element of sustainable HRM - with the focus on production engineers. J. Clean. Prod. 2021, 278, 124008. [Google Scholar] [CrossRef] [PubMed]
- Hronová, Š.; Špaček, M. Sustainable HRM practices in corporate reporting. Economies 2021, 9, 75. [Google Scholar] [CrossRef]
- Minutiello, V.; Tettamanzi, P. The quality of nonfinancial voluntary disclosure: A systematic literature network analysis on sustainability reporting and integrated reporting. Corp. Soc. Responsib. Environ. Manag. 2022, 29, 1–18. [Google Scholar] [CrossRef]
- Liu, M. Quantitative ESG disclosure and divergence of ESG ratings. Front. Psychol. 2022, 13, 936798. [Google Scholar] [CrossRef] [PubMed]
- Huang, C.C.; Abidin, Z.Z.; Jusoff, K. External reporting of human capital in Malaysia. Asian Soc. Sci. 2008, 4, 3–15. [Google Scholar] [CrossRef]
- Sahari, S.; Nichol, E.O.; Yusof, S.M. Stakeholders’ expectations on human capital disclosure vs. corporate reporting practice in Malaysia. Int. Bus. Res. 2019, 12, 148–155. [Google Scholar] [CrossRef]
- Abdullah, N.; Fatima, A.H.; Sulaiman, M. Business sustainability: The trend of human resource disclosure based on Malaysian evidence. J. Manag. Theory Pract. 2021, 2, 1–9. [Google Scholar] [CrossRef]
- Abbas, Y.A.; Mehmood, W.; Aliessa, M.H.M.; Aman-Ullah, A. Level of sustainability reporting of Malaysian IPO companies. Environ. Sci. Pollut. Res. 2022, 29, 69527–69539. [Google Scholar] [CrossRef] [PubMed]
- Bursa Malaysia Securities Berhad. Sustainability Reporting Guide, 3rd ed.; Bursa Malaysia Securities Berhad, 2022. Available online: https://bursasustain.bursamalaysia.com/droplet-details/resources/sustainability-reporting-guide-3rd-edition (access attempted on 6 October 2026). The direct guide PDF was inaccessible during final verification; the edition and publication year were corroborated using Bursa Malaysia Berhad’s Sustainability Report 2022, printed pp. 5 and 11, and the official Bursa Assist guidance. No guide page or chapter locator is claimed.
- Mad, S.; Mohd Suffian, M.T.; Omar, N.A. ESG disclosure in the palm oil industry: A comparative study of Malaysia and Indonesia. INSIGHT J. 2026, 13, 63–78. [Google Scholar] [CrossRef]
- Lau, P.Y.Y.; Park, S.; Hsu, Y.-C.; Lien, B.Y.-H.; Ho, J.A. Does investment in green employee development climate matter for environmental commitment and green well-being? A case study of a palm oil company in Malaysia. SAGE Open 2023, 13(4), 21582440231204130. [Google Scholar] [CrossRef]
- Hanapi, N.H.; Alahdal, W.M.; Hashim, H.A.; Salleh, Z.; Taha, R.; Adnan, S.M. Datasets for sustainability reporting index of agricultural & plantation companies in Malaysia. Data Brief. 2025, 60, 111491. [Google Scholar] [CrossRef] [PubMed]
- Bursa Malaysia Securities Berhad. Bursa Malaysia Enhances Sustainability Reporting Framework with New Climate Change Reporting. Media Release. 26 September 2022. Available online: https://www.bursamalaysia.com/sites/5bb54be15f36ca0af339077a/content_entry5c11a9db758f8d31544574c6/63312a2439fba20d86ba8e16/files/26Sept_2022_Bursa_Malaysia_Enhances_Sustainability_Reporting_Framework_With_New_Climate_Change_Reporting.pdf.
- Donaldson, T.; Preston, L.E. The stakeholder theory of the corporation: Concepts, evidence, and implications. Acad. Manag. Rev. 1995, 20, 65–91. [Google Scholar] [CrossRef]
Figure 1.
Selection and composition of the RO1, RO2 and RO3 analytical samples and the nested technical-pair safeguard. The 26-company pool is a technical gate and not an objective denominator.
Figure 1.
Selection and composition of the RO1, RO2 and RO3 analytical samples and the nested technical-pair safeguard. The 26-company pool is a technical gate and not an objective denominator.
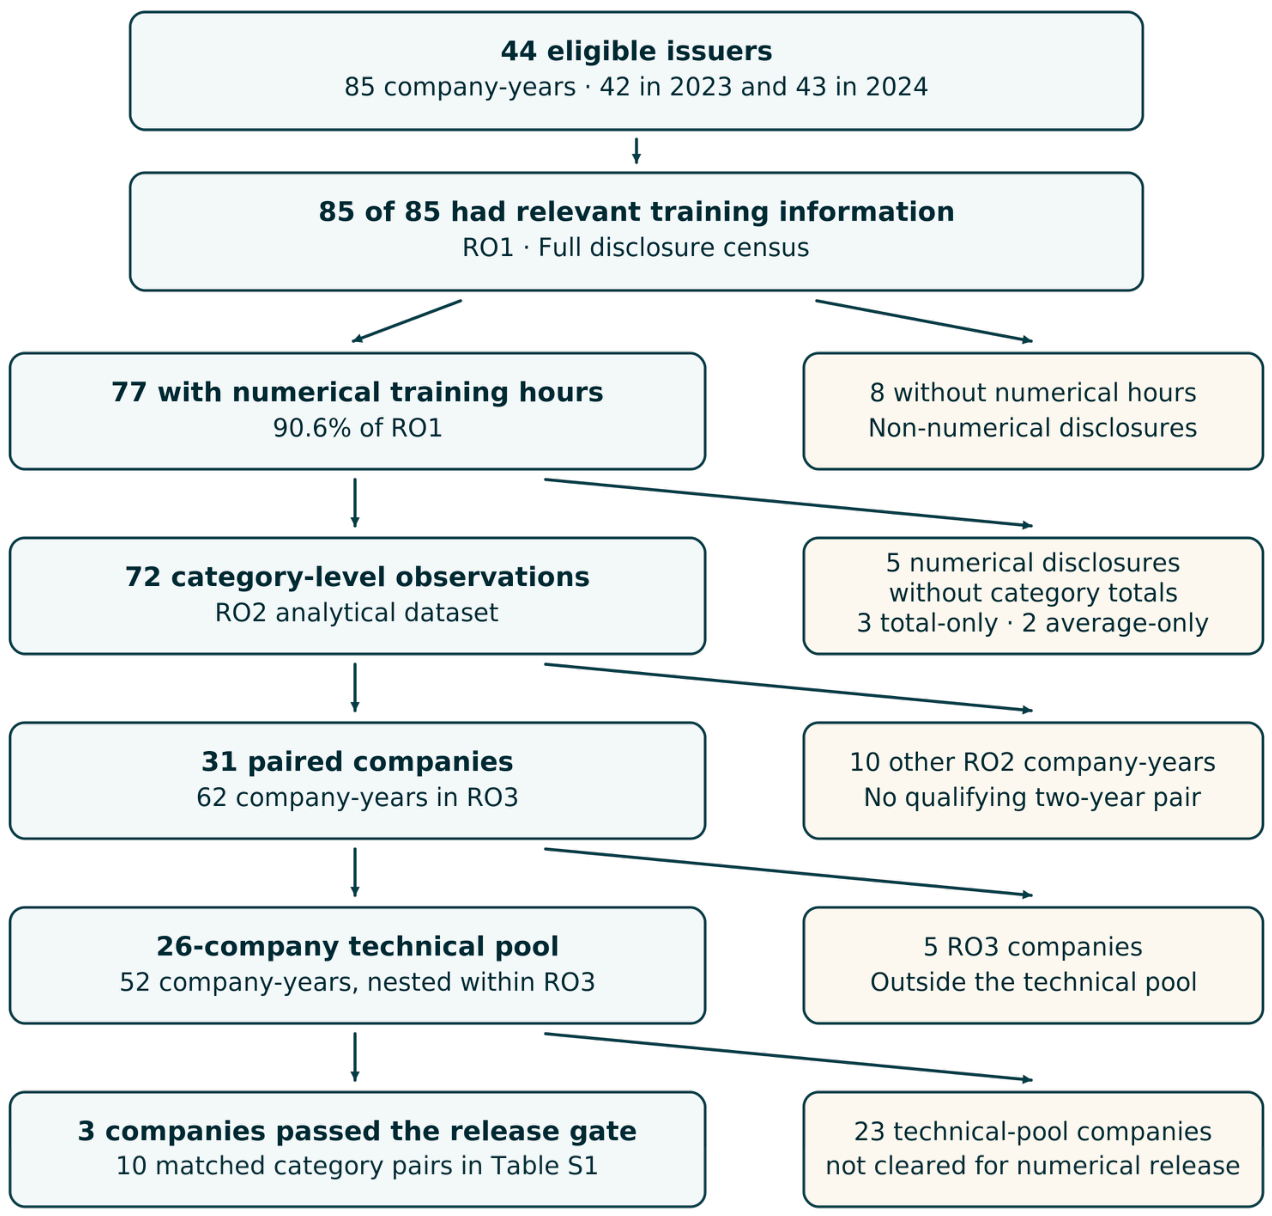
Figure 2.
Disclosure depth across progressively stricter information levels. Counts and percentages use 85 company-years. These overlapping dimensions do not constitute an additive distribution.
Figure 2.
Disclosure depth across progressively stricter information levels. Counts and percentages use 85 company-years. These overlapping dimensions do not constitute an additive distribution.
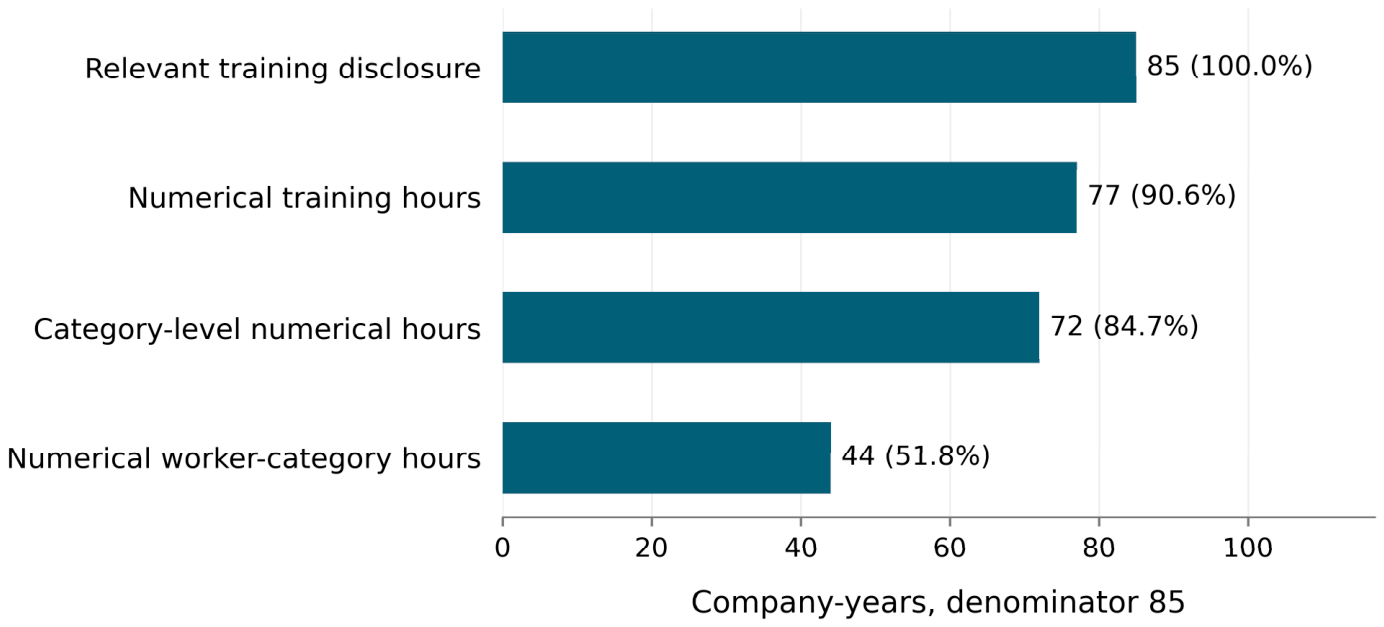
Figure 3.
Distribution of employee-category granularity. Counts and percentages use 72 company-years. Category totals exclude aggregate total rows.
Figure 3.
Distribution of employee-category granularity. Counts and percentages use 72 company-years. Category totals exclude aggregate total rows.
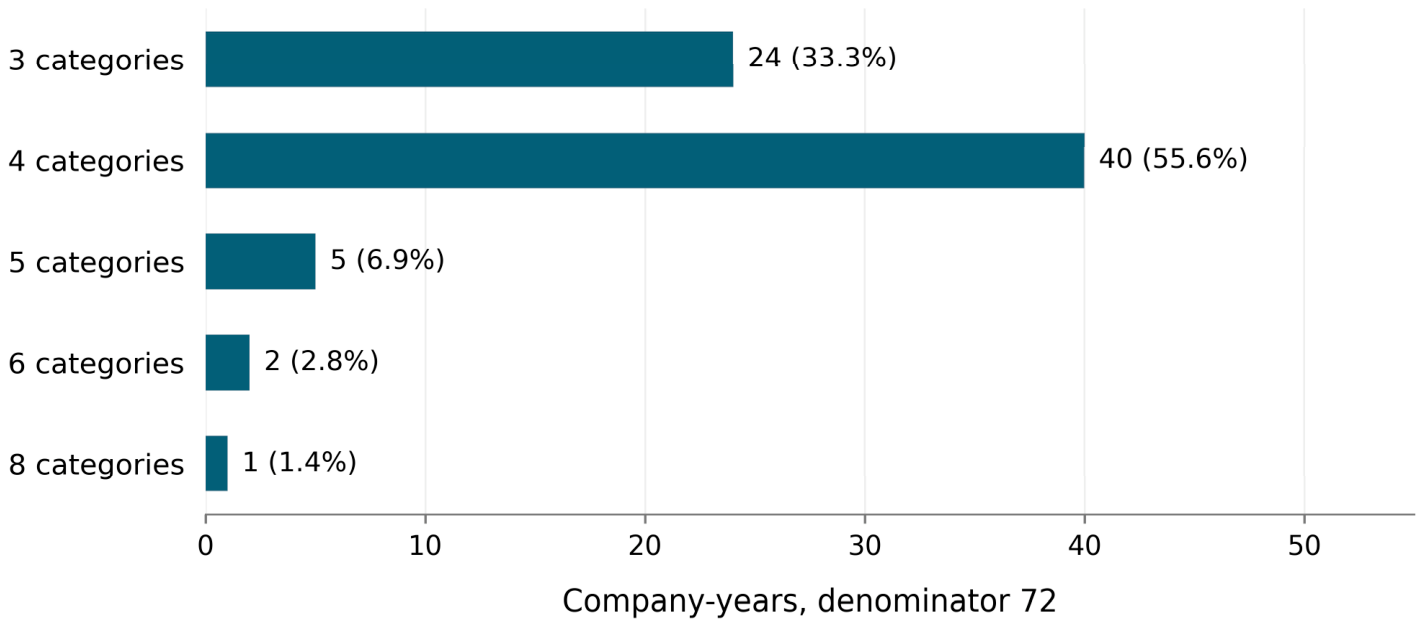
Figure 4.
Two-year reporting consistency across the 31-company balanced subset. Broad worker-visibility stability does not require unchanged terminology and does not establish numerical worker visibility in both years.
Figure 4.
Two-year reporting consistency across the 31-company balanced subset. Broad worker-visibility stability does not require unchanged terminology and does not establish numerical worker visibility in both years.
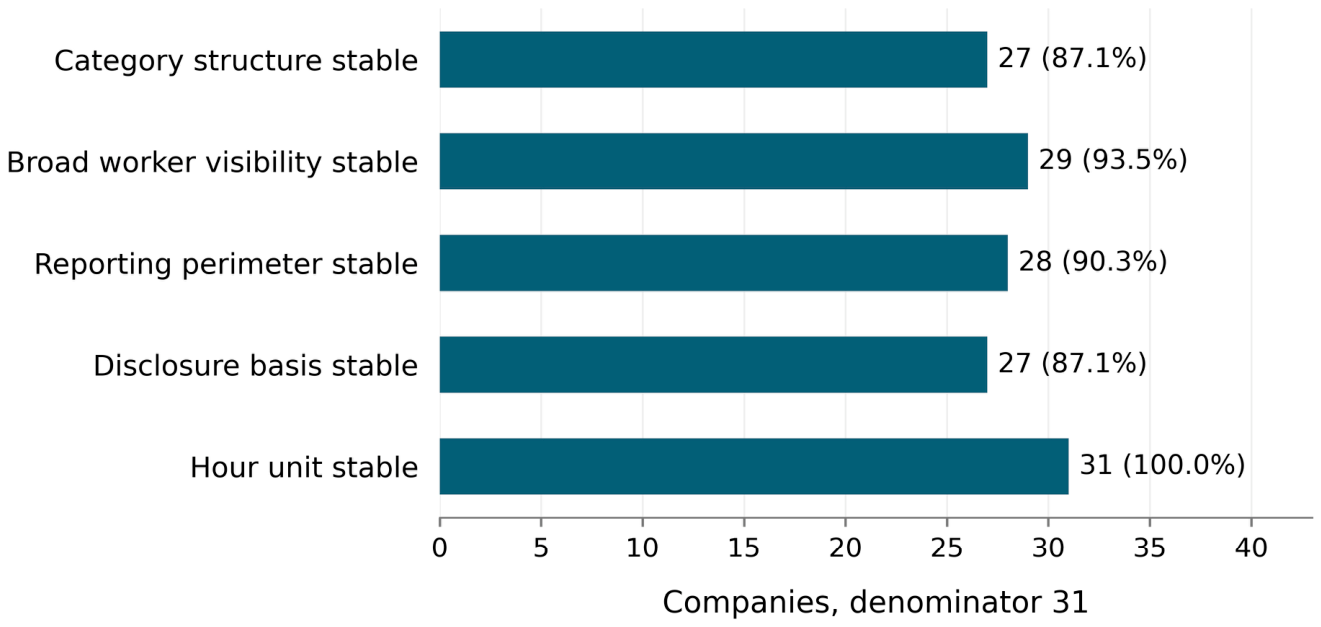

Table 1.
Disclosure coverage.
| Disclosure characteristic | Overall | 2023 | 2024 |
| C6(a)-type or relevant training disclosure | 85/85, 100.0% | 42/42, 100.0% | 43/43, 100.0% |
| Numerical training-hour disclosure | 77/85, 90.6% | 36/42, 85.7% | 41/43, 95.3% |
| Category-level numerical disclosure | 72/85, 84.7% | 32/42, 76.2% | 40/43, 93.0% |
| Total-only disclosure | 3/85, 3.5% | 3/42, 7.1% | 0/43, 0.0% |
| Average-only disclosure | 2/85, 2.4% | 1/42, 2.4% | 1/43, 2.3% |
| Narrative-only or non-hour disclosure without numerical training hours | 8/85, 9.4% | 6/42, 14.3% | 2/43, 4.7% |
| No relevant training disclosure | 0/85, 0.0% | 0/42, 0.0% | 0/43, 0.0% |
| Worker category separately named with numerical hours | 44/85, 51.8% | 20/42, 47.6% | 24/43, 55.8% |
| Worker category separately named but recorded as No Data Provided | 2/85, 2.4% | 1/42, 2.4% | 1/43, 2.3% |
| Worker category named only narratively | 5/85, 5.9% | 4/42, 9.5% | 1/43, 2.3% |
| Worker category visible only in an alternate C6(a) table | 1/85, 1.2% | 0/42, 0.0% | 1/43, 2.3% |
| No separate worker label in the selected training disclosure | 33/85, 38.8% | 17/42, 40.5% | 16/43, 37.2% |
Note. Overall denominator 85 company-years; 2023 denominator 42; 2024 denominator 43. Category-level, total-only, average-only and non-numerical disclosure forms are mutually exclusive and sum to 85. The information-depth rows overlap. Worker-visibility states sum to 85. Percentages are retained at one-decimal precision.
Table 2.
Employee-category granularity, worker visibility, reporting scope and exact label patterns.
Table 2.
Employee-category granularity, worker visibility, reporting scope and exact label patterns.
| Panel A. Category granularity | ||
| Number of distinct reported categories | Company-years | Percentage of 72 |
| 3 | 24 | 33.3% |
| 4 | 40 | 55.6% |
| 5 | 5 | 6.9% |
| 6 | 2 | 2.8% |
| 8 | 1 | 1.4% |
| Total | 72 | 100.0% |
| Panel B. Worker visibility | ||
| Worker-visibility state | Company-years | Percentage of 72 |
| Separately named with numerical hours | 44 | 61.1% |
| Separately named but No Data Provided | 2 | 2.8% |
| Visible only in an alternate C6(a) table | 1 | 1.4% |
| Not separately named in the selected training disclosure | 25 | 34.7% |
| Total | 72 | 100.0% |
| Panel C. Reporting scope | ||
| Coded reporting-scope group | Company-years | Percentage of 72 |
| Group or report scope | 50 | 69.4% |
| Exact perimeter unresolved | 9 | 12.5% |
| Segment-specific or changing segment basis | 4 | 5.6% |
| Operational and support-service units | 2 | 2.8% |
| Specified Kretam subsidiaries or operations | 2 | 2.8% |
| Training-specific or health-and-safety basis | 2 | 2.8% |
| Malaysia operations only | 2 | 2.8% |
| Group scope covering Malaysia and Indonesia | 1 | 1.4% |
| Total | 72 | 100.0% |
| Panel D. Exact employee-category label patterns | ||
| Exact company-stated pattern | n | % |
| Management; Executive; Non-executive/Technical Staff; General Workers | 25 | 34.7 |
| Management; Executive; Non-Executive | 7 | 9.7 |
| Management; Executive; Staff | 2 | 2.8 |
| Management; Executive; Non-executive/Technical Staff | 2 | 2.8 |
| Management; Executive; Non-executive/Technical Staff; General Workers - Local; General Workers - Foreigner | 2 | 2.8 |
| Management; Executive; Non-Executive; General Workers | 2 | 2.8 |
| Executive; Non-executive/Technical Staff; General Workers | 2 | 2.8 |
| Management; Executive; Non-Executive/Technical Staff; General Workers | 2 | 2.8 |
| Management; Executive; Non-Executive/Technical staff; General workers | 2 | 2.8 |
| Management; Employees; Workers | 2 | 2.8 |
| Manager; Executive; Non-Executive | 2 | 2.8 |
| Senior Management; Middle Management; Junior Management; Non-executive/Technical Staff | 2 | 2.8 |
| Key Senior Management (Included Executive Directors); Middle Management; Executive; Non-Executive | 2 | 2.8 |
| Executive Level; Staff Level; Worker Level | 2 | 2.8 |
| Management; Executive; Non-executive/Staff | 2 | 2.8 |
| Senior Management; Middle Management; Executive; Non-Executive | 2 | 2.8 |
| Management; Executive; Non-executive | 2 | 2.8 |
| Board of Directors; Management; Executive; Non-Executive; General workers / Labour | 1 | 1.4 |
| Management; Executive; Non-Executive/Staff; General Workers | 1 | 1.4 |
| Executive Directors; Management; Executives; Non-Executives; Workers; Contractor’s workers | 1 | 1.4 |
| Senior Management; Mid Management; Non-Executive | 1 | 1.4 |
| Senior Management; Management; Executive; Non-Executive | 1 | 1.4 |
| Board of Directors; Senior Management; Middle Management; Junior Management; Executives & Senior Executives; Non-Executives | 1 | 1.4 |
| Executive Directors; Management; Executives; Non-Executives; Workers | 1 | 1.4 |
| Board of Directors; KLK: Senior Management; KLK: Middle Management; KLK: Junior Management; KLK: Executives & Senior Executives; KLK: Non-Executives; Industrial Chemical: Executives & Senior Executives; Industrial Chemical: Non-Executives | 1 | 1.4 |
| Senior Management; Middle Management; Executive; Non-Executive; Worker/Labourer | 1 | 1.4 |
| Senior Management; Management; Executives; Non-Executives | 1 | 1.4 |
Note. Each panel uses 72 company-years and sums to 72. Median category count 4; mean 3.85; range 3 to 8. There are 27 exact category-label patterns. Pattern wording and typography are preserved. Scope groups consolidate source-coded wording; nine exact perimeters remain unresolved. Worker labels are not occupationally standardised. Panel D percentages follow the retained presentation and are rounded.
Table 3.
Two-year disclosure consistency.
| Consistency dimension | Companies | Percentage of 31 |
| Category structure stable | 27 | 87.1% |
| Category structure changed | 4 | 12.9% |
| Category count unchanged | 27 | 87.1% |
| Category count increased | 4 | 12.9% |
| Category count decreased | 0 | 0.0% |
| Same certified reporting perimeter | 28 | 90.3% |
| Segment or disclosure perimeter changed | 2 | 6.5% |
| Reporting-period or related basis differed | 1 | 3.2% |
| Unit remained consistent | 31 | 100.0% |
| Disclosure basis stable | 27 | 87.1% |
| Disclosure basis changed | 4 | 12.9% |
| 2023 observation sourced retrospectively | 21 | 67.7% |
| 2024 observation sourced retrospectively | 1 | 3.2% |
| 2023 comparative figures explicitly restated | 2 | 6.5% |
| 2024 figures explicitly restated | 0 | 0.0% |
Note. Denominator 31 companies, contributing 62 company-years. Rows represent separate consistency and provenance dimensions and must not be summed as one distribution. Retrospective sourcing and explicit restatement are separate characteristics. All percentages use the 31-company denominator. Organisational perimeter and reporting duration are different dimensions. The retained 28 / 2 / 1 source-coded grouping includes one reporting-period difference; unchanged perimeter coding does not establish equal duration or complete indicator-specific scope verification. Explicit-restatement counts refer to markers identified in the reviewed selected disclosure.
Table 4.
Within-company 2023-2024 consistency and change patterns.
| Within-company pattern | Companies | % of 31 | Companies materially affected |
| Stable category structure and disclosure basis | 26 | 83.9% | Remaining 26 RO3 companies |
| Category structure and count changed, disclosure basis stable | 1 | 3.2% | TSH Resources Berhad |
| Category structure stable, reporting or disclosure basis changed | 1 | 3.2% | Harn Len Corporation Berhad |
| Category structure, count and disclosure basis changed, perimeter stable | 1 | 3.2% | PLS Plantations Berhad |
| Category structure, disclosure basis and reporting perimeter changed | 2 | 6.5% | Kuala Lumpur Kepong Berhad; Batu Kawan Berhad |
| Total | 31 | 100.0% |
Note. Mutually exclusive pattern classes sum to 31 companies. Five companies changed category structure or disclosure basis. These changes remain within RO3 and do not remove companies from the balanced subset.
Disclaimer/Publisher’s Note: The statements, opinions and data contained in all publications are solely those of the individual author(s) and contributor(s) and not of MDPI and/or the editor(s). MDPI and/or the editor(s) disclaim responsibility for any injury to people or property resulting from any ideas, methods, instructions or products referred to in the content. |
© 2026 by the authors. Licensee MDPI, Basel, Switzerland. This article is an open access article distributed under the terms and conditions of the Creative Commons Attribution (CC BY) license (http://creativecommons.org/licenses/by/4.0/).
Copyright: This open access article is published under a Creative Commons CC BY 4.0 license, which permit the free download, distribution, and reuse, provided that the author and preprint are cited in any reuse.