

Submitted:
03 November 2026
Posted:
06 November 2026
You are already at the latest version
Abstract
Industrial hemp (Cannabis sativa) is cultivated for fiber and cannabidiol (CBD). The cannabis aphid (Phorodon cannabis) is a common hemp pest that causes feeding damage and may transmit plant pathogens. This study investigated transcriptional responses of P. cannabis to different hemp cultivars, hypothesizing that cultivar-associated differences in chemical composition influence aphid gene expression. Adult aphids were collected from two fiber hemp cultivars (Henola and Bialobrzeskie) and three CBD-rich cultivars (Citrus, BaOx, and Cherry Dwarf). RNA sequencing, gene expression validation, and bioinformatic analyses were conducted to characterize transcriptional differences. Aphids feeding on CBD-rich cultivars exhibited greater downregulation of genes associated with metabolism and environmental information processing than aphids feeding on fiber cultivars. Similar patterns occurred in genes involved in cellular processes, genetic information processing, and organismal systems. Notably, genes associated with xenobiotic metabolism, including UDP-dependent glucuronosyltransferases (UGTs) and carboxylesterases (CESs), were significantly downregulated in aphids feeding on CBD-rich cultivars. These findings reveal cultivar-associated differences in cannabis aphid gene expression, particularly in metabolic and detoxification pathways. Although the observed patterns may reflect differences in hemp chemical composition, further research is needed to distinguish the effects of CBD from other genetic and physiological differences among cultivars.
Keywords:
Cannabis sativa
; cannabis aphids
; transcriptomic data
; gene regulation
; xenobiotics
1. Introduction
Industrial hemp (Cannabis sativa) is cultivated for fiber and cannabidiol (CBD) production but is susceptible to infestation by a variety of insect pests (Ajayi and Samuel-Foo, 2021). Cannabis aphid is a newly recognized pest species of hemp in North America (Cranshaw et al., 2018; Durak et al., 2021). It causes direct feeding damage by extracting phloem sap using piercing-sucking mouthparts and may also contribute to indirect losses by transmitting viruses and other pathogens (Cranshaw et al., 2018; Durak et al., 2021; Miotti et al., 2023). In greenhouse and field settings, this aphid is typically observed in early spring and autumn. In our observations, it is commonly found on fiber hemp cultivars but rarely on cannabidiol (CBD)-rich cultivars. Preliminary studies further indicate consistently high aphid populations on fiber hemp cultivars such as Henola and Bialobrzeskie, whereas significantly lower populations occur on CBD-rich cultivars such as Citrus, BaOx, and Cherry Dwarf.
A key difference between fiber and CBD hemp cultivars is their cannabinoid profile, particularly cannabidiol (CBD) content. CBD concentrations vary substantially among hemp types, with high-CBD cultivars exhibiting considerably higher CBD concentrations than most fiber-type cultivars (Johnson & Wallace, 2021). Based on these observations, we hypothesize that variation in CBD content among hemp cultivars mediates cannabis aphid host preference and performance, with higher CBD levels reducing aphid feeding, survival, and development.
Cannabidiol (CBD), one of the major cannabinoids produced by Cannabis sativa, has received increasing attention for its pharmacological and therapeutic properties in humans (Pagano et al., 2022; Fordjour et al., 2023; Rapin et al., 2021). Beyond its biomedical relevance, CBD has also raised important ecological questions regarding its role in plant–herbivore interactions (MacWilliams et al, 2023; Xu et al, 2021). Understanding the interactions between cannabinoids and herbivorous insects such as the cannabis aphid (Phorodon cannabis) is important for developing sustainable pest management strategies in hemp production (Pulkoski & Burrack, 2023). Cannabinoids, particularly cannabidiol (CBD) and related phytocannabinoids, have emerged as promising plant-derived defense compounds with significant potential for sustainable insect pest management. Recent studies have demonstrated that CBD and cannabidivarinic acid (CBDVA) reduce the performance, survival, and reproduction of the hemp aphid (Phorodon cannabis) by disrupting key physiological and molecular processes (MacWilliams et al., 2023; MacWilliams et al., 2025). MacWilliams et al. (2023) reported that elevated cannabinoid concentrations in Cannabis sativa are associated with reduced aphid population growth, supporting the adaptive role of cannabinoids as defensive metabolites against herbivorous insects. Similar insecticidal effects have been observed in other economically important pests. CBD significantly reduced growth and feeding of the fall armyworm (Spodoptera frugiperda) in a dose-dependent manner by altering detoxification enzyme activity and nutrient metabolism (Abendroth et al., 2023), while CBD also disrupts exoskeleton development in tobacco hornworm (Manduca sexta), further demonstrating its broad-spectrum insecticidal activity (Koch, 2021). Increasing evidence indicates that cannabinoids and other specialized plant metabolites regulate the expression and activity of insect detoxification systems, including cytochrome P450 monooxygenases (CYP450s), glutathione S-transferases (GSTs), carboxylesterases (CarEs), UDP-glycosyltransferases (UGTs), and ATP-binding cassette (ABC) transporters, thereby impairing insects’ capacity to metabolize defensive compounds and adapt to host plants (Chamani et al., 2025; Wang et al., 2025). Comprehensive reviews have further highlighted that plant secondary metabolites interfere with digestive and detoxification pathways, leading to reduced feeding efficiency, slower development, decreased fecundity, and increased mortality (Chamani et al., 2025). Furthermore, variation in terpene and cannabinoid composition among hemp cultivars significantly influences insect host selection, oviposition behavior, and larval fitness, indicating that these metabolites function cooperatively in plant defense (Pandey et al., 2026). Collectively, these findings provide compelling evidence that cannabinoids regulate insect gene expression, particularly detoxification-related pathways, thereby suppressing insect fitness and reducing pest populations, especially hemp aphids (MacWilliams et al., 2023; MacWilliams et al., 2025). However, the molecular mechanisms by which cannabinoids regulate detoxification gene expression in hemp aphids remain largely unknown and warrant further investigation to facilitate the development of cannabinoid-based integrated pest management strategies.
Plant secondary metabolites are important determinants of host plant resistance and can influence herbivorous insects by altering their physiology, metabolism, and gene expression (Chamani et al., 2025; Wang et al., 2025). In insects, detoxification genes, including cytochrome P450 monooxygenases (CYP450s), glutathione S-transferases (GSTs), carboxylesterases (CarEs), UDP-glycosyltransferases (UGTs), and ATP-binding cassette (ABC) transporters, play essential roles in metabolizing and tolerating toxic plant compounds (Chamani et al., 2025). Because CBD-rich and fiber hemp cultivars differ substantially in their cannabidiol (CBD) content (MacWilliams et al., 2023; MacWilliams et al., 2025), we hypothesized that these differences would differentially regulate the expression of detoxification-related genes in the cannabis aphid (Phorodon cannabis), thereby influencing aphid adaptation and population growth. To test this hypothesis, we compared gene expression profiles of aphids feeding on hemp cultivars with contrasting CBD contents and examined whether transcriptional responses were associated with differences in aphid population performance.
The first objective of this study was to determine whether CBD-rich and fiber hemp cultivars differentially affect cannabis aphid population dynamics. Specifically, we evaluated aphid population growth on multiple hemp cultivars representing contrasting chemotypes to determine whether CBD-rich cultivars suppress aphid colonization and reproduction relative to fiber cultivars. Previous studies have demonstrated that elevated concentrations of cannabinoids, including CBD and cannabidivarinic acid (CBDVA), are associated with reduced cannabis aphid performance and population growth, suggesting that cannabinoids function as defensive metabolites against aphid herbivory (MacWilliams et al., 2023; MacWilliams et al., 2025). Similar effects of cannabinoids on insect performance have also been reported in other herbivorous insects (Abendroth et al., 2023; Pandey et al., 2026).
The second objective was to determine whether aphids feeding on CBD-rich and fiber hemp cultivars exhibit distinct transcriptomic responses. Using comparative RNA sequencing, we identified differentially expressed genes between aphids feeding on the two hemp chemotypes, with particular emphasis on detoxification-related genes (CYP450s, GSTs, CarEs, and UGTs), digestive enzymes, transporters, stress-response genes, immune-related genes, and other genes associated with host adaptation. Plant secondary metabolites are known to regulate insect detoxification pathways and metabolic processes, thereby altering insect adaptation to host plants (Chamani et al., 2025; Wang et al., 2025). Furthermore, CBD has been shown to alter detoxification enzyme activity and nutrient metabolism in the fall armyworm (Spodoptera frugiperda), providing evidence that cannabinoids can interfere with insect detoxification mechanisms (Abendroth et al., 2023). We therefore evaluated whether transcriptional changes in these pathways corresponded with differences in aphid population performance observed among hemp cultivars.
To accomplish these objectives, adult cannabis aphids were collected from five hemp cultivars comprising two fiber cultivars (Henola and Bialobrzeskie) and three CBD-rich cultivars (Citrus, BaOx, and Cherry Dwarf). Total RNA was extracted, reverse transcribed into cDNA, and subjected to high-throughput RNA sequencing followed by comprehensive bioinformatic analyses. Differential gene expression analyses were performed to identify genes and biological pathways associated with aphid feeding on contrasting hemp chemotypes. By integrating aphid population dynamics with transcriptomic responses, this study provides new insights into the molecular mechanisms by which hemp cannabinoids influence aphid adaptation and contributes to the development of pest-resistant hemp cultivars and cannabinoid-based integrated pest management strategies (MacWilliams et al., 2023; MacWilliams et al., 2025).
2. Materials and Methods
2.1. Cannabis Aphid Colonies
Cannabis aphids (Phorodon cannabis) were collected from hemp plants grown in the greenhouse at Alabama State University and maintained on Bialobrzeskie hemp plants in a controlled-environment growth tent at 25 ± 1°C under a 14:10 h light:dark photoperiod. Five industrial hemp (Cannabis sativa) cultivars were used in this study, including two fiber cultivars (Henola and Bialobrzeskie) and three CBD-rich cultivars (Citrus, BaOx, and Cherry Dwarf). All plants were grown under the same environmental conditions and were approximately six months old at the time of the experiment. Four biological replicates were established for each cultivar, with each replicate consisting of an independent plant maintained in a separate cage. Adult aphids were transferred to each plant and allowed to feed continuously for 10 days before sample collection. Approximately 1,000 adult aphids were collected from each biological replicate for RNA extraction and subsequent transcriptomic analysis. In total, the experimental design included five cultivars with four biological replicates per cultivar, yielding 20 biological samples for transcriptomic analysis.
2.2. Image of Cannabis Aphid Under Scanning Electron Microscope
Cannabis aphids (Phorodon cannabis) were examined using scanning electron microscopy (SEM) to confirm species identity based on morphological characteristics. Sample preparation followed the protocol described by Gildea et al. (2022). Briefly, aphid specimens were vacuum-dried and sputter-coated with a thin layer of gold using an EMS Quorum sputter coater (EMS 150R ES; Electron Microscopy Sciences, Hatfield, PA, USA). The coated specimens were examined with a JEOL JSM-6010LA analytical scanning electron microscope (JEOL Ltd., Tokyo, Japan) equipped with InTouchScope software (JSM-IT200 InTouchScope™ SEM Series, JEOL Ltd., Tokyo, Japan), and high-resolution images were captured for morphological identification.
2.3. Field Experimental Design and Cannabis Aphid Population Assessment
Field experiments were conducted at the experimental field of Tuskegee University, Alabama, on May 13, 2022. Two fiber hemp (Cannabis sativa) cultivars, Henola and Bialobrzeskie, were direct-seeded in the field and emerged on May 18, 2022. Each fiber hemp planting area was 30 m long and 1 m wide, with approximately 15 m allocated to each cultivar. Plants were allowed to grow under field conditions without fixed within-row spacing, resulting in approximately 120–130 plants of each cultivar per plot. Three replicate plots were established, providing three biological replicates and a total of approximately 360–390 plants for each fiber hemp cultivar.
The CBD-rich hemp cultivars Cherry Dwarf and Citrus were established by transplanting seedlings into the field at approximately the same time. BaOx was not included because planting materials were unavailable for the Alabama field experiment. Each plot contained five plants of Cherry Dwarf and five plants of Citrus, with approximately 1 m spacing between individual plants. Three replicate were established, resulting in 15 plants of each cultivar per plot and a total of 45 plants per cultivar across the three plots. All cultivars were grown under the same field conditions and managed using standard agronomic practices.
Cannabis aphid (Phorodon cannabis) populations were assessed on two sampling dates, July 19 and August 5, 2022. During the first sampling, aphids were collected by beating 117 plants of each fiber hemp cultivar and 15 plants of each CBD-rich cultivar into plastic collection containers. For each fiber hemp cultivar, 117 plants were sampled from the approximately 120–130 available plants in each replicate plot. Similarly, 15 plants of each CBD-rich cultivar were sampled across the three replicate in each plot. The three plots served as three biological replicates for each cultivar. Thus, a total of 351 plants of each fiber hemp cultivar and 45 plants of each CBD-rich cultivar were sampled. Because the fiber hemp plants had increased substantially in size by the second sampling date, the sampling effort was adjusted to 20 plants of each fiber hemp cultivar and five plants of each CBD-rich cultivar per biological replicate. Accordingly, 60 plants of each fiber hemp cultivar and 15 plants of each CBD-rich cultivar were sampled on August 5. All collected aphids were preserved in 70% ethanol until further analysis.
Aphid abundance was determined under a Nikon SMZ800N stereomicroscope (Nikon Instruments Inc., Melville, NY, USA). To account for differences in plant architecture among hemp cultivars, aphid counts were normalized according to plant size. Specifically, counts from the larger fiber hemp plants were adjusted to an equivalent plant-size basis relative to the CBD-rich hemp plants. The normalized aphid abundance data were subsequently used to compare cannabis aphid population densities among the different hemp cultivars.
2.4. RNA Isolation and cDNA Library Preparation
Total RNA was extracted from pools of approximately 1,000 cannabis aphids per sample. The aphids were collected from laboratory-maintained colonies reared on the respective hemp cultivars under controlled growth-tent conditions as above. Aphids used for RNA extraction were not collected from the field survey described in Section 3. RNA extraction was performed using the SV Total RNA Isolation System (Promega, Madison, WI, USA) according to the manufacturer’s protocol. Briefly, aphid samples were homogenized in 175 μL of RNA Lysis Buffer (RLA) supplemented with 1% β-mercaptoethanol (BME) using a motorized tissue grinder with a disposable blue pestle. Following homogenization, 350 μL of RNA Dilution Buffer (RDA) was added, and samples were mixed by gentle inversion and incubated at 70°C for 3 min. The lysates were centrifuged for 10 min, and the clarified supernatants were transferred to fresh tubes. Subsequently, 200 μL of 95% ethanol was added, mixed thoroughly, and the samples were loaded onto Spin Basket columns and centrifuged for 1 min. The RNA bound to the membrane was washed with 600 μL of RNA Wash Solution (RWA). Genomic DNA was removed by on-column DNase digestion using a mixture of 40 μL Yellow Core Buffer, 5 μL MnCl₂ (0.09 M), and 5 μL DNase I, which was applied directly to the membrane and incubated at room temperature for 15 min. After DNase treatment, 200 μL of DNase Stop Solution (DSA) was added, followed by centrifugation. The columns were washed once with 600 μL and once with 250 μL of RNA Wash Solution (RWA), with centrifugation after each wash. RNA was eluted with 100 μL of nuclease-free water by centrifugation at 12,000 rpm for 1 min and stored at −70°C until further analysis. Each treatment consisted of aphids collected from one of five hemp cultivars, with four biological replicates per cultivar, resulting in a total of 20 RNA samples. RNA concentration and purity were determined using a NanoDrop One spectrophotometer (Thermo Fisher Scientific, Waltham, MA, USA), and RNA integrity was evaluated using an Agilent 2100 Bioanalyzer (Agilent Technologies, Santa Clara, CA, USA). All samples used for library construction had RNA Integrity Number (RIN) values of approximately 7.0 or higher and A260/A280 ratios ranging from 2.0 to 2.2. cDNA library preparation and Illumina RNA sequencing were performed by LC Sciences (Houston, TX, USA) following the manufacturer’s standard protocols.
2.5. Library Construction and Sequencing
Poly(A) RNA sequencing libraries were constructed using the Illumina TruSeq Stranded mRNA Library Preparation Kit according to the manufacturer’s instructions at LC Sciences (Houston, TX, USA). RNA integrity was assessed using an Agilent 2100 Bioanalyzer (Agilent Technologies, Santa Clara, CA, USA). Poly(A)+ mRNA was enriched from total RNA using oligo(dT)-attached magnetic beads through two rounds of purification. The purified mRNA was fragmented under elevated temperature in the presence of divalent cations and reverse-transcribed into first-strand cDNA, followed by second-strand cDNA synthesis, end repair, A-tailing, adapter ligation, and PCR amplification to generate the final sequencing libraries according to the Illumina TruSeq Stranded mRNA protocol. Library quality and concentration were evaluated using the Agilent 2100 Bioanalyzer with a High Sensitivity DNA Kit. The qualified libraries were subjected to paired-end sequencing on the Illumina NovaSeq 6000 platform at LC Sciences (Houston, TX, USA).
2.6. Sequence Processing, De Novo Transcriptome Assembly, and Functional Annotation
Raw sequencing reads were processed to remove adapter sequences, low-quality reads, and reads containing ambiguous nucleotides using Cutadapt (Martin et al., 2011) in combination with in-house Perl scripts. The quality of the clean reads was evaluated using FastQC, including assessments of Q20, Q30, and GC content. Only high-quality clean reads were used for subsequent analyses. De novo transcriptome assembly was performed using Trinity v2.4.0 (Grabherr et al., 2011). Trinity grouped transcripts with shared sequence content into clusters, each representing a putative gene. The longest transcript within each cluster was selected as the representative unigene for downstream analyses.
Functional annotation of the assembled transcripts was conducted by searching against the NCBI non-redundant (Nr) protein database (http://www.ncbi.nlm.nih.gov/), Gene Ontology (GO) (http://www.geneontology.org) (Conesa et al., 2005), Swiss-Prot (http://www.expasy.ch/sprot/) (Bairoch and Apweiler, 1998), Kyoto Encyclopedia of Genes and Genomes (KEGG) (http://www.kegg.jp/kegg/) (Kanehisa and Goto, 2000), and eggNOG databases (http://eggnogdb.embl.de/) using DIAMOND (Buchfink et al., 2015) with an E-value threshold of 1 × 10⁻⁵. Gene Ontology terms were assigned to classify transcript functions, while KEGG pathway analysis was performed to identify genes involved in biological and metabolic pathways. Putative detoxification-related genes, including cytochrome P450 monooxygenases (P450s), glutathione S-transferases (GSTs), carboxylesterases (CESs), and UDP-glycosyltransferases (UGTs), were identified based on BLASTx searches against the Nr database using an E-value cutoff of 1 × 10⁻⁵.
2.7. Differential Gene Expression Analysis
To investigate the transcriptomic responses of P. cannabis to different hemp chemotypes, aphids feeding on fiber and CBD-rich hemp cultivars were collected after approximately two weeks of continuous feeding. RNA-seq data were analyzed to identify differentially expressed genes associated with aphid responses to the contrasting phytochemical profiles of fiber and CBD-rich hemp cultivars, with particular emphasis on genes involved in detoxification and host adaptation.
Transcript abundance was quantified using Salmon (Patro et al., 2017) and normalized as transcripts per million (TPM) (Mortazavi et al., 2008). Differential gene expression analysis was performed using the edgeR package in R (Robinson et al., 2010). Genes with an absolute log2 fold change greater than 1 (|log2FC| > 1) and a P value < 0.05 were considered significantly differentially expressed. Genes with log2FC > 1 were considered upregulated, whereas those with log2FC < −1 were considered downregulated.
2.8. Gene Expression Analysis in Aphids Feeding on CBD and Fiber Hemp Cultivars
Differential expression of detoxification-related genes and other differentially expressed genes was compared between cannabis aphids feeding on CBD-rich hemp cultivars and those feeding on fiber hemp cultivars. Principal component analysis (PCA) was performed using normalized gene expression data in R to evaluate global transcriptomic differences between the two groups. PCA plots were generated using the ggplot2 package (Wickham, 2016).
Heatmaps were constructed based on log2 (FC) values to visualize differential gene expression in aphids feeding on CBD-rich hemp cultivars relative to those feeding on fiber hemp cultivars. Heatmap visualization was performed in R (version 3.6.2) using the ggplot2 package.
2.9. RT-qPCR for Validation of Gene Expression in Aphids
To validate the RNA-seq results, quantitative real-time PCR (RT-qPCR) was performed on 14 selected transcripts, including nine significantly differentially expressed genes involved in KEGG pathways and five detoxification-related genes. The selected transcripts represented genes associated with cellular processes, genetic information processing, metabolism, organismal systems, and detoxification pathways, including cytochrome P450 monooxygenases (P450s), glutathione S-transferases (GSTs), carboxylesterases/esterases (CESs), and UDP-glucuronosyltransferases (UDPs).
Total RNA was extracted using the SV Total RNA Isolation System (Promega, Madison, WI, USA) according to the manufacturer’s protocol as described above. Residual genomic DNA was removed by on-column DNase digestion according to the manufacturer’s instructions, followed by the recommended wash steps to eliminate DNase. For each sample, 1 μg of total RNA was reverse transcribed using SuperScript III Reverse Transcriptase (Thermo Fisher Scientific, Columbus, OH, USA). Briefly, 1 μL of 50 μM oligo(dT)20 primer, 1 μL of 10 mM deoxynucleotide triphosphates (dNTPs), and 1 μg of total RNA were combined with nuclease-free water to a final volume of 13 μL. The mixture was incubated at 65°C for 5 min and immediately chilled on ice for 1 min. Subsequently, 4 μL of 5× First-Strand Buffer, 1 μL of 0.1 M dithiothreitol (DTT), 1 μL of RNaseOUT Recombinant Ribonuclease Inhibitor, and 1 μL of SuperScript III Reverse Transcriptase (200 U/μL) were added. Reverse transcription was carried out at 50°C for 50 min, followed by enzyme inactivation at 70°C for 15 min.
Quantitative PCR reactions were performed using 100 ng of cDNA template, 1 μL each of forward and reverse primers (10 μM), and 10 μL of SsoAdvanced Universal SYBR Green Supermix (Bio-Rad, Hercules, CA, USA) in a CFX Opus 96 Real-Time PCR System (Bio-Rad, Hercules, CA, USA). The amplification program consisted of an initial denaturation at 95°C for 3 min, followed by 39 cycles of 95°C for 10 s and 60°C for 30 s. A melting curve analysis was then performed by increasing the temperature from 65°C to 95°C in 0.5°C increments every 5 s to verify amplification specificity.
Each treatment consisted of four biological replicates, with each biological replicate analyzed in three technical replicates. Relative transcript abundance was calculated using Bio-Rad CFX Maestro Software version 2.3 (Bio-Rad, Hercules, CA, USA). Gene expression levels were determined using the ∆∆Ct method (Livak and Schmittgen, 2001), with consideration of primer amplification efficiency as described by Pfaffl (2001). Primer efficiencies were determined from the slopes of standard curves generated using serial cDNA dilutions (Table 1), where amplification efficiency (E) was calculated as where efficiency was measured from the slope of the dilution series Ct values such that efficiency E value is equal to 10-1/slope and percent efficiency is equal to (E - 1) × 100%; thus, an E value of 2.00 is 100% efficiency or doubling each cycle (https://www.bio-rad.com/webroot/web/pdf/lsr/literature/Bulletin_5279.pdf). Dissociation (melting) curves were examined for each amplicon to confirm amplification specificity.
Transcript expression levels were normalized using two reference genes, 60S ribosomal protein L4 (RpL4) and 40S ribosomal protein S24 isoform X2 (RpS24) (Table 1). Relative gene expression was compared between aphids feeding on fiber hemp and CBD-rich hemp cultivars. To assess the agreement between RT-qPCR and RNA-seq results, the correlation between log₂ fold changes obtained by the two methods was evaluated using Spearman’s rank-order correlation in GraphPad Prism (GraphPad Software, San Diego, CA, USA).
2.10. Data Availability
The transcriptome data analyzed in this study have been deposited in the NCBI Sequence Read Archive (SRA) under accession numbers SRR41206863–SRR41206881. The The corresponding BioProject accession number is PRJNA1542134, the Transcriptome Shotgun Assembly (TSA) submission number is SUB16548364, and the BioSample submission number is SUB16549803. The SRA submission can be accessed at: https://submit.ncbi.nlm.nih.gov/subs/sra/SUB16548418/overview.
3. Results
3.1. CBD-Rich Hemp Cultivars Reduce Phorodon Cannabis Populations
The cannabis aphid, Phorodon cannabis, is a phloem-feeding insect measuring approximately 1.5–2.5 mm in length. Adult aphids exhibit seasonal color variation, ranging from pale yellow or cream early in the growing season to light green, golden brown, or pale pink later in the season. Species identification was confirmed using scanning electron microscopy (SEM), which revealed the characteristic bulb-tipped setae on the head, thorax, and the basal segments of the antennae (Figure 1). These diagnostic structures are indicated by circles in the SEM images.
Greenhouse observations consistently showed that P. cannabis readily colonized the fiber hemp cultivars Henola and Białobrzeskie, whereas infestations were rare on the CBD-rich cultivars Citrus and Cherry Dwarf, especially in autumn. Similar trends were observed under field conditions. Field surveys demonstrated that aphid populations were significantly greater on the fiber hemp cultivars than on the CBD-rich cultivars (Table 2). Two-way ANOVA revealed significant effects of sampling date (F₁,₁₆ = 465.10, P < 0.001), hemp cultivar (F₃,₁₆ = 387.62, P < 0.001), and the sampling date × cultivar interaction (F₃,₁₆ = 158.95, P < 0.001) on cannabis aphid populations. Throughout the sampling period, CBD-rich cultivars maintained substantially lower aphid densities than the fiber cultivars.
The contrasting aphid populations corresponded with differences in cannabidiol (CBD) content among the cultivars. Fiber hemp cultivars, which contain relatively low concentrations of CBD (1-5%), supported large aphid populations, whereas CBD-rich cultivars with high cannabinoid content (8-12%) harbored few aphids. These findings suggest a negative association between CBD concentration and P. cannabis abundance, indicating that elevated CBD levels may contribute to natural resistance against cannabis aphids.
3.2. Overview of the Aphid Transcriptome
To investigate the transcriptomic responses of the cannabis aphid (P. cannabis) to different hemp cultivars, aphids were reared for 10 days on two fiber hemp cultivars (Henola and Bialobrzeskie) and three CBD-rich cultivars (Citrus, BaOx, and Cherry Dwarf) as described above. Following the feeding period, approximately 1,000 adult aphids were collected from each treatment, with four biological replicates per cultivar. Total RNA was extracted and subjected to RNA sequencing (RNA-seq). RNA-seq generated a total of 801,799,802 paired-end raw reads, each approximately 100 bp in length. De novo transcriptome assembly produced 44,986 transcripts ranging from 201 to 20,151 bp, with a median transcript length of 513 bp. The assembly had an N50 of 1,883 bp, indicating good transcript continuity (Supplementary Table S1). The GC content ranged from 6.91% to 80.28%, with a median of 36.26%. Most assembled transcripts (56.84%) were between 200 and 800 bp in length, while 24.89% ranged from 800 to 2,000 bp and 15.44% exceeded 2,000 bp. After removing transcripts derived from host plants, mites, and other contaminants, a final dataset of 34,043 aphid-specific transcripts was retained for downstream analyses.
Principal component analysis (PCA) was performed to evaluate the overall variation in gene expression among aphids feeding on different hemp cultivars (Figure 2). The first two principal components explained 26.8% (PC1) and 9.1% (PC2) of the total transcriptomic variation, respectively. PC1 represented the primary source of variation and clearly separated aphids feeding on CBD-rich cultivars from those feeding on fiber cultivars, indicating substantial differences in their transcriptomic profiles. Aphid samples from CBD-rich cultivars clustered on the left side of the PC1 axis, whereas samples from the fiber cultivars were distributed toward the center and right side of the axis, demonstrating distinct gene expression patterns between the two hemp types.
Biological replicates clustered closely within each treatment group, indicating high reproducibility and low within-group variation. The clear separation between CBD-rich and fiber cultivars, together with the tight clustering of biological replicates, demonstrates the robustness of the RNA-seq dataset and suggests that host cultivar type is a major factor influencing gene expression in P. cannabis. These results provide a strong foundation for subsequent analyses aimed at identifying differentially expressed genes and the biological pathways associated with aphid adaptation to different hemp cultivars.
3.3. Gene Categories and KEGG Pathways Identified in Phorodon Cannabis
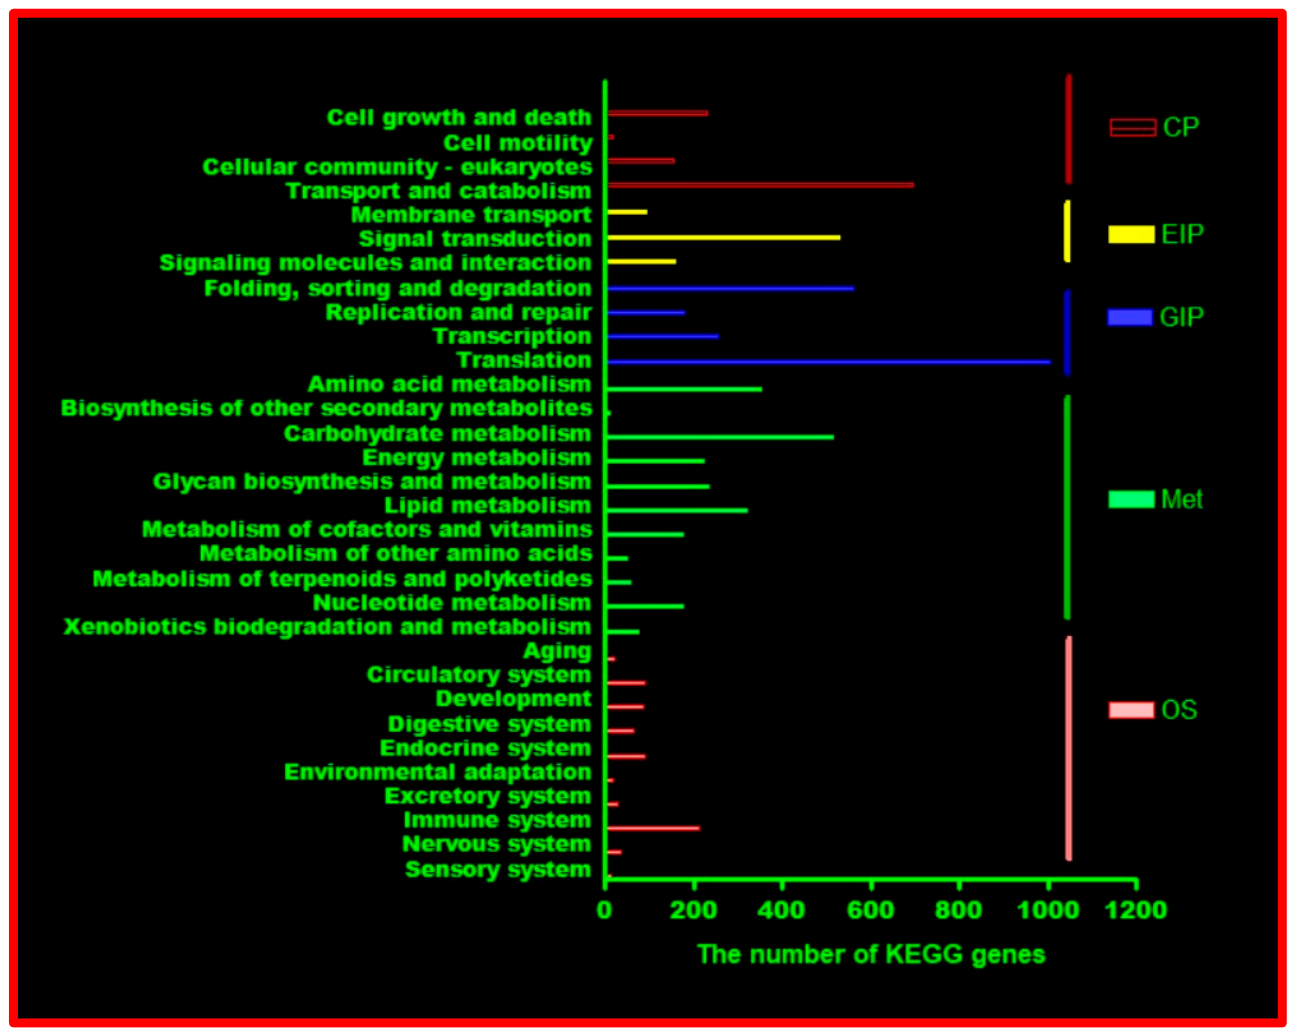
Kyoto Encyclopedia of Genes and Genomes (KEGG) pathway analysis revealed that metabolism was the largest functional category represented in the Phorodon cannabis transcriptome (Figure 3). A total of 2,195 transcripts (16.1% of all annotated genes) were assigned to metabolic pathways. These genes are involved in a wide range of biochemical processes, including energy production, biosynthesis, and the degradation of biological molecules. Among the metabolic pathways, carbohydrate metabolism was the most abundant subcategory, comprising 514 transcripts. In addition, a substantial number of transcripts were associated with xenobiotic biodegradation and metabolism, highlighting the potential importance of detoxification processes in P. cannabis. The second-largest category was genetic information processing, which included 2,001 transcripts (14.7%). These transcripts are responsible for the storage, replication, expression, and maintenance of genetic information, including DNA replication, transcription, translation, and repair. Translation was the largest subcategory within this group, with 1,004 transcripts. Cellular processes represented the third-largest category, with 1,098 transcripts(8.1%). These transcripts participate in essential cellular functions such as cell cycle regulation, cell signaling, cellular communication, intracellular transport, and catabolism. Among these, transport and catabolism were the most highly represented subcategory, containing 694 transcripts. Environmental information processing and human diseases were also well represented, accounting for 780 transcripts (5.7%) and 790 transcripts (5.8%), respectively. Transcripts associated with environmental information processing are involved in membrane transport, signal transduction, and signaling molecule interactions, enabling aphids to perceive and respond to environmental stimuli. Although designated as "human diseases" in the KEGG database, transcripts in this category represent conserved molecular pathways shared across diverse organisms. They are not indicative of human disease functions in P. cannabis. The organismal systems category was the smallest major KEGG classification, comprising 669 transcripts (4.9%). These transcripts are associated with physiological systems, including the immune, endocrine, digestive, and nervous systems. Among these, immune system-related pathways were the most abundant, with 214 transcripts, suggesting an important role for immune function in the biology of P. cannabis. Notably, 6,090 transcripts (44.7%) could not be assigned to any KEGG pathway. This relatively large proportion likely reflects transcripts with unknown or poorly characterized functions, lineage-specific transcripts, or transcripts that are not currently represented in the KEGG database.
Figure 4.
Functional classification of P. cannabis genes based on KEGG pathway analysis.
3.4. Gene Regulation in Cannabis Aphids (Phorodon cannabis) Feeding on CBD-Rich Versus Fiber Hemp Cultivars
The differential gene expression observed in cannabis aphids (Phorodon cannabis) feeding on CBD-rich and fiber hemp cultivars likely reflects the distinct chemical compositions of these plants and the corresponding biological responses elicited in the aphids. The three CBD-rich hemp cultivars—Citrus (Cs), BaOx (Ba), and Cherry Dwarf (Cd)—contain higher concentrations of cannabinoids, particularly cannabidiol (CBD) (Table 2). These compounds may impose physiological stress on aphids, inducing detoxification, defense, and stress-response mechanisms. In contrast, the fiber hemp cultivars Henola (He) and Bialobrzeskie (Bz) generally contain lower cannabinoid concentrations and exhibit different secondary metabolite profiles (Table 2). Consequently, aphids feeding on fiber hemp are likely exposed to reduced or qualitatively different chemical stress, resulting in distinct transcriptional responses.
Across the total aphid transcriptome, a greater number of transcripts were significantly upregulated in aphids feeding on CBD-rich hemp cultivars than in those feeding on fiber hemp cultivars, particularly in the Ba–Bz, Cd–Bz, Ba–He, and Cs–He comparisons (Figure 5A). In contrast, among transcripts assigned to Kyoto Encyclopedia of Genes and Genomes (KEGG) pathways, significantly more transcripts were downregulated in aphids feeding on CBD-rich cultivars than in those feeding on fiber cultivars, with the except of the Cd–He comparison (Figure 5B).
Many of the upregulated transcripts identified in the total transcriptome are not currently assigned to well-characterized metabolic or signaling pathways in the KEGG database. These transcripts may include stress-responsive transcripts, non-coding RNAs, or transcripts with unknown biological functions. Feeding on CBD-rich cultivars may induce a broad transcriptional response in aphids, although the functional significance of many of these genes remains unknown (Figure 5A).
In contrast, KEGG pathway genes represent well-defined biological processes, including metabolism, signal transduction, genetic information processing, and cellular regulation. The predominance of downregulated KEGG pathway genes suggests that feeding on CBD-rich hemp suppresses multiple physiological pathways. Because KEGG pathway genes are generally well annotated and tightly regulated, their coordinated downregulation may reflect a systematic metabolic adjustment to the chemical environment of CBD-rich cultivars (Figure 5B).
Further analysis of KEGG functional categories showed that genes involved in metabolism and environmental information processing were more frequently downregulated in aphids feeding on CBD-rich hemp than in those feeding on fiber hemp cultivars (Figure 6). Similar trends were observed for genes associated with cellular processes (except Cd–He), genetic information processing (except Cs–Bz and Cd–He), human disease-related pathways (except Ba–He and Cd–He), and organismal systems (except Ba–He and Cs–He) (Figure 6).
Within the metabolism category, genes involved in amino acid metabolism and carbohydrate metabolism exhibited substantially more downregulation than upregulation in aphids feeding on CBD-rich cultivars (Figure 7). Similar expression patterns were observed for genes associated with glycan biosynthesis and metabolism, lipid metabolism, metabolism of cofactors and vitamins, and xenobiotic biodegradation and metabolism, with the exception of the Cd–He comparison. In contrast, genes involved in energy metabolism and nucleotide metabolism displayed mixed expression patterns, with both significantly upregulated and downregulated genes identified in aphids feeding on CBD-rich hemp cultivars. Notably, genes associated with the metabolism of terpenoids and polyketides exhibited relatively few significant changes in expression between aphids feeding on CBD-rich and fiber hemp cultivars, suggesting that these pathways are minimally affected by differences in hemp chemotype (Figure 7).
3.5. Regulation of Detoxification Genes in Cannabis Aphids (Phorodon cannabis) Feeding on CBD-Rich and Fiber Hemp Cultivars
In insects, the detoxification of xenobiotics generally proceeds through three sequential phases: oxidation (Phase I), conjugation (Phase II), and excretion (Phase III). During Phase I, cytochrome P450 monooxygenases (P450s) oxidize a broad range of xenobiotics, including synthetic insecticides such as organochlorines, neonicotinoids, and pyrethroids, as well as naturally occurring plant secondary metabolites. In Phase II, glutathione S-transferases (GSTs) and uridine diphosphate glucuronosyltransferases (UDPs/UGTs) conjugate these oxidized compounds with glutathione or glucuronic acid, thereby increasing their water solubility. Carboxylesterases/esterases (CESs) also contribute to detoxification by hydrolyzing ester-containing xenobiotics and plant-derived compounds. Finally, the resulting metabolites are transported and excreted from the insect, completing the detoxification process.
To investigate the detoxification response of cannabis aphids (Phorodon cannabis) to different hemp chemotypes, we analyzed the expression of detoxification-related genes in aphids feeding on CBD-rich and fiber hemp cultivars (Table 3; Supplementary Table S2). Among the 153 identified P450 genes, 17 (11.1%) were significantly differentially expressed in aphids feeding on CBD-rich hemp cultivars. Similarly, 8 of 34 GST genes (23.5%), 15 of 47 UDP genes (31.9%), and 31 of 132 CES genes (23.5%) were significantly regulated (Table 3). Among the four detoxification gene families, UDPs exhibited the highest proportion of differentially expressed genes, followed by GSTs and CESs, indicating that these gene families are particularly responsive to CBD-rich hemp. These findings suggest that UDPs and CESs may play important roles in the detoxification of cannabidiol (CBD) and other hemp secondary metabolites.
Heatmap analysis further revealed substantial variation in detoxification gene expression among aphids feeding on different hemp cultivars (Figure 8). The expression patterns of P450 and GST genes, which are primarily involved in the detoxification of insecticides and other xenobiotics, varied among hemp cultivars, suggesting that their regulation is influenced by differences in plant chemistry (Figure 8A and 8B). In contrast, most UDP and CES genes were significantly downregulated in aphids feeding on CBD-rich hemp cultivars compared with those feeding on fiber hemp cultivars (Figure 8C and 8D). This contrasting expression pattern indicates that CBD-rich hemp substantially alters the regulation of detoxification pathways in cannabis aphids. Overall, these results highlight the complex interactions between hemp secondary metabolites and insect detoxification mechanisms, providing new insights into the molecular basis of aphid adaptation to different hemp chemotypes and supporting the potential development of CBD-based strategies for sustainable management of cannabis aphids.
3.6. RT qPCR Validation of RNA-seq
To validate the RNA-Seq results, we performed RT-qPCR analysis on 14 selected transcripts and evaluated the correlation between gene expression levels obtained by the two methods. The selected transcripts included nine significantly differentially expressed genes involved in KEGG pathways and five detoxification-related genes that were either up- or down-regulated. Among these, the highest up-regulated transcript was the predicted mucin-6-like (Vwf) gene, which is associated with the immune system and exhibited a Log₂ fold change (Log₂FC) of 7.420 ± 0.587 in the Ba vs. Bz comparison. The most strongly down-regulated transcript was pectinesterase 31-like, which is involved in carbohydrate metabolism and showed a Log₂FC of −6.972 ± 0.360.
Transcripts were selected for RT-qPCR validation based on two criteria. First, transcripts were required to have sufficient expression for reliable amplification (read count >1) and primer efficiencies close to 2.0 (amplification efficiency was calculated as E = 10^(−1/slope) from the slope of the standard curve generated using serial cDNA dilutions; Table 1). Second, the selected transcripts were annotated with putative biological functions relevant to the response of Phorodon cannabis to different industrial hemp cultivars, including genes involved in cellular processes, genetic information processing, metabolism, and organismal systems. Particular emphasis was placed on detoxification-related genes, including cytochrome P450 monooxygenases (P450s), glutathione S-transferases (GSTs), carboxylesterases (CESs), and UDP-glucuronosyltransferases (UDPs), because these enzymes are likely involved in the detoxification or metabolism of cannabidiol (CBD) and other hemp secondary metabolites that may contribute to reduced cannabis aphid populations on CBD-rich cultivars.
The RT-qPCR results were highly consistent with the RNA-Seq data. For most of the validated genes, the direction and magnitude of differential expression between aphids feeding on fiber hemp and CBD-rich hemp cultivars closely matched those obtained from Illumina RNA-Seq analysis (Figure 9). Furthermore, Spearman’s rank correlation analysis revealed a strong positive correlation between Log₂ fold changes measured by RT-qPCR and RNA-Seq (Spearman’s r = 0.78, P < 0.0001). These results demonstrate that the RNA-Seq data accurately reflect transcriptional changes in cannabis aphids in response to the distinct chemical compositions of fiber and CBD-rich hemp cultivars, thereby confirming the reliability of the transcriptome analysis.
4. Discussion
4.1. Chemical Composition of Hemp
Industrial hemp (Cannabis sativa L.) is a chemically complex crop cultivated for fiber, grain, and cannabinoid production. More than 177 cannabinoids, over 100 terpenes, and numerous flavonoids and polyphenols have been identified in hemp, making it one of the most chemically diverse agricultural crops (Hanuš et al., 2016, 2020; Berman et al., 2018; Citti et al., 2019; Basas-Jaumandreu et al., 2020). Among these compounds, cannabinoids are considered the most biologically important because of their diverse pharmacological and ecological activities.
Cannabidiol (CBD), first isolated in 1940 (Jacob and Todd, 1940; Adams et al., 1940; Ghosh et al., 1940), is the predominant cannabinoid in CBD-rich hemp cultivars and possesses anti-inflammatory, antioxidant, analgesic, and anxiolytic properties. Other major cannabinoids include Δ⁹-tetrahydrocannabinol (THC), cannabigerol (CBG), cannabichromene (CBC), and cannabinol (CBN), each exhibiting distinct biological activities.
Terpenes constitute another important group of secondary metabolites that contribute to hemp aroma and flavor while also influencing insect-plant interactions. Major terpenes, including β-caryophyllene, β-myrcene, limonene, α-pinene, linalool, and humulene, have demonstrated antimicrobial, anti-inflammatory, insecticidal, or repellent activities. Together with flavonoids and polyphenols, these compounds may act synergistically through the "entourage effect," enhancing the biological activity of cannabinoids. Therefore, the complex phytochemical composition of hemp likely contributes to its defense against herbivorous insects.
4.2. Differences Between Fiber and CBD-Rich Hemp Cultivars
The principal distinction between fiber and CBD-rich hemp cultivars is their chemical composition, particularly cannabinoid concentration (Hartsel et al., 2016; Pavlovic et al., 2019; Tsaliki et al., 2021). Fiber hemp cultivars are bred primarily for stem fiber production and generally contain very low concentrations of cannabinoids, including CBD and THC (<0.3% THC). In contrast, CBD-rich cultivars are selectively bred to accumulate high concentrations of CBD, often ranging from 5% to over 20%, while maintaining THC concentrations below the legal threshold.
Besides cannabinoid content, CBD-rich cultivars generally possess more abundant and diverse terpene profiles than fiber cultivars. Because terpenes and cannabinoids interact biologically, CBD-rich cultivars present insects with a more chemically complex environment than fiber cultivars.
Our transcriptome analysis demonstrated that aphids feeding on CBD-rich cultivars (BaOx, Citrus, and Cherry Dwarf) exhibited substantially greater transcriptional changes than aphids feeding on fiber cultivars (Bialobrzeskie and Henola). Most notably, genes involved in metabolism and numerous KEGG pathways were predominantly down-regulated in aphids feeding on CBD-rich cultivars. These results suggest that the elevated concentrations of CBD and associated secondary metabolites impose physiological stress that suppresses multiple metabolic pathways.
Although several detoxification and stress-response genes were up-regulated, the overall down-regulation of metabolism-related pathways indicates that aphids likely reallocate metabolic resources toward stress adaptation at the expense of normal physiological functions. Such metabolic trade-offs may ultimately reduce growth, reproduction, and survival, thereby contributing to the lower aphid populations consistently observed on CBD-rich hemp cultivars.
4.3. CBD Regulates Detoxification-Related Gene Expression
Accumulating evidence indicates that CBD modulates the expression and activity of detoxification enzymes in both vertebrates and invertebrates. In mammals, CBD is metabolized primarily by cytochrome P450 enzymes, including CYP2C9, CYP2C19, CYP3A4, and CYP2D6, while also interacting with UDP-glucuronosyltransferases and carboxylesterases (Yamaori et al., 2010, 2011a,b,c, 2012; Jiang et al., 2013; Laizure et al., 2013; Qian et al., 2019; Smith et al., 2023). Depending on enzyme type and concentration, CBD may either inhibit or induce detoxification pathways.
Consistent with these observations, our transcriptome analysis showed that CBD-rich hemp altered the expression of multiple detoxification genes in P. cannabis. P450 and GST genes exhibited mixed responses, with both up- and down-regulation observed among cultivars. In contrast, UDP and CES genes were consistently suppressed in aphids feeding on CBD-rich hemp cultivars.
Because UDPs and CESs participate in the detoxification of cannabinoids, plant secondary metabolites, insect growth regulators, and microbial insecticides, reduced expression of these genes likely diminishes the aphids’ ability to metabolize CBD and other toxic compounds. Consequently, cannabinoids may accumulate within aphid tissues, increasing physiological stress and impairing normal metabolic functions.
CBD-rich hemp also significantly down-regulated genes involved in lipid metabolism. Similar effects have been reported in mammals, where CBD suppresses fatty acid synthesis, lipid transport, and lipid accumulation (Bielawiec et al., 2023). The observed inhibition of lipid metabolism in cannabis aphids further supports the hypothesis that CBD broadly disrupts energy metabolism in addition to detoxification processes.
Although our findings strongly suggest that CBD influences detoxification pathways, the precise molecular mechanisms underlying these effects remain unclear. More than 177 cannabinoids, over 100 terpenes, and numerous flavonoids and polyphenols have been identified in hemp, making it difficult to determine which specific chemical components are responsible for the observed changes in detoxification gene expression. Future studies using purified CBD at multiple concentrations, combined with controlled bioassays, will be necessary to determine whether CBD directly regulates detoxification genes or indirectly affects their expression through other signaling pathways.
4.4. CBD Shows Potential as a Botanical Insecticide for Aphid Control
Previous studies have demonstrated that cannabinoids, terpenes, and other constituents possess insecticidal, miticidal, and repellent activities against a wide range of arthropod pests (McPartland, 1997; McPartland and Sheikh, 2018; Park et al., 2019; Ona et al., 2022). Historically, cannabis-derived preparations have been used to repel mosquitoes, lice, fleas, ticks, mites, and numerous agricultural pests.
Consistent with these reports, we observed substantially lower cannabis aphid populations on CBD-rich hemp cultivars than on fiber cultivars. Our transcriptomic analysis provides a potential molecular explanation for this phenomenon. Aphids feeding on CBD-rich cultivars exhibited significant down-regulation of UDP and CES genes, two enzyme families essential for detoxifying cannabinoids and other plant-derived xenobiotics. Reduced expression of these enzymes is expected to impair detoxification efficiency, resulting in increased susceptibility to CBD and other toxic secondary metabolites.
While our data demonstrate a strong association between CBD-rich hemp, suppression of detoxification genes, and reduced aphid populations, additional functional studies are needed to establish a causal relationship. RNA interference (RNAi) and enzyme activity assays would help determine whether inhibition of UDP and CES directly contributes to aphid mortality.
Overall, our results suggest that CBD-rich hemp creates a chemically challenging environment that suppresses detoxification pathways in P. cannabis. This reduced detoxification capacity may contribute to the naturally lower aphid populations observed on CBD-rich cultivars and supports the potential development of CBD-based botanical insecticides as environmentally sustainable alternatives for integrated pest management in hemp production.
Supplementary Materials
The following supporting information can be downloaded at the website of this paper posted on Preprints.org.
Author Contributions
Conceptualization, J.X., T.L., and O.S.A.; methodology, J.X.; software, J.X.; validation, J.X., T.L., J.A.A., and O.S.A.; formal analysis, J.X.; investigation, J.X., T.L., N.A., I.V.T., I.I., J.A.A., and O.S.A.; resources, J.X., T.L., and O.S.A.; data curation, J.X., and O.S.A.; writing—original draft preparation, J.X.; writing—review and editing, J.X., T.L., I.V.T., J.A.A., and O.S.A.; visualization, J.X.; supervision, O.S.A.; project administration, J.X., and O.S.A.; funding acquisition, J.X., and O.S.A. All authors have read and agreed to the published version of the manuscript.
Funding
This work was supported by the U.S. Department of Education through the Title III, Part B, Historically Black Colleges and Universities (HBCU) Program and by the Innovate Alabama Project for the Hemp Program.
Institutional Review Board Statement
Not applicable.
Informed Consent Statement
Not applicable.
Data Availability Statement
The transcriptomic data have been deposited in the NCBI Sequence Read Archive (SRA), and all supplementary tables are available in the published article. Further inquiries regarding the data may be directed to the corresponding authors.
Acknowledgments
We thank L.C. Sciences, LLC (Texas, USA) for providing sequencing services. We also acknowledge the use of ChatGPT (OpenAI, GPT-5.2) for language editing and grammatical checking of the manuscript, and R for generating the plots.
Conflicts of Interest
The authors declare no conflicts of interest.
References
- Abendroth, J.A.; Gondhalekar, A.D.; Scharf, M.E.; Couture, J.J. Cannabidiol reduces fall armyworm (Spodoptera frugiperda) growth by reducing consumption and altering detoxification and nutritional enzyme activity in a dose-dependent manner. Arthropod-Plant Interact. 2023, 17, 195–204. [Google Scholar] [CrossRef]
- Adams, R.; Baker, B.R.; Wearn, R.B. Structure of cannabinol. III. Synthesis of cannabinol, 1-Hydroxy-3-n-amyl-6,6,9-trimethyl-6-dibenzopyran. J. Amer. Chem. Soc. 1940, 62, 2204–2207. [Google Scholar] [CrossRef]
- Ajayi, O.S.; Samuel-Foo, M. Hemp pest spectrum and potential relationship between Helicoverpa zea infestation and hemp production in the United States in the face of climate change. Insects 2021, 12, 940. [Google Scholar] [CrossRef] [PubMed]
- Bairoch, A.; Apweiler, R. The SWISS-PROT protein sequence data bank and its supplement TrEMBL. Nucleic Acids Res. 1998, 26, 38–42. [Google Scholar] [CrossRef] [PubMed]
- Basas-Jaumandreu, J.; de las Heras, F.X.C. GCMS metabolite profile and identification of unusual homologous cannabinoids in high potency Cannabis sativa. Planta Med. 2020, 86, 338–347. [Google Scholar] [CrossRef] [PubMed]
- Berman, P.; Futoran, K.; Lewitus, G.M.; Mukha, D.; Benami, M.; Shlomi, T.; Meiri, D.A. new ESI-LC/MS approach for comprehensive metabolic profiling of phytocannabinoids in Cannabis. Sci. Rep. 2018, 8, 14280. [Google Scholar] [CrossRef] [PubMed]
- Bielawiec, P.; Dziemitko, S.; Konstantynowicz-Nowicka, K.; Chabowski, A.; Dzięcioł, J.; Harasim-Symbor, E. Cannabidiol improves muscular lipid profile by affecting the expression of fatty acid transporters and inhibiting de Novo lipogenesis. Sci. Rep. 2023, 13, 3694. [Google Scholar] [CrossRef] [PubMed]
- Buchfink, B.; Xie, C.; Huson, D.H. Fast and sensitive protein alignment using DIAMOND. Nat. Methods 2015, 12, 59–60. [Google Scholar] [CrossRef] [PubMed]
- Chamani, M.; Dadpour, M.; Dehghanian, Z.; Panahirad, S.; Chenari Bouket, A.; Oszako, T.; Kumar, S. From digestion to detoxification: exploring plant metabolite impacts on insect enzyme systems for enhanced pest control. Insects 2025, 16, 392. [Google Scholar] [CrossRef] [PubMed]
- Citti, C.; Linciano, P.; Russo, F.; Luongo, L.; Iannotta, M.; Maione, S.; Laganà, A.; Capriotti, A. L.; Forni, F.; Vandelli, M. A.; Gigli, G.; Cannazza, G. A novel phytocannabinoid isolated from Cannabis sativa L. with an in vivo cannabimimetic activity higher than Δ⁹-tetrahydrocannabinol: Δ⁹-Tetrahydrocannabiphorol. Sci. Rep. 2019, 9, 20335. [Google Scholar] [CrossRef] [PubMed]
- Conesa, A.; Götz, S.; García-Gómez, J.M.; Terol, J.; Talón, M.; Robles, M. Blast2GO: A universal tool for annotation, visualization and analysis in functional genomics research. Bioinformatics 2005, 21, 3674–3676. [Google Scholar] [CrossRef] [PubMed]
- Cranshaw, W.S.; Halbert, S.E.; Favret, C.; Britt, K.E.; Miller, G.L. Phorodon cannabis Passerini (Hemiptera: Aphididae), a newly recognized pest in North America found on industrial hemp. Insecta Mundi 2018, 0662, 1–12. [Google Scholar]
- Durak, R.; Jedryczka, M.; Czajka, B.; Dampc, J.; Wielgusz, K.; Borowiak-Sobkowiak, B. Mild abiotic stress affects development and stimulates hormesis of hemp aphid Phorodon cannabis. Insects 2021, 12, 420. [Google Scholar] [CrossRef] [PubMed]
- Fordjour, E.; Manful, C.F.; Sey, A.A.; Javed, R.; Pham, T.H.; Thomas, R.; Cheema, M. Cannabis: A multifaceted plant with endless potentials. Front. Pharmacol. 2023, 14, 1200269. [Google Scholar] [CrossRef] [PubMed]
- Ghosh, R.; Todd, A.R.; Wilkinson, S. Cannabis indica. Part V. The synthesis of cannabinol. J. Chem. Soc. 1940, 1393–1396. [Google Scholar] [CrossRef]
- Gildea, L.; Ayariga, J.A.; Ajayi, O.S.; Xu, J.; Villafane, R.; Samuel-Foo, M. Cannabis sativa CBD extract shows promising antibacterial activity against Salmonella typhimurium and S. newington. Molecules 2022, 27, 2669. [Google Scholar] [CrossRef] [PubMed]
- Grabherr, M.G.; Haas, B.J.; Yassour, M.; Levin, J.Z.; Thompson, D.A.; Amit, I.; Adiconis, X.; Fan, L.; Raychowdhury, R.; Zeng, Q.; Chen, Z.; Mauceli, E.; Hacohen, N.; Gnirke, A.; Rhind, N.; Di Palma, F.; Birren, B.W.; Nusbaum, C.; Lindblad-Toh, K.; Friedman, N.; Regev, A. Full-length transcriptome assembly from RNA-Seq data without a reference genome. Nat. Biotechnol. 2011, 29, 644–652. [Google Scholar] [CrossRef] [PubMed]
- Hanuš, L.O.; Meyer, S.M.; Muñoz, E.; Taglialatela-Scafati, O.; Appendino, G. Phytocannabinoids: a unified critical inventory. Nat. Prod. Rep. 2016, 33, 1357–1392. [Google Scholar] [CrossRef] [PubMed]
- Hanuš, L.O.; Hod, Y. Terpenes/terpenoids in cannabis: are they important? Med. Cannabis Cannabinoids. 2020, 3, 25–60. [Google Scholar] [CrossRef] [PubMed]
- Hartsel, J.A.; Eades, J.; Hickory, B.; Makriyannis, A. Cannabis sativa and hemp. In Nutraceuticals; Gupta, R.C., Ed.; Academic Press: Boston, 2016; pp. 735–754. ISBN 978-0-12-802147-7. [Google Scholar]
- Jacob, A.; Todd, A.R. Cannabis indica. Part II. Isolation of cannabidiol from Egyptian hashish. Observations on the structure of cannabinol. J. Chem. Soc. 1940, 649–653. [Google Scholar] [CrossRef]
- Jiang, R.; Yamaori, S.; Okamoto, Y.; Yamamoto, I.; Watanabe, K. Cannabidiol is a potent inhibitor of the catalytic activity of cytochrome P450 2C19. Drug Metab. Pharmacokinet. 2013, 28, 332–338. [Google Scholar] [CrossRef] [PubMed]
- Johnson, M. S.; Wallace, J. G. Genomic and chemical diversity of commercially available high-CBD industrial hemp accessions. Front.Genet. 2021, 12, 682475. [Google Scholar] [CrossRef] [PubMed]
- Kanehisa, M.; Goto, S. KEGG: Kyoto Encyclopedia of Genes and Genomes. Nucleic Acids Res. 2000, 28, 27–30. [Google Scholar] [CrossRef] [PubMed]
- Koch, S.D. Insecticidal property of cannabidiol: CBD disrupts exoskeleton development of tobacco hornworm (Manduca sexta). M.S. thesis, Colorado State University–Pueblo, Pueblo, CO, USA, 2021; 90p. [Google Scholar]
- Laizure, S.C.; Herring, V.; Hu, Z.; Witbrodt, K.; Parker, R.B. The role of human carboxylesterases in drug metabolism: have we overlooked their importance? Pharmacotherapy 2013, 33, 210–222. [Google Scholar] [CrossRef] [PubMed]
- Livak, K.J.; Schmittgen, T.D. Analysis of relative gene expression data using real-time quantitative PCR and the 2(T)(-Delta Delta C) method. Methods 2001, 25, 402–408. [Google Scholar] [CrossRef] [PubMed]
- MacWilliams, J.; Peirce, E.; Pitt, W.J.; Schreiner, M.; Matthews, T.; Yao, L.; Broeckling, C.; Nachappa, P. Assessing the adaptive role of cannabidiol (CBD) in Cannabis sativa defense against Cannabis aphids. Front. Plant Sci. 2023, 14, 1223894. [Google Scholar] [CrossRef] [PubMed]
- MacWilliams, J.; Padimi, V.; Carter, O.; Brownstein, K.; Stansell, Z.; Gordon, T.; Nachappa, P. Assessing the adaptive role of cannabidivarinic acid (CBDVA) in aphid defense in Cannabis sativa. J. Cannabis Res. 2025, 7, 34. [Google Scholar] [CrossRef] [PubMed]
- McPartland, J.M. Cannabis as repellent and pesticide. J. Int. Hemp Assoc. 1997, 4, 87–92. [Google Scholar]
- McPartland, J.M.; Sheikh, Z. A review of Cannabis sativa-based insecticides, miticides, and repellents. J. Entomol. Zool. Stud. 2018, 6, 1288–1299. [Google Scholar]
- Martin, M. Cutadapt removes adapter sequences from high-throughput sequencing reads. EMBnet. J. 2011, 17, 10–12. [Google Scholar] [CrossRef]
- Miotti, N.; Passera, A.; Ratti, C.; Dall’Ara, M.; Casati, P. A guide to cannabis virology: From the virome investigation to the development of viral biotechnological tools. Viruses 2023, 15, 1532. [Google Scholar] [CrossRef] [PubMed]
- Mortazavi, A.; Williams, B.A.; McCue, K.; Schaeffer, L.; Wold, B. Mapping and quantifying mammalian transcriptomes by RNA-seq. Nat. Methods 2008, 5, 621–628. [Google Scholar] [CrossRef] [PubMed]
- Ona, G.; Balant, M.; Bouso, J.C.; Gras, A.; Vallès, J.; Vitales, D.; Garnatje, T. The use of Cannabis sativa L. for pest control: From the ethnobotanical knowledge to a systematic review of experimental studies. Cannabis Cannabinoid Res. 2022, 7, 365–387. [Google Scholar] [CrossRef] [PubMed]
- Pagano, C.; Navarra, G.; Coppola, L.; Avilia, G.; Bifulco, M.; Laezza, C. Cannabinoids: Therapeutic use in clinical practice. Int. J. Mol. Sci. 2022, 23, 3344. [Google Scholar] [CrossRef] [PubMed]
- Pandey, S.; Stowers-Fann, K.; Duringer, J.; Baluch, S.; Walton, V.M.; Dorman, S.J.; Shrestha, G. Evaluating the effects of terpene and cannabinoid variation in hemp (Cannabis sativa) germplasm on Helicoverpa zea oviposition and larval fitness. J. Pest Sci. 2026, 99, 85. [Google Scholar] [CrossRef]
- Park, S.H.; Staples, S.K.; Gostin, E.L.; Smith, J.P.; Vigil, J.J.; Seifried, D.; Kinney, C.; Pauli, C.S.; Vanden Heuvel, B.D. Contrasting roles of cannabidiol as an insecticide and rescuing agent for ethanol-induced death in the tobacco hornworm Manduca sexta. Sci.ic Rep. 2019, 9, 10481. [Google Scholar] [CrossRef] [PubMed]
- Patro, R.; Duggal, G.; Love, M.I.; Irizarry, R.A.; Kingsford, C. Salmon provides fast and bias-aware quantification of transcript expression. Nat. Methods 2017, 14, 417–419. [Google Scholar] [CrossRef] [PubMed]
- Pavlovic, R.; Panseri, S.; Giupponi, L.; Leoni, V.; Citti, C.; Cattaneo, C.; Cavaletto, M.; Giorgi, A. Phytochemical and ecological analysis of two varieties of hemp (Cannabis sativa L.) grown in a mountain environment of Italian Alps. Front. Plant Sci. 2019, 10, 1265. [Google Scholar] [CrossRef] [PubMed]
- Pfaffl, M.W. A new mathematical model for relative quantification in real time RT-PCR. Nucleic Acids Res. 2001, 29, e45. [Google Scholar] [CrossRef] [PubMed]
- Pulkoski, M.; Burrack, H. Assessing the impact of piercing-sucking pests on greenhouse-grown industrial hemp (Cannabis sativa L.). Environ. Entomol. 2023, 53, 1–10. [Google Scholar] [CrossRef] [PubMed]
- Qian, Y.; Wang, X.; Markowitz, J.S. In vitro inhibition of carboxylesterase 1 by major cannabinoids and selected metabolites. Drug Metab. Dispos. 2019, 47, 465–472. [Google Scholar] [CrossRef] [PubMed]
- Rapin, L.; Gamaoun, R.; El Hage, C.; Arboleda, M.F.; Prosk, E. Cannabidiol use and effectiveness: real-world evidence from a Canadian medical cannabis clinic. J. Cannabis Res. 2021, 3, 19. [Google Scholar] [CrossRef] [PubMed]
- Robinson, M.D.; McCarthy, D.J.; Smyth, G.K. edgeR: A bioconductor package for differential expression analysis of digital gene expression data. Bioinformatics 2010, 26, 139–140. [Google Scholar] [CrossRef] [PubMed]
- Smith, R.T.; Gruber, S.A. Contemplating cannabis? The complex relationship between cannabinoids and hepatic metabolism resulting in the potential for drug-drug interactions. Front. Psychiatry 2023, 13, 1055481. [Google Scholar] [CrossRef] [PubMed]
- Tsaliki, E.; Kalivas, A.; Jankauskiene, Z.; Irakli, M.; Cook, C.; Grigoriadis, I.; Panoras, I.; Vasilakoglou, I.; Dhima, K. Fibre and seed productivity of industrial hemp (Cannabis sativa L.) varieties under mediterranean conditions. Agronomy 2021, 11, 171. [Google Scholar] [CrossRef]
- Wang, Y.; Gao, R.; Gu, T.; Li, X.; Wang, M.; Wang, A.; Qiu, Y. Metabolomics and transcriptomics reveal the role of the terpene biosynthetic pathway in the mechanism of insect resistance in Solanum habrochaites. J. Agric. Food Chem. 2025, 73, 6253–6269. [Google Scholar] [CrossRef] [PubMed]
- Wickham, H. ggplot2: Elegant graphics for data analysis, 2nd ed.; Springer International Publishing: Cham, Switzerland, 2016; 260p. [Google Scholar] [CrossRef]
- Xu, J.; Knight, T.; Boone, D.; Saleem, M.; Finley, S.J.; Gauthier, N.; Ayariga, J.A.; Akinrinlola, R.; Pulkoski, M.; Britt, K.; Tolosa, T.; Rosado-Rivera, Y.I.; Iddrisu, I.; Thweatt, I.; Li, T.; Hansen, Z.; Zebelo, S.; Burrack, H.; Thiessen, L.; Bernard, E.; Kuhar, T.; Samuel-Foo, M.; Ajayi, O.S. Influence of fungicide application on rhizosphere microbiota structure and microbial secreted enzymes in diverse cannabinoid-rich hemp cultivars. Int. J. Mol. Sci. 2024, 25, 5892. [Google Scholar] [CrossRef] [PubMed]
- Yamaori, S.; Kushihara, M.; Yamamoto, I.; Watanabe, K. Characterization of major phytocannabinoids, cannabidiol and cannabinol, as isoform-selective and potent inhibitors of human CYP1 enzymes. Biochem. Pharmacol. 2010, 79, 1691–1698. [Google Scholar] [CrossRef] [PubMed]
- Yamaori, S.; Ebisawa, J.; Okushima, Y.; Yamamoto, I.; Watanabe, K. Potent inhibition of human cytochrome P450 3A isoforms by cannabidiol: role of phenolic hydroxyl groups in the resorcinol moiety. Life Sci. 2011a, 88, 730–736. [Google Scholar] [CrossRef] [PubMed]
- Yamaori, S.; Maeda, C.; Yamamoto, I.; Watanabe, K. Differential inhibition of human cytochrome P450 2A6 and 2B6 by major phytocannabinoids. Forensic. Toxicol. 2011b, 29, 117–124. [Google Scholar] [CrossRef]
- Yamaori, S.; Okamoto, Y.; Yamamoto, I.; Watanabe, K. Cannabidiol, a major phytocannabinoid, as a potent atypical inhibitor for CYP2D6. Drug Metab. Dispos. 2011c, 39, 2049–2056. [Google Scholar] [CrossRef] [PubMed]
- Yamaori, S.; Koeda, K.; Kushihara, M.; Hada, Y.; Yamamoto, I.; Watanabe, K. Comparison in the in vitro inhibitory effects of major phytocannabinoids and polycyclic aromatic hydrocarbons contained in marijuana smoke on cytochrome P450 2C9 activity. Drug Metab. Pharmacokinet. 2012, 27, 294–300. [Google Scholar] [CrossRef] [PubMed]
Figure 1.
Scanning electron microscopy (SEM) of Phorodon cannabis. (A) Whole aphid observed under SEM at 100× magnification. (B) Enlarged view of the antennal region showing bulb-tipped setae within the circle.
Figure 1.
Scanning electron microscopy (SEM) of Phorodon cannabis. (A) Whole aphid observed under SEM at 100× magnification. (B) Enlarged view of the antennal region showing bulb-tipped setae within the circle.
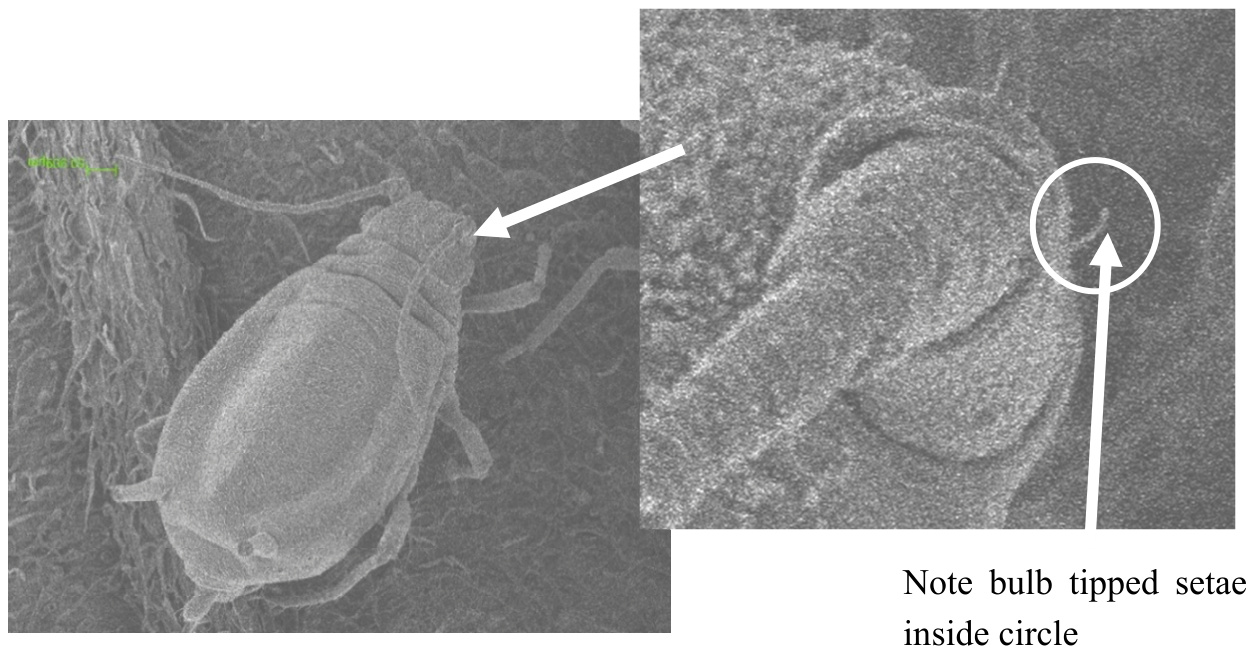
Figure 2.
Principal component analysis (PCA) of P. cannabis transcriptome data. CBD-rich hemp cultivars are grouped within red circles, while fiber hemp cultivars are grouped within blue circles. Red circles, diamonds, and squares represent BaOx (Ba1–Ba4), Cherry Dwarf (Cd1–Cd4), and Citrus (Cs1–Cs4), respectively. Blue circles and diamonds represent Bialobrzeskie (Bz1–Bz4) and Henola (He1–He4), respectively.
Figure 2.
Principal component analysis (PCA) of P. cannabis transcriptome data. CBD-rich hemp cultivars are grouped within red circles, while fiber hemp cultivars are grouped within blue circles. Red circles, diamonds, and squares represent BaOx (Ba1–Ba4), Cherry Dwarf (Cd1–Cd4), and Citrus (Cs1–Cs4), respectively. Blue circles and diamonds represent Bialobrzeskie (Bz1–Bz4) and Henola (He1–He4), respectively.
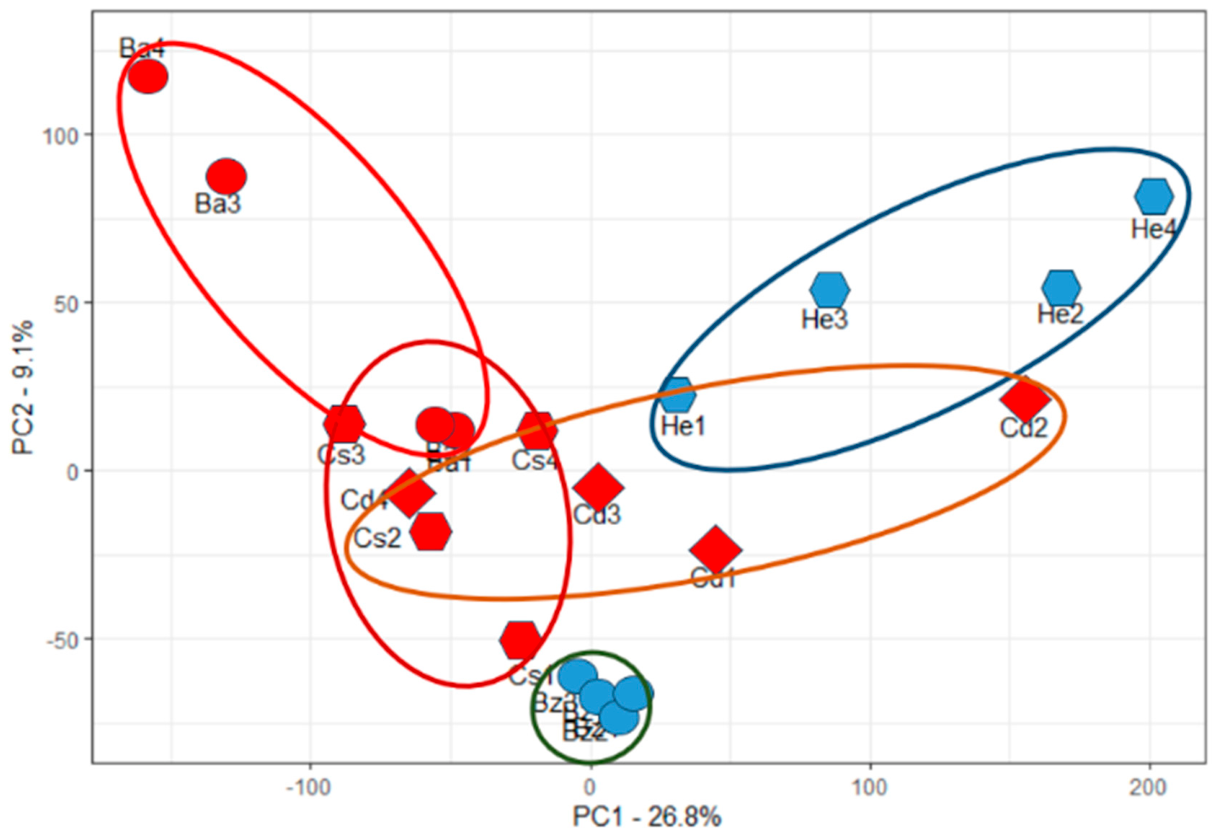
Figure 3.
Pie chart depicting Kyoto Encyclopedia of Genes and Genomes (KEGG) pathway gene distribution in the P. cannabis transcriptome.
Figure 3.
Pie chart depicting Kyoto Encyclopedia of Genes and Genomes (KEGG) pathway gene distribution in the P. cannabis transcriptome.
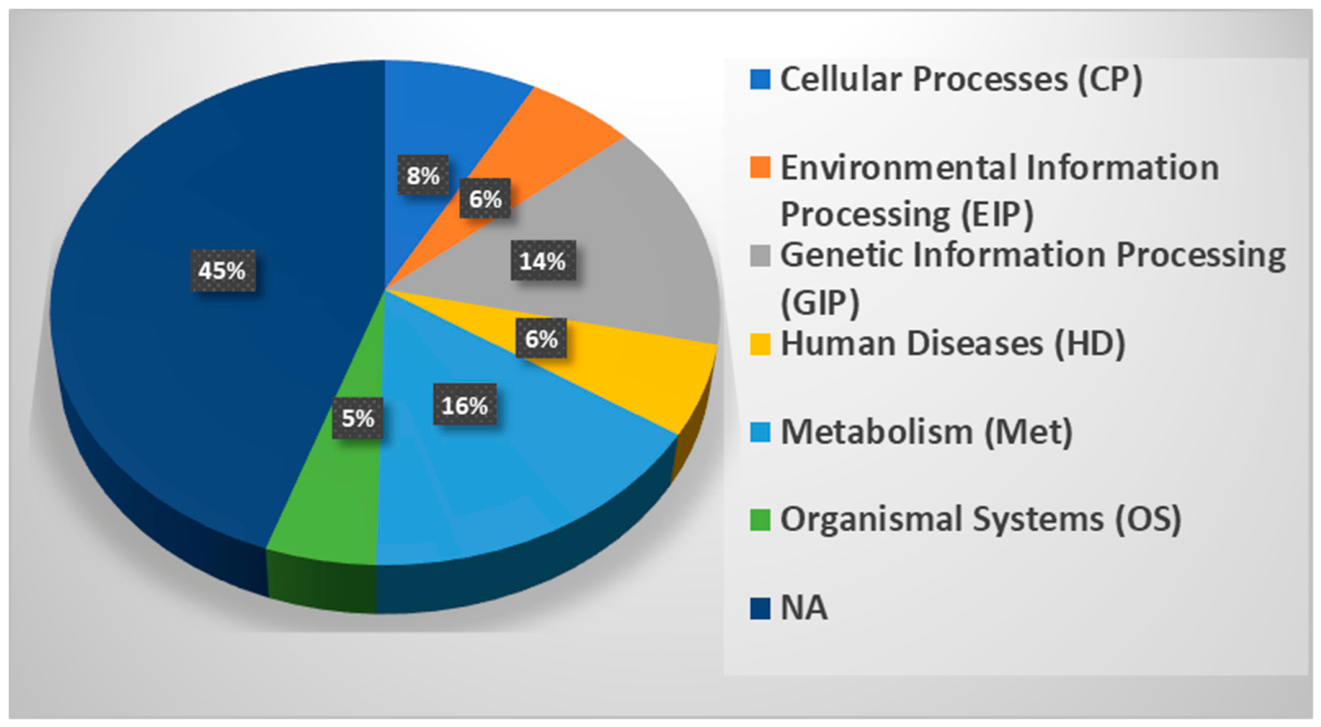
Figure 5.
Comparison of the numbers of significantly upregulated and downregulated genes in cannabis aphids (Phorodon cannabis) feeding on CBD-rich versus fiber hemp cultivars. (A) Differentially expressed genes among the total aphid transcriptome (34,043 genes). (B) Differentially expressed genes associated with KEGG pathways (13,623 genes). The total transcriptome contained more upregulated than downregulated genes in aphids feeding on CBD-rich hemp cultivars, whereas KEGG pathway-associated genes were predominantly downregulated compared with aphids feeding on fiber hemp cultivars.
Figure 5.
Comparison of the numbers of significantly upregulated and downregulated genes in cannabis aphids (Phorodon cannabis) feeding on CBD-rich versus fiber hemp cultivars. (A) Differentially expressed genes among the total aphid transcriptome (34,043 genes). (B) Differentially expressed genes associated with KEGG pathways (13,623 genes). The total transcriptome contained more upregulated than downregulated genes in aphids feeding on CBD-rich hemp cultivars, whereas KEGG pathway-associated genes were predominantly downregulated compared with aphids feeding on fiber hemp cultivars.
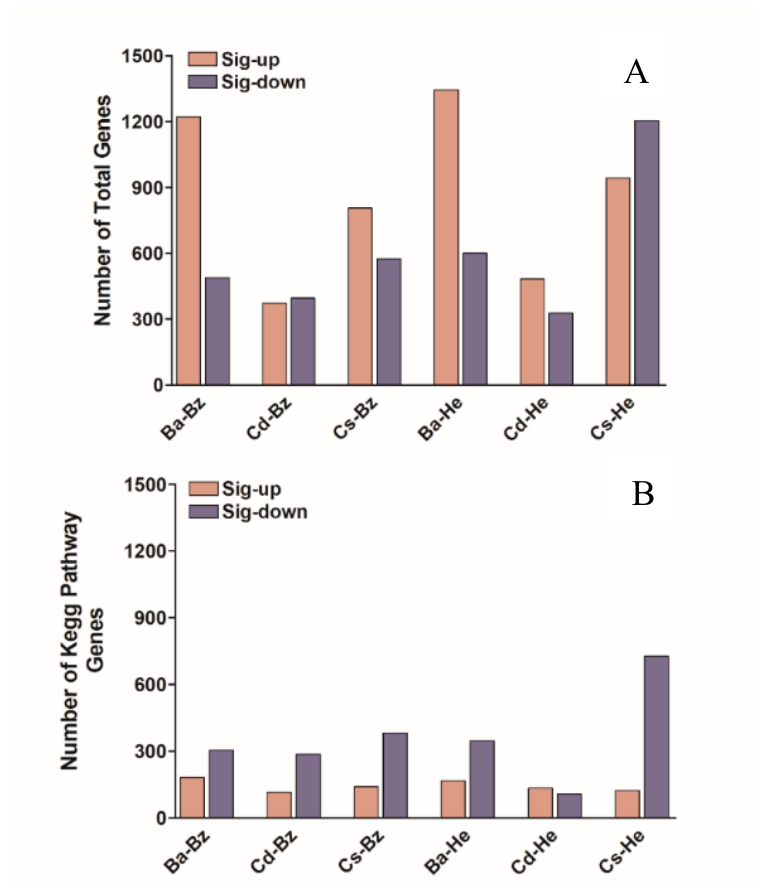
Figure 6.
Regulation of KEGG pathway-associated genes in cannabis aphids (Phorodon cannabis) feeding on CBD-rich versus fiber hemp cultivars. Most KEGG pathway-associated genes were downregulated in aphids feeding on CBD-rich hemp cultivars compared with those feeding on fiber hemp cultivars, suggesting broad suppression of genes involved in diverse biological pathways. (A) Number of genes associated with cellular processes (CP); (B) environmental information processing (EIP) pathways; (C) genetic information processing (GIP) pathways; (D) human disease (HD) pathways; (E) metabolism (Met) pathways; and (F) organismal systems (OS) pathways.
Figure 6.
Regulation of KEGG pathway-associated genes in cannabis aphids (Phorodon cannabis) feeding on CBD-rich versus fiber hemp cultivars. Most KEGG pathway-associated genes were downregulated in aphids feeding on CBD-rich hemp cultivars compared with those feeding on fiber hemp cultivars, suggesting broad suppression of genes involved in diverse biological pathways. (A) Number of genes associated with cellular processes (CP); (B) environmental information processing (EIP) pathways; (C) genetic information processing (GIP) pathways; (D) human disease (HD) pathways; (E) metabolism (Met) pathways; and (F) organismal systems (OS) pathways.
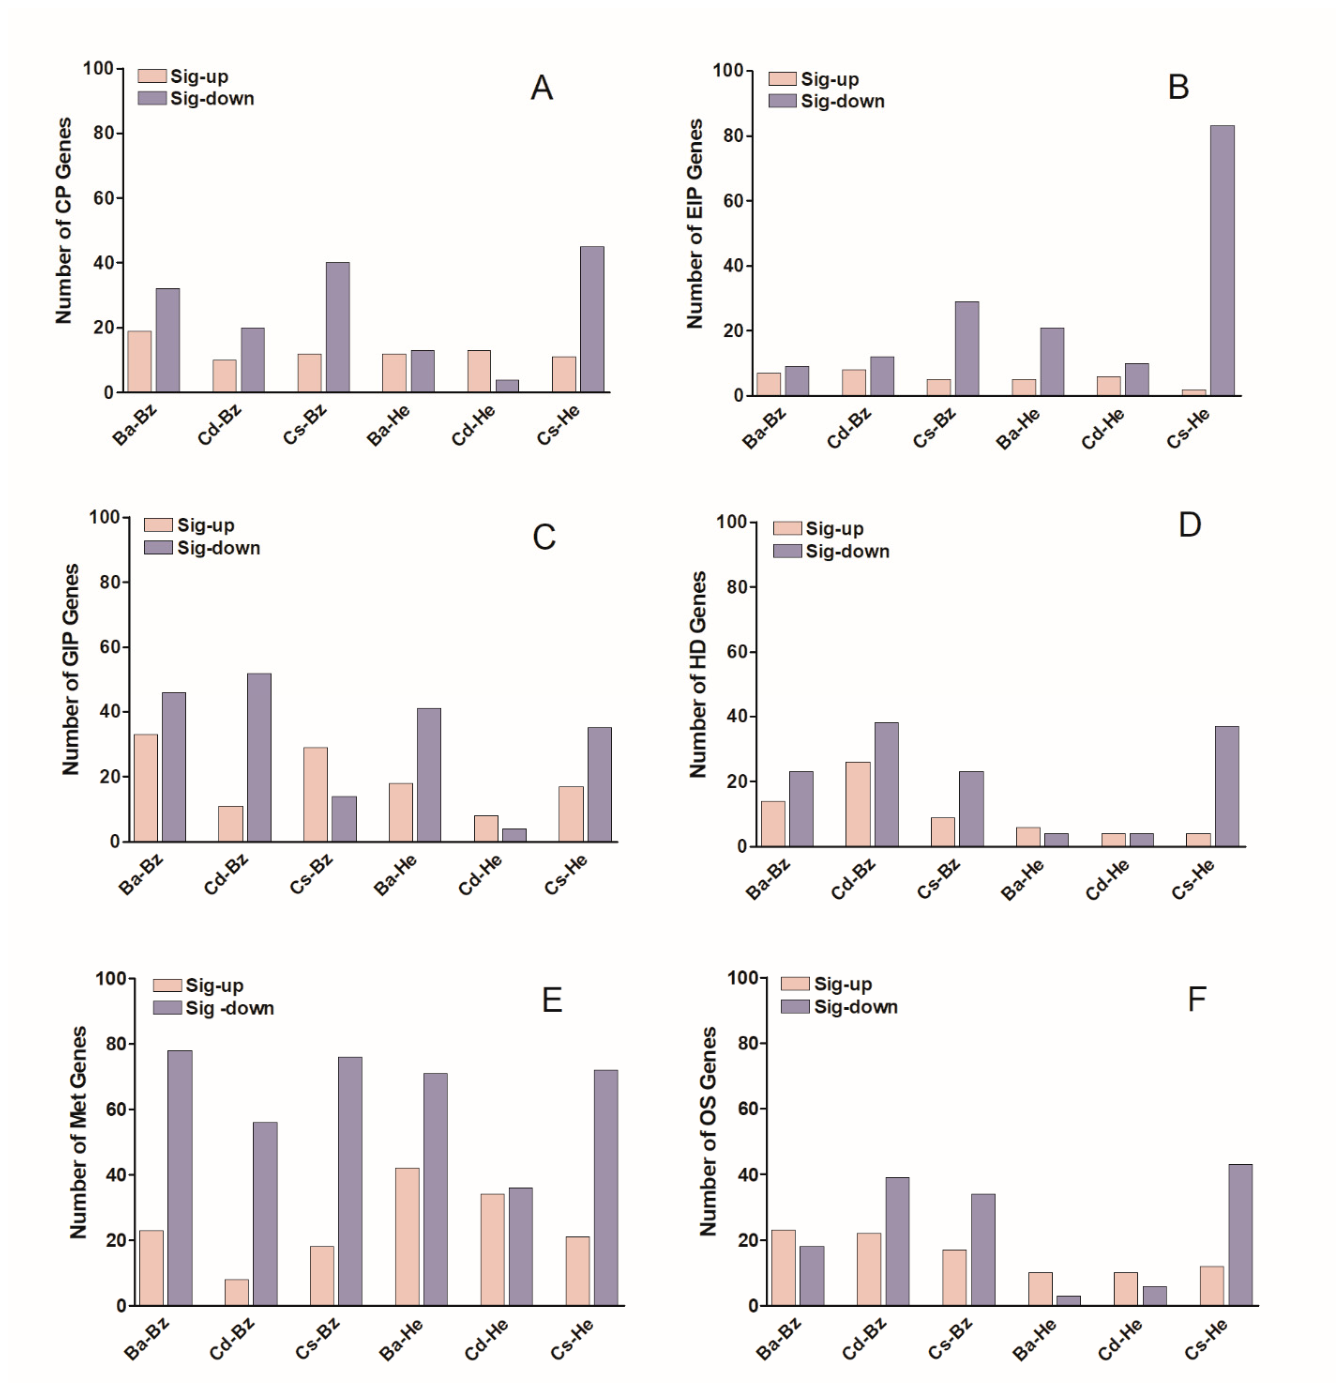
Figure 7.
Regulation of metabolism-related genes in cannabis aphids (Phorodon cannabis) feeding on CBD-rich versus fiber hemp cultivars. Genes associated with amino acid metabolism and carbohydrate metabolism were predominantly downregulated in aphids feeding on CBD-rich hemp cultivars compared with those feeding on fiber hemp cultivars. A similar pattern was observed for genes involved in glycan biosynthesis and metabolism, lipid metabolism, and the metabolism of cofactors and vitamins, except in the Cherry Dwarf versus Henola (Cd–He) comparison. (A) Number of genes associated with amino acid metabolism; (B) carbohydrate metabolism; (C) energy metabolism; (D) glycan biosynthesis and metabolism; (E) lipid metabolism; (F) metabolism of cofactors and vitamins; (G) metabolism of terpenoids and polyketides; (H) nucleotide metabolism; and (I) xenobiotics biodegradation and metabolism.
Figure 7.
Regulation of metabolism-related genes in cannabis aphids (Phorodon cannabis) feeding on CBD-rich versus fiber hemp cultivars. Genes associated with amino acid metabolism and carbohydrate metabolism were predominantly downregulated in aphids feeding on CBD-rich hemp cultivars compared with those feeding on fiber hemp cultivars. A similar pattern was observed for genes involved in glycan biosynthesis and metabolism, lipid metabolism, and the metabolism of cofactors and vitamins, except in the Cherry Dwarf versus Henola (Cd–He) comparison. (A) Number of genes associated with amino acid metabolism; (B) carbohydrate metabolism; (C) energy metabolism; (D) glycan biosynthesis and metabolism; (E) lipid metabolism; (F) metabolism of cofactors and vitamins; (G) metabolism of terpenoids and polyketides; (H) nucleotide metabolism; and (I) xenobiotics biodegradation and metabolism.
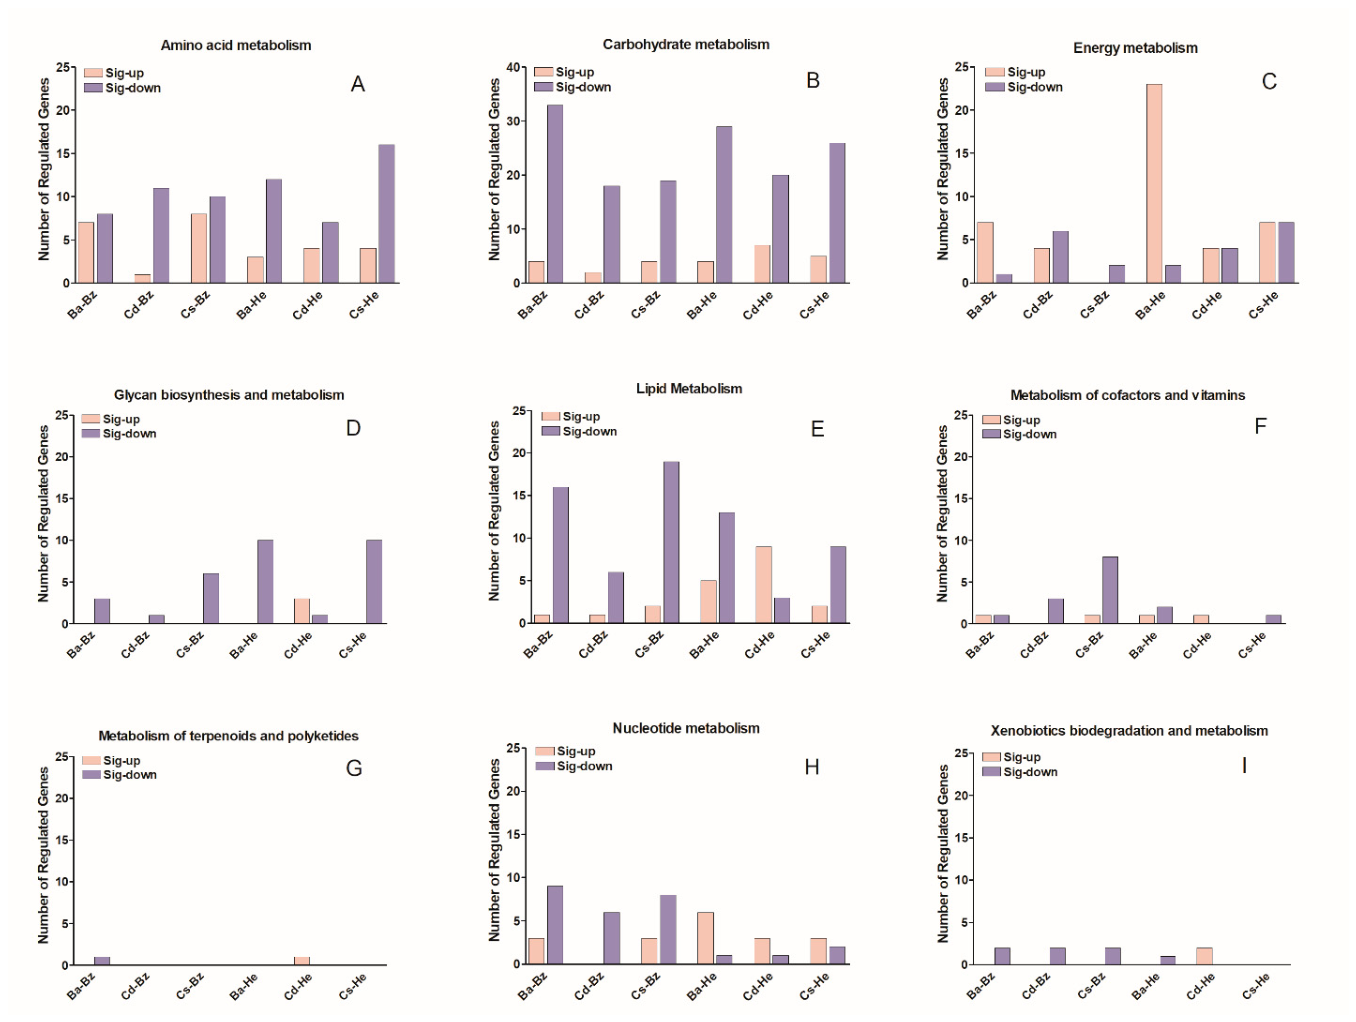
Figure 8.
Heatmap of detoxification genes in Phorodon cannabis feeding on CBD-rich and fiber hemp cultivars. Ba, Cd, and Cs represent the CBD-rich cultivars BaOx, Cherry Dwarf, and Citrus, respectively, whereas Bz and He represent the fiber cultivars Bialobrzeskie and Henola, respectively. (A) Cytochrome P450s (P450); (B) glutathione S-transferases (GSTs); (C) carboxylesterases/esterases (CES); and (D) UDP-glycosyltransferases (UDP).
Figure 8.
Heatmap of detoxification genes in Phorodon cannabis feeding on CBD-rich and fiber hemp cultivars. Ba, Cd, and Cs represent the CBD-rich cultivars BaOx, Cherry Dwarf, and Citrus, respectively, whereas Bz and He represent the fiber cultivars Bialobrzeskie and Henola, respectively. (A) Cytochrome P450s (P450); (B) glutathione S-transferases (GSTs); (C) carboxylesterases/esterases (CES); and (D) UDP-glycosyltransferases (UDP).
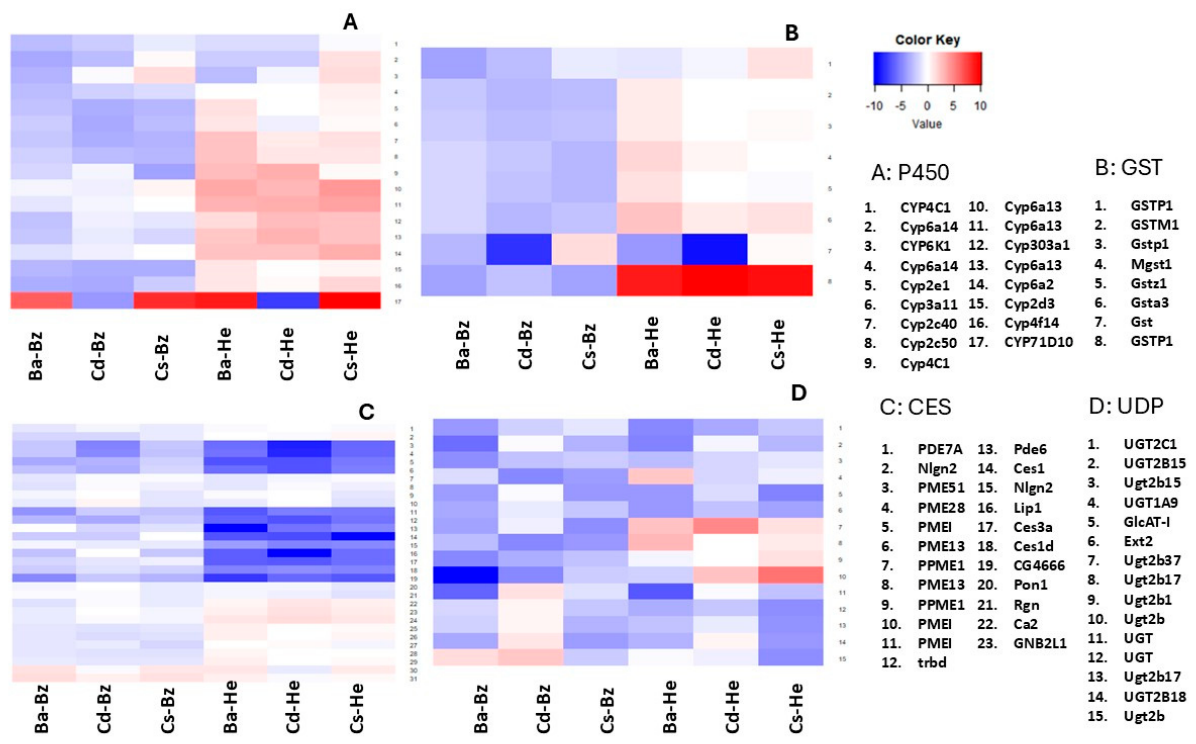
Figure 9.
Validation of RNA-seq results by quantitative real-time PCR (RT-qPCR). (A) Log₂ fold changes (Log₂FC) of differentially expressed genes identified by RNA-seq in Phorodon cannabis feeding on CBD-rich hemp cultivars relative to fiber hemp cultivars. (B) Relative fold changes in gene expression determined by RT-qPCR for the same genes. The housekeeping genes RPL4 (60S ribosomal protein L4) and RpS24 (40S ribosomal protein S24 isoform X2) were used as reference genes for RT-qPCR normalization. Gene annotations: (1) Pex5, peroxisomal targeting signal 1 receptor isoform X1; (2) Vwf, predicted mucin-6-like; (3) Ext2, exostosin-2; (4) MPV17L2, mpv17-like protein 2; (5) PLXNB3, plexin-B3-like; (6) PME48, pectinesterase 31-like; (7) Cel, esterase FE4-like isoform X5; (8) cryS, carboxylesterase; (9) HPD, 4-hydroxyphenylpyruvate dioxygenase; (10) RPL39, LUMA_CG021300 isoform A; (11) LSM4, predicted U6 snRNA-associated Sm-like protein LSm4; (12) PME28, predicted pectinesterase-like isoform X2; (13) Cyp6a14, cytochrome P450 6CY5; and (14) UGT2B15, UDP-glucuronosyltransferase 2B2-like. Note: Ba, Cd, and Cs represent the CBD-rich cultivars BaOx, Cherry Dwarf, and Citrus, respectively, whereas Bz and He represent the fiber cultivars Bialobrzeskie and Henola, respectively.
Figure 9.
Validation of RNA-seq results by quantitative real-time PCR (RT-qPCR). (A) Log₂ fold changes (Log₂FC) of differentially expressed genes identified by RNA-seq in Phorodon cannabis feeding on CBD-rich hemp cultivars relative to fiber hemp cultivars. (B) Relative fold changes in gene expression determined by RT-qPCR for the same genes. The housekeeping genes RPL4 (60S ribosomal protein L4) and RpS24 (40S ribosomal protein S24 isoform X2) were used as reference genes for RT-qPCR normalization. Gene annotations: (1) Pex5, peroxisomal targeting signal 1 receptor isoform X1; (2) Vwf, predicted mucin-6-like; (3) Ext2, exostosin-2; (4) MPV17L2, mpv17-like protein 2; (5) PLXNB3, plexin-B3-like; (6) PME48, pectinesterase 31-like; (7) Cel, esterase FE4-like isoform X5; (8) cryS, carboxylesterase; (9) HPD, 4-hydroxyphenylpyruvate dioxygenase; (10) RPL39, LUMA_CG021300 isoform A; (11) LSM4, predicted U6 snRNA-associated Sm-like protein LSm4; (12) PME28, predicted pectinesterase-like isoform X2; (13) Cyp6a14, cytochrome P450 6CY5; and (14) UGT2B15, UDP-glucuronosyltransferase 2B2-like. Note: Ba, Cd, and Cs represent the CBD-rich cultivars BaOx, Cherry Dwarf, and Citrus, respectively, whereas Bz and He represent the fiber cultivars Bialobrzeskie and Henola, respectively.
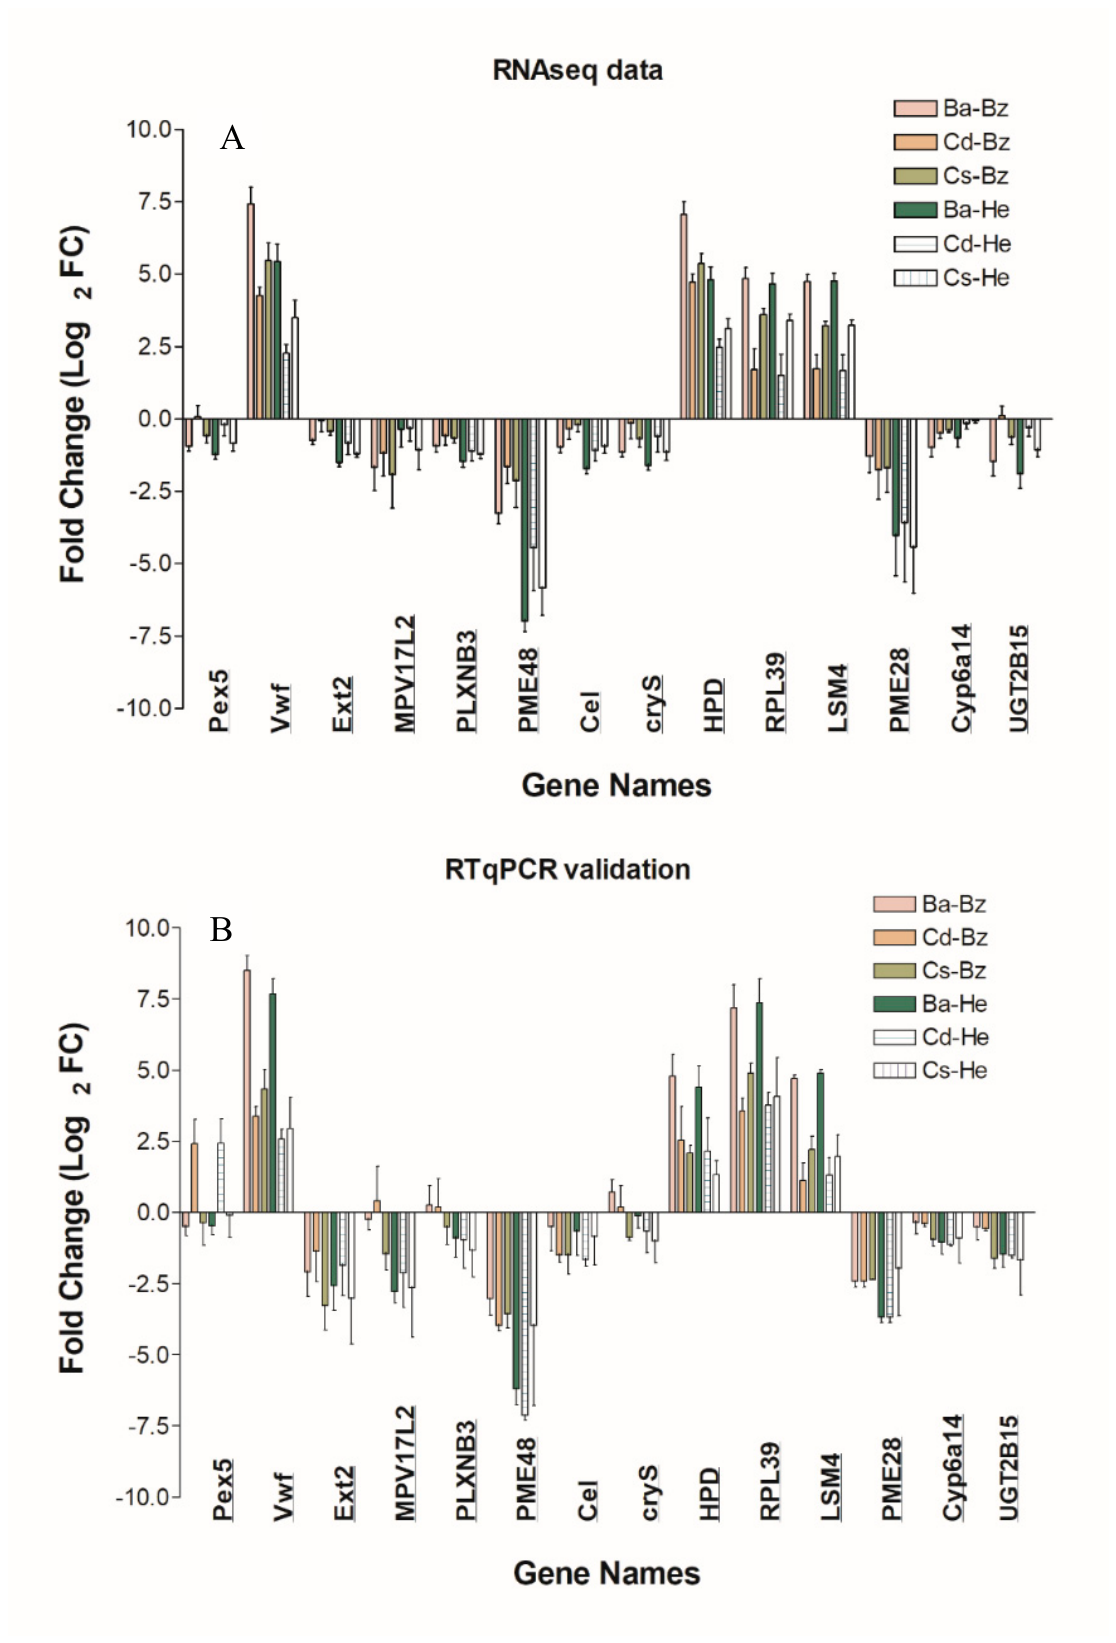

Table 1.
Primers used in RT-qPCR for the validation of gene expression.
| SN | Gene names | Description | Primer sequences Forward/Reverse (5’ to 3’) | Amplicon length | Efficient |
|---|---|---|---|---|---|
| 1 | Pex5 | peroxisomal targeting signal 1 receptor isoform X1 | F: TGTCCAGGTCCGTTTGACGC R: CCGTTCGATCGACGCGTACA |
116 | 1.98 |
| 2 | Vwf | PREDICTED: mucin-6-like | F: CGGACCCAGCCAAATGGACA R: ACCAGGAACGCACATTCGGT |
137 | 2.14 |
| 3 | Ext2 | exostosin-2 | F: TGGACCGTCTAATGGCTGAGC R: CAGTGACGGTCGTGAGGCAG |
100 | 1.89 |
| 4 | MPV17L2 | mpv17-like protein 2 | F: TCGTTACCGGGCACGTTTCC R: TGTCGAACACGTACACCGCC |
143 | 2.09 |
| 5 | PLXNB3 | plexin-B3-like | F: TGGCCGTGTCCAGCAACAAT R: TCTGTCGTACCGGTCGTCGT |
130 | 1.98 |
| 6 | PME48 | pectinesterase 31-like | F: TTGGGTCGAGCTTGGAGGGA R: TTTCAGGTGAGCCCATGCCG |
106 | 2.11 |
| 7 | Cel | esterase FE4-like isoform X5 | F: AGTGTCCTGGAAACATGGGCT R: ACAGACGCTGATCCTGCACT |
134 | 2.16 |
| 8 | cryS | carboxylesterase | F: ACATCCCGGATGGTCTGGAGT R: CGTTCTGCTGTGGCACCGAT |
134 | 2.08 |
| 9 | HPD | 4-hydroxyphenylpyruvate dioxygenase | F: AGGCCCTTGGACAGAAAGCG R: TGGTGCAGAATAGGAAGGCAGG |
133 | 2.06 |
| 10 | RPL39 | CLUMA_CG021300, isoform A | F: AGCAAAAGACCAACCGTCCT R: AGCTTGGTTCTTCGCCAATGT |
100 | 2.05 |
| 11 | LSM4 | PREDICTED: U6 snRNA-associated Sm-like protein LSm4 | F: ACGGACTTCTGGTTTCCTGTGA R: TGACCTCATCAGGGATTCGAAGA |
150 | 1.72 |
| 12 | PME28 | PREDICTED: pectinesterase-like isoform X2 | F: CCAAAGTGACGGTGGCAGGA R: ACCATTTCCGTCACCGCTCG |
110 | 1.79 |
| 13 | Cyp6a14 | cytochrome P450 6CY5 | F: TCGTCTTTCACTGAACGTGGTCT R: CCCGATGTGAAACCAGGTGTCA | 128 | 1.81 |
| 14 | UGT2B15 | UDP-glucuronosyltransferase 2B2-like | F: TGCACCTGTTGATGCATTGCA R: TAGCCCGATTTCCAGCGAGG |
149 | 1.80 |
| 15 | RPL4 | 60S ribosomal protein L4 | F: ATGTTATCGCTGGCTCGCCC R: ACATCAGGACGAATGGGCGC |
110 | 1.94 |
| 16 | RpS24 | 40S ribosomal protein S24 isoform X2 | F: AGCCACCATCAGGACGAGGA R: CCTTCTTCACTGAGGCCTGGC |
101 | 2.04 |
Table 2.
Comparison of CBD levels and aphid populations among different hemp cultivars in the field.
Table 2.
Comparison of CBD levels and aphid populations among different hemp cultivars in the field.
| Hemp cultivar | Type | Amount of aphids/5 plants* | CBD content** | THC content** | |
|---|---|---|---|---|---|
| 7/19/22 | 8/5/22 | ||||
| Henola | fiber | 115 ± 9.5B | 1071 ± 41.2B | 2-5% | <0.20% |
| Bialobrzeskie | fiber | 407 ± 16.1A | 1548 ± 85.8A | 1-1.5% | <0.12% |
| Cherry Dwarf | CBD | 6 ± 0.3C | 2 ± 0.9C | 11-12% | <0.3% |
| Citrus | CBD | 5 ± 0.4C | 4 ± 0.3C | 8-12% | Consistently <0.3% |
| BaOx | CBD | NA | NA | 8-10% | Consistently <0.3% |
*Number of aphid/five plants: The number of aphids on five CBD hemp cultivars and fiber hemp was normalized to match the size of the CBD cultivars. Different superscript letters indicate significant differences in cannabis aphid numbers among hemp cultivars within the same sampling date (P ≤ 0.01). ** CBD and THC content data were obtained from the company’s website. These concentrations may vary depending on the plant’s developmental stage and growing conditions. The BaOx cultivar was not available for the field experiments in Alabama; therefore, aphid population data for this cultivar could not be obtained..
Table 3.
The percentage of detoxification genes that are significantly regulated in Cannabis aphid (Phorodon cannabis) feeding on CBD vs. fiber hemp cultivars.
Table 3.
The percentage of detoxification genes that are significantly regulated in Cannabis aphid (Phorodon cannabis) feeding on CBD vs. fiber hemp cultivars.
| Gene types | P450 | GST | UDP | CES |
|---|---|---|---|---|
| Total genes | 153 | 34 | 47 | 132 |
| Sig genes | 17 | 8 | 15 | 31 |
| % of sig genes | 11.1 | 23.5 | 31.9 | 23.5 |
Disclaimer/Publisher’s Note: The statements, opinions and data contained in all publications are solely those of the individual author(s) and contributor(s) and not of MDPI and/or the editor(s). MDPI and/or the editor(s) disclaim responsibility for any injury to people or property resulting from any ideas, methods, instructions or products referred to in the content. |
© 2026 by the authors. Licensee MDPI, Basel, Switzerland. This article is an open access article distributed under the terms and conditions of the Creative Commons Attribution (CC BY) license.
Copyright: This open access article is published under a Creative Commons CC BY 4.0 license, which permit the free download, distribution, and reuse, provided that the author and preprint are cited in any reuse.