
Submitted:
03 November 2026
Posted:
06 November 2026
You are already at the latest version
Abstract
Standardized school prototypes are replicated across Egypt regardless of local wind, yet the effect of courtyard orientation on classroom ventilation and summer comfort remains poorly quantified. This study assessed a five-story prototype in hot-arid Cairo using validated non-isothermal computational fluid dynamics (CFD) for four courtyard orientations (0°, 15°, 30° and 45° relative to the prevailing August wind), combined with adaptive and heat-balance comfort indices. The realizable k–ε model reproduced measured classroom temperatures with a root-mean-square error of 0.31 K, and discretization uncertainty was below 1.5%. The wind-aligned layout gave the highest mean classroom air speed (0.44 m/s) and the lowest air temperature (31.1 °C); rotations of 15–45° reduced air speed by 19–29% and raised air temperature by 1.5–4.0 K, well above the model uncertainty. No orientation met the 80% acceptability limit of the ASHRAE 55 adaptive model (30.4 °C). The aligned classroom would comply only with ceiling fans providing at least 0.6 m/s, whereas rotated layouts would also need substantial heat-gain reductions; Coupled Model Intercomparison Project Phase 6 projections indicate that this margin is exhausted at about 2 K of regional warming. Courtyard alignment is necessary but insufficient and must be combined with elevated air movement and heat-gain control.
Keywords:
natural ventilation
; courtyard orientation
; computational fluid dynamics
; adaptive thermal comfort
; educational building
; hot-arid climate
1. Introduction
Classrooms in hot-arid regions are prone to overheating, and moderately raised classroom temperatures have measurable effects on pupils' comfort and on the speed of schoolwork [1,2]. In Egypt, most public pre-university schools are delivered by the General Authority for Educational Buildings (GAEB) from a small set of standardized prototypes that are replicated nationwide with little adaptation to regional climate or to the orientation of individual plots [3,4]. Field studies in naturally ventilated governmental classrooms have repeatedly recorded summer air temperatures well above comfort limits [5,6]. Because these buildings are free-running for most of the school year, the way in which their form and orientation capture the prevailing wind is a first-order determinant of indoor thermal conditions, and a single siting decision embedded in a prototype is multiplied across a very large building stock.
Wind-driven cross-ventilation depends on the pressure difference generated across a building's openings, which in turn depends on the angle at which the wind strikes the façade [7,8]. Computational fluid dynamics (CFD) studies have shown that wind direction and building arrangement strongly alter airflow patterns, recirculation zones and ventilation potential around and inside buildings [9,10,11], and steady Reynolds-averaged Navier–Stokes (RANS) modeling has been extensively validated for cross-ventilation of generic buildings [12,13,14]. Courtyards are a long-established passive strategy in hot-arid climates, and their thermal and aerodynamic performance has been shown to depend on proportion and orientation [15,16,17,18]. In educational settings, orientation and landscape also govern the outdoor microclimate around school buildings [19], and simulation-based optimization of natural ventilation has recently been applied to student accommodation [20].
The general effect of orientation on wind-driven ventilation is therefore well documented for generic geometries. What remains insufficiently quantified for school buildings in hot-arid climates is (i) how much a realistic, nationally replicated prototype loses in classroom air movement and thermal comfort per degree of misalignment with the prevailing wind; (ii) whether the differences between orientations exceed the numerical and modeling uncertainty of the CFD predictions on which such rankings are based; and (iii) whether good orientation alone can deliver acceptable summer comfort, and if not, how large the remaining deficit is and what it would take to close it under current and projected climates. Answers to these questions are needed by agencies such as GAEB, which must decide whether to prescribe orientation rules, ceiling fans or envelope upgrades for prototypes that will be built on many differently oriented plots.
In a preceding study, Qataya et al. [21] examined the same GAEB prototype with isothermal, wind-only CFD under twelve monthly wind conditions and found that the 0° and 15° courtyard orientations maximized courtyard air speeds and façade pressure differences. That analysis did not resolve the classroom thermal field, did not include solar and internal heat gains, and did not evaluate occupant comfort. Building on that work and on a bioclimatic framework for natural ventilation in hot-arid regions [22], the present study makes four contributions: (1) non-isothermal CFD of an occupied classroom under peak-summer conditions, supported by a comparison of three RANS turbulence models against measured classroom temperatures; (2) a multi-metric comfort assessment that combines the adaptive model, including the provision for elevated air speed, with the predicted mean vote, standard effective temperature and vertical temperature difference; (3) explicit numerical and model uncertainty bounds, used to test whether the predicted differences between orientations are resolvable, together with an occupancy sensitivity analysis; and (4) design-oriented quantities that are transferable beyond the case study, namely the thermal penalty per 15° of misalignment, the residual comfort deficit that orientation cannot remove, the indoor air speed required to offset it, and the regional warming at which this mitigation is exhausted.
The remainder of the paper is organized as follows. Section 2 describes the case study, the CFD model, its verification and validation, and the ventilation and comfort indicators. Section 3 presents the airflow, temperature and comfort results together with their uncertainty. Section 4 discusses the contribution of the study, mitigation strategies for sub-optimal orientations, implications under projected warming and the limitations of the approach, and Section 5 concludes.
2. Materials and Methods
2.1. Research Design
The study combines a CFD parametric analysis with a post-processing chain for ventilation and comfort indicators (Figure 1). After the climatic context and the case-study building were defined, the CFD model was verified with a four-grid sensitivity study and validated against measured classroom temperatures, using three turbulence models. The validated set-up was then applied to four courtyard orientations. Airflow and temperature fields were analyzed on two horizontal planes, on vertical sections and over the classroom volume, and the results were converted into ventilation indicators, adaptive and heat-balance comfort indices, uncertainty bounds, an occupancy sensitivity estimate and a screening under projected warming.
2.2. Climatic Context
The study addresses the Cairo and Nile Delta climatic region, which has the largest concentration of pre-university schools in Egypt [23] and a hot desert (BWh) climate in the Köppen–Geiger classification [24]. Hourly wind speed, wind direction and air temperature were obtained from the EnergyPlus weather (EPW) file for Cairo International Airport, which is based on observations of the Egyptian Meteorological Authority at 10 m above ground [25], and monthly statistics were derived with the Weather Tool of Autodesk Ecotect [26]. The monthly means show a clear seasonal pattern (Figure 2): during summer the prevailing wind blows consistently from about 350° (north–northwest), whereas in winter it shifts to southerly and south-westerly directions; mean monthly air temperatures approach 30 °C in summer and about 15 °C in winter.
August has the highest monthly mean air temperature and was therefore selected as the design condition. The simulations used the August means of the EPW file, i.e. a wind speed of 3.13 m/s at 10 m from 350° and an air temperature of 29.2 °C; the corresponding mean relative humidity of the 1991–2021 climatology is 47% [27]. Monthly means represent the prevailing condition that governs comparative ventilation performance and avoid bias from atypical days; the implications of neglecting short-term variability are discussed in Section 4.4. The mean and mean-maximum August air temperatures (29.2 °C and about 36.6 °C [27]) remain below the range of about 35–37 °C above which increased air movement no longer provides cooling [8,28], so that natural ventilation remains physiologically beneficial throughout the design month.
2.3. Case-Study Building and Classroom
The case study is the standardized GAEB pre-university prototype used in the Cairo and Delta region [3] (Figure 3). The five-story building (ground floor plus four floors) contains 33 classrooms arranged along the main façade and served by an open corridor facing a U-shaped, semi-enclosed courtyard; the courtyard is approximately 19.4 m wide and 32.5 m long, the building is 18.35 m high and the roof slopes 3° towards the courtyard [21]. Each single-loaded classroom is cross-ventilated through two windows in the outer façade and one high-level window on the corridor side. The analysis focuses on a typical classroom of the main wing (floor level +3.90 m), whose geometry, openings, internal gains and envelope properties are listed in Table 1. All operable sashes were modeled fully open in all scenarios.
A three-dimensional model replicating the building dimensions was created in SolidWorks and imported into ANSYS DesignModeler, where the building volume was subtracted from the surrounding air domain by a Boolean operation [14,29]. Four orientation scenarios were analyzed. In the 0° case the prototype is aligned with the prevailing August wind, so that the wind is incident normal to the classroom openings of the main wing; in the 15°, 30° and 45° cases the building is rotated towards the northwest by the stated angle. This range covers the orientations recommended for courtyards in hot-arid climates [15,16,17,18] and the rotations that plot constraints commonly impose in practice.
2.4. Governing Equations and Turbulence Modeling
The flow was treated as three-dimensional, incompressible, fully turbulent and non-isothermal. The orientation scenarios were solved with the steady RANS equations closed by an eddy-viscosity model [30,31,32]. Mass and momentum conservation read:
where the last term represents thermal buoyancy in the Boussinesq approximation. Heat transfer in the air is governed by the energy equation, which includes molecular and turbulent diffusion and the internal heat sources [7,33]:
Radiative exchange, including solar loading of the envelope, was represented by the radiative transfer equation [32]:
Because the orientation scenarios are steady, the time-derivative terms are omitted from Equations (1)–(3). They were retained only for the 24-h validation case (Section 2.7), which was solved as an unsteady RANS (URANS) simulation with time-varying outdoor boundary conditions. Three two-equation closures were compared in the validation: the standard k–ε model [34], the realizable k–ε model [35] and the shear stress transport (SST) k–ω model [36].
2.5. Boundary Conditions and Solver Settings
The boundary conditions follow established best-practice guidelines for CFD in the built environment [29,37,38] and are summarized in Table 2. The approach-flow profile accounts for the atmospheric boundary layer (ABL) and was implemented with a user-defined function using the logarithmic law [39,40]:
where κ = 0.42, z0 = 0.5 m represents the average roughness of the urban terrain around the site, Uref = 3.13 m/s and Href = 10 m. The turbulence intensity, turbulent kinetic energy and dissipation rate profiles were prescribed as [39,41]:
with I10 = 0.39 and α = 0.44 [42] and Cμ = 0.09 [34,39]. The pressure-based coupled solver was used with second-order upwind discretization of all transport equations. Convergence was accepted when the scaled residuals fell below 10−6 for continuity and 10−7 for the momentum, turbulence and energy equations and the monitored classroom-averaged air speed and temperature no longer changed. Each orientation case required about 6 h on a workstation with an Intel Core i9-9900K processor and 64 GB of RAM.
2.6. Computational Domain, Mesh and Verification
The computational domain was sized in proportion to the building height H following CFD guidelines [29,37,43]: it extends 5H upstream and laterally, 8H above the roof and 20H downstream (Figure 4a), giving 540 m × 260 m × 180 m and a blockage ratio of 1.18%, well below the commonly recommended maximum of 3% [32,44]. The domain was discretized with unstructured polyhedral cells, refined towards the building surfaces, façade edges, window openings and roof interfaces, with inflation layers along the walls (Figure 4b, c; Table 3).
Grid sensitivity was assessed for the 0° case with four grids of 2,638,583, 4,559,500, 7,878,800 and 13,614,600 cells, obtained by reducing the near-wall face size from 0.7 m to 0.5, 0.3 and 0.1 m under otherwise identical settings. The static pressure along a vertical line at the center of the classroom (0–3.3 m) was used as the comparison variable because it is sensitive to the pressure field that drives cross-ventilation (Figure 5). The global refinement ratio between successive grids, r = (Nfine∕Ncoarse)1/3, is 1.20. This is below the value of 1.3 recommended by Celik et al. [46]; the recommendation is based on experience rather than a formal requirement, and the large cell counts made a constant ratio of 1.3 or more over three levels impractical. The grid convergence index (GCI) of the finer pair was therefore complemented by a two-grid estimate between the 4.56 and 13.61 million-cell grids, whose ratio (r = 1.44) satisfies the recommendation [46,47]:
The coarsest grid deviated from the finest by up to 14.4% (mean 5.4%), whereas the three finer grids agreed to within 2.9% (mean below 1.5%), and the selected 7.88 million-cell grid differed from the finest by at most 0.86% (mean 0.50%). Because the differences between the three finer grids change sign along the line, convergence is oscillatory and the apparent order cannot be estimated reliably; following Stern et al. [45], the numerical uncertainty was therefore taken as half the range of the three solutions, i.e. 0.05 Pa (0.54%) for the line-averaged pressure and at most 1.45% at any point. The conservative two-grid GCI (Fs = 3, p = 2) between the 4.56 and 13.61 million-cell grids averages 2.9% (maximum 5.7%). Further refinement would therefore not materially change the results, and the 7.88 million-cell grid was adopted as a balance between accuracy and cost.
2.7. Validation
Validation was performed at two levels. For the airflow, the same modeling framework (domain proportions, ABL inlet profile, polyhedral meshing and realizable k–ε closure) had previously been validated by Qataya et al. [21] against wind-tunnel pressure coefficients and velocities for a courtyard building [48], with a mean deviation of 3.14% in the pressure coefficient and a maximum deviation of 4.39% in velocity. For the thermal field, which governs the comfort results of the present study, the model was compared with indoor air temperatures measured continuously over 24 h on 21 August in a naturally ventilated classroom of a GAEB school reported by Mohamed [5] and Mohamed and Gado [6]. The validation model reproduced the geometry of the measured classroom and used hourly outdoor air temperature, solar radiation, wind speed and direction for the reference day, together with the internal gains of the occupied classroom; the meteorological inputs were compiled from public climate databases [27]. The case was solved as a URANS simulation over 24 h, and the predicted classroom-averaged air temperature was compared with the measurements for each turbulence model.
Agreement was quantified with the mean absolute error (MAE), the root-mean-square error (RMSE), the mean bias error (MBE), the mean absolute percentage error (MAPE), the coefficient of determination (R2) and the maximum absolute error, evaluated at the 110–111 measurement times covered by each simulation (Table 4, Figure 6). The realizable k–ε model gave the best overall agreement (RMSE 0.31 K, MAPE 0.73%, R2 = 0.992), followed by the SST k–ω model (RMSE 0.40 K), which had the smallest bias, whereas the standard k–ε model overpredicted the night-time and early-morning temperatures (MBE +0.54 K, RMSE 0.81 K). The better performance of the realizable model is consistent with its improved treatment of separated and recirculating flows, in which the standard k–ε model tends to overproduce turbulent kinetic energy [14,35]. The realizable k–ε model was therefore adopted for the orientation study.
This validation has limitations that must be stated explicitly. The measurements and the simulations do not refer to identical meteorological conditions, because the hourly boundary conditions were reconstructed from climate databases rather than recorded at the site during the measurement; only air temperature was measured, so indoor air speeds, pressure distributions and air-change rates could not be validated directly; and the validation was transient whereas the parametric study is steady. The comparison should therefore be regarded as a trend validation that demonstrates the ability of the model to reproduce the magnitude and diurnal evolution of classroom air temperature, complemented by the airflow validation of the same framework against wind-tunnel data. The implications of these limitations are assessed in Section 3.4 and Section 4.4.
2.8. Ventilation and Comfort Indicators
Air speeds and temperatures were area-averaged on the working plane (0.6 m above the floor) and on the plane at mid-height of the windows (2.15 m), and volume-averaged over the classroom. Ventilation performance was characterized by the mean velocity ratio MVR = Ūroom∕Uref, by a velocity-based equivalent air-change rate, by the volume-averaged turbulence intensity (TI) and by the stagnant fraction of the classroom volume, defined as the share of the volume in which the air speed is below 0.1 m/s:
where Aop = 3.98 m2 is the total operable opening area and V = 131.4 m3 is the classroom volume. ACHe is an index proportional to Ūroom rather than the volume flow through the openings; it is reported because it expresses the classroom air movement in the familiar units of an air-change rate, but its absolute values should not be compared with measured air-change rates. Ventilation effectiveness in the sense of the local mean age of air [49] was not computed and is discussed as a limitation.
Thermal comfort was evaluated primarily with the adaptive model of ASHRAE Standard 55-2023 [50,51], which is applicable to occupant-controlled, naturally conditioned spaces:
with acceptability limits of ±3.5 K (80%) and ±2.5 K (90%) around tcmf for 10 °C ≤ tpma ≤ 33.5 °C. For tpma = 29.2 °C, the comfort temperature is 26.85 °C and the 80% and 90% upper limits are 30.35 °C and 29.35 °C; these limits are identical to those of the CBE Thermal Comfort Tool [52]. When the operative temperature exceeds 25 °C, the standard allows the upper limits to be raised by 1.2, 1.8 and 2.2 K for average air speeds of 0.6, 0.9 and 1.2 m/s, which was used to determine the air speed needed to restore compliance. Because the radiant temperature field was not exported, the operative temperature was approximated by the air temperature. To address local and heat-balance aspects of comfort, the predicted mean vote (PMV), the predicted percentage of dissatisfied (PPD) and the standard effective temperature (SET) were computed according to ASHRAE 55-2023, including the SET-based cooling effect of elevated air speed, for seated students (1.2 met), a summer school uniform (0.5 clo), a relative humidity of 47% and a relative air speed vr = v + 0.3(M − 1) [50], using the pythermalcomfort library [53]. The PMV of ISO 7730 [54] is not defined for air temperatures above 30 °C and was not used. The vertical air-temperature difference between the working plane and the mid-window plane was compared with the limit of 3 K between head and ankle height for seated occupants [50,54]; the ISO 7730 draught model is valid only between 20 and 26 °C and is not relevant at the temperatures found here, where air movement is desired rather than a source of discomfort [50,55].
tcmf = 0.31 tpma + 17.8
To judge whether differences between orientations are meaningful, two sources of uncertainty were considered: the numerical uncertainty from the grid study (Section 2.6) and the model uncertainty from the validation, taken as the RMSE of the adopted model. Because the scenarios share the same model, part of the model error is systematic and cancels in differences; treating the errors of two scenarios as independent gives a conservative uncertainty of √2 × 0.31 ≈ 0.44 K for temperature differences. The sensitivity of the classroom temperature to occupancy was estimated with a first-order steady heat balance:
where N is the number of students, qs = 70 W is the sensible heat gain of a seated person [56] and Q = ACHeV/3600; because ACHe is only an index of the flow through the classroom, a factor-of-two uncertainty in Q was also considered. Finally, the robustness of the comfort results to climate change was screened with a delta approach: the regional warming ΔT projected by the multi-model median of the Coupled Model Intercomparison Project Phase 6 (CMIP6) for North Africa [57,58] was added to both tpma and the classroom temperatures of each scenario, which assumes that the free-running indoor temperature follows the outdoor temperature one-to-one while wind, gains and envelope remain unchanged.
2.9. Software and Post-Processing
The geometry was prepared in SolidWorks and ANSYS DesignModeler, and the simulations were run in ANSYS Fluent 2022. Area- and volume-averaged quantities were exported from ANSYS Fluent. The error statistics, comfort indices (computed with the pythermalcomfort package, version 4.6.1 [53]), uncertainty estimates and screening analyses were computed in Python 3 and reproduced with spreadsheet formulas in Table S1 (Supplementary Materials). Generative AI was used in the research process as follows: the Python post-processing scripts were drafted with the assistance of a large language model (Claude, Anthropic), and all calculations were checked by the authors against the spreadsheet implementation. The scripts are available from the corresponding author on request.
3. Results
3.1. Airflow and Temperature Patterns
Figure 7 shows the air speed, streamlines and air temperature on the working plane and at mid-window height. At 0°, the airflow is well organized at both heights, with two coherent jets entering through the façade windows, limited vortex formation and sustained air speeds in the occupied zone; the temperature field is correspondingly uniform, with the lowest values of all cases. A rotation of 15° introduces localized vortices near the inlets and slightly curves the jets, but penetration and air speeds remain close to the aligned case and the temperature rises only locally. At 30°, flow coherence deteriorates markedly: the jets are deflected towards one side wall, two large recirculation cells occupy the center and the leeward part of the room, and warmer zones develop in the central and leeward regions. The 45° case shows the strongest degradation, with a single large vortex, extensive low-speed regions and a pronounced hot zone in the leeward half of the classroom.
The three-dimensional renderings and vertical sections (Figure 8) confirm that air enters predominantly through the windward windows and forms a jet that crosses the depth of each classroom before leaving through the high-level corridor window. At 0°, the jets are strongest and most uniform over the five floors, and stagnant zones are limited. With increasing rotation, the jets weaken and shorten, recirculation expands towards the interior, and the differences between floors increase because the pressure distribution on the façade becomes less uniform; at 30° and 45° the upper floors are most affected. The temperature renderings show the corresponding progression from a uniformly cool building at 0° to large hot regions at 45°.
3.2. Quantitative Ventilation Performance
Table 5 and Figure 9 summarize the mean air speeds and temperatures. The aligned case gives the highest air speed at all three levels, with a volume-averaged value of 0.436 m/s. Relative to 0°, the volume-averaged air speed falls by 19.0%, 29.4% and 28.4% at 15°, 30° and 45°, and the working-plane air speed by 9.4%, 23.9% and 13.6%. In contrast, the mean air temperature rises monotonically with rotation, by 1.51, 2.65 and 4.03 K for the classroom volume and by 1.19, 2.44 and 3.26 K on the working plane. All classroom temperatures exceed the outdoor mean of 29.2 °C, by 1.4 K (working plane, 0°) to 6.0 K (classroom volume, 45°), reflecting solar and internal gains that the wind-driven flow removes only partially.
The ventilation indicators in Table 6 show the same ranking. The mean velocity ratio decreases from 0.139 at 0° to 0.098–0.100 at 30–45°, and ACHe from 47.5 to 33.5–34.0 h−1. Although the 45° case has a slightly higher mean air speed than the 30° case (+1.4%), this does not translate into better ventilation: its turbulence intensity (30%) and stagnant fraction (48% of the volume) are the highest of all cases, and its temperatures are the highest. The higher mean speed at 45° is produced by localized jetting near the openings rather than by flow through the occupied zone, which shows that the mean air speed alone is an incomplete indicator of ventilative cooling.
3.3. Thermal Comfort
Table 7 and Figure 10 present the comfort indicators. None of the orientations satisfies the 80% acceptability limit of the adaptive model (30.35 °C) at the prevailing air speeds. The aligned case comes closest, exceeding the limit by 0.77 K for the classroom volume and 0.24 K on the working plane, whereas the 15°, 30° and 45° cases exceed it by 2.27, 3.41 and 4.80 K (classroom volume). Because all mean air speeds are below 0.6 m/s, the elevated-air-speed provision of ASHRAE 55 does not apply to the simulated conditions. If ceiling fans raised the average air speed to 0.6 m/s, the upper limit would increase to 31.55 °C and the aligned case would comply. The 15° case would require about 0.9 m/s for the working plane but would still exceed the limit for the classroom volume at 1.2 m/s, by 0.07 K; the 30° and 45° cases cannot be brought into compliance by air movement alone and would additionally need reductions of 1.2 K and 2.6 K in the classroom temperature, respectively.
The heat-balance indices give a consistent picture. Even with the SET-based cooling effect of the simulated air speeds, the PMV ranges from +1.0 (slightly warm, PPD 27%) at 0° to +2.5 (warm to hot, PPD 92%) at 45°, and the SET increases from 28.4 to 33.0 °C. Varying the relative humidity between 40% and 60% changes the PMV by −0.1 to +0.3 units without altering the ranking. The PMV is known to overestimate warm discomfort in naturally ventilated buildings, where occupants adapt [51], so these values should be read as a comparative rather than an absolute measure. Vertical air-temperature differences between the working plane and the mid-window plane are small (0.18–0.71 K over 1.55 m) and far below the 3 K limit for seated occupants, so stratification is not a source of local discomfort in any case; draught is not a concern at these temperatures. The dominant comfort issue is therefore whole-body warmth, which increases systematically with misalignment.
3.4. Uncertainty and Occupancy Sensitivity
The temperature differences between adjacent orientations (1.51, 1.14 and 1.39 K for the classroom volume) are 2.6–3.4 times the conservative uncertainty of 0.44 K, and the difference between the aligned and the 45° case (4.03 K) is more than nine times larger, so the temperature ranking 0° < 15° < 30° < 45° is robust. For air speed, the numerical uncertainty (at most 1.45%) is much smaller than the differences of 19–29% between the aligned case and the rotated cases, which are therefore considered resolvable. The 1.4% difference between the 30° and 45° cases is within the combined uncertainty and should not be interpreted as a real difference; because air speed was not validated directly, the velocity results are interpreted comparatively rather than in absolute terms.
Equation (13) gives a sensitivity of 0.034 K per student at 0° and 0.042–0.049 K per student for the rotated cases. A change of ±10 students (30–50 students, i.e. ±25%) therefore shifts the classroom temperature by ±0.34–0.49 K, or by ±0.69–0.97 K if the effective flow rate is half the ACHe-based value. Because the shift has the same sign for all orientations, the differences between scenarios change by less than 0.15 K, and the ranking is unaffected. Reduced occupancy does not remove the comfort deficit either: with 30 students the aligned case would still reach about 30.8 °C, above the 80% limit.
4. Discussion
4.1. Contribution and Transferable Findings
The results confirm, for a nationally replicated school prototype, the dominant influence of wind incidence on cross-ventilation reported for generic buildings and courtyards [9,15,21], and they add three findings that extend beyond the specific case. First, misalignment carries a quantifiable thermal penalty: on average, each 15° of rotation away from the prevailing wind raised the mean classroom temperature by about 1.3 K (1.1 K on the working plane) and reduced the mean air speed by up to 29%. For an agency that builds a prototype on many plots, this penalty provides a simple basis for siting rules and for deciding when compensating measures are needed. Second, air-speed metrics alone can misrank orientations: the 45° case had a higher mean air speed than the 30° case but the highest temperatures, because its additional air movement was concentrated in jets near the openings while large stagnant zones persisted. Orientation studies that report only airflow indicators may therefore misjudge comfort, which supports coupling the airflow with the thermal field and with comfort indices, as done here. Third, orientation is necessary but not sufficient: even the aligned case remained 0.8 K above the adaptive 80% limit in peak summer, consistent with overheating reported for naturally ventilated schools in warm climates [6,59].
These findings are derived from a single prototype and climate, but the mechanisms behind them, namely the loss of façade pressure difference and jet penetration with oblique incidence and the persistence of a comfort deficit under high solar and internal gains, are generic. They are therefore expected to apply qualitatively to other single-loaded, cross-ventilated classroom wings in hot-arid climates, while the numerical values should be re-evaluated for other prototypes, sites and wind regimes (Section 4.4).
4.2. Mitigation for Sub-Optimal Orientations
Urban plots often make the ideal orientation unattainable, so measures that compensate for misalignment are needed. The comfort analysis indicates the size of the required effect. Elevated air movement from ceiling fans is the most direct measure: ASHRAE 55 credits 1.2–2.2 K of additional acceptable temperature for average air speeds of 0.6–1.2 m/s [50], at an energy cost far below that of air conditioning [55]. This is sufficient for the aligned case and nearly sufficient for the 15° case, but the 30° and 45° cases additionally require the heat gains to be reduced enough to lower the classroom temperature by about 1.2–2.6 K. Measures that restore wind capture at oblique incidence, such as wing walls beside the windows [8,60], windcatchers and window-windcatchers [33,44,61,62,63] and larger, adjustable inlet openings [7], can partly recover the lost pressure difference. Gains can be reduced by external shading of the façade windows, roof insulation and improved glazing, which retrofit studies of Egyptian schools have shown to be effective [4]. Automated or scheduled window operation can help to maintain the intended opening area during occupancy [64]. Quantifying the combined effect of these measures for the rotated cases is a natural extension of this work.
4.3. Implications Under Projected Warming
Table 8 and Figure 11 show the screening of the comfort deficit under projected warming. The CMIP6 multi-model median for North Africa projects an annual warming of 1.8 K (SSP2-4.5) and 2.2 K (SSP5-8.5) for 2030–2059 and of 2.7 K and 5.0 K for 2070–2099 relative to 1981–2010 [57], and national analyses for Egypt project comparable increases in temperature extremes [58]. Because the adaptive limit rises by only 0.31 K per kelvin of outdoor warming while the free-running indoor temperature rises by about 1 K, the exceedance grows by about 0.69 K per kelvin of warming. For the aligned case, fans providing 1.2 m/s would maintain compliance up to about 2.1 K of warming, i.e. approximately to the 2030–2059 median under SSP2-4.5 but not under SSP5-8.5; the rotated cases already exceed this margin under the current climate. Under SSP5-8.5 at the end of the century the prevailing mean outdoor temperature (34.2 °C) exceeds the range of applicability of the adaptive model, indicating that free-running operation alone could no longer be assessed with, let alone satisfy, the adaptive criterion.
This screening is deliberately simple: it assumes unchanged wind conditions and a one-to-one transfer of outdoor warming indoors, and it uses annual-mean projections, whereas summer warming in the region is projected to be larger (6.2 K in June–August under SSP5-8.5 by 2070–2099 [57]). It is therefore likely to be optimistic. A full assessment would repeat the CFD and comfort analysis with morphed future weather files, as done for naturally ventilated schools in Southern Europe [59]. Nevertheless, the screening shows that an orientation-only strategy has little resilience to warming and that combined measures should be planned now.
4.4. Limitations and Scope of Applicability
Steady RANS modeling. Natural wind is unsteady, and steady RANS does not capture transient features such as the flapping of the incoming jet, gusts and the turbulent exchange through openings; in cross-ventilation it underestimates the turbulent kinetic energy, whereas large-eddy simulation (LES) reproduces mean and fluctuating quantities better at a computational cost about 80–100 times higher [13,65,66]. Steady RANS therefore tends to overestimate the stability and coherence of the jets and to underestimate the exchange by fluctuations, particularly at oblique incidence, where the mean pressure difference is small. Accordingly, the absolute ventilation at 30° and 45° may be somewhat underestimated and the penalty of misalignment somewhat overstated, but the ranking, which is driven by large differences in mean pressure difference and jet penetration, is expected to hold. The use of monthly-mean wind conditions also neglects the variability of wind speed and direction; URANS or LES with time-varying inflow would quantify these effects.
Validation. As discussed in Section 2.7, the thermal validation is a trend validation for air temperature only, based on measurements in a different period and with reconstructed boundary conditions, and the airflow validation relies on wind-tunnel data for a generic courtyard building. On-site measurements of indoor air speed, pressure difference across the openings and carbon dioxide-based air-change rates in the case-study classroom would strengthen the predictive capability of the model and would allow the velocity-based ventilation index to be replaced by measured flow rates.
Isolated building. The building was simulated without neighboring buildings, vegetation or local obstructions. Sheltering by surrounding buildings reduces façade pressure differences and cross-ventilation rates [67,68], and building arrangement and density strongly affect natural ventilation potential [10,11]. The results therefore represent an upper bound for open, suburban sites; in dense urban settings the absolute ventilation will be lower and the effective wind direction at the façade may differ from the meteorological one [9], so site-specific analysis is recommended.
Windows and occupants. All operable sashes were assumed fully open, which is also an upper bound. In practice the opening angle and duration depend on noise, dust, security and teachers' preferences [64,69]. Since the flow through an opening scales approximately with its effective area [7], partially open windows would reduce the ventilation of all orientations and increase classroom temperatures, which would further increase the need for fans and gain reduction. Occupancy was fixed at 40 students with constant metabolic heat; the first-order sensitivity in Section 3.4 indicates shifts of ±0.3–1.0 K for ±25% occupancy, and the obstruction of the flow by occupants and furniture was represented only through the furniture geometry.
Comfort assessment. The operative temperature was approximated by the air temperature, which underestimates the operative temperature where internal surfaces are warmer than the air. The adaptive model was derived mainly from adult occupants, whereas children have been found to feel warmer and to prefer cooler conditions than the model predicts [70]. Classroom temperatures of 30–35 °C are objectively warm for learning, and moderately raised classroom temperatures reduce the performance of schoolwork [1]; the comfort deficits reported here are therefore likely to be conservative estimates of the real problem.
Scope. The quantitative results apply directly to the investigated GAEB prototype, to the climate of Cairo and the Nile Delta and to the August mean wind from 350°. Only one classroom position was analyzed in detail; classrooms on other floors and in the side wings, other GAEB prototypes and other climatic regions of Egypt may respond differently and should be assessed individually before the findings are generalized.
5. Conclusions
This study quantified how courtyard orientation controls the ventilation and summer comfort of classrooms in a standardized Egyptian school prototype, using validated non-isothermal CFD, a multi-metric comfort assessment and explicit uncertainty bounds. Its main implications are:
- Aligning the courtyard with the prevailing summer wind is the most effective no-cost passive measure for this prototype. Misalignment carries a thermal penalty of about 1.1–1.3 K per 15° of rotation and a loss of up to about 30% in classroom air movement, both exceeding the estimated model uncertainty, so orientation should be treated as a performance-critical parameter when standardized prototypes are sited.
- Mean air speed alone is not a reliable indicator of ventilative cooling. The distribution of the flow, and in particular the extent of stagnant zones, determines whether air movement removes heat from the occupied zone, so orientation studies should couple airflow with the thermal field and with comfort indices.
- Good orientation does not by itself deliver acceptable summer comfort in a hot-arid climate. The aligned classroom requires ceiling fans that raise the air speed to at least 0.6 m/s, and classrooms rotated by 30–45° additionally require substantial reductions in solar and internal heat gains; prototype specifications should combine orientation guidance with ceiling fans, external shading, roof insulation and devices that recover wind capture at oblique incidence.
- The combined benefit of orientation and fans would be exhausted at about 2 K of regional warming, within the range projected for the middle of the century, so school prototypes should be designed for projected rather than current climate.
- Future work should repeat the analysis with time-resolved or scale-resolving simulations, surrounding buildings, measured indoor air speeds and air-change rates, morphed future weather data and further classroom positions and prototypes.
Supplementary Materials
The following supporting information can be downloaded at the website of this paper posted on Preprints.org, Table S1: Post-processed simulation results, validation data and calculations of the error metrics, comfort indices, uncertainty, occupancy sensitivity and warming screening (spreadsheet).
Author Contributions
Conceptualization, M.A.M. and R.S.Q.; methodology, R.S.Q. and M.A.M.; software, R.S.Q.; validation, R.S.Q. and M.A.M.; formal analysis, R.S.Q.; investigation, R.S.Q.; data curation, R.S.Q.; writing—original draft preparation, R.S.Q.; writing—review and editing, M.A.M., H.A. and S.S.; visualization, R.S.Q.; supervision, M.A.M., H.A. and S.S. All authors have read and agreed to the published version of the manuscript.
Funding
The authors would like to acknowledge the Research and Consultancy Institute at Effat University for funding the APC of this paper.
Institutional Review Board Statement
Not applicable.
Informed Consent Statement
Not applicable.
Data Availability Statement
The original contributions presented in this study are included in the article and its Supplementary Materials (Table S1). Further inquiries can be directed to the corresponding author.
Acknowledgments
The authors would like to acknowledge the Research and Consultancy Institute at Effat University for funding the APC of this paper.
Conflicts of Interest
The authors declare no conflicts of interest.
Nomenclature
The following symbols and abbreviations are used in this manuscript:
| a | Absorption coefficient (m−1) |
| ACHe | Velocity-based equivalent air-change rate (h−1) |
| Aop | Total operable opening area (m2) |
| Cμ | Turbulence model constant (−) |
| cp | Specific heat capacity of air (J kg−1 K−1) |
| Fs | Safety factor of the grid convergence index (−) |
| gi | Gravitational acceleration in direction i (m s−2) |
| GCI | Grid convergence index (%) |
| Href | Reference height of the wind measurement (10 m) |
| I | Radiative intensity (W m−2 sr−1) |
| Iu, I10 | Turbulence intensity at height z and at 10 m (−) |
| k | Turbulent kinetic energy (m2 s−2) |
| MVR | Mean velocity ratio (−) |
| N | Number of occupants (−) or number of grid cells (−) |
| n | Refractive index (−) |
| p | Static pressure (Pa); apparent order of convergence in Equation (10) |
| PMV, PPD | Predicted mean vote (−) and predicted percentage of dissatisfied (%) |
| Prt | Turbulent Prandtl number (−) |
| Q | Volumetric ventilation flow rate (m3 s−1) |
| qs | Sensible heat gain per occupant (W) |
| r | Grid refinement ratio (−) |
| RMSE, MAE, MBE, MAPE | Root-mean-square, mean absolute, mean bias and mean absolute percentage errors |
| SET | Standard effective temperature (°C) |
| Sh | Volumetric heat source (W m−3) |
| T, T0 | Air temperature and reference temperature (K) |
| tcmf, tpma | Adaptive comfort temperature and prevailing mean outdoor air temperature (°C) |
| ui | Mean velocity component in direction i (m s−1) |
| Uref, Ūroom | Reference wind speed at Href and volume-averaged classroom air speed (m s−1) |
| u*ABL | Atmospheric boundary layer friction velocity (m s−1) |
| V | Classroom volume (m3) |
| z, z0 | Height above ground and aerodynamic roughness length (m) |
| α | Power-law exponent of the turbulence intensity profile (−) |
| β | Thermal expansion coefficient (K−1) |
| ε | Turbulence dissipation rate (m2 s−3) |
| κ | von Kármán constant (−) |
| λ | Thermal conductivity (W m−1 K−1) |
| μt, ν, νt | Turbulent dynamic viscosity (Pa s); kinematic and turbulent kinematic viscosities (m2 s−1) |
| ρ | Air density (kg m−3) |
| σ, σs | Stefan–Boltzmann constant (W m−2 K−4) and scattering coefficient (m−1) |
| Φ, Ω′ | Scattering phase function (−) and solid angle (sr) |
| ABL, CFD, RANS, URANS, LES | Atmospheric boundary layer; computational fluid dynamics; (unsteady) Reynolds-averaged Navier–Stokes; large-eddy simulation |
| GAEB, EPW, SST, TI | General Authority for Educational Buildings; EnergyPlus weather file; shear stress transport; turbulence intensity |
References
- Wargocki, P.; Wyon, D.P. The effects of moderately raised classroom temperatures and classroom ventilation rate on the performance of schoolwork by children (RP-1257). HVAC&R Res. 2007, 13, 193–220. [Google Scholar] [CrossRef]
- Zomorodian, Z.S.; Tahsildoost, M.; Hafezi, M. Thermal comfort in educational buildings: a review article. Renew. Sustain. Energy Rev. 2016, 59, 895–906. [Google Scholar] [CrossRef]
- General Authority for Educational Buildings (GAEB). School Prototypes after the Earthquake; Ministry of Education: Cairo, Egypt, 2023. [Google Scholar]
- Anber, M.F. Thermal retrofitting of primary school buildings in Egypt: optimizing energy efficiency and thermal comfort. Int. Des. J. 2022, 12, 325–337. [Google Scholar] [CrossRef]
- Mohamed, M. Investigating the Environmental Performance of Government Primary Schools in Egypt: With Particular Concern to Thermal Comfort. Ph.D. Thesis, University of Dundee, Dundee, UK, 2009. Available online: https://discovery.dundee.ac.uk/en/studentTheses/investigating-the-environmental-performance-of-government-primary/ (accessed on 13 October 2026).
- Mohamed, M.; Gado, T. Assessment of thermal comfort inside primary governmental classrooms in hot dry climates part I: a case study from Egypt. In Proceedings of the SUE-MoT 2009: Second International Conference on Whole Life Urban Sustainability and Its Assessment, Loughborough, UK; Horner, M., Price, A., Bebbington, J., Emmanuel, R., Eds.; Loughborough University: Loughborough, UK, 2009. pp. 979–990.
- Awbi, H.B. Ventilation of Buildings, 2nd ed.; Spon Press: London, UK, 2003. [Google Scholar]
- Givoni, B. Passive and Low Energy Cooling of Buildings; Van Nostrand Reinhold: New York, NY, USA, 1994. [Google Scholar]
- Lee, K.Y.; Mak, C.M. Effects of different wind directions on ventilation of surrounding areas of two generic building configurations in Hong Kong. Indoor Built Environ. 2022, 31, 414–434. [Google Scholar] [CrossRef]
- Zhong, Y.; Yin, W.; Li, Y.; Hao, X.; Zhang, S.; Han, Q.; Duan, S. Evaluation of building arrangement on natural ventilation potential in ideal building arrays. J. Asian Archit. Build. Eng. 2023, 22, 3759–3781. [Google Scholar] [CrossRef]
- Buccolieri, R.; Sandberg, M.; Wigö, H.; Di Sabatino, S. The drag force distribution within regular arrays of cubes and its relation to cross ventilation: theoretical and experimental analyses. J. Wind Eng. Ind. Aerodyn. 2019, 189, 91–103. [Google Scholar] [CrossRef]
- Ramponi, R.; Blocken, B. CFD simulation of cross-ventilation for a generic isolated building: impact of computational parameters. Build. Environ. 2012, 53, 34–48. [Google Scholar] [CrossRef]
- van Hooff, T.; Blocken, B.; Tominaga, Y. On the accuracy of CFD simulations of cross-ventilation flows for a generic isolated building: comparison of RANS, LES and experiments. Build. Environ. 2017, 114, 148–165. [Google Scholar] [CrossRef]
- Blocken, B. Computational fluid dynamics for urban physics: importance, scales, possibilities, limitations and ten tips and tricks towards accurate and reliable simulations. Build. Environ. 2015, 91, 219–245. [Google Scholar] [CrossRef]
- Soflaei, F.; Shokouhian, M.; Tabadkani, A.; Moslehi, H.; Berardi, U. A simulation-based model for courtyard housing design based on adaptive thermal comfort. J. Build. Eng. 2020, 31, 101335. [Google Scholar] [CrossRef]
- Hassan, M.H. Ventilated courtyard as a passive cooling strategy in hot desert climates. In Proceedings of the 33rd AIVC Conference, Copenhagen, Denmark, 2012. [Google Scholar]
- Mossad, G.; Ezzat, H.; Talaat, N. Natural ventilation in old Islamic houses: courtyard study in Old Cairo. J. Al-Azhar Univ. Eng. Sect. 2016, 11, 601–615. [Google Scholar] [CrossRef]
- Wazeri, U. Practices on Environmental Architecture: Sunny Design for the Interior Court; Madbouly Press: Cairo, Egypt, 2002. [Google Scholar]
- Antoniadis, D.; Katsoulas, N.; Kittas, C. Simulation of schoolyard's microclimate and human thermal comfort under Mediterranean climate conditions: effects of trees and green structures. Int. J. Biometeorol. 2018, 62, 2025–2036. [Google Scholar] [CrossRef] [PubMed]
- Duan, Z.; Zi, Y.; Wang, L.; Dong, S. Research on the optimization design of natural ventilation in university dormitories based on the healthy building concept: a case study of Xuzhou region. Buildings 2025, 15, 3630. [Google Scholar] [CrossRef]
- Qataya, R.S.; Mohamed, M.A.; AlShanwany, H.; Sabour, S. Optimizing courtyard orientation for wind-driven ventilation in hot-arid climates: a case study from Egypt. EQA Int. J. Environ. Qual. 2024, 63, 26–40. [Google Scholar] [CrossRef] [PubMed]
- Qataya, R.S.; Mohamed, M.A.A.; AlShanwany, H.; Sabbour, S. A framework for enhancing natural ventilation in hot-arid regions: a bioclimatic design approach. Egypt. Int. J. Eng. Sci. Technol. 2024, 46, 39–52. [Google Scholar] [CrossRef]
- Central Agency for Public Mobilization and Statistics (CAPMAS). A.R.E. Annual Bulletin of Pre-University Education 2022/2023. Available online: https://censusinfo.capmas.gov.eg/Metadata-en-v4.2/index.php/catalog/757 (accessed on 13 October 2026).
- Beck, H.E.; Zimmermann, N.E.; McVicar, T.R.; Vergopolan, N.; Berg, A.; Wood, E.F. Present and future Köppen-Geiger climate classification maps at 1-km resolution. Sci. Data 2018, 5, 180214. [Google Scholar] [CrossRef] [PubMed]
- Afandi, G.E. Evaluation of NCEP climate forecast system reanalysis against surface observations over Egypt. Am. J. Sci. Technol. 2014, 1, 157–167. [Google Scholar]
- Mohamed, M.; Gado, T. Application of computer based environmental assessment and optimization tools: an approach for appropriating buildings. In Proceedings of the 3rd International Conference ArchCairo 2006, Cairo, Egypt; Cairo University: Cairo, Egypt, 2006; pp. 592–604. [Google Scholar]
- Climate-Data.org. Cairo Climate (Egypt): Climate Data 1991–2021. Available online: https://en.climate-data.org/africa/egypt/cairo-governorate/cairo-3392/ (accessed on 13 October 2026).
- Taher, A.K. A Parametric Investigation of Natural Ventilation Retrofit Strategies for the Cosmopolitan Heritage Buildings of Alexandria. Ph.D. Thesis, Cardiff University, Cardiff, UK, 2020. Available online: https://orca.cardiff.ac.uk/id/eprint/139812/ (accessed on 13 October 2026).
- Franke, J.; Hellsten, A.; Schlünzen, H.; Carissimo, B. Best Practice Guideline for the CFD Simulation of Flows in the Urban Environment; COST Action 732; University of Hamburg, Meteorological Institute: Hamburg, Germany, 2007. [Google Scholar]
- Serra, N. Revisiting RANS turbulence modelling used in built-environment CFD simulations. Build. Environ. 2023, 237, 110333. [Google Scholar] [CrossRef]
- Bardina, J.E.; Huang, P.G.; Coakley, T.J. Turbulence Modeling Validation, Testing, and Development; NASA Technical Memorandum 110446; NASA Ames Research Center: Moffett Field, CA, USA, 1997. [Google Scholar]
- Tu, J.; Yeoh, G.H.; Liu, C.; Tao, Y. Computational Fluid Dynamics: A Practical Approach, 4th ed.; Butterworth-Heinemann: Oxford, UK, 2023. [Google Scholar]
- Mohamed, M.A.A.; El-Amin, M.F. Inward and outward opening properties of one-sided windcatchers: experimental and analytical evaluation. Sustainability 2022, 14, 4048. [Google Scholar] [CrossRef]
- Launder, B.E.; Spalding, D.B. The numerical computation of turbulent flows. Comput. Methods Appl. Mech. Eng. 1974, 3, 269–289. [Google Scholar] [CrossRef]
- Shih, T.H.; Liou, W.W.; Shabbir, A.; Yang, Z.; Zhu, J. A new k-ε eddy viscosity model for high Reynolds number turbulent flows. Comput. Fluids 1995, 24, 227–238. [Google Scholar] [CrossRef]
- Menter, F.R. Two-equation eddy-viscosity turbulence models for engineering applications. AIAA J. 1994, 32, 1598–1605. [Google Scholar] [CrossRef] [PubMed]
- Tominaga, Y.; Mochida, A.; Yoshie, R.; Kataoka, H.; Nozu, T.; Yoshikawa, M.; Shirasawa, T. AIJ guidelines for practical applications of CFD to pedestrian wind environment around buildings. J. Wind Eng. Ind. Aerodyn. 2008, 96, 1749–1761. [Google Scholar] [CrossRef]
- Building and Construction Authority. Green Mark for Non-Residential Buildings: Technical Guide; Building and Construction Authority: Singapore, 2016. [Google Scholar]
- Richards, P.J.; Hoxey, R.P. Appropriate boundary conditions for computational wind engineering models using the k-ε turbulence model. J. Wind Eng. Ind. Aerodyn. 1993, 46–47, 145–153. [Google Scholar] [CrossRef]
- Monin, A.S. The atmospheric boundary layer. Annu. Rev. Fluid Mech. 1970, 2, 225–250. [Google Scholar] [CrossRef]
- Perén, J.I.; van Hooff, T.; Leite, B.C.C.; Blocken, B. Impact of eaves on cross-ventilation of a generic isolated leeward sawtooth roof building: windward eaves, leeward eaves and eaves inclination. Build. Environ. 2015, 92, 578–590. [Google Scholar] [CrossRef]
- GB 50009-2012; Load Code for the Design of Building Structures. China Architecture & Building Press: Beijing, China, 2012.
- Meroney, R.; Ohba, R.; Leitl, B.; Kondo, H.; Grawe, D.; Tominaga, Y. Review of CFD guidelines for dispersion modeling. Fluids 2016, 1, 14. [Google Scholar] [CrossRef]
- Calautit, J.K.; Hughes, B.R. Wind tunnel and CFD study of the natural ventilation performance of a commercial multi-directional wind tower. Build. Environ. 2014, 80, 71–83. [Google Scholar] [CrossRef]
- Stern, F.; Wilson, R.V.; Coleman, H.W.; Paterson, E.G. Comprehensive approach to verification and validation of CFD simulations, part 1: methodology and procedures. J. Fluids Eng. 2001, 123, 793–802. [Google Scholar] [CrossRef]
- Celik, I.B.; Ghia, U.; Roache, P.J.; Freitas, C.J.; Coleman, H.; Raad, P.E. Procedure for estimation and reporting of uncertainty due to discretization in CFD applications. J. Fluids Eng. 2008, 130, 078001. [Google Scholar] [CrossRef]
- Roache, P.J. Perspective: a method for uniform reporting of grid refinement studies. J. Fluids Eng. 1994, 116, 405–413. [Google Scholar] [CrossRef]
- Prakash, D. Ventilation performance analysis on low-rise courtyard building for various courtyard shape factors and roof topology. Int. J. Vent. 2023, 22. [Google Scholar] [CrossRef]
- Sandberg, M. What is ventilation efficiency? Build. Environ. 1981, 16, 123–135. [Google Scholar] [CrossRef]
- ANSI/ASHRAE Standard 55-2023; Thermal Environmental Conditions for Human Occupancy. ASHRAE: Atlanta, GA, USA, 2023.
- de Dear, R.J.; Brager, G.S. Developing an adaptive model of thermal comfort and preference. ASHRAE Trans. 1998, 104, 145–167. [Google Scholar]
- Tartarini, F.; Schiavon, S.; Cheung, T.; Hoyt, T. CBE Thermal Comfort Tool: online tool for thermal comfort calculations and visualizations. SoftwareX 2020, 12, 100563. [Google Scholar] [CrossRef]
- Tartarini, F.; Schiavon, S. pythermalcomfort: a Python package for thermal comfort research. SoftwareX 2020, 12, 100578. [Google Scholar] [CrossRef]
- ISO 7730:2005; Ergonomics of the Thermal Environment—Analytical Determination and Interpretation of Thermal Comfort Using Calculation of the PMV and PPD Indices and Local Thermal Comfort Criteria. International Organization for Standardization: Geneva, Switzerland, 2005.
- Schiavon, S.; Melikov, A.K. Energy saving and improved comfort by increased air movement. Energy Build. 2008, 40, 1954–1960. [Google Scholar] [CrossRef]
- ASHRAE. ASHRAE Handbook: Fundamentals, SI ed.; American Society of Heating, Refrigerating and Air-Conditioning Engineers: Atlanta, GA, USA, 2021. [Google Scholar]
- Almazroui, M.; Saeed, F.; Saeed, S.; Islam, M.N.; Ismail, M.; Klutse, N.A.B.; Siddiqui, M.H. Projected change in temperature and precipitation over Africa from CMIP6. Earth Syst. Environ. 2020, 4, 455–475. [Google Scholar] [CrossRef]
- Hamed, M.M.; Salehie, O.; Nashwan, M.S.; Shahid, S. Projection of temperature extremes of Egypt using CMIP6 GCMs under multiple shared socioeconomic pathways. Environ. Sci. Pollut. Res. 2023, 30, 38063–38075. [Google Scholar] [CrossRef] [PubMed]
- Heracleous, C.; Michael, A. Assessment of overheating risk and the impact of natural ventilation in educational buildings of Southern Europe under current and future climatic conditions. Energy 2018, 165, 1228–1239. [Google Scholar] [CrossRef]
- Mak, C.M.; Niu, J.L.; Lee, C.T.; Chan, K.F. A numerical simulation of wing walls using computational fluid dynamics. Energy Build. 2007, 39, 995–1002. [Google Scholar] [CrossRef]
- Mohamed, M.; Mohammed, M.F.M. Investigating the environmental performance of the wind catcher in Jeddah. WIT Trans. Built Environ. 2018, 177, 15–26. [Google Scholar] [CrossRef]
- Obeidat, L.M.; Alrebei, O.F.; Ma'bdeh, S.N.; Al-Radaideh, T.; Amhamed, A.I. Parametric enhancement of a window-windcatcher for enhanced thermal comfort and natural ventilation. Atmosphere 2023, 14, 844. [Google Scholar] [CrossRef]
- Alrebei, O.F.; Obeidat, L.M.; Ma'bdeh, S.N.; Kaouri, K.; Al-Radaideh, T.; Amhamed, A.I. Window-windcatcher for enhanced thermal comfort, natural ventilation and reduced COVID-19 transmission. Buildings 2022, 12, 791. [Google Scholar] [CrossRef]
- Stazi, F.; Naspi, F.; Ulpiani, G.; Di Perna, C. Indoor air quality and thermal comfort optimization in classrooms developing an automatic system for windows opening and closing. Energy Build. 2017, 139, 732–746. [Google Scholar] [CrossRef]
- Blocken, B. LES over RANS in building simulation for outdoor and indoor applications: a foregone conclusion? Build. Simul. 2018, 11, 821–870. [Google Scholar] [CrossRef]
- Jiang, Y.; Chen, Q. Study of natural ventilation in buildings by large eddy simulation. J. Wind Eng. Ind. Aerodyn. 2001, 89, 1155–1178. [Google Scholar] [CrossRef]
- Tominaga, Y.; Blocken, B. Wind tunnel experiments on cross-ventilation flow of a generic building with contaminant dispersion in unsheltered and sheltered conditions. Build. Environ. 2015, 92, 452–461. [Google Scholar] [CrossRef]
- Tsutsumi, J.; Katayama, T.; Nishida, M. Wind tunnel tests of wind pressure on regularly aligned buildings. J. Wind Eng. Ind. Aerodyn. 1992, 43, 1799–1810. [Google Scholar] [CrossRef]
- Fabi, V.; Andersen, R.V.; Corgnati, S.; Olesen, B.W. Occupants' window opening behaviour: a literature review of factors influencing occupant behaviour and models. Build. Environ. 2012, 58, 188–198. [Google Scholar] [CrossRef]
- Teli, D.; Jentsch, M.F.; James, P.A.B. Naturally ventilated classrooms: an assessment of existing comfort models for predicting the thermal sensation and preference of primary school children. Energy Build. 2012, 53, 166–182. [Google Scholar] [CrossRef]
Figure 1.
Research workflow, from the definition of the case and the verification and validation of the CFD model to the parametric orientation study, the ventilation and comfort indicators, the robustness analyses and the design guidance.
Figure 1.
Research workflow, from the definition of the case and the verification and validation of the CFD model to the parametric orientation study, the ventilation and comfort indicators, the robustness analyses and the design guidance.
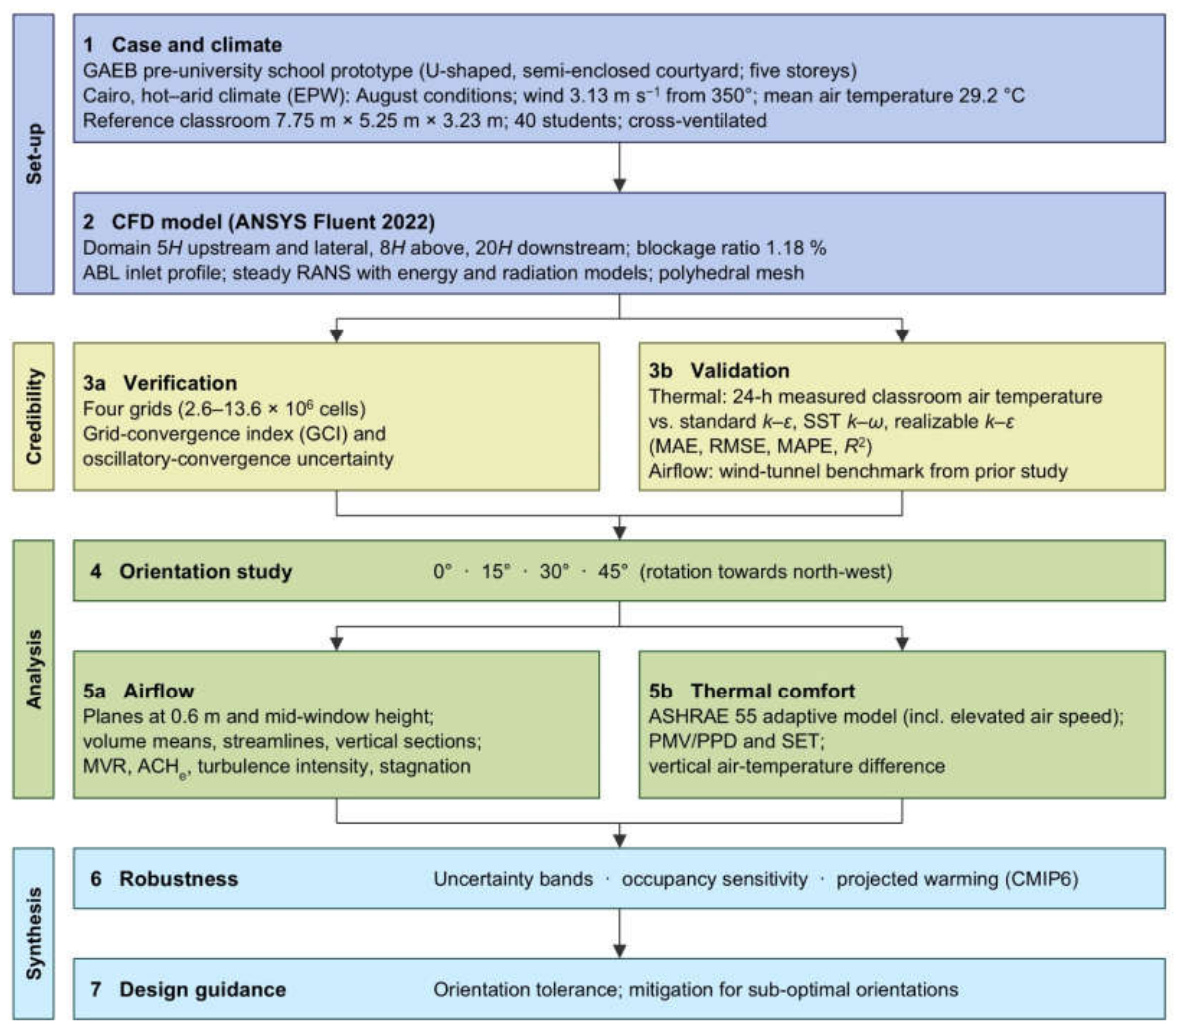
Figure 2.
Monthly mean wind speed (m/s), prevailing wind direction (degrees divided by 10) and air temperature (°C) for Cairo, derived from the EPW weather data used in the study.
Figure 2.
Monthly mean wind speed (m/s), prevailing wind direction (degrees divided by 10) and air temperature (°C) for Cairo, derived from the EPW weather data used in the study.
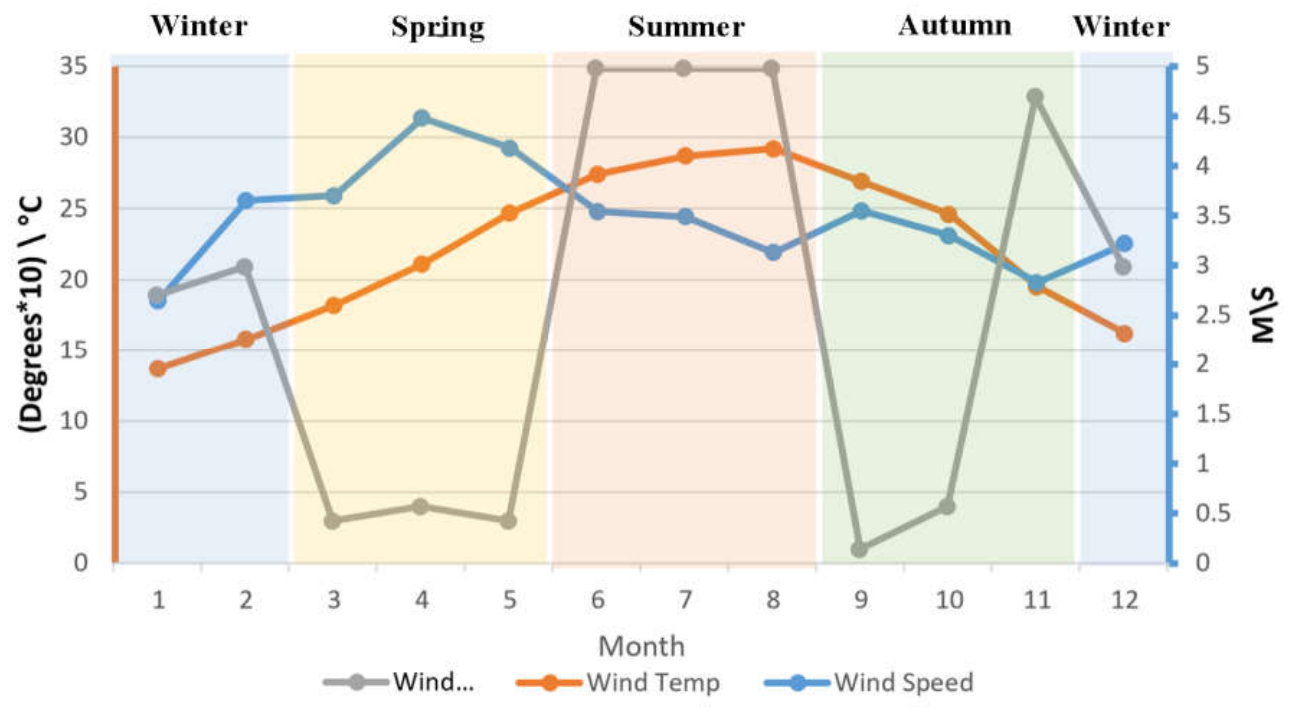
Figure 3.
The GAEB pre-university prototype: a ground-floor plan (dimensions in meters); b three-dimensional view; c cut-away view of the classroom wings and corridors; d cut-away of the main wing showing the stacked classrooms and the open corridor; e furnished classroom; f classroom plan; g classroom section with window and sill heights.
Figure 3.
The GAEB pre-university prototype: a ground-floor plan (dimensions in meters); b three-dimensional view; c cut-away view of the classroom wings and corridors; d cut-away of the main wing showing the stacked classrooms and the open corridor; e furnished classroom; f classroom plan; g classroom section with window and sill heights.
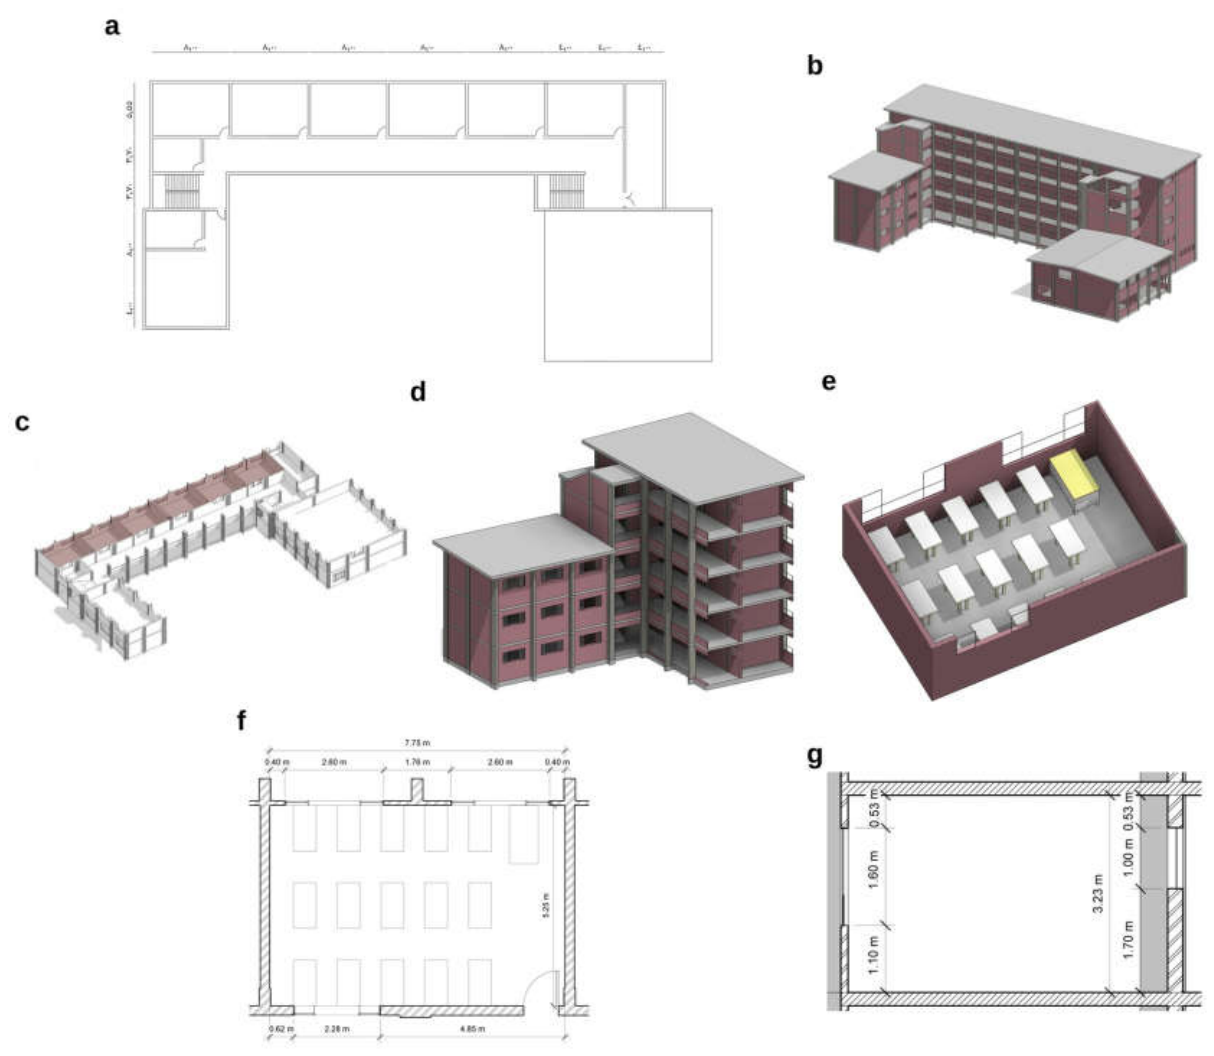
Figure 4.
Computational domain and mesh: a domain dimensions relative to the building height H and boundary conditions; b refinement of the polyhedral mesh around the building and the openings; c near-wall mesh on the classroom façades.
Figure 4.
Computational domain and mesh: a domain dimensions relative to the building height H and boundary conditions; b refinement of the polyhedral mesh around the building and the openings; c near-wall mesh on the classroom façades.
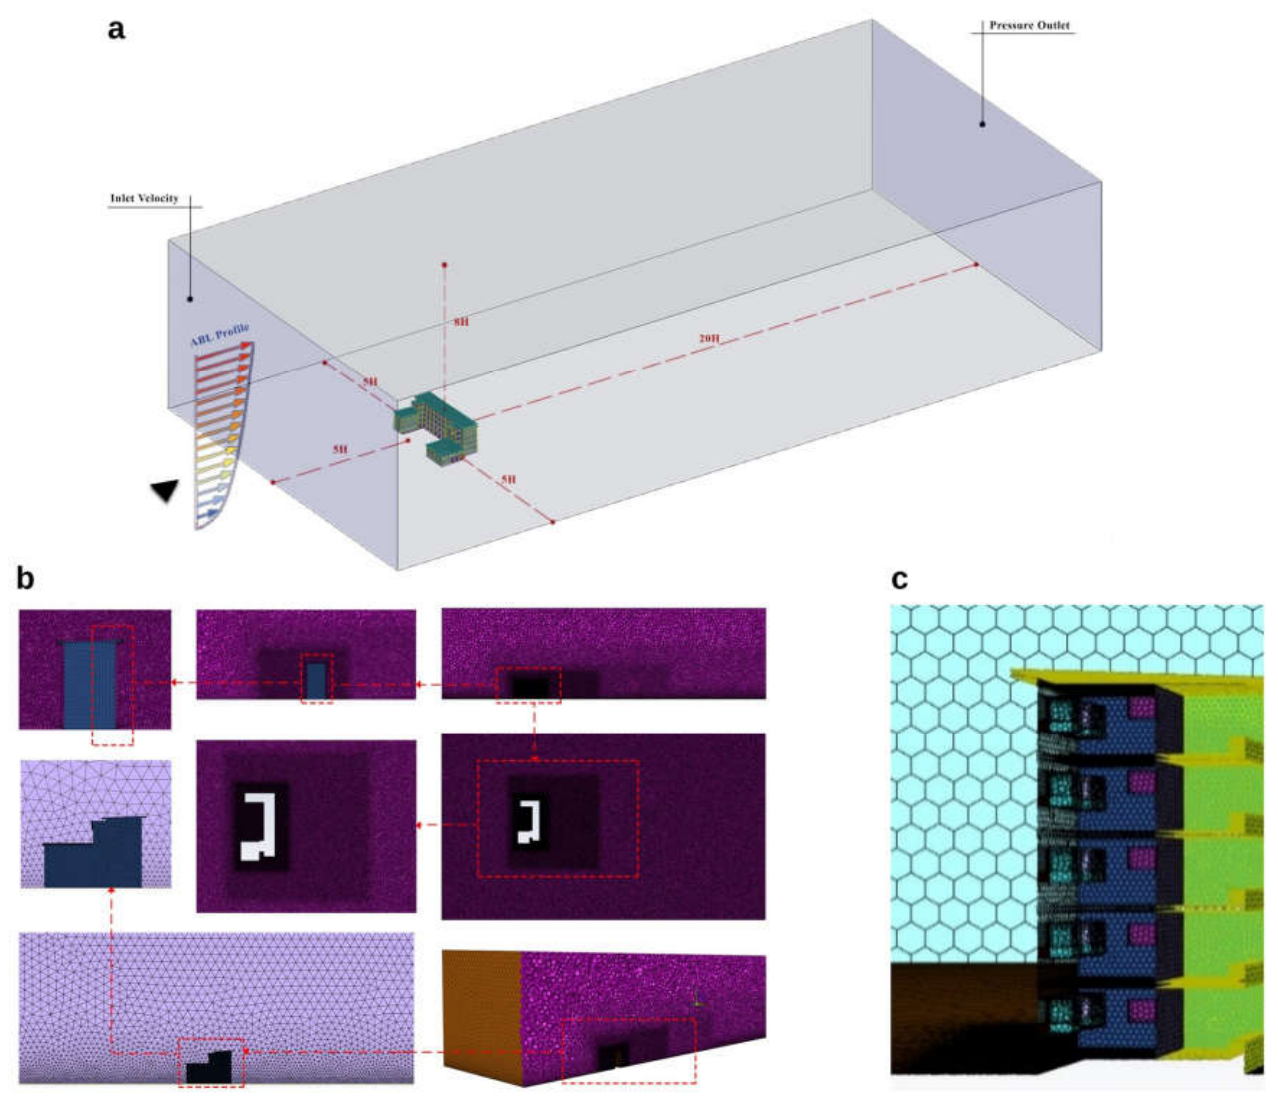
Figure 5.
Grid sensitivity study for the 0° case: a static pressure along the vertical center line of the classroom for the four grids; b location of the monitoring line.
Figure 5.
Grid sensitivity study for the 0° case: a static pressure along the vertical center line of the classroom for the four grids; b location of the monitoring line.
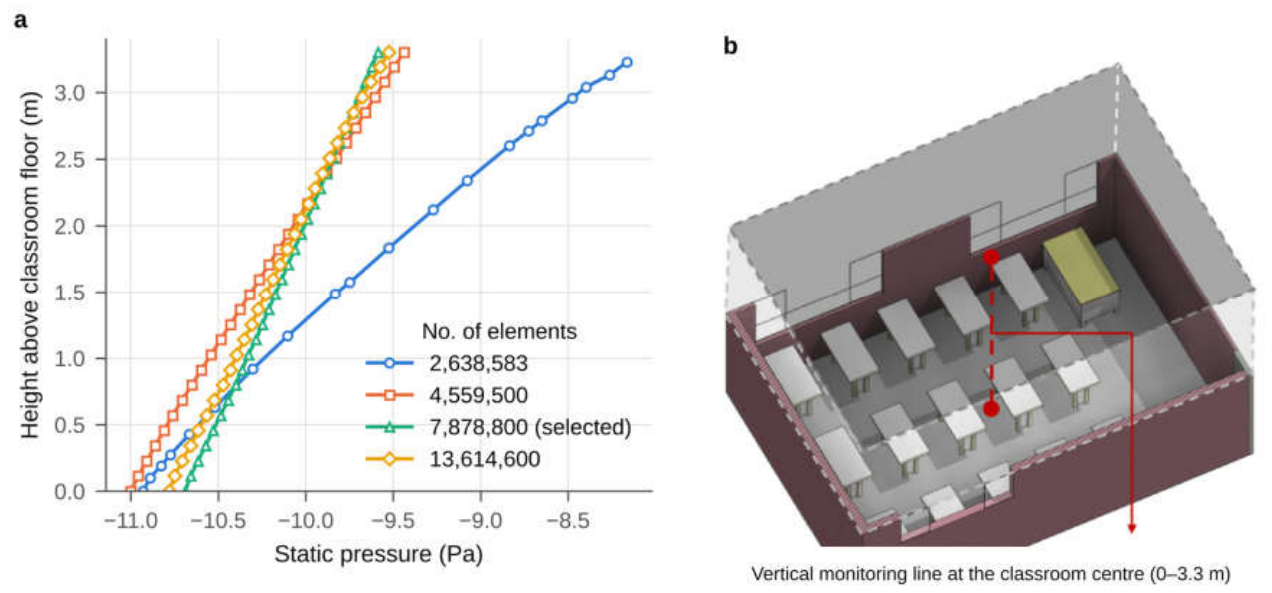
Figure 6.
Validation of the classroom air temperature: a measured and simulated 24-h profiles on 21 August for the standard k–ε, SST k–ω and realizable k–ε models; b distribution of the absolute percentage errors at the measurement times (box: interquartile range; line: median; whiskers: 1.5 times the interquartile range; circles: outliers).
Figure 6.
Validation of the classroom air temperature: a measured and simulated 24-h profiles on 21 August for the standard k–ε, SST k–ω and realizable k–ε models; b distribution of the absolute percentage errors at the measurement times (box: interquartile range; line: median; whiskers: 1.5 times the interquartile range; circles: outliers).
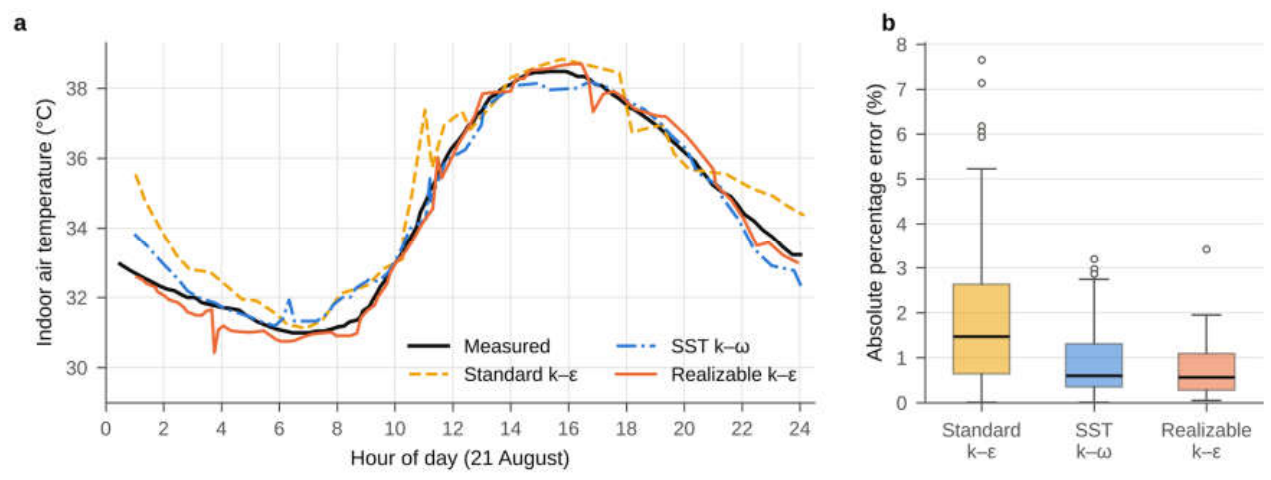
Figure 7.
Air speed, streamlines and air temperature on the working plane (0.6 m) and at mid-window height for the four orientations.
Figure 7.
Air speed, streamlines and air temperature on the working plane (0.6 m) and at mid-window height for the four orientations.
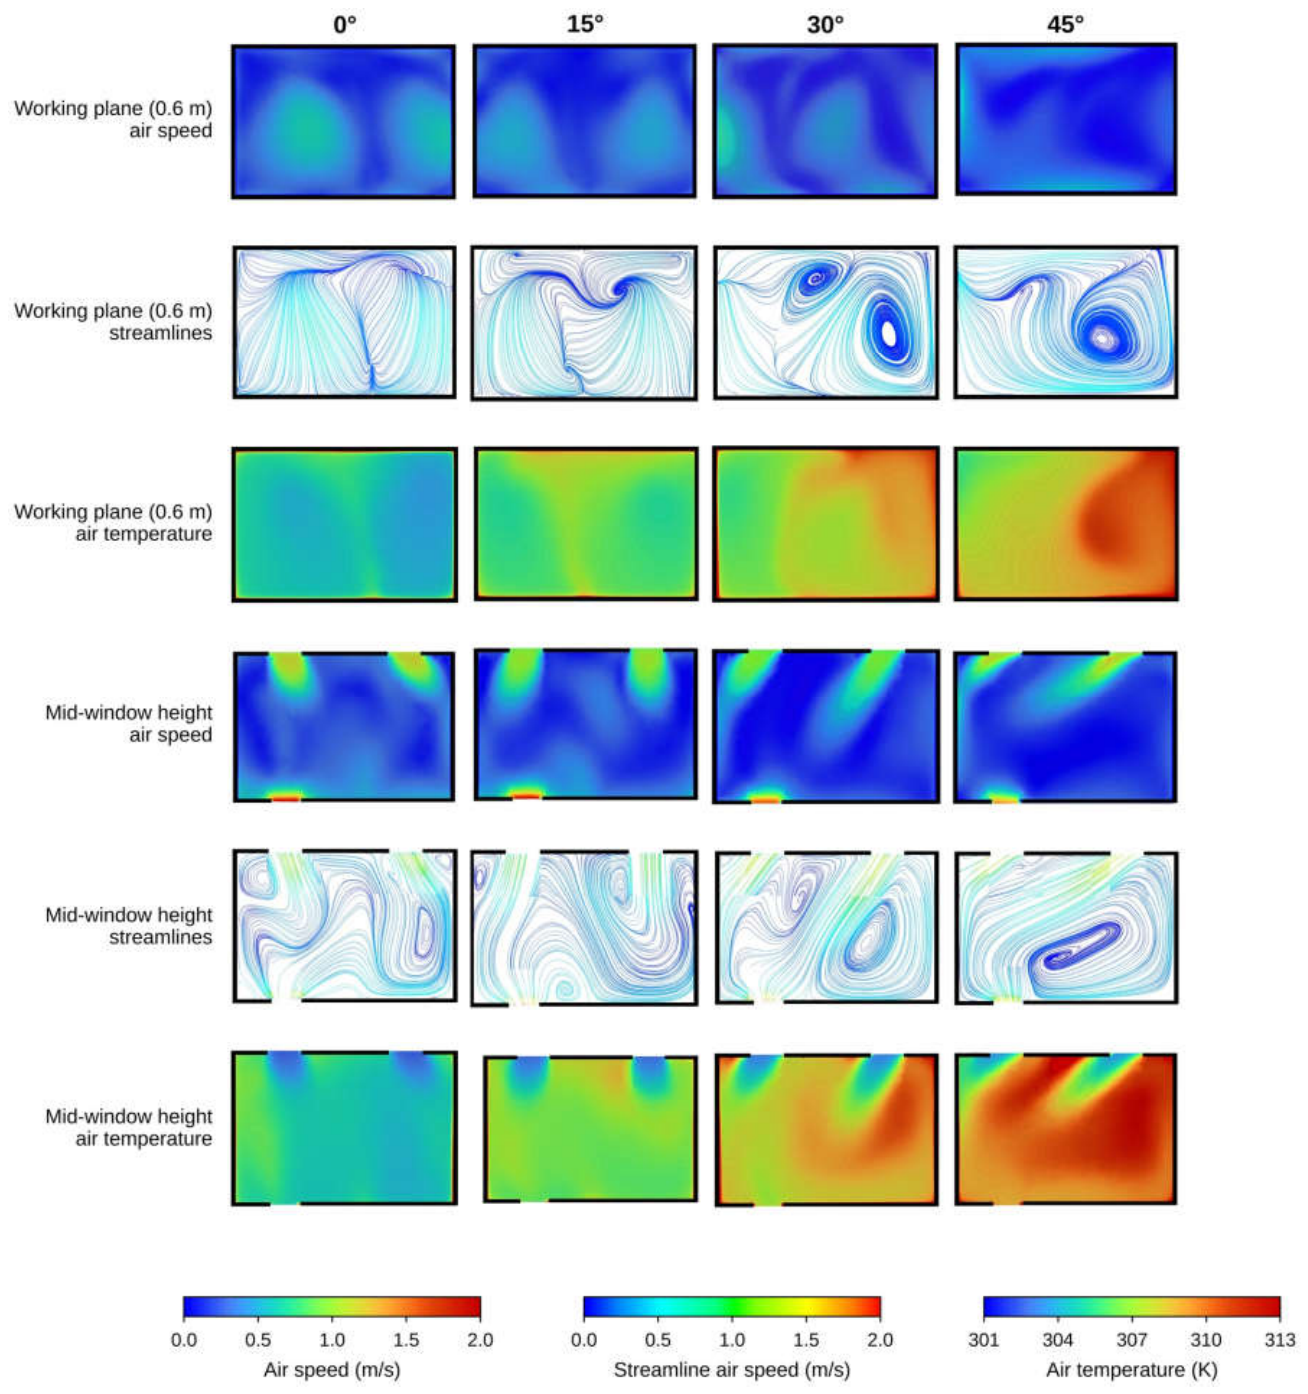
Figure 8.
Three-dimensional renderings of air speed and air temperature, and vertical sections of air speed and velocity vectors through the classroom wing, for the four orientations. The 15° air-speed rendering was exported with a 0–1.8 m/s color scale.
Figure 8.
Three-dimensional renderings of air speed and air temperature, and vertical sections of air speed and velocity vectors through the classroom wing, for the four orientations. The 15° air-speed rendering was exported with a 0–1.8 m/s color scale.
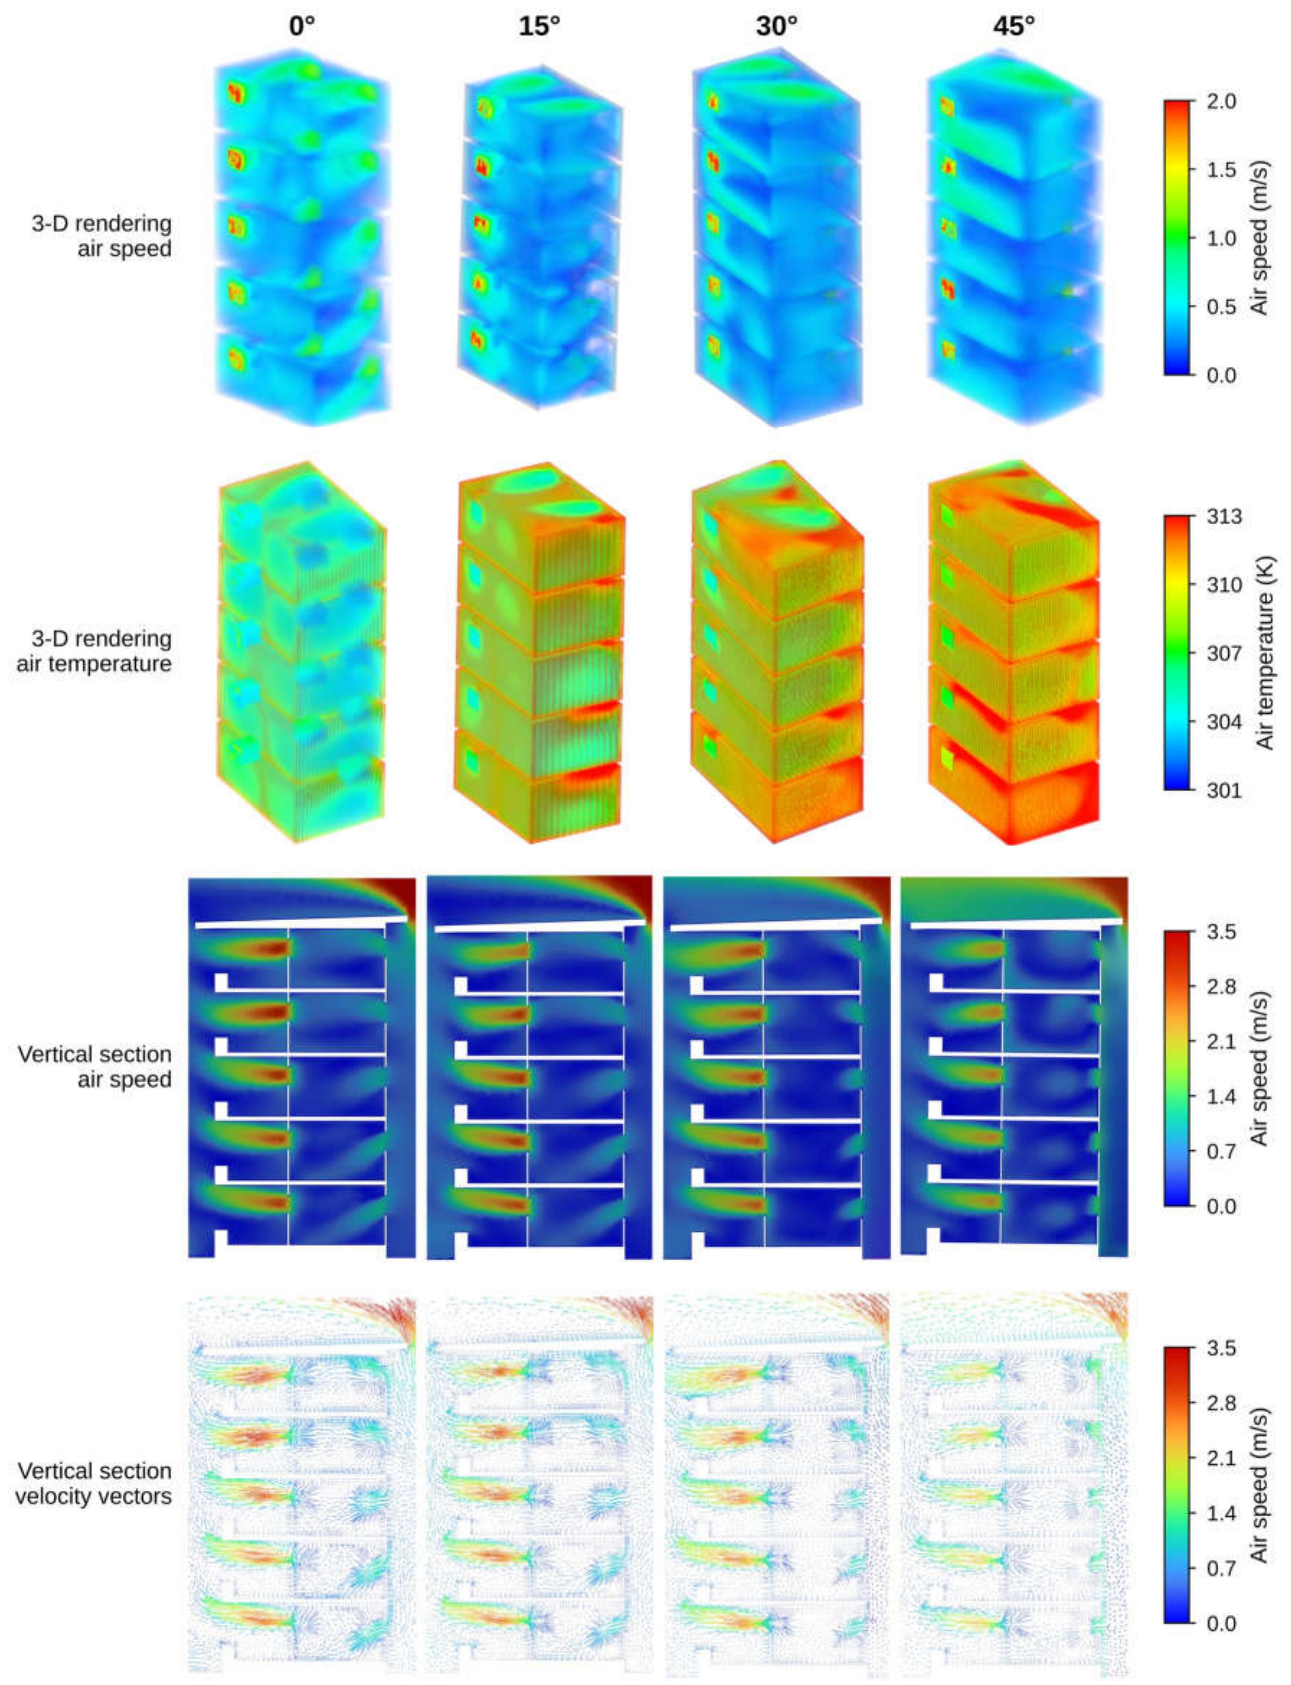
Figure 9.
Mean air speed (a) and mean air temperature (b) on the working plane, at mid-window height and over the classroom volume for the four orientations. The dashed line marks the 80% upper limit of the adaptive model.
Figure 9.
Mean air speed (a) and mean air temperature (b) on the working plane, at mid-window height and over the classroom volume for the four orientations. The dashed line marks the 80% upper limit of the adaptive model.
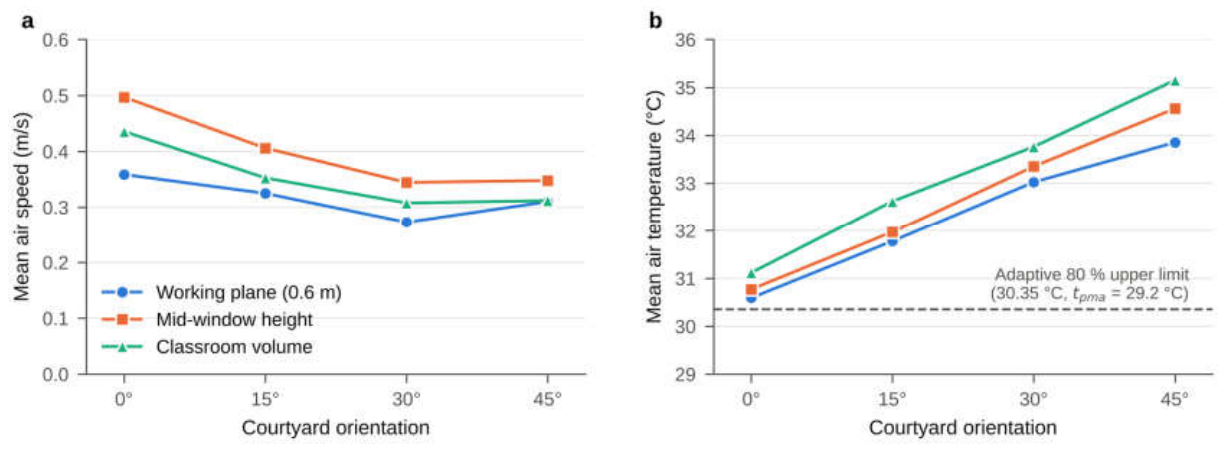
Figure 10.
Classroom-volume (filled markers) and working-plane (open markers) mean temperatures of the four orientations on the ASHRAE 55 adaptive comfort chart for tpma = 29.2 °C, with the 80% upper limits for average air speeds of 0.6, 0.9 and 1.2 m/s. The open markers are offset horizontally for legibility.
Figure 10.
Classroom-volume (filled markers) and working-plane (open markers) mean temperatures of the four orientations on the ASHRAE 55 adaptive comfort chart for tpma = 29.2 °C, with the 80% upper limits for average air speeds of 0.6, 0.9 and 1.2 m/s. The open markers are offset horizontally for legibility.
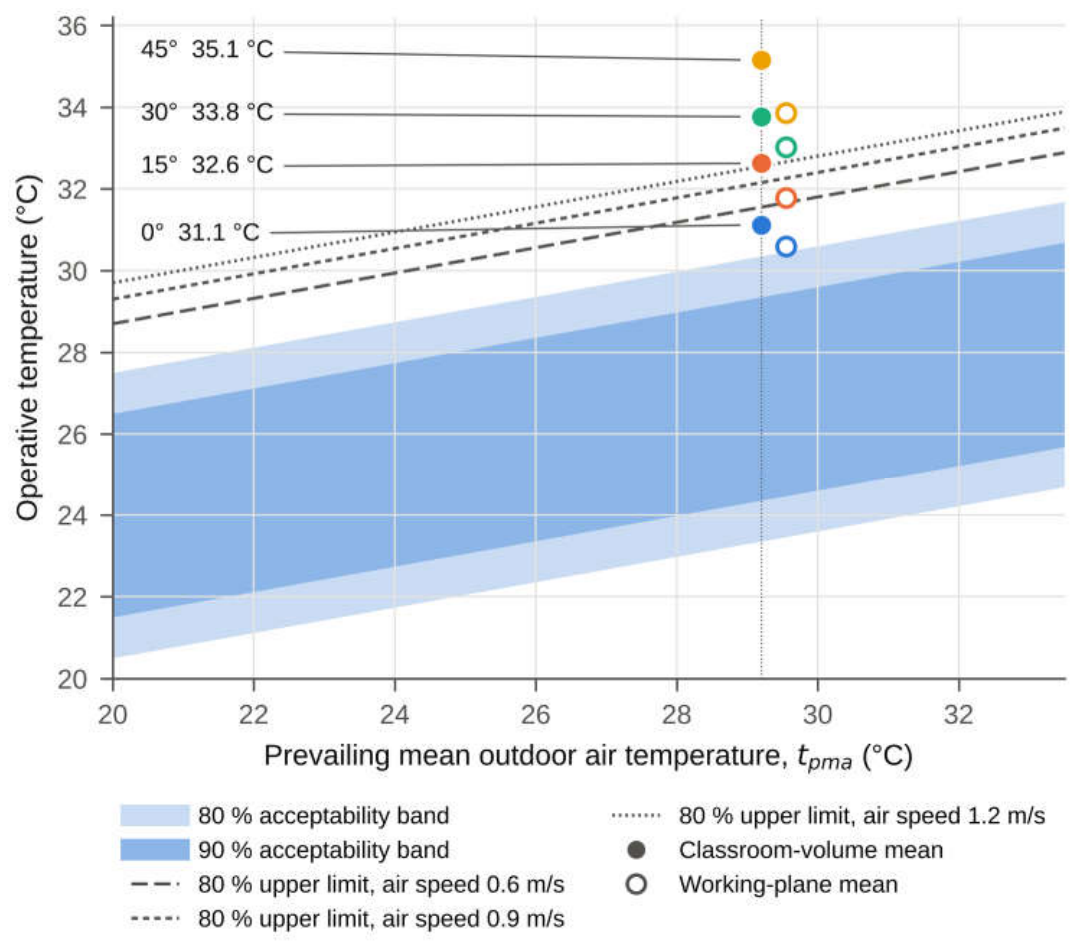
Figure 11.
Screening of the exceedance of the adaptive 80% upper limit (classroom-volume mean) as a function of regional warming. Dashed lines show the offsets provided by elevated air speed; dotted lines mark the CMIP6 multi-model median warming for North Africa [57]; the shaded area marks tpma > 33.5 °C, where the adaptive model is not applicable.
Figure 11.
Screening of the exceedance of the adaptive 80% upper limit (classroom-volume mean) as a function of regional warming. Dashed lines show the offsets provided by elevated air speed; dotted lines mark the CMIP6 multi-model median warming for North Africa [57]; the shaded area marks tpma > 33.5 °C, where the adaptive model is not applicable.
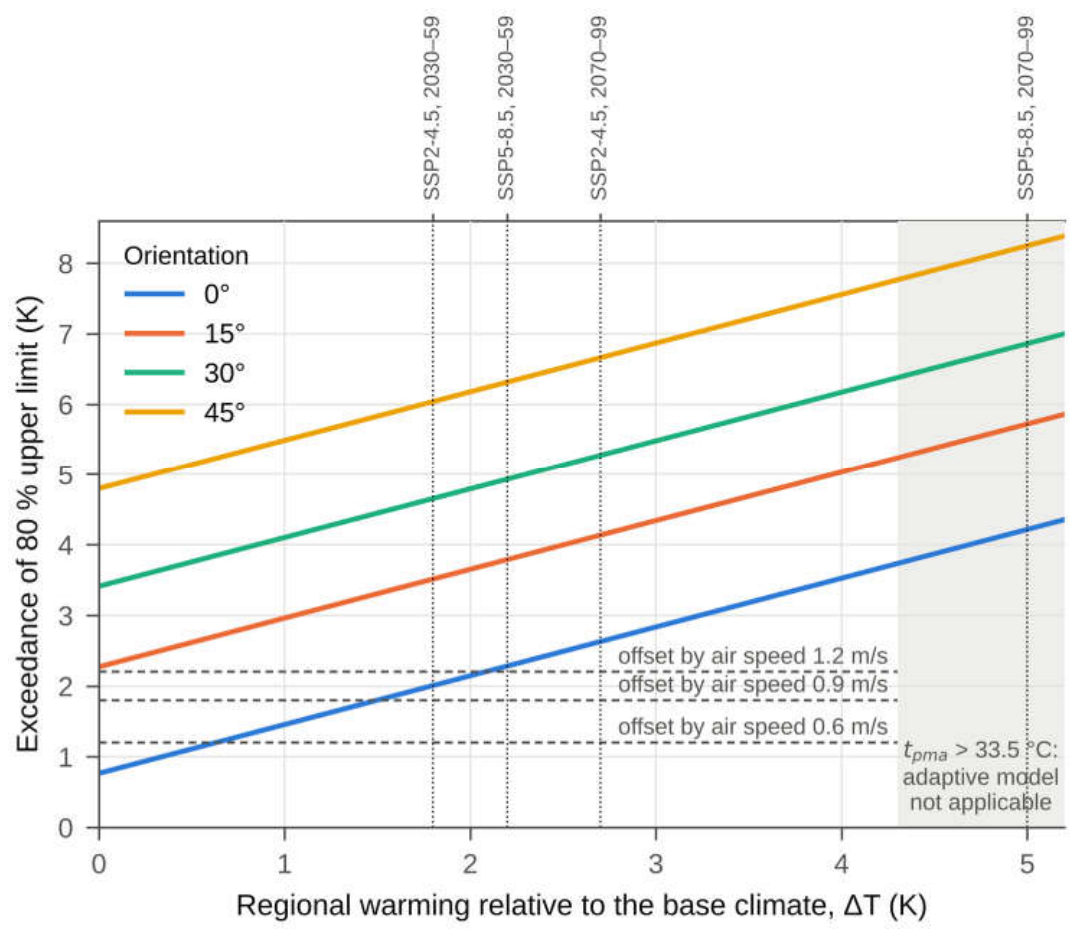

Table 1.
Geometry, occupancy, internal gains and envelope properties of the analyzed classroom.
| Parameter | Value | |||||
|---|---|---|---|---|---|---|
| Classroom | ||||||
| Internal dimensions (L × W × H) | 7.75 m × 5.25 m × 3.23 m; floor area 40.7 m2; volume 131.4 m3 | |||||
| Occupancy | 40 students (1.02 m2 per student); work-plane height 0.60 m | |||||
| Position | Main wing, floor level +3.90 m | |||||
| Openings | ||||||
| Façade windows | 2 × (2.60 m × 1.60 m), sill 1.10 m; operable sash 1.30 m × 1.10 m each (2 × 1.43 m2) | |||||
| Corridor-side window | 1 × (2.30 m × 1.00 m), sill 1.70 m; operable sash 1.12 m × 1.00 m (1.12 m2) | |||||
| Total operable area Aop | 3.98 m2 (9.8% of the floor area) | |||||
| Operable area / wall area | 11.4% (façade); 4.5% (corridor side) | |||||
| Glazed window-to-wall ratio | 33.2% (façade); 9.2% (corridor side) | |||||
| Internal gains and occupants | ||||||
| Metabolic rate | 1.2 met per student (70 W m−2) | |||||
| Lighting | 3 W m−2 sensible; no latent gain | |||||
| Clothing insulation | 0.5 clo (summer school uniform) | |||||
| Air and roof | ||||||
| Air density | 1.168 kg m−3 (August mean air temperature 29.2 °C) | |||||
| Roof slope | 3° towards the courtyard | |||||
| Envelope materials | ||||||
| Material | ρ (kg m−3) | λ (W m−1 K−1) | cp(J kg−1 K−1) | Solar absorptivity | Emissivity | Transmissivity |
| Brick | 1790 | 0.60 | 260 | 0.80 | 0.95 | – |
| Concrete | 2300 | 1.90 | 840 | 0.60 | 0.80 | – |
| Sand | 2240 | 1.74 | 840 | 0.50 | 0.85 | – |
| Mortar | 1650 | 0.72 | 920 | 0.70 | 0.80 | – |
| Glass | 2300 | 1.046 | 836.8 | 0.15 | 0.85 | 0.84 |
Opening ratios are based on the internal floor area (40.7 m2) and on the internal wall area of each façade (7.75 m × 3.23 m).
Table 2.
Boundary conditions and solver settings.
| Item | Setting |
|---|---|
| Inlet | Velocity inlet with logarithmic ABL profile (Equations (5) and (6)): Uref = 3.13 m/s at 10 m from 350° (August mean), z0 = 0.5 m, κ = 0.42; turbulence profiles from Equations (7)–(9); air temperature 29.2 °C |
| Outlet | Pressure outlet, zero gauge static pressure |
| Top and lateral boundaries | Symmetry (zero normal velocity and zero normal gradients) |
| Ground and building surfaces | No-slip walls with standard wall functions; conduction through the envelope with the material properties of Table 1 |
| Flow regime | Three-dimensional, incompressible, fully turbulent and non-isothermal; Boussinesq buoyancy; radiation by Equation (4) |
| Internal heat sources | 40 seated students (1.2 met) and lighting (3 W m−2) |
| Turbulence model | Realizable k–ε (orientation study); standard k–ε, realizable k–ε and SST k–ω (validation) |
| Time dependence | Steady state (orientation study); unsteady (URANS) over 24 h (validation) |
| Solver and discretization | Pressure-based, coupled pressure–velocity scheme, second-order upwind discretization |
| Convergence | Scaled residuals below 10−6 (continuity) and 10−7 (other equations); stable classroom-averaged air speed and temperature |
Table 3.
Mesh characteristics and results of the grid sensitivity study.
| Characteristic | Value | ||||
|---|---|---|---|---|---|
| Cell type | Unstructured polyhedral with inflation layers | ||||
| Cells / nodes (selected grid) | 7,878,800 / 41,338,900 | ||||
| Face sizing | 0.3 m near walls to 1.2 m near the domain boundaries | ||||
| Growth rate; transition ratio | 1.1 near walls, 1.2 near boundaries; 0.272 | ||||
| Maximum skewness; orthogonal quality | 0.5; 0.9 | ||||
| Grid sensitivity (static pressure on the vertical center line, 0° case) | |||||
| Grid | Cells | Near-wall face size (m) | r(−) | Max. deviation from finest grid (%) | Mean deviation from finest grid (%) |
| G1 | 2,638,583 | 0.7 | – | 14.4 | 5.4 |
| G2 | 4,559,500 | 0.5 | 1.20 | 2.05 | 1.02 |
| G3 (selected) | 7,878,800 | 0.3 | 1.20 | 0.86 | 0.50 |
| G4 | 13,614,600 | 0.1 | 1.20 | – | – |
r = (Nfine ∕Ncoarse)1/3 relative to the next coarser grid. Convergence of G2–G4 is oscillatory; numerical uncertainty (half the range of G2–G4 [45]): 0.05 Pa (0.54%) for the line-averaged pressure and at most 1.45% pointwise. Two-grid GCI between G2 and G4 (r = 1.44, Fs = 3, p = 2 [46]): mean 2.9%, maximum 5.7%.
Table 4.
Agreement between measured and simulated classroom air temperatures for the three turbulence models.
Table 4.
Agreement between measured and simulated classroom air temperatures for the three turbulence models.
| Model | MAE (K) | RMSE (K) | MBE (K) | MAPE (%) | R2 (−) | Max. error (K) |
|---|---|---|---|---|---|---|
| Standard k–ε | 0.62 | 0.81 | +0.54 | 1.83 | 0.952 | 2.49 |
| SST k–ω | 0.31 | 0.40 | +0.02 | 0.92 | 0.982 | 1.04 |
| Realizable k–ε | 0.25 | 0.31 | −0.10 | 0.73 | 0.992 | 1.08 |
Simulated profiles were interpolated to the measurement times within their common period (111 times for the standard k–ε and SST k–ω models and 110 for the realizable k–ε model, 0.5–24 h). MBE > 0 indicates overprediction.
Table 5.
Mean air speed and air temperature for the four orientations, with changes relative to the 0° case.
Table 5.
Mean air speed and air temperature for the four orientations, with changes relative to the 0° case.
| Orientation | Mean air speed (m/s) | Change, volume (%) | Mean air temperature (°C) | Change, volume (K) | ||||
|---|---|---|---|---|---|---|---|---|
| Work plane | Mid-window | Volume | Work plane | Mid-window | Volume | |||
| 0° | 0.359 | 0.497 | 0.436 | – | 30.59 | 30.77 | 31.12 | – |
| 15° | 0.325 | 0.406 | 0.353 | −19.0 | 31.78 | 31.97 | 32.62 | +1.51 |
| 30° | 0.273 | 0.345 | 0.308 | −29.4 | 33.03 | 33.35 | 33.76 | +2.65 |
| 45° | 0.310 | 0.348 | 0.312 | −28.4 | 33.85 | 34.56 | 35.15 | +4.03 |
Work plane: 0.6 m above the floor; mid-window: 2.15 m above the floor; volume: classroom volume average.
Table 6.
Ventilation indicators for the four orientations.
| Orientation | Ūroom (m/s) | MVR (−) | Qe (m3/s) | ACHe (h−1) | TI (%) | Stagnant volume (%) |
|---|---|---|---|---|---|---|
| 0° | 0.436 | 0.139 | 1.73 | 47.5 | 12 | 9 |
| 15° | 0.353 | 0.113 | 1.40 | 38.5 | 17 | 20 |
| 30° | 0.308 | 0.098 | 1.22 | 33.5 | 24 | 34 |
| 45° | 0.312 | 0.100 | 1.24 | 34.0 | 30 | 48 |
MVR = Ūroom∕Uref with Uref = 3.13 m/s; Qe = Ūroom Aop and ACHe from Equation (11) are velocity-based indices rather than measured opening flows; TI is the volume-averaged turbulence intensity; stagnant volume is the share of the classroom volume with air speed below 0.1 m/s.
Table 7.
Thermal comfort indicators for the four orientations.
| Orientation | T volume (°C) | Exceedance of 80% limit (K) | Air speed for 80% compliance (volume) | PMV (−) | PPD (%) | SET (°C) | ΔT vertical (K) | |
|---|---|---|---|---|---|---|---|---|
| Volume | Work plane | |||||||
| 0° | 31.12 | +0.77 | +0.24 | ≥ 0.6 m/s | +1.02 | 27 | 28.4 | 0.18 |
| 15° | 32.62 | +2.27 | +1.43 | > 1.2 m/s a | +1.59 | 56 | 30.3 | 0.19 |
| 30° | 33.76 | +3.41 | +2.67 | Not attainable b | +2.01 | 77 | 31.7 | 0.33 |
| 45° | 35.15 | +4.80 | +3.50 | Not attainable b | +2.45 | 92 | 33.0 | 0.71 |
Adaptive model of ASHRAE 55-2023 for tpma = 29.2 °C: tcmf = 26.85 °C; 80% and 90% upper limits 30.35 °C and 29.35 °C, raised by 1.2, 1.8 and 2.2 K for average air speeds of 0.6, 0.9 and 1.2 m/s. PMV, PPD and SET for the classroom volume with 1.2 met, 0.5 clo, 47% relative humidity, mean radiant temperature equal to air temperature and the SET-based cooling effect of the simulated air speed. ΔT vertical: mid-window plane minus working plane. a The working-plane mean complies at 0.9 m/s; the volume mean exceeds the 1.2 m/s limit by 0.07 K b With 1.2 m/s, a further reduction of 1.2 K (30°) and 2.6 K (45°) in classroom temperature would be required.
Table 8.
Screening of the exceedance of the adaptive 80% upper limit (classroom-volume mean, K) under projected regional warming.
Table 8.
Screening of the exceedance of the adaptive 80% upper limit (classroom-volume mean, K) under projected regional warming.
| Scenario | ΔT (K) | tpma (°C) | 0° | 15° | 30° | 45° |
|---|---|---|---|---|---|---|
| Current climate | 0 | 29.2 | 0.77 * | 2.27 | 3.41 | 4.80 |
| SSP2-4.5, 2030–2059 | 1.8 (1.4–2.5) | 31.0 | 2.01 * | 3.51 | 4.65 | 6.04 |
| SSP5-8.5, 2030–2059 | 2.2 (1.8–2.9) | 31.4 | 2.28 | 3.79 | 4.93 | 6.32 |
| SSP2-4.5, 2070–2099 | 2.7 (2.3–3.6) | 31.9 | 2.63 | 4.14 | 5.28 | 6.66 |
| SSP5-8.5, 2070–2099 | 5.0 (4.1–6.0) | 34.2 | (4.22) | (5.72) | (6.86) | (8.25) |
ΔT: CMIP6 multi-model median (66% range) of annual warming over North Africa relative to 1981–2010 [57]. Exceedance = current exceedance + 0.69 ΔT. * Within the 2.2 K offset of an average air speed of 1.2 m/s. Values in parentheses: tpma > 33.5 °C, outside the applicability of the adaptive model.
Disclaimer/Publisher’s Note: The statements, opinions and data contained in all publications are solely those of the individual author(s) and contributor(s) and not of MDPI and/or the editor(s). MDPI and/or the editor(s) disclaim responsibility for any injury to people or property resulting from any ideas, methods, instructions or products referred to in the content. |
© 2026 by the authors. Licensee MDPI, Basel, Switzerland. This article is an open access article distributed under the terms and conditions of the Creative Commons Attribution (CC BY) license.
Copyright: This open access article is published under a Creative Commons CC BY 4.0 license, which permit the free download, distribution, and reuse, provided that the author and preprint are cited in any reuse.