

Submitted:
01 November 2026
Posted:
05 November 2026
You are already at the latest version
Abstract
Self-compassion is consistently associated with lower burnout, mostly in between-person comparisons. This within-person panel study estimates whether, within each coach, higher-than-usual self-compassion precedes lower burnout. Data came from an open panel of Swiss sports coaches (Ackeret et al., 2022a) across three waves at baseline, 3 months, and 6 months (N = 422). After longitudinal invariance tests, a random-intercept cross-lagged panel model separated between-person differences from within-person change. The standardized within-person path for Hypothesis 1, from self-compassion at baseline to burnout at 3 months, was β = 0.29, 95% CI [−0.47, 1.06]. Self-compassion is not yet established as a target for burnout-prevention trials in coaches.
Keywords:
self-compassion
; uncompassionate self-responding
; coach burnout
; social support
; random-intercept cross-lagged panel model
Does Self-Compassion Precede Lower Burnout in Sports Coaches? A Within-Person Panel Study
Burnout is a recurring risk in sports coaching, marked by long and irregular hours, results-dependent employment, work–family conflict, and high emotional investment in athletes (Ackeret et al., 2022a). Coach burnout is defined, for this study, by the athlete burnout triad of emotional and physical exhaustion, devaluation of the sport, and a reduced sense of accomplishment (Raedeke & Smith, 2001, p. 283), as applied to coaches through the Coach Burnout Questionnaire (Harris, 2005), and it is linked to coaches leaving the profession (Ackeret et al., 2022a). Research on coach well-being has emphasized risk factors over protective resources; self-compassion and perceived social support are two such resources of growing interest (Ackeret et al., 2022a).
Self-compassion is a kind and understanding stance toward oneself in the face of failure or difficulty (Neff, 2003b), commonly described along the three bipolar dimensions of self-kindness versus self-judgment, common humanity versus isolation, and mindfulness versus over-identification (Neff, 2003a, 2003b). It is negatively associated with burnout among helping professionals, physicians, students, and other occupational groups (Ackeret et al., 2022a). In sports coaches, self-compassion and social support showed stable negative associations with burnout over 6 months, and all three constructs showed high rank-order stability (Ackeret et al., 2022a). That stability leaves open whether a coach’s burnout changes in the months after the coach responds to setbacks with more or less self-compassion than usual.
Answering that question requires separating two sources of covariation. Associations across people reflect stable level differences (for example, a coach who is both habitually self-compassionate and habitually low in burnout). Prospective within-person effects reflect how deviations from a coach’s own typical level carry forward. The traditional cross-lagged panel model (CLPM) blends these sources, so lagged coefficients can misrepresent within-person processes when stable individual differences are present (Hamaker et al., 2015). The random-intercept cross-lagged panel model (RI-CLPM) adds a random intercept for each construct and estimates autoregressive and cross-lagged paths among within-person deviations (Hamaker et al., 2015). An earlier analysis of the coach panel estimated invariance, stability, and growth models without autoregressive or cross-lagged paths (Ackeret et al., 2022a, pp. 4–5). Longitudinal tracking of athletes and coaches has been recommended to clarify directionality between self-compassion and mental health (Ackeret, 2025, p. 24). A related longitudinal study in sport followed athletes rather than coaches and treated self-compassion as a time-invariant predictor of growth in prosocial and antisocial behavior (McEwan & Zhang, 2024). The present study asks whether self-compassion precedes lower burnout within persons over time in a random-intercept model of the same open coach panel.
Self-Compassion and Later Burnout
Theory points to self-compassion as a resource that protects against later burnout. Because over-identification, and the self-judgment and isolation it fuels, magnifies what a failure implies for self-worth (Neff, 2003b, p. 89), a coach who meets a poor result or a hard run of competition with kindness, common humanity, and mindfulness should appraise the setback as less threatening and recover sooner than a coach who meets it with those harsher responses. Self-compassion is associated with well-being and coping (Ackeret et al., 2022a), and among female athletes, lower self-compassion was associated with higher burnout through greater self-criticism (Amemiya & Sakairi, 2020). Over months, meeting ordinary coaching stressors with less self-compassion than usual would wear down the emotional and physical energy that exhaustion captures (Raedeke & Smith, 2001, p. 283). A within-person rise in self-compassion is therefore expected to precede a fall in burnout at the next assessment, beyond the coach’s stable level of either construct.
Hypothesis 1: Within coaches, higher-than-usual self-compassion at one wave will predict lower-than-usual burnout at the next wave, controlling for the coach’s prior-wave within-person burnout and beyond stable differences between coaches.
The Hypothesis 1 model treats self-compassion as a single construct. To form the total, self-judgment, isolation, and over-identification items are reverse-scored and averaged with self-kindness, common humanity, and mindfulness items (Ackeret et al., 2022a; Raes et al., 2011). Researchers increasingly score these two sets separately as compassionate and uncompassionate self-responding, because they are partly independent and relate differently to distress (Brenner et al., 2017; Muris & Petrocchi, 2017). Uncompassionate self-responding is broader than self-criticism, which primarily describes self-judgment rather than isolation or over-identification (Neff et al., 2019, p. 29). Self-criticism is positively associated with exhaustion among workers (Souza, 2024, Abstract) and with all three burnout dimensions among students (Hailikari et al., 2025, p. 5), and compassion-focused theory links self-criticism and shame to threat processing (Gilbert, 2009; Gilbert & Procter, 2006). For intervention, building kindness and reducing harsh self-criticism are different targets.
The split was specified after the analysis plan was frozen, so its paths are estimated as exploratory questions rather than hypotheses. The first is whether, within coaches, higher-than-usual uncompassionate self-responding precedes higher-than-usual total burnout, net of compassionate self-responding. The second is whether compassionate self-responding precedes later burnout, estimated without a directional expectation.
Reciprocal Paths and Social Support
The reverse direction has also been proposed, with burnout increasing self-criticism and thereby undermining self-compassion (Ackeret et al., 2022a). The analysis plan lists this reverse path as a secondary hypothesis (Hypothesis 3), estimated in the same model as Hypothesis 1. The reverse paths to compassionate and to uncompassionate self-responding are exploratory.
Research Question 1: Is higher-than-usual burnout at one wave associated with lower-than-usual self-compassion at the next wave?
Perceived social support, a second protective resource in coach research, is consistently associated with lower coach burnout, and social support and self-compassion are positively related (Ackeret et al., 2022a). Whether support weakens the path from self-compassion to later burnout is not tested in this study. Two further hypotheses are stated in the analysis plan. Hypothesis 2: Within coaches, higher-than-usual perceived social support at one wave will predict lower-than-usual burnout at the next wave. Within-person comparisons across waves require that each construct be measured on the same metric at every wave. Hypothesis 4: Self-compassion, perceived social support, and burnout will show at least scalar longitudinal measurement invariance across the three waves. The hypothesis numbers follow the analysis plan, whose Hypothesis 3, the reverse path from burnout to self-compassion, appears here as Research Question 1. Hypotheses 2 and 4 are secondary. Social support also enters the analysis as one of the choices in the specification curve.
The Present Study
To answer these questions, I fit a three-wave RI-CLPM with latent constructs to an open panel of sports coaches assessed at baseline, 3 months, and 6 months (Ackeret et al., 2022a). The study estimates the prospective within-person path from self-compassion to burnout and separates stable between-person differences from within-person dynamics. A CLPM comparison then checks whether conclusions about direction depend on that separation, and the separated-components models repeat the estimate with compassionate and uncompassionate self-responding scored separately.
Method
Transparency and Openness
This study is a secondary analysis of publicly deposited panel data under a CC0 waiver (Ackeret et al., 2022b). Original data collection adhered to ethical standards and was approved by the university’s Institutional Review Board (internal ethics committee), and participants gave informed consent (Ackeret et al., 2022a). Two prior studies analyzed the same panel (Ackeret, 2025; Ackeret et al., 2022a); the present question, model, and analyses differ. The analysis plan was frozen on October 24, 2026, and kept under version control; this analysis was not registered. The deposited data were opened twice: first on October 28, 2026, for a specification-curve summary under a specification that has since been superseded, and second for the analyses reported here, which follow the frozen plan. Sample size was fixed by the deposit. Reporting follows JARS for quantitative research (Appelbaum et al., 2018). Data are available from the original deposit (Ackeret et al., 2022b) at https://doi.org/10.5061/dryad.p5hqbzkrk. The analysis code and frozen analysis plan are available from the corresponding author on request, and data access follows the original data holders’ terms (Ackeret et al., 2022a).
Participants and Procedure
Swiss sports coaches were recruited through the national professional association of coaches, the national coach education program, and the national youth and adult sport program, completed the same online questionnaire at baseline, 3 months, and 6 months, and received email invitations at 12 weeks with one reminder (Ackeret et al., 2022a). The interval between waves was 3 months by design; the deposit records no individual response dates. The analytic sample comprised 422 coaches; 420 provided data at baseline, 301 at 3 months, and 259 at 6 months, and 258 provided data at all three waves. Baseline demographics are not in the planned models. The published sample description reports 20.7% women, a mean age of 44.48 years (SD = 11.03), and 57 sport disciplines across competitive and recreational levels (Ackeret et al., 2022a). The attrition pattern is reported by wave in the Results.
Measures
Self-compassion and burnout items were rated on a 5-point scale from 1 (almost never) to 5 (almost always), and social support items on a 5-point scale from 1 (not true at all) to 5 (very true; Ackeret et al., 2022a, pp. 3–4). Table 1 reports Cronbach’s α for each construct at each wave.
Self-Compassion
Self-compassion was measured with the 12-item Self-Compassion Scale Short Form (Raes et al., 2011). A sample item is “I try to see my failings as part of the human condition” (Raes et al., 2011, p. 251). Items 1, 4, 8, 9, 11, and 12, which tap self-judgment, isolation, and over-identification, are reverse-scored so that higher scores indicate more self-compassion (Raes et al., 2011). In the Hypothesis 1 model, self-compassion was a latent factor at each wave with the three self-compassion parcels of the original deposit as indicators (Ackeret et al., 2022b). Each parcel was the mean of four items, two of them reverse-scored, and the allocation was the same at every wave. In the separated-components model, compassionate self-responding was scored from the six self-kindness, common humanity, and mindfulness items (Items 2, 3, 5, 6, 7, and 10) and uncompassionate self-responding from the six self-judgment, isolation, and over-identification items (Items 1, 4, 8, 9, 11, and 12), as correlated latent factors with six item indicators each (Raes et al., 2011).
The deposit parcels follow the item-to-construct balance technique used for this panel (Ackeret et al., 2022a, p. 4). As in that study, each latent variable had three parcels as indicators, the loading of the first parcel was fixed to 1, and residuals of the same parcel were correlated across waves (Ackeret et al., 2022a, p. 4). The parcels were recomputed from the items and checked against the deposited parcel scores before any model was fitted.
Parcel-level longitudinal invariance used the same steps and fit-change rule as the item-level models (see Analytic Strategy). Partial invariance required at least two of three parcels per factor to be invariant, applying the item majority rule (Steenkamp & Baumgartner, 1998, and Vandenberg & Lance, 2000, as cited in Putnick & Bornstein, 2016) to parcels by analogy. Parcel-level invariance does not imply item-level invariance (Little et al., 2013). Parcels were not prorated: a parcel was missing if any of its items was missing (averaging available items is person-mean imputation; Enders, 2025).
Burnout
Burnout was measured with the 15-item Coach Burnout Questionnaire (Harris, 2005, pp. 17–18), which rewords Athlete Burnout Questionnaire items (Raedeke & Smith, 2001) for coaching rather than playing (Harris, 2005, p. 17). It covers three dimensions labeled here exhaustion, reduced accomplishment, and devaluation. A sample item is “It seems that no matter what I do, I don’t coach as well as I should” (Harris, 2005, p. 68). Items 1 and 14 are reverse-scored (Harris, 2005, p. 12), and higher scores indicate more burnout. At each wave, total burnout was a latent factor with the three burnout parcels of the original deposit as indicators (Ackeret et al., 2022b), each the mean of five items and formed and scaled in the same way as the self-compassion parcels. In the separated-components model, total burnout had three indicators at each wave, the mean of the five items of each dimension, with items assigned to dimensions by the key of the Athlete Burnout Questionnaire (Raedeke & Smith, 2001; see Gao & Wang, 2024, p. 4), which the coach adaptation preserves (Harris, 2005, p. 17).
In the separated-components model, compassionate and uncompassionate self-responding were each a latent factor with its six items as indicators. In the full-scale specification of the specification curve, self-compassion had its 12 items and burnout its 15 items as indicators.
Perceived Social Support
Perceived social support was measured with the six-item Brief Perceived Social Support Questionnaire (Kliem et al., 2015, as cited in Ackeret et al., 2022a, p. 4). A sample item is “I receive a lot of understanding and security from others” (Kliem et al., 2015, as cited in Ackeret et al., 2022a, p. 4). Higher scores indicate more perceived support. At each wave, perceived social support was a latent factor with three parcels, each the mean of two items.
Analytic Strategy
I fitted the primary RI-CLPM in R (Version 4.5.2) with the lavaan package (Version 0.6.17; Rosseel, 2012), using robust maximum likelihood (MLR) estimation, which gives robust standard errors and a scaled test statistic (Enders, 2025). Missing data were handled under a missing-at-random assumption with full-information maximum likelihood (FIML; Enders, 2025). The missingness pattern is reported by wave in the Results.
I first tested longitudinal measurement invariance for each construct, moving from configural to metric to scalar models (Putnick & Bornstein, 2016). Model fit is described with the chi-square test, the comparative fit index (CFI), the root mean square error of approximation (RMSEA), and the standardized root mean square residual (SRMR). The analysis plan named dynamic fit index cutoffs (McNeish & Wolf, 2023) for these indices; I did not compute them, a departure from the plan recorded in the analysis materials, so invariance decisions rest on the fit-change criteria that follow. Nested invariance steps were accepted when robust CFI decreased by no more than .010 and robust RMSEA increased by no more than .015 relative to the preceding model, with partial invariance if a step fails (Putnick & Bornstein, 2016).
The Hypothesis 1 model was a three-wave RI-CLPM with latent constructs for self-compassion and burnout (Hamaker et al., 2015; Mulder & Hamaker, 2021), estimated with MLR and FIML. Each construct had a random intercept. Within-person deviations were linked by autoregressive and cross-lagged paths with within-wave residual covariances. With three waves, the autoregressive and cross-lagged paths were constrained equal across the two intervals, as the analysis plan specified, and I tested that equality constraint against a model with freely estimated lagged paths.
The Hypothesis 1 estimand is the within-person cross-lagged effect of self-compassion on next-wave burnout, net of prior burnout (Hamaker et al., 2015). The lagged paths are equal across intervals in the unstandardized metric, but the standardized estimate differs by interval because within-person variances differ by wave. I report the standardized estimate from the MLR model with its 95% confidence interval (CI) for each interval, with baseline to 3 months as the primary estimate. The analysis plan named Hypothesis 1 as the single planned test at α = .05 and set a Holm correction for the secondary tests. I report estimates with 95% CIs instead, with no p values and no fixed-alpha decision rule; this departs from the frozen plan and is recorded as a deviation.
The analysis plan listed a Bayesian RI-CLPM as a sensitivity analysis, conditional on sourcing its priors. The planned prior on the cross-lagged paths was Normal(0, .2²) on the standardized scale, and a prior sensitivity analysis was to compare diffuse with informative priors (Depaoli & van de Schoot, 2017). This analysis was not run; its sampler, convergence, and model-comparison settings were not specified.
The Research Question 1 reverse path from burnout to later self-compassion was estimated in the same model and is reported in the same way, as are the random-intercept correlation and the CLPM versus RI-CLPM contrast. Because no p values are reported, the Holm correction set in the analysis plan was not applied; this is part of the deviation described above. Hypothesis 2 was estimated in a separate RI-CLPM of perceived social support and burnout, specified as the Hypothesis 1 model with support in place of self-compassion and with the parcel releases that the invariance tests required. The analysis plan did not say whether self-compassion stays in this model; I did not include it, a choice made after the plan was frozen and recorded as a deviation. Hypothesis 4 was tested with the invariance procedure described above, applied to each of the three constructs.
Analyses based on the split into compassionate and uncompassionate self-responding were specified after the analysis plan was frozen and are exploratory. In this model, the self-compassion factor was replaced by correlated compassionate and uncompassionate factors. I estimated the path from uncompassionate self-responding to total burnout net of compassionate self-responding, the path from compassionate self-responding to burnout, and the reverse paths from burnout to each. These paths are reported as MLR estimates with 95% CIs and are not treated as tests of a hypothesis. Any other analysis suggested by the data is identified as unplanned where it is reported.
Departures from the frozen analysis plan that arose after the plan was locked are reported in the Appendix (see Appendix).
Robustness analyses set in the analysis plan compared the Hypothesis 1 model with a traditional CLPM (Hamaker et al., 2015), a model with unconstrained lagged paths, the same RI-CLPM on observed scale means, and a complete-case model. A specification curve summarized the path from self-compassion to burnout across the five choices set in the analysis plan: CLPM versus RI-CLPM, lagged paths free versus equal, parcels versus full scale, FIML versus listwise deletion, and inclusion versus exclusion of the social-support covariance (Simonsohn et al., 2020; Steegen et al., 2016). These analyses are descriptive; each is reported as a standardized estimate with its 95% CI.
Before fitting the observed data, Hypothesis 1 estimation scripts were exercised on simulated panel data as a code check; the scripts are in the analysis materials. A formal recovery summary for that check was not released.
Results
Preliminary Analyses
Means, standard deviations, and reliability coefficients for each construct at each wave appear in Table 1. Intercorrelations among the observed study variables at baseline, 3 months, and 6 months appear in Table 2.
Missingness and attrition by wave were as follows. Of the 422 coaches in the analytic sample, 420 (99.5%) provided data at baseline, 301 (71.3%) at 3 months, 259 (61.4%) at 6 months, and 258 (61.1%) at all three waves. The other 164 coaches were missing data for at least one wave; among them, n = 41 provided data at baseline and 3 months only, n = 121 baseline-only, and n = 2 under other incomplete wave patterns. On this panel, Ackeret et al. (2022a, §2.2) reported that coaches who completed all three waves did not differ from those with incomplete wave patterns on baseline burnout, self-compassion, or social support (all ts < 1.83, all ps > .07, all ds < .18).
Longitudinal Measurement Invariance
Parcel-level configural, metric, and scalar models for self-compassion, burnout, and perceived social support appear in Table 3. Hypothesis 4 predicted at least scalar invariance of self-compassion, perceived social support, and burnout (Putnick & Bornstein, 2016). For burnout and perceived social support, every step met the fit-change criteria, so scalar invariance held; for self-compassion, the scalar step met the criteria only after one intercept (h1SCPB) was released, so partial scalar invariance held (Table 3).
Model Convergence and Fit
The Hypothesis 1 RI-CLPM estimated with MLR converged and fit the data, χ²(121) = 149.41, CFI = .994, RMSEA = .027, 90% CI [.000, .043], SRMR = .044. The comparison of equal with freely estimated lagged paths was Δχ²(4) = 12.15 (Satorra–Bentler scaled), ΔCFI = −.001, ΔRMSEA = .002. The planned Bayesian sensitivity model was not run.
Estimation Problems
The separated-components total-burnout model produced an improper solution (a negative variance estimate), failed a lavaan postestimation check, and returned lavaan warnings. No model was respecified; the estimates are reported as estimated, and the full warning text is in the estimation log of the analysis materials.
Within-Person Path from Self-Compassion to Burnout
Reverse Path from Burnout to Self-Compassion
For Research Question 1, the standardized within-person path from burnout to later self-compassion was β = −0.03, 95% CI [−0.93, 0.87], from baseline to 3 months and β = −0.02, 95% CI [−0.51, 0.48], from 3 to 6 months.
Within-Person Path from Social Support to Burnout
For Hypothesis 2, the standardized within-person path from perceived social support to later burnout, estimated in the RI-CLPM of support and burnout, was β = −0.27, 95% CI [−0.63, 0.09], from baseline to 3 months and β = −0.28, 95% CI [−0.70, 0.14], from 3 to 6 months. The interval for baseline to 3 months includes 0 and is compatible with effects from −0.63 to 0.09. Both cross-lagged paths of this model appear in Table 4.
Between-Person Association
The random-intercept correlation between self-compassion and burnout, a planned additional estimate, was r = −.48, 95% CI [−.60, −.37].
Exploratory Analyses: Compassionate and Uncompassionate Self-Responding
These estimates are exploratory. Reported paths are the baseline-to-3-months (first-interval) standardized estimates. The cross-lagged path from uncompassionate self-responding to later total burnout, net of compassionate self-responding, was β = 0.01, 95% CI [−0.72, 0.73], from baseline to 3 months. The path from compassionate self-responding to later burnout was β = 0.41, 95% CI [−0.49, 1.32], from baseline to 3 months. The reverse path from burnout to later compassionate self-responding was β = 0.01, 95% CI [−0.71, 0.73], from baseline to 3 months, and the reverse path to later uncompassionate self-responding was β = 0.20, 95% CI [−1.44, 1.85], from baseline to 3 months. Full estimates appear in Table 5.
Robustness and Sensitivity Analyses
Model Comparison
In the traditional CLPM, the path from self-compassion to burnout was β = −0.04, 95% CI [−0.11, 0.02], compared with β = 0.29, 95% CI [−0.47, 1.06], in the RI-CLPM (baseline to 3 months).
Descriptive Sensitivity Analyses
Unconstrained, observed-score, and complete-case models yielded β = 0.20, 95% CI [−1.66, 2.06]; β = −0.14, 95% CI [−0.32, 0.04]; and β = −0.27, 95% CI [−0.90, 0.35], respectively. The specification curve for the path from self-compassion to burnout appears in Figure 2. The planned Bayesian sensitivity analysis with diffuse and informative priors was not run.
Discussion
This analysis was designed to estimate whether self-compassion precedes lower burnout within sports coaches over time. From baseline to 3 months, the within-person path from self-compassion to later burnout was β = 0.29, 95% CI [−0.47, 1.06], an interval that includes 0; from 3 to 6 months, it was β = 0.14, 95% CI [−0.13, 0.41], an interval that includes 0. The within-person estimates do not show that higher self-compassion precedes lower burnout within coaches. For Research Question 1, the reverse paths from burnout to later self-compassion were β = −0.03, 95% CI [−0.93, 0.87], from baseline to 3 months and β = −0.02, 95% CI [−0.51, 0.48], from 3 to 6 months, so the data do not show the reverse direction either. In the separated-components model uncompassionate self-responding had a prospective association with later burnout whose 95% CI includes 0 and is compatible with effects from −0.72 to 0.73. For Hypothesis 2, the 95% CI of the within-person path from perceived social support to later burnout, from baseline to 3 months, includes 0 and is compatible with effects from −0.63 to 0.09, so the estimate does not settle whether higher-than-usual support precedes lower burnout within coaches. For Hypothesis 4, by the fit-change criteria, scalar invariance held for burnout and perceived social support, and partial scalar invariance held for self-compassion after one intercept was released (Table 3).
Theoretical Implications
Stability analyses of this panel established that coaches who are more self-compassionate are also less burned out and that both constructs are stable over 6 months (Ackeret et al., 2022a). Separating stable differences from within-person change shows that the negative association lies mainly between coaches (r = −.48). In the separated-components models, scoring compassionate and uncompassionate self-responding separately estimates the prospective association of uncompassionate self-responding net of compassionate self-responding. That association had a 95% CI that includes 0 and is compatible with effects from −0.72 to 0.73, which bears on whether self-compassion is best represented by a total score (Muris & Otgaar, 2020; Neff et al., 2019). The CLPM comparison examines how far conclusions about direction depend on removing stable between-person variance (Hamaker et al., 2015).
Practical Implications
The within-person estimate for Hypothesis 1 was β = 0.29, 95% CI [−0.47, 1.06], from baseline to 3 months. The estimate does not yet justify burnout-prevention trials that build self-compassion, delivered through coach education programs and sport federations. Whether such trials should target uncompassionate self-responding in particular rests on the separated-components estimates. In the separated-components model, the 95% CI for the path from uncompassionate self-responding, net of compassionate self-responding, to later burnout includes 0 and is compatible with effects from −0.72 to 0.73, so these data do not single it out as a target.
Limitations
The coaches were recruited in Switzerland (Ackeret et al., 2022a, p. 3), so the findings apply to Swiss coaches. Some sports may be over- or underrepresented, women were underrepresented, and coaches with higher burnout may have been less likely to take part (Ackeret et al., 2022a, p. 6).
Future Directions
More frequent assessments across a competitive season could test whether the path from self-compassion to burnout operates over weeks rather than months. Randomized trials of brief self-compassion training for coaches that measure self-criticism and kindness separately would test whether reducing self-critical responding reduces later exhaustion. The path should also be tested with multimethod burnout criteria and in samples beyond this Swiss coach panel. Experimental assignment of self-responding would test whether changing uncompassionate self-responding changes later burnout. Coaching-specific effect-size benchmarks and parcel designs that isolate facet-unique variance would sharpen the interpretation of estimates.
Conclusion
By removing stable differences between coaches with random intercepts, the design estimates the within-person path from self-compassion to later burnout directly, with its uncertainty stated as an estimate and a 95% CI rather than as a yes-or-no decision. The estimate does not yet justify burnout-prevention trials that build self-compassion.
Appendix A
Deviations from the Frozen Analysis Plan
Every departure from the analysis plan frozen on October 24, 2026, that affects the confirmatory analyses reported here is listed below with its date. This analysis was not registered; the plan was frozen under version control (see Transparency and Openness). Reporting follows the Journal Article Reporting Standards for quantitative research (Appelbaum et al., 2018). A time-stamped registered plan is the criterion for registration (Nosek et al., 2018); none was filed for this analysis.
Primary Hypothesis Estimand (October 30, 2026). The hypothesis retained for the primary estimand is the one in the analysis plan frozen on October 24, 2026: higher-than-usual total self-compassion predicts lower burnout at the next wave. A later draft protocol proposed a narrower hypothesis based on uncompassionate self-responding; I retained the frozen hypothesis (October 28, 2026), and analyses that separate compassionate and uncompassionate self-responding are reported as exploratory.
Reporting and multiplicity (recorded with the analyses reported here). The analysis plan named Hypothesis 1 as the single planned test at α = .05 and set a Holm correction for secondary tests. I report estimates with 95% confidence intervals and no p values; the Holm correction was not applied.
Dynamic fit indexes (departure recorded in the analysis materials). The analysis plan named dynamic fit index cutoffs (McNeish & Wolf, 2023); they were not computed, so invariance decisions rest on the fit-change criteria stated in the Analytic Strategy.
Bayesian sensitivity analysis (not run). The analysis plan listed a Bayesian RI-CLPM as a sensitivity analysis, conditional on sourcing its priors; that analysis was not run, and its sampler, convergence, and model-comparison settings were not specified.
Hypothesis 2 specification (post-freeze). The analysis plan did not say whether self-compassion stays in the Hypothesis 2 RI-CLPM of perceived social support and burnout; I did not include it, a choice made after the plan was frozen.
On October 31, 2026, the analyses were run under a later revision of the frozen analysis plan and analysis script that corrected a software version label and changed run controls without changing estimation; the revision is documented in the analysis materials, and the run completed for all 32 of 32 specifications.
References
- Ackeret, N. The contribution of self-compassion and social support to the mental health of coaches and athletes in elite sport . Doctoral dissertation;BORIS Theses, University of Bern, 2025. [Google Scholar] [CrossRef] [PubMed]
- Ackeret, N.; Röthlin, P.; Allemand, M.; Krieger, T.; Berger, T.; Znoj, H.; Kenttä, G.; Birrer, D.; Horvath, S. Six-month stability of individual differences in sports coaches’ burnout, self-compassion and social support. Psychol. Sport Exerc. 61 2022a, 102207. [Google Scholar] [CrossRef]
- Ackeret, N.; Röthlin, P.; Allemand, M.; Krieger, T.; Berger, T.; Znoj, H.; Kenttä, G.; Birrer, D.; Horvath, S. Six-month stability of individual differences in sports coaches’ burnout, self-compassion and social support [Dataset]. Dryad 2022b. [Google Scholar] [CrossRef]
- Amemiya, R.; Sakairi, Y. The role of self-compassion in athlete mindfulness and burnout: Examination of the effects of gender differences. Personal. Individ. Differ. 166 2020, 110167. [Google Scholar] [CrossRef]
- Appelbaum, M.; Cooper, H.; Kline, R. B.; Mayo-Wilson, E.; Nezu, A. M.; Rao, S. M. Journal article reporting standards for quantitative research in psychology: The APA Publications and Communications Board task force report. Am. Psychol. Correction published 2018, American Psychologist, 73(7), 947. 2018, 73(1), 3–25. [Google Scholar] [CrossRef]
- Chen, F. F. Sensitivity of goodness of fit indexes to lack of measurement invariance. Struct. Equ. Model. 2007, 14(3), 464–504. [Google Scholar] [CrossRef]
- Cumming, G. The new statistics: Why and how. Psychol. Sci. 2014, 25(1), 7–29. [Google Scholar] [CrossRef] [PubMed]
- Brenner, R. E.; Heath, P. J.; Vogel, D. L.; Credé, M. Two is more valid than one: Examining the factor structure of the Self-Compassion Scale (SCS). J. Couns. Psychol. 2017, 64(6), 696–707. [Google Scholar] [CrossRef] [PubMed]
- Depaoli, S.; van de Schoot, R. Improving transparency and replication in Bayesian statistics: The WAMBS-Checklist. Psychol. Methods 2017, 22(2), 240–261. [Google Scholar] [CrossRef] [PubMed]
- Enders, C. K. Missing data: An update on the state of the art. Psychol. Methods 2025, 30(2), 322–339. [Google Scholar] [CrossRef] [PubMed]
- Gao, Y.; Wang, L. A study on the relationship and path between mental health and burnout of Chinese athletes. Front. Psychol. 15 2024, 1422207. [Google Scholar] [CrossRef] [PubMed]
- Gilbert, P. Introducing compassion-focused therapy. Adv. Psychiatr. Treat. 2009, 15(3), 199–208. [Google Scholar] [CrossRef]
- Gilbert, P.; Procter, S. Compassionate mind training for people with high shame and self-criticism: Overview and pilot study of a group therapy approach. Clin. Psychol. Psychother. 2006, 13(6), 353–379. [Google Scholar] [CrossRef]
- Hailikari, T.; Kosenkranius, M.; Rönkkönen, S.; Virtanen, V. Self-criticism unveiled: Its interplay with burnout and self-compassion in higher education students’ study achievement. Learn. Individ. Differ. 120 2025, 102692. [Google Scholar] [CrossRef]
- Hamaker, E. L.; Kuiper, R. M.; Grasman, R. P. P. P. A critique of the cross-lagged panel model. Psychol. Methods 2015, 20(1), 102–116. [Google Scholar] [CrossRef] [PubMed]
- Harris, B. S. Coach and athlete burnout: The role of coaches’ decision-making style . Master’s thesis;The Research Repository @ WVU, West Virginia University, 2005. [Google Scholar] [CrossRef]
- Little, T. D.; Rhemtulla, M.; Gibson, K.; Schoemann, A. M. Why the items versus parcels controversy needn’t be one. Psychol. Methods 2013, 18(3), 285–300. [Google Scholar] [CrossRef] [PubMed]
- McEwan, K.; Zhang, S. Longitudinal influence of self-compassion and fears of compassion on prosocial and antisocial behaviour in sport: A conditional latent growth curve modelling analysis. Int. J. Sport Exerc. Psychol. 2024, 22(7), 1743–1758. [Google Scholar] [CrossRef]
- McNeish, D.; Wolf, M. G. Dynamic fit index cutoffs for confirmatory factor analysis models. Psychol. Methods 2023, 28(1), 61–88. [Google Scholar] [CrossRef] [PubMed]
- Mulder, J. D.; Hamaker, E. L. Three extensions of the random intercept cross-lagged panel model. Struct. Equ. Model. A Multidiscip. J. 2021, 28(4), 638–648. [Google Scholar] [CrossRef]
- Muris, P.; Otgaar, H. The process of science: A critical evaluation of more than 15 years of research on self-compassion with the Self-Compassion Scale. Mindfulness 2020, 11(6), 1469–1482. [Google Scholar] [CrossRef]
- Muris, P.; Petrocchi, N. Protection or vulnerability? A meta-analysis of the relations between the positive and negative components of self-compassion and psychopathology. Clin. Psychol. Psychother. 2017, 24(2), 373–383. [Google Scholar] [CrossRef] [PubMed]
- Neff, K. D. The development and validation of a scale to measure self-compassion. Self Identity 2003a, 2(3), 223–250. [Google Scholar] [CrossRef]
- Neff, K. D. Self-compassion: An alternative conceptualization of a healthy attitude toward oneself. Self Identity 2003b, 2(2), 85–101. [Google Scholar] [CrossRef]
- Neff, K. D.; Tóth-Király, I.; Yarnell, L. M.; Arimitsu, K.; Castilho, P.; Ghorbani, N.; Guo, H. X.; Hirsch, J. K.; Hupfeld, J.; Hutz, C. S.; Kotsou, I.; Lee, W. K.; Montero-Marin, J.; Sirois, F. M.; de Souza, L. K.; Svendsen, J. L.; Wilkinson, R. B.; Mantzios, M. Examining the factor structure of the Self-Compassion Scale in 20 diverse samples: Support for use of a total score and six subscale scores. Psychol. Assess. 2019, 31(1), 27–45. [Google Scholar] [CrossRef] [PubMed]
- Nosek, B. A.; Ebersole, C. R.; DeHaven, A. C.; Mellor, D. T. The preregistration revolution. Proc. Natl. Acad. Sci. 2018, 115(11), 2600–2606. [Google Scholar] [CrossRef] [PubMed]
- Putnick, D. L.; Bornstein, M. H. Measurement invariance conventions and reporting: The state of the art and future directions for psychological research. Dev. Rev. 41 2016, 71–90. [Google Scholar] [CrossRef] [PubMed]
- Raedeke, T. D.; Smith, A. L. Development and preliminary validation of an athlete burnout measure. J. Sport Exerc. Psychol. 2001, 23(4), 281–306. [Google Scholar] [CrossRef] [PubMed]
- Raes, F.; Pommier, E.; Neff, K. D.; Van Gucht, D. Construction and factorial validation of a short form of the Self-Compassion Scale. Clin. Psychol. Psychother. 2011, 18(3), 250–255. [Google Scholar] [CrossRef] [PubMed]
- Rosseel, Y. lavaan: An R package for structural equation modeling. J. Stat. Softw. 2012, 48(2), 1–36. [Google Scholar] [CrossRef]
- Simonsohn, U.; Simmons, J. P.; Nelson, L. D. Specification curve analysis. Nat. Hum. Behav. 2020, 4(11), 1208–1214. [Google Scholar] [CrossRef] [PubMed]
- Souza, F. L. X. Autocriticismo e medo da autocompaixão no trabalho [Self-criticism and fear of self-compassion at work]. Master’s thesis;Universidade Federal de Minas Gerais, Repositório Institucional da UFMG, 2024. Available online: https://hdl.handle.net/1843/78795.
- Steegen, S.; Tuerlinckx, F.; Gelman, A.; Vanpaemel, W. Increasing transparency through a multiverse analysis. Perspect. Psychol. Sci. 2016, 11(5), 702–712. [Google Scholar] [CrossRef] [PubMed]
Figure 1.
Within-Person Paths Between Self-Compassion and Burnout Note. N = 422 coaches (FIML analytic sample; wave complete-case counts: 420 baseline, 301 at 3 months, 259 at 6 months). Random-intercept cross-lagged panel model (RI-CLPM) of within-person total self-compassion and burnout across three waves, estimated with robust maximum likelihood (MLR). Random intercepts for self-compassion and burnout are both centered on the 3-month wave. Thin solid gray lines = random-intercept factor loadings. Autoregressive and cross-lagged paths are equality-constrained across intervals. Solid arrows show the Hypothesis 1 path (total self-compassion to burnout); dashed arrows show autoregressive and reverse paths. Standardized MLR β with 95% CIs appear in the inset estimates table, not on the paths. Hypothesis 1 predicted a negative path from total self-compassion to burnout (β < 0). H1 = Hypothesis 1; Std. = standardized; CI = confidence interval; MLR = robust maximum likelihood; FIML = full-information maximum likelihood.
Figure 1.
Within-Person Paths Between Self-Compassion and Burnout Note. N = 422 coaches (FIML analytic sample; wave complete-case counts: 420 baseline, 301 at 3 months, 259 at 6 months). Random-intercept cross-lagged panel model (RI-CLPM) of within-person total self-compassion and burnout across three waves, estimated with robust maximum likelihood (MLR). Random intercepts for self-compassion and burnout are both centered on the 3-month wave. Thin solid gray lines = random-intercept factor loadings. Autoregressive and cross-lagged paths are equality-constrained across intervals. Solid arrows show the Hypothesis 1 path (total self-compassion to burnout); dashed arrows show autoregressive and reverse paths. Standardized MLR β with 95% CIs appear in the inset estimates table, not on the paths. Hypothesis 1 predicted a negative path from total self-compassion to burnout (β < 0). H1 = Hypothesis 1; Std. = standardized; CI = confidence interval; MLR = robust maximum likelihood; FIML = full-information maximum likelihood.
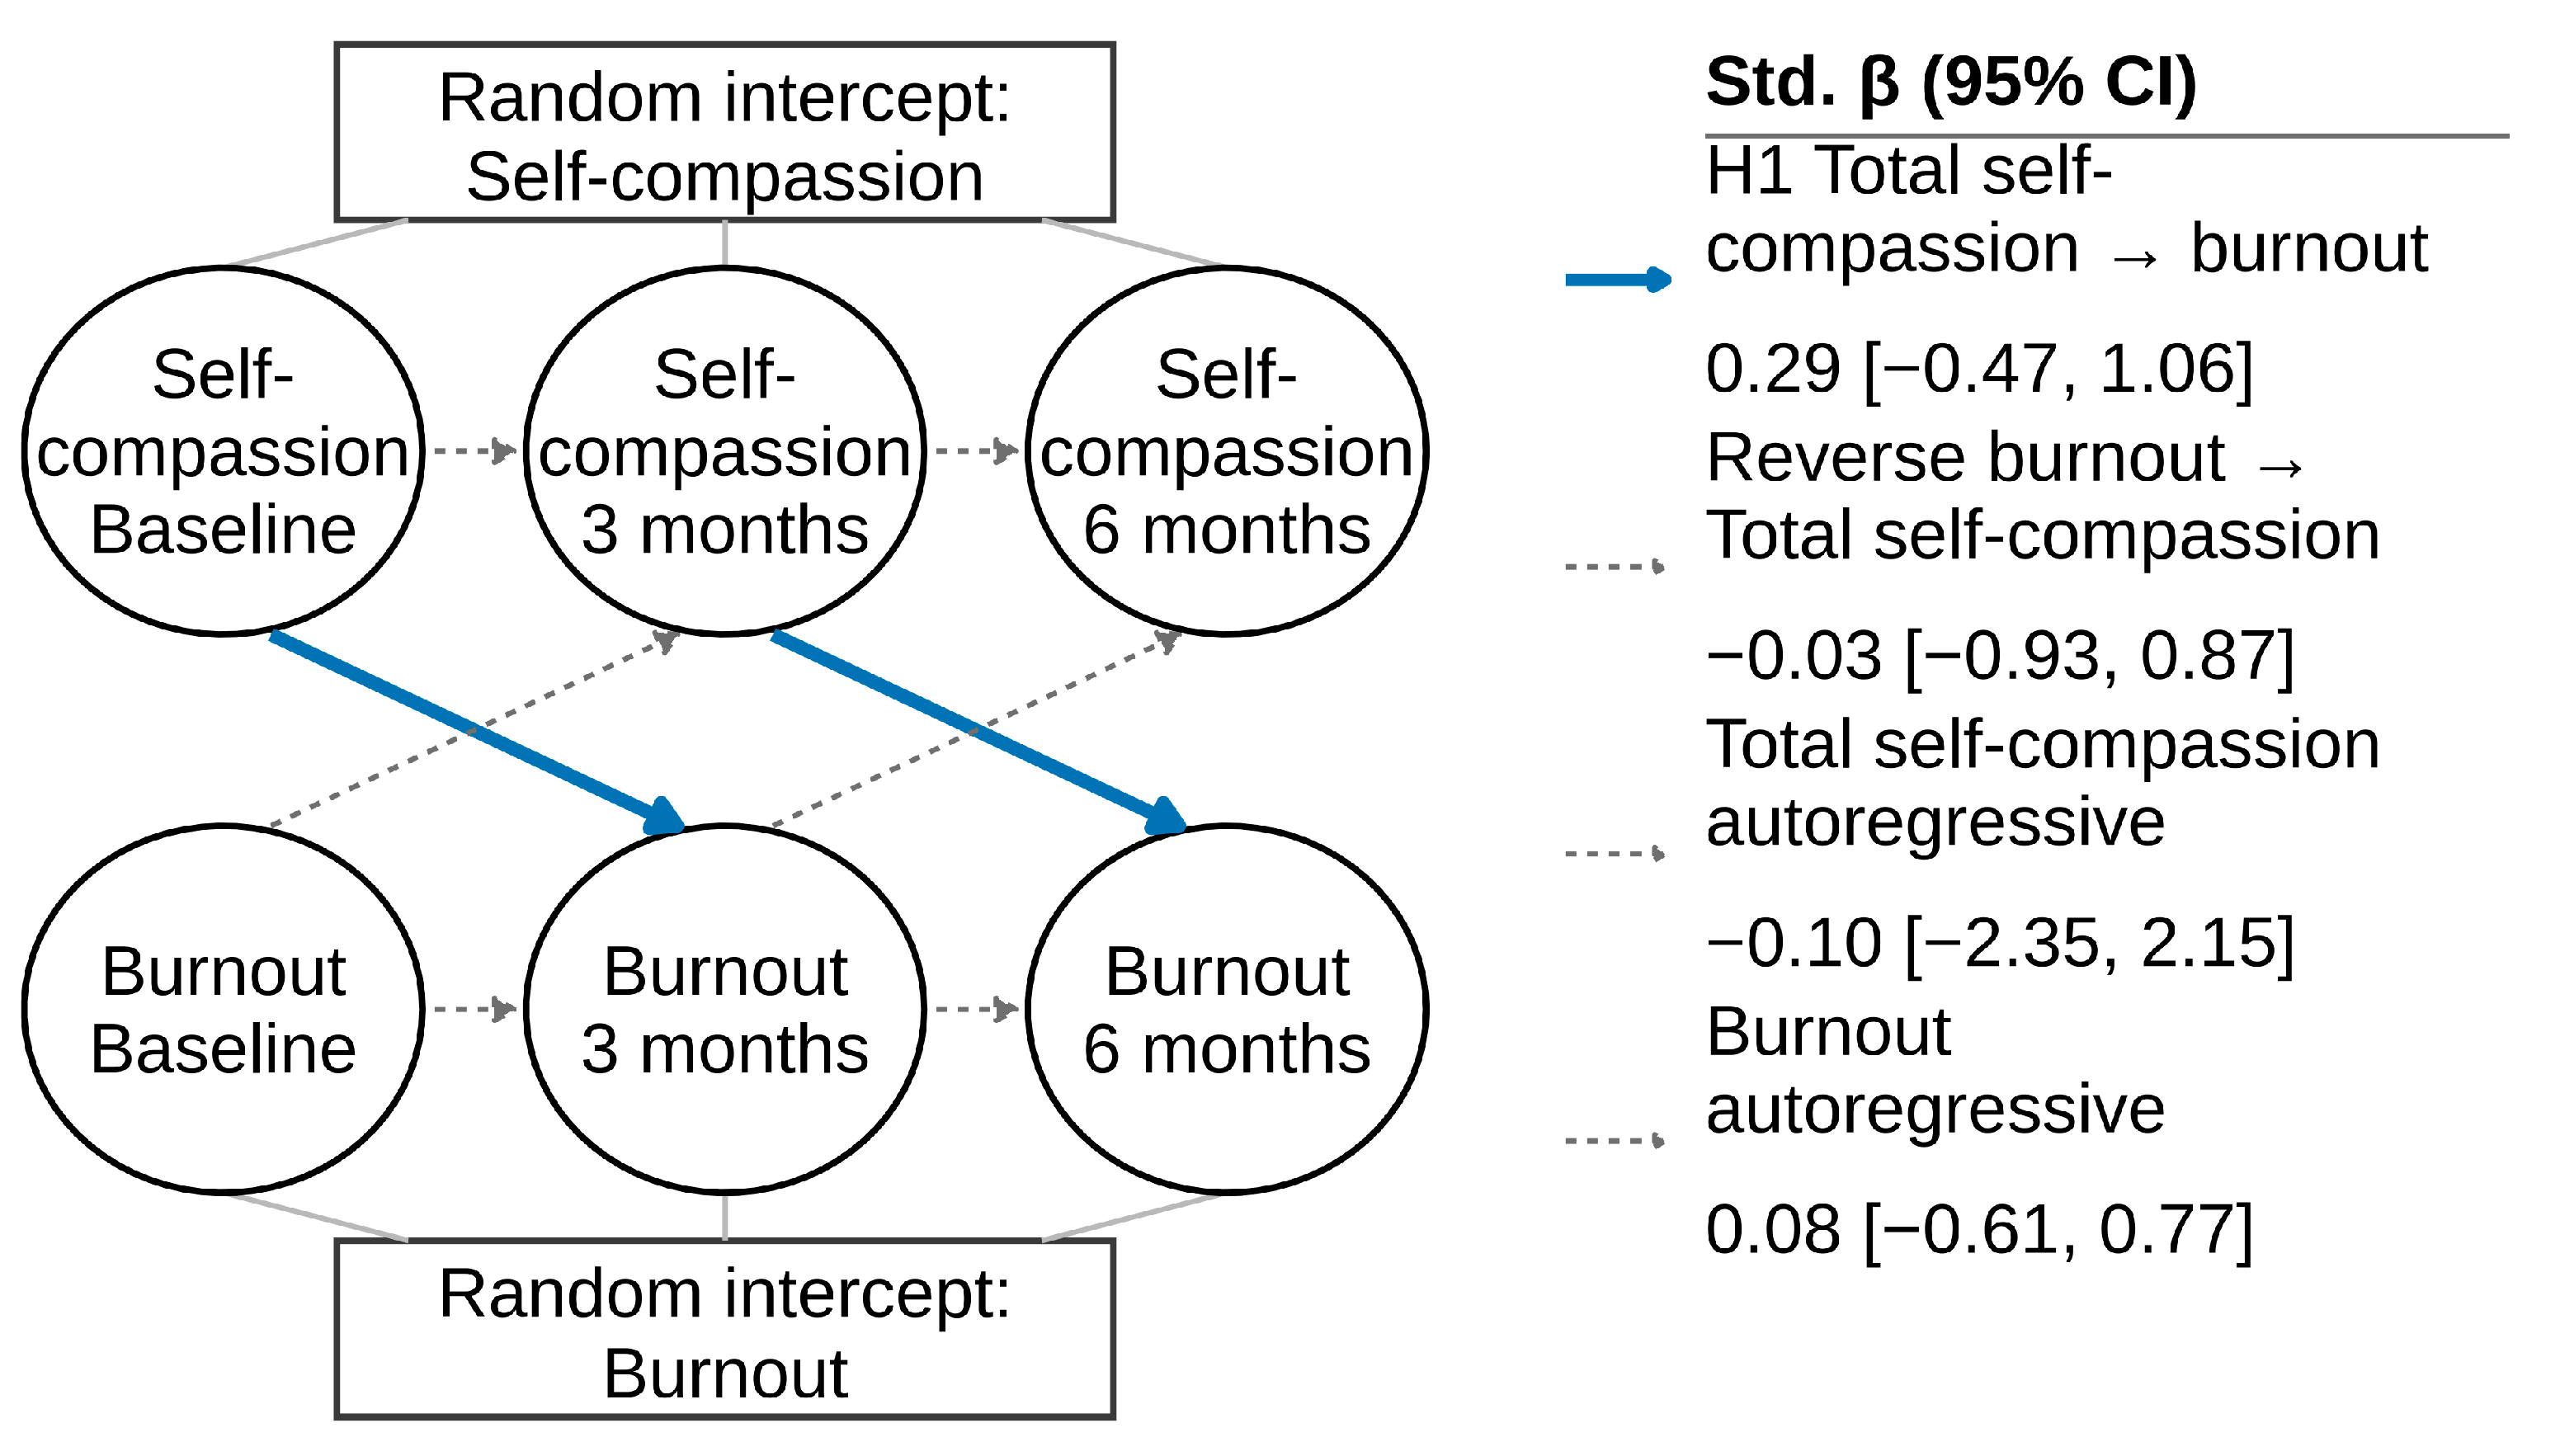
Figure 2.
Specification Curve for the Path From Self-Compassion to Burnout Note. N = 422 coaches. (a) Standardized path from total self-compassion to burnout in each of 32 specifications, sorted by estimate; points are robust maximum likelihood (MLR) estimates; vertical lines are 95% confidence intervals (CIs); filled black = CI excludes 0; open = CI includes 0; × (Non-conv.) = nonconverged specification; the accent (primary) point and horizontal accent line mark the primary MLR random-intercept cross-lagged panel model (RI-CLPM) specification (equal lags, parcels, full-information maximum likelihood (FIML), without social support; β = 0.29, 95% CI [−0.47, 1.06]). (b) Analytic choices for each specification (filled = included, open = not included). All 32 CIs include 0. The five specification factors are those set in the analysis plan (see Analytic Strategy). CLPM = cross-lagged panel model; FIML = full-information maximum likelihood; CI = confidence interval; H1 = Hypothesis 1.
Figure 2.
Specification Curve for the Path From Self-Compassion to Burnout Note. N = 422 coaches. (a) Standardized path from total self-compassion to burnout in each of 32 specifications, sorted by estimate; points are robust maximum likelihood (MLR) estimates; vertical lines are 95% confidence intervals (CIs); filled black = CI excludes 0; open = CI includes 0; × (Non-conv.) = nonconverged specification; the accent (primary) point and horizontal accent line mark the primary MLR random-intercept cross-lagged panel model (RI-CLPM) specification (equal lags, parcels, full-information maximum likelihood (FIML), without social support; β = 0.29, 95% CI [−0.47, 1.06]). (b) Analytic choices for each specification (filled = included, open = not included). All 32 CIs include 0. The five specification factors are those set in the analysis plan (see Analytic Strategy). CLPM = cross-lagged panel model; FIML = full-information maximum likelihood; CI = confidence interval; H1 = Hypothesis 1.
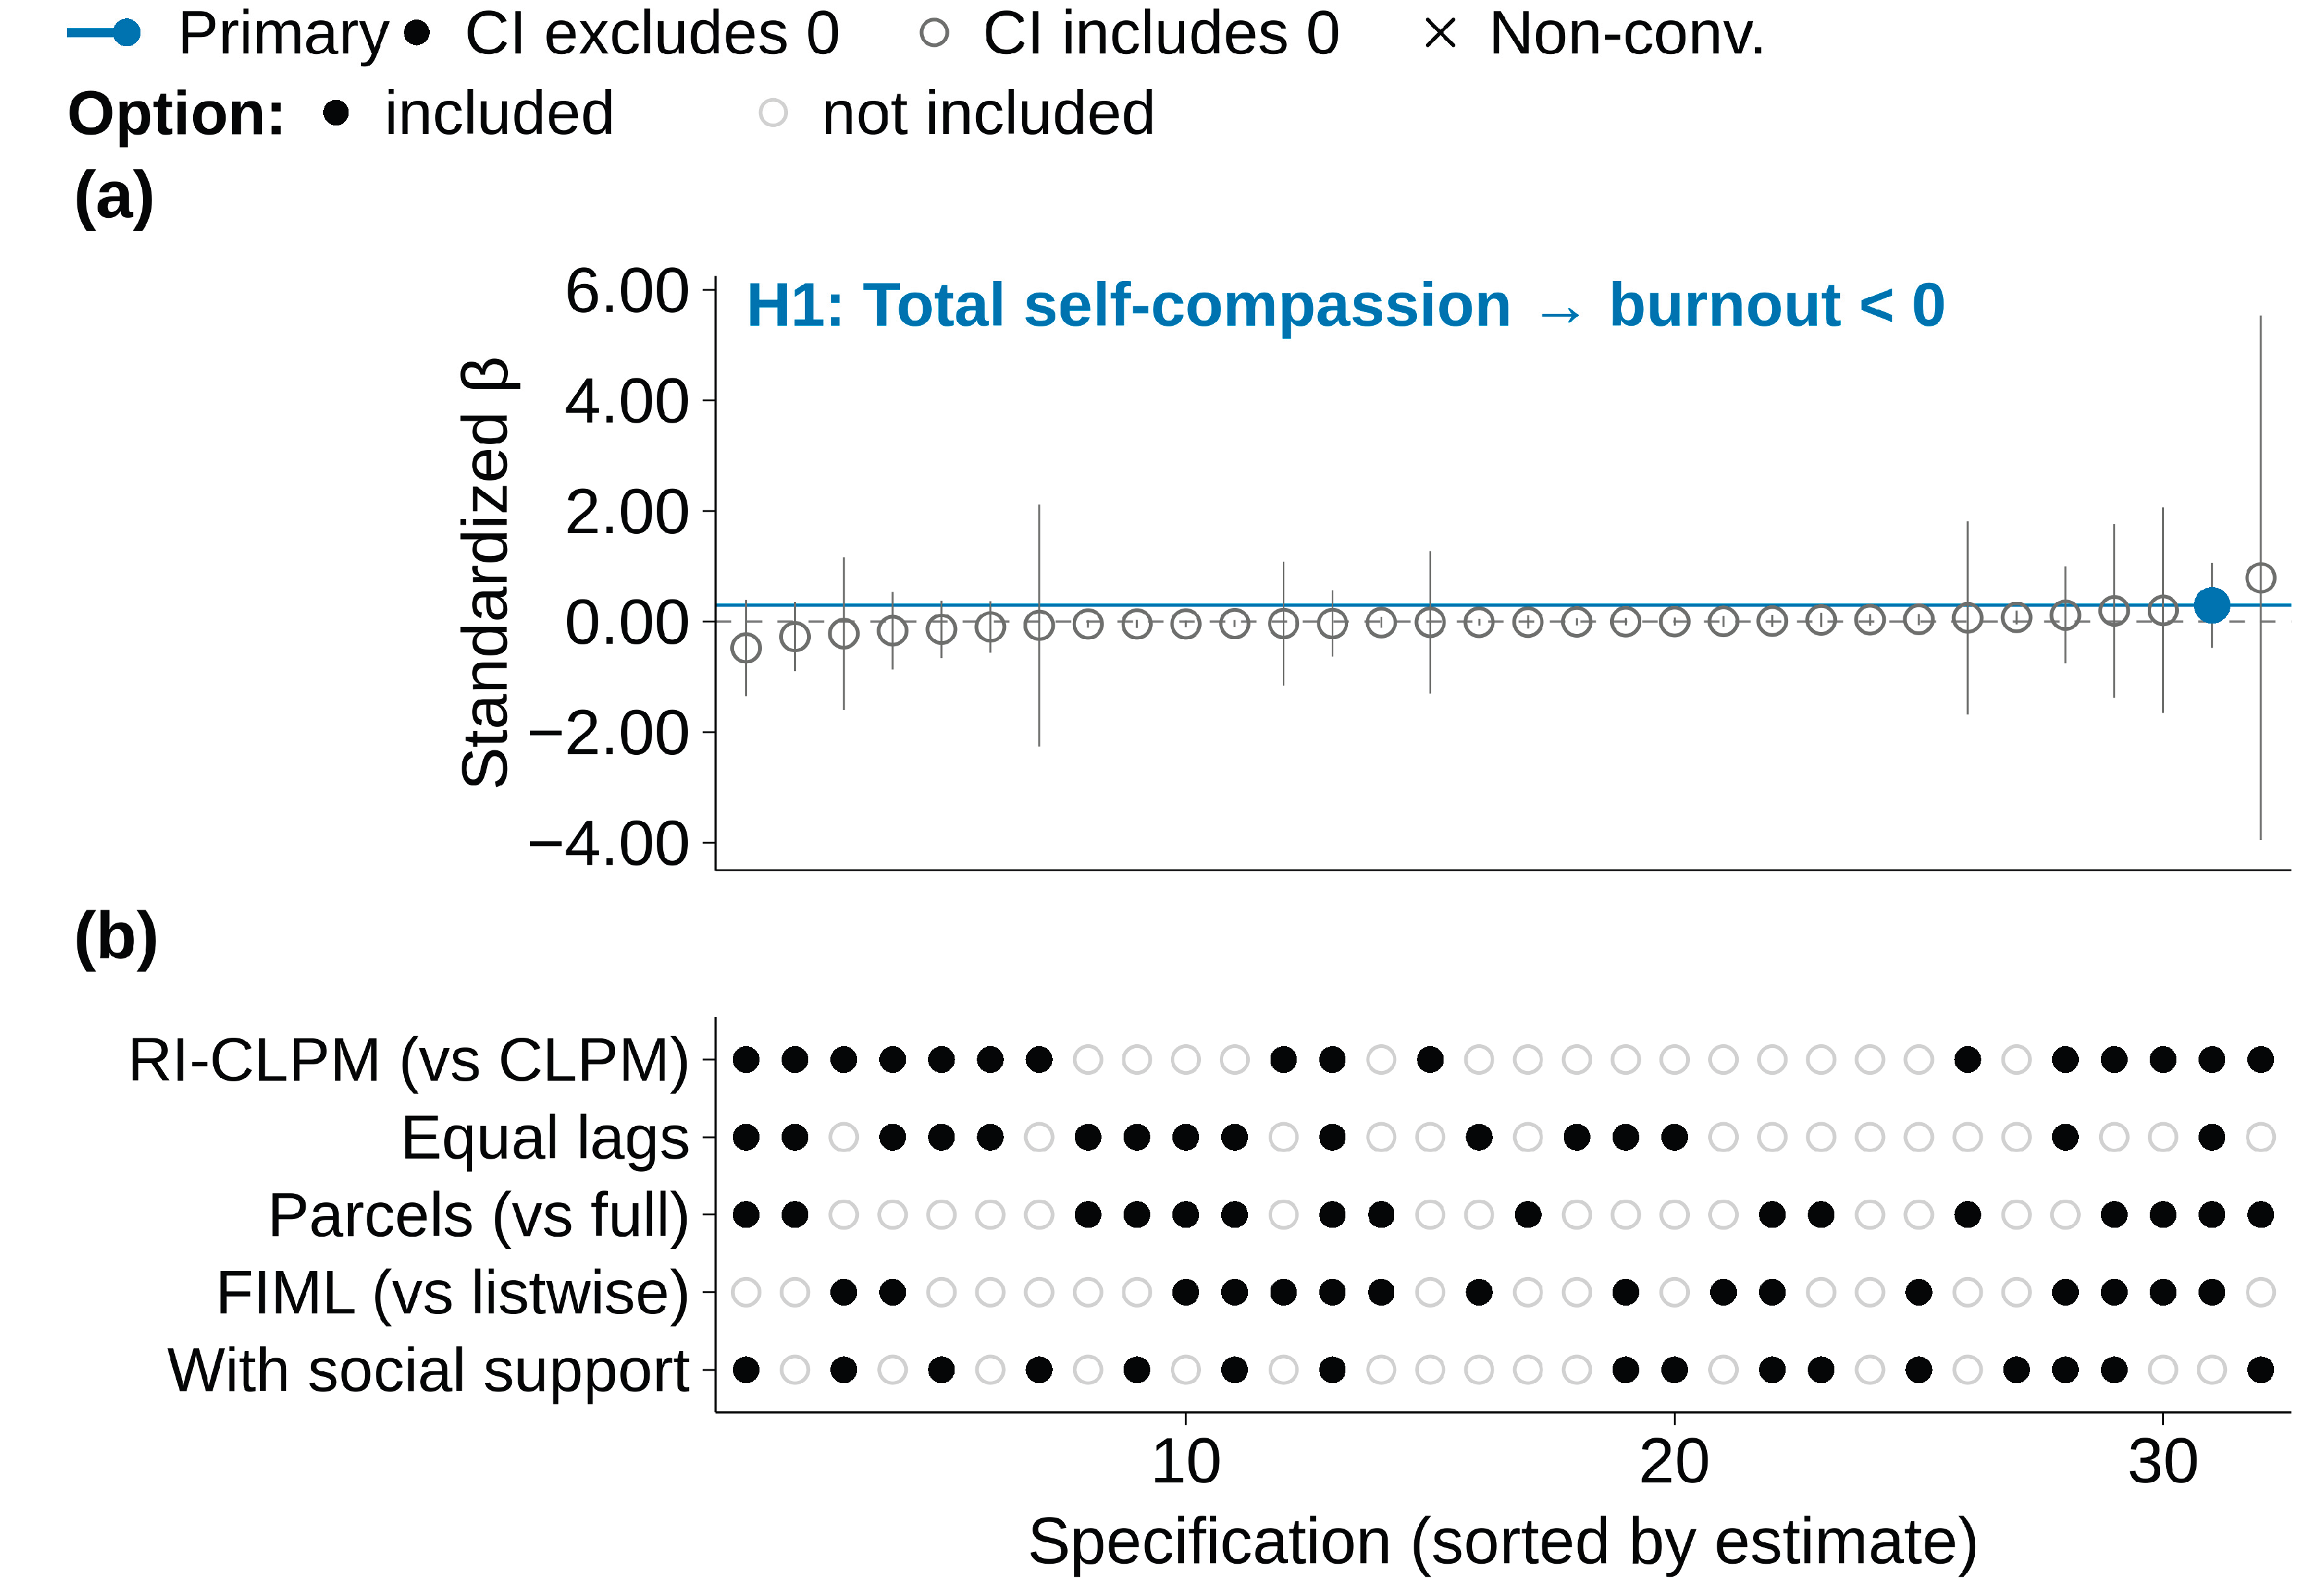

Table 1.
Descriptive Statistics and Reliability by Wave.
| Construct | Wave | n | M | SD | Reliability |
| Self-compassion | Baseline | 420 | 3.5 | 0.5 | .73 |
| Compassionate SR | Baseline | 420 | 3.4 | 0.5 | .57 |
| Uncompassionate SR | Baseline | 420 | 2.3 | 0.7 | .79 |
| Burnout | Baseline | 420 | 2.0 | 0.6 | .88 |
| Perceived social support | Baseline | 420 | 4.2 | 0.7 | .85 |
| Self-compassion | 3 months | 301 | 3.5 | 0.5 | .77 |
| Compassionate SR | 3 months | 301 | 3.4 | 0.6 | .63 |
| Uncompassionate SR | 3 months | 301 | 2.4 | 0.7 | .79 |
| Burnout | 3 months | 301 | 2.0 | 0.5 | .87 |
| Perceived social support | 3 months | 301 | 4.2 | 0.7 | .85 |
| Self-compassion | 6 months | 259 | 3.6 | 0.5 | .77 |
| Compassionate SR | 6 months | 259 | 3.4 | 0.6 | .64 |
| Uncompassionate SR | 6 months | 259 | 2.3 | 0.7 | .82 |
| Burnout | 6 months | 259 | 1.9 | 0.5 | .88 |
| Perceived social support | 6 months | 259 | 4.2 | 0.7 | .85 |
Note. Self-compassion and burnout items were rated from 1 (almost never) to 5 (almost always), and social support items from 1 (not true at all) to 5 (very true). SR = self-responding (compassionate SR; uncompassionate SR). Wave-specific ns are complete cases at that wave (baseline = 420, 3 months = 301, 6 months = 259). The analytic RI-CLPM N = 422 is the FIML sample; two analytic cases lack baseline self-report on these scales (baseline n = 420). Reliability is Cronbach’s α. Intercorrelations among the observed study variables appear in Table 2. M = mean; SD = standard deviation; RI-CLPM = random-intercept cross-lagged panel model; FIML = full-information maximum likelihood.
Table 2.
Means, Standard Deviations, and Intercorrelations for Observed Study Variables.
| Variable | n | M | SD | 1 | 2 | 3 | 4 | 5 | 6 | 7 | 8 | 9 | 10 | 11 | 12 | 13 | 14 | 15 |
| 1. SC t1 | 420 | 3.5 | 0.5 | — | ||||||||||||||
| 2. CS t1 | 420 | 3.4 | 0.5 | .72 | — | |||||||||||||
| 3. UCS t1 | 420 | 2.3 | 0.7 | −.85 | −.24 | — | ||||||||||||
| 4. BO t1 | 420 | 2.0 | 0.6 | −.36 | −.11 | .42 | — | |||||||||||
| 5. SU t1 | 420 | 4.2 | 0.7 | .23 | .06 | −.28 | −.25 | — | ||||||||||
| 6. SC t2 | 301 | 3.5 | 0.5 | .78 | .53 | −.69 | −.38 | .27 | — | |||||||||
| 7. CS t2 | 301 | 3.4 | 0.6 | .60 | .66 | −.33 | −.21 | .15 | .78 | — | ||||||||
| 8. UCS t2 | 301 | 2.4 | 0.7 | −.69 | −.26 | .76 | .40 | −.28 | −.87 | −.37 | — | |||||||
| 9. BO t2 | 301 | 2.0 | 0.5 | −.34 | −.07 | .42 | .78 | −.35 | −.39 | −.21 | .42 | — | ||||||
| 10. SU t2 | 301 | 4.2 | 0.7 | .24 | .05 | −.29 | −.24 | .72 | .30 | .19 | −.30 | −.39 | — | |||||
| 11. SC t3 | 259 | 3.6 | 0.5 | .76 | .50 | −.69 | −.38 | .33 | .83 | .62 | −.75 | −.43 | .32 | — | ||||
| 12. CS t3 | 259 | 3.4 | 0.6 | .61 | .67 | −.33 | −.20 | .19 | .61 | .71 | −.34 | −.23 | .21 | .72 | — | |||
| 13. UCS t3 | 259 | 2.3 | 0.7 | −.61 | −.19 | .71 | .38 | −.32 | −.70 | −.34 | .79 | .43 | −.29 | −.85 | −.26 | — | ||
| 14. BO t3 | 259 | 1.9 | 0.5 | −.35 | −.12 | .40 | .74 | −.34 | −.40 | −.26 | .40 | .80 | −.27 | −.45 | −.20 | .48 | — | |
| 15. SU t3 | 259 | 4.2 | 0.7 | .23 | .07 | −.27 | −.25 | .80 | .25 | .14 | −.27 | −.34 | .77 | .29 | .18 | −.28 | −.32 | — |
Note. Cells below the diagonal are pairwise Pearson correlations among observed construct scores at baseline (t1), 3 months (t2), and 6 months (t3). Pairwise ns range from 258 to 420. Diagonal cells are em dashes. Upper-triangle cells are blank. Variable stubs and column heads are numbered 1–15 in the order shown. SC = self-compassion total; CS = compassionate self-responding; UCS = uncompassionate self-responding; BO = burnout; SU = perceived social support; SR = self-responding; t1 = baseline; t2 = 3 months; t3 = 6 months. Wave ns, means, and standard deviations match the panel descriptives used in Table 1. Reporting of intercorrelations with ns follows JARS for quantitative research (Appelbaum et al., 2018). n = sample size; M = mean; SD = standard deviation; JARS = Journal Article Reporting Standards.
Table 3.
Longitudinal Measurement Invariance.
| Construct | Model | χ²(df) | CFI | RMSEA | SRMR | ΔCFI | ΔRMSEA |
| Self-compassion | Configural | 16.00 (15) | 1.000 | .000 | .014 | — | — |
| Self-compassion | Metric | 17.83 (19) | 1.000 | .000 | .018 | .000 | .000 |
| Self-compassion | Partial scalar | 20.28 (21) | 1.000 | .000 | .021 | .000 | .000 |
| Burnout | Configural | 9.91 (15) | 1.000 | .000 | .011 | — | — |
| Burnout | Metric | 12.63 (19) | 1.000 | .000 | .017 | .000 | .000 |
| Burnout | Scalar | 17.73 (23) | 1.000 | .000 | .019 | .000 | .000 |
| Perceived social support | Configural | 10.37 (15) | 1.000 | .000 | .013 | — | — |
| Perceived social support | Metric | 10.85 (19) | 1.000 | .000 | .015 | .000 | .000 |
| Perceived social support | Scalar | 13.19 (23) | 1.000 | .000 | .016 | .000 | .000 |
Note. Self-compassion, burnout, and perceived social support were each modeled with three parcels. ΔCFI and ΔRMSEA are changes from the preceding, less constrained model (configural cells = —). Invariance was evaluated with Chen’s (2007) criteria: ΔCFI ≤ .010 together with ΔRMSEA ≤ .015. Partial scalar invariance for self-compassion was obtained by freeing the h1SCPB intercept (Putnick & Bornstein, 2016). CFI = comparative fit index; RMSEA = root mean square error of approximation; SRMR = standardized root mean square residual; SC = self-compassion; h1SCPB = self-compassion Parcel B intercept in the Hypothesis 1 longitudinal CFA; CFA = confirmatory factor analysis.
Table 4.
Within-Person Paths in the Random-Intercept Cross-Lagged Panel Models.
| Path | β | b | SE | 95% CI |
| SC → burnout (baseline → 3 mo.) | 0.29 | 0.31 | 0.39 | [−0.47, 1.06] |
| SC → burnout (3 → 6 mo.) | 0.14 | 0.31 | 0.14 | [−0.13, 0.41] |
| Burnout → SC (baseline → 3 mo.) | −0.03 | −0.01 | 0.46 | [−0.93, 0.87] |
| Burnout → SC (3 → 6 mo.) | −0.02 | −0.01 | 0.25 | [−0.51, 0.48] |
| Social support → burnout (baseline → 3 mo.) | −0.27 | −0.22 | 0.19 | [−0.63, 0.09] |
| Social support → burnout (3 → 6 mo.) | −0.28 | −0.22 | 0.21 | [−0.70, 0.14] |
| Burnout → social support (baseline → 3 mo.) | −0.44 | −0.61 | 0.19 | [−0.81, −0.06] |
| Burnout → social support (3 → 6 mo.) | −0.50 | −0.61 | 0.30 | [−1.10, 0.09] |
| Note. Self-compassion, perceived social support, and burnout are latent factors with three parcels each. Autoregressive and cross-lagged paths are constrained equal across the two intervals; standardized estimates differ by interval because within-person variances differ by wave. The paths from self-compassion to burnout estimate Hypothesis 1, the paths from burnout to self-compassion estimate Research Question 1, and the paths from perceived social support to burnout estimate Hypothesis 2. Exploratory paths appear in Table 5. Autoregressive paths and residual covariances appear in the supplement. β = standardized within-person cross-lagged estimate from the Hypothesis 1 RI-CLPM (first four rows) and from the Hypothesis 2 RI-CLPM of perceived social support and burnout (last four rows), each estimated with MLR; b = unstandardized estimate; SE = standard error of β; CI = confidence interval; RI-CLPM = random-intercept cross-lagged panel model; MLR = robust maximum likelihood; SC = self-compassion; “social support” denotes perceived social support; H1 = Hypothesis 1; H2 = Hypothesis 2. Inference rests on the 95% confidence intervals; intervals that exclude zero indicate a directionally signed within-person path at the 95% level (APA 7 §6.43; Cumming, 2014). H1 RI-CLPM fit: χ²(121) = 149.41. H2 RI-CLPM fit: χ²(123) = 156.10. | ||||
Table 5.
Exploratory Within-Person Paths for Compassionate and Uncompassionate Self-Responding.
| Path | β | b | SE | 95% CI |
| Uncompassionate SR → burnout | 0.01 | 0.00 | 0.37 | [−0.72, 0.73] |
| Compassionate SR → burnout | 0.41 | 0.31 | 0.46 | [−0.49, 1.32] |
| Burnout → compassionate SR | 0.01 | 0.01 | 0.37 | [−0.71, 0.73] |
| Burnout → uncompassionate SR | 0.20 | 0.10 | 0.84 | [−1.44, 1.85] |
Note. Reported β, SE, and 95% CI values are the baseline-to-3-months (first-interval) standardized estimates; under equal unstandardized lags the standardized estimates can differ for the 3-to-6-months interval. The model was specified after the analysis plan was frozen. β = standardized within-person cross-lagged estimate from an exploratory RI-CLPM estimated with MLR, in which self-compassion is replaced by correlated compassionate and uncompassionate self-responding factors, each with its six items as indicators, and total burnout has the three dimension scores as indicators; b = unstandardized estimate; RI-CLPM = random-intercept cross-lagged panel model; MLR = robust maximum likelihood; SE = standard error; CI = confidence interval; SR = self-responding (compassionate SR; uncompassionate SR). Inference rests on the 95% confidence intervals; intervals that exclude zero indicate a directionally signed within-person path at the 95% level (APA 7 §6.43; Cumming, 2014). RI-CLPM fit: χ²(924) = 1585.28, CFI = .909, RMSEA = .047, SRMR = .074; CFI = comparative fit index; RMSEA = root mean square error of approximation; SRMR = standardized root mean square residual.
Disclaimer/Publisher’s Note: The statements, opinions and data contained in all publications are solely those of the individual author(s) and contributor(s) and not of MDPI and/or the editor(s). MDPI and/or the editor(s) disclaim responsibility for any injury to people or property resulting from any ideas, methods, instructions or products referred to in the content. |
© 2026 by the author. Licensee MDPI, Basel, Switzerland. This article is an open access article distributed under the terms and conditions of the Creative Commons Attribution (CC BY) license.
Copyright: This open access article is published under a Creative Commons CC BY 4.0 license, which permit the free download, distribution, and reuse, provided that the author and preprint are cited in any reuse.