

Submitted:
03 November 2026
Posted:
05 November 2026
You are already at the latest version
Abstract
The molecular architecture of the growth-regulating hypothalamus-pituitary-muscle (H-P-M) axis is poorly understood. We performed integrative transcriptomic analysis of the hypothalamus, pituitary, and longissimus dorsi muscle from Liangshan black sheep with superior growth performance to dissect this regulatory network. Analysis of 3,422 differentially expressed genes (DEGs) identified across pairwise tissue comparisons revealed a three-tiered regulatory architecture: (1) tissue-specific interfaces defining spatial hierarchy, (2) relay modules for temporal dynamics, and (3) shared core hubs (131 genes) establishing neuro-endocrine-muscle integration. This study provides a multi-level regulatory map of the H-P-M axis, identifying key pathways such as pituitary calcium signaling and hub genes (e.g., NPY), with 12 of 14 candidate genes validated by quantitative PCR. These findings deepen the understanding of neuroendocrine control over skeletal muscle growth and offer novel molecular targets for genetic improvement in livestock.
Keywords:
H-P-M axis
; integrative transcriptomics
; gene regulatory network
; neuroendocrine regulation
; growth performance
1. Introduction
Growth performance is a key economic trait in sheep production, and average daily gain (ADG) is the main phenotypic target for both commercial evaluation and marker-assisted selection. Growth in livestock is a complex quantitative trait that integrates neuroendocrine signaling, hepatic metabolic programming, and peripheral tissue anabolism. These processes are coordinated within the somatotropic axis, in which hypothalamic neurons, pituitary endocrine cells, hepatic effectors, and skeletal myofibers act as one neuro-endocrine-muscular circuit. Within this circuit, the pituitary is the obligatory relay that converts hypothalamic neuropeptide signals into systemic growth hormone (GH) pulses, while the liver acts as a peripheral transducer of GH action through IGF-1 production. Because the pituitary converts neural input into hormonal output, we focus this study on the hypothalamus-pituitary-muscle (H-P-M) axis, spanning the neuroendocrine relay and its terminal muscle effector; the liver, although an important somatotropic node, was not sampled. At the top of this hierarchy, hypothalamic nuclei act as the main coordinators of somatotropic signaling, driving pulsatile secretion of growth hormone-releasing hormone (GHRH) and neuropeptide Y (NPY), which in turn trigger pituitary growth hormone (GH) release into the circulation [1]. GH then acts directly on peripheral tissues and indirectly through hepatic production of insulin-like growth factor-1 (IGF-1), which is induced via JAK2-STAT5 signaling and coordinates substrate partitioning by modulating gluconeogenic and lipogenic pathways [2,3]. Skeletal myofibers, the final effector tissue, convert circulating anabolic hormones into hypertrophic growth by activating mTORC1-mediated protein synthesis and suppressing the ubiquitin-proteasome system. The balance of these processes determines somatic growth.
Despite progress in the genomics of ovine growth through quantitative trait loci (QTL) mapping, genome-wide association studies (GWAS), and whole-genome resequencing [4,5,6], our understanding is limited by two main gaps that prevent a mechanistic, systems-level view. First, most studies focus on commercially improved breeds (e.g., Dorset, Suffolk, and Texel), largely neglecting indigenous breeds that carry adaptive alleles shaped by distinct evolutionary pressures. A clear example is the Chinese Liangshan black sheep (Ovis aries), which tolerates the hypobaric hypoxia and ultraviolet radiation of high-altitude environments [7]. This imbalance matters because about 18% of China's indigenous sheep germplasm faces demographic bottlenecks and risks genetic erosion [8], making functional genomic annotation a conservation priority. Second, and more fundamentally, most transcriptomic studies use reductionist designs focused on single tissues or two-organ comparisons (e.g., liver-muscle pairs) [9]. Such designs, while revealing tissue-autonomous regulation, cannot capture inter-organ crosstalk. In particular, they miss the feed-forward and feedback signaling that carries information from central neuroendocrine centers through peripheral metabolic effectors to terminal anabolic tissues. As a result, the transcriptional coordination across the H-P-M circuit and how it supports superior growth remain unknown, and no systematic multi-tissue transcriptomic study has yet reconstructed the gene regulatory networks (GRNs) underlying ovine growth.
To address these gaps, we performed integrative RNA-sequencing of three functionally coupled tissues—the hypothalamus (HT), the pituitary gland (PIT), and the longissimus dorsi muscle (LD)—in Liangshan black sheep from the cohort with the highest ADG under a fermented onion dietary intervention [10]. We selected the pituitary as the intermediate node because it is the obligatory relay converting hypothalamic input into systemic GH output, and its transcriptome directly reflects the regulatory logic of the ovine somatotropic axis. This design uses an indigenous Chinese breed with strong growth under resource-limited conditions, which may reveal adaptive variants obscured in intensively selected commercial populations. Our objectives were threefold: to build a molecular map of the H-P-M axis; to clarify how coordinated transcription across these three tissues supports growth; and to nominate candidate genes for genomic selection. Beyond improving our understanding of complex traits, these findings provide genomic resources for germplasm characterization, molecular breeding, and conservation of indigenous livestock.
2. Materials and Methods
2.1. Animals, Ethics Statement, and Sample Collection
The biological materials employed in this investigation were obtained from a previous publication [10], which provides comprehensive methodological details regarding the experimental design, diet preparation and fermentation, animal housing and feeding management, growth performance measurements, and ethical authorization (Approval No. XCU20230925, granted by the Animal Care and Ethics Committee of Xichang University). In summary, 20 clinically healthy four-month-old female Liangshan black ewes (23 ± 0.5 kg) were randomly assigned to four groups (n = 5 per group) and fed, for a 60-day trial period following a 15-day adaptation period, a basal control diet or experimental diets containing 10%, 20%, or 30% fermented onion supplementation (dry matter basis). Performance analysis revealed that the 20% fermented onion group showed superior ADG relative to all other experimental groups (P < 0.01) [10]. At the end of the trial, the control and 20% fermented onion groups were slaughtered after a 16-h fasting period, in compliance with the guidelines of the Animal Care and Ethics Committee of Xichang University. The animals were slaughtered by exsanguination via severance of the jugular veins (jugular venesection), a standard humane slaughter practice for meat-producing sheep, without the use of sedatives or anesthetics; all efforts were made to minimize suffering. Hypothalamus (HT), pituitary (PIT), and longissimus dorsi (LD) muscle tissues were collected immediately after slaughter from the five animals of the 20% fermented onion group (n = 5 independent biological replicates) for transcriptomic analysis; for qPCR validation, HT, PIT, and LD tissues from both the control and the 20% fermented onion groups (n = 5 per group) were collected. All tissues were snap-frozen in liquid nitrogen and stored at -80°C until RNA extraction.
2.2. RNA Extraction, Library Construction, and Sequencing
Total RNA was isolated from tissue specimens (n = 5 biological replicates per tissue, ~500 mg) employing TRIzol™ Reagent (Invitrogen, USA) in accordance with standard protocols. RNA quality was evaluated using an Agilent 2100 Bioanalyzer (RIN > 7.0) and a NanoDrop 2000 spectrophotometer (A260/A280 > 1.8, A260/A230 > 2.0). Strand-specific cDNA libraries were generated using the NEBNext® Ultra™ Directional RNA Library Prep Kit (New England Biolabs, USA), with an insert size selection of 250-300 base pairs. Paired-end sequencing (2 × 150 bp) was conducted on the Illumina HiSeq 4000 platform (Illumina, USA), generating approximately 8 Gb of clean data per sample.
2.3. Bioinformatics Analysis2.4. Quality Control and Read Alignment
The quality of the raw sequencing reads was assessed using FastQC (v0.11.7), and the reads were processed with Trim Galore (v0.6.6) to remove adapters and low-quality bases (Q < 20). Clean reads were aligned to the ovine reference genome (Oar_v4.0, GCA_000298735.2) using HISAT2 (v2.2.1). Alignment rates were evaluated using SAMtools (v1.10), and samples with > 85% alignment were retained. Gene expression was quantified using StringTie (v2.1.2) and normalized as FPKM. Genes with an FPKM value greater than 0.1 in at least one sample were retained for further analysis.
2.5. Differential Expression and Functional Enrichment Analysis
Differential expression analysis was performed using the R package DESeq2 (v1.24.0) with default parameters on the five biological replicates per tissue. Genes with a Benjamini-Hochberg-adjusted P value (FDR) < 0.01 and an absolute log2 fold change (|log2FC|) ≥ 4 were considered differentially expressed (DEGs). Principal component analysis (PCA) was performed on FPKM values to evaluate sample relationships and reproducibility. GO and KEGG enrichment analyses were conducted using clusterProfiler (v4.0.5) with a hypergeometric test and Benjamini-Hochberg-adjusted P < 0.05. Tissue expression profile (TISSUES) enrichment was performed to identify tissue-specific expression preferences of the DEG sets.
Venn diagram analysis of the DEGs from pairwise tissue comparisons was conducted to delineate the hierarchical regulatory architecture of the H-P-M axis. DEGs were classified into single-specific (S), dual-intersection (D), and triple-intersection (T) gene sets according to their presence patterns across comparisons (Table 1).
Protein-protein interaction (PPI) networks were constructed by submitting DEGs to the STRING database (v11.0) with a high-confidence threshold (score > 0.9), and the networks were visualized using Cytoscape (v3.6.1). Hub gene identification was achieved through two complementary strategies. First, the CytoHubba plugin was used with four topological algorithms (Degree, EPC, MCC, and MNC), and genes consistently ranked at the top by all four methods were retained. Second, network module detection was performed using MCODE (degree cutoff = 2, node score cutoff = 0.2, k-core = 2, max depth = 100) to identify densely connected clusters. The consensus hub genes were subjected to GO and KEGG enrichment analysis using clusterProfiler (v4.0.5) in R (Benjamini-Hochberg-adjusted P < 0.05).
2.7. RNA-seq Validation by qPCR
Fourteen DEGs—AGRP, CARTPT, KDM5C, NPY, and SNRNP70 (hypothalamus); CRHR1, GLDN, MC4R, and TRPC7 (pituitary); and MYOG, PPARA, SREBF1, TGFB1, and TGFB3 (longissimus dorsi)—were selected for qPCR validation across the three tissues. Primers were designed using NCBI Primer-BLAST and synthesized by Sangon Biotech (Table S1). First-strand cDNA was synthesized from five biological replicates per group (control and 20% fermented onion) using HiScript II SuperMix (Vazyme) in accordance with the manufacturer's instructions. Quantitative PCR was performed in triplicate on a CFX96 system (Bio-Rad) using SYBR Green Master Mix (Biomiga). The thermal cycling protocol consisted of initial denaturation at 95°C for 3 min, followed by 40 cycles of 95°C for 10 s and 60°C for 30 s, with melt-curve analysis performed at the end. Relative expression was calculated using the 2^−ΔΔCq^ method with GAPDH as the reference gene.
3. Results
3.1. RNA-Seq Data Quality and Transcriptome Profiling
To characterize the transcriptomes of the H-P-M axis, RNA sequencing was performed on pituitary (PIT), hypothalamus (HT), and longissimus dorsi (LD) tissues, with five biological replicates per tissue. Sequencing yielded 355.48 million high-quality read pairs, amounting to an aggregate data size of 106.64 Gb, with an average of 23.70 million read pairs per sample (range 18.88-29.78 million; Table 2 and Table S2). Quality metrics were high, with Q20 scores exceeding 97.99% (mean 98.25%), Q30 scores exceeding 95.11% (mean 95.67%), and GC content ranging from 49.25% to 55.26% (mean 50.88%), consistent with the expected ovine genome composition. Sequencing depth and quality were uniform across samples.
3.2. Tissue-Specific Transcriptional Profiles and Global Expression Patterns
PCA separated the three tissues along PC1 and PC2 (Figure 1A), with replicates within each tissue clustering tightly, indicating good reproducibility and strong inter-tissue divergence.
Gene expression showed clear tissue-specific patterns (Figure 1B, Table S3). PIT showed predominant expression of hormone-related genes, including PRL (prolactin), LHB (luteinizing hormone β-subunit), and NNAT (neuronatin), alongside housekeeping genes such as RPL23A (ribosomal protein L23a). HT was characterized by elevated expression of neural markers, notably MBP (myelin basic protein) and the KEF53 family genes (e.g., KEF53_p07, KEF53_p08, KEF53_p11, KEF53_p12). In contrast, LD showed enrichment of muscle-specific genes, including ACTA1 (skeletal muscle α-actin 1), TNNC2 (troponin C2), CKM (muscle-type creatine kinase), MYL11 (myosin light chain 11), and KEF53_p11. These profiles reflect the functional specialization of each tissue.
3.3. Differential Gene Expression Analysis Reveals Hierarchical Transcriptional Divergence
Pairwise differential expression analysis used stringent criteria (adjusted P < 0.01, |log2FC| ≥ 4). The three comparisons yielded 1,206 to 2,345 differentially expressed genes (DEGs), with divergence following a clear order (Figure 1C-F, Table 2): the LD vs HT comparison yielded 2,345 DEGs, followed by LD vs PIT (2,165 DEGs) and HT vs PIT (1,206 DEGs).
3.4. Overlap Analysis Identifies Shared and Tissue-Specific DEG Signatures
Venn diagram analysis of the 3,422 unique DEGs across the three pairwise comparisons revealed distinct overlap patterns (Figure 1C and Table 3). The largest intersection (1,187 genes, 34.69%) was observed in the D1 group, corresponding to the core skeletal muscle signature genes. Moderate overlap was observed for the D2 group (519 genes, 15.17%) and the D3 group (326 genes, 9.53%). Comparison-specific DEGs constituted 36.79% of the total, comprising 521 genes (15.23%) unique to the S2 group, 508 genes (14.85%) unique to the S1 group, and 230 genes (6.72%) unique to the S3 group. In total, 131 genes (3.83%) were differentially expressed across all three comparisons (T1 group), constituting a core set of universal tissue-discriminating markers. This distribution, with the largest category representing muscle-related genes (34.69%) and the smallest representing neuroendocrine-specific differences (6.72%), matches the overall DEG hierarchy.
3.5. HT vs PIT: Predominance of Neural Signaling Genes in Hypothalamus
The HT vs PIT comparison identified 1,206 DEGs, with a 3.0:1 ratio favoring upregulation in HT (902 vs 304 genes; Figure 1D, Table 4). The most significantly upregulated genes in HT comprised neural-specific markers, including MBP, AIF1L, CERS1, ALDOC, and VAMP1, which are centrally implicated in myelination, neuronal function, and synaptic vesicle transport, underscoring the hypothalamus's role as a neural integration center. Conversely, PIT-enriched genes included hormone biosynthesis and secretion regulators, such as IGSF1, CGA, LHB, RAB27A, and ELAPOR1. The presence of CGA and LHB, critical components of pituitary gonadotropins, confirms the specialized endocrine function of the pituitary gland.
3.6. Muscle vs Neuroendocrine Tissues: Metabolic and Contractile Gene Signatures
Comparison of LD with the neuroendocrine tissues (PIT and HT) revealed substantially higher numbers of DEGs (2,165 and 2,345, respectively) and a marked shift in expression directionality. In the LD vs PIT comparison, the up/downregulated ratio decreased to 0.78:1 (948 vs 1,217 genes; Figure 1E), while in the LD vs HT comparison this ratio further declined to 0.42:1 (699 vs 1,646 genes; Figure 1F). The progressive reduction in this ratio (3.0 → 0.78 → 0.42) reflects increasing functional divergence from neural regulatory tissues to the peripheral metabolic tissue.
LD-upregulated genes were enriched in muscle-specific functional modules (Figure 1E-F and Table 4). The top markers included ACTN3, CASQ1, CKMT2, BIN1, FHL3, DHRS7C, and COQ8A, which encode core components of muscle physiology: ACTN3 plays a key role in maintaining the sarcomeric structure of fast-twitch fibers, CASQ1 is a critical regulator of sarcoplasmic reticulum calcium homeostasis, CKMT2 is essential for ATP regeneration during contraction, and BIN1 organizes T-tubule systems indispensable for excitation-contraction coupling. Notably, ACTN3, CASQ1, and CKMT2 were identified among the top five DEGs in both muscle comparisons, establishing their status as core skeletal muscle signature genes.
Conversely, genes downregulated in LD (i.e., enriched in PIT or HT) were associated with neuroendocrine signaling machinery (Figure 1E-F and Table 4). PIT-enriched genes included POMC, MAPK8IP1, MPP2, and CLGN, with POMC serving as the precursor of multiple pituitary hormones, including ACTH. HT-enriched genes included ALDOC, GPM6A, SRCIN1, and SYT11, which have been linked to neuronal development, synaptic function, and signal transduction.
3.7. Cross-Comparison Analysis Identifies Core Tissue Markers
Comparative analysis across the multiple DEG lists revealed robust tissue-specific core markers (Table 5). For LD, ACTN3, CASQ1, and CKMT2 were consistently upregulated in both comparisons (LD vs PIT and LD vs HT), suggesting their key function in muscle identity. Similarly, ALDOC manifested as a prominent HT marker in both HT vs PIT and LD vs HT comparisons, while IGSF1 was consistently downregulated in HT and LD relative to PIT, designating it as a pituitary-specific signature. These cross-validated markers represent high-confidence candidates for tissue-specific functional studies and molecular diagnostics.
3.8. Tissue-Specific Transcriptional Interfaces in the H-P-M Axis
3.9. Membrane-Receptor Systems Show a Spatial Gradient
To systematically dissect functional specialization within the H-P-M axis, comprehensive functional enrichment analyses were performed on the DEGs from the pairwise tissue comparisons. The comparative enrichment results captured tissue-specific transcriptional divergence: the hypothalamus-longissimus dorsi comparison (S1, LD vs HT) revealed unique differentiation between the neuroendocrine center and the peripheral effector; the pituitary-longissimus dorsi comparison (S2, LD vs PIT) reflected the direct regulatory interface between the endocrine gland and its target organ; and the hypothalamus-pituitary comparison (S3, HT vs PIT) defined signal conversion characteristics at the neuro-endocrine junction.
Cellular component (CC) enrichment analysis revealed a clear gradient of membrane-associated structures (Figure 2A, Table S4). In the S1 comparison (LD vs HT), the terms "Cell periphery" (197 genes, FDR = 1.51 × 10⁻¹⁹), "Plasma membrane" (173 genes, FDR = 4.18 × 10⁻¹⁴), and "Membrane" (244 genes, FDR = 2.66 × 10⁻¹⁰) were strongly enriched, with FDR values spanning nine orders of magnitude. These genes encompass neurotransmitter receptors (e.g., CHRNA5, CHRNB4, GRIN1, GLRA1), ion channels (e.g., SCN2B, KCNQ3, HCN4), and G protein-coupled receptors (e.g., SSTR2, MC5R, GHR, LEPR), indicating that long-range hypothalamic regulation of longissimus dorsi relies on sophisticated membrane receptor architectures for distant signal transduction. In contrast, S2 (LD vs PIT) showed much weaker membrane enrichment, with the extracellular matrix (ECM, 24 genes) showing enrichment for collagens (COL5A1, COL21A1) and matrix remodeling factors (LOX, LOXL2, ADAMTS1, ADAMTS2), suggesting a shift from signal reception to ECM remodeling and myofiber assembly in pituitary hormone action. S3 (HT vs PIT) showed intermediate membrane enrichment ("Membrane," 113 genes, FDR = 0.0027; "Cell periphery," 87 genes, FDR = 8.31 × 10⁻⁶), with enriched genes including pituitary hormone receptors (AVPR1A, AVPR1B, GNRHR, GHRHR) and calcium signaling molecules (CALCR), consistent with the density of hypothalamic releasing-hormone receptors on pituitary cells. This gradient (S1 >> S3 > S2) links regulatory distance to signal-transduction complexity, showing the role of membrane-mediated mechanisms in the spatial hierarchy of the axis.
3.10. Regulatory and Developmental Programs Are Functionally Complementary
BP enrichment analysis (Figure 2B, Table S4) showed divergent functional orientations among tissue-specific gene sets. The S1 comparison showed broad regulatory orientation, with "Biological regulation" (274 genes, FDR = 0.0023), "Regulation of biological process" (251 genes, FDR = 0.0217), and "Regulation of cellular process" (239 genes, FDR = 0.0138) as dominant enrichment terms. The regulatory genes in question included transcription factors (e.g., NKX3-1, NEUROG2, ONECUT2), signal transduction molecules (e.g., WNT3A, FGF9, DKK3), and epigenetic regulators (e.g., SOCS3, CDKN1A), consistent with the hypothalamus acting as a neuroendocrine center that integrates environmental and metabolic signals to regulate downstream tissues. In contrast, the S2 comparison showed developmental orientation, with tissue expression profiles (TISSUES) specifically enriched in the muscular system (24 genes), encompassing muscle-specific genes (e.g., MYOG, MYF5, MSTN, MYOD1, MYBPH), myofiber assembly factors (e.g., CAV1, FABP3, ANO5), and metabolic regulators (e.g., FBXO32, HACD1), corresponding to pituitary hormone-driven mechanisms of muscle morphogenesis. The S3 comparison fell between these two extremes, with regulatory functions predominating ("Biological regulation," 145 genes, FDR = 0.00063; "Regulation of biological process," 137 genes, FDR = 0.00083) and specific enrichment of "Cell communication" (73 genes, FDR = 0.0018) and "Signaling" (71 genes, FDR = 0.002), involving neuropeptide signaling (e.g., AVPR1A, AVPR1B, LHB, FSHB, POMC, TSHB) and cell-cell interaction molecules (e.g., DHH, SCN1B, GJA5, EDN1), precisely mapping signal interactions between hypothalamic neurons and pituitary endocrine cells.
Molecular function (MF) and pathway analyses further substantiated this differentiation (Figure 2C, Table S4). The S3 comparison enriched "Calcium ion transmembrane transporter activity" (9 genes, FDR = 0.0242) and "Calcium channel activity" (8 genes, FDR = 0.0257), forming a continuous chain from ligand binding to ion transport in calcium signaling. The "Neuroactive ligand-receptor interaction" pathway was significantly enriched in S3 (14 genes, FDR = 0.0023), encompassing pituitary hormones and their receptors (AVPR1A, AVPR1B, GNRHR, GHRHR, LHB, FSHB, TSHB) and neurotransmitter receptors (HTR6, HRH1, TRHR); this enrichment was not observed in the S2 comparison, confirming that neuroactive signaling systems constitute the molecular basis of hypothalamic regulation. Tissue expression profile (TISSUES) analysis supported this perspective (Figure 2C, Table S4): the S1 set was enriched in the "Head" category (112 genes) and nervous system-related tissues; the S2 set was specifically enriched in the muscular system (skeletal muscle, 9 genes; muscle, 12 genes, including RYR1, MYH2, MYBPC1, MYL2, CLCN1); and the S3 set displayed pituitary gland specificity (9 genes, including LHX3, PROP1, GNRHR, GHRHR, FSHB, POU1F1, POMC, TSHB; FDR = 3.1 × 10⁻⁴) and adenohypophysis specificity (4 genes), consistent with its interface role. These complementary distributions reveal directional information flow from regulation toward developmental effectors within the H-P-M axis, supporting hierarchical signal amplification and execution.
3.11. Shared Pathways Define the Basis of Serial Regulation
Cross-comparison shared pathway analysis identified core processes enriched in at least two comparisons, illuminating the coordinated regulatory logic of the H-P-M axis (Figure 3, Table S4). Regulatory processes including "Biological regulation," "Regulation of biological processes," and "Regulation of cellular processes" were shared between the S1 and S3 comparisons (S1: 274/251/239 genes; S3: 145/137/129 genes) but showed no significant enrichment in S2, establishing the hypothalamus as the regulatory hub within the axis. Developmental processes (e.g., "Developmental process," "Anatomical structure development") were significantly enriched in S1 (123 and 116 genes, involving HOX gene families such as HOXB7, HOXB6, HOXC9, HOXD4, HOXD9 and developmental regulators such as PAX5, OSR1, TBX15), embodying functional conversion from neuroendocrine signals to developmental effectors. "Cell communication" (S1: 133 genes, including WNT7A, DLK2, CCL2, IL15, FASLG; S3: 73 genes, including AVPR1A, LHB, FSHB, EDN1) and "Signaling" (S1: 131 genes; S3: 71 genes) were significantly enriched in the comparisons involving the hypothalamus, showing the key role of neurohormonal signaling in coordinating endocrine pathways.
In summary, enrichment of tissue-specific DEGs defined three functional interfaces of the H-P-M axis. The hypothalamus-longissimus dorsi interface represents long-range neuroendocrine regulation, achieving distal muscle control through complex membrane receptor systems (neurotransmitter receptors, growth factor receptors LEPR/GHR, ion channels) and broad-spectrum regulatory networks. The pituitary-longissimus dorsi interface represents hormone-target organ effector function, driving muscle growth through developmental program activation (myogenic transcription factors MYOG/MYF5/MYOD1) and ECM remodeling (collagens, matrix metalloproteinases). The hypothalamus-pituitary interface constitutes neuroendocrine conversion, transforming neural input into hormonal output through calcium-dependent signal transduction and pituitary hormone receptors (GNRHR, GHRHR, AVPR1A/1B). This tissue-specific transcriptional regulation provides a molecular interface framework for understanding neuroendocrine regulation of skeletal muscle growth and its impact on animal growth performance (e.g., energy partitioning and average daily gain), establishing the foundation for subsequent network construction.
3.12. Relay Modules Reveal the Information-Transduction Chain of the H-P-M Axis3.13. Three Complementary Modules Form a Complete Signal Chain
Intersection analysis of the pairwise DEG sets revealed serial regulatory modules in which intermediate tissues act as hubs of the H-P-M axis (Figure 1C, 4, and 5; Table 3, Table S4). Three key intersection sets were identified as elucidating functional connectivity from a tissue relay perspective: the D2 group ((LD vs HT) ∩ (HT vs PIT), 519 DEGs) represented genes whose differential expression involves the hypothalamus in both comparisons, connecting pituitary and muscle with the hypothalamus as the hub; the D3 group ((LD vs PIT) ∩ (HT vs PIT), 326 DEGs) represented genes whose differential expression involves the pituitary in both comparisons, linking hypothalamus and muscle with the pituitary as the bridge; and the D1 group ((LD vs HT) ∩ (LD vs PIT), 1,187 DEGs) represented longissimus dorsi genes responding to dual neuroendocrine signals. This approach highlights how tissues in the axis transfer information through shared transcriptional elements.
Functional enrichment showed that the three modules are highly specialized and complementary (Figure 4 and Figure 5, Table S4). The D2 group constituted a "neural signal transduction module," with cellular components showing significant enrichment in membrane structures and synaptic components: "synapse" (71 genes, including GAP43, TH, STX1B, SV2A, DRD2, and the GABA receptor family GABRA1/GABRB2/GABRG2), "presynaptic membrane" (10 genes, including CPLX3, STX1A, PPFIA3, UNC13A), "axon" (32 genes, including GAP43, SNCB, TH, NEFH, SCN2A, STX1B, NEFL, GRM3), and "neuron projection" (87 genes). The molecular functions encompassed neurotransmitter receptors (e.g., GRIN1, GRIN2C, GLRA1) and ion channel activities. Biological process analysis identified significant enrichment of "Synaptic signaling" and "Chemical synaptic transmission." Tissue expression profiles were significantly enriched in "Brain" (123 genes, including ALDOC, GAP43, GPRIN1, SNCB, TH, OPRM1, CARTPT, STX1B, DRD2, SLC1A2), "Spinal cord" (14 genes, FDR = 1.7 × 10⁻⁴), and "Cerebral cortex" (23 genes, FDR = 1.2 × 10⁻⁵, including KCNAB1, SCGN, AVPR1A, HTR6, CALB1, CA4). This profile positions the module as an input unit that senses and transmits neuroendocrine signals at the start of axial information flow.
The D1 group (LD_HT_PIT intersection) showed "regulatory coordination" functional characteristics in biological process enrichment, with genes participating in "Biological regulation"-related processes, particularly "Cell-cell signaling" (67 genes, including CHRNA1, WNT7A, STAC3, GABRQ, SNAP25, STX1A, CPE) and "Signaling." The cellular components were specifically localized to the sarcomere, myofibril, and T-tubule (eight genes, including CAV3 and CACNA1S), suggesting mediation through secreted factors and muscle contractile units. The molecular functions encompassed protein binding and ion channel activities, reflecting the functional diversity and network integration properties of regulatory factors.
The D3 group (PIT_LD_HT intersection) represented a "pituitary-centered developmental effector execution module," with biological processes focused on developmental programs: developmental process, anatomical structure development, differentiation of striated muscle cells (34 genes, including MYOG, ACTA1, MYMK, FLNC, KLHL40, MYOZ1, CASQ1, NEB, CSRP3, LMOD3, IGF1, CACNA1S, MYH7, MYOD1), and development of skeletal muscle organs (29 genes). The molecular functions were predominantly protein binding, with particular emphasis on cytoskeletal protein binding (involving ACTN3, FLNC, SYNPO2L, MYPN, MYOM2, etc.), supporting myofiber assembly and structural remodeling. This module specifically enriched muscle-related tissues (skeletal muscle/muscle tissue), suggesting the terminal execution role of skeletal muscle in neuroendocrine responses.
3.14. Spatiotemporal Hierarchy and Molecular Mechanisms
The three modules differed in temporal dynamics: neural transmission in the D2 module (synaptic signaling, chemical synaptic transmission) supports signal transfer at second-to-minute scales; regulatory coordination in the D1 module (cell communication, signaling) mediates signal integration at minute-to-hour scales; and developmental execution in the D3 module (muscle cell differentiation, myofibril assembly) achieves long-term adaptation at hour-to-day/week scales (Figure 4 and Figure 5, Table S4). This temporal gradient may reflect the progression of axial signaling from acute responses to chronic effects; these timescale assignments are inferred from the enriched processes and require experimental confirmation. In spatial organization, the D2 module showed the strongest neural specificity (brain 123 genes, spinal cord 14 genes), while the D1 module displayed muscle-related structural specificity (sarcomere/T-tubule enrichment) and the D3 module showed developmental effector specificity (skeletal muscle organ development, 29 genes), corresponding to the spatial positioning of signal initiation, execution, and conversion, respectively. This spatial hierarchy highlights the role of tissue relay in maintaining information flow in the axis.
At the molecular mechanism level, the three modules formed a complete signal transduction chain: membrane receptors and ion channels (D2, e.g., GRIN1/GRIN2C, GLRA1, KCNAB1, HTR6) receive upstream signals; secreted regulatory factors and cell communication molecules (D1, e.g., WNT7A, CHRNA1, SNAP25, STX1A, CPE) execute signal integration and amplification; and structural proteins and metabolic enzymes (D3, e.g., ACTA1, FLNC, MYOM2, NEB, CSRP3, MYH7) implement downstream effects. While the "Neuroactive ligand-receptor interaction" pathway was significant in S3 (12 genes, FDR = 0.0025), it did not manifest directly in the intersection group data, possibly because of reduced enrichment power following the reduction in gene number resulting from the intersection process. This mechanism emphasizes the importance of inter-module complementarity in supporting overall H-P-M axis function.
In summary, the three serial modules form a dynamic regulatory chain of the H-P-M axis, from neural signal sensing (D2: synaptic signaling molecules GAP43, TH, STX1B, DRD2) through hormone secretion and signal integration (D1: cell communication molecules WNT7A, CHRNA1, SNAP25, STX1A) to muscle growth (D3: muscle developmental genes MYOG, ACTA1, MYH7, MYOD1), achieving complete information transduction. This modular architecture clarifies hypothalamic regulation of longissimus dorsi development through pituitary mediation, providing a molecular mechanistic framework for the coordinated neuroendocrine regulation of animal growth performance (e.g., energy partitioning and metabolic efficiency), and a theoretical basis for optimizing livestock production performance through strategic targeting of the H-P-M axis.
3.15. A Shared Core Gene Network Links the Three Tissues of the H-P-M Axis
After defining the tissue-specific interfaces (Section 3.4) and relay modules (Section 3.5), we focused on the 131 core genes commonly differentially expressed across all three tissues (T1 group) to explore the molecular foundation of H-P-M axis functional integration. Functional enrichment analysis of these shared core genes (Figure 6, Table S4) revealed highly focused and interrelated functional modules in biological processes, cellular components, and tissue expression profiles.
3.16. Evidence for a Neuro-Muscular Interface
Enrichment analysis revealed that genes shared across the three tissues were highly enriched in key components of neuro-muscular signal transduction at the biological process (BP) dimension (Figure 6, Table S4). The most significantly enriched term was "Synaptic signaling" (14 genes, FDR = 8.72 × 10⁻⁵), involving neurotransmitter synthesis and receptor genes such as SNCB, TH, OPRM1, CARTPT, as well as synaptic vesicle release proteins including STX1B and SV2A. This was closely followed by "Cell-cell signaling" (17 genes, FDR = 0.0008) and "Chemical synaptic transmission" (12 genes, FDR = 0.0008), indicating that these core genes directly participate in neuroendocrine signal transduction between the hypothalamus and the pituitary. "Nervous system development" (26 genes, FDR = 0.0008) contained the largest number of genes, encompassing axonal growth-related factors such as GAP43, NEFH, KIF5A and neural developmental transcription factors including SOX10 and POU3F2, suggesting that the functional integration of the H-P-M axis originates from coordinated establishment during early developmental stages. In addition, the enrichment of "Cell junction organization" (11 genes, FDR = 0.0268) and "Muscle organ development" (8 genes, FDR = 0.0307) further confirmed the developmental coupling of the neural-endocrine-muscle tri-system.
3.17. Integration at the Cellular-Component Level
At the cellular component (CC) dimension, shared genes were enriched in muscle contractile apparatus and neural signal transduction structures, establishing cross-tissue structure-function correspondence (Figure 6, Table S4). "Myofibril" (12 genes, FDR = 2.31 × 10⁻⁶) and "Sarcomere" (11 genes, FDR = 2.40 × 10⁻⁶) emerged as the most significantly enriched CC terms, containing core muscle contraction proteins such as ACTN2, MYH2, RYR1, and MYL2. The shared expression of these genes across the three tissues may be indicative of shared origins in the development of the pituitary and hypothalamic glands with muscle tissue, or of evolutionary conservation of expression regulatory networks. Concurrently, "Synapse" (23 genes, FDR = 2.67 × 10⁻⁶) and "Neuron projection" (20 genes, FDR = 0.00019) were highly enriched, constructing complete neural signal transduction structural units. "Cell junction" (29 genes, FDR = 2.74 × 10⁻⁶) was among the most significantly enriched CC terms; this integrated group comprises sarcomere junction proteins (ACTN2, XIRP2), synaptic junction molecules (STX1B, SV2A), and cell adhesion factors (CDH20, EPCAM), suggesting that these genes play critical roles in maintaining structural continuity and signal transmission stability across hierarchical levels of the H-P-M axis.
3.18. Tissue Expression Profiles Reveal a Neural Bias
Tissue expression profile (TISSUES) analysis further confirmed the high expression preference of these shared genes in the nervous system (33 genes, FDR = 0.0059) and the brain (32 genes, FDR = 0.0059) (Figure 6, Table S4). These neural center-enriched genes are involved in dopaminergic signaling (TH, DRD2), opioid receptor signaling (OPRM1), and pituitary hormone secretion (PRL, GH1), mapping the neuroendocrine regulatory core of the H-P-M axis with a high degree of precision. Concurrently, the enrichment of skeletal muscle (9 genes, FDR = 0.0059) and muscle (12 genes, FDR = 0.0059) related genes, including the calcium ion channel RYR1, myosin heavy chain MYH2, and chloride channel CLCN1, directly connects neuroendocrine signals with the terminal effects of muscle contraction. Notably, forebrain-specific genes (13 genes, FDR = 0.0059), including CARTPT and SLC1A2, were identified as playing a key role in information integration and initial signal initiation throughout the regulatory axis. This tissue distribution pattern (nervous system > brain > forebrain → skeletal muscle/muscle) clearly delineates the spatial hierarchy of signal flow within the H-P-M axis.
3.19. A Three-Tiered Regulatory Architecture for the H-P-M Axis
Integrating the tissue-specific interfaces (Section 3.4), relay modules (Section 3.5), and shared core network (Section 3.6) showed that the H-P-M axis operates through a three-tiered functional integration architecture: tissue-specific regulatory interfaces, tissue relay modules, and shared core hubs. Tissue-specific regulatory interfaces define spatial functional differentiation within the axis, with membrane receptor systems showing gradient distribution (S1 >> S3 > S2) and functional orientations displaying complementary patterns (regulation-signal conversion-developmental execution). Tissue relay modules construct a temporal dynamics chain from rapid neural transmission (second-to-minute scale) through signal integration (minute-to-hour scale) to chronic developmental effects (hour-to-day/week scale). The shared core gene network establishes the foundation for neuro-endocrine-muscle tri-system functional coordination through transcriptional synchronization of synaptic signaling, hormone secretion regulation, and sarcomere assembly. This two-layered architecture, with tissue-specific interfaces for directional transmission and shared hubs for coordinated responses, supports the H-P-M axis as a functional unit in which cross-tissue cascades ensure faithful transmission of growth-regulatory information.
3.20. qPCR Validation of RNA-Seq Data
To verify the reliability of the RNA-seq results, quantitative real-time PCR (qPCR) was performed on 14 DEGs across the three tissues (hypothalamus, pituitary, and longissimus dorsi), comparing the 20% fermented onion group with the control group (n = 5 per group). The expression patterns detected by qPCR showed a high degree of consistency with those observed in RNA-seq analysis.
In the hypothalamus (Figure 7A), both platforms revealed upregulation of CARTPT (RNA-seq: 2.15-fold; qPCR: 1.81-fold), NPY (RNA-seq: 6.68-fold; qPCR: 3.51-fold), SNRNP70 (RNA-seq: 1.54-fold; qPCR: 1.48-fold), and KDM5C (RNA-seq: 1.80-fold) in the 20% fermented onion group relative to controls; AGRP showed low expression with no clear treatment-associated change on either platform. In the pituitary (Figure 7B), concordant upregulation of GLDN (RNA-seq: 2.53-fold; qPCR: 3.62-fold) and TRPC7 (RNA-seq: 2.65-fold; qPCR: 2.28-fold) was observed, whereas CRHR1 and MC4R were downregulated (qPCR); MC4R was expressed at very low levels in the RNA-seq data, making its RNA-seq comparison non-informative. In the longissimus dorsi muscle (Figure 7C), elevated expression of TGFB1 was validated by both approaches (RNA-seq: 1.22-fold; qPCR: 1.87-fold), as was TGFB3, while MYOG and SREBF1 showed modest downregulation in the treatment group (0.87-fold). PPARA showed discrepant directions between platforms (upregulated by qPCR but downregulated by RNA-seq), and was therefore not considered validated.
Among the fourteen genes examined, twelve (85.7%) displayed concordant expression trends between qPCR and RNA-seq platforms, despite variations in absolute expression levels attributable to the distinct quantification methodologies (relative quantification versus FPKM normalization). The strong agreement between these two independent analytical approaches supports the accuracy and reproducibility of the RNA-seq data, thereby validating the robustness of the identified transcriptional alterations across the different tissue types.
4. Discussion
We used high-throughput transcriptome sequencing of three tissues of the sheep H-P-M axis to characterize neuroendocrine-metabolic regulation under a fermented onion feed intervention. We identified 3,422 tissue-comparison DEGs and constructed a three-tiered functional integration architecture of "tissue-specific regulatory interfaces + tissue relay modules + shared core hubs."
4.1. Reliability of the Transcriptome Data
For 14 DEGs, qPCR and RNA-seq agreed in expression trend for 85.7% (12/14), above the 70-80% concordance typically reported [11]. Although qPCR uses relative quantification (2^-ΔΔCq^ method) and RNA-seq uses FPKM, which differ in absolute magnitude, the two methods agreed on the direction and relative size of expression changes, supporting the reliability of the transcriptome data [12].
4.2. Regulatory Distance and Membrane-Receptor Complexity
CC enrichment showed a clear gradient of membrane-associated structures: the strong enrichment of "Cell periphery," "Plasma membrane," and "Membrane" in S1 far exceeded the moderate membrane enrichment in S3 and the weak enrichment in S2. This gradient (S1 >> S3 > S2) raises a question: why does the hypothalamus-muscle interface need a more complex membrane-receptor system than the other interfaces?
A likely explanation is that greater regulatory distance demands more precise and sensitive signal transduction. Long-range hypothalamic regulation of skeletal muscle crosses multiple physiological barriers, and each step attenuates the signal and adds noise; the hypothalamus may therefore use complex membrane-receptor networks to recognize and amplify weak or mixed peripheral signals [13]. Neurotransmitter receptors enriched in the S1 comparison (GRIN1, GLRA1, CHRNA5/CHRNB4) constitute rapid signaling systems, while G protein-coupled receptors (SSTR2, MC5R, GHR, LEPR) mediate slow but amplifiable signal transduction [14]. This combination of fast ionotropic and slow metabotropic receptors may let the H-P-M axis respond to two classes of stimuli: acute stressors (e.g., exercise, starvation) and chronic metabolic state changes (e.g., nutritional sufficiency, obesity).
The enrichment of growth hormone receptor (GHR) and leptin receptor (LEPR) indicates the presence of feedback regulatory mechanisms from peripheral metabolic signals to the central nervous system. Leptin regulates the expression balance of orexigenic neuropeptides (NPY/AgRP) and anorexigenic neuropeptides (POMC/CART) by activating LEPR-positive neurons in the hypothalamic arcuate nucleus [15]. In contrast, the S2 comparison showed reduced membrane receptor enrichment intensity accompanied by enrichment of extracellular matrix components (COL5A1, COL21A1, LOX, LOXL2), indicating a mechanistic shift from signal reception to effector execution, achieving muscle growth through regulation of extracellular matrix remodeling and myofiber assembly [16]. The LOX family of enzymes catalyzes collagen cross-linking, a process critical for maintaining muscle mechanical strength during periods of rapid growth [17].
4.3. Biological Processes Trace Information Flow from Integration to Execution
BP enrichment showed complementary functional orientations, revealing the directionality of information flow in the H-P-M axis. The "regulatory orientation" of S1—"Biological regulation," "Regulation of biological process," and "Regulation of cellular process"—reflected the role of the hypothalamus as a neuroendocrine center that integrates signals from multiple sources. The regulatory genes included not only transcription factors (NKX3-1, NEUROG2, ONECUT2) and signaling pathway ligands (WNT3A, FGF9, DKK3), but also negative feedback regulators (SOCS3, CDKN1A). The validated KDM5C (histone H3K4 demethylase, upregulated 1.80-fold) and SNRNP70 (core spliceosome component, upregulated 1.54-fold) represent fine-tuning regulatory mechanisms at the epigenetic and post-transcriptional levels, respectively.
The enrichment of SOCS3 was unexpected: under improved nutrition, the negative-feedback regulator SOCS3 was upregulated. SOCS3 functions as a negative regulator of leptin and growth hormone signaling, and its expression within the hypothalamus is a key mechanism underpinning leptin and growth hormone resistance [18]. In the context of prolonged elevated nutritional intake, moderate SOCS3 upregulation may limit receptor desensitization and metabolic disturbance from signal overactivation, protecting against excessive inflammation [19] and preserving cellular integrity [20], a form of negative-feedback homeostasis under activated conditions (reviewed in [21]).
The "developmental orientation" of S2 differed from that of S1, with tissue expression profiles enriched in the muscular system, including myogenic transcription factors (MYOG, MYF5, MSTN, MYOD1) and myofiber assembly factors (CAV1, FABP3, ANO5), corresponding to pituitary hormone-driven mechanisms of muscle morphogenesis. The enrichment of myostatin (MSTN) indicated the ubiquity of negative feedback regulation in muscle development, with increased MSTN expression typically concomitant with the muscle transition from hyperplastic to hypertrophic growth [21,22,23], consistent with the mild downregulation of MYOG (0.87-fold) observed in this study.
The S3 comparison simultaneously enriched "Biological regulation" and "Cell communication," involving neuropeptide signaling (AVPR1A/1B, LHB, FSHB, POMC, TSHB) and cell junction proteins (DHH, SCN1B, GJA5, EDN1), precisely mapping bidirectional signal interactions between hypothalamic neurons and pituitary endocrine cells. Gap junction protein GJA5 plays a key role in the electrical coupling between pituitary cells, thereby facilitating synchronized secretory activity, a process of paramount importance for the generation of coordinated hormone pulses [24,25]. Pulsatile hormone secretion is essential for maintaining target organ receptor sensitivity and preventing receptor desensitization.
4.4. Calcium Signaling as a Core Trigger of Pituitary Hormone Secretion
MF enrichment identified "Calcium ion transmembrane transporter activity" and "Calcium channel activity" in S3, pointing to a central role for calcium signaling in pituitary hormone secretion. Electrical activity and calcium oscillations in pituitary cells directly determine pulsatile hormone secretion patterns [26]. This calcium-dependent secretion has three implications: first, calcium oscillation frequency and amplitude encode the concentration information of hypothalamic releasing hormones; second, calcium-dependent vesicle release mechanisms ensure the spatiotemporal precision of hormone secretion; and third, calcium signals can simultaneously activate transcription factors (NFAT, CREB), coupling acute secretory responses with long-term gene expression regulation.
KEGG analysis showed enrichment of the "Neuroactive ligand-receptor interaction" pathway in S3 but not S2, confirming neuroactive signaling as the molecular basis of the hypothalamus-pituitary interface. Receptors enriched in this pathway constitute the classical hypothalamic-pituitary regulatory axis: GNRHR, GHRHR, AVPR1A/1B, and TRHR are all members of the GPCR family with signal amplification capacity. Upon agonist binding, a single receptor can activate multiple G protein molecules, each of which can in turn activate multiple effector enzymes, resulting in cascade amplification [14,27,28].
The coordinated upregulation of TRPC7 (qPCR: 2.28-fold) and GLDN (qPCR: 3.62-fold) in the pituitary suggests enhanced calcium-related signaling capacity in the high-growth group. TRPC7, a non-selective cation channel, facilitates calcium ion influx in pituitary cells and thereby contributes to the calcium responses of these cells to hypothalamic releasing hormones [29,30]; its upregulation may lower the activation threshold for calcium influx, enabling pituitary cells to mount effective secretory responses even to lower concentrations of releasing hormones. GLDN encodes gliomedin, a protein best characterized in the organization of myelinated nerve fibers; its consistent upregulation across platforms is intriguing, although its direct role in pituitary cell function is not yet established and warrants functional follow-up. We therefore interpret the GLDN finding cautiously and note that the mechanistic relationship between GLDN and pituitary secretory capacity remains to be experimentally defined.
4.5. Hypothalamic Neuropeptide Reprogramming and Feeding Regulation
We observed coordinated upregulation of CARTPT and NPY (2.15- and 6.68-fold) in the hypothalamus, a pattern that adds a new dimension to classical feeding-regulation theory. Conventional wisdom asserts that CARTPT exerts anorexigenic effects while NPY promotes feeding, showing antagonistic functions [31,32]. However, in studies examining the effects of feed restriction on sheep, feed restriction led to increased NPY/AgRP/LepR expression and decreased POMC/CARTPT expression [33]^. This coordinated upregulation may reflect reprogramming of hypothalamic neuronal subpopulations by leptin and insulin signals after improved nutrition.
NPY, the most potent orexigenic neuropeptide, is subject to negative regulation by leptin [31]. The significant upregulation of NPY in this study (3.51-fold by qPCR) may suggest that fermented onion feed improved rumen fermentation efficiency, increasing volatile fatty acid production, which in turn regulated hypothalamic neuropeptide expression through gut-brain axis signals (e.g., volatile fatty acids, GLP-1); however, this hypothesis requires direct testing of gut-derived signals. CARTPT neurons primarily respond to enhanced insulin signaling [34,35], reflecting another dimension of nutrient sensing mechanisms that enable body energy redistribution.
The upregulation of SNRNP70 (1.54-fold) points to a possible role for RNA splicing in neuroendocrine responses. Alternative splicing enables individual genes to produce multiple protein isoforms; during the processing of neuropeptide precursors (e.g., NPY, POMC), alternative splicing can result in the production of signal peptides of varying lengths, affecting the protein's cellular localization and secretion efficiency [36,37]^. The upregulation of KDM5C (histone H3K4 demethylase, 1.80-fold) indicated a possible role of epigenetic regulation in long-term nutritional adaptation. KDM5C regulates the expression of neuronal plasticity-related genes by removing H3K4me3 [38,39], which may represent an example of chromatin remodeling in hypothalamic neurons under conditions of long-term nutritional improvement.
4.6. The Muscle TGFB1-AMPK-SREBF1 Axis May Shift Metabolism from Lipid to Protein Synthesis
The results revealed a notable pattern: upregulation of TGFB1 (1.87-fold) in longissimus dorsi, combined with mild downregulation of MYOG and SREBF1 (0.87-fold). It is important to distinguish what was observed from what is hypothesized. The data directly show only three expression changes: upregulation of TGFB1 and downregulation of MYOG and SREBF1. TGFB1 demonstrates dose-dependent functions in muscle biology: physiological levels of TGFB1 promote muscle repair and satellite cell activation, while excessive levels induce muscle fibrosis [17,40]; the moderate upregulation observed here is likely to represent the former, supporting adaptive remodeling of muscle during growth.
SREBF1 (SREBP-1), the master transcriptional regulator of fatty acid and triglyceride synthesis [39,41], has clear metabolic significance in its downregulation. Research has demonstrated that SREBP-1 regulates muscle protein synthesis by downregulating the expression of myogenic factors, including MYOD1, MYOG, and MEF2C [42]. Downregulation of SREBF1 may therefore indicate a shift in energy allocation from lipid synthesis toward protein synthesis, which is favorable for meat production performance, as indicated by increased lean meat percentage and decreased intramuscular fat. TGFB1 regulates muscle differentiation by inhibiting MYOG promoter activity through SMAD3-dependent mechanisms [43]. Decreased expression of the myogenic regulatory factor MYOG may be indicative of a transition in the muscle's biological state from a phase of rapid growth, characterized by high MYOG expression and extensive myotube fusion, to a phase of stable maintenance, marked by myofiber hypertrophy as the predominant feature [44,45].
Based on these observations, we propose the TGFB1-AMPK-SREBF1 axis as a working model in which TGFB1 upregulation and SREBF1 downregulation reflects a redirection of energy allocation from lipid synthesis toward protein synthesis, thereby optimizing growth efficiency. We emphasize that this is a literature-based hypothesis: AMPK was neither measured in this study nor identified among the DEGs, and the proposed axis should be considered a hypothesis to be tested in future mechanistic work, including direct measurement of AMPK activity and functional perturbation experiments.
4.7. Relay Modules Form a Multi-Timescale Framework
The three modules from intersection analysis form a spatial information chain and reveal how the H-P-M axis integrates function across timescales. Neuroendocrine systems operate across multiple timescales, from millisecond neurotransmitter signals to hour- and day-scale hormone regulation and development [46]. This temporal integration lets organisms respond to both fast environmental changes and slow metabolic shifts [47].
The D2 module ("neural signal transduction") is rich in synaptic components and neurotransmitter receptors, with tissue expression enriched in nervous tissue, consistent with fast, millisecond-to-second signaling. Rapid neural signal dynamics can influence hormone output patterns on a second timescale, entailing the conversion of transient fluctuations in neuronal activity into relatively slow hormone responses through nonlinear integration mechanisms [48,49]. The D1 module, indicative of muscle response genes, is enriched in cell communication and signaling, representing an intermediate timescale of minutes to hours. This module supports the view that skeletal muscle is not only a passive effector but also an active signal sender: as an endocrine organ, muscle secretes myokines that contribute to systemic metabolic regulation [50]. The enrichment of IL15 and WNT7A in this study is indicative of muscle endocrine function, with IL-15 improving insulin sensitivity [51] and WNT7A promoting muscle hypertrophy by activating the AKT-mTOR pathway [52]. The D3 module, a "developmental effector execution module," is characterized by the differentiation of striated muscle cells and the development of skeletal muscle organs, representing terminal effector execution over extended periods of hours to days or weeks [53].
In addition, the core genes shared across the three tissues were simultaneously enriched in neural signal transduction and muscle contraction structures, forming cross-tissue functional integration nodes. This co-expression indicates strong conservation of secretion mechanisms between neural and muscular systems: neurons and endocrine cells both release vesicles via SNARE-mediated membrane fusion [54,55]. The co-expression of STX1B and SV2A across the three tissues in this study confirmed this mechanistic conservation, with v-SNARE proteins capable of driving calcium-triggered membrane fusion on millisecond timescales [56,57]. This conservation provides a common molecular basis for cross-tissue coordination, allowing the D2-D1-D3 modules to integrate through shared mechanisms (e.g., SNARE-mediated secretion, calcium signaling) into a unified network spanning immediate responses, metabolic coordination, and sustained adaptation [46,58].
4.8. Limitations
Several limitations of this study should be acknowledged. First, the transcriptomic comparisons were performed among three tissues within the high-growth (20% fermented onion) cohort; the DEGs therefore reflect tissue identity differences rather than treatment-induced changes, and the tissue-level architecture described here should be interpreted as the transcriptional framework of the axis rather than as causal evidence for the growth response. Second, the sample size (n = 5 per tissue) is modest, and the animals were all young females of a single breed, which limits the generalizability of the findings. Third, the qPCR validation, although concordant for 12 of 14 genes, was restricted to a subset of DEGs and to two of the four experimental groups. Fourth, the proposed "Interface-Relay-Hub" architecture, the assigned timescales of the relay modules, and the hypothesized regulatory axes (e.g., TGFB1-AMPK-SREBF1) are inferred from enrichment and network analyses and require direct functional validation (e.g., perturbation experiments, protein-level measurements). Fifth, the liver, an important somatotropic mediator of GH action through IGF-1 production, was not sampled, so the present framework focuses on the neuroendocrine-muscle arm of the somatotropic system. Finally, the hub genes nominated here (e.g., NPY, GLDN, TRPC7) warrant targeted functional studies to establish their roles in growth regulation.
5. Conclusions
We describe, for the first time in sheep, coordinated transcriptional regulation across three tissues of the H-P-M axis, revealing a spatial hierarchy built on membrane-receptor gradients, functional-orientation differences, and neuroactive ligand-receptor pathways. The identification of key genes (NPY, CARTPT, GLDN, TRPC7, TGFB1) and their interaction networks provides a novel molecular framework for understanding neuroendocrine-metabolic integration. Pending functional validation, these candidate genes may serve as markers for early selection of growth performance, and the identified pathways as targets for nutritional regulation.
Supplementary Materials
The following supporting information can be downloaded at the website of this paper posted on Preprints.org: Table S1: Primer sequences used for qPCR validation; Table S2: Per-sample RNA-seq quality metrics; Table S3: FPKM expression matrix of all genes across the 15 samples; Table S4: Complete GO, KEGG, and TISSUES enrichment results for all DEG sets.
Author Contributions
Conceptualization, C.Y. and R.G.; methodology, Y.Q. and X.F.; software, Y.Q.; validation, C.Y. and X.F.; formal analysis, X.F. and Y.Q.; investigation, C.Y., Z.H. and J.L.; resources, Z.H. and Y.Q.; data curation, C.Y. and X.F.; writing-original draft preparation, C.Y.; writing-review and editing, X.F., J.W. and R.G.; visualization, X.F. and C.Y.; supervision, J.W. and R.G.; project administration, R.G.; funding acquisition, J.W. All authors have read and agreed to the published version of the manuscript.
Funding
This research was funded by the Identification of ADG-Related Genes in Liangshan Black Sheep Based on the Hypothalamus-Pituitary-Liver-Muscle Regulatory Axis and Construction of Their Regulatory Network, grant number 2025SKLAB6-03, and by the Agricultural "Eaglet-type" Science and Technology Vice-Presidency Project (lump-sum system), grant number 26KJFZ0009, the Sichuan Science and Technology Program (2025YFHZ0058). The funders had no role in the design of the study; in the collection, analyses, or interpretation of data; in the writing of the manuscript; or in the decision to publish the results.
Institutional Review Board Statement
The animal study protocol was approved by the Animal Care and Ethics Committee of Xichang University (approval no. XCU20230925). All animals were slaughtered by jugular venesection after a 16-h fast, without sedatives or anesthetics, and all efforts were made to minimize suffering.
Informed Consent Statement
Not applicable.
Data Availability Statement
The raw RNA-seq data have been deposited in the Genome Sequence Archive (GSA) of the National Genomics Data Center (NGDC), China National Center for Bioinformation (CNCB), under BioProject accession PRJCA072424 (https://www.cncb.ac.cn/). All other data are within the manuscript and its Supplementary Materials (FPKM matrix, Table S3; full enrichment results, Table S4).
Acknowledgments
The authors thank the staff of Xichang University for assistance with animal management and sampling.
Conflicts of Interest
The authors declare no conflicts of interest.
Abbreviations
The following abbreviations are used in this manuscript:
- ADG: average daily gain - BP: biological process - CC: cellular component - DEG: differentially expressed gene - ECM: extracellular matrix - FDR: false discovery rate - FPKM: fragments per kilobase of transcript per million mapped reads - GH: growth hormone - GO: Gene Ontology - GPCR: G protein-coupled receptor - HT: hypothalamus - IGF-1: insulin-like growth factor 1 - KEGG: Kyoto Encyclopedia of Genes and Genomes - LD: longissimus dorsi - MF: molecular function - PIT: pituitary - PPI: protein-protein interaction - qPCR: quantitative real-time PCR - TISSUES: tissue expression profile
References
- Uddin, A.H.M.M.; Petrovski, K.R.; Song, Y.; Garg, S.; Kirkwood, R.N. Application of Exogenous GnRH in Food Animal Production. Animals 2023, 13, 1891. [Google Scholar] [CrossRef]
- Chen, B.; Yue, Y.; Li, J.; Liu, J.; Yuan, C.; Guo, T.; Zhang, D.; Yang, B.; Lu, Z. Transcriptome-metabolome analysis reveals how sires affect meat quality in hybrid sheep populations. Front. Nutr. 2022, 9, 967985. [Google Scholar] [CrossRef]
- Song, Y.; Zhang, Q.; Shi, J.; Fu, L.; Cheng, S. Screening of Genes Related to Growth, Development and Meat Quality of Sahan Crossbred F1 Sheep Based on RNA-Seq Technology. Front. Vet. Sci. 2022, 9, 831519. [Google Scholar] [CrossRef]
- Kalds, P.; Zhou, S.; Gao, Y.; Cai, B.; Huang, S.; Chen, Y.; Wang, X. Genetics of the phenotypic evolution in sheep: a molecular look at diversity-driving genes. Genet Sel. Evol. 2022, 54, 61. [Google Scholar] [CrossRef]
- Zhao, L.; Yuan, L.; Li, F.; Zhang, X.; Tian, H.; Ma, Z.; Zhang, D.; Zhang, Y.; Zhao, Y.; Huang, K.; Li, X.; Cheng, J.; Xu, D.; Yang, X.; Han, K.; Weng, X.; Wang, W. Whole-genome resequencing of Hu sheep identifies candidate genes associated with agronomic traits. J. Genet. Genom. 2024, 51, 866–876. [Google Scholar] [CrossRef]
- Mohammadabadi, M.; Bordbar, F.; Jensen, J.; Du, M.; Guo, W. Key Genes Regulating Skeletal Muscle Development and Growth in Farm Animals. Animals 2021, 11, 835. [Google Scholar] [CrossRef]
- Zhang, M.; Xu, X.; Chen, Y.; Wei, C.; Zhan, S.; Cao, J.; Guo, J.; Dai, D.; Wang, L.; Zhong, T.; Zhang, H.; Li, L. Transcriptomic and Metabolomic Analyses Reveal Molecular Regulatory Networks for Pigmentation Deposition in Sheep. IJMS 2024, 25, 8248. [Google Scholar] [CrossRef]
- Jin, M.; Wang, H.; Liu, G.; Lu, J.; Yuan, Z.; Li, T.; Liu, E.; Lu, Z.; Du, L.; Wei, C. Whole-genome resequencing of Chinese indigenous sheep provides insight into the genetic basis underlying climate adaptation. Genet Sel. Evol. 2024, 56, 26. [Google Scholar] [CrossRef]
- Peng, H.; Hu, M.; Liu, Z.; Lai, W.; Shi, L.; Zhao, Z.; Ma, H.; Li, Y.; Yan, S. Transcriptome Analysis of the Liver and Muscle Tissues of Dorper and Small-Tailed Han Sheep. Front. Genet. 2022, 13, 868717. [Google Scholar] [CrossRef]
- Yang, C.; Wang, S.; Qi, Y.; Jin, Y.; Guan, R.; Huang, Z. Enhancing growth performance in Liangshan black sheep through fermented onion: insights from transcriptomics and metabolomics. Front. Vet. Sci. 2025, 12, 1533728. [Google Scholar] [CrossRef]
- Everaert, C.; Luypaert, M.; Maag, J.L.V.; Cheng, Q.X.; Dinger, M.E.; Hellemans, J.; Mestdagh, P. Benchmarking of RNA-sequencing analysis workflows using whole-transcriptome RT-qPCR expression data. Sci. Rep. 2017, 7, 1559. [Google Scholar] [CrossRef]
- Pombo, M.A.; Zheng, Y.; Fei, Z.; Martin, G.B.; Rosli, H.G. Use of RNA-seq data to identify and validate RT-qPCR reference genes for studying the tomato-Pseudomonas pathosystem. Sci. Rep. 2017, 7, 44905. [Google Scholar] [CrossRef]
- Lee, D.K.; Jeong, J.H.; Chun, S.K.; Chua, S.; Jo, Y.H. Interplay between glucose and leptin signalling determines the strength of GABAergic synapses at POMC neurons. Nat. Commun. 2015, 6, 6618. [Google Scholar] [CrossRef]
- Hazell, G.G.; Hindmarch, C.C.; Pope, G.R.; Roper, J.A.; Lightman, S.L.; Murphy, D.; O’Carroll, A.M.; Lolait, S.J. G protein-coupled receptors in the hypothalamic paraventricular and supraoptic nuclei – serpentine gateways to neuroendocrine homeostasis. Front. Neuroendocrinol. 2012, 33, 45–66. [Google Scholar] [CrossRef]
- Innes, D.; Hudson, N.; Anderson, S.; Poppi, D.; Quigley, S. Differential voluntary feed intake and whole transcriptome profiling in the hypothalamus of young sheep offered CP and phosphorus-deficient diets. animal 2023, 17, 100973. [Google Scholar] [CrossRef]
- Ismaeel, A.; Kim, J.S.; Kirk, J.S.; Smith, R.S.; Bohannon, W.T.; Koutakis, P. Role of Transforming Growth Factor-β in Skeletal Muscle Fibrosis: A Review. IJMS 2019, 20, 2446. [Google Scholar] [CrossRef]
- Delaney, K.; Kasprzycka, P.; Ciemerych, M.A.; Zimowska, M. The role of TGF-β1 during skeletal muscle regeneration. Cell Biol. Int. 2017, 41, 706–715. [Google Scholar] [CrossRef]
- Wen, X.; et al. Signaling pathways in obesity: mechanisms and therapeutic interventions. Signal Transduct. Target Ther. 2022, 7(1), 298. [Google Scholar] [CrossRef]
- Aarts, J.; Roeleveld, D.M.; Helsen, M.M.; Walgreen, B.; Vitters, E.L.; Kolls, J.; van de Loo, F.A.; van Lent, P.L.; van der Kraan, P.M.; Koenders, M.I. Systemic overexpression of interleukin-22 induces the negative immune-regulator SOCS3 and potently reduces experimental arthritis in mice. Rheumatology 2020, 60, 1974–1983. [Google Scholar] [CrossRef]
- Nohara, S.; Yamamoto, M.; Yasukawa, H.; Nagata, T.; Takahashi, J.; Shimozono, K.; Yanai, T.; Sasaki, T.; Okabe, K.; Shibata, T.; Akagaki, D.; Mawatari, K.; Fukumoto, Y. SOCS3 deficiency in cardiomyocytes elevates sensitivity of ischemic preconditioning that synergistically ameliorates myocardial ischemia reperfusion injury. PLoS ONE 2021, 16, e0254712. [Google Scholar] [CrossRef]
- JOULIAEKAZA, D.; CABELLO, G. The myostatin gene: physiology and pharmacological relevance. Curr. Opin. Pharmacol. 2007, 7, 310–315. [Google Scholar] [CrossRef]
- Morissette, M.R.; Cook, S.A.; Buranasombati, C.; Rosenberg, M.A.; Rosenzweig, A. Myostatin inhibits IGF-I-induced myotube hypertrophy through Akt. Am. J. Physiol.-Cell Physiol. 2009, 297, 1124–1132. [Google Scholar] [CrossRef]
- Hennebry, A.; Berry, C.; Siriett, V.; O'Callaghan, P.; Chau, L.; Watson, T.; Sharma, M.; Kambadur, R. Myostatin regulates fiber-type composition of skeletal muscle by regulating MEF2 and MyoD gene expression. Am. J. Physiol.-Cell Physiol. 2009, 296, C525–C534. [Google Scholar] [CrossRef]
- Li, X.; Lynn, B.D.; Nagy, J.I. The effector and scaffolding proteins AF6 and MUPP1 interact with connexin36 and localize at gap junctions that form electrical synapses in rodent brain. Eur. J. Neurosci. 2011, 35, 166–181. [Google Scholar] [CrossRef]
- Shimizu, K.; Stopfer, M. Gap junctions. Curr. Biol. 2013, 23, R1026–R1031. [Google Scholar] [CrossRef]
- Stojilkovic, S.S.; Tabak, J.; Bertram, R. Ion Channels and Signaling in the Pituitary Gland. Endocr. Rev. 2010, 31, 845–915. [Google Scholar] [CrossRef]
- Naor, Z. Signaling by G-protein-coupled receptor (GPCR): Studies on the GnRH receptor. Front. Neuroendocrinol. 2009, 30, 10–29. [Google Scholar] [CrossRef]
- Avet, C.; Garrel, G.; Denoyelle, C.; Laverrière, J.N.; Counis, R.; Cohen-Tannoudji, J.; Simon, V. SET Protein Interacts with Intracellular Domains of the Gonadotropin-releasing Hormone Receptor and Differentially Regulates Receptor Signaling to cAMP and Calcium in Gonadotrope Cells. J. Biol. Chem. 2013, 288, 2641–2654. [Google Scholar] [CrossRef]
- Núñez, L.; Bird, G.S.; Hernando-Pérez, E.; Pérez-Riesgo, E.; Putney, J.W.; Villalobos, C. Store-operated Ca2+ entry and Ca2+ responses to hypothalamic releasing hormones in anterior pituitary cells from Orai1−/− and heptaTRPC knockout mice. Biochim. Et. Biophys. Acta (BBA) -Mol. Cell Res. 2019, 1866, 1124–1136. [Google Scholar] [CrossRef]
- Tomić, M.; Kucka, M.; Kretschmannova, K.; Li, S.; Nesterova, M.; Stratakis, C.A.; Stojilkovic, S.S. Role of nonselective cation channels in spontaneous and protein kinase A-stimulated calcium signaling in pituitary cells. Am. J. Physiol.-Endocrinol. Metab. 2011, 301, E370–E379. [Google Scholar] [CrossRef]
- Loh, K.; Herzog, H.; Shi, Y.C. Regulation of energy homeostasis by the NPY system. Trends Endocrinol. Amp Metab. 2015, 26, 125–135. [Google Scholar] [CrossRef]
- Szlis, M.; Polkowska, J.; Skrzeczyńska, E.; Przybył, B.J.; Wójcik-Gładysz, A. Does obestatin modulate the hypothalamic appetite-regulating network in peripubertal sheep? Anim. Physiol. Nutr. 2018, 102, 690–700. [Google Scholar] [CrossRef]
- Review for "Impact of food restriction on the medio-basal hypothalamus of intact ewes as revealed by a large-scale transcriptomics study. 2022. [CrossRef]
- Dodd, G.T.; Lee-Young, R.S.; Brüning, J.C.; Tiganis, T. TCPTP Regulates Insulin Signaling in AgRP Neurons to Coordinate Glucose Metabolism With Feeding. Diabetes 2018, 67, 1246–1257. [Google Scholar] [CrossRef]
- Shin, A.C.; Filatova, N.; Lindtner, C.; Chi, T.; Degann, S.; Oberlin, D.; Buettner, C. Insulin Receptor Signaling in POMC, but Not AgRP, Neurons Controls Adipose Tissue Insulin Action. Diabetes 2017, 66, 1560–1571. [Google Scholar] [CrossRef]
- Lee, Y.; Rio, D.C. Mechanisms and Regulation of Alternative Pre-mRNA Splicing. Annu. Rev. Biochem. 2015, 84, 291–323. [Google Scholar] [CrossRef]
- Lee, P.J.; Sun, Y.; Soares, A.R.; Fai, C.; Picciotto, M.R.; Guo, J.U. Alternative translation initiation produces synaptic organizer proteoforms with distinct localization and functions. Mol. Cell 2024, 84, 3967–3978.e8. [Google Scholar] [CrossRef]
- Trempenau, M.L.; Schuster, M.B.; Pundhir, S.; Pereira, M.A.; Kalvisa, A.; Tapia, M.; Su, J.; Ge, Y.; de Boer, B.; Balhuizen, A.; Bagger, F.O.; Shliaha, P.; Sroczynska, P.; Walfridsson, J.; Grønbæk, K.; Theilgaard-Mönch, K.; Jensen, O.N.; Helin, K.; Porse, B.T. The histone demethylase KDM5C functions as a tumor suppressor in AML by repression of bivalently marked immature genes. Leukemia 2023, 37, 593–605. [Google Scholar] [CrossRef]
- Rondinelli, B.; Schwerer, H.; Antonini, E.; Gaviraghi, M.; Lupi, A.; Frenquelli, M.; Cittaro, D.; Segalla, S.; Lemaitre, J.M.; Tonon, G. H3K4me3 demethylation by the histone demethylase KDM5C/JARID1C promotes DNA replication origin firing. Nucleic Acids Res. 2015, 43, 2560–2574. [Google Scholar] [CrossRef]
- Burks, T.N.; Cohn, R.D. Role of TGF-β signaling in inherited and acquired myopathies. Skelet. Muscle 2011, 1, 19. [Google Scholar] [CrossRef]
- Masri, S.; Rigor, P.; Cervantes, M.; Ceglia, N.; Sebastian, C.; Xiao, C.; Roqueta-Rivera, M.; Deng, C.; Osborne, T.F.; Mostoslavsky, R.; Baldi, P.; Sassone-Corsi, P. Partitioning Circadian Transcription by SIRT6 Leads to Segregated Control of Cellular Metabolism. Cell 2014, 158, 659–672. [Google Scholar] [CrossRef]
- Dessalle, K.; Euthine, V.; Chanon, S.; Delarichaudy, J.; Fujii, I.; Rome, S.; Vidal, H.; Nemoz, G.; Simon, C.; Lefai, E. SREBP-1 Transcription Factors Regulate Skeletal Muscle Cell Size by Controlling Protein Synthesis through Myogenic Regulatory Factors. PLoS ONE 2012, 7, e50878. [Google Scholar] [CrossRef]
- Liu, D.; Black, B.L.; Derynck, R. TGF-β inhibits muscle differentiation through functional repression of myogenic transcription factors by Smad3. Genes Dev. 2001, 15, 2950–2966. [Google Scholar] [CrossRef]
- Sutcu, H.H.; Montagne, B.; Ricchetti, M. DNA-PKcs regulates myogenesis in an Akt-dependent manner independent of induced DNA damage. Cell Death Differ. 2023, 30, 1900–1915. [Google Scholar] [CrossRef]
- Okamoto, S.; Asgar, N.F.; Yokota, S.; Saito, K.; Minokoshi, Y. Role of the α2 subunit of AMP-activated protein kinase and its nuclear localization in mitochondria and energy metabolism-related gene expressions in C2C12 cells. Metabolism 2019, 90, 52–68. [Google Scholar] [CrossRef]
- Leng, G.; Pineda, R.; Sabatier, N.; Ludwig, M. 60 YEARS OF NEUROENDOCRINOLOGY: The posterior pituitary, from Geoffrey Harris to our present understanding. J. Endocrinol. 2015, 226, T173–T185. [Google Scholar] [CrossRef]
- Clément, F. Multiscale mathematical modeling of the hypothalamo-pituitary-gonadal axis. Theriogenology 2016, 86, 11–21. [Google Scholar] [CrossRef]
- Gavenas, J.; Rutishauser, U.; Schurger, A.; Maoz, U. Slow ramping emerges from spontaneous fluctuations in spiking neural networks. Nat. Commun. 2024, 15, 7285. [Google Scholar] [CrossRef]
- Romanò, N.; Guillou, A.; Hodson, D.J.; Martin, A.O.; Mollard, P. Multiple-scale neuroendocrine signals connect brain and pituitary hormone rhythms. Proc. Natl. Acad. Sci. U.S.A. 2017, 114, 2379–2382. [Google Scholar] [CrossRef]
- Severinsen, M.C.K.; Pedersen, B.K. Muscle–Organ Crosstalk: The Emerging Roles of Myokines. Endocr. Rev. 2020, 41, 594–609. [Google Scholar] [CrossRef]
- Nadeau, L.; Patten, D.; Caron, A.; Garneau, L.; Pinault-Masson, E.; Foretz, M.; Haddad, P.; Anderson, B.; Quinn, L.; Jardine, K.; McBurney, M.; Pistilli, E.; Harper, M.; Aguer, C. IL-15 improves skeletal muscle oxidative metabolism and glucose uptake in association with increased respiratory chain supercomplex formation and AMPK pathway activation. Biochim. Et. Biophys. Acta (BBA) -General. Subj. 2019, 1863, 395–407. [Google Scholar] [CrossRef]
- von Maltzahn, J.; Bentzinger, C.F.; Rudnicki, M.A. Wnt7a–Fzd7 signalling directly activates the Akt/mTOR anabolic growth pathway in skeletal muscle. Nat. Cell Biol. 2011, 14, 186–191. [Google Scholar] [CrossRef]
- CHARGÉ, S.B.P.; RUDNICKI, M.A. Cellular and Molecular Regulation of Muscle Regeneration. Physiol. Rev. 2004, 84, 209–238. [Google Scholar] [CrossRef]
- Zhou, Q.; Zhou, P.; Wang, A.L.; Wu, D.; Zhao, M.; Südhof, T.C.; Brunger, A.T. The primed SNARE–complexin–synaptotagmin complex for neuronal exocytosis. Nature 2017, 548, 420–425. [Google Scholar] [CrossRef]
- Jahn, R.; Fasshauer, D. Molecular machines governing exocytosis of synaptic vesicles. Nature 2012, 490, 201–207. [Google Scholar] [CrossRef]
- Gaisano, H.Y. Recent new insights into the role of SNARE and associated proteins in insulin granule exocytosis. Diabetes Obes. Metab. 2017, 19, 115–123. [Google Scholar] [CrossRef]
- Kesavan, J.; Borisovska, M.; Bruns, D. v-SNARE Actions during Ca2+-Triggered Exocytosis. Cell 2007, 131, 351–363. [Google Scholar] [CrossRef]
- Romanò, N.; Yip, S.H.; Hodson, D.J.; Guillou, A.; Parnaudeau, S.; Kirk, S.; Tronche, F.; Bonnefont, X.; Le Tissier, P.; Bunn, S.J.; Grattan, D.R.; Mollard, P.; Martin, A.O. Plasticity of Hypothalamic Dopamine Neurons during Lactation Results in Dissociation of Electrical Activity and Release. J. Neurosci. 2013, 33, 4424–4433. [Google Scholar] [CrossRef]
Figure 1.
Transcriptome profiling and differential expression analysis of the H-P-M axis. (A) Principal component analysis (PCA) of the 15 samples based on FPKM values; PIT (red/orange), HT (blue/cyan), and LD (green/teal) samples segregate along PC1 (34.6%) and PC2 (24.1%). (B) Expression distributions of representative tissue-specific genes (log2(FPKM + 1)) across PIT, HT, and LD, including PRL, LHB, NNAT, RPL23A, KEF53 family genes, MBP, ACTA1, TNNC2, CKM, and MYL11. (C) Venn diagram of DEGs across the three pairwise comparisons (LD vs HT, LD vs PIT, HT vs PIT), showing unique sets S1 (508), S2 (521), S3 (230), dual-intersection sets D1 (1,187), D2 (519), D3 (326), and triple-intersection set T1 (131). (D-F) Volcano plots of DEGs (|log2FC| ≥ 4, adjusted P < 0.01) for HT vs PIT (D), LD vs PIT (E), and LD vs HT (F); red, upregulated; blue, downregulated; gray, not significant. Top five DEGs are labeled in each comparison.
Figure 1.
Transcriptome profiling and differential expression analysis of the H-P-M axis. (A) Principal component analysis (PCA) of the 15 samples based on FPKM values; PIT (red/orange), HT (blue/cyan), and LD (green/teal) samples segregate along PC1 (34.6%) and PC2 (24.1%). (B) Expression distributions of representative tissue-specific genes (log2(FPKM + 1)) across PIT, HT, and LD, including PRL, LHB, NNAT, RPL23A, KEF53 family genes, MBP, ACTA1, TNNC2, CKM, and MYL11. (C) Venn diagram of DEGs across the three pairwise comparisons (LD vs HT, LD vs PIT, HT vs PIT), showing unique sets S1 (508), S2 (521), S3 (230), dual-intersection sets D1 (1,187), D2 (519), D3 (326), and triple-intersection set T1 (131). (D-F) Volcano plots of DEGs (|log2FC| ≥ 4, adjusted P < 0.01) for HT vs PIT (D), LD vs PIT (E), and LD vs HT (F); red, upregulated; blue, downregulated; gray, not significant. Top five DEGs are labeled in each comparison.
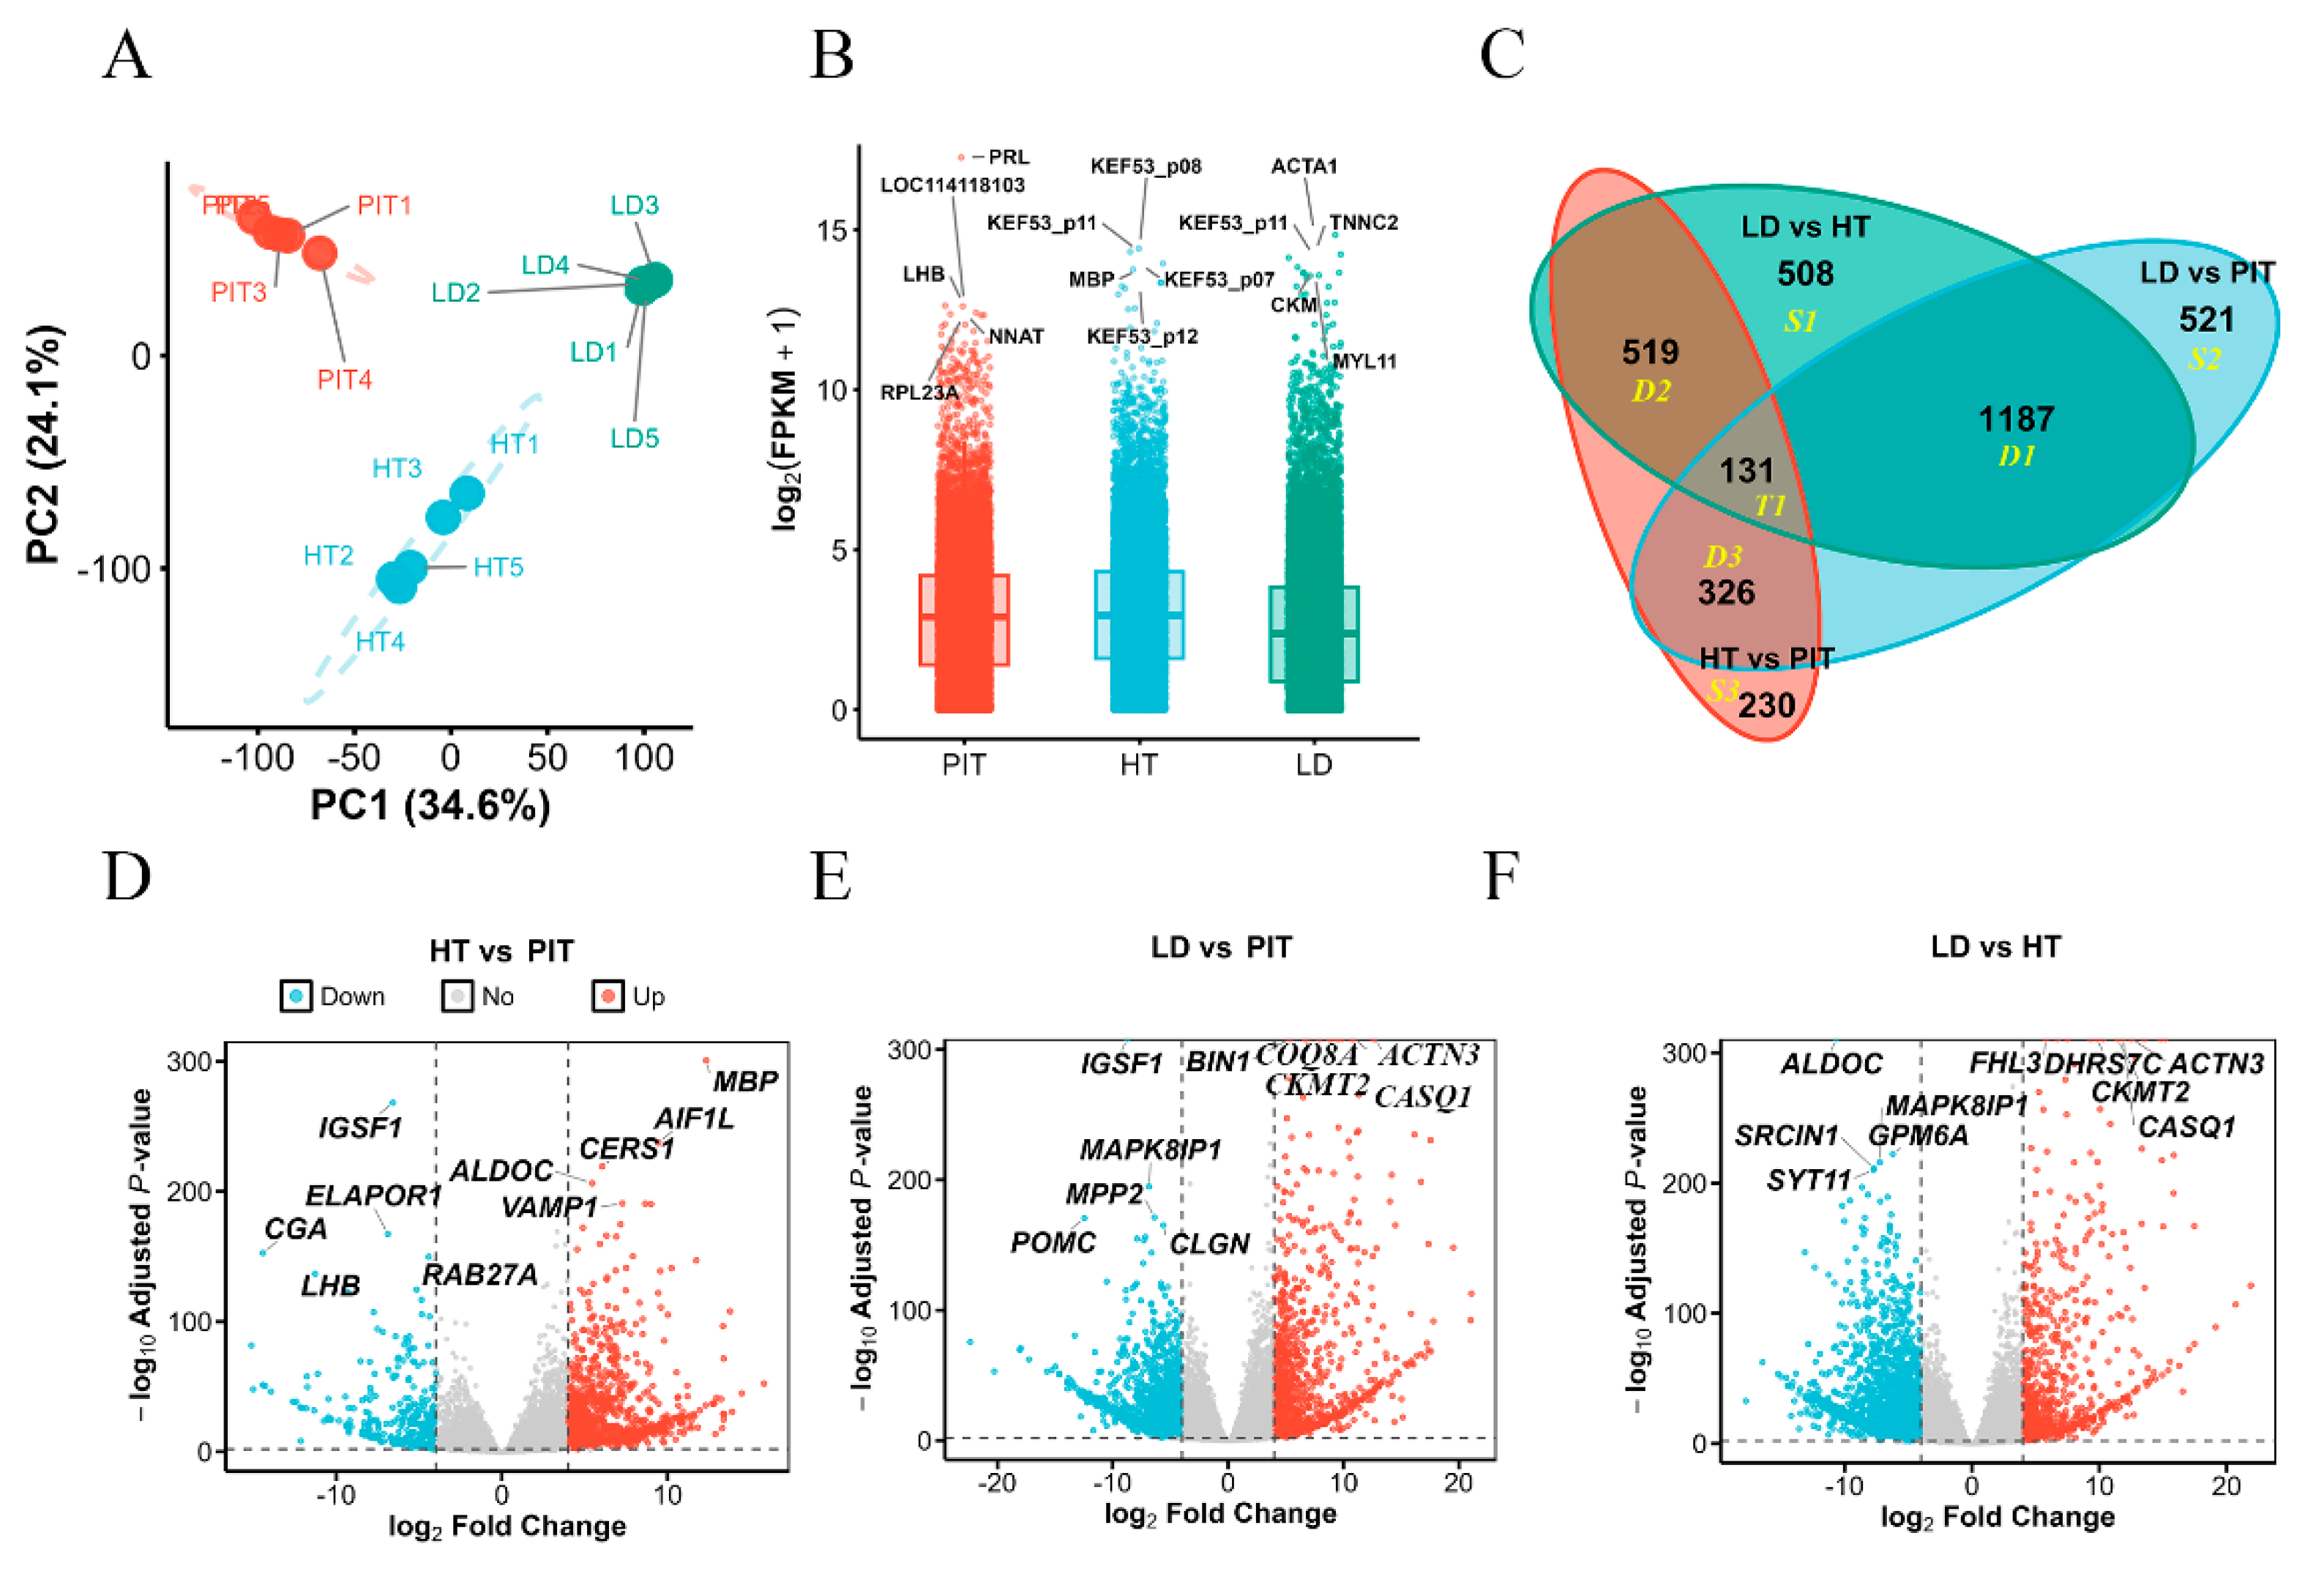
Figure 2.
Functional enrichment of tissue-specific DEG sets (S1, S2, S3). (A) Cellular component (CC) enrichment; (B) biological process (BP) enrichment; (C) KEGG pathway, molecular function (MF), and tissue expression profile (TISSUES) enrichment. Bubble size represents gene count and color represents -log10(FDR).
Figure 2.
Functional enrichment of tissue-specific DEG sets (S1, S2, S3). (A) Cellular component (CC) enrichment; (B) biological process (BP) enrichment; (C) KEGG pathway, molecular function (MF), and tissue expression profile (TISSUES) enrichment. Bubble size represents gene count and color represents -log10(FDR).
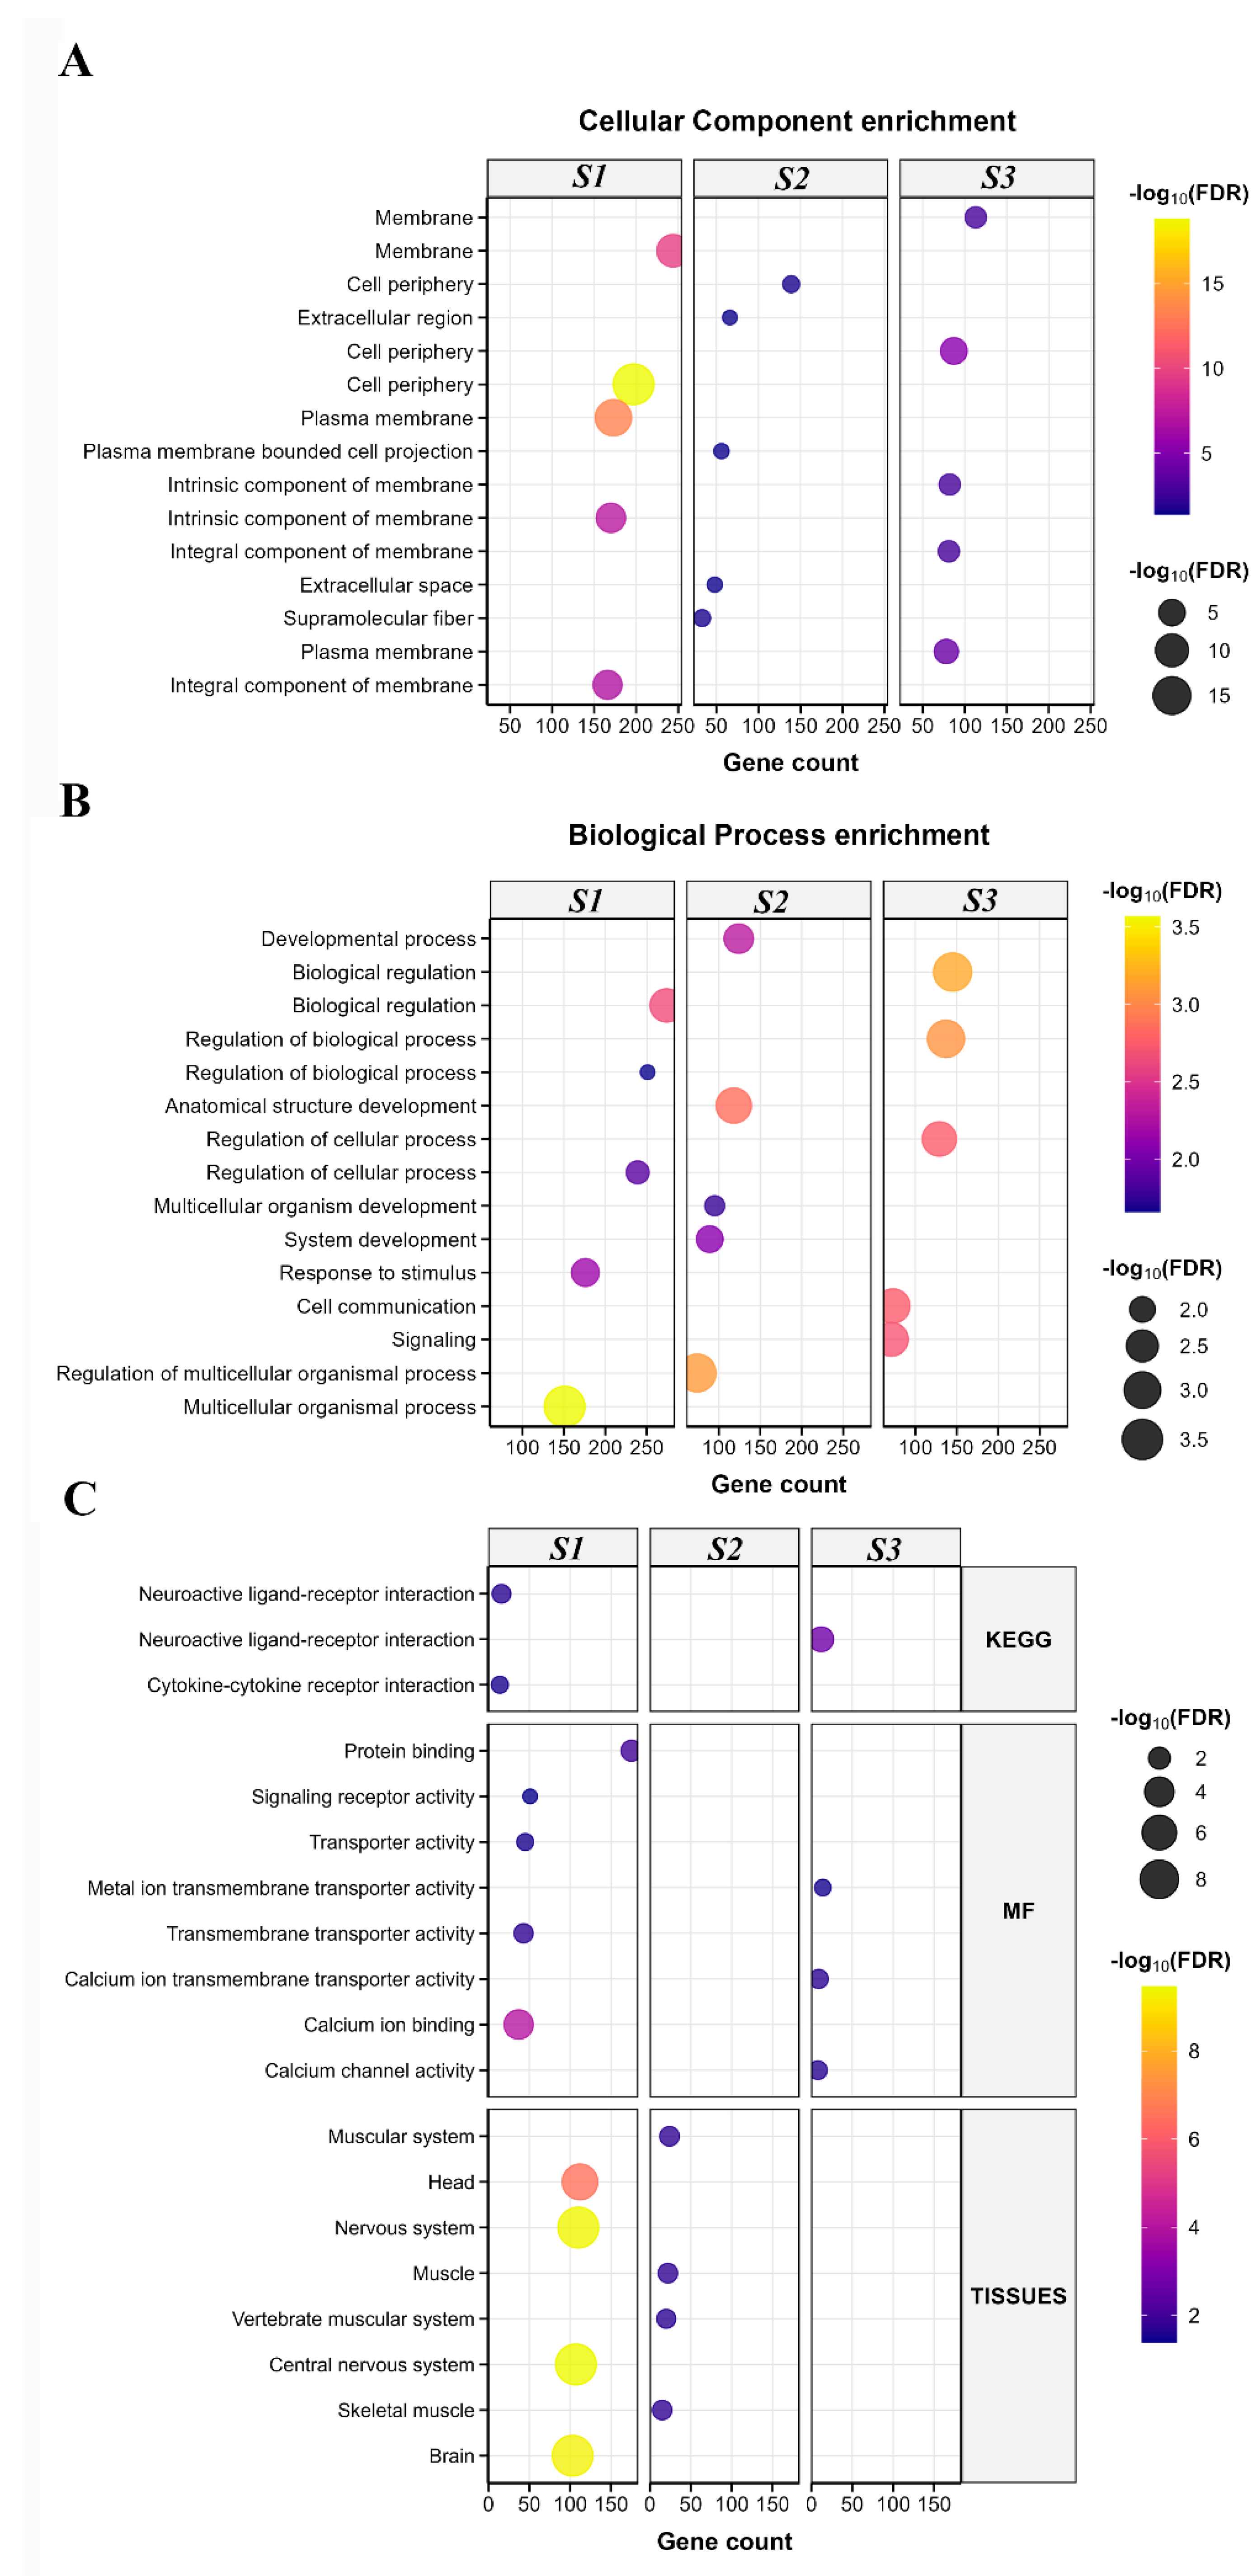
Figure 3.
Shared enriched pathways across the S1, S2, and S3 comparisons. Heatmap of the top 15 pathways present in at least two comparisons; color and values represent -log10(FDR); blank cells indicate no significant enrichment.
Figure 3.
Shared enriched pathways across the S1, S2, and S3 comparisons. Heatmap of the top 15 pathways present in at least two comparisons; color and values represent -log10(FDR); blank cells indicate no significant enrichment.
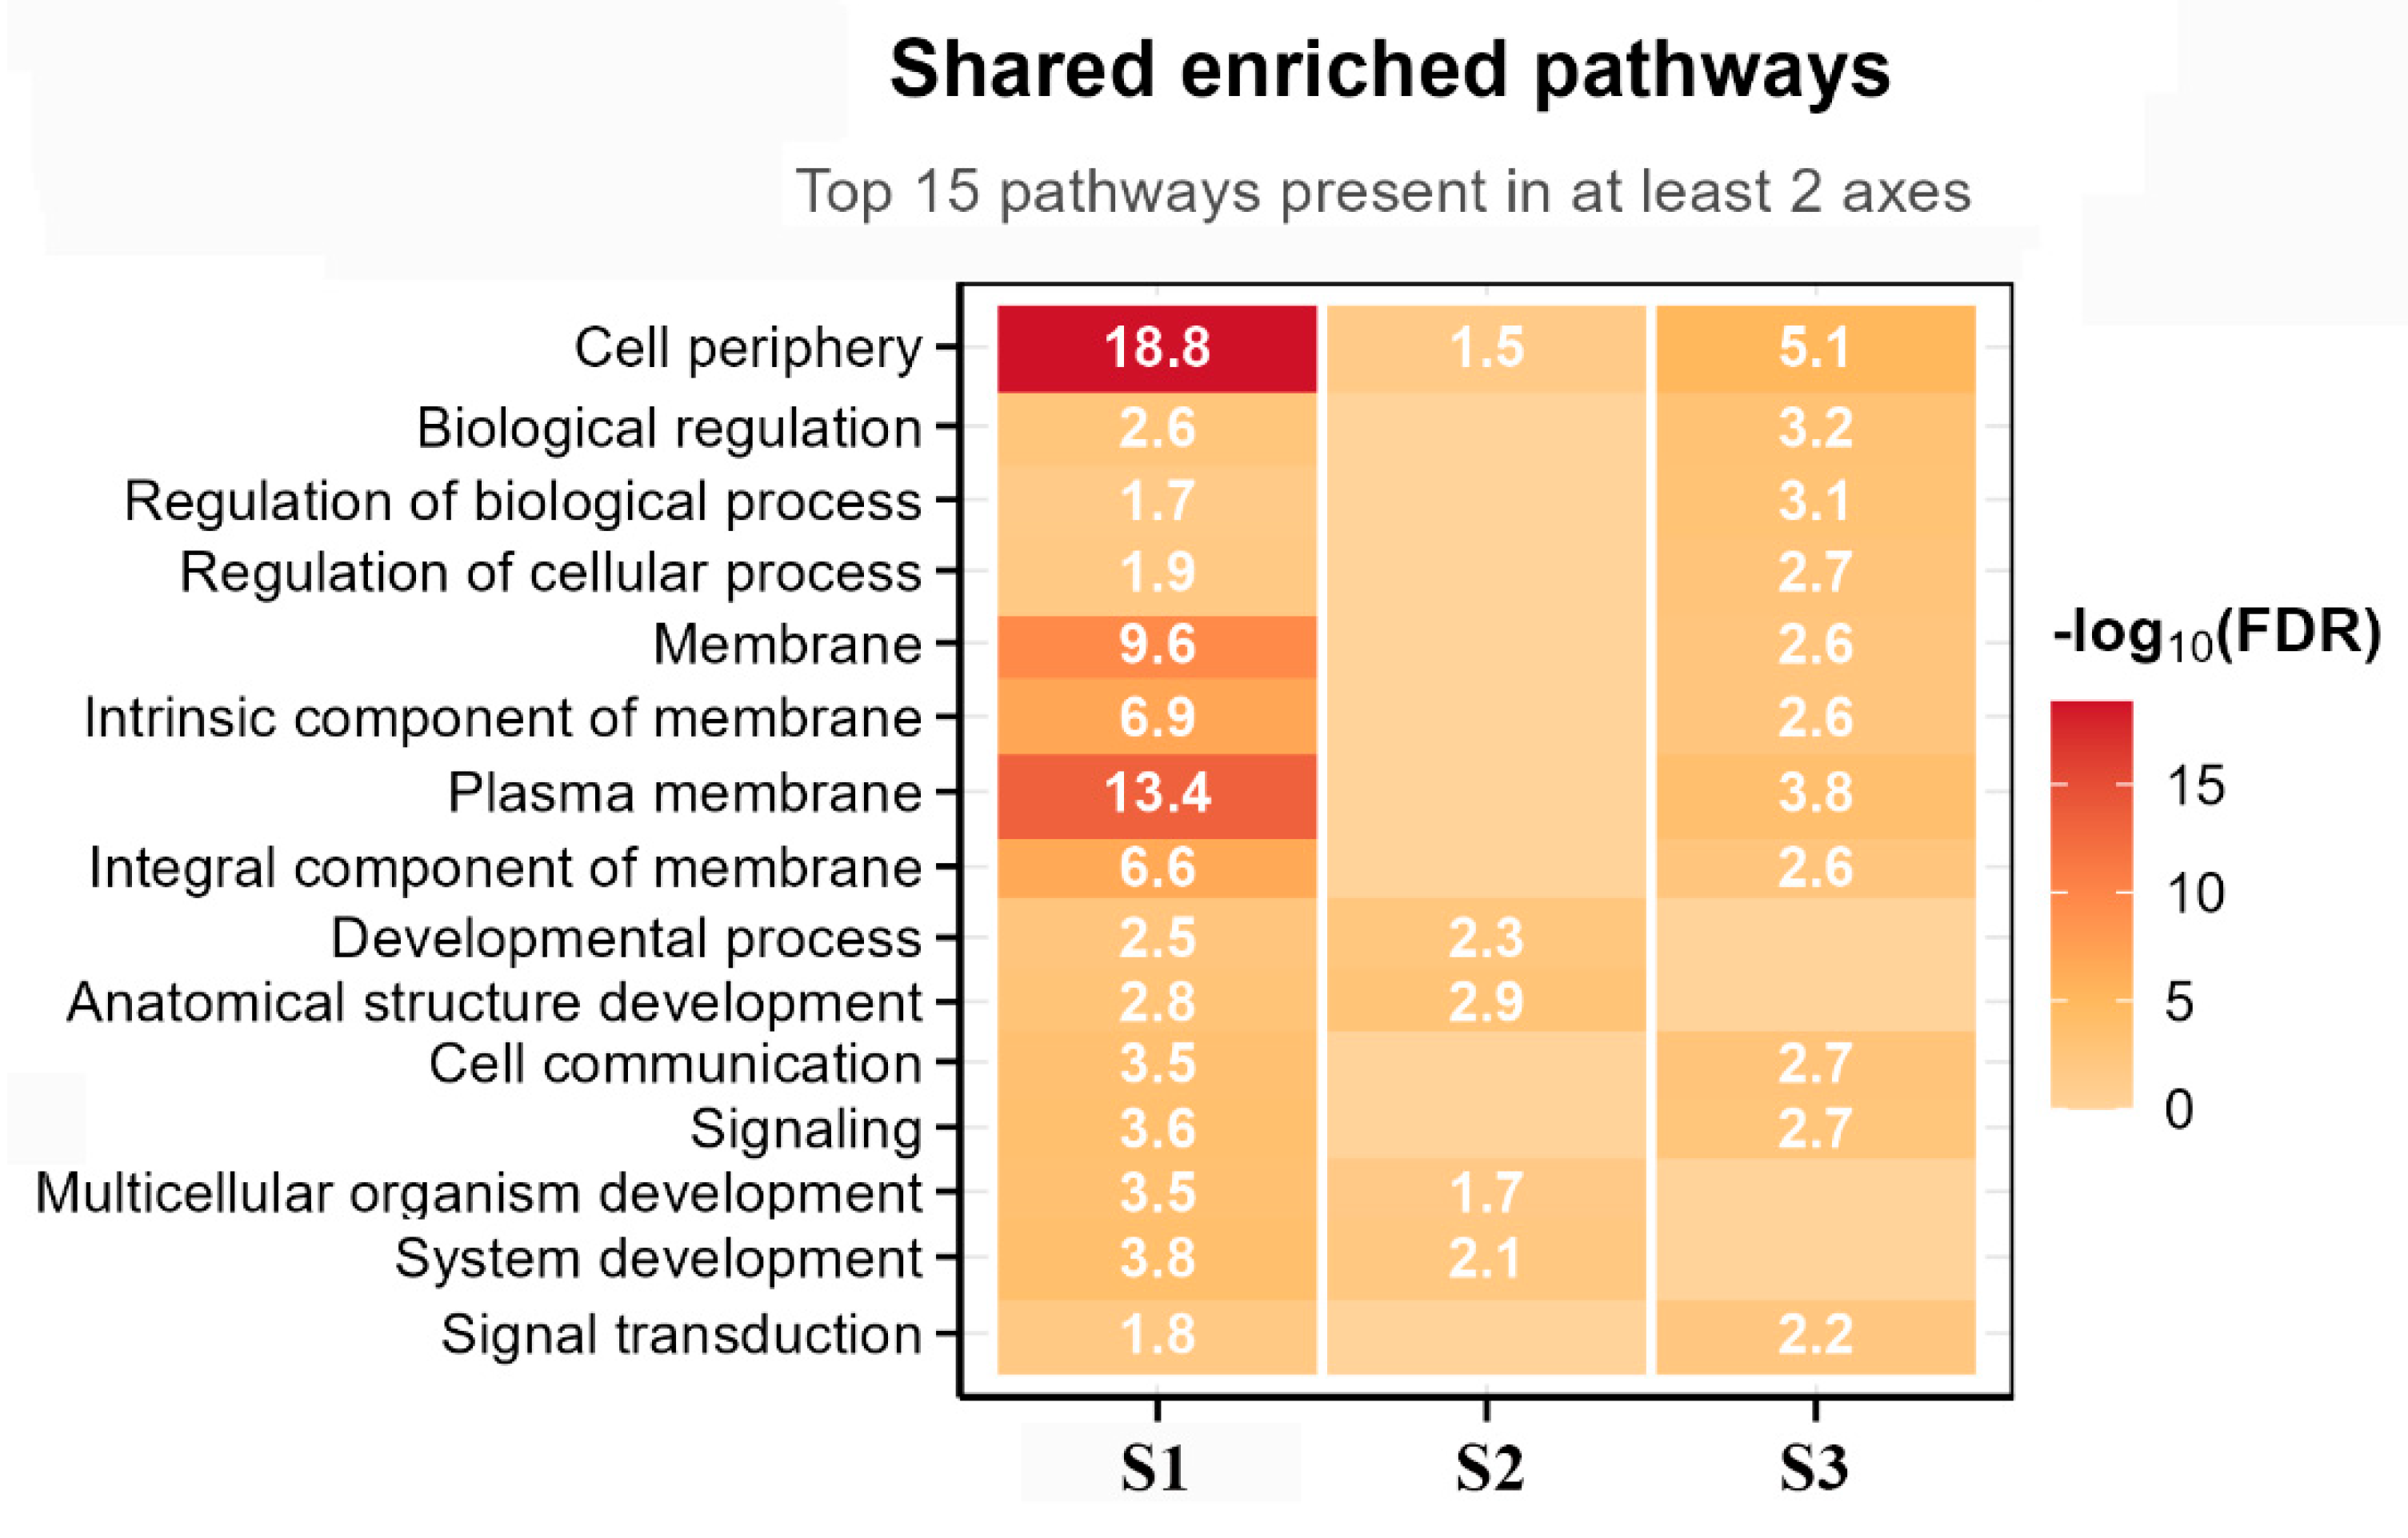
Figure 4.
Functional enrichment of the relay modules (D2, D3, D1). Enrichment results for cellular component (CC), biological process (BP), KEGG pathways, molecular function (MF), and tissue expression profiles (TISSUES) for the D2, D3, and D1 intersection gene sets. Bubble size represents gene count and color represents -log10(FDR).
Figure 4.
Functional enrichment of the relay modules (D2, D3, D1). Enrichment results for cellular component (CC), biological process (BP), KEGG pathways, molecular function (MF), and tissue expression profiles (TISSUES) for the D2, D3, and D1 intersection gene sets. Bubble size represents gene count and color represents -log10(FDR).
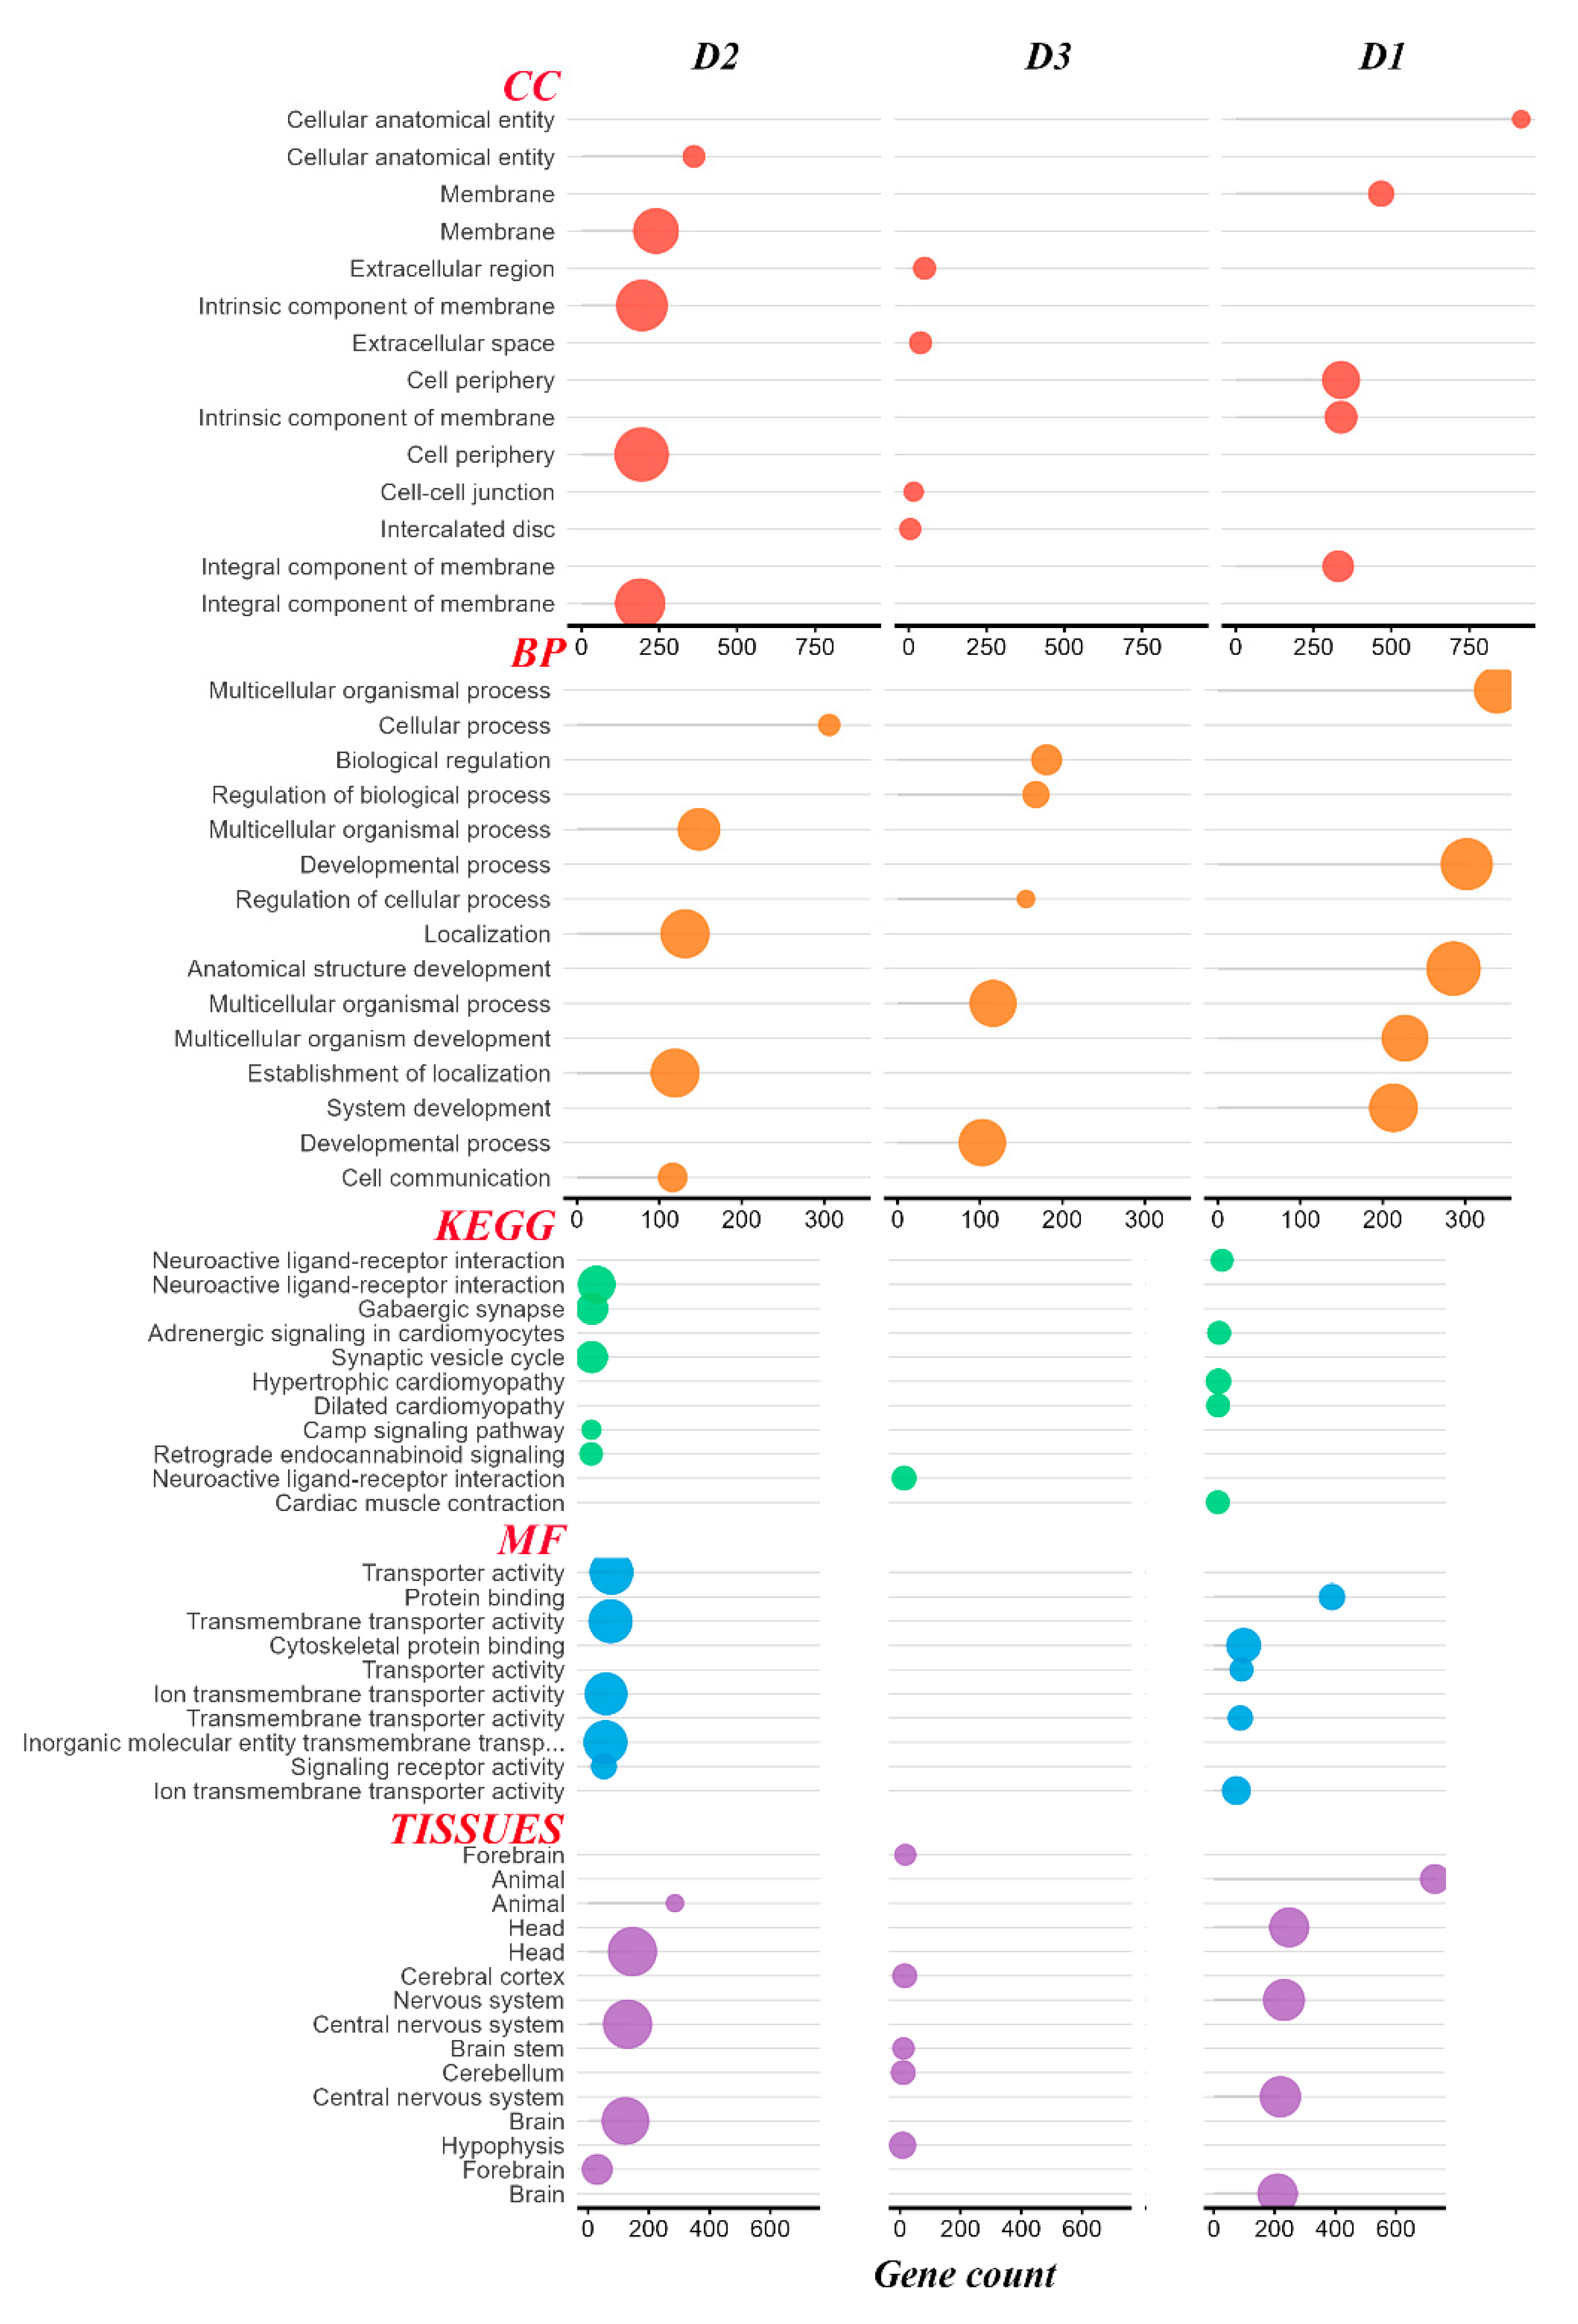
Figure 5.
Shared enriched pathways across the D2, D3, and D1 modules. Heatmap of the top 15 pathways; color and values represent -log10(FDR); blank cells indicate no significant enrichment.
Figure 5.
Shared enriched pathways across the D2, D3, and D1 modules. Heatmap of the top 15 pathways; color and values represent -log10(FDR); blank cells indicate no significant enrichment.
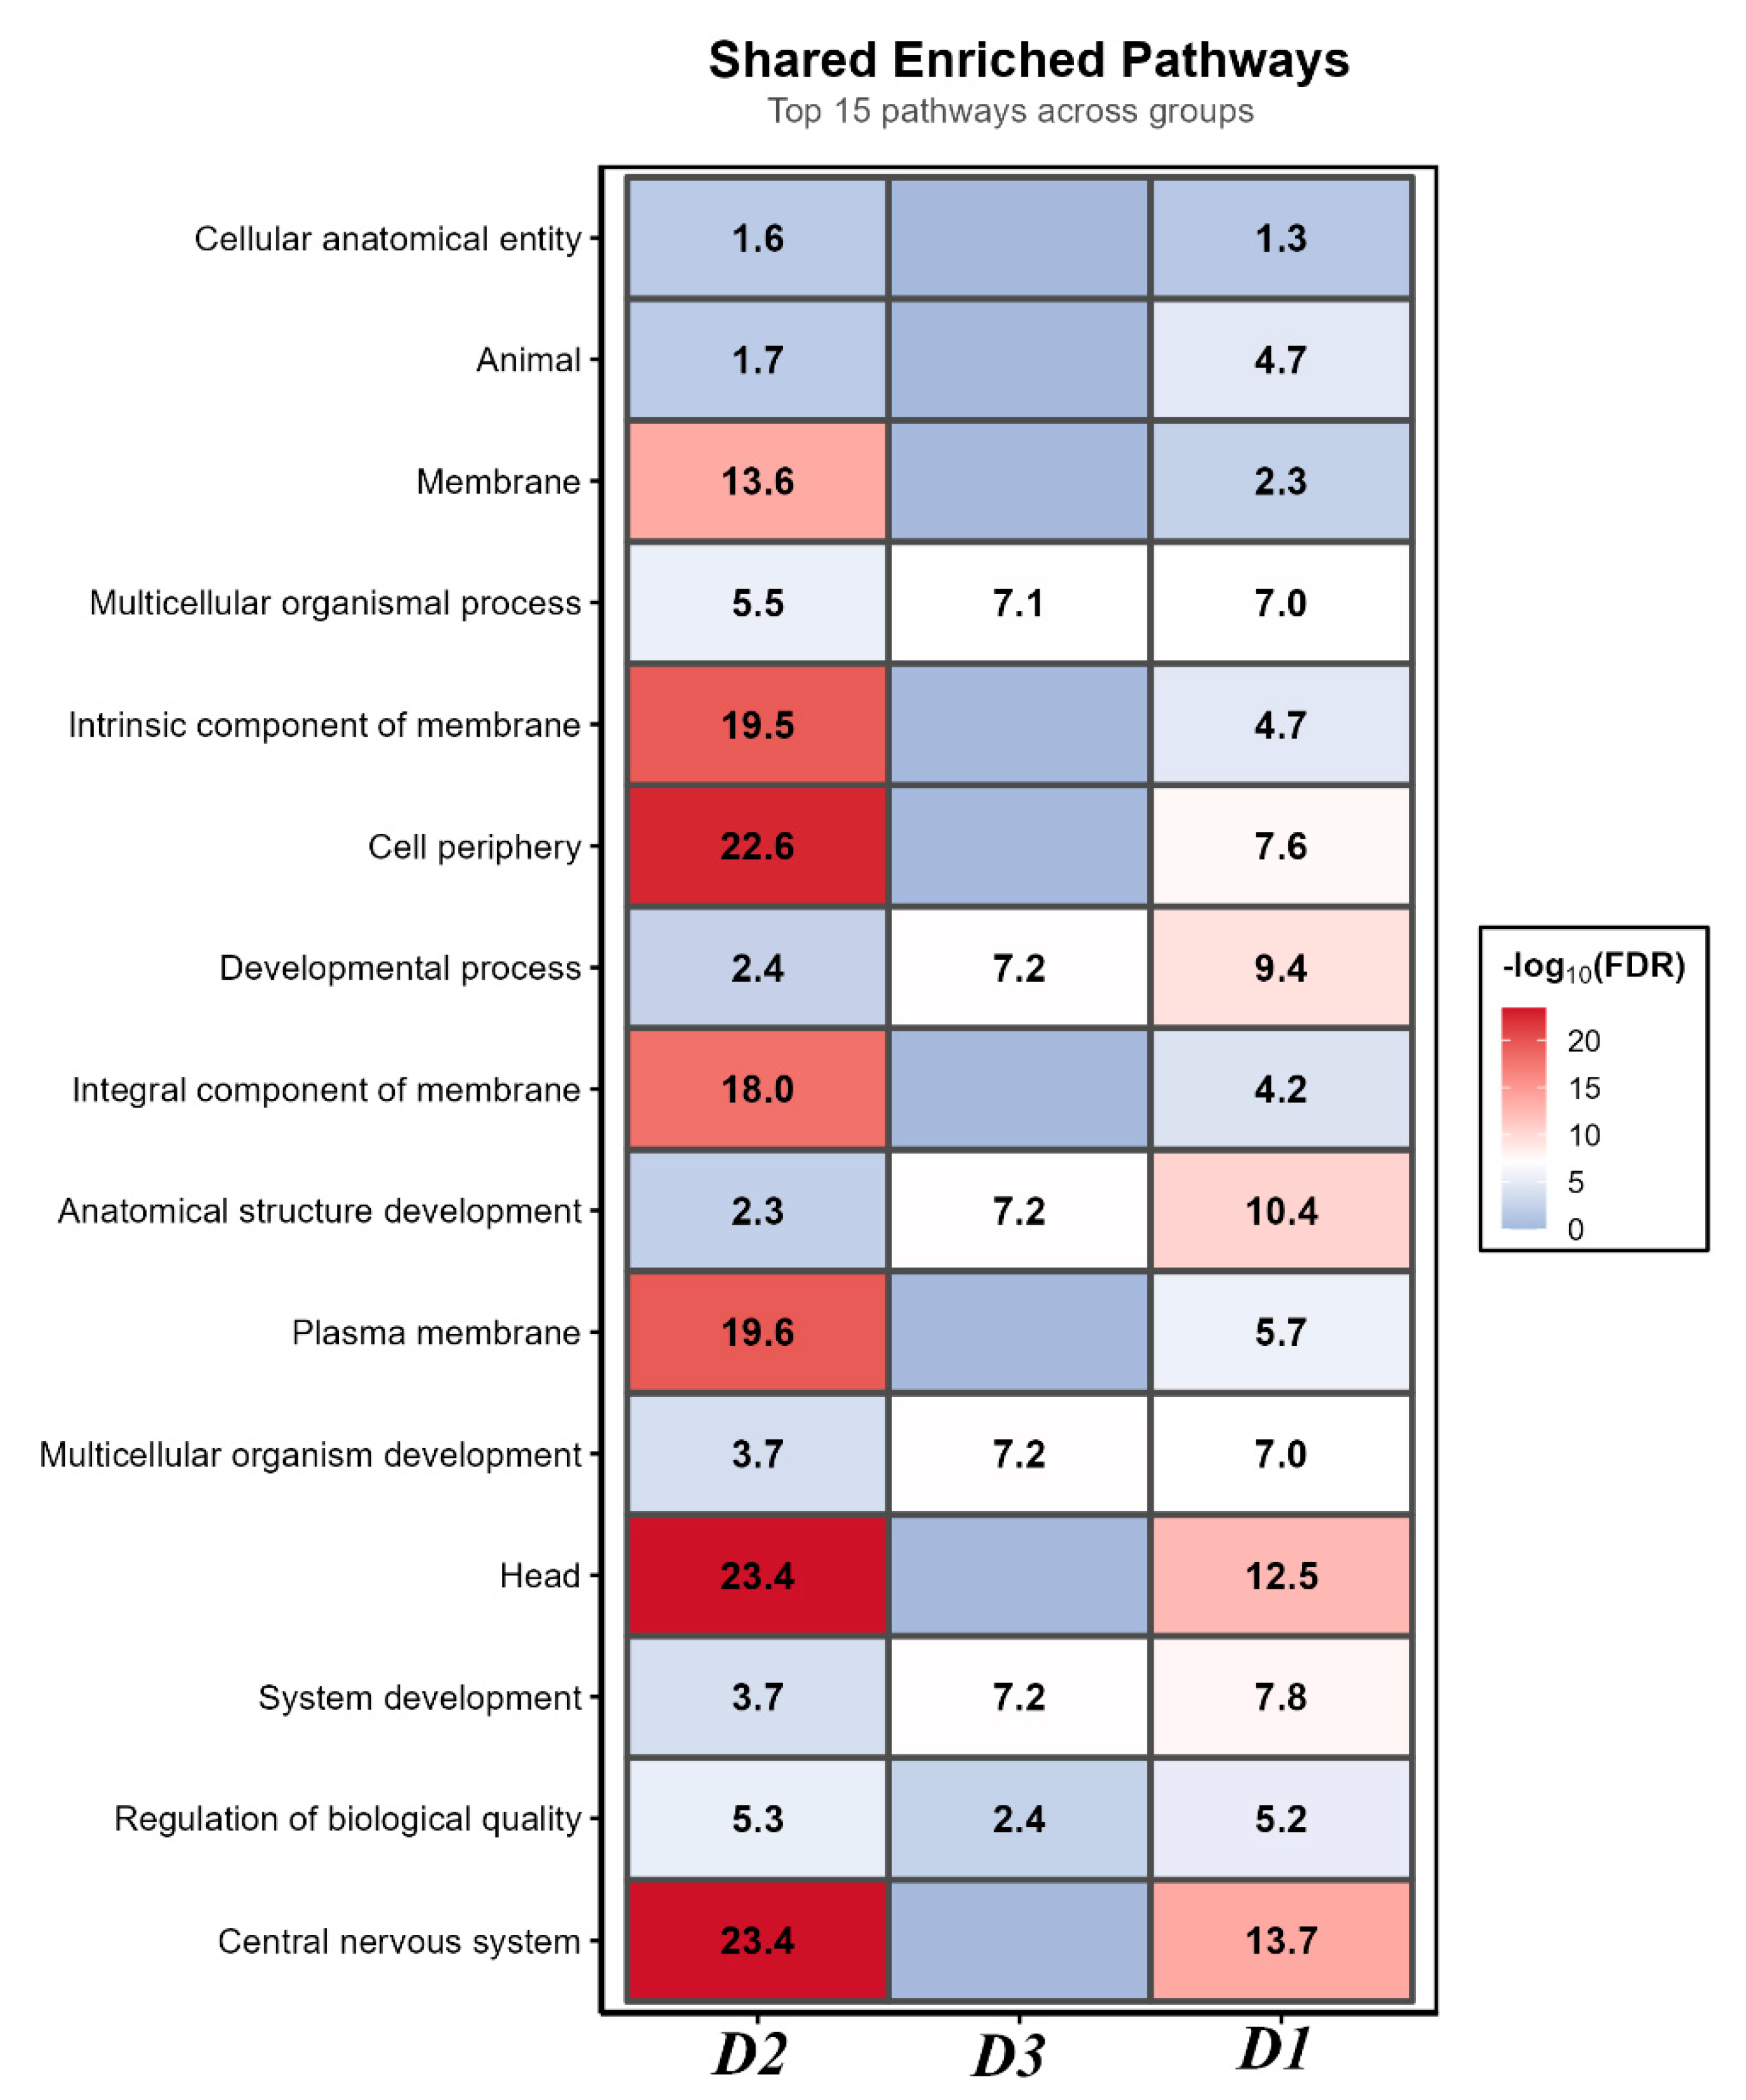
Figure 6.
Functional enrichment of the 131 core genes shared across the three tissues (T1 group). Bubble plot of enriched BP, CC, and TISSUES categories, including myofibril, sarcomere, synapse, cell junction, synaptic signaling, neuron projection, nervous system development, chemical synaptic transmission, cell-cell signaling, skeletal muscle, nervous system, muscle, forebrain, brain, and cell junction organization. Bubble size represents gene count and color represents -log10(FDR).
Figure 6.
Functional enrichment of the 131 core genes shared across the three tissues (T1 group). Bubble plot of enriched BP, CC, and TISSUES categories, including myofibril, sarcomere, synapse, cell junction, synaptic signaling, neuron projection, nervous system development, chemical synaptic transmission, cell-cell signaling, skeletal muscle, nervous system, muscle, forebrain, brain, and cell junction organization. Bubble size represents gene count and color represents -log10(FDR).
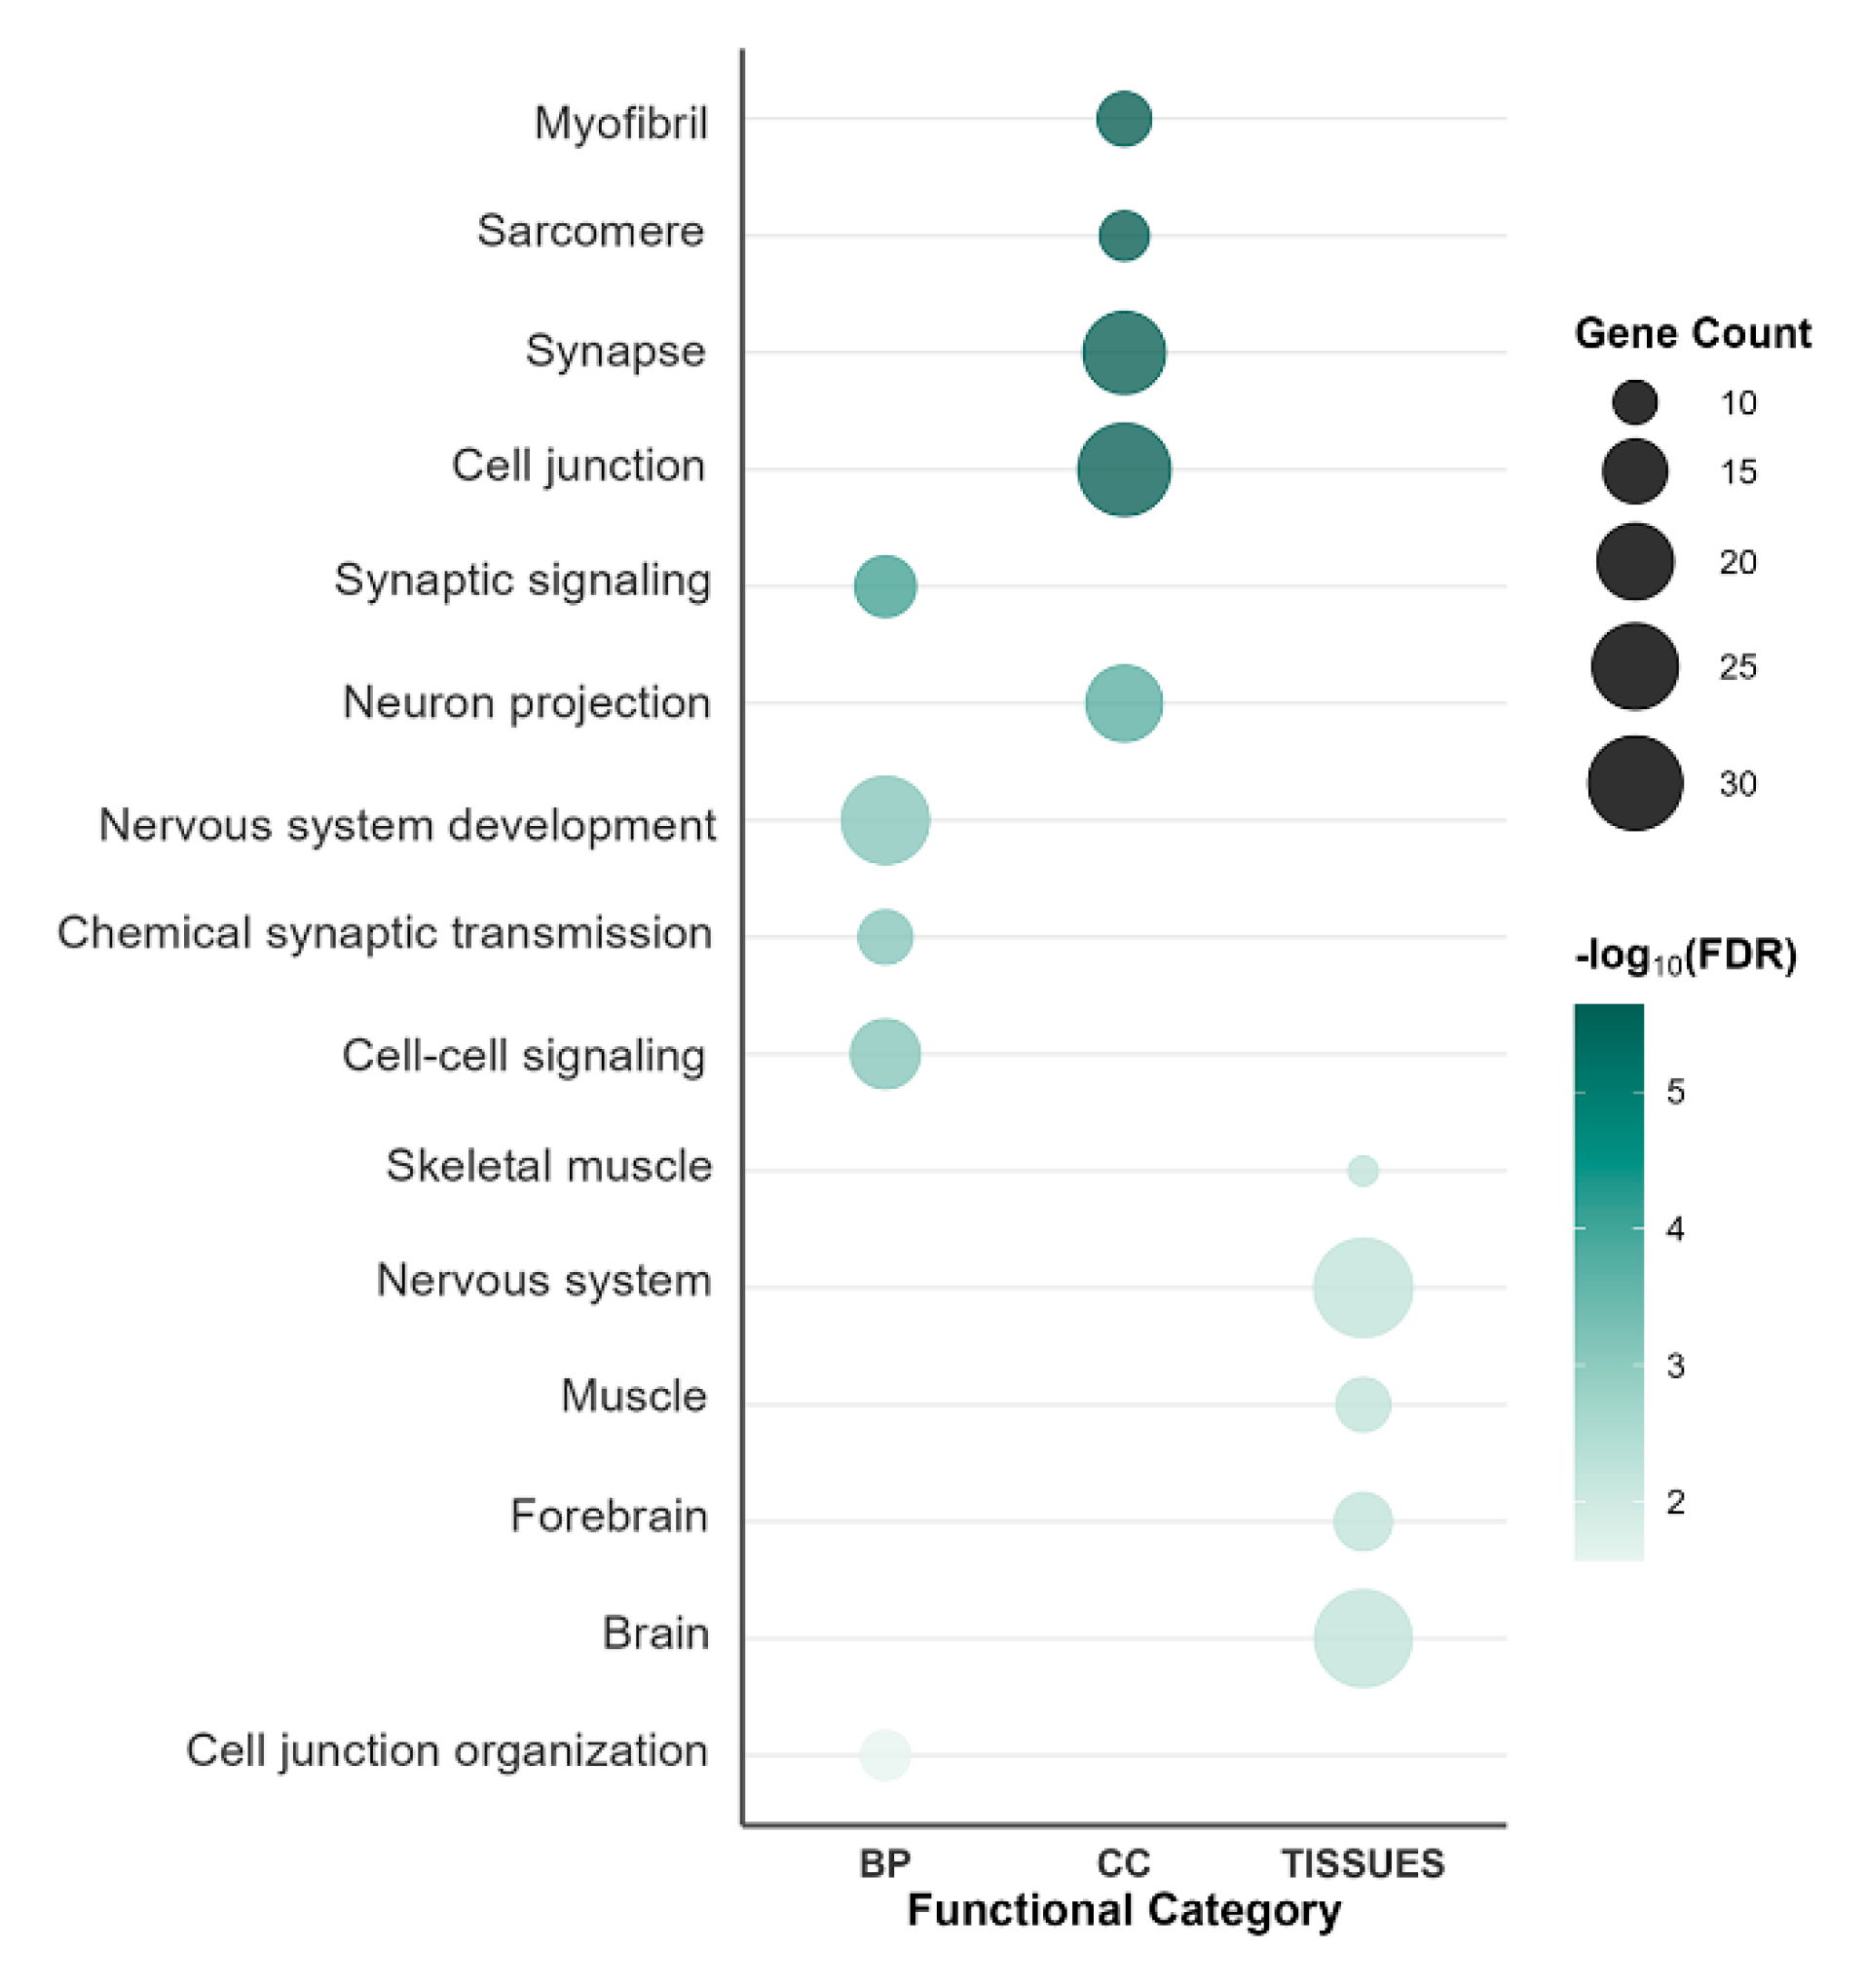
Figure 7.
qPCR validation of RNA-seq results. Comparison of relative expression (qPCR) and FPKM (RNA-seq) between the control (blue/green/light blue) and 20% fermented onion (orange/pink/yellow) groups for (A) hypothalamus genes (AGRP, CARTPT, KDM5C, NPY, SNRNP70), (B) pituitary genes (CRHR1, GLDN, MC4R, TRPC7), and (C) longissimus dorsi genes (MYOG, PPARA, SREBF1, TGFB1, TGFB3). Values are means of five biological replicates; qPCR was performed in technical triplicate.
Figure 7.
qPCR validation of RNA-seq results. Comparison of relative expression (qPCR) and FPKM (RNA-seq) between the control (blue/green/light blue) and 20% fermented onion (orange/pink/yellow) groups for (A) hypothalamus genes (AGRP, CARTPT, KDM5C, NPY, SNRNP70), (B) pituitary genes (CRHR1, GLDN, MC4R, TRPC7), and (C) longissimus dorsi genes (MYOG, PPARA, SREBF1, TGFB1, TGFB3). Values are means of five biological replicates; qPCR was performed in technical triplicate.
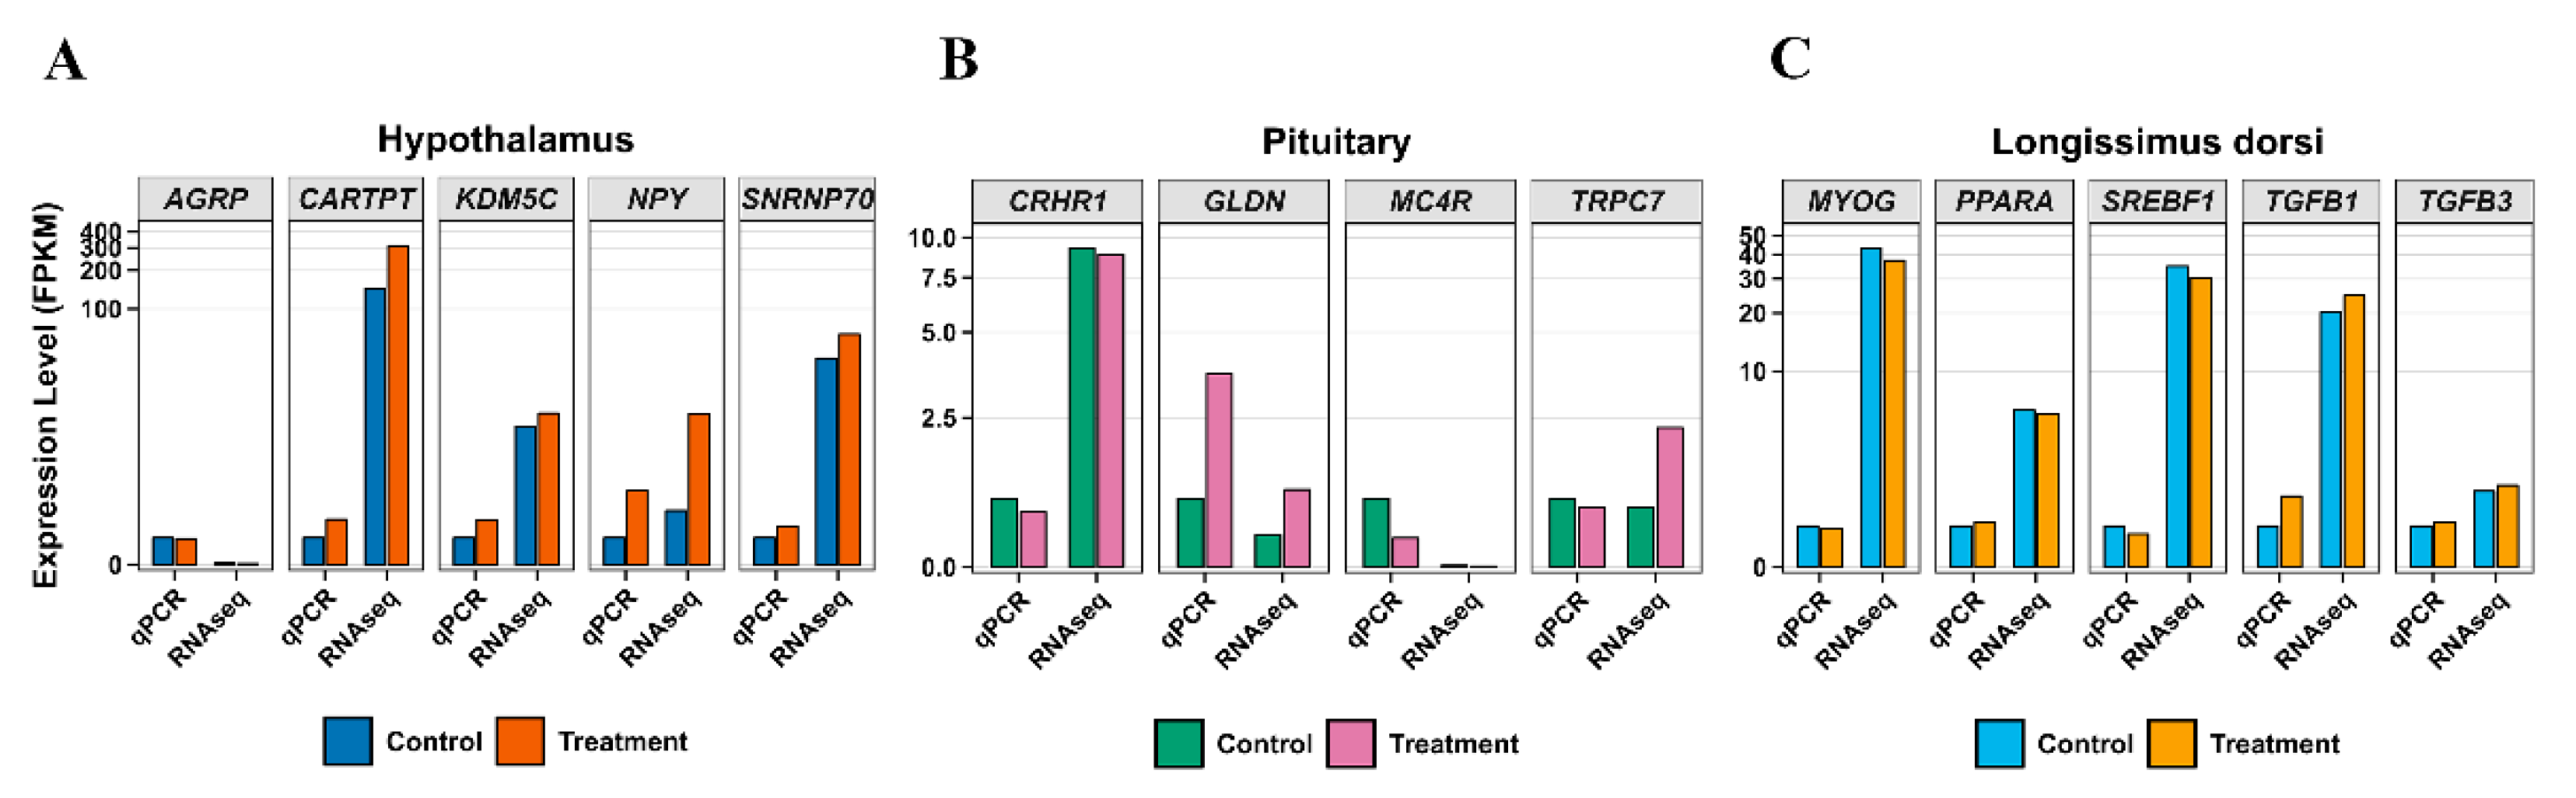

Table 1.
Classification and definition of tissue-specific and intersecting differentially expressed gene sets in the H-P-M axis.
Table 1.
Classification and definition of tissue-specific and intersecting differentially expressed gene sets in the H-P-M axis.
| Category | Name | Definition | Biological interpretation |
|---|---|---|---|
| Single-specific gene sets | S1 | Unique to LD vs HT | Hypothalamus-muscle specific interface |
| Single-specific gene sets | S2 | Unique to LD vs PIT | Pituitary-muscle specific interface |
| Single-specific gene sets | S3 | Unique to HT vs PIT | Hypothalamus-pituitary neuroendocrine interface |
| Dual-intersection gene sets | D1 | (LD vs HT) ∩ (LD vs PIT) | Muscle response to dual neuroendocrine signals |
| Dual-intersection gene sets | D2 | (LD vs HT) ∩ (HT vs PIT) | Hypothalamus-centered neural transmission module |
| Dual-intersection gene sets | D3 | (LD vs PIT) ∩ (HT vs PIT) | Pituitary-centered hormonal relay module |
| Triple-intersection gene set | T1 | (LD vs HT) ∩ (LD vs PIT) ∩ (HT vs PIT) | Core shared regulatory network |
Table 2.
Summary of RNA-seq quality metrics across tissues.
| Tissue | Sample size (n) | Clean read pairs (M) | Clean base (Gb) | Q30 (%) | GC (%) |
|---|---|---|---|---|---|
| Pituitary (PIT) | 5 | 26.77 ± 2.48 | 8.03 ± 0.75 | 95.74 ± 0.25 | 50.20 ± 0.51 |
| Longissimus dorsi (LD) | 5 | 23.05 ± 0.87 | 6.92 ± 0.28 | 95.93 ± 0.22 | 52.34 ± 1.73 |
| Hypothalamus (HT) | 5 | 23.07 ± 3.10 | 6.92 ± 0.91 | 95.36 ± 0.26 | 50.52 ± 0.79 |
Table 3.
Summary statistics of DEG overlap patterns.
| Category | Count | Proportion |
|---|---|---|
| Shared DEGs (in ≥ 2 comparisons; D1 + D2 + D3 + T1) | 2,163 | 63.21% |
| Unique DEGs (S1 + S2 + S3) | 1,259 | 36.79% |
| Muscle-related overlaps (D1) | 1,187 | 34.69% |
| Neuroendocrine overlaps (D2 + D3) | 845 | 24.70% |
| Core markers (T1) | 131 | 3.83% |
| Total unique DEGs | 3,422 | 100% |
Table 4.
Top five differentially expressed genes in pairwise tissue comparisons.
| Comparison | Direction | Top 5 DEGs | Primary functions |
|---|---|---|---|
| HT vs PIT | Up | MBP,AIF1L,CERS1,ALDOC,VAMP1 | Myelination, neuronal function, synaptic vesicle transport |
| HT vs PIT | Down | IGSF1,ELAPOR1,CGA,RAB27A,LHB | Hormone biosynthesis and secretion |
| LD vs PIT | Up | ACTN3,BIN1,CASQ1,CKMT2,COQ8A | Muscle contraction, T-tubule formation, calcium homeostasis, energy metabolism |
| LD vs PIT | Down | IGSF1,MAPK8IP1,MPP2,POMC,CLGN | Hormone precursor processing, signal transduction |
| LD vs HT | Up | ACTN3,CASQ1,CKMT2,DHRS7C,FHL3 | Muscle contraction, calcium homeostasis, energy metabolism, transcriptional regulation |
| LD vs HT | Down | ALDOC,GPM6A,MAPK8IP1,SRCIN1,SYT11 | Neuronal metabolism, synapse formation, signal transduction |
Table 5.
Core tissue-specific marker genes validated across multiple comparisons.
| Tissue | Core markers | Appearance in comparisons | Functional category |
|---|---|---|---|
| HT | ALDOC | HT vs PIT (top 5 up), LD vs HT (top 5 down) | Neuronal metabolism |
| PIT | IGSF1 | HT vs PIT (top 5 down), LD vs PIT (top 5 down) | Neuroendocrine signaling |
| LD | ACTN3, CASQ1, CKMT2 | LD vs PIT (top 5 up), LD vs HT (top 5 up) | Muscle contraction and energy metabolism |
Disclaimer/Publisher’s Note: The statements, opinions and data contained in all publications are solely those of the individual author(s) and contributor(s) and not of MDPI and/or the editor(s). MDPI and/or the editor(s) disclaim responsibility for any injury to people or property resulting from any ideas, methods, instructions or products referred to in the content. |
© 2026 by the authors. Licensee MDPI, Basel, Switzerland. This article is an open access article distributed under the terms and conditions of the Creative Commons Attribution (CC BY) license (http://creativecommons.org/licenses/by/4.0/).
Copyright: This open access article is published under a Creative Commons CC BY 4.0 license, which permit the free download, distribution, and reuse, provided that the author and preprint are cited in any reuse.