

Submitted:
03 November 2026
Posted:
05 November 2026
You are already at the latest version
Abstract
Olive leaves are an agricultural by-product with potential for recovering sugars and phe-nolic compounds. This study evaluated the effects of extraction conditions on total sugar and phenolic contents obtained by ultrasound-assisted extraction (UAE) and en-zyme-assisted extraction (EAE). UAE employed water, 30% ethanol, and 50% ethanol for 5–40 min, whereas EAE used 0–0.25% (w/v) cellulase in water or citrate buffer (pH 5) at 50 °C for 120 min. Cellulase activity was confirmed using the DNSA assay. During UAE, solvent composition significantly affected total sugar content, while extraction time and its interaction with solvent were significant only for total phenolics. UAE with 50% etha-nol yielded 14.82% total sugars after 5 min and a maximum of 15.01% after 30 min. The highest UAE phenolic content was 1276.90 mg GAE/100 g with 30% ethanol after 30 min. During EAE, medium and cellulase concentration significantly affected both responses. Maximum sugar and phenolic contents were 11.67% with 0.20% cellulase in water and 1287.02 mg GAE/100 g with 0.25% cellulase in citrate buffer, respectively. Both methods show potential for recovering sugars and phenolics from dried olive leaves, with method selection depending on the target fraction and processing requirements.
Keywords:
enzyme-assisted extraction
; ultrasound-assisted extraction
; cellulase
; total sugars
; total phenolics
; ethanol
; water
; citrate buffer
1. Introduction
Olive cultivation and processing generate substantial quantities of residues, including leaves that account for approximately 10% of the harvested material delivered to processing mills, with additional biomass generated during pruning [1,2]. Olive leaves contain phenolic compounds, phytosterols, and tocopherols associated with antioxidant activity [1,3,4], alongside soluble sugars and structural carbohydrates [5,6,7,8]. This composition makes them a promising renewable feedstock for recovering valuable constituents within the circular bioeconomy [6]. Conventional extraction methods, including maceration and Soxhlet extraction, commonly employ water, methanol, ethanol, or acetone [9,10,11,12,13]. However, long processing times, solvent and energy requirements, and possible degradation of thermolabile compounds have encouraged alternative approaches. These include ultrasound-assisted extraction (UAE) [3,4,10,13,14], microwave-assisted extraction [10,14,15], supercritical fluid extraction [10], pressurized liquid extraction and hydrothermal autohydrolysis [6,16], and natural deep eutectic solvents (NADES) [17,18]. NADES have also been combined with ultrasound [11,12,19,20], microwaves, and high hydrostatic pressure [21]. UAE promotes extraction through acoustic cavitation, which disrupts plant tissues, facilitates solvent penetration, and accelerates constituent release [3,11,14]. Reported phenolic contents vary with extraction conditions: Martín-García et al. [4] obtained 28.1–58.6 mg/g dry weight, while Huamán-Castilla et al. [3] reported 12.26 mg GAE/g dry weight using ethanol at 20 kHz and 60% amplitude for 30 min, and Contreras et al. [22] obtained 24.2 mg GAE/g dry weight using ethanol-based UAE. Across five olive cultivars, Rubio-Senent et al. [9] reported 98.65–303.96 mg/L following water maceration and 130.52–362.87 mg/L using 80% methanol in an ultrasonic bath. Aqueous extraction has also yielded approximately 15 ppm hydroxytyrosol [19]. For carbohydrates, Ramírez et al. [23] reported total sugar and polyol contents of 2.5–3.5% of dry weight after extraction with boiling water in an ultrasonic bath for 3 min, with mannitol (up to 2.60%) and glucose (up to 1.33%) predominating. These findings demonstrate the potential for recovering both fractions, although differences in procedures, analytical measurements, and reporting bases limit direct comparisons. Enzyme-assisted extraction (EAE) uses hydrolytic enzymes, including cellulases, pectinases, and xylanases, to disrupt cell-wall polysaccharides and facilitate constituent release [5,7]. Commercial preparations such as Celluclast, Pectinex XXL, and Viscozyme L have improved polyphenol recovery relative to enzyme-free aqueous extraction [5]. Enzymatic treatment can also modify phenolic composition: β-glucosidases and esterases promote oleuropein conversion into its aglycone and hydroxytyrosol [24,25]. Related studies have investigated enzymatic treatment of olive leaf extracts [26,27] and cellulase pretreatment before UAE [19]. Within an integrated biorefinery, López-Linares et al. [6] applied a Novozymes enzyme mixture in citrate buffer at pH 4.8, obtaining a maximum glucose yield of 10.6 g/100 g of raw olive leaves alongside phenolic and lignin recovery and bioethanol production. EAE performance depends on enzyme concentration and extraction medium, which affect catalytic activity and constituent solubility. Studies characterizing olive leaf composition and endogenous enzyme activities provide further context for enzymatic processing [9,23]. Water and aqueous ethanol are also relevant extraction media for potential food and pharmaceutical applications [28]. Nevertheless, systematic assessment of cellulase concentration in different aqueous media for the simultaneous recovery of total sugars and phenolics remains limited. Evaluating both responses is important because conditions favouring phenolic recovery may not maximize sugar recovery. The present study therefore aimed to characterize the moisture, ash, crude fat, and crude fiber contents of olive leaves and evaluate UAE and EAE as separate extraction approaches. UAE experiments examined solvent composition—water, 30% ethanol, and 50% ethanol—and extraction time (5–40 min). EAE experiments investigated cellulase concentration (0.05–0.25%, w/v) in water and citrate buffer (pH 5), using corresponding enzyme-free controls. The approaches were compared in terms of total sugar and phenolic recovery, processing time, and solvent and enzyme requirements to identify promising conditions for recovering either or both fractions and supporting olive leaf waste valorization.
2. Materials and Methods
2.1. Chemicals and Reagents
Ethanol (96%) and methanol (99%) were obtained from Thermo Fisher Scientific (Maharashtra, India); petroleum ether and sulfuric acid (96%) from Carlo Erba Reagents S.A.S. (Val-de-Reuil, France); sodium hydroxide from Lach-Ner (Neratovice, Czech Republic); Folin–Ciocalteu reagent, sodium carbonate, and anhydrous D-(+)-glucose from Gram-Mol (Zagreb, Croatia); phenol (99+%) from Acros Organics, Thermo Fisher Scientific (Maharashtra, India); cellulase, 3,5-dinitrosalicylic acid (DNSA), and potassium sodium tartrate from Sigma-Aldrich (Steinheim, Germany); and gallic acid from Merck KGaA (Darmstadt, Germany). Deionized and distilled water were obtained in Zagreb, Croatia.
2.2. Plant Material
Olive leaves were collected in June 2022 in the coastal region of Croatia. The leaves were washed, air-dried, and stored in polypropylene bags in a dry, dark place. Before extraction and analysis, the leaves were ground using an electric grinder (Tefal GT 110838, China).
2.3. Preliminary Gravimetric Determination of Olive Leaf Composition
2.4. Ultrasound – Assisted Extraction
Ground olive leaves (1 g ± 1 mg) were mixed with 10 mL of distilled water or aqueous ethanol (30% or 50%, v/v) in a dry glass beaker. Ultrasound-assisted extraction was performed in duplicate for 5, 10, 20, 30, and 40 min using a probe-type ultrasonic processor (UP200Ht, Hielscher, Germany) equipped with a 14 mm probe immersed directly in the mixture, at 100% amplitude and a nominal power of 200 W. Sample temperatures were measured before and after extraction and ranged from 22.5–24 °C and 53.5–74.5 °C, respectively.
2.5. Enzyme – Assisted Extraction
Enzyme-assisted extraction was performed using cellulase solutions prepared in purified water or citrate buffer (pH 5) at mass concentrations of 0.05, 0.10, 0.15, 0.20, and 0.25% (w/v). Ground olive leaves (2 g ± 0.01 g) were weighed into 100 mL Erlenmeyer flasks, and 25 mL of the corresponding cellulase solution was added. The mixtures were thoroughly mixed and maintained at 50 °C for 2 h under magnetic stirring, with each flask fitted with a water-cooled condenser. Following extraction, the mixtures were filtered through filter paper into 25 mL volumetric flasks and made up to volume with purified water or citrate buffer, as appropriate. The extracts were transferred to labelled Falcon tubes and stored at −18 °C until analysis. Enzyme-free controls were prepared using 25 mL of purified water or citrate buffer under identical conditions.
2.5.1. Determination of Cellulase Activity
Cellulase activity was determined using the DNSA assay according to Kracher et al. [33]. Cellulase solutions at the lowest and highest concentrations investigated (0.05 and 0.25% w/v, respectively) were prepared separately in purified water and citrate buffer. Cellulose (10 mg) was mixed with 1 mL of each enzyme solution, vortexed, and incubated in a shaking incubator at 50 °C for 1 h. The samples were then centrifuged at 10,000 rpm for 5 min. An aliquot of the supernatant (600 µL) was mixed with 600 µL of DNSA reagent and heated at 95 °C for 15 min. Subsequently, 200 µL of potassium sodium tartrate solution was added, and the mixture was vortexed and cooled in a refrigerator for 5 min. Absorbance was measured at 575 nm using a UV/Vis spectrophotometer (Lambda 1, Perkin-Elmer, Waltham, MA, USA). Controls without the enzyme, substrate, or DNSA reagent were included. Blank-corrected absorbance values were converted to reducing sugar concentrations using a glucose calibration curve. Cellulase activity was expressed in U/mL, with one unit defined as the amount of enzyme releasing 1 µmol of glucose equivalents per minute under the assay conditions.
2.6. Determination of Total Sugar Content
Total sugar content was determined using the phenol–sulfuric acid method [34]. A 600 µL aliquot of extract was mixed with 600 µL of 5% phenol solution and 3 mL of concentrated sulfuric acid. After vortex mixing, absorbance was measured at 492 nm using a UV/Vis spectrophotometer (Lambda 1, Perkin-Elmer, Waltham, MA, USA) against a reagent blank prepared using distilled water instead of the extract. Total sugar content was calculated using a glucose calibration curve (25–100 µg/mL) and expressed as a percentage (%) of glucose equivalents.
2.7. Determination of Total Phenolic Content
Total phenolic content was determined using the Folin–Ciocalteu method [35]. A 125 µL aliquot of extract was mixed with 625 µL of Folin–Ciocalteu reagent and 10 mL of distilled water. After 3 min, 1.9 mL of saturated sodium carbonate solution was added, and the mixture was vortexed and incubated in a water bath at 50 °C for 25 min. Absorbance was measured at 765 nm using a UV/Vis spectrophotometer (Lambda 1, Perkin-Elmer, Waltham, MA, USA) against a reagent blank prepared using distilled water instead of the extract. Total phenolic content was calculated using a gallic acid calibration curve (50–500 mg/L) and expressed as gallic acid equivalents (GAE).
2.8. Statistical Analysis
Measurements were performed in duplicate (n = 2), and results are expressed as mean ± standard deviation (SD). Microsoft Excel for Microsoft 365 (Microsoft Corporation, Redmond, WA, USA) was used to calculate means and SD and to prepare graphical representations. Statistical analyses were performed using R software (R Core Team, Vienna, Austria) [36]. Two-way analysis of variance (ANOVA) was used to describe differences in total sugar and total phenolic contents among the measured samples. For enzyme-assisted extraction, extraction medium (purified water and citrate buffer), cellulase mass concentration (0, 0.05, 0.10, 0.15, 0.20, and 0.25%, w/v), and their interaction were included in the model. For ultrasound-assisted extraction, extraction solvent (water, 30% ethanol, and 50% ethanol v/v), extraction time (5, 10, 20, 30, and 40 min), and their interaction were included in the model. Pairwise comparisons were performed in R using Tukey’s honestly significant difference (HSD) test based on estimated marginal means [36], with a threshold of p < 0.05. These comparisons describe differences among the measured samples rather than establish treatment effects. Graphs prepared in Excel display mean values, SD error bars, and lowercase letters corresponding to Tukey’s HSD test results obtained in R.
3. Results and Discussion
3.1. Chemical Composition of Olive Leaves
The olive leaves were characterized in terms of moisture, crude fat, total ash, and crude fiber contents to provide an overview of the raw material composition before extraction. The results are presented in Figure 1 and discussed in the following subsections, with particular attention to crude fiber as a structural fraction relevant to cellulase-assisted extraction.
The moisture content of the air-dried olive leaves was 5.95% (Figure 1), slightly higher than the values reported by Andrejč et al. [37] for leaves dried at room temperature (4.87–4.98%) or in an oven (3.39–3.42%). These differences may reflect variations in drying and storage conditions.
The crude fat content of the dried olive leaves was 2.24% (Figure 1), within the ranges reported for olive leaves from Portugal (2.15–4.01%) [38] and northwestern Brazil (1.59–2.42%) [39] and Spain (2.5%) [6]. These findings indicate a comparable lipid content, although differences in sample preparation and extraction methods should be considered when comparing results.
The total ash content of the dried olive leaves was 5.69% (Figure 1), higher than the range reported by Melo Ferreira et al. [38] (3.94–4.86%) and lower than the value reported by Altop et al. (2018) [8] and López-Linares et al. [6] (8.4%). Ribas et al. [39] reported ash contents of 4.63–5.10%, with higher values of 6.18–6.62% in some cultivars. These findings suggest that differences in ash content may be associated with olive cultivar and growing conditions.
The crude fiber content of the olive leaf sample was 20.50% (Figure 1), indicating a substantial proportion of structural plant material. This fraction consists mainly of cellulose and residual lignin, although their individual contents cannot be determined using this method. The measured value falls within the crude fiber range of 17.4–22.8% reported by Gomez-Cabrera et al. [40], exceeds the 14.5% reported by Ibrahim et al. [41], and is lower than the 27.83% reported by Altop et al. [8]. Differences among studies may reflect variations in analytical procedures, cultivar, sample composition, and environmental conditions affecting cell wall formation [42]. The result is also consistent with the lignocellulosic nature of olive leaves described by Romero-García et al. [43]. Regarding individual structural components, Lama-Muñoz et al. [7] reported cellulose, hemicellulose, and lignin contents of up to 15.38%, 9.16%, and 17.38%, respectively. However, these values are not directly comparable with crude fiber content, which represents a different analytical fraction. Although cellulose was not quantified separately in the present study, its presence in the olive leaf matrix provides a rationale for investigating cellulase-assisted extraction to facilitate the release of phenolic compounds.
3.2. Effects of Extraction on Total Sugar and Total Phenolic Contents
The effects of ultrasound-assisted and enzyme-assisted extraction on total sugar and total phenolic contents are discussed below, considering extraction time and solvent composition for ultrasound-assisted extraction, and extraction medium and cellulase concentration for enzyme-assisted extraction.
3.2.1. Ultrasound-Assisted Extraction
The total sugar contents obtained by ultrasound-assisted extraction (UAE) are presented in Figure 2, and the results of two-way ANOVA and Tukey’s HSD test are provided in Table S1 and Table S2. Total sugar contents ranged from 1.35% to 15.01%. Two-way ANOVA revealed a significant effect of solvent composition (F = 23.103; p < 0.001), whereas extraction time (F = 2.147; p > 0.05) and the interaction between these factors (F = 0.519; p > 0.05) were not significant (Table S1). Although solvent composition had a significant overall effect, Tukey’s HSD test showed that several treatment combinations, including those with the highest total sugar contents, did not differ significantly from one another (p > 0.05; Figure 2, Table S2). Among the solvents investigated, 50% ethanol yielded the highest total sugar contents at all extraction times, with values ranging from 9.97% to 15.01%. The highest value was recorded after 30 min (15.01%), although a similar value was obtained after only 5 min (14.82%). For 30% ethanol and water, the highest contents were obtained after 5 min, reaching 10.94% and 4.92%, respectively. These results indicate that solvent composition was more influential than extraction duration within the investigated ranges. A different solvent-dependent trend was reported by Huamán-Castilla et al. [3], who obtained the highest reducing sugar yield from olive leaves using water at 70 °C (13.15 mg/g dry weight, comprising 5.15 mg/g fructose and 8.00 mg/g glucose). Lower yields were obtained using 30% glycerol and 30% ethanol, reaching 7.42 and 4.74 mg/g dry weight, respectively. The difference from the present findings may reflect variations in solvent composition, solid-to-liquid ratio, extraction conditions, and the sugars measured. In particular, reducing sugar yields are not directly comparable with total sugar contents. Bilalov et al. [24] and Marchetti et al. [13] also reported advantages of higher ethanol concentrations (50% and 80%) for the UAE of target compounds. Further context is provided by Ramírez et al. [23], who investigated carbohydrates in leaves from different olive cultivars using boiling water and extraction in an ultrasonic bath for 3 min. Total sugar and polyol contents ranged from 2.5% to 3.5% of dry weight, with mannitol (up to 2.60%) and glucose (up to 1.33%) predominating, alongside smaller amounts of sucrose and fructose. The total sugar content obtained with water in the present study after 5 min (4.92%) was somewhat higher. This difference may be associated with the use of an ultrasonic probe, as well as differences in plant material, extraction conditions, and analytical methods. However, direct comparison is limited because Ramírez et al. [23] included polyols in their measurements. At longer extraction times (20–40 min), lower total sugar contents were recorded in water (1.35–1.72%) and 30% ethanol (3.14–5.30%) than after 5 min, although neither the overall effect of extraction time nor its interaction with solvent composition was statistically significant. Fiorito et al. [15] and Marchetti et al. [13] noted that prolonged ultrasound treatment may promote the degradation of extracted compounds or subsequent reactions with matrix components. Such processes could contribute to the observed patterns, but they were not demonstrated in the present study. Process optimization should therefore aim to maximize sugar recovery while minimizing extraction time and the proportion of organic solvent. Under the investigated conditions, 30% ethanol for 5 min represents a potential compromise, providing a total sugar content of 10.94% with a lower ethanol concentration. Alternatively, 50% ethanol for 5 min yielded 14.82%, close to the highest observed value of 15.01% after 30 min, suggesting limited benefit from extending the extraction time.
The total phenolic contents of olive leaf extracts obtained by ultrasound-assisted extraction (UAE) are presented in Figure 3, while the results of two-way analysis of variance (ANOVA) and Tukey’s HSD test are provided in Table S3 and Table S4. Two-way ANOVA revealed significant effects of solvent composition (F = 3.937; p < 0.05), extraction time (F = 7.188; p < 0.01), and their interaction (F = 3.025; p < 0.05), indicating that the effect of extraction time depended on the solvent used. Mean total phenolic contents ranged from 97.70 to 1276.90 mg GAE/100 g. Tukey’s HSD test showed that total phenolic contents obtained with water and 30% ethanol after 30 min were significantly higher than those obtained with water after 5 and 10 min (p < 0.05), whereas all other pairwise comparisons were not significant (Table S4). After 5 and 10 min, 50% ethanol yielded the highest mean total phenolic contents (983.36 and 911.19 mg GAE/100 g, respectively), whereas water yielded the lowest (97.70 and 127.97 mg GAE/100 g), although these differences were not statistically significant. Extending extraction to 30 min increased the contents obtained with water and 30% ethanol to 1175.74 and 1276.90 mg GAE/100 g, respectively. Although the latter represented the highest mean value, it differed significantly only from the values obtained with water after 5 and 10 min. The highest mean total phenolic contents were observed after 30 min with water and 30% ethanol, but after only 5 min with 50% ethanol, consistent with the significant interaction between solvent composition and extraction time. The increases observed with water and 30% ethanol may reflect the combined effects of ultrasound and the accompanying temperature rise, although their individual contributions cannot be distinguished. Extending extraction from 30 to 40 min decreased the mean values in both solvents; however, these decreases were not statistically significant and do not provide sufficient evidence of phenolic degradation.
The importance of solvent composition is illustrated by Huamán-Castilla et al. [3], who reported total phenolic contents of 12.26 mg GAE/g dry weight using 30% ethanol and 14.85 mg GAE/g dry weight using 30% glycerol at 70 °C after 30 min of ultrasound treatment (20 kHz, 60% amplitude). The latter value was 38% higher than that obtained by conventional extraction. Martín-García et al. [4] reported values of 28.1–58.6 mg/g dry weight using an ultrasonic probe for 8 min at 100% amplitude with 55% ethanol, whereas Contreras et al. [22] obtained 24.2 mg GAE/g dry weight using ethanol-based UAE. Higher ethanol concentrations have also been investigated: Pompei et al. [10] reported 43.28 mg GAE/mL in dried olive leaf extracts obtained with 70% ethanol using UAE (59 kHz, 30 min), compared with 49.43 mg GAE/mL following supercritical extraction of fresh leaves. Rosa et al. [14] also reported improved polyphenol extractability using ultrasound- and pressure-assisted extraction with ethanol concentrations up to 80%, compared with aqueous systems. Alternative solvent systems can also support targeted phenolic recovery. Sánchez-Monedero et al. [11] achieved an oleuropein yield of 37.00 mg/g dry weight in only 60 s using an ultrasonic probe (26 kHz, 10 W, room temperature) and a natural eutectic solvent composed of proline and 1,2-butanediol with 75% ethanol, reporting up to a 77-fold reduction in energy consumption relative to the conventional process. For aqueous extraction, Rubio-Senent et al. [9] reported total phenolic concentrations of 98.65–303.96 mg/L following water maceration of leaves from five olive cultivars, compared with 130.52–362.87 mg/L using 80% methanol in an ultrasonic bath. Zurob et al. [19] also recovered hydroxytyrosol using water, at a concentration of approximately 15 ppm. Together, these findings demonstrate the importance of solvent selection and processing conditions, although differences in plant material, analytical methods, and reporting bases—including total phenolics versus individual compounds and concentrations per extract volume versus contents per dry mass—limit direct comparisons. From a practical perspective, extraction with 30% ethanol for 30 min provided the highest mean total phenolic content in the present study. UAE with 50% ethanol for 5 min offered a shorter processing option, with no statistically significant difference from this maximum, while water extraction for 30 min provided an alcohol-free alternative. The selection of extraction conditions should therefore balance total phenolic content with processing time, solvent consumption, energy requirements, and the intended application of the extracts.
Overall, solvent composition significantly influenced both total sugar and total phenolic contents, whereas extraction time and its interaction with solvent were significant only for total phenolics. Extraction with 50% ethanol for 5 min provided a high total sugar content (14.82%) and a total phenolic content of 983.36 mg GAE/100 g, making it a promising option for recovering both fractions within a short processing time. Although the highest mean sugar content was obtained with 50% ethanol after 30 min (15.01%) and the highest mean phenolic content with 30% ethanol after 30 min (1276.90 mg GAE/100 g), neither differed significantly from the corresponding value obtained with 50% ethanol after 5 min. The choice of extraction conditions should therefore balance the recovery of both compound groups with processing time and the proportion of organic solvent.
3.2.2. Enzyme-Assisted Extraction
Before enzyme-assisted extraction of olive leaves, cellulase activity was assessed using the DNSA assay at the lowest (0.05%, w/v) and highest (0.25%, w/v) enzyme mass concentrations used in the extraction experiments. Enzymatic activity was confirmed in both water and citrate buffer (pH 5). At 0.05% cellulase, activities were 5.220 U/mL in water and 6.247 U/mL in citrate buffer, increasing to 8.303 and 14.776 U/mL, respectively, at 0.25% cellulase (Table 1). These results confirmed cellulase activity in both extraction media before evaluating its effects on total sugar and total phenolic contents.
Studies on the enzyme-assisted extraction of total sugars and phenolics from dried olive leaves remain limited. Previous research has mainly focused on glucose release for fermentation [44], enzymatic saccharification for bioethanol production [6], and increased glucose concentrations through β-glucosidase-mediated oleuropein hydrolysis [45]. Vardakas et al. [5] investigated total polyphenol recovery and antioxidant activity using different enzyme preparations, whereas Ramírez et al. [23] characterized olive leaf composition and endogenous enzyme activities. These studies did not directly compare the effects of cellulase concentration in water and citrate buffer (pH 5) on the simultaneous recovery of total sugars and phenolics. This comparative approach represents a distinct contribution of the present study, allowing the effects of enzyme concentration and extraction medium on the recovery of both compound groups to be assessed.
The total sugar contents obtained by enzyme-assisted extraction are presented in Figure 4, while the results of two-way ANOVA and Tukey’s HSD test are provided in Table S5 and Table S6. Extraction medium (F = 66.57; p < 0.001) and cellulase mass concentration (F = 13.35; p < 0.001) significantly affected total sugar content, whereas their interaction was not significant (F = 1.69; p > 0.05). According to the reported Tukey grouping letters, treatments with 0.20% cellulase in water and 0.20–0.25% cellulase in citrate buffer differed significantly from those with 0–0.05% cellulase in water (p < 0.05; Figure 4, Table S6). Total sugar contents ranged from 2.75% to 11.67%, with water yielding higher mean values than citrate buffer at all investigated cellulase concentrations (0–0.25%, w/v). In water, cellulase addition increased the content from 7.41% in the enzyme-free control to 11.67% at 0.20% cellulase, representing a relative increase of 57.6%. In citrate buffer, the content increased from 2.75% to 9.58% at 0.25% cellulase, corresponding to a relative increase of 248.4%. This larger relative increase partly reflects the lower control value in citrate buffer and does not necessarily indicate greater enzymatic efficiency. The extraction of sugars without enzyme addition is consistent with the substantial water-extractable fraction of olive leaves (25.5–32.8% of dry matter) and their reported glucose (6.2–9.4%) and mannitol (3.3–5.2%) contents [7,23]. Water facilitates the dissolution of polar carbohydrates through interactions with their hydroxyl groups [9], while cellulase-mediated disruption of the lignocellulosic matrix may further promote carbohydrate release [5,6]. López-Linares et al. [6] obtained a maximum glucose yield of 10.6 g/100 g of raw olive leaves using a Novozymes enzyme mixture in citrate buffer (pH 4.8) within an integrated biorefinery process that also recovered antioxidant phenolics and lignin. However, their pretreatment and hydrolysis conditions differ from the direct extraction approach investigated here, limiting quantitative comparison. Although pH influences enzyme performance, the observed differences cannot be attributed exclusively to pH because the media also differed in composition. Increasing cellulase concentration in water from 0.20% to 0.25% provided no further increase in mean total sugar content (11.67% and 11.62%, respectively), suggesting limited benefit from additional enzyme under the investigated conditions. However, this plateau does not establish complete cellulose conversion, and total sugar measurements cannot distinguish naturally soluble sugars from carbohydrates released through enzymatic hydrolysis. The results indicate the potential of enzyme-assisted extraction for recovering total sugars from olive leaves, consistent with previously reported applications of enzymatic lignocellulosic biomass degradation and carbohydrate release [6,16].
The total phenolic contents obtained by enzyme-assisted extraction are presented in Figure 5, while the results of two-way ANOVA and Tukey’s HSD test are provided in Table S7 and Table S8. Extraction medium (F = 42.34), cellulase mass concentration (F = 102.09), and their interaction (F = 15.33) significantly affected total phenolic content (p < 0.001), indicating that the effect of enzyme concentration depended on the medium used. Values ranged from 696.34 to 1287.02 mg GAE/100 g. Tukey’s HSD test showed that all cellulase treatments yielded significantly higher total phenolic contents than the enzyme-free controls, while 0.25% cellulase in citrate buffer provided a significantly higher content than all other treatments (p < 0.05; Figure 5, Table S8). In water, total phenolic content increased from 713.28 mg GAE/100 g in the enzyme-free control to the highest mean value of 1191.45 mg GAE/100 g at 0.15% (w/v) cellulase, representing an increase of approximately 67%. However, treatments with 0.05–0.15% cellulase did not differ significantly, so the highest mean value does not establish 0.15% as a uniquely optimal concentration. The improvement in phenolic recovery is consistent with the findings of Vardakas et al. [5], who investigated Celluclast, Pectinex XXL, and Viscozyme L preparations. Their highest total phenolic content of 605.55 mg GAE/L was obtained using a 1:1 mixture of Pectinex and Viscozyme, approximately 75% higher than the control. This relative increase is comparable to those observed in the present study, although differences in enzyme preparations, extraction conditions, and reporting units limit direct comparisons of absolute values. In citrate buffer, adding only 0.05% cellulase provided a high total phenolic content (1205.95 mg GAE/100 g), whereas the highest mean value was obtained at 0.25% (1287.02 mg GAE/100 g), approximately 85% higher than the control (696.34 mg GAE/100 g). Treatments with 0.05–0.20% cellulase did not differ significantly from one another, indicating that increasing the enzyme dose did not necessarily produce a proportional increase in phenolic recovery. The difference between the media was particularly pronounced at 0.25% cellulase, where the content obtained in water was 892.99 mg GAE/100 g, significantly lower than in citrate buffer. This pattern illustrates the significant interaction between cellulase concentration and extraction medium. Separate cellulase activity measurements also showed higher activity in citrate buffer than in water at 0.25% enzyme (14.776 versus 8.303 U/mL; Table 1). This finding may help explain the differences, although activity measured using a model substrate does not necessarily reflect enzyme performance in a complex plant matrix. In addition to facilitating compound release from the cell wall, enzymatic treatment may alter the composition of the phenolic fraction. Karami et al. [45] demonstrated that β-glucosidase from Aspergillus niger hydrolyzed oleuropein in a previously prepared olive leaf extract and altered its antioxidant activity. Liu et al. [26] applied cellulase preparations with high β-glucosidase activity, followed by treatment at elevated temperature, achieving complete oleuropein degradation and a hydroxytyrosol yield of 86–88%. These studies show that enzymatic effects may involve both improved extractability and the biotransformation of phenolic glycosides. However, because neither individual phenolic compounds nor the β-glucosidase activity of the preparation was determined in the present study, such transformations remain a possible rather than a confirmed explanation for the results. The importance of biological treatment for the availability of individual phenolics is further supported by Razola-Díaz et al. [1], who reported increases in oleuropein of up to 55% and hydroxytyrosol of up to 36% following olive leaf fermentation with selected lactic acid bacteria. Although fermentation is not directly comparable with cellulase addition, these findings support the importance of treatment type in phenolic release and changes in phenolic profiles. Accordingly, the decrease in total phenolic content at higher cellulase concentrations in water cannot be attributed to a specific mechanism without further analysis of extract composition. Overall, the results demonstrate that phenolic recovery depends on the combined selection of cellulase concentration and extraction medium. The high contents obtained at lower enzyme concentrations are relevant to further optimization of enzyme use. Since water and citrate buffer differ in both composition and pH, the advantage of citrate buffer at higher enzyme concentrations cannot be attributed exclusively to pH.
3.2.3. Comparison of Extraction Methods and Implications for Olive Leaf Valorization
The comparison of total sugar contents obtained by ultrasound-assisted extraction (UAE) and enzyme-assisted extraction (EAE) is presented in Figure 6. UAE with 50% ethanol yielded the highest mean value after 30 min (15.01%), although a similar value was achieved after only 5 min (14.82%). Cellulase-assisted extraction resulted in lower total sugar contents, with the highest mean value (11.67%) obtained using 0.20% (w/v) cellulase in water. Thus, UAE with 50% ethanol enabled higher observed sugar recovery within a shorter processing time, whereas EAE improved recovery in an aqueous medium without ethanol. Under the investigated conditions, short-duration UAE with 50% ethanol showed promise for obtaining extracts with high sugar recovery.
For total phenolics (Figure 7), the highest mean values were numerically similar for UAE with 30% ethanol for 30 min (1276.90 mg GAE/100 g) and EAE with 0.25% cellulase in citrate buffer (1287.02 mg GAE/100 g). UAE required ethanol but no enzyme addition, whereas EAE enabled recovery without ethanol, although it required a longer processing time, a larger volume of extraction medium per gram of leaves, and cellulase supplementation. Nevertheless, only 0.05% cellulase in citrate buffer yielded 1205.95 mg GAE/100 g, suggesting the potential to reduce enzyme consumption while maintaining high phenolic recovery. UAE with 50% ethanol for 5 min also enabled substantial simultaneous recovery of phenolics (983.36 mg GAE/100 g) and sugars (14.82%). Extraction conditions can therefore be selected to favour the recovery of phenolics, sugars, or both compound groups.
For sugar recovery, UAE with 50% ethanol stands out, providing a high yield after only 5 min and the highest mean value after 30 min, whereas both methods achieved nearly equal maximum mean phenolic contents under different conditions: UAE with 30% ethanol for 30 min and EAE with 0.25% cellulase in citrate buffer.
4. Conclusions
This study demonstrated the potential of ultrasound-assisted and enzyme-assisted extraction for recovering sugars and phenolic compounds from dried olive leaves. Solvent composition significantly affected total sugar recovery during UAE, whereas extraction time and its interaction with solvent were significant only for total phenolics. UAE with 50% ethanol provided a high total sugar content after only 5 min (14.82%), close to the highest mean value obtained after 30 min (15.01%), supporting the use of shorter processing times. For EAE, extraction medium and cellulase concentration significantly influenced both measured fractions, with a significant interaction observed only for total phenolics. The highest mean total sugar content was obtained with 0.20% cellulase in water (11.67%), while 0.25% cellulase in citrate buffer yielded the highest total phenolic content (1287.02 mg GAE/100 g). The latter was numerically comparable to the maximum obtained by UAE with 30% ethanol for 30 min (1276.90 mg GAE/100 g). Overall, UAE with 50% ethanol for 5 min represents a promising option for simultaneous sugar and phenolic recovery, while both extraction methods offer suitable conditions for obtaining phenolic-rich extracts. Selection should consider the target compounds, processing time, solvent requirements, and enzyme consumption. Further characterization of individual sugars and phenolics would help clarify extract composition and guide potential applications.
Supplementary Materials
The following supporting information can be downloaded at the website of this paper posted on Preprints.org, Table S1. Results of two-way ANOVA for the effects of extraction solvent and extraction time on total sugar content of olive leaf extracts obtained by ultrasound-assisted extraction. Table S2. Total sugar content of olive leaf extracts obtained by ultrasound-assisted extraction using different extraction solvents and times, with Tukey’s HSD test results. Table S3. Results of two-way ANOVA for the effects of extraction solvent and extraction time on total phenolic content of olive leaf extracts obtained by ultrasound-assisted extraction. Table S4. Total phenolic content of olive leaf extracts obtained by ultrasound-assisted extraction using different extraction solvents and times, with Tukey’s HSD test results. Table S5. Results of two-way ANOVA for the effects of extraction medium and cellulase mass concentration on total sugar content of olive leaf extracts obtained by enzyme-assisted extraction. Table S6. Total sugar content of olive leaf extracts obtained by enzyme-assisted extraction at different cellulase mass concentrations and in different extraction media, with Tukey’s HSD test results. Table S7. Results of two-way ANOVA for the effects of extraction medium and cellulase mass concentration on total phenolic content of olive leaf extracts obtained by enzyme-assisted extraction. Table S8. Total phenolic content of olive leaf extracts obtained by enzyme-assisted extraction at different cellulase mass concentrations and in different extraction media, with Tukey’s HSD test results.
Author Contributions
Conceptualization, M.D.; methodology, M.D.; software, M.D.; validation, M.D., J.B., D.Š. and T.R.; formal analysis, M.D., J.B., D.Š. and T.R.; investigation, M.D., J.B., D.Š. and T.R.; resources, M.D. and T.R.; data curation, M.D., J.B., D.Š. and T.R.; writing—original draft preparation, M.D.; writing—review and editing, M.D.; visualization, M.D.; supervision, M.D.; project administration, M.D.; funding acquisition, M.D. All authors have read and agreed to the published version of the manuscript.
Funding
This research received no external funding.
Data Availability Statement
The original contributions presented in this study are included in the article. Further inquiries can be directed to the corresponding author.
Conflicts of Interest
The authors declare no conflicts of interest.
References
- Razola-Díaz, M.C.; Martín-García, B.; De Montijo-Prieto, S.; Aznar-Ramos, M.J.; Jiménez-Valera, M.; Ruiz-Bravo, A.; Verardo, V.; Gómez-Caravaca, A.M. Unlocking phenolic bioactive compounds from olive leaves through lactic acid fermentation. Food Res. Int. 2026, 242, 120138. [Google Scholar] [CrossRef] [PubMed]
- Şahin, S.; Bilgin, M. Olive tree (Olea europaea L.) leaf as a waste by-product of table olive and olive oil industry: A review. J. Sci. Food Agric. 2018, 98, 1271–1279. [Google Scholar] [CrossRef] [PubMed]
- Huamán-Castilla, N.L.; Mamani-Pari, S.; Ramos Allcca, D.; Quispe Angulo, M.F.; Arroyo, G.; León-Calvo, N.C. Ultrasound-Assisted Extraction to Recover Antioxidant Compounds: A Comparative Analysis of Green Solvents for the Sustainable Valorization of Olive Leaves. Processes 2025, 13, 3856. [Google Scholar] [CrossRef]
- Martín-García, B.; De Montijo-Prieto, S.; Jiménez-Valera, M.; Carrasco-Pancorbo, A.; Ruiz-Bravo, A.; Verardo, V.; Gómez-Caravaca, A.M. Comparative extraction of phenolic compounds from olive leaves using a sonotrode and an ultrasonic bath and the evaluation of both antioxidant and antimicrobial activity. Antioxidants 2022, 11, 558. [Google Scholar] [CrossRef] [PubMed]
- Vardakas, A.; Kechagias, A.; Penov, N.; Giannakas, A.E. Optimization of Enzymatic Assisted Extraction of Bioactive Compounds from Olea europaea Leaves. Biomass 2024, 4, 647–657. [Google Scholar] [CrossRef]
- López-Linares, J.C.; Romero-García, J.M.; Romero, I.; Ruiz, E.; Castro, E. Development of a biorefinery from olive mill leaves: Comparison of different process configurations. Ind. Crops Prod. 2023, 200, 116813. [Google Scholar] [CrossRef]
- Lama-Muñoz, A.; Contreras, M.M.; Espínola, F.; Moya, M.; Romero, I.; Castro, E. Characterization of the lignocellulosic and sugars composition of different olive leaves cultivars. Food Chem. 2020, 329, 127153. [Google Scholar] [CrossRef] [PubMed]
- Altop, A.; Coskun, I.; Filik, G.; Kucukgul, A.; Bekiroglu, Y.G.; Cayan, H.; et al. Amino acid, mineral, condensed tannin, and other chemical contents of olive leaves (Olea europaea L.) processed via solid-state fermentation using selected Aspergillus niger strains. Cienc. Investig. Agrar. 2018, 45, 220–230. [Google Scholar] [CrossRef]
- Rubio-Senent, F.; Bermúdez-Oria, A.; Fernández-Prior, Á.; Lama-Muñoz, A.; Rodríguez-Gutiérrez, G.; Fernández-Bolaños, J. Phenolic composition and in vitro bioactivities of olive leaf infusions: Influence of cultivar and infusion temperature. Food Biosci. 2026, 109376. [Google Scholar] [CrossRef]
- Pompei, F.; Alessandroni, L.; Marconi, R.; Caprioli, G.; Sagratini, G.; Vittori, S.; Mannozzi, C. Polyphenol extraction from Lacrima di Morro d’Alba grape pomace and Ascolana Tenera olive leaves as an effective recovery of agricultural side-streams. Appl. Food Res. 2025, 5, 101084. [Google Scholar] [CrossRef]
- Sánchez-Monedero, A.; González-Miquel, M.; González, E.J. Ultrasound-Assisted Eutectic Solvent-Based Process Intensification for Sustainable Recovery of Oleuropein from Olive Leaves. Molecules 2025, 30, 3829. [Google Scholar] [CrossRef] [PubMed]
- Martinović, M.; Krgović, N.; Nešić, I.; Žugić, A.; Tadić, V.M. Conventional vs. Green Extraction Using Natural Deep Eutectic Solvents—Differences in the Composition of Soluble Unbound Phenolic Compounds and Antioxidant Activity. Antioxidants 2022, 11, 2295. [Google Scholar] [CrossRef] [PubMed]
- Marchetti, F.; Gugel, I.; Costa, S.; Baldisserotto, A.; Foletto, A.; Gugel, I.; Baldini, E.; Manfredini, S.; Vertuani, S. A Sustainable Approach to Valuable Polyphenol and Iridoid Antioxidants from Medicinal Plant By-Products. Antioxidants 2024, 13, 1014. [Google Scholar] [CrossRef] [PubMed]
- Rosa, G.S.; Vanga, S.K.; Gariépy, Y.; Raghavan, V. Comparison of microwave, ultrasonic and conventional techniques for extraction of bioactive compounds from olive leaves (Olea europaea L.). Innov. Food Sci. Emerg. Technol. 2019, 58, 102234. [Google Scholar] [CrossRef]
- Fiorito, S.; Collevecchio, C.; Genovese, S. Novel procedures for olive leaves extracts processing: Selective isolation of oleuropein and elenolic acid. Food Chem. 2024, 447, 139038. [Google Scholar] [CrossRef] [PubMed]
- Freitas, L.; Simões, R.; Miranda, I.; Peres, F.; Ferreira-Dias, S. Optimization of Autohydrolysis of Olive Pomaces to Obtain Bioactive Oligosaccharides: The Effect of Cultivar and Fruit Ripening. Catalysts 2022, 12, 788. [Google Scholar] [CrossRef]
- Cannavacciuolo, C.; Pagliari, S.; Frigerio, J.; Giustra, C.M.; Labra, M.; Campone, L. Natural Deep Eutectic Solvents (NADESs) Combined with Sustainable Extraction Techniques: A Review of the Green Chemistry Approach in Food Analysis. Foods 2023, 12, 56. [Google Scholar] [CrossRef] [PubMed]
- Mir-Cerdà, A.; Granados, M.; Saurina, J.; Sentellas, S. Green Extraction of Antioxidant Compounds from Olive Tree Leaves Based on Natural Deep Eutectic Solvents. Antioxidants 2023, 12, 995. [Google Scholar] [CrossRef] [PubMed]
- Zurob, E.; Cabezas, R.; Villarroel, E.; Rosas, N.; Merlet, G.; Quijada-Maldonado, E.; Romero, J.; Plaza, A. Design of natural deep eutectic solvents for the ultrasound-assisted extraction of hydroxytyrosol from olive leaves supported by COSMO-RS. Sep. Purif. Technol. 2020, 248, 117054. [Google Scholar] [CrossRef]
- Ünlü, A.E. Green and non-conventional extraction of bioactive compounds from olive leaves: Screening of novel natural deep eutectic solvents and investigation of process parameters. Waste Biomass Valorization 2021, 12, 5329–5346. [Google Scholar] [CrossRef] [PubMed]
- Siamandoura, P.; Tzia, C. Comparative Study of Novel Methods for Olive Leaf Phenolic Compound Extraction Using NADES as Solvents. Molecules 2023, 28, 353. [Google Scholar] [CrossRef] [PubMed]
- Contreras, M.d.M.; Lama-Muñoz, A.; Espínola, F.; Moya, M.; Romero, I.; Castro, E. Valorization of olive mill leaves through ultrasound-assisted extraction. Food Chem. 2020, 314, 126218. [Google Scholar] [CrossRef] [PubMed]
- Ramírez, E.M.; Brenes, M.; Romero, C.; Medina, E. Chemical and enzymatic characterization of leaves from Spanish table olive cultivars. Foods 2022, 11, 3879. [Google Scholar] [CrossRef] [PubMed]
- Bilalov, E.; Dias, R.C.S. Separation of the hydrolysis products of oleuropein in olive leaf using tailored adsorbents with pyridyl- and 2-(dimethylamino)ethyl-functional groups. Next Chem. Eng. 2026, 3, 100078. [Google Scholar] [CrossRef]
- García-Molina, G.; Peters, E.; Palmeri, R.; Awoke, Y.; Márquez-Álvarez, C.; Blanco, R.M. Enzymatic synthesis of hydroxytyrosol from oleuropein for valorization of an agricultural waste. Bioengineered 2024, 15, 2396647. [Google Scholar] [CrossRef] [PubMed]
- Liu, M.; Yong, Q.; Yu, S. Efficient bioconversion of oleuropein from olive leaf extract to antioxidant hydroxytyrosol by enzymatic hydrolysis and high-temperature degradation. Biotechnol. Appl. Biochem. 2018, 65, 680–689. [Google Scholar] [CrossRef] [PubMed]
- Yuan, J.J.; Tu, J.L.; Qin, F.G.F.; et al. Phenolic composition of oleuropein extract after enzymatic process by HPLC-MS and their antioxidant and antibacterial activities. J. Food Biochem. 2018, 42, e12517. [Google Scholar] [CrossRef]
- Tobiszewski, M.; Namieśnik, J. Greener organic solvents in analytical chemistry. Curr. Opin. Green Sustain. Chem. 2017, 5, 1–4. [Google Scholar] [CrossRef]
- AOAC International. Official Methods of Analysis of AOAC International. In Method 930.15, Loss on Drying (Moisture) for Feeds (at 135 °C for 2 Hours)., 18th ed.; Horwitz, W., Latimer, G.W., Jr., Eds.; AOAC International: Gaithersburg, MD, USA, 2005. [Google Scholar]
- AOAC International. Official Methods of Analysis of AOAC International, Method 920.39, Fat (Crude) or Ether Extract in Animal Feed, 18th ed.; Horwitz, W., Latimer, G.W., Jr., Eds.; AOAC International: Gaithersburg, MD, USA, 2005. [Google Scholar]
- AOAC International. Official Methods of Analysis of AOAC International, 16th ed.; Cunniff, P., Ed.; AOAC International: Arlington, VA, USA, 1995. [Google Scholar]
- AOAC International. Official Methods of Analysis of AOAC International, Method 962.09, Fiber (Crude) in Animal Feed and Pet Food, 18th ed.; Horwitz, W., Latimer, G.W., Jr., Eds.; AOAC International: Gaithersburg, MD, USA, 2005. [Google Scholar]
- Kracher, D.; Oros, D.; Yao, W.; Preims, M.; Rezić, I.; Haltrich, D.; Rezić, T.; Ludwig, R. Fungal secretomes enhance sugar beet pulp hydrolysis. Biotechnol. J. 2014, 9, 483–492. [Google Scholar] [CrossRef] [PubMed]
- DuBois, M.; Gilles, K.A.; Hamilton, J.K.; Rebers, P.A.; Smith, F. Colorimetric Method for Determination of Sugars and Related Substances. Anal. Chem. 1956, 28, 350–356. [Google Scholar] [CrossRef]
- Singleton, V.L.; Rossi, J.A., Jr. Colorimetry of Total Phenolics with Phosphomolybdic–Phosphotungstic Acid Reagents. Am. J. Enol. Vitic. 1965, 16, 144–158. [Google Scholar] [CrossRef]
- R Core Team. R: A Language and Environment for Statistical Computing; R Foundation for Statistical Computing: Vienna, Austria, 2026; Available online: https://www.R-project.org/ (accessed on 12 October 2026).
- Andrejč, C.D.; Butinar, B.; Knez, Ž.; Tomažič, K.; Knez Marevci, M. The Effect of Drying Methods and Extraction Techniques on Oleuropein Content in Olive Leaves. Plants 2022, 11, 865. [Google Scholar] [CrossRef] [PubMed]
- Melo Ferreira, D.; de Oliveira, N.M.; Chéu, M.H.; Meireles, D.; Lopes, L.; Oliveira, M.B.; et al. Updated Organic Composition and Potential Therapeutic Properties of Different Varieties of Olive Leaves from Olea europaea. Plants 2023, 12, 688. [Google Scholar] [CrossRef] [PubMed]
- Ribas, J.C.R.; Lazzari, A.; Gonzalez, L.B.F.; Silva, C.M.; Adamuchio, L.G.; Cuquel, F.L.; et al. Bioactive compounds and antioxidant activity of olive leaves grown in Paraná, Brazil. Pesqui. Agropecu. Bras. 2023, 58, e03025. [Google Scholar] [CrossRef]
- Gomez-Cabrera, A.; Garrido, A.; Guerrero, J.E.; Ortiz, V. Nutritive value of the olive leaf: Effects of cultivar, season of harvesting and system of drying. J. Agric. Sci. 1992, 119, 205–210. [Google Scholar] [CrossRef]
- Ibrahim, E.H.; Abdelgaleel, M.A.; Salama, A.A.; Metwalli, S.M. Chemical and nutritional evaluation of olive leaves and selection the optimum conditions for extraction their phenolic compounds. J. Agric. Res. 2016, 42, 445–459. [Google Scholar] [CrossRef]
- Wang, B.; Qu, J.; Feng, S.; Chen, T.; Yuan, M.; Huang, Y.; et al. Seasonal Variations in the Chemical Composition of Liangshan Olive Leaves and Their Antioxidant and Anticancer Activities. Foods 2019, 8, 657. [Google Scholar] [CrossRef] [PubMed]
- Romero-García, J.M.; Lama-Muñoz, A.; Rodríguez-Gutiérrez, G.; Moya, M.; Ruiz, E.; Fernández-Bolaños, J.; Castro, E. Obtaining sugars and natural antioxidants from olive leaves by steam-explosion. Food Chem. 2016, 210, 457–465. [Google Scholar] [CrossRef] [PubMed]
- Gugel, I.; Marchetti, F.; Costa, S.; Gugel, I.; Baldini, E.; Vertuani, S.; Manfredini, S. 2G-lactic acid from olive oil supply chain waste: Olive leaves upcycling via Lactobacillus casei fermentation. Appl. Microbiol. Biotechnol. 2024, 108, 379. [Google Scholar] [CrossRef] [PubMed]
- Karami, F.; Ghorbani, M.; Sadeghi Mahoonak, A.; Pourhossein, A.; Bagheri, A.; Khodarahmi, R. Increasing antioxidant activity in food waste extracts by β-glucosidase. Food Technol. Biotechnol. 2022, 60, 458–468. [Google Scholar] [CrossRef] [PubMed]
Figure 1.
Moisture, total ash, crude fiber, and crude fat contents of olive leaves. Error bars represent standard deviations.
Figure 1.
Moisture, total ash, crude fiber, and crude fat contents of olive leaves. Error bars represent standard deviations.
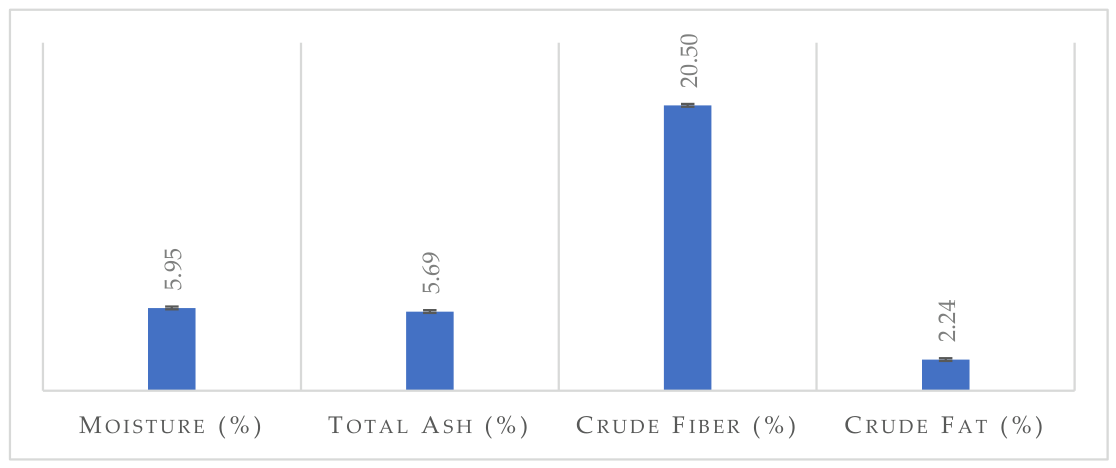
Figure 2.
Effect of medium and extraction time on total sugar content. Values are presented as mean ± standard deviation (SD; n = 2). Different letters indicate significant differences among treatments according to Tukey’s HSD test (p < 0.05).
Figure 2.
Effect of medium and extraction time on total sugar content. Values are presented as mean ± standard deviation (SD; n = 2). Different letters indicate significant differences among treatments according to Tukey’s HSD test (p < 0.05).
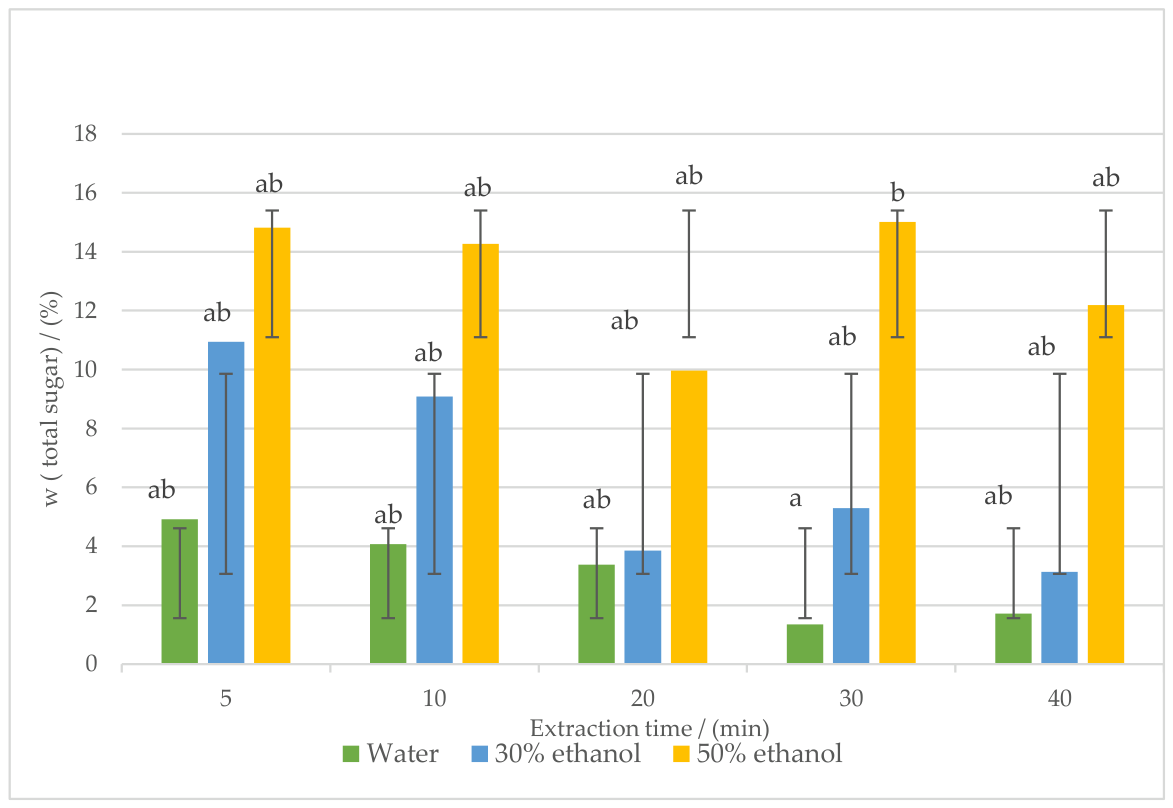
Figure 3.
Effect of medium and extraction time on total phenolic content. Values are presented as mean ± standard deviation (SD; n = 2). Different letters indicate significant differences among treatments according to Tukey’s HSD test (p < 0.05).
Figure 3.
Effect of medium and extraction time on total phenolic content. Values are presented as mean ± standard deviation (SD; n = 2). Different letters indicate significant differences among treatments according to Tukey’s HSD test (p < 0.05).
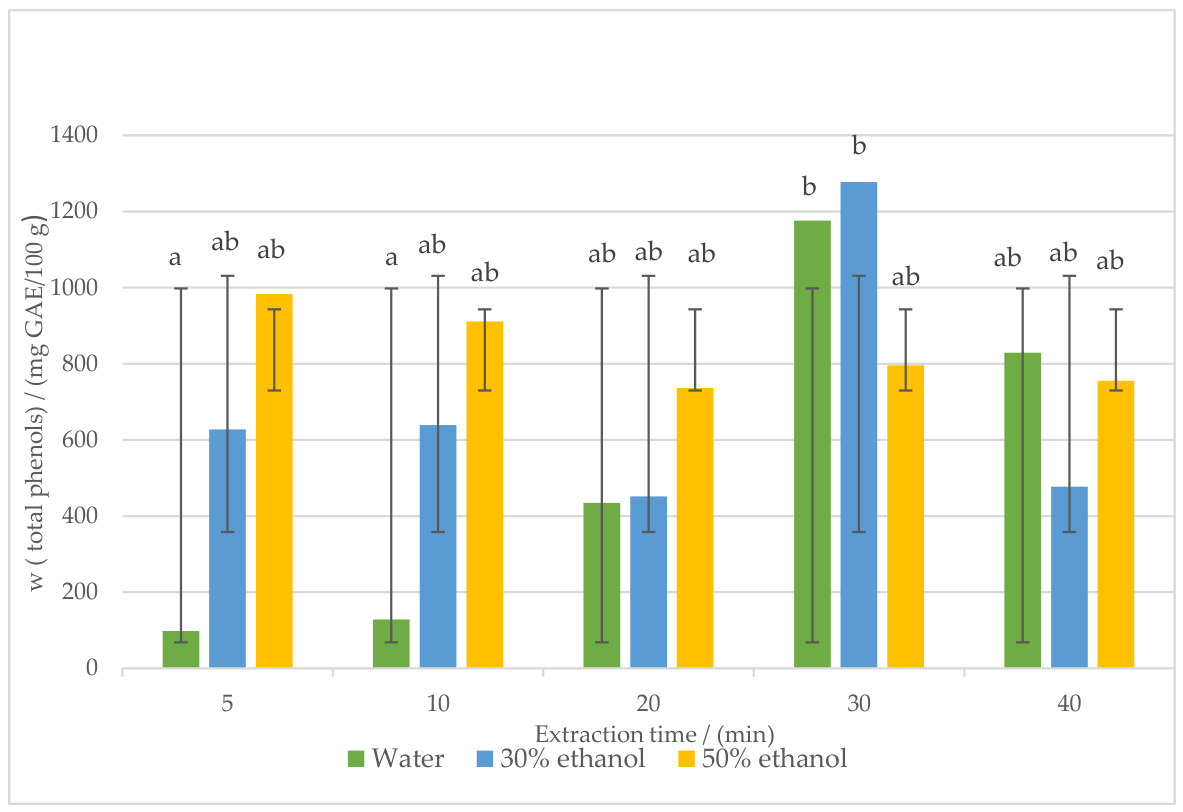
Figure 4.
Effect of medium and cellulase concentration on total sugar content. Values are presented as mean ± standard deviation (SD; n = 2). Different letters indicate significant differences among treatments according to Tukey’s HSD test (p < 0.05).
Figure 4.
Effect of medium and cellulase concentration on total sugar content. Values are presented as mean ± standard deviation (SD; n = 2). Different letters indicate significant differences among treatments according to Tukey’s HSD test (p < 0.05).
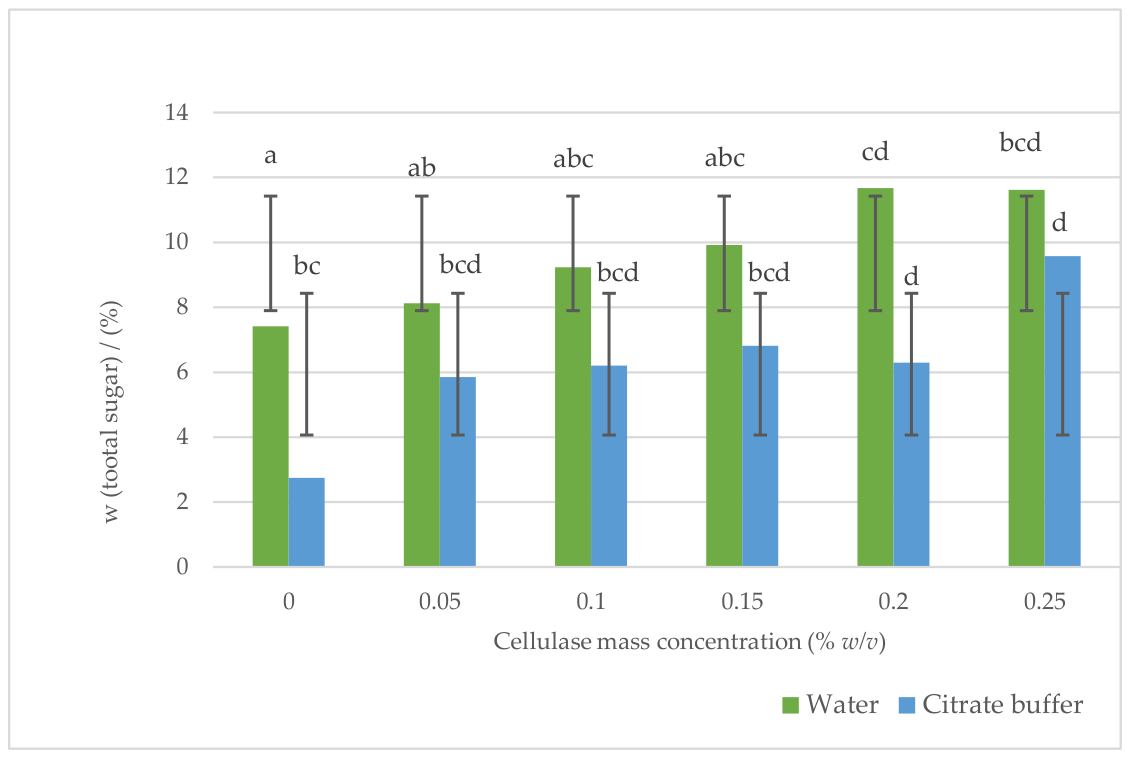
Figure 5.
Effect of medium and cellulase concentration on total phenolic content. Values are presented as mean ± standard deviation (SD; n = 2). Different letters indicate significant differences among treatments according to Tukey’s HSD test (p < 0.05).
Figure 5.
Effect of medium and cellulase concentration on total phenolic content. Values are presented as mean ± standard deviation (SD; n = 2). Different letters indicate significant differences among treatments according to Tukey’s HSD test (p < 0.05).
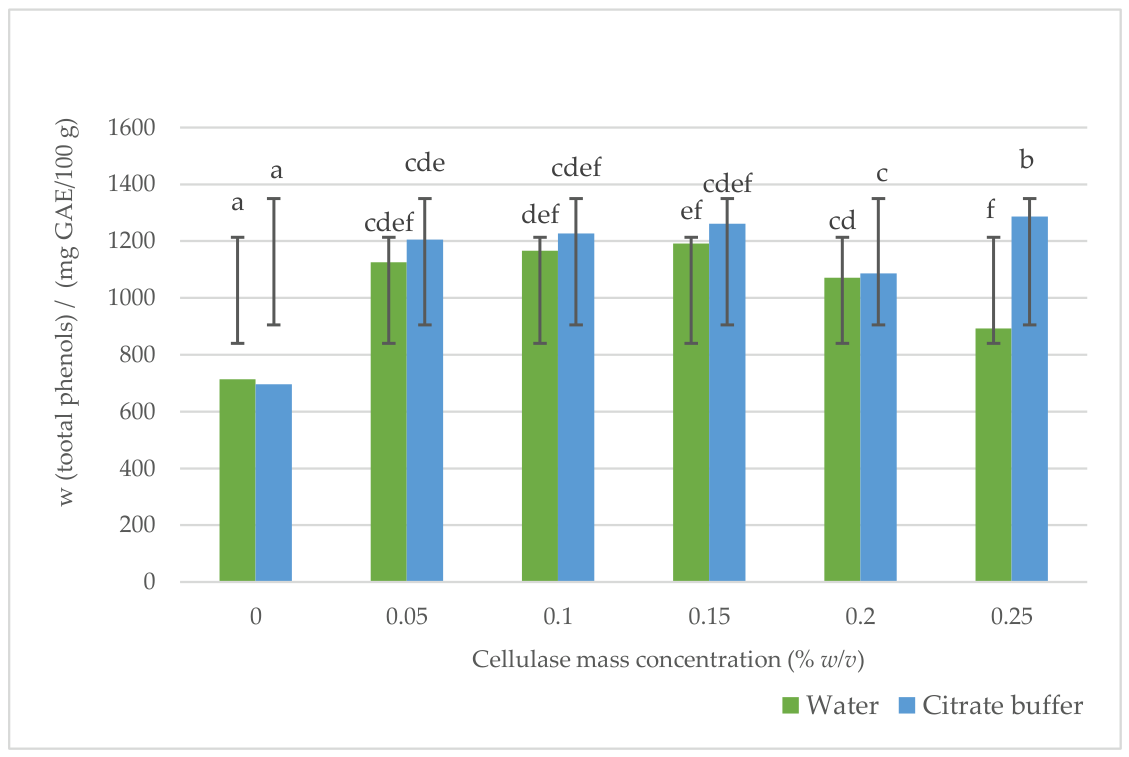
Figure 6.
Heatmaps showing the effects of extraction parameters on the total sugar content (%) of olive leaf extracts obtained by (a) ultrasound-assisted extraction (UAE) using different solvents and extraction times and (b) enzyme-assisted extraction (EAE) using different extraction media and cellulase concentrations. Color intensity represents the mean total sugar content.
Figure 6.
Heatmaps showing the effects of extraction parameters on the total sugar content (%) of olive leaf extracts obtained by (a) ultrasound-assisted extraction (UAE) using different solvents and extraction times and (b) enzyme-assisted extraction (EAE) using different extraction media and cellulase concentrations. Color intensity represents the mean total sugar content.
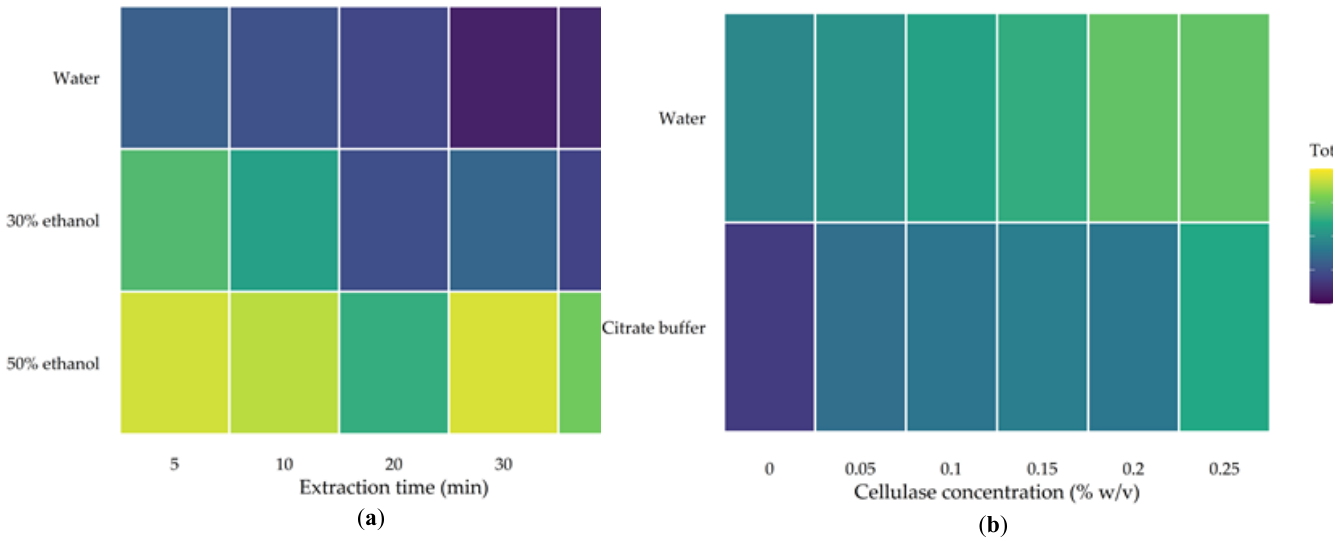
Figure 7.
Heatmaps showing the effects of extraction parameters on the total phenolic content (mg GAE/100 g) of olive leaf extracts obtained by (a) ultrasound-assisted extraction (UAE) using different solvents and extraction times and (b) enzyme-assisted extraction (EAE) using different extraction media and cellulase concentrations. Color intensity represents the mean total phenolic content.
Figure 7.
Heatmaps showing the effects of extraction parameters on the total phenolic content (mg GAE/100 g) of olive leaf extracts obtained by (a) ultrasound-assisted extraction (UAE) using different solvents and extraction times and (b) enzyme-assisted extraction (EAE) using different extraction media and cellulase concentrations. Color intensity represents the mean total phenolic content.
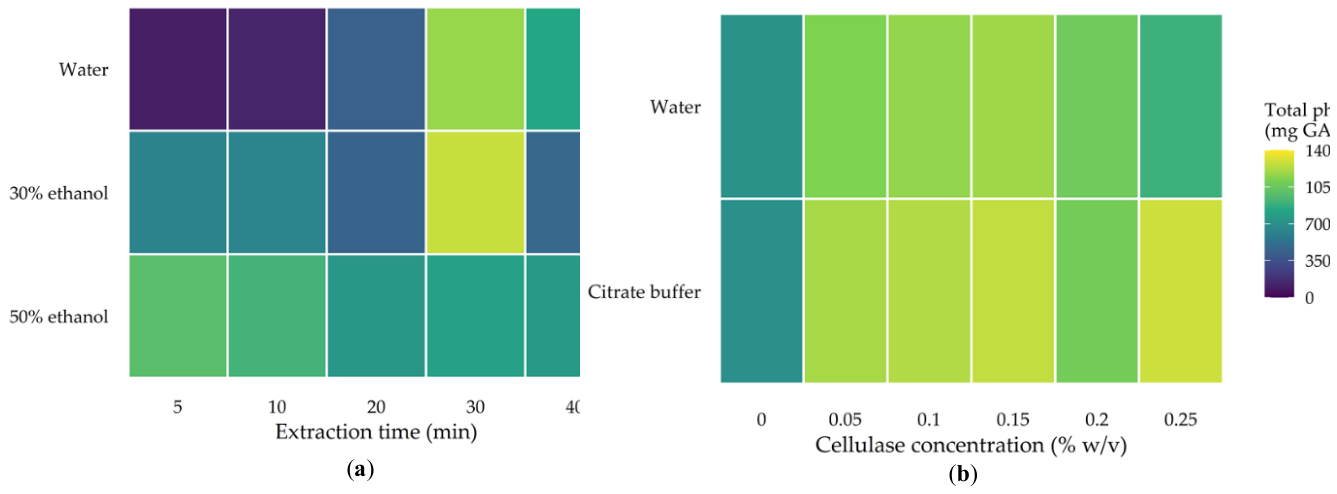

Table 1.
Cellulase activity in purified water and citrate buffer (pH 5) at two enzyme concentrations.
Table 1.
Cellulase activity in purified water and citrate buffer (pH 5) at two enzyme concentrations.
| Enzyme activity (U/mL) | ||
| Cellulase mass concentration (%, w/v) | Water | Citrate buffer |
| 0.05 | 5.220 | 6.247 |
| 0.25 | 8.303 | 14.776 |
Disclaimer/Publisher’s Note: The statements, opinions and data contained in all publications are solely those of the individual author(s) and contributor(s) and not of MDPI and/or the editor(s). MDPI and/or the editor(s) disclaim responsibility for any injury to people or property resulting from any ideas, methods, instructions or products referred to in the content. |
© 2026 by the authors. Licensee MDPI, Basel, Switzerland. This article is an open access article distributed under the terms and conditions of the Creative Commons Attribution (CC BY) license (http://creativecommons.org/licenses/by/4.0/).
Copyright: This open access article is published under a Creative Commons CC BY 4.0 license, which permit the free download, distribution, and reuse, provided that the author and preprint are cited in any reuse.