

Submitted:
02 November 2026
Posted:
05 November 2026
You are already at the latest version
Abstract
Salinity limits olive establishment and productivity, requiring strategies to improve acclimatisation. We evaluated treatments with five plant growth regulators (PGRs): gibberellic acid (GA3), indole-3-acetic acid (IAA), salicylic acid (SA), kinetin (KIN) and spermidine (SPD), in one-year-old ‘Picual’ plants exposed to 0, 100 and 200 mM NaCl. Salinity reduced above-ground growth, water status, pigment levels and photosynthesis, favouring biomass allocation to roots. At 100 mM NaCl, SA provided the greatest photosynthetic protection: it maintained net CO2 assimilation (A) and increased total plant dry weight (TPDW) and pigment content compared with plants without growth regulators at the same salinity. At 200 mM NaCl, IAA increased TPDW whilst maintaining leaf growth, A, and water- and nitrogen-use efficiencies. These benefits coincided with higher ascorbate peroxidase activity, higher proline concentrations and high phenolic contents, and lower ethylene production. GA3 preserved pigments and photosynthetic activity, KIN promoted leaf growth, and SPD increased root biomass. Descriptive estimates of the NaCl concentration corresponding to 50 % of reference A (C50) were higher with PGRs; neither reference threshold was reached with IAA or GA3 within 0–200 mM NaCl. Overall, the treatments promoted complementary responses, with SA standing out under moderate salinity and IAA under severe salinity.
Keywords:
Olea europaea
; plant growth regulators
; salt stress
; photosynthetic performance
; water-use efficiency
; antioxidant response
; osmotic adjustment
; ethylene
1. Introduction
Soil salinisation is one of the main constraints on agricultural production and poses a growing threat to the sustainability of cropping systems [1,2]. In arid and semi-arid regions, high evaporation rates, low rainfall and insufficient soil leaching favour the accumulation of salts in the root zone [1]. This process can be exacerbated by reduced availability of good-quality water and by the use of saline or reclaimed water resources for irrigation [2,3]. From the plant’s perspective, salinity initially reduces water availability and, when exposure is prolonged, can lead to the accumulation of potentially toxic ions, metabolic disturbances and a decline in growth and productivity [4]. This problem is particularly significant in the Mediterranean basin, where climate change, water scarcity and the expansion of irrigation are increasing the risk of salinisation of soils and water sources used in agriculture [1].
Salinity tolerance is a complex trait that depends on the coordinated action of various mechanisms. Broadly speaking, three main components are recognised: tolerance to osmotic stress, ion exclusion and tissue tolerance [4]. Tolerance to osmotic stress enables growth and gas exchange to be maintained, to varying degrees, when the water potential of the environment decreases; ion exclusion limits the transport of Na⁺ and Cl⁻ to photosynthetic organs and helps to maintain nutritional balance; and tissue tolerance enables cellular activity to be maintained despite the accumulation of salts in the tissues, through compartmentalisation and the protection of metabolism [4,5]. The relative contribution of these components varies between species and genotypes and depends on salt concentration, the duration of exposure and the plant’s stage of development [4]. The olive tree is considered to be moderately tolerant to salinity, although the degree of tolerance varies widely between cultivars and depends on the conditions of exposure [6,7]. These differences between cultivars have been linked primarily to the ability to restrict ion transport to the aerial parts [7,8]. Hydric, osmotic, metabolic and antioxidant adjustments also play a role [6,9,10,11].
In response to the osmotic component of salinity, plants can accumulate compatible solutes that lower the cellular osmotic potential and help maintain hydration and turgor [12]. Among these, proline is a multifunctional amino acid which, in addition to contributing to osmotic regulation, plays a role in the stabilisation of proteins and membranes and in maintaining redox balance during stress [13]. Salinity can also alter the profile of free amino acids; changes in this profile reflect a reorganisation of carbon and nitrogen metabolism and may contribute to the supply of protective compounds and metabolic intermediates [6,14]. In the olive tree, the accumulation of proline and other solutes has been linked to water relations, photosynthetic activity and the antioxidant response, although the extent of this depends on the cultivar and the stress conditions [15,16,17,18]. However, the accumulation of proline should not be interpreted on its own as evidence of greater tolerance, as it may also serve as an indicator of the intensity of the stress experienced by the plant [7].
Salinity can also alter the redox balance of plant cells as a result of its osmotic and ionic components. During the osmotic phase, reduced water uptake and stomatal closure limit the availability of CO2. When the energy absorbed exceeds the capacity for photosynthetic utilisation, over-reduction of the electron transport chain may occur, leading to increased formation of reactive oxygen species (ROS) [4,19]. With prolonged exposure, the accumulation of Na+ and Cl⁻ in tissues can disrupt ionic homeostasis, affect metabolism and damage components of the photosynthetic apparatus, thereby intensifying oxidative imbalance [4,6,14]. Although ROS also perform signalling functions, their excessive accumulation can oxidise membrane lipids, proteins and nucleic acids and contribute to the loss of pigments and photosynthetic activity observed under salinity [20]. To limit these effects, plants possess an enzymatic antioxidant system in which different enzymes act in a coordinated manner. Ascorbate peroxidase (APX) removes H2O2 using ascorbate as an electron donor, whilst glutathione reductase (GR) regenerates reduced glutathione and contributes to the functioning of the ascorbate–glutathione cycle and the maintenance of the cellular redox state. Guaiacol peroxidase (GPX) also participates in the removal of H2O2, as well as being involved in processes related to the protection and modification of cell walls [21]. In the olive tree, salinity can elicit different responses from APX, GR and other antioxidant enzymes depending on the cultivar, salt concentration and duration of treatment [17,18,19,22]. Consequently, an increase in enzymatic activity may represent the activation of a defence mechanism, but it may also be a compensatory response to higher levels of oxidative stress; therefore, it should not be interpreted in isolation as evidence of greater tolerance.
Antioxidant defence also comprises non-enzymatic components. Carotenoids play a role in photoprotection by dissipating excess energy and deactivating excited species, thereby helping to protect pigments and photosynthetic membranes from photooxidation [23]. Phenolic compounds and flavonoids may play a role in neutralising ROS and maintaining redox balance, although their accumulation under salinity varies between species, cultivars and experimental conditions [24,25]. However, the total amount of phenols or flavonoids does not, on its own, indicate the antioxidant capacity of the compounds present. Therefore, determining these alongside antiradical capacity provides complementary information on the non-enzymatic antioxidant response. In addition to these protective mechanisms, ethylene acts as a signalling molecule in the plant’s response to stress. Its production can be altered under salinity and play a role in regulating growth, senescence and other defence responses, although its effects depend on the species, the intensity of the stress and the physiological context [26,27].
Plant responses to salinity are regulated by a complex signalling network in which phytohormones and other growth regulators play a central role. Saline stress can alter both their endogenous levels and the associated signalling pathways, affecting processes related to growth, water balance, photosynthesis and antioxidant defence. In this context, the exogenous application of plant growth regulators (PGRs) has been proposed as a strategy to mitigate the negative effects of salinity and promote plant acclimatisation to stress [27,28,29,30]. However, their efficacy depends on the type and concentration of the regulator, the plant species, and the intensity and duration of the stress [29,30]. There has not yet been a sufficiently comprehensive characterisation, from a comparative and integrated perspective, of how regulators belonging to different groups modify the olive tree’s response to salinity. Consequently, the aim of this study was to comparatively evaluate the effects of gibberellic acid (GA3), indole-3-acetic acid (IAA), salicylic acid (SA), kinetin (KIN) and spermidine (SPD) on the response of one-year-old olive plants subjected to different NaCl concentrations. To this end, indicators of growth, water relations, gas exchange, photosynthetic pigments, and metabolic and antioxidant responses were analysed. The hypothesis was that PGRs would differentially modify the olive tree’s response to salinity and that the magnitude of their effects would depend on the intensity of the salt stress. This integrated approach allows the characterisation of the responses associated with each regulator and an assessment of their potential usefulness in promoting the olive tree’s acclimatisation to saline conditions.
2. Materials and Methods
2.1. Plant Material, Growing Conditions and Treatments
One-year-old plants of Olea europaea L. cv. ‘Picual’ were used, supplied by Viveros Jarico S.L. (Almería, Spain). Healthy plants of uniform size were selected, and their roots were carefully washed to remove any remnants of the original growing medium. The plants were transplanted into 1-litre pots containing a mixture of sand and perlite (1:3, v/v) and pruned to a height of 60 cm, retaining a single stem per plant. They were then kept in a growth chamber with a photoperiod of 16/8 h (light/dark), temperatures of 25/20 °C and relative humidity levels of 55/75 % during the light and dark periods, respectively. The photosynthetic photon flux density (PPFD; 400–700 nm) was 500 µmol m-2 s-1, provided by Sylvania Cool White and Osram Dulux Superstar lamps (Osram Sylvania Inc., Danvers, MA, USA). The pots were randomly distributed within the chamber and their positions were changed periodically. During the four-week acclimatisation period, the plants were watered three times a week with a 50 % Hoagland nutrient solution [31], using a sufficient volume to allow drainage from the bottom of the pots.
Once acclimatisation was complete, the 108 plants were randomly assigned to six treatments of 18 individuals each: one treatment without a plant growth regulator (−PGR) and five treatments with gibberellic acid (GA3), indole-3-acetic acid (IAA), salicylic acid (SA), kinetin (KIN) or spermidine (SPD). The concentrations used were 1 µM for GA3, IAA and KIN [27,32] and 0.5 mM for SA and SPD [33,34]. All PGRs were prepared in distilled water containing 1 % Tween 20 and applied by foliar spraying at a rate of 25 mL per plant, twice a week for three consecutive weeks. The −PGR plants received the same volume of distilled water containing 1 % Tween 20. Once the three weeks of PGR application had been completed, the 18 plants in each treatment were randomly allocated across three salinity levels: 0, 100 and 200 mM NaCl, with six plants per level. To avoid a sudden change in the osmotic potential of the medium, the NaCl concentration in the 50 % Hoagland solution was increased daily by 25 mM until the assigned level was reached. Harvesting took place four weeks after the start of NaCl application. The experiment followed a completely randomised factorial design, with the PGR treatment — six levels, including −PGR — and salinity — three NaCl concentrations — as factors, and six independent plants per combination.
2.2. Growth and Leaf Water Relations
At the end of the experiment, one mature leaf was selected from each of three independent plants per experimental combination to determine leaf water relations. The leaves were weighed immediately to obtain their fresh weight (FW) and were kept in test tubes containing 15 mL of distilled water for 24 hours, at 25 °C and in the dark. After carefully removing surface water with absorbent paper, the turgid weight (TW) was determined. Finally, the leaves were dried in a forced-air oven at 65 °C for 72 h to obtain the dry weight (DW). The relative water content (RWC) was calculated using the formula RWC (%) = [(FW − DW) / (TW − DW)] × 100 [35]. Water uptake capacity (WUC) was calculated using the formula WUC (g H₂O g⁻¹ DW) = (TW − FW) / DW [36,37].
Once these measurements had been taken, the plants were carefully removed from their pots and the roots were washed with water to remove any remaining growing medium, and subsequently with distilled water. Excess water was removed using absorbent paper. The total shoot length (TSL) was determined as the sum of the lengths of all shoots developed by each plant. The plants were then separated into leaves, stems and roots. Total leaf area (TLA) was determined by individually measuring all the leaves of each plant using a LI-3000C portable leaf area meter (LI-COR Biosciences, Lincoln, NE, USA) and was expressed in cm² plant⁻¹. Each fraction was then dried in a forced-air oven at 65 °C for 72 h. Leaf dry mass (LDM), stem dry weight (SDW) and root dry weight (RDW) were determined. Total plant dry weight (TPDW) was calculated as the sum of LDM, SDW and RDW. The root-to-shoot ratio (R/S) was calculated using the formula R/S = RDW / (LDM + SDW).
2.3. Elemental Analysis of Carbon and Nitrogen
The total carbon (C) and nitrogen (N) content was determined in dried and finely homogenised leaf and root samples by total combustion, using a TruSpec Micro Elemental Analyser (LECO, St Joseph, MI, USA). For each determination, approximately 1–5 mg of dry tissue was weighed on a precision microbalance and encapsulated before being introduced into the analyser. The samples underwent instantaneous combustion in the presence of oxygen, and the gases generated were carried by helium through the analytical system. Carbon was quantified as CO₂ by infrared absorption detection, whilst nitrogen was determined using a differential thermal conductivity detector. The equipment was calibrated using certified standards of known concentration. Prior to sample analysis, blanks were run until the signal stabilised, and during the analytical run, certified standards were periodically included to check the stability of the equipment and the quality of the determinations. The results were expressed as a percentage of dry weight (% DW).
2.4. Pigments and Photosynthetic Activity
The photosynthetic response was assessed by determining photosynthetic pigments and leaf gas exchange. Photosynthetic pigments were extracted using 80 % acetone and determined spectrophotometrically following procedures previously applied to olive trees [27], with some modifications. The leaf tissue was homogenised with 80 % (v/v) acetone at a ratio of 1:2 (w/v) and centrifuged at 2000 × g for 10 min at 4 °C. Absorbances were measured at 470, 646.8 and 663.2 nm using a Lambda 19 UV-Vis spectrophotometer (PerkinElmer). The concentrations of chlorophyll a (Chl a), chlorophyll b (Chl b) and carotenoids (Car) were calculated using the equations of Wellburn [38]:
Chl a = 12.21 A663.2 − 2.79 A646.8
Chl b = 21.5 A646.8 − 5.1 A663.2
Car = (1000 A470 − 3.27 Chl a − 104 Chl b)/198
The results were expressed in mg g⁻¹ DW. Four independent samples were analysed per experimental combination.
Foliar gas exchange was determined on fully expanded young leaves using a LI-6400 portable photosynthesis system (LI-COR Inc., Lincoln, NE, USA), following the procedure described by Boussadia et al. [9]. The net CO2 assimilation rate (A), stomatal conductance (gs), intercellular CO2 concentration (Ci) and transpiration rate (E) were recorded for three independent plants per experimental combination. The apparent carboxylation efficiency (A/Cᵢ), water use efficiency (WUE), intrinsic water use efficiency (WUEᵢ) and photosynthetic nitrogen use efficiency (PNUE) were calculated as A/Ci, A/E, A/gs and A/foliar N concentration, respectively.
2.5. Free Amino Acids, Proline and Ethylene Production
Total free amino acids (TFAA) were extracted from leaf tissue using 95 % ethanol at a ratio of 1:10 (w/v) and quantified colorimetrically by the ninhydrin reaction at 570 nm, using glycine as a standard [39]. The results were expressed in mg AA g-1 DW.
Proline (Pro) was extracted with 3 % sulphosalicylic acid at a ratio of 1:10 (w/v) and determined by the ninhydrin reaction following Bates et al. [40] and Farias et al. [39]. Absorbance was measured at 520 nm and the concentration was calculated using a proline standard curve. The results were expressed in µmol proline g⁻¹ DW. Both TFAA and Pro were determined in four independent samples per experimental combination.
Ethylene (C2H4) production was determined by gas chromatography, following previously described procedures [27,41]. A 0.25 g sample of fresh leaves was placed in 5 mL vials, which were sealed and incubated for 1 h at 30 °C in the dark. Subsequently, 1 mL of the headspace was injected into an HP 5890 Series II gas chromatograph (Hewlett-Packard, Palo Alto, CA, USA) fitted with a flame ionisation detector and a Porapak-R column. Ethylene was identified by comparison with a C₂H₄ standard, and the results were expressed as nL C₂H₄ g⁻¹ FW h⁻¹. Three independent samples were analysed per experimental combination.
2.6. Enzymatic and Non-Enzymatic Antioxidant System
The leaf antioxidant system was characterised by determining enzymatic activities, phenolic compounds and radical scavenging capacity. Enzymes were extracted using the method described by Agarwal et al. [42], with some modifications. The leaf tissue was homogenised in 100 mM potassium phosphate buffer (pH 7.0), containing 1 mM Na2EDTA, 5 mM ascorbic acid and 1 % polyvinylpyrrolidone (PVP), at a ratio of 1:10 (w/v).
Ascorbate peroxidase (APX) activity and guaiacol peroxidase (GPX) activity were determined according to Boussadia et al. [9], with some modifications, by recording, respectively, the decrease in absorbance at 290 nm due to the oxidation of ascorbate and the increase in absorbance at 470 nm associated with the formation of tetraguaiacol. Glutathione reductase (GR) activity was determined according to Anee et al. [43], with some modifications, by measuring the decrease in absorbance at 340 nm associated with the oxidation of NADPH. The activities were calculated using molar extinction coefficients of 2.8, 6.22 and 26.6 mM-1 cm-1 for APX, GR and GPX, respectively, and were expressed in µmol min⁻¹ g⁻¹ FW. Four independent samples were analysed per experimental combination.
The total phenolic content (TPC) was determined in the acetone extracts used for pigment quantification using the Folin–Ciocalteu method, whilst the total flavonoid content (TFC) was determined in 80 % (v/v) methanolic extracts using the aluminium chloride colorimetric method, following Kiani et al. [44], with some modifications. Absorbances were measured at 720 and 510 nm for TPC and TFC, respectively, using pyrogallol and catechin to prepare the corresponding standard curves. The results were expressed in mg g⁻¹ DW. Four independent samples were analysed per experimental combination.
The antioxidant capacity of the methanolic leaf extracts was assessed using the ABTS+ and DPPH radical neutralisation assays, following the methods of Pungin et al. [45] (and Kiani et al. [44], respectively, with some modifications. For the ABTS assay, the extracts, prepared at concentrations ranging from 50 to 700 µg mL-1, were mixed with an ABTS+ solution and the absorbance was measured at 745 nm. For the DPPH assay, 2 mL of extract (10–50 µg mL-1) was mixed with 0.5 mL of 0.2 mM DPPH prepared in methanol. After 30 minutes of incubation in the dark, the absorbance was measured at 517 nm. Antioxidant capacity was expressed as the concentration required to neutralise 50 % of the radical (IC₅₀, µg mL-1). Six independent samples were analysed per experimental combination.
2.7. Statistical Analysis
One-way analyses of variance (ANOVA) were carried out to assess the effect of growth regulators within each salinity level and the effect of salinity within each PGR treatment. Furthermore, a two-factor ANOVA was applied to determine the effects of treatment with growth regulators (R), salinity (S) and their interaction (R × S). Means were compared using Tukey’s test (p < 0.05), and the magnitude of the effects of R, S and R × S was estimated using omega-squared (ω2).
Pearson’s correlations were calculated from the means corresponding to the 18 experimental combinations. P-values were adjusted using the Benjamini–Hochberg procedure [46]. Principal component analysis (PCA) and hierarchical clustering were performed using the standardised means of the 18 experimental combinations. The ANOVAs and PCA were carried out using Statgraphics Centurion XIX (version 19), utilising the University of Jaén’s institutional licence; the correlations and hierarchical clustering were carried out using Python 3.12.13.
3. Results
3.1. Effects of Growth-Regulator Treatments and Salinity on Plant Growth and Leaf Water Relations
The two-factor ANOVA showed that salinity significantly affected all growth parameters, whilst treatment with plant growth regulators (PGRs) affected stem dry weight (SDW), root dry weight (RDW), total plant dry weight (TPDW), the root-to-shoot ratio (R/S), total leaf area (TLA) and total shoot length (TSL) (Table S2). The interaction between PGR treatment and salinity (R × S) was significant for LDM, RDW, TPDW, R/S, TLA and TSL, indicating that the effect of PGR treatments on these variables varied with the salinity level. Effect sizes showed that salinity was the main factor explaining the variation in most growth parameters, particularly LDM, TLA and TSL, whilst for RDW the effects of salinity and PGR treatment were of similar magnitude, and for TPDW, PGR treatment was the main explanatory factor (Table S1).
In plants not treated with PGR (−PGR), increasing the NaCl concentration from 0 to 200 mM reduced LDM by 31.3 %, TLA by 40.4 % and TSL by 55.4 %, whilst RDW increased by 54.9 % and R/S by 66.7 % (p < 0.05) (Figure 1; Table 1; Table S3). At 100 mM NaCl, the IAA, SA and SPD treatments increased RDW by 44.6 %, 57.4 % and 27.1 %, respectively, and all three produced higher R/S values than those of the −PGR plants. Furthermore, IAA and SA increased TPDW by 7.8 % and 10.0 %, respectively. At 200 mM NaCl, SPD was the only treatment with RDW and R/S values higher than those of the −PGR plants; RDW reached 3.39 g plant-1, 16.5 % higher than in −PGR (Figure 1; Table 1; Table S3). The response of TLA and TSL to salinity also varied with PGR treatment. At 100 mM NaCl, no treatment improved TLA or TSL compared with −PGR. In contrast, at 200 mM, IAA and KIN increased TLA by 22.8 % and 50.4 %, respectively, whilst GA3, IAA and KIN increased TSL by 49.7 %, 27.5 % and 31.4 %, respectively (Table 1; Table S3).
Salinity and PGR treatments had a significant effect on RWC and WUC. The R × S interaction was significant only for WUC (Table S2), indicating that the response of this variable to PGRs depended on the NaCl concentration. According to the effect sizes, salinity accounted for the largest proportion of the variation in both RWC and WUC (Table S1). Compared with 0 mM, 200 mM NaCl significantly reduced RWC in the −PGR plants and in those treated with GA3, IAA, SA and SPD, whilst with KIN no differences were detected between salinity levels (Table 1 and Table S3). Conversely, WUC increased under salinity, and at 200 mM NaCl, the treatments with GA3, IAA, SA and SPD showed significantly lower values than those of the −PGR plants (Table 1 and Table S3).
3.2. Effects of Growth Regulator Treatments and Salinity on Leaf and Root C and N Status
Elemental composition responded significantly to both salinity (S) and growth regulator treatments (R) (Table S4). Concentrations of nitrogen (N) and carbon (C), as well as the carbon-to-nitrogen ratio (C/N), showed significant effects of both factors and their interaction in leaves and roots. The magnitudes of the effects indicated that the R × S interaction accounted for the largest proportion of the variation in N, C and C/N in the leaves, whilst the effect of R predominated in the roots (Table S1).
In leaves, the N concentration showed a treatment-dependent response to PGRs (Table 2 and Table S5). At 100 mM NaCl, GA₃ and SPD exhibited significantly higher concentrations than −PGR, whilst at 200 mM NaCl, IAA and −PGR constituted the group with the highest values. Variations in leaf C were comparatively smaller: IAA showed the highest value at 100 mM NaCl, whilst at 200 mM it did not differ significantly from −PGR. The highest C/N ratios were observed for IAA, SA and KIN at 100 mM NaCl, and for SA and KIN at 200 mM NaCl. In the roots, the N concentration at 200 mM NaCl was significantly lower than that recorded at 0 mM in all PGR treatments. At 100 mM NaCl, −PGR, SA and SPD constituted the group with the highest concentrations, whilst at 200 mM, SA and SPD did not differ significantly from −PGR. The root concentration of C showed smaller variations, although at 200 mM NaCl, SPD exhibited a significantly higher value than −PGR, IAA and SA. The root C/N ratio increased with salinity in most treatments; GA3 and KIN had the highest values at 100 mM NaCl, whilst KIN reached the highest numerical value at 200 mM, showing no difference from GA3 or IAA. For SPD, this ratio did not vary significantly across the salinity levels.
3.3. Effects of Growth-Regulator Treatments and Salinity on Photosynthetic Pigments
The concentrations of chlorophyll a (Chl a), chlorophyll b (Chl b), total chlorophyll (Chl a+b) and carotenoids (Car), as well as the Chl a/b and Chl a+b/Car ratios, were significantly affected by treatments with growth regulators (R), salinity (S) and their interaction (R × S) (Table S6). The effect sizes showed that R was the main source of variation for Chl a, Chl b, Chl a+b and Car, whilst the R × S interaction accounted for the largest proportion of the variation in the Chl a/b and Chl a+b/Car ratios (Table S1).
In plants not treated with plant growth regulators (−PGR), the total chlorophyll concentration decreased progressively with salinity, with a 38.7 % reduction at 200 mM NaCl compared with 0 mM (Figure 2; Table S7). At 0 mM NaCl, SA and KIN constituted the group with the highest values; with GA₃, levels remained unchanged between 0 and 100 mM and increased at 200 mM NaCl. The R × S interaction was reflected in contrasting responses to salinity: total chlorophyll increased with GA3 and reached its highest value at 200 mM NaCl; with SPD, it remained unchanged between 0 and 100 mM and decreased at 200 mM; whilst with SA, it decreased progressively as salinity increased.
The response of carotenoids also depended on the PGR treatment and the salinity level (Figure 3). At 0 mM NaCl, only SA and KIN showed significantly higher levels than −PGR. At 100 mM, GA3, SA, KIN and SPD exceeded the levels observed with −PGR, with the highest values corresponding to SA and KIN, which did not differ significantly from GA₃. At 200 mM, these four treatments also showed higher values than −PGR, with GA₃ reaching the maximum. IAA did not differ significantly from −PGR at either salinity level.
The Chl a/b ratio also showed a response dependent on both factors (Table 3 and Table S7). At 0 mM NaCl, only IAA produced a ratio significantly higher than that of −PGR, whilst at 100 mM only SA significantly exceeded this treatment. At 200 mM, no PGR treatment produced a Chl a/b ratio higher than −PGR. The Chl a+b/Car ratio also showed a response dependent on both PGR treatment and salinity (Table 3 and Table S7). In −PGR plants, the ratio decreased significantly at 100 and 200 mM NaCl compared with 0 mM, with no differences between the two salinity levels. At 100 mM, GA3, IAA and SA showed values significantly higher than −PGR; at 200 mM, this ratio was higher for GA3, IAA, KIN and SPD, whilst SA showed a lower value.
3.4. Effects of Growth-Regulator Treatments and Salinity on Photosynthetic Performance
The two-factor ANOVA showed that the net CO2 assimilation rate (A), stomatal conductance (gs), intercellular CO2 concentration (Ci), transpiration rate (E), photosynthetic nitrogen use efficiency (PNUE), apparent carboxylation efficiency (A/Ci), instantaneous water use efficiency (WUE) and intrinsic water use efficiency (WUEᵢ) were significantly affected by growth regulator treatment (R), salinity (S) and their interaction (R × S) (Table S8). The significant interaction for all variables indicates that their response to salinity depended on the applied growth regulator treatment. The effect sizes showed that salinity was the main source of variation for A, gs, E and PNUE, whilst the R × S interaction explained the largest proportion of the variation in Ci, A/Ci, WUE and WUEi (Table S1).
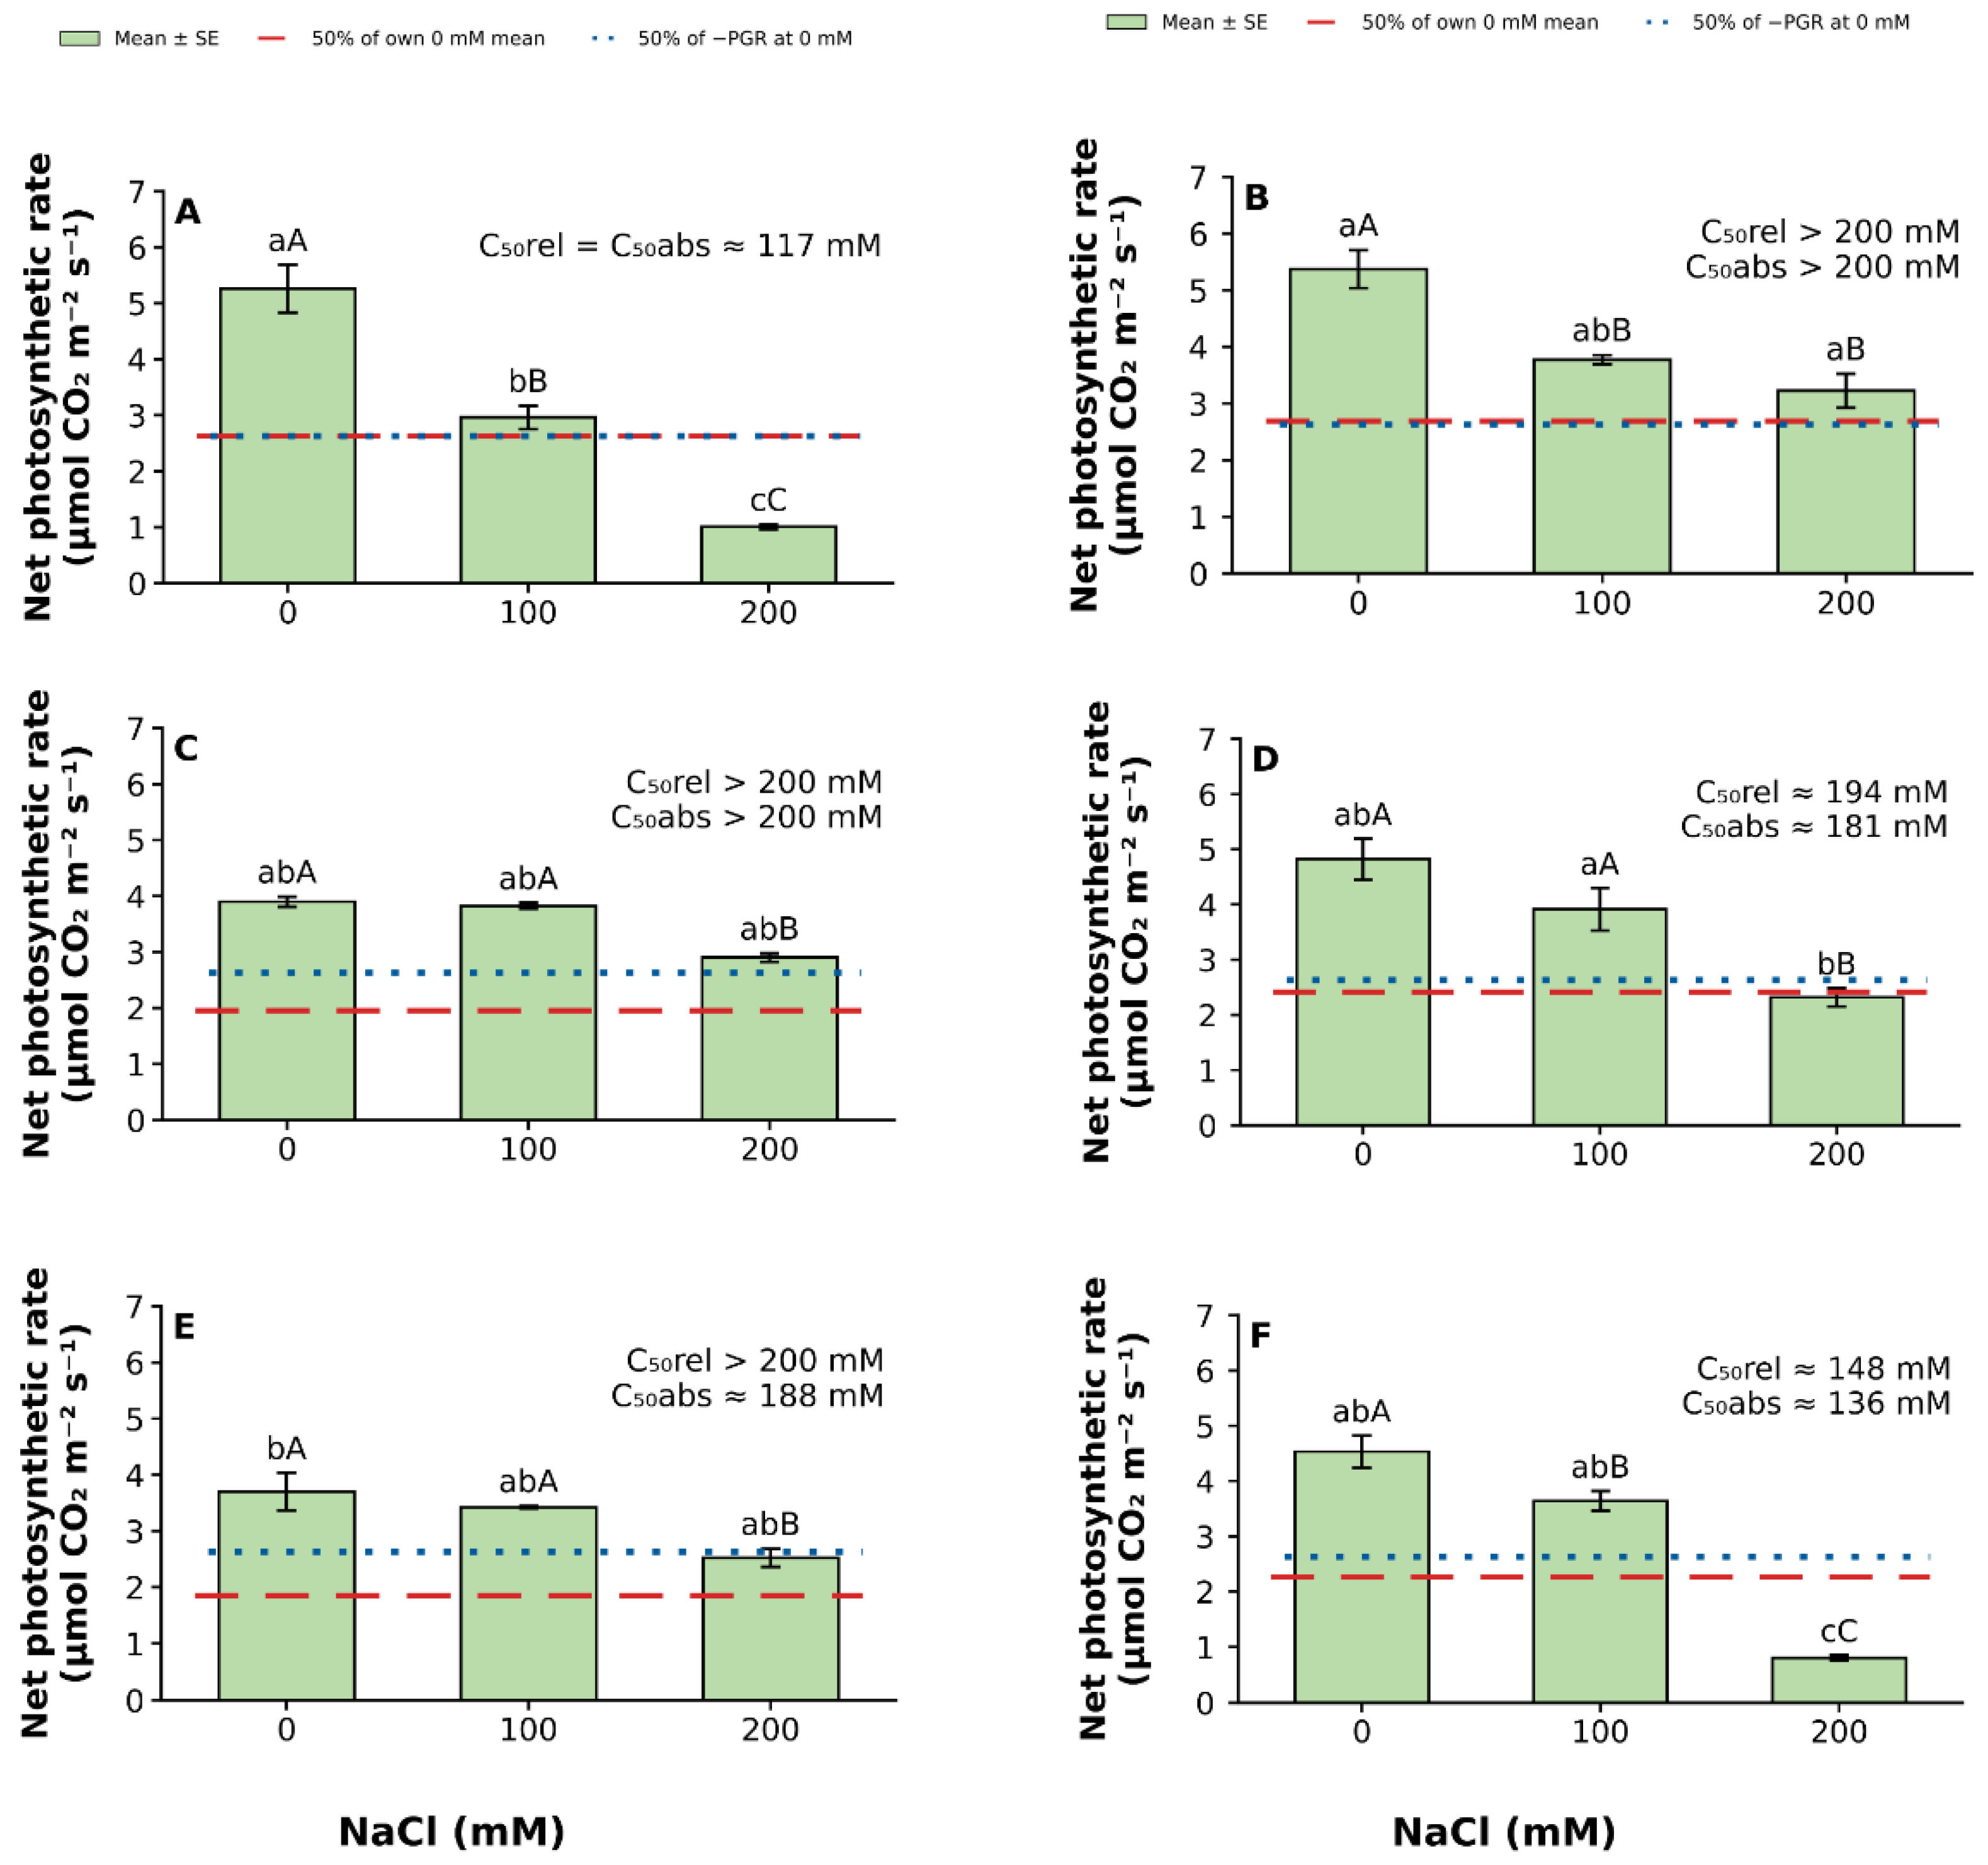
In plants not treated with PGR (−PGR), salinity caused a coordinated decrease in gas exchange (Figure 4; Table S9). At 100 and 200 mM NaCl, A decreased by 43.7 % and 80.8 %, gₛ by 43.0 % and 61.1 %, and E by 47.8 % and 68.7 %, respectively, compared with 0 mM. PGR treatments attenuated this response to varying degrees. At 100 mM, IAA, SA and KIN maintained A at levels showing no significant difference from their 0 mM values, although only SA showed a value significantly higher than that of −PGR. GA3, SA and KIN showed values for gs and E higher than −PGR, and KIN was the only treatment in which E did not decrease significantly compared with 0 mM. At 200 mM, A decreased compared with 0 mM under all treatments, but the reductions recorded with GA3, IAA, SA and KIN (39.9 %, 25.6 %, 51.9 % and 31.8 %, respectively) were smaller than that observed in the −PGR treatment. Consequently, these four treatments exhibited significantly higher A values than −PGR. At this salinity level, IAA and SA also maintained higher gₛ values, whilst GA₃, IAA, SA and KIN exhibited higher E values than −PGR. SPD did not differ from −PGR for any of the three parameters at 200 mM. Ci and A/Ci responded differently to salinity and PGR treatments (Figure 4; Table 4). In −PGR plants, Ci did not vary significantly at 100 mM, but increased by 32.0 % at 200 mM compared with 0 mM. In contrast, A/Ci decreased by 47.5 % and 92.3 % at 100 and 200 mM, respectively, and both reductions were significant compared with 0 mM. At 100 mM, GA3, IAA, SA and KIN exhibited Cᵢ values significantly higher than −PGR, whilst SPD did not differ from the untreated plants. For A/Ci, SPD exhibited the highest value and was significantly higher than all other treatments. GA3 and IAA did not differ from −PGR or from SA and KIN, whilst the latter two showed values lower than −PGR. At 200 mM NaCl, GA3, IAA, SA and KIN exhibited A/Ci values significantly higher than −PGR, whilst SPD did not differ from the untreated plants. Compared with 0 mM, A/Ci increased with GA3 and KIN, but decreased with IAA, SA and SPD. WUE, WUEᵢ and PNUE also showed responses dependent on the PGR treatment and the salinity level (Figure 4; Table 4). In −PGR, WUE and WUEi remained unchanged at 100 mM, but decreased by 35.5 % and 49.5 %, respectively, at 200 mM. At 100 mM, SPD increased WUE compared with 0 mM and exhibited the highest value, whilst IAA, SA and KIN increased WUEᵢ. At this salinity level, IAA and SA maintained PNUE compared with 0 mM and showed higher values than in the −PGR treatment. At 200 mM, WUE increased compared with 0 mM for GA3, SA and KIN and remained unchanged for IAA; however, only GA3 and IAA showed values significantly higher than −PGR. WUEi increased with GA3, IAA, SA and KIN, although only GA3, IAA and KIN significantly exceeded −PGR. PNUE decreased compared with 0 mM in all PGR treatments at 200 mM, but GA3, IAA and SA maintained values significantly higher than −PGR. At 100 mM, IAA and SA stood out for simultaneously maintaining A, A/Ci and PNUE, whilst KIN maintained A, E and A/Ci. At 200 mM, GA₃, IAA and KIN mitigated the loss of A and exhibited A/Ci and WUEi values significantly higher than −PGR. SA also reduced the loss of A and exhibited a PNUE value higher than −PGR, although A/Ci decreased compared with 0 mM. SPD, by contrast, did not prevent the deterioration of A, A/Ci, WUEi or PNUE at 200 mM.
As a complementary analysis of photosynthetic tolerance, the concentration of NaCl that reduced A to 50 % of the reference value (C50) was estimated. With GA₃ and IAA, the 50 % reduction was not achieved within the experimental range; consequently, the C50rel and C50abs values were greater than 200 mM NaCl. SA exhibited C50rel and C50abs values of approximately 194 and 181 mM, respectively, whilst with KIN these were greater than 200 mM and approximately 188 mM. SPD also shifted this threshold to a concentration higher than that estimated for −PGR, with both values below 150 mM, compared with approximately 117 mM in untreated plants. Therefore, all PGR treatments increased the concentration of NaCl required to reduce A by 50 %, and GA₃ and IAA produced the greatest shift in the photosynthetic tolerance threshold. The estimated thresholds were higher than those of −PGR for the treatments for which a threshold could be estimated; for GA3 and IAA, neither reference threshold was reached within the tested range
Figure 5.
Effects of plant growth regulator (PGR) treatments and NaCl salinity on net CO₂ assimilation rate (A) and the estimated salinity thresholds for a 50 % reduction in A in leaves of one-year-old olive plants: (A) −PGR, (B) GA3, (C) IAA, (D) SA, (E) KIN, and (F) SPD. Values are means ± standard error (SE; n = 3) at 0, 100, and 200 mM NaCl. Different lowercase letters indicate significant differences among PGR treatments within the same NaCl concentration, whereas different uppercase letters indicate significant differences among NaCl concentrations within the same PGR treatment, according to Tukey’s test (p < 0.05). Red dashed lines represent 50 % of the mean A at 0 mM NaCl for each treatment, whereas blue dotted lines represent 50 % of the mean A of −PGR plants at 0 mM NaCl. Abbreviations: PGR, plant growth regulator; −PGR, without plant growth regulator; GA3, gibberellic acid; IAA, indole-3-acetic acid; SA, salicylic acid; KIN, kinetin; SPD, spermidine.
Figure 5.
Effects of plant growth regulator (PGR) treatments and NaCl salinity on net CO₂ assimilation rate (A) and the estimated salinity thresholds for a 50 % reduction in A in leaves of one-year-old olive plants: (A) −PGR, (B) GA3, (C) IAA, (D) SA, (E) KIN, and (F) SPD. Values are means ± standard error (SE; n = 3) at 0, 100, and 200 mM NaCl. Different lowercase letters indicate significant differences among PGR treatments within the same NaCl concentration, whereas different uppercase letters indicate significant differences among NaCl concentrations within the same PGR treatment, according to Tukey’s test (p < 0.05). Red dashed lines represent 50 % of the mean A at 0 mM NaCl for each treatment, whereas blue dotted lines represent 50 % of the mean A of −PGR plants at 0 mM NaCl. Abbreviations: PGR, plant growth regulator; −PGR, without plant growth regulator; GA3, gibberellic acid; IAA, indole-3-acetic acid; SA, salicylic acid; KIN, kinetin; SPD, spermidine.
3.5. Biochemical Stress Responses and Antioxidant Defence
3.5.1. Free Amino Acids, Proline and Ethylene Production
Leaf contents of total free amino acids (TFAA) and proline (Pro), as well as ethylene (C2H4) production, were significantly affected by treatment with growth regulators (R), salinity (S) and their interaction (R × S) (Table S10). Effect sizes showed that R was the main source of variation for TFAA and C2H4, whilst the R × S interaction accounted for the largest proportion of the variation in Pro (Table S1). In −PGR plants, the TFAA content decreased by 18.6 % and 45.1 % at 100 and 200 mM NaCl, respectively, compared with 0 mM (Figure 6A; Table S11). At 100 mM NaCl, GA3 exhibited the highest TFAA content, with an increase of 87.5 % compared with the −PGR treatment, whilst SA and SPD showed increases of 27.8 % and 26.3 %, respectively. At 200 mM NaCl, all PGR treatments exhibited significantly higher contents than −PGR. GA₃ again achieved the highest value, with an increase of 93.9 %, followed by KIN, SPD, SA and IAA, with increases of 50.5 %, 35.6 %, 32.3 % and 28.4 %, respectively. In the absence of salinity, SA had the highest TFAA content.
Pro accumulation depended on the specific combination of PGR treatment and salinity (Figure 6B; Table S11). In −PGR plants, Pro increased by 14.7 % at 100 mM NaCl but decreased by 14.6 % at 200 mM compared with 0 mM. At 100 mM NaCl, GA3 and SPD constituted the group with the highest contents and significantly exceeded −PGR by 51.8 % and 60.3 %, respectively. At 200 mM NaCl, IAA produced the greatest Pro accumulation, with an increase of 73.9 % compared with −PGR. GA3 and SA also exhibited significantly higher values, with increases of 33.6 % and 12.3 %, respectively. SPD did not differ significantly from −PGR, whilst KIN exhibited a significantly lower content. In the absence of NaCl, GA₃ exhibited the highest Pro content, followed by IAA and SA.
C2H4 production increased markedly with salinity in −PGR plants, by 141.4 % and 122.2 % at 100 and 200 mM NaCl, respectively, with no significant differences between the two salinity levels (Figure 6C; Table S11). At 100 mM NaCl, SA did not differ significantly from −PGR, whilst GA₃, IAA, KIN and SPD reduced C₂H₄ production by 64.4 %, 66.5 %, 84.5 % and 74.1 %, respectively. At 200 mM NaCl, SPD did not differ from −PGR, whilst GA₃, IAA, SA and KIN exhibited significantly lower values, with reductions of 41.5 %, 79.4 %, 41.8 % and 78.8 %, respectively. In the absence of salinity, SA was the only PGR treatment that significantly increased C2H4 production compared with −PGR; GA3 produced no significant changes, whilst IAA, KIN and SPD reduced it. Overall, the response of C2H4 production to salinity depended markedly on the applied PGR treatment.
3.5.2. Enzymatic Antioxidant Activities
The activities of ascorbate peroxidase (APX), glutathione reductase (GR) and guaiacol peroxidase (GPX) were significantly affected by growth regulator treatment (R), salinity (S) and their interaction (R × S) (Table S12). Salinity was the main source of variation for APX and GPX, whilst the R × S interaction accounted for the largest proportion of the variation in GR (Table S1). These results indicate that the response of the three enzymes to salinity depended on the applied PGR treatment.
In −PGR plants, APX did not vary significantly between 0 and 100 mM NaCl but increased by 74.5 % at 200 mM (p < 0.05); GR increased by 97.5 % and 113.6 % at 100 and 200 mM NaCl, respectively (p < 0.05); and GPX increased progressively by 54.6 % and 87.9 % at the two salinity levels (p < 0.05) (Figure 7A–C; Table S13). In the absence of salinity, KIN and SPD significantly increased APX by 19.7 % and 39.7 %, respectively, compared with −PGR, whilst IAA and SA reduced it (p < 0.05). At 100 mM NaCl, all PGR treatments increased this activity (p < 0.05), with increases of 87.9 % with IAA, 35.3 % with KIN, 30.0 % with GA₃, 22.3 % with SPD and 21.3 % with SA. At 200 mM NaCl, only IAA increased APX, by 50.1 %, whereas GA₃ reduced it by 30.0 % (p < 0.05 in both cases), whilst SA, KIN and SPD did not differ from −PGR. Within each treatment, APX increased progressively with salinity in plants treated with IAA and SA, whereas with SPD it decreased at 100 mM and increased again at 200 mM.
For GR, in the absence of salinity, GA3 significantly increased the activity by 105.4 % compared with −PGR, whilst IAA, SA and SPD reduced it (p < 0.05) and KIN did not differ from −PGR (Figure 7B; Table S13). At 100 mM NaCl, KIN exhibited the highest activity and exceeded −PGR by 30.8 % (p < 0.05); GA3, SA and SPD showed significantly lower values, whereas IAA did not differ from −PGR. At 200 mM NaCl, SPD exhibited the highest activity and exceeded −PGR by 23.3 % (p < 0.05); GA₃, IAA and SA showed significantly lower values, whereas KIN did not differ from −PGR. When the response to salinity was considered within each treatment, GR decreased with GA3, reached its maximum at 100 mM with IAA, increased at 100 and 200 mM with SA and KIN, and increased only at 200 mM with SPD.
For GPX, in the absence of salinity, KIN significantly increased the activity by 40.8 % compared with −PGR, whilst GA₃, SA and SPD reduced it (p < 0.05) and IAA did not differ from −PGR (Figure 7C; Table S13). At 100 mM NaCl, all PGR treatments reduced GPX (p < 0.05), with decreases ranging from 13.9 % with GA3 to 56.2 % with SPD. At 200 mM NaCl, IAA did not differ from −PGR, whilst GA₃, SA, KIN and SPD significantly reduced the activity by 34.5 %, 22.1 %, 35.2 % and 27.4 %, respectively. Within each treatment, GPX reached its maximum at 100 mM with GA3 and at 200 mM with IAA, SA and SPD; with KIN, by contrast, it was significantly lower at both salinity levels than in the absence of salinity.
3.6. Phenolic Compounds and Non-Enzymatic Antioxidant Capacity
In −PGR plants, TPC did not vary between 0 and 100 mM NaCl and increased at 200 mM, whereas TFC decreased at 100 mM and increased at 200 mM (Figure 8A, B; Table S15). At 100 mM, IAA, SA and KIN increased TPC, with IAA reaching the highest value among all treatments. At 200 mM, TPC increased with SPD and decreased with IAA, SA and GA3 compared with 100 mM. With KIN, TPC increased progressively, from 29.54 mg g⁻¹ DW at 0 mM to 64.35 mg g⁻¹ DW at 200 mM. At this salinity level, IAA exhibited the highest mean value, although it did not differ significantly from KIN. TFC increased progressively with IAA, SA and GA3, with the latter treatment reaching the highest content at 200 mM. With SPD and KIN, TFC increased at 100 mM and decreased at 200 mM.
The effects of PGR treatments and salinity on antioxidant capacity differed between the ABTS and DPPH assays (Table 5). In the ABTS assay, IAA exhibited the highest antioxidant capacity at 100 mM NaCl (359.57 ± 1.48 µg mL-1), whereas at 200 mM the highest capacity was observed with SPD (245.43 ± 0.51 µg mL-1), followed by GA3 and SA, which did not differ significantly from each other. KIN exhibited the lowest capacity at both salinity levels, with IC50 values of 769.30 ± 7.35 and 499.73 ± 2.81 µg mL-1 at 100 and 200 mM, respectively. In the DPPH assay, SPD exhibited the highest antioxidant capacity at 100 mM NaCl (20.49 ± 0.34 µg mL-1), with IAA showing the second highest capacity (30.00 ± 0.18 µg mL⁻¹). At 200 mM, the highest capacities were observed with IAA and −PGR, with IC50 values of 18.60 ± 0.47 and 18.89 ± 0.35 µg mL-1, respectively, which did not differ significantly from each other. KIN exhibited the lowest capacity at both salinity levels, with values of 81.00 ± 1.16 and 87.24 ± 1.49 µg mL-1, respectively. IC50 values exceeding the tested concentration ranges are indicated in Table 5 and should be regarded as estimates obtained by extrapolation.
Overall, IAA consistently enhanced antioxidant capacity at 100 mM NaCl, whereas at 200 mM the responses were radical-specific, with SPD exhibiting the highest capacity in the ABTS assay and IAA maintaining a capacity similar to that of −PGR in the DPPH assay.
3.7. Integrative Multivariate Analysis of Plant Responses to PGRs and Salinity
The 23 variables related to growth, water status, nitrogen status, photosynthetic pigments, gas exchange and biochemical responses, obtained from the means of the 18 PGR × salinity combinations, were analysed jointly using Pearson’s correlations, hierarchical clustering and principal component analysis (Figure 9, Figure 10 and Figure 11).
The correlation analysis revealed close associations between leaf growth, water status and gas exchange (Figure 9A). Leaf dry mass (LDM) was positively correlated with total leaf area (TLA; r = 0.88), relative water content (RWC; r = 0.81), net photosynthetic rate (A; r = 0.87) and stomatal conductance (gs; r = 0.72), and negatively correlated with water uptake capacity (WUC; r = −0.69). RWC showed a similar pattern, correlating positively with A, gₛ and transpiration rate (E) (r = 0.77, 0.74 and 0.74, respectively) and negatively with WUC (r = −0.84). A was also positively correlated with TLA (r = 0.66), gs (r = 0.63) and E (r = 0.67). The strongest association was observed between gₛ and E (r = 0.99), whilst total chlorophyll was positively correlated with carotenoids (r = 0.81), gₛ (r = 0.67) and E (r = 0.69).
Biochemical traits showed fewer specific associations (Figure 9B). Total free amino acid content (TFAA) was positively correlated with RWC (r = 0.75) and A (r = 0.66). By contrast, APX activity was negatively correlated with LDM (r = −0.70) and RWC (r = −0.72), whilst GPX activity was negatively correlated with LDM (r = −0.64) and A (r = −0.70). Flavonoid content was also negatively correlated with TLA (r = −0.66). These associations linked higher leaf growth and photosynthetic activity to a more favourable water status, whereas higher activities of certain antioxidant enzymes were associated with lower LDM, RWC or A. No significant correlations were detected for proline, ethylene, GR, phenols or the ABTS and DPPH IC50 values after Benjamini–Hochberg correction. All significant correlations had adjusted p-values below 0.05.
The integrated heatmap and dendrogram showed a general separation between numerous treatments exposed to 200 mM NaCl and the majority of non-saline treatments (Figure 10). However, the 18 combinations were not grouped exclusively according to NaCl concentration, indicating that plant growth regulators (PGRs) modified the multivariate pattern induced by salinity. In the absence of NaCl, most treatments exhibited relatively high values for LDM, TLA, RWC and gas exchange variables, alongside low values for proline and antioxidant activities. In contrast, the −PGR plants at 200 mM NaCl exhibited low values for LDM, TLA, RWC, total chlorophyll, carotenoids, A, gs and E, and high values for WUC, Ci, ethylene, GPX and flavonoids. This pattern linked severe salinity to the coordinated inhibition of above-ground growth, water status and photosynthetic activity, as well as to a greater intensity of certain biochemical responses to stress. The effects of the PGRs depended on the regulator applied and the salinity level. At 200 mM NaCl, IAA, SA and SPD maintained relatively high root biomass values, with SPD being the treatment with the highest standardised value. However, in the SPD treatment, this maintenance was not accompanied by a general recovery in above-ground growth or photosynthesis. IAA was characterised by high APX and GPX activities and high phenolic contents, whilst SPD showed relatively high GR activity. SA also maintained high root biomass and exhibited relative increases in APX and GPX. GA₃ was distinguished by its higher relative contents of total chlorophyll, carotenoids and flavonoids, and KIN by maintaining a comparatively larger leaf area. Under moderate salinity, IAA and SA also exhibited relatively high root biomass values. IAA was further distinguished by its phenolic content and its APX and GR activities; GA3, by relatively high levels of TFAA, proline and foliar nitrogen; and SPD, by greater accumulation of proline and foliar nitrogen. Thus, the heatmap showed that the PGRs did not induce a common response, but rather distinct profiles of morphological, physiological and biochemical adjustments.
Principal component analysis confirmed the multivariate differentiation between the treatments (Figure 11A). The first two components together explained 52.72 % of the total variance. PC1 explained 40.67 % and primarily represented the salinity gradient: the non-saline combinations were situated on the negative side of the axis, those exposed to 200 mM NaCl were predominantly located on the positive side, and those at 100 mM were in intermediate positions. RWC (−0.92), LDM (−0.90), A (−0.84), E (−0.86), gₛ (−0.85), TFAA (−0.74), TLA (−0.76), total chlorophyll (−0.68) and carotenoids (−0.56) showed negative loadings on PC1, whilst APX (0.78), GPX (0.68), WUC (0.71), GR (0.59) and RDW (0.51) were positively associated with this component. Thus, the shift towards positive values on PC1 reflected the transition from greater leaf growth, better water status, higher photosynthetic activity and pigment retention towards greater antioxidant activity, WUC and allocation of biomass to the roots. PC2 explained a further 12.05 % and mainly reflected the differences between the effects of the plant growth regulators within each salinity level. Root nitrogen (0.40), foliar nitrogen (0.82) and ethylene (0.23) were associated with its positive end, whilst Cᵢ (−0.52), DPPH IC₅₀ (−0.47), phenols (−0.21), APX (−0.27), GR (−0.41), WUC (−0.19) and RDW (−0.25) were oriented towards the negative end of PC2. Treatments with KIN under salinity conditions had the most negative scores on PC2, whilst −PGR and some SPD treatments occupied more positive positions. The partial overlap between the 100 and 200 mM NaCl groups indicates that, although salinity was the main determinant of the ordination, the applied PGR substantially modified the multivariate response.
By plotting the combinations separately at each NaCl concentration, the shifts induced by each PGR relative to −PGR were compared directly (Figure 11B). In the absence of NaCl, all treatments were situated below −PGR; SA produced the greatest shift towards negative values on PC1, whilst KIN and SPD reached the most negative values on PC2. At 100 mM NaCl, KIN showed the greatest separation from −PGR, mainly along PC2, and IAA also shifted markedly towards negative values on this component, whilst SPD remained relatively close to −PGR. At 200 mM NaCl, all PGRs shifted the scores towards lower values on PC1 relative to −PGR, although they differed on PC2: KIN again showed the greatest separation towards negative values on PC2, and GA₃ and SA exhibited the most pronounced shifts towards negative values on PC1. IAA and SPD remained closer to −PGR, particularly IAA. The absence of a common direction of shift indicates a multivariate reconfiguration specific to each PGR, dependent on the intensity of salinity. Integrative analyses highlighted the relative maintenance of root biomass with SPD, the most pronounced antioxidant and phenolic response with IAA, the preservation of pigments with GA₃, and the relative maintenance of leaf area with KIN under conditions of severe salinity.
Overall, the integrative analyses demonstrated that PGR treatments modified the response of olive plants to salinity, and their effects depended on the regulator, the variable considered and stress intensity. Under severe salinity, SPD was distinguished by the maintenance of root biomass, GA3 contributed to the preservation of photosynthetic pigments, KIN favoured the relative maintenance of leaf area and IAA promoted a more pronounced antioxidant and phenolic response. SA combined relatively high root biomass with increased activity of certain antioxidant enzymes. Therefore, no PGR fully restored the physiological profile observed in the absence of salinity; instead, the different treatments promoted distinct response profiles related to the maintenance of root growth, pigment preservation, retention of leaf area and biochemical protection. These profiles summarise the different responses associated with PGR treatment under the conditions tested.
4. Discussion
In the present study, salinity mainly restricted the growth of the aerial parts of ‘Picual’ olive plants, as reflected in the reductions in LDM, TLA and TSL in the −PGR plants (Figure 1; Table 1). This response is consistent with the growth reductions reported for ‘Oueslati’, ‘Arbequina’, ‘Koroneiki’, ‘Royal de Cazorla’, ‘Fadak 86’ and ‘Zard’ under different NaCl concentrations [19,47,48]. However, TPDW remained stable in the −PGR plants and in those treated with IAA or SPD at both salinity levels; SA and KIN maintained it at 100 mM, and with GA₃ it did not differ between 0 and 200 mM NaCl. The stability of total biomass has also been observed in other olive genotypes [10,49], although marked reductions have been reported in ‘Oueslati’ at 200 mM [47], confirming that this response depends on the genotype [10,50]. The significant interaction between the growth regulator (R) and salinity (S) for TPDW indicates that the response to salinity depended on the PGR applied (Table S2). At 200 mM NaCl, the reduction in LDM in the −PGR plants and those treated with GA3 or SPD coincided with an increase in RDW and, in several cases, in R/S; KIN and SA showed a similar pattern at 100 mM (Figure 1; Table 1). This increased allocation to the roots may have partially compensated for the loss of foliar biomass and helped to maintain water and nutrient uptake when salinity reduces the water potential of the environment [51]. The greater sensitivity of above-ground growth compared to root growth has been described in various olive cultivars [8,27,52], although Palm et al. [10] did not observe significant changes in root biomass in the genotypes studied. PGRs modified this pattern in a salinity intensity-dependent manner. A comparable regulator-dependent shift in biomass allocation has recently been reported in salt-stressed sugar beet, where foliar methyl jasmonate (MeJA) increased dry matter accumulation and the root-to-shoot ratio [53]. IAA was the only regulator that increased TPDW compared with −PGR at 100 and 200 mM NaCl and, at 200 mM, also promoted TLA and TSL, in line with previous results obtained in ‘Picual’ plantlets [27]. SA increased TPDW, RDW and R/S only at 100 mM, whilst GA₃ and KIN improved specific components of above-ground development under severe salinity, without increasing TPDW; the effect of GA₃ on TSL is consistent with that described for ‘Chemlali’ and ‘Koroneiki’ [54]. SPD, on the other hand, increased RDW and R/S at 200 mM, indicating a preferential allocation of biomass to the roots. Therefore, IAA exhibited the most integrated growth response under severe salinity, whilst SA, GA3, KIN and SPD acted on more specific components, depending on the intensity of the stress.
Alongside changes in biomass allocation, salinity reduced leaf water status, as indicated by the decrease in relative water content (RWC) (Table 1). The reduction in soil water potential caused by NaCl hinders water uptake and the maintenance of turgor, and may alter root hydraulic conductivity [55,56]. Decreases in RWC have previously been reported in olive trees, although their magnitude depends on the cultivar and the intensity and duration of the stress [6,35,48]. The response of water uptake capacity (WUC) should be interpreted in conjunction with the decrease in RWC, as this variable reflects the amount of water that leaf tissue takes up during rehydration until turgor is restored [36]. The negative association between RWC and WUC, as well as their opposite positions along the main multivariate gradient, indicates that the increase in WUC under salinity is consistent with a greater need for tissue rehydration and not necessarily with improved water status. The association of low RWC, LDM and TLA values with high WUC values reinforces the relationship between deteriorating water status and the inhibition of leaf growth (Figure 9, Figure 10 and Figure 11). However, this general pattern was not consistently replicated across all PGRs: at 200 mM NaCl, GA₃, IAA, SA and SPD exhibited WUC values lower than those of −PGR, without showing higher RWC values.
In addition to its effects on growth and water relations, salinity altered the C:N balance in a manner dependent on the organ and the PGR treatment (Table 2). The general decrease in root N at 200 mM NaCl, compared with the more variable response of foliar N, indicates that the nitrogen status of the roots was particularly sensitive to severe salinity. Competition between Cl⁻ and NO3⁻, along with alterations to the transport systems and enzymes involved in nitrogen assimilation, may explain this response [57]. This pattern is consistent with previous studies on olive cultivars, although the response depends on the genotype, the NaCl concentration and the duration of exposure [18]. None of the PGRs prevented the decline in root N at 200 mM NaCl. Furthermore, foliar and root N concentrations did not correlate significantly with growth variables or water-related parameters (Figure 9); consequently, no statistical association was observed between nitrogen status and the maintenance of growth or water status. Carbon concentrations varied less than those of nitrogen; consequently, the increase in the C/N ratio in the roots observed in most treatments was primarily due to the decrease in nitrogen (Table 2). The response of the C/N ratio to salinity is not uniform across species, as it can be modified by different changes in C and N concentrations [58,59]. At 100 mM NaCl, GA3 and SPD increased leaf N compared with −PGR, whilst IAA increased leaf C. Under severe salinity, SPD was the only regulator that increased root C compared with −PGR; this increase coincided with greater root biomass, but not with an increase in N in this organ.
The stability of the photosynthetic apparatus is an important component of the olive tree’s response to salinity, as chloroplasts are sensitive to osmotic and ionic imbalances and to the accumulation of reactive oxygen species [20,48]. In −PGR plants, the progressive decrease in total chlorophyll and carotenoids indicated that the pigment system of ‘Picual’ was increasingly affected as salinity rose (Figure 2 and Figure 3). This response is consistent with the losses of chlorophylls and carotenoids described in other olive genotypes, although their magnitude depends on the cultivar [48,60]. At 200 mM NaCl, the reduction in chlorophyll in the −PGR plants did not coincide with a significant decrease in foliar N (Table 2); therefore, the loss of pigments does not appear to be primarily attributable to an N limitation. This pattern contrasts with the simultaneous decrease in total chlorophyll and foliar N observed in the ‘Oliana’ and ‘Lecciana’ cultivars under salinity [18]. Total chlorophyll correlated positively with carotenoids, gₛ and E, and both pigments were associated on PC1 with leaf growth, RWC and gas exchange, in opposition to the salinity gradient (Figure 9 and Figure 11). PGRs modified the pigment system’s response to salinity, although their efficacy depended on the regulator and the pigment in question. GA3 provided the most consistent protection, with the highest total chlorophyll and carotenoid contents at 200 mM NaCl (Figure 2, Figure 3 and Figure 10). This response is consistent with the improvement in the chlorophyll index and other physiological parameters described in ‘Chemlali’ and ‘Koroneiki’ treated with GA3 under salinity [54]. However, in the present study, the preservation of pigments with GA3 was not accompanied by an increase in TPDW compared with −PGR under severe salinity, indicating that greater stability of the pigment apparatus did not necessarily imply greater biomass accumulation. The remaining PGRs showed more selective responses. SA increased total chlorophyll and carotenoids at 100 mM NaCl, whilst at 200 mM it only maintained a higher carotenoid content, suggesting preferential protection of the photoprotective components. KIN and SPD maintained higher total chlorophyll and carotenoid values than −PGR at 200 mM, albeit with different growth patterns: KIN was associated with higher TLA and TSL, whilst SPD increased RDW and R/S (Figure 1, Figure 2 and Figure 3). IAA, by contrast, increased total biomass and maintained TLA and TSL under severe salinity without being accompanied by greater pigment accumulation relative to −PGR. This result differs from that previously observed with IAA and SA in ‘Picual’ plantlets subjected to salinity [27], possibly due to the different developmental stage of the plant material [7], and contrasts with the simultaneous improvement in pigments, growth and water status induced by melatonin in two-year-old ‘Zard’ olive plants [48]. Analysis of the Chl a + b/Car and Chl a/b ratios showed that salinity and PGRs altered not only the abundance of pigments but also their relative composition (Table 3). In −PGR plants, Chl a + b/Car decreased with salinity; at 200 mM NaCl, this ratio was lower with SA and higher with GA₃, IAA, KIN and SPD. When this ratio reflects a relative maintenance of carotenoids, its decrease may indicate a greater contribution of these pigments to photoprotection [61]. At 200 mM, the Chl a/b ratio increased in −PGR, whilst it was lower with IAA, SA, KIN and SPD and remained stable with GA3, indicating a regulator-dependent reorganisation of pigment composition. Consequently, although GA₃ provided the most comprehensive protection of the pigment apparatus under severe salinity, the lack of correspondence observed with the other PGRs between pigment abundance, their relative composition and growth suggests that pigment preservation alone is not a sufficient indicator of an overall improvement in salinity tolerance (Figure 11).
In −PGR plants, the parallel decreases in A, gs and E indicate that the inhibition of photosynthesis was associated with greater stomatal limitation of CO2 diffusion and lower transpiration (Figure 4). The positive association of A with gs, E, RWC, LDM and TLA, as well as their collective orientation in the opposite direction to the salinity gradient in the PCA, confirms the close relationship between photosynthetic activity, water status and leaf growth (Figure 9 and Figure 11A). This coordinated deterioration in water relations and gas exchange has previously been described in olive trees subjected to salinity [6,7]. Although stomatal closure reduces water loss, it also limits CO2 uptake [62]; however, changes in Ci and A/Ci indicate that this alone does not explain the decrease in A. At 100 mM NaCl, Cᵢ did not differ from that at 0 mM, whilst A/ Ci decreased, suggesting a lower apparent utilisation of available CO2. At 200 mM, the decrease in A was proportionally greater than that of gs; it coincided with an increase in Ci and a marked reduction in A/Ci, pointing to a greater contribution from non-stomatal limitations under severe salinity, including possible restrictions on mesophyll diffusion or on the biochemical capacity for carbon fixation [20,63]. The coexistence of stomatal and non-stomatal limitations has previously been described in olive trees [64]. PGRs modified this response in a salinity intensity-dependent manner, as confirmed by the significant R × S interaction for all photosynthetic parameters (Table S8). At 100 mM NaCl, SA showed the most favourable response, as although IAA, SA and KIN maintained A relative to their non-saline conditions, SA was the only treatment that exhibited values higher than −PGR (Figure 4). The simultaneous increase in gₛ and E relative to −PGR indicates reduced stomatal restriction, whilst the higher Cᵢ and lower A/Cᵢ suggest that this improvement in A was primarily related to greater internal CO₂ availability rather than to greater apparent efficiency in its utilisation. The ability of SA to modulate stomatal opening and maintain CO₂ assimilation under salinity has been described in other species, although it depends on the concentration applied and the intensity of the stress [65,66]. A recent study demonstrated that the exogenous application of SA improved photosynthetic performance, antioxidant enzyme activity and osmolyte accumulation in Zinnia elegans subjected to Cd stress, whilst reducing oxidative damage. These results support the general role of SA in coordinating photosynthetic protection, redox regulation and metabolic acclimatisation during plant responses to stress [67]. SPD exhibited a higher A/Cᵢ ratio, but this advantage did not translate into higher A. At 200 mM NaCl, GA3, IAA, SA and KIN mitigated the inhibition of A relative to −PGR, although none restored values to those observed at 0 mM (Figure 4). IAA exhibited the lowest relative loss of A and combined this maintenance with higher values of gₛ and A/Cᵢ, which is consistent with a reduction in both stomatal limitation and the impairment of apparent CO₂ utilisation. Together with the maintenance of leaf growth, this response indicates a more integrated physiological protection and is consistent with the favourable effects of IAA previously observed in young ‘Picual’ plants exposed to NaCl [27] and in other species subjected to salinity [68,69]. With GA₃, the maintenance of A coincided with a high A/Cᵢ ratio and with the greatest protection of chlorophylls and carotenoids, suggesting a coordinated preservation of the pigment apparatus and photosynthetic function. This effect is consistent with previous findings in ‘Chemlali’ and ‘Koroneiki’ [54] and with the coordinated regulation of stomatal function, photosynthetic stability and carbon fixation attributed to GA₃ under salinity [70]. SA and KIN exhibited distinct patterns, consistent with preferential protection of the stomatal component and apparent CO₂ utilisation, respectively. In contrast, SPD did not protect A at 200 mM despite its favourable effect on root biomass, revealing a decoupling between root response and foliar carbon assimilation under severe salinity [71]. More broadly, recent findings in sugar beet showed that foliar MeJA increased net photosynthetic rate under both controlled and field saline conditions [53]. Recent findings in wheat subjected to water stress showed that foliar application of SA and putrescine improved photosynthetic rate, leaf water status and osmolyte accumulation [72].
Descriptive C50 estimates summarised the response of A to increasing NaCl concentrations (Figure 5). All PGRs shifted this threshold above that of −PGR, using both relative and absolute references, indicating not only initial differences in A, but also a smaller decrease in this variable along the salinity gradient. The agreement between both criteria reinforces this interpretation, particularly because plant responses may vary with stress intensity [73]. GA3 and IAA provided the greatest photosynthetic protection, as a 50 % reduction in A was not reached within the experimental range; KIN and SA showed intermediate protection, and SPD also shifted C50 above −PGR. Together with the multivariate analyses, these results confirm that GA₃ and IAA prolonged the maintenance of A under salinity, albeit through distinct physiological responses: GA3 was primarily associated with the preservation of the pigment apparatus, whilst IAA combined the maintenance of A with leaf growth.
The responses of WUE and WUEi show that the effect of salinity on water-use efficiency depended on the relationship between A and its transpiration and stomatal components. In −PGR plants, both efficiencies were maintained at 100 mM NaCl but decreased at 200 mM, indicating that the regulation of gas exchange could no longer compensate for the inhibition of A under severe salinity. This behaviour is consistent with the close relationship between photosynthesis, stomatal regulation and water status described in olive trees under salinity [6,9]. At 100 mM, SPD stood out for its effect on WUE, whilst IAA, SA and KIN increased WUEi. At 200 mM, GA₃ and IAA both maintained efficiencies above those of −PGR; KIN maintained WUEi, whilst the favourable effect of SPD was restricted to moderate salinity. The response to GA₃ is consistent with that previously described in olive trees [54], and the response to IAA is consistent with the results obtained in young ‘Picual’ plantlets subjected to NaCl [27].
The effect of PGRs on PNUE also depended on salinity. At 100 mM NaCl, IAA and SA simultaneously maintained A and PNUE relative to their respective non-saline conditions. At 200 mM, GA3, IAA and SA exhibited PNUE values higher than those of −PGR. These results indicate that, under these treatments, the maintenance of photosynthetic activity was accompanied by higher photosynthetic nitrogen-use efficiency. The response to IAA is consistent with its ability to enhance N utilisation and CO₂ assimilation under salinity [74], whilst the effect of SA is consistent with its role in the coordinated regulation of photosynthesis and N metabolism under saline stress [75]. In −PGR plants, the progressive decrease in total free amino acids (TFAA), particularly at 200 mM NaCl, indicates that salinity did not induce a general accumulation of these compounds in the leaves (Figure 6A). The TFAA content reflects the balance between their synthesis, their release resulting from protein turnover, and their utilisation in the synthesis of proteins, secondary metabolites and other metabolic pathways [76]. Therefore, its positive association with RWC and A suggests that the reduction in TFAA formed part of the coordinated deterioration in water status and photosynthetic activity induced by salinity. A similar reduction was observed in six olive genotypes exposed to 200 mM NaCl [8]. PGRs attenuated this decrease in a salinity intensity-dependent manner: at 100 mM, GA₃ produced the highest TFAA content, whilst SA and SPD also showed values higher than −PGR; at 200 mM, all PGRs increased TFAA compared with −PGR, with a particularly marked response to GA3. The maintenance of free amino acid levels is consistent with greater availability of precursors for the synthesis and turnover of proteins and other metabolites involved in stress acclimatisation.
In −PGR plants, the decrease in TFAA at 100 mM NaCl, together with the increase in proline (Pro), indicates that both parameters responded differently to salinity. The moderate increase in Pro at 100 mM is consistent with its role as a compatible solute and with its contribution to osmotic adjustment and the maintenance of cellular hydration [77]. This increase is in line with previous results obtained in ‘Picual’ plantlets [27]. However, the decrease in Pro at 200 mM indicates that this response did not persist as salinity increased. This pattern differs from the progressive accumulation observed in young ‘Chemlali’ plants exposed to 100 and 200 mM NaCl [14,15], but is consistent with the reduction described in ‘Arbequina’, ‘Koroneiki’, ‘Royal de Cazorla’ and ‘Fadak 86’ [19]. Similarly, Vita et al. [78] did not observe a common response across cultivars, as Pro remained unchanged in three of the four genotypes studied and only increased at 200 mM in ‘Oliana’. In the present study, the decrease in Pro under severe salinity coincided with the greatest reductions in TFAA, RWC and A. The effects of PGRs on Pro also depended on the salinity level. At 100 mM NaCl, GA3 and SPD produced the highest Pro contents, with values significantly higher than those of −PGR (Figure 6B). The increase induced by GA3 is consistent with that observed in the olive cultivars ‘Zard’ and ‘Shiraz’ exposed to low concentrations of NaCl [79]. With SPD, the highest Pro accumulation coincided with an increase in WUE, whilst with GA₃ it was accompanied by the maintenance of photosynthetic pigments and A, in line with the photosynthetic protection described in ‘Chemlali’ and ‘Koroneiki’ [54]. At 200 mM NaCl, IAA produced the highest Pro accumulation, whilst GA3 and SA also maintained higher levels than those of −PGR. The stimulation of Pro by IAA and SA is consistent with results previously obtained in ‘Picual’ plantlets exposed to 100 and 200 mM NaCl [27]. In the case of IAA, this increase formed part of the more integrated physiological response observed under severe salinity, whilst GA3 and SA combined greater Pro accumulation with the maintenance of TFAA and photosynthetic or metabolic protection, respectively. KIN maintained TFAA and WUEi, but exhibited a lower Pro content than −PGR, a pattern consistent with that observed in maize treated with KIN under salinity [80]. SPD maintained TFAA at 200 mM, although its stimulation of Pro was restricted to 100 mM. The role of salicylic acid (SA) and polyamines in osmotic and metabolic adaptation is also supported by recent findings in wheat subjected to water stress, in which foliar application of SA and putrescine enhanced the accumulation of proline, soluble proteins and soluble sugars, while improving leaf water status and photosynthetic rate [72].
In −PGR plants, salinity markedly increased ethylene production in the leaves, which reached similarly high values at 100 and 200 mM NaCl (Figure 6C). This increase is consistent with that previously observed in ‘Picual’ plantlets exposed to 200 mM NaCl [27] and with the response described in Solanum chilense under salinity [81]. In the present study, the elevated ethylene production coincided with the alterations in growth, water status and gas exchange induced by salinity and, at 200 mM NaCl, formed part of the characteristic physiological and biochemical profile of −PGR plants shown in the heatmap (Figure 1, Figure 4 and Figure 10; Table 1). The PGRs modulated ethylene production in a regulator- and salinity-dependent manner. IAA and KIN reduced ethylene in both the absence and presence of NaCl; GA3 reduced it only under salinity; SA shifted from stimulating it in the absence of NaCl to reducing it at 200 mM; and SPD exhibited an inhibitory effect at 0 and 100 mM, but not at 200 mM (Figure 6C; Table S11). This pattern is consistent with that previously observed in ‘Picual’ plantlets, in which ethylene production also depended on the PGR applied and the NaCl concentration [27]. The reduction induced by PGRs should be interpreted as an attenuation of the increase caused by salt stress, without assuming that ethylene plays an exclusively detrimental role, as it is also involved in signalling and acclimatisation to stress. However, high or sustained production may contribute to growth inhibition, leaf senescence and photosynthetic impairment [82]. At 200 mM NaCl, the reduction in ethylene with IAA coincided with the preservation of A, WUE, WUEi and PNUE; with KIN, with higher values of TLA, TSL and WUEi; with GA₃, with the protection of pigments and photosynthetic activity; and with SA, with higher Pro and TFAA contents compared to −PGR. Although ethylene did not show any significant bivariate correlations with the other variables, the heatmap associated its high production in −PGR plants with low values of LDM, TLA, RWC, total chlorophyll, carotenoids, A, gs and E (Figure 10).
The distinct responses of TFAA, Pro and ethylene indicate that PGRs induced specific biochemical adjustments under salinity. Given that ethylene is synthesised from methionine via S-adenosylmethionine, these variations are consistent with a coordinated reorganisation of N metabolism, Pro accumulation and ethylene signalling [83,84,85].
In −PGR plants, GR and GPX activity increased at 100 mM NaCl, whilst at 200 mM, APX, GR and GPX all increased (Figure 7), indicating a broadening of the antioxidant response as salinity intensified. The functional relationship between APX and GR within the ascorbate–glutathione cycle, together with the involvement of GPX in the detoxification of peroxides, allows these changes to be interpreted as a reorganisation of the enzymatic antioxidant system [86]. This response differs from that described in other olive genotypes, in which salinity reduced APX and/or GPX [9,22,87], confirming that the enzymatic response depends on the genotype and the exposure conditions. PGRs modulated the enzymatic antioxidant response in a salinity intensity-dependent manner. At 100 mM NaCl, all treatments increased APX activity compared with the −PGR control, and KIN was the only treatment to simultaneously increase both APX and GR activity, indicating coordinated activation of components of the ascorbate–glutathione cycle. Under severe salinity, IAA was the only treatment that maintained APX activity higher than that of −PGR, whilst SPD was the only treatment that increased GR. These results show that PGRs did not induce a uniform antioxidant response, but rather differentiated strategies depending on the regulator and the intensity of the stress. The general decrease in GPX with PGRs does not necessarily imply reduced antioxidant capacity, as the relative contribution of enzymatic defences may vary between treatments [87].
In addition to antioxidant enzymes, phenolic compounds and flavonoids may contribute to redox control by scavenging free radicals and protecting cellular structures [44]. In −PGR plants, the enzymatic and non-enzymatic responses did not vary in parallel: at 100 mM NaCl, the increase in GR and GPX was not accompanied by increases in phenolic content or antioxidant capacity; at 200 mM, the increase in APX and phenolic compounds indicated a broader antioxidant response. The selective enhancement of DPPH scavenging activity suggests changes in the composition or reactivity of the antioxidants, rather than a general increase in antioxidant capacity. This pattern was reflected in the shift of the −PGR plants at 200 mM NaCl towards positive PC1 values, where APX, GR, GPX, TPC and TFC exhibited positive loadings (Figure 11), and is consistent with the reorganisation of phenolic pathways described in olive trees under salinity [10,24,88]. The PGRs induced distinct non-enzymatic antioxidant profiles. IAA and SA combined the activation of APX with changes in phenolic compounds and radical scavenging capacity, although SA exhibited a response dependent on salinity intensity. These results are consistent with the favourable effects of IAA previously described in ‘Picual’ [27] and with the regulation of secondary metabolites and antioxidant systems attributed to SA under salinity [89,90]. GA3 was primarily associated with the enhancement of the non-enzymatic component, whilst KIN showed that a high TPC content does not necessarily imply a greater radical scavenging capacity. SPD exhibited the most plastic response, with a predominance of TFC and DPPH activity at 100 mM, and of TPC, GR and ABTS⁺ activity at 200 mM. This pattern is consistent with the role of polyamines in regulating antioxidant defences under salinity [88,92]. The differences between the ABTS⁺ and DPPH assays are to be expected, as both assess the reactivity of the extracts against radicals via different reaction mechanisms. Furthermore, TPC and TFC are global measures that do not necessarily reflect the composition, reactivity or antioxidant kinetics of phenolic compounds and flavonoids [93,94].
Overall, the benefits of PGRs in ‘Picual’ were not associated with a single mechanism, but rather with physiological adjustments specific to each regulator, the relevance of which depended on salinity intensity.
5. Conclusions
The benefits conferred by plant growth regulator treatments on ‘Picual’ olive plants depended on salinity intensity. Under moderate salinity, SA produced the most favourable photosynthetic response by maintaining net CO2 assimilation and increasing total biomass and photosynthetic pigments relative to −PGR. The simultaneous stimulation of APX and phenolic compounds indicates that this preservation of photosynthetic activity was accompanied by changes in antioxidant-related traits. At the same salinity level, SPD promoted a different response, characterised by greater biomass allocation to the roots and improved WUE associated with Pro accumulation, demonstrating that the benefits of the treatments could be underpinned by different physiological adjustments. Under severe salinity, IAA combined higher total biomass and leaf area with higher CO2 assimilation relative to −PGR. The increase in total biomass and the maintenance of leaf growth, CO2 assimilation, and water- and nitrogen-use efficiencies were accompanied by the stimulation of APX, higher Pro and high TPC contents, and reduced ethylene production. This coordination shows that the benefit of IAA did not depend on a single response but on the integration of photosynthetic, osmotic, metabolic, and antioxidant adjustments. At this salinity intensity, GA3 primarily enhanced the preservation of the photosynthetic pigment apparatus and photosynthetic activity, whereas the benefits of KIN and SPD were concentrated, respectively, on the maintenance of leaf area and shoot length relative to −PGR and on biomass allocation to the roots. The increase in C50 with all regulators confirmed that the treatments prolonged photosynthetic activity with increasing salinity, with particularly extensive protection provided by IAA and GA3. Consequently, SA was notable for its effectiveness under moderate salinity, whereas IAA combined benefits in biomass, leaf area and photosynthetic performance under severe salinity at the dose tested.
Supplementary Materials
The following supporting information can be downloaded at: https://www.mdpi.com/article/doi/s1, Table S1: Omega-squared (ω²) effect sizes for the effects of growth regulator, salinity, and their interaction on growth, leaf water relations, elemental composition, photosynthetic pigments, photosynthetic performance, and biochemical parameters of one-year-old olive plants; Table S2: Two-way ANOVA results for growth and leaf water-relation parameters; Table S3: One-way ANOVA results for growth and leaf water-relation parameters; Table S4: Two-way ANOVA results for elemental composition and C/N ratio; Table S5: One-way ANOVA results for elemental composition and C/N ratio; Table S6: Two-way ANOVA results for photosynthetic-pigment contents and pigment ratios; Table S7: One-way ANOVA results for photosynthetic-pigment contents and pigment ratios; Table S8: Two-way ANOVA results for leaf gas-exchange and photosynthetic-efficiency parameters; Table S9: One-way ANOVA results for leaf gas-exchange and photosynthetic-efficiency parameters; Table S10: Two-way ANOVA results for total free amino acids, proline, and ethylene production; Table S11: One-way ANOVA results for total free amino acids, proline, and ethylene production; Table S12: Two-way ANOVA results for antioxidant-enzyme activities; Table S13: One-way ANOVA results for antioxidant-enzyme activities; Table S14: Two-way ANOVA results for phenolic and flavonoid contents and non-enzymatic antioxidant capacity; Table S15: One-way ANOVA results for phenolic and flavonoid contents and non-enzymatic antioxidant capacity; Table S16: Eigenvalues, explained variance, and variable loadings for the principal component analysis (PCA).
Author Contributions
For research articles with several authors, a short paragraph specifying their individual contributions must be provided. The following statements should be used “Conceptualization, M.d.P.C. and C.A.; methodology, M.d.P.C. and C.A.; software, M.d.P.C. and C.A.; validation, M.d.P.C. and C.A.; formal analysis, M.d.P.C. and C.A; investigation, M.d.P.C. and C.A; resources, M.d.P.C.; data curation, M.d.P.C. and C.A.; writing—original draft preparation, M.d.P.C. and C.A.; writing—review and editing, M.d.P.C. and C.A.; visualization, M.d.P.C. and C.A.; supervision, M.d.P.C. and C.A.; project administration, M.d.P.C.; funding acquisition, M.d.P.C. All authors have read and agreed to the published version of the manuscript.
Funding
This research was supported by an R&D project of Viveros Jarico S.L., funded by the Junta de Andalucía (grant no. 805, University of Jaén), entitled “Improvement of salinity tolerance in olive by pretreatment with growth regulators”.
Data Availability Statement
The original contributions presented in this study are included in the article and its Supplementary Materials. Further inquiries can be directed to the corresponding author.
Acknowledgments
Technical and human support provided by CICT of Universidad de Jaén (UJA, MINECO, Junta de Andalucía, FEDER) is gratefully acknowledged.
Conflicts of Interest
The authors declare no conflicts of interest.
Abbreviations
The following abbreviations are used in this manuscript:
| A | Net CO₂ assimilation rate |
| A/Ci | Apparent carboxylation efficiency |
| ABTS | 2,2′-Azino-bis(3-ethylbenzothiazoline-6-sulfonic acid) |
| ACC | 1-Aminocyclopropane-1-carboxylic acid |
| APX | Ascorbate peroxidase |
| C/N | Carbon-to-nitrogen ratio |
| C2H4 | Ethylene |
| C50abs | NaCl concentration corresponding to 50 % of −PGR A at 0 mM NaCl |
| C50rel | NaCl concentration corresponding to 50 % of each treatment’s A at 0 mM NaCl |
| Car | Carotenoids |
| CAT | Catalase |
| Chl | Total chlorophyll |
| Chl a | Chlorophyll a |
| Chl b | Chlorophyll b |
| Chl a+b | Total chlorophyll |
| Chl a/b | Chlorophyll a-to-chlorophyll b ratio |
| Chl a+b/Car | Total chlorophyll-to-carotenoids ratio |
| Ci | Intercellular CO₂ concentration |
| DPPH | 2,2-Diphenyl-1-picrylhydrazyl |
| DW | Dry weight |
| E | Transpiration rate |
| FW | Fresh weight |
| GA3 | Gibberellic acid |
| GABA | γ-Aminobutyric acid |
| GPX | Guaiacol peroxidase |
| GR | Glutathione reductase |
| gs | Stomatal conductance |
| IAA | Indole-3-acetic acid |
| IC50 | Half-maximal inhibitory concentration |
| KIN | Kinetin |
| LDM | Leaf dry mass |
| −PGR | Without plant growth regulator |
| PNUE | Photosynthetic nitrogen-use efficiency |
| PPFD | Photosynthetic photon flux density |
| Pro | Proline |
| PVP | Polyvinylpyrrolidone |
| R/S | Root-to-shoot ratio |
| RDW | Root dry weight |
| ROS | Reactive oxygen species |
| RWC | Relative water content |
| SA | Salicylic acid |
| SDW | Stem dry weight |
| SOD | Superoxide dismutase |
| SPD | Spermidine |
| TFAA | Total free amino acids |
| TFC | Total flavonoid content |
| TLA | Total leaf area |
| TPC | Total phenolic content |
| TPDW | Total plant dry weight |
| TSL | Total shoot length |
| TW | Turgid weight |
| WUC | Water uptake capacity |
| WUE | Instantaneous water-use efficiency |
| WUEi | Intrinsic water-use efficiency |
| ω² | Omega-squared effect size |
References
- Mukhopadhyay, R.; Sarkar, B.; Jat, H.S.; Sharma, P.C.; Bolan, N.S. Soil salinity under climate change: Challenges for sus-tainable agriculture and food security. J. Environ. Manag. 2021, 280, 111736. [Google Scholar] [CrossRef] [PubMed]
- Tarolli, P.; Luo, J.; Park, E.; Barcaccia, G.; Masin, R. Soil salinization in agriculture: Mitigation and adaptation strategies combining nature-based solutions and bioengineering. iScience 2024, 27, 108830. [Google Scholar] [CrossRef] [PubMed]
- Romero-Trigueros, C.; Vivaldi, G.A.; Nicolás, E.N.; Paduano, A.; Salcedo, F.P.; Camposeo, S. Ripening indices, olive yield and oil quality in response to irrigation with saline reclaimed water and deficit strategies. Front. Plant Sci. 2019, 10, 1243. [Google Scholar] [CrossRef] [PubMed]
- Munns, R.; Tester, M. Mechanisms of salinity tolerance. Annu. Rev. Plant Biol. 2008, 59, 651–681. [Google Scholar] [CrossRef] [PubMed]
- Deinlein, U.; Stephan, A.B.; Horie, T.; Luo, W.; Xu, G.; Schroeder, J.I. Plant salt-tolerance mechanisms. Trends Plant Sci. 2014, 19, 371–379. [Google Scholar] [CrossRef] [PubMed]
- El Yamani, M.; Cordovilla, M.P. Tolerance mechanisms of olive tree (Olea europaea) under saline conditions. Plants 2024, 13, 2094. [Google Scholar] [CrossRef] [PubMed]
- Al-Absi, K.M. Olive response to salinity: A comprehensive review to causes, mechanisms, and management. Adv. Agric. 2026, 7635682. [Google Scholar] [CrossRef]
- Aparicio, C.; Urrestarazu, M.; Cordovilla, M.d.P. Comparative physiological analysis of salinity effects in six olive genotypes. HortScience 2014, 49, 901–904. [Google Scholar] [CrossRef]
- Boussadia, O.; Zgallai, H.; Mzid, N.; Zaabar, R.; Braham, M.; Doupis, G.; Koubouris, G. Physiological responses of two olive cultivars to salt stress. Plants 2023, 12, 1926. [Google Scholar] [CrossRef] [PubMed]
- Palm, E.R.; Salzano, A.M.; Vergine, M.; Negro, C.; Nissim, W.G.; Sabbatini, L.; Balestrini, R.; de Pinto, M.C.; Fortunato, S.; Gohari, G.; Mancuso, S.; Luvisi, A.; De Bellis, L.; Scaloni, A.; Vita, F. Response to salinity stress in four Olea europaea L. genotypes: A multidisciplinary approach. Environ. Exp. Bot. 2024, 218, 105586. [Google Scholar] [CrossRef]
- Vergine, M.; Palm, E.R.; Salzano, A.M.; Negro, C.; Nissim, W.G.; Sabbatini, L.; Balestrini, R.; de Pinto, M.C.; Dipierro, N.; Gohari, G.; Fotopoulos, V.; Mancuso, S.; Luvisi, A.; De Bellis, L.; Scaloni, A.; Vita, F. Water and nutrient availability modulate the salinity stress response in Olea europaea cv. Arbequina. Plant Stress 2024, 14, 100648. [Google Scholar] [CrossRef]
- Munns, R.; Day, D.A.; Fricke, W.; Watt, M.; Arsova, B.; Barkla, B.J.; Bose, J.; Byrt, C.S.; Chen, Z.-H.; Foster, K.J.; Gilliham, M.; Henderson, S.W.; Jenkins, C.L.D.; Kronzucker, H.J.; Miklavcic, S.J.; Plett, D.; Roy, S.J.; Shabala, S.; Shelden, M.C.; Soole, K.L.; Taylor, N.L.; Tester, M.; Wege, S.; Wegner, L.H.; Tyerman, S.D. Energy costs of salt tolerance in crop plants. New Phytol. 2020, 225, 1072–1090. [Google Scholar] [CrossRef] [PubMed]
- Hayat, S.; Hayat, Q.; Alyemeni, M.N.; Wani, A.S.; Pichtel, J.; Ahmad, A. Role of proline under changing environments: A review. Plant Signal. Behav. 2012, 7, 1456–1466. [Google Scholar] [CrossRef] [PubMed]
- Ben Abdallah, M.; Trupiano, D.; Polzella, A.; De Zio, E.; Sassi, M.; Scaloni, A.; Zarrouk, M.; Ben Youssef, N.; Scippa, G.S. Unraveling physiological, biochemical and molecular mechanisms involved in olive (Olea europaea L. cv. Chétoui) tolerance to drought and salt stresses. J. Plant Physiol. 2018, 220, 83–95. [Google Scholar] [CrossRef] [PubMed]
- Ben Ahmed, C.; Ben Rouina, B.; Boukhris, M. Changes in water relations, photosynthetic activity and proline accumulation in one-year-old olive trees (Olea europaea L. cv. Chemlali) in response to NaCl salinity. Acta Physiol. Plant. 2008, 30, 553–560. [Google Scholar] [CrossRef]
- Ben Ahmed, C.; Ben Rouina, B.; Sensoy, S.; Boukhriss, M.; Abdullah, F.B. Saline water irrigation effects on antioxidant defence system and proline accumulation in leaves and roots of field-grown olive. J. Agric. Food Chem. 2009, 57, 11484–11490. [Google Scholar] [CrossRef] [PubMed]
- Ayaz, M.; Varol, N.; Yolcu, S.; Pelvan, A.; Kaya, Ü.; Aydoğdu, E.; Bor, M.; Ördemir, F.; Türkan, İ. Three (Turkish) olive cultivars display contrasting salt stress-coping mechanisms under high salinity. Trees 2021, 35, 1283–1298. [Google Scholar] [CrossRef]
- Hussain, K.; Fox, J.-P.; Hallman, L.M.; Shahid, M.A.; Rossi, L. Salinity-induced physiological, antioxidative, and enzymatic responses of ‘Oliana’ and ‘Lecciana’ olive tree cultivars. Front. Plant Sci. 2026, 16, 1746013. [Google Scholar] [CrossRef] [PubMed]
- Regni, L.; Del Pino, A.M.; Mousavi, S.; Palmerini, C.A.; Baldoni, L.; Mariotti, R.; Mairech, H.; Gardi, T.; D’Amato, R.; Proietti, P. Behavior of four olive cultivars during salt stress. Front. Plant Sci. 2019, 10, 867. [Google Scholar] [CrossRef] [PubMed]
- Wang, X.; Chen, Z.; Sui, N. Sensitivity and Responses of Chloroplasts to Salt Stress in Plants. Front. Plant Sci. 2024, 15, 1374086. [Google Scholar] [CrossRef] [PubMed]
- Hernández, J.A. Salinity tolerance in plants: Trends and perspectives. Int. J. Mol. Sci. 2019, 20, 2408. [Google Scholar] [CrossRef] [PubMed]
- Del Buono, D.; Regni, L.; Del Pino, A.M.; Bartucca, M.L.; Palmerini, C.A.; Proietti, P. Effects of Megafol on the olive cultivar ‘Arbequina’ grown under severe saline stress in terms of physiological traits, oxidative stress, antioxidant defences, and cytosolic Ca²⁺. Front. Plant Sci. 2021, 11, 603576. [Google Scholar] [CrossRef] [PubMed]
- Takahashi, S.; Badger, M.R. Photoprotection in plants: A new light on photosystem II damage. Trends Plant Sci. 2011, 16, 53–60. [Google Scholar] [CrossRef] [PubMed]
- Petridis, A.; Therios, I.; Samouris, G.; Tananaki, C. Salinity-induced changes in phenolic compounds in leaves and roots of four olive cultivars (Olea europaea L.) and their relationship to antioxidant activity. Environ. Exp. Bot. 2012, 79, 37–43. [Google Scholar] [CrossRef]
- Akhtar, M.T.; Noor, M.; Lin, X.; Lu, Z.; Jin, B. Flavonoids in plant salt stress responses: Biosynthesis, regulation, functions, and signaling networks. Plants 2026, 15, 171. [Google Scholar] [CrossRef] [PubMed]
- Cebrián, G.; Iglesias-Moya, J.; García, A.; Martínez, J.; Romero, J.; Regalado, J.J.; Martínez, C.; Valenzuela, J.L.; Jamilena, M. Involvement of ethylene receptors in the salt tolerance response of Cucurbita pepo. Hortic. Res. 2021, 8, 73. [Google Scholar] [CrossRef] [PubMed]
- Cordovilla, M.P.; Aparicio, C.; Melendo, M.; Bueno, M. Exogenous application of indol-3-acetic acid and salicylic acid improves tolerance to salt stress in olive plantlets (Olea europaea L. cultivar Picual) in growth chamber environments. Agronomy 2023, 13, 647. [Google Scholar] [CrossRef]
- Bueno, M.; Cordovilla, M.d.P. Plant growth regulators application enhance tolerance to salinity and benefit the halophyte Plantago coronopus in saline agriculture. Plants 2021, 10, 1872. [Google Scholar] [CrossRef] [PubMed]
- Vetrano, F.; Moncada, A.; Miceli, A. Use of gibberellic acid to increase the salt tolerance of leaf lettuce and rocket grown in a floating system. Agronomy 2020, 10, 505. [Google Scholar] [CrossRef]
- Sreekanth, D.; Singh, C.; Yadav, M.K.; Singh, T.; Kuwardadra, S.I.; Pawar, D.V. Phytohormones and plant growth regulators as sustainable modulators of salinity stress tolerance in major crops: Mechanistic insights and environmental perspectives. Plant Stress 2026, 21, 101421. [Google Scholar] [CrossRef]
- Hoagland, D.R.; Arnon, D.I. The water-culture method for growing plants without soil. In California Agricultural Experiment Station, Circular 347, Revised ed.; University of California, College of Agriculture: Berkeley, CA, USA, 1950; Available online: https://archive.org/details/watercultureme3450hoag (accessed on 5 September 2026).
- Chakrabarti, N.; Mukherji, S. Alleviation of NaCl stress by pretreatment with phytohormones in Vigna radiata. Biol. Plant. 2003, 46, 589–594. [Google Scholar] [CrossRef]
- Ma, Y.; Wang, Z.; Zhou, B.; Yang, W.; Wang, Y. Salicylic acid improving salinity tolerance by enhancing photosynthetic capacity, osmotic adjustment and maintenance of Na⁺/K⁺ homeostasis in faba bean seedlings. Chem. Biol. Technol. Agric. 2025, 12, 89. [Google Scholar] [CrossRef]
- Shokri, G.; Amiri, J.; Barin, M. Spermidine mitigates salt stress in grapevine with alterations in physicochemical properties and nutrient composition. J. Plant Nutr. Soil Sci. 2024, 187, 516–532. [Google Scholar] [CrossRef]
- Alnusaire, T.S. Application of γ-aminobutyric acid alleviates salinity-mediated growth decline and oxidative damage by increasing proline and antioxidant functioning in olive (Olea europaea L.). Front. Plant Sci. 2026, 16, 1737858. [Google Scholar] [CrossRef] [PubMed]
- Mahmud, A.-A.; Hossain, M.M.; Karim, M.A.; Mian, M.A.K.; Zakaria, M.; Kadian, M.S. Plant water relations and canopy temperature depression for assessing water stress tolerance of potato. Indian J. Plant Physiol. 2016, 21, 56–63. [Google Scholar] [CrossRef]
- Ben Hassena, A.; Trabelsi, L.; Zouari, M.; Decou, R.; Triki, M.A.; Khabou, W.; Labrousse, P.; Zouari, N. Effect of treated wastewater irrigation and mycorrhizal inoculation on Olea europaea: Physiological, anatomical and morphological responses. J. Agric. Food Res. 2025, 21, 101967. [Google Scholar] [CrossRef]
- Wellburn, A.R. The spectral determination of chlorophylls a and b, as well as total carotenoids, using various solvents with spectrophotometers of different resolution. J. Plant Physiol. 1994, 144, 307–313. [Google Scholar] [CrossRef]
- Farias, F.d.S.; da Costa Neto, V.P.; Souza, C.C.d.S.; Chaves, D.V.; Bonifácio, A. Differential metabolic rearrangements improve biomass and enhance the tolerance of two dwarf cashew (Anacardium occidentale L.) genotypes to salt stress. AIMS Mol. Sci. 2024, 11, 206–220. [Google Scholar] [CrossRef]
- Bates, L.S.; Waldren, R.P.; Teare, I.D. Rapid determination of free proline for water-stress studies. Plant Soil 1973, 39, 205–207. [Google Scholar] [CrossRef]
- Zapata, P.J.; Serrano, M.; García-Legaz, M.F.; Pretel, M.T.; Botella, M.A. Short term effect of salt shock on ethylene and polyamines depends on plant salt sensitivity. Front. Plant Sci. 2017, 8, 855. [Google Scholar] [CrossRef] [PubMed]
- Agarwal, S.; Sairam, R.K.; Srivastava, G.C.; Tyagi, A.; Meena, R.C. Role of ABA, salicylic acid, calcium and hydrogen peroxide on antioxidant enzymes induction in wheat seedlings. Plant Sci. 2005, 169, 559–570. [Google Scholar] [CrossRef]
- Anee, T.I.; Rachman, R.R.; Ziqi, Z.; Suzuki, N. A combination of salt stress and waterlogging provides protection to tomato plants against the negative effects of waterlogging individually applied. Physiol. Plant. 2025, 177, e70116. [Google Scholar] [CrossRef] [PubMed]
- Kiani, R.; Arzani, A.; Mirmohammady Maibody, S.A.M. Polyphenols, flavonoids, and antioxidant activity involved in salt tolerance in wheat, Aegilops cylindrica and their amphidiploids. Front. Plant Sci. 2021, 12, 646221. [Google Scholar] [CrossRef] [PubMed]
- Pungin, A.; Lartseva, L.; Loskutnikova, V.; Shakhov, V.; Popova, E.; Skrypnik, L.; Krol, O. Effect of salinity stress on phenolic compounds and antioxidant activity in halophytes Spergularia marina (L.) Griseb. and Glaux maritima L. cultured in vitro. Plants 2023, 12, 1905. [Google Scholar] [CrossRef] [PubMed]
- Benjamini, Y.; Hochberg, Y. Controlling the false discovery rate: A practical and powerful approach to multiple testing. J. R. Stat. Soc. Ser. B Methodol. 1995, 57, 289–300. [Google Scholar] [CrossRef]
- Methenni, K.; Ben Abdallah, M.; Nouairi, I.; Smaoui, A.; Ben Ammar, W.; Zarrouk, M.; Ben Youssef, N. Salicylic acid and calcium pretreatments alleviate the toxic effect of salinity in the Oueslati olive variety. Sci. Hortic. 2018, 233, 349–358. [Google Scholar] [CrossRef]
- Zahedi, S.M.; Hosseini, M.S.; Fahadi Hoveizeh, N.; Gholami, R.; Abdelrahman, M.; Tran, L.S.P. Exogenous melatonin mitigates salinity-induced damage in olive seedlings by modulating ion homeostasis, antioxidant defence, and phytohormone balance. Physiol. Plant. 2021, 173, 1682–1694. [Google Scholar] [CrossRef] [PubMed]
- Elloumi, O.; Regaieg, I.; Lehiani, M.A.; Ben Amar, F.; Chaari, A. Salt tolerance of new olive varieties issued from a Tunisian breeding crosses. J. New Sci. Agric. Biotechnol. 2016, IABC(15), 1303–1311. Available online: https://www.jnsciences.org/agri-biotech/41-volume-special-conference-iabc-2015/214-salt-tolerance-of-new-olive-varieties-issued-from-a-tunisian-breeding-crosses.html (accessed on 5 September 2026).
- Elloumi, O.; Ben Amar, F.; Trigui, A.; Gargouri, K.; Ghrab, M. Early evaluation of salt-stress tolerance of new released olive cultivars based on physiological and biomass allocation indicators. J. Agric. Food Res. 2024, 18, 101503. [Google Scholar] [CrossRef]
- Shelden, M.C.; Munns, R. Crop root system plasticity for improved yields in saline soils. Front. Plant Sci. 2023, 14, 1120583. [Google Scholar] [CrossRef] [PubMed]
- Tadić, J.; Dumičić, G.; Veršić Bratinčević, M.; Vitko, S.; Liber, Z.; Radić Brkanac, S. Comparative analysis of cultivated and wild olive genotypes to salinity and drought stress. Front. Plant Sci. 2024, 15, 1423761. [Google Scholar] [CrossRef] [PubMed]
- Zhang, Z.; Cao, G.; Yang, L.; Sun, Y.; Li, G.; Li, N. Effects of foliar-applied PAA@Mn₃O₄ nanoparticles, methyl jasmonate, and γ-aminobutyric acid on growth and yield performance of sugar beet (Beta vulgaris L.) under salt-affected conditions. Plants 2026, 15, 2729. [Google Scholar] [CrossRef] [PubMed]
- Moula, I.; Boussadia, O.; Koubouris, G.; Ben Hassine, M.; Boussetta, W.; Van Labeke, M.-C.; Braham, M. Ecophysiological and biochemical aspects of olive tree (Olea europaea L.) in response to salt stress and gibberellic acid-induced alleviation. S. Afr. J. Bot. 2020, 132, 38–44. [Google Scholar] [CrossRef]
- Lu, Y.; Fricke, W. Salt stress—Regulation of root water uptake in a whole-plant and diurnal context. Int. J. Mol. Sci. 2023, 24, 8070. [Google Scholar] [CrossRef] [PubMed]
- Melino, V.; Tester, M. Salt-tolerant crops: Time to deliver. Annu. Rev. Plant Biol. 2023, 74, 671–696. [Google Scholar] [CrossRef] [PubMed]
- Nazir, F.; Mahajan, M.; Khatoon, S.; Albaqami, M.; Ashfaque, F.; Chhillar, H.; Chopra, P.; Khan, M.I.R. Sustaining nitrogen dynamics: A critical aspect for improving salt tolerance in plants. Front. Plant Sci. 2023, 14, 1087946. [Google Scholar] [CrossRef] [PubMed]
- Du, B.; Winkler, J.B.; Ache, P.; White, P.J.; Dannenmann, M.; Alfarraj, S.; Albasher, G.; Schnitzler, J.-P.; Hedrich, R.; Rennenberg, H. Differences of nitrogen metabolism in date palm (Phoenix dactylifera) seedlings subjected to water deprivation and salt exposure. Tree Physiol. 2023, 43, 587–596. [Google Scholar] [CrossRef] [PubMed]
- Hussain, T.; Asrar, H.; Zhang, W.; Liu, X. The combination of salt and drought benefits selective ion absorption and nutrient use efficiency of halophyte Panicum antidotale. Front. Plant Sci. 2023, 14, 1091292. [Google Scholar] [CrossRef] [PubMed]
- Bashir, M.A.; Silvestri, C.; Coppa, E.; Brunori, E.; Cristofori, V.; Rugini, E.; Ahmad, T.; Hafiz, I.A.; Abbasi, N.A.; Nawaz Shah, M.K.; Astolfi, S. Response of Olive Shoots to Salinity Stress Suggests the Involvement of Sulfur Metabolism. Plants 2021, 10, 350. [Google Scholar] [CrossRef] [PubMed]
- Nguyen, A.T.; Tran, L.H.; Jung, S. Salt Stress-Induced Modulation of Porphyrin Biosynthesis, Photoprotection, and Antioxidant Properties in Rice Plants (Oryza sativa). Antioxidants 2023, 12, 1618. [Google Scholar] [CrossRef] [PubMed]
- Zhou, Y.; Feng, C.; Wang, Y.; Yun, C.; Zou, X.; Cheng, N.; Zhang, W.; Jing, Y.; Li, H. Understanding of plant salt tolerance mechanisms and application to molecular breeding. Int. J. Mol. Sci. 2024, 25, 10940. [Google Scholar] [CrossRef] [PubMed]
- Pan, Y.; Li, H.; Liu, T.; Qu, J.; Song, X. Photosynthetic performance in mangrove species under salt stress: Mesophyll conductance as a key limitation. Tree Physiol. 2026, 46, tpaf145. [Google Scholar] [CrossRef] [PubMed]
- Loreto, F.; Centritto, M.; Chartzoulakis, K. Photosynthetic limitations in olive cultivars with different sensitivity to salt stress. Plant Cell Environ. 2003, 26, 595–601. [Google Scholar] [CrossRef]
- Wang, Z.; Dong, S.; Teng, K.; Chang, Z.; Zhang, X. Exogenous salicylic acid optimizes photosynthesis, antioxidant metabolism, and gene expression in perennial ryegrass subjected to salt stress. Agronomy 2022, 12, 1920. [Google Scholar] [CrossRef]
- Mendonça, A.J.T.; Lima, G.S.d.; Soares, L.A.d.A.; Oliveira, V.K.N.; Gheyi, H.R.; Silva, L.d.A.; Almeida, F.A.d.; Fernandes, P.D. Gas exchange, photosynthetic pigments, and growth of hydroponic okra under salt stress and salicylic acid. Rev. Bras. Eng. Agríc. Ambient. 2023, 27, 673–681. [Google Scholar] [CrossRef]
- Ismail, H.; Ahsan, M.; Sajid, M.; Memon, Z.-N.; Naeem, M.; Khan, J.A.; Jamal, A.; Sahito, Z.A.; Althobaiti, F.; Ahmed, A.F. Exogenous salicylic acid supplementation enhances cadmium-induced oxidative stress tolerance by regulating nutrient metabolism, photosynthetic traits, and growth in Zinnia elegans. Russ. J. Plant Physiol. 2026, 73, 234. [Google Scholar] [CrossRef]
- Abdel Latef, A.A.H.; Akter, A.; Tahjib-Ul-Arif, M. Foliar application of auxin or cytokinin can confer salinity stress tolerance in Vicia faba L. Agronomy 2021, 11, 790. [Google Scholar] [CrossRef]
- Abdel Latef, A.A.H.; Tahjib-Ul-Arif, M.; Rhaman, M.S. Exogenous auxin-mediated salt stress alleviation in faba bean (Vicia faba L.). Agronomy 2021, 11, 547. [Google Scholar] [CrossRef]
- Tripathi, J.M.; Khan, B.R.; Gaur, R.; Yadav, D.; Verma, K.K.; Gupta, R. Gibberellic acid improves photosynthetic electron transport and stomatal function in crops that are adversely affected by salinity exposure. Plants 2025, 14, 3388. [Google Scholar] [CrossRef] [PubMed]
- Santos Filho, F.B.d.; Silva, T.I.d.; Dias, M.G.; Grossi, J.A.S. Polyamines mitigate the harmful effects of salt stress on the growth and gas exchange of nasturtium. Cienc. Agrotecnol. 2022, 46, e000722. [Google Scholar] [CrossRef]
- Sattar, A.; El-Mogy, M.M.; Mahmoud, H.; El-Beltagi, H.S.; Hamed, L.M.M.; Rasheed, U.; Sher, A.; Ijaz, M. Exogenously applied salicylic acid and putrescine enhanced terminal drought tolerance in wheat via modulation in photosynthetic pigments, antioxidants defence mechanism and accumulation osmo-metabolites. Russ. J. Plant Physiol. 2026, 73, 244. [Google Scholar] [CrossRef]
- DiCara, C.; Gedan, K. Distinguishing the effects of stress intensity and stress duration in plant responses to salinity. Plants 2023, 12, 2522. [Google Scholar] [CrossRef] [PubMed]
- Shaaban, A.; Saudy, H.S.; Eid, M.A.M.; Zahran, S.F.; Mekdad, A.A.A. Synergistic effect of indole-3-acetic acid and nitrogen on yield, sugar profile, and nitrogen utilization of salt-stressed sugar beet crop. BMC Plant Biol. 2025, 25, 632. [Google Scholar] [CrossRef] [PubMed]
- Yang, H.; Fang, R.; Luo, L.; Yang, W.; Huang, Q.; Yang, C.; Hui, W.; Gong, W.; Wang, J. Uncovering the mechanisms of salicylic acid-mediated abiotic stress tolerance in horticultural crops. Front. Plant Sci. 2023, 14, 1226041. [Google Scholar] [CrossRef] [PubMed]
- Batista-Silva, W.; Heinemann, B.; Rugen, N.; Nunes-Nesi, A.; Araújo, W.L.; Braun, H.-P.; Hildebrandt, T.M. The role of amino acid metabolism during abiotic stress release. Plant Cell Environ. 2019, 42, 1630–1644. [Google Scholar] [CrossRef] [PubMed]
- Carillo, P.; Mastrolonardo, G.; Nacca, F.; Parisi, D.; Verlotta, A.; Fuggi, A. Nitrogen metabolism in durum wheat under salinity: Accumulation of proline and glycine betaine. Funct. Plant Biol. 2008, 35, 412–426. [Google Scholar] [CrossRef] [PubMed]
- Vita, F.; Sabbatini, L.; Sillo, F.; Ghignone, S.; Vergine, M.; Guidi Nissim, W.; Fortunato, S.; Salzano, A.M.; Scaloni, A.; Luvisi, A.; Balestrini, R.; De Bellis, L.; Mancuso, S. Salt stress in olive tree shapes resident endophytic microbiota. Front. Plant Sci. 2022, 13, 992395. [Google Scholar] [CrossRef] [PubMed]
- Shekafandeh, A.; Sirooeenejad, S.; Alsmoushtaghi, E. Influence of gibberellin on increasing of sodium chloride tolerance via some morpho-physiological changes in two olive cultivars. Agric. Conspec. Sci. 2017, 82, 367–373. Available online: https://hrcak.srce.hr/193532 (accessed on 5 September 2026).
- Kaya, C.; Tuna, A.L.; Okant, A.M. Effect of foliar-applied kinetin and indoleacetic acid on maize plants grown under saline conditions. Turk. J. Agric. For. 2010, 34, 529–538. [Google Scholar] [CrossRef]
- Gharbi, E.; Martínez, J.-P.; Benahmed, H.; Fauconnier, M.-L.; Lutts, S.; Quinet, M. Salicylic acid differently impacts ethylene and polyamine synthesis in the glycophyte Solanum lycopersicum and the wild-related halophyte Solanum chilense exposed to mild salt stress. Physiol. Plant. 2016, 158, 152–167. [Google Scholar] [CrossRef] [PubMed]
- Chen, G.; Amoanimaa-Dede, H.; Zeng, F.; Deng, F.; Xu, S.; Chen, Z.-H. Stomatal regulation and adaptation to salinity in glycophytes and halophytes. Adv. Bot. Res. 2022, 103, 1–42. [Google Scholar] [CrossRef]
- Iqbal, N.; Umar, S.; Khan, N.A. Nitrogen availability regulates proline and ethylene production and alleviates salinity stress in mustard (Brassica juncea). J. Plant Physiol. 2015, 178, 84–91. [Google Scholar] [CrossRef] [PubMed]
- Singh, P.; Choudhary, K.K.; Chaudhary, N.; Gupta, S.; Sahu, M.; Tejaswini, B.; Sarkar, S. Salt stress resilience in plants mediated through osmolyte accumulation and its crosstalk mechanism with phytohormones. Front. Plant Sci. 2022, 13, 1006617. [Google Scholar] [CrossRef] [PubMed]
- Zhang, X.; Sun, J.; Dong, C.H. Molecular regulations of ethylene signaling in plant salt stress responses. Plant Stress 2024, 14, 100583. [Google Scholar] [CrossRef]
- Li, S. Novel insight into functions of ascorbate peroxidase in higher plants: More than a simple antioxidant enzyme. Redox Biol. 2023, 64, 102789. [Google Scholar] [CrossRef] [PubMed]
- Tadić, J.; Dumičić, G.; Veršić Bratinčević, M.; Vitko, S.; Radić Brkanac, S. Physiological and biochemical response of wild olive (Olea europaea subsp. europaea var. sylvestris) to salinity. Front. Plant Sci. 2021, 12, 712005. [Google Scholar] [CrossRef] [PubMed]
- Skodra, C.; Michailidis, M.; Dasenaki, M.E.; Ganopoulos, I.; Thomaidis, N.S.; Tanou, G.; Molassiotis, A. Unraveling salt-responsive tissue-specific metabolic pathways in olive tree. Physiol. Plant. 2021, 173, 1643–1656. [Google Scholar] [CrossRef] [PubMed]
- Torun, H.; Novák, O.; Mikulík, J.; Strnad, M.; Ayaz, F.A. The effects of exogenous salicylic acid on endogenous phytohormone status in Hordeum vulgare L. under salt stress. Plants 2022, 11, 618. [Google Scholar] [CrossRef] [PubMed]
- Rajabi Dehnavi, A.; Zahedi, M.; Ludwiczak, A.; Piernik, A. Foliar application of salicylic acid improves salt tolerance of sorghum (Sorghum bicolor (L.) Moench). Plants 2022, 11, 368. [Google Scholar] [CrossRef] [PubMed]
- El Sayed, A.I.; Mohamed, A.H.; Rafudeen, M.S.; Omar, A.A.; Awad, M.F.; Mansour, E. Polyamines mitigate the destructive impacts of salinity stress by enhancing photosynthetic capacity, antioxidant defence system and upregulation of Calvin cycle-related genes in rapeseed (Brassica napus L.). Saudi J. Biol. Sci. 2022, 29, 3675–3686. [Google Scholar] [CrossRef] [PubMed]
- Hai, X.; Mi, J.; Zhao, B.; Zhang, B.; Zhao, Z.; Liu, J. Foliar application of spermidine reduced the negative effects of salt stress on oat seedlings. Front. Plant Sci. 2022, 13, 846280. [Google Scholar] [CrossRef] [PubMed]
- Knez, E.; Kadac-Czapska, K.; Grembecka, M. Evaluation of spectrophotometric methods for assessing antioxidant potential in plant food samples—A critical approach. Appl. Sci. 2025, 15, 5925. [Google Scholar] [CrossRef]
- Suhag, R.; Razem, M.; Bolchini, S.; Tenuta, M.C.; Ferrentino, G. Mapping antioxidant mechanisms in plant extracts via reactivity kinetics inhibiting oil autoxidation. Appl. Food Res. 2025, 5, 101476. [Google Scholar] [CrossRef]
Figure 1.
Effects of treatments with plant growth regulators (PGRs) and salinity (0, 100 and 200 mM NaCl) on the accumulation and distribution of dry matter in one-year-old olive trees. The stacked bars represent root dry weight (RDW), stem dry weight (SDW) and leaf dry mass (LDM), whilst the red line represents total plant dry weight (TPDW). Values are means ± standard error (SE; n = 6). Letters within each coloured segment correspond to the respective plant organ, whilst those above the red line correspond to TPDW. Different lower-case letters indicate significant differences between PGR treatments within the same NaCl concentration, whilst different upper-case letters indicate significant differences between NaCl concentrations within the same PGR treatment, according to Tukey’s test (p < 0.05). Abbreviations: −PGR, without plant growth regulator; GA3, gibberellic acid; IAA, indole-3-acetic acid; SA, salicylic acid; KIN, kinetin; SPD, spermidine.
Figure 1.
Effects of treatments with plant growth regulators (PGRs) and salinity (0, 100 and 200 mM NaCl) on the accumulation and distribution of dry matter in one-year-old olive trees. The stacked bars represent root dry weight (RDW), stem dry weight (SDW) and leaf dry mass (LDM), whilst the red line represents total plant dry weight (TPDW). Values are means ± standard error (SE; n = 6). Letters within each coloured segment correspond to the respective plant organ, whilst those above the red line correspond to TPDW. Different lower-case letters indicate significant differences between PGR treatments within the same NaCl concentration, whilst different upper-case letters indicate significant differences between NaCl concentrations within the same PGR treatment, according to Tukey’s test (p < 0.05). Abbreviations: −PGR, without plant growth regulator; GA3, gibberellic acid; IAA, indole-3-acetic acid; SA, salicylic acid; KIN, kinetin; SPD, spermidine.
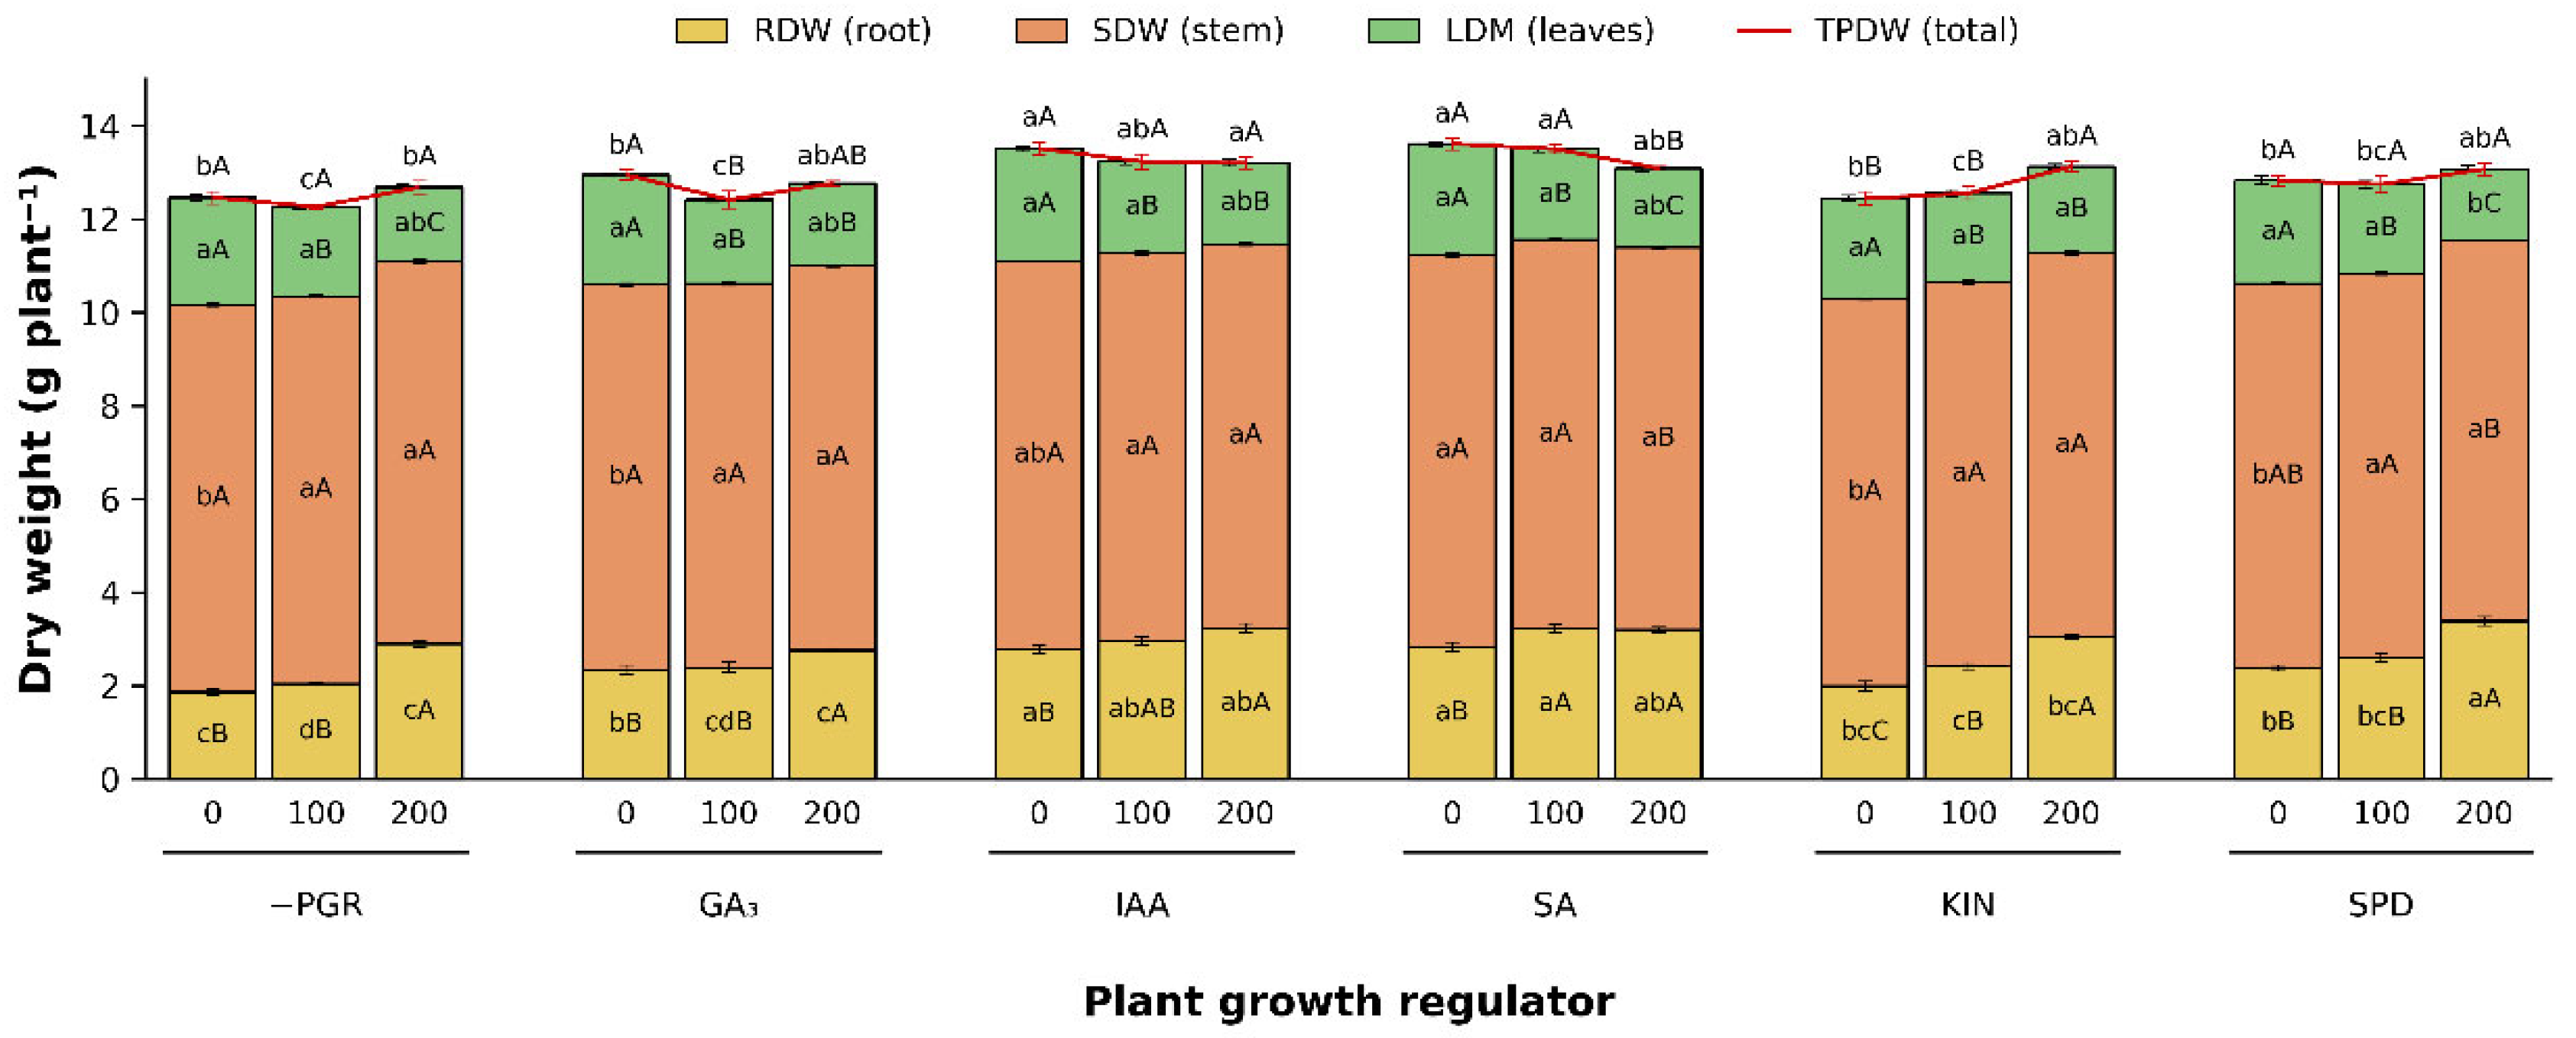
Figure 2.
Effects of plant growth regulator (PGR) treatments and salinity (0, 100, and 200 mM NaCl) on chlorophyll contents in leaves of one-year-old olive plants. Stacked bars represent chlorophyll a (Chl a) and chlorophyll b (Chl b), whereas the red line represents total chlorophyll (Chl a+b). Values are means ± standard error (SE; n = 4). Letters within each coloured segment correspond to the respective chlorophyll fraction, whereas those above the red line correspond to total chlorophyll. Different lowercase letters indicate significant differences among PGR treatments within the same NaCl concentration, whereas different uppercase letters indicate significant differences among NaCl concentrations within the same PGR treatment, according to Tukey’s test (p < 0.05). Abbreviations: Chl a, chlorophyll a; Chl b, chlorophyll b; Chl a+b, total chlorophyll; DW, dry weight; −PGR, without plant growth regulator; GA3, gibberellic acid; IAA, indole-3-acetic acid; SA, salicylic acid; KIN, kinetin; SPD, spermidine.
Figure 2.
Effects of plant growth regulator (PGR) treatments and salinity (0, 100, and 200 mM NaCl) on chlorophyll contents in leaves of one-year-old olive plants. Stacked bars represent chlorophyll a (Chl a) and chlorophyll b (Chl b), whereas the red line represents total chlorophyll (Chl a+b). Values are means ± standard error (SE; n = 4). Letters within each coloured segment correspond to the respective chlorophyll fraction, whereas those above the red line correspond to total chlorophyll. Different lowercase letters indicate significant differences among PGR treatments within the same NaCl concentration, whereas different uppercase letters indicate significant differences among NaCl concentrations within the same PGR treatment, according to Tukey’s test (p < 0.05). Abbreviations: Chl a, chlorophyll a; Chl b, chlorophyll b; Chl a+b, total chlorophyll; DW, dry weight; −PGR, without plant growth regulator; GA3, gibberellic acid; IAA, indole-3-acetic acid; SA, salicylic acid; KIN, kinetin; SPD, spermidine.
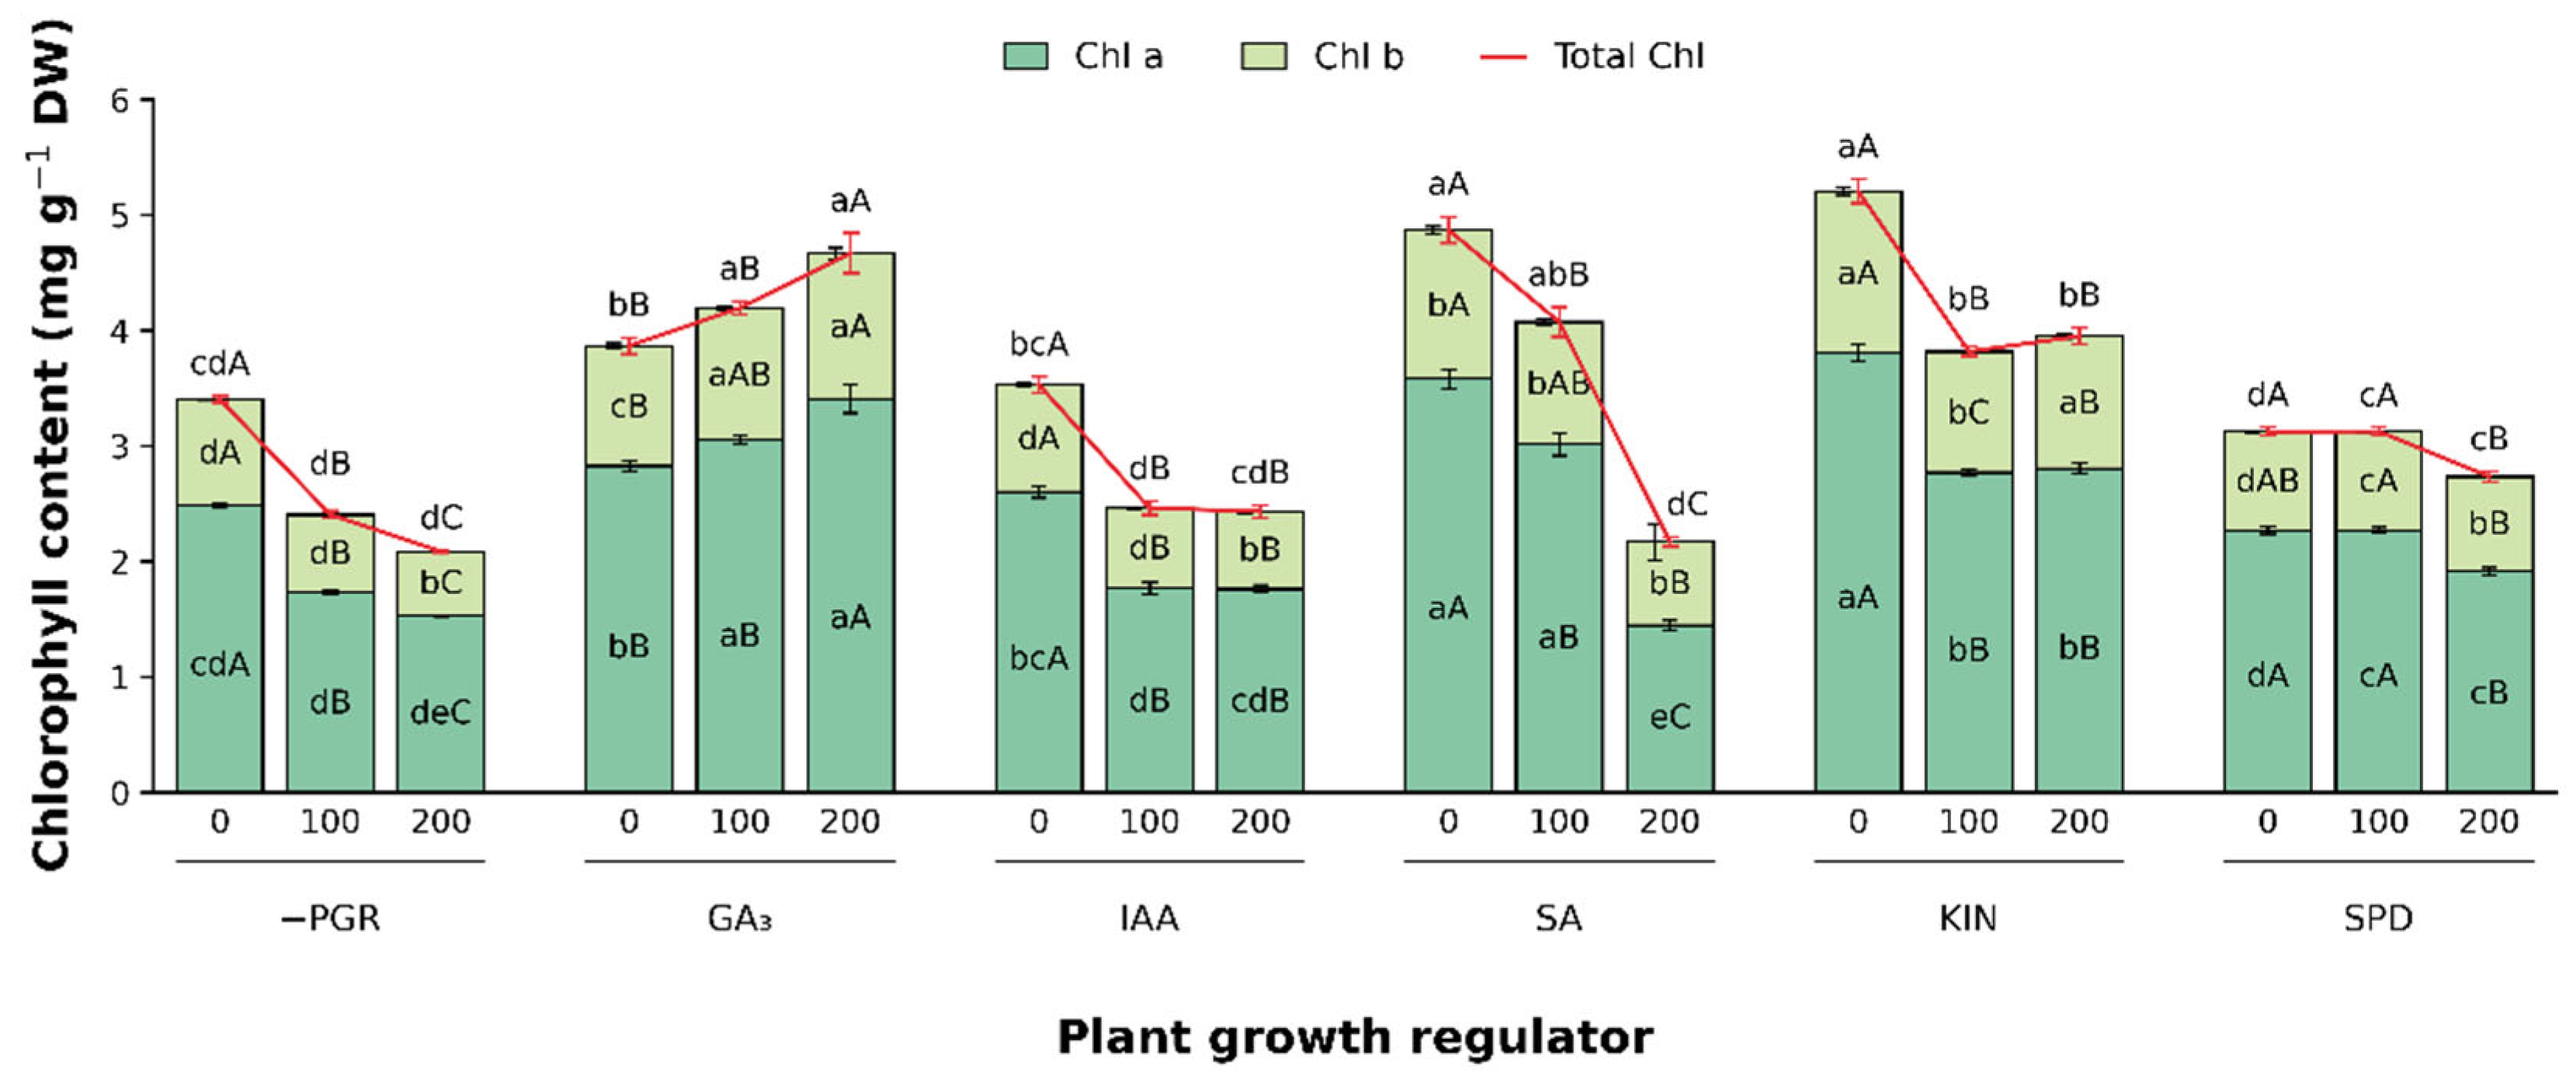
Figure 3.
Effects of plant growth regulator (PGR) treatments and salinity (NaCl: 0, 100, and 200 mM) on carotenoid content in leaves of one-year-old olive plants. Values represent means ± standard error (SE; n = 4). Different lowercase letters indicate significant differences among PGR treatments within the same NaCl concentration, whereas different uppercase letters indicate significant differences among NaCl concentrations within the same PGR treatment, according to Tukey’s test (p < 0.05). The lower panel shows the percentage change at 100 mM NaCl (red circles) and 200 mM NaCl (blue squares) relative to the absolute control (−PGR at 0 mM NaCl). Positive and negative values indicate increases and decreases relative to the absolute control, respectively. Abbreviations: DW, dry weight; −PGR, without plant growth regulator; GA3, gibberellic acid; IAA, indole-3-acetic acid; SA, salicylic acid; KIN, kinetin; SPD, spermidine.
Figure 3.
Effects of plant growth regulator (PGR) treatments and salinity (NaCl: 0, 100, and 200 mM) on carotenoid content in leaves of one-year-old olive plants. Values represent means ± standard error (SE; n = 4). Different lowercase letters indicate significant differences among PGR treatments within the same NaCl concentration, whereas different uppercase letters indicate significant differences among NaCl concentrations within the same PGR treatment, according to Tukey’s test (p < 0.05). The lower panel shows the percentage change at 100 mM NaCl (red circles) and 200 mM NaCl (blue squares) relative to the absolute control (−PGR at 0 mM NaCl). Positive and negative values indicate increases and decreases relative to the absolute control, respectively. Abbreviations: DW, dry weight; −PGR, without plant growth regulator; GA3, gibberellic acid; IAA, indole-3-acetic acid; SA, salicylic acid; KIN, kinetin; SPD, spermidine.
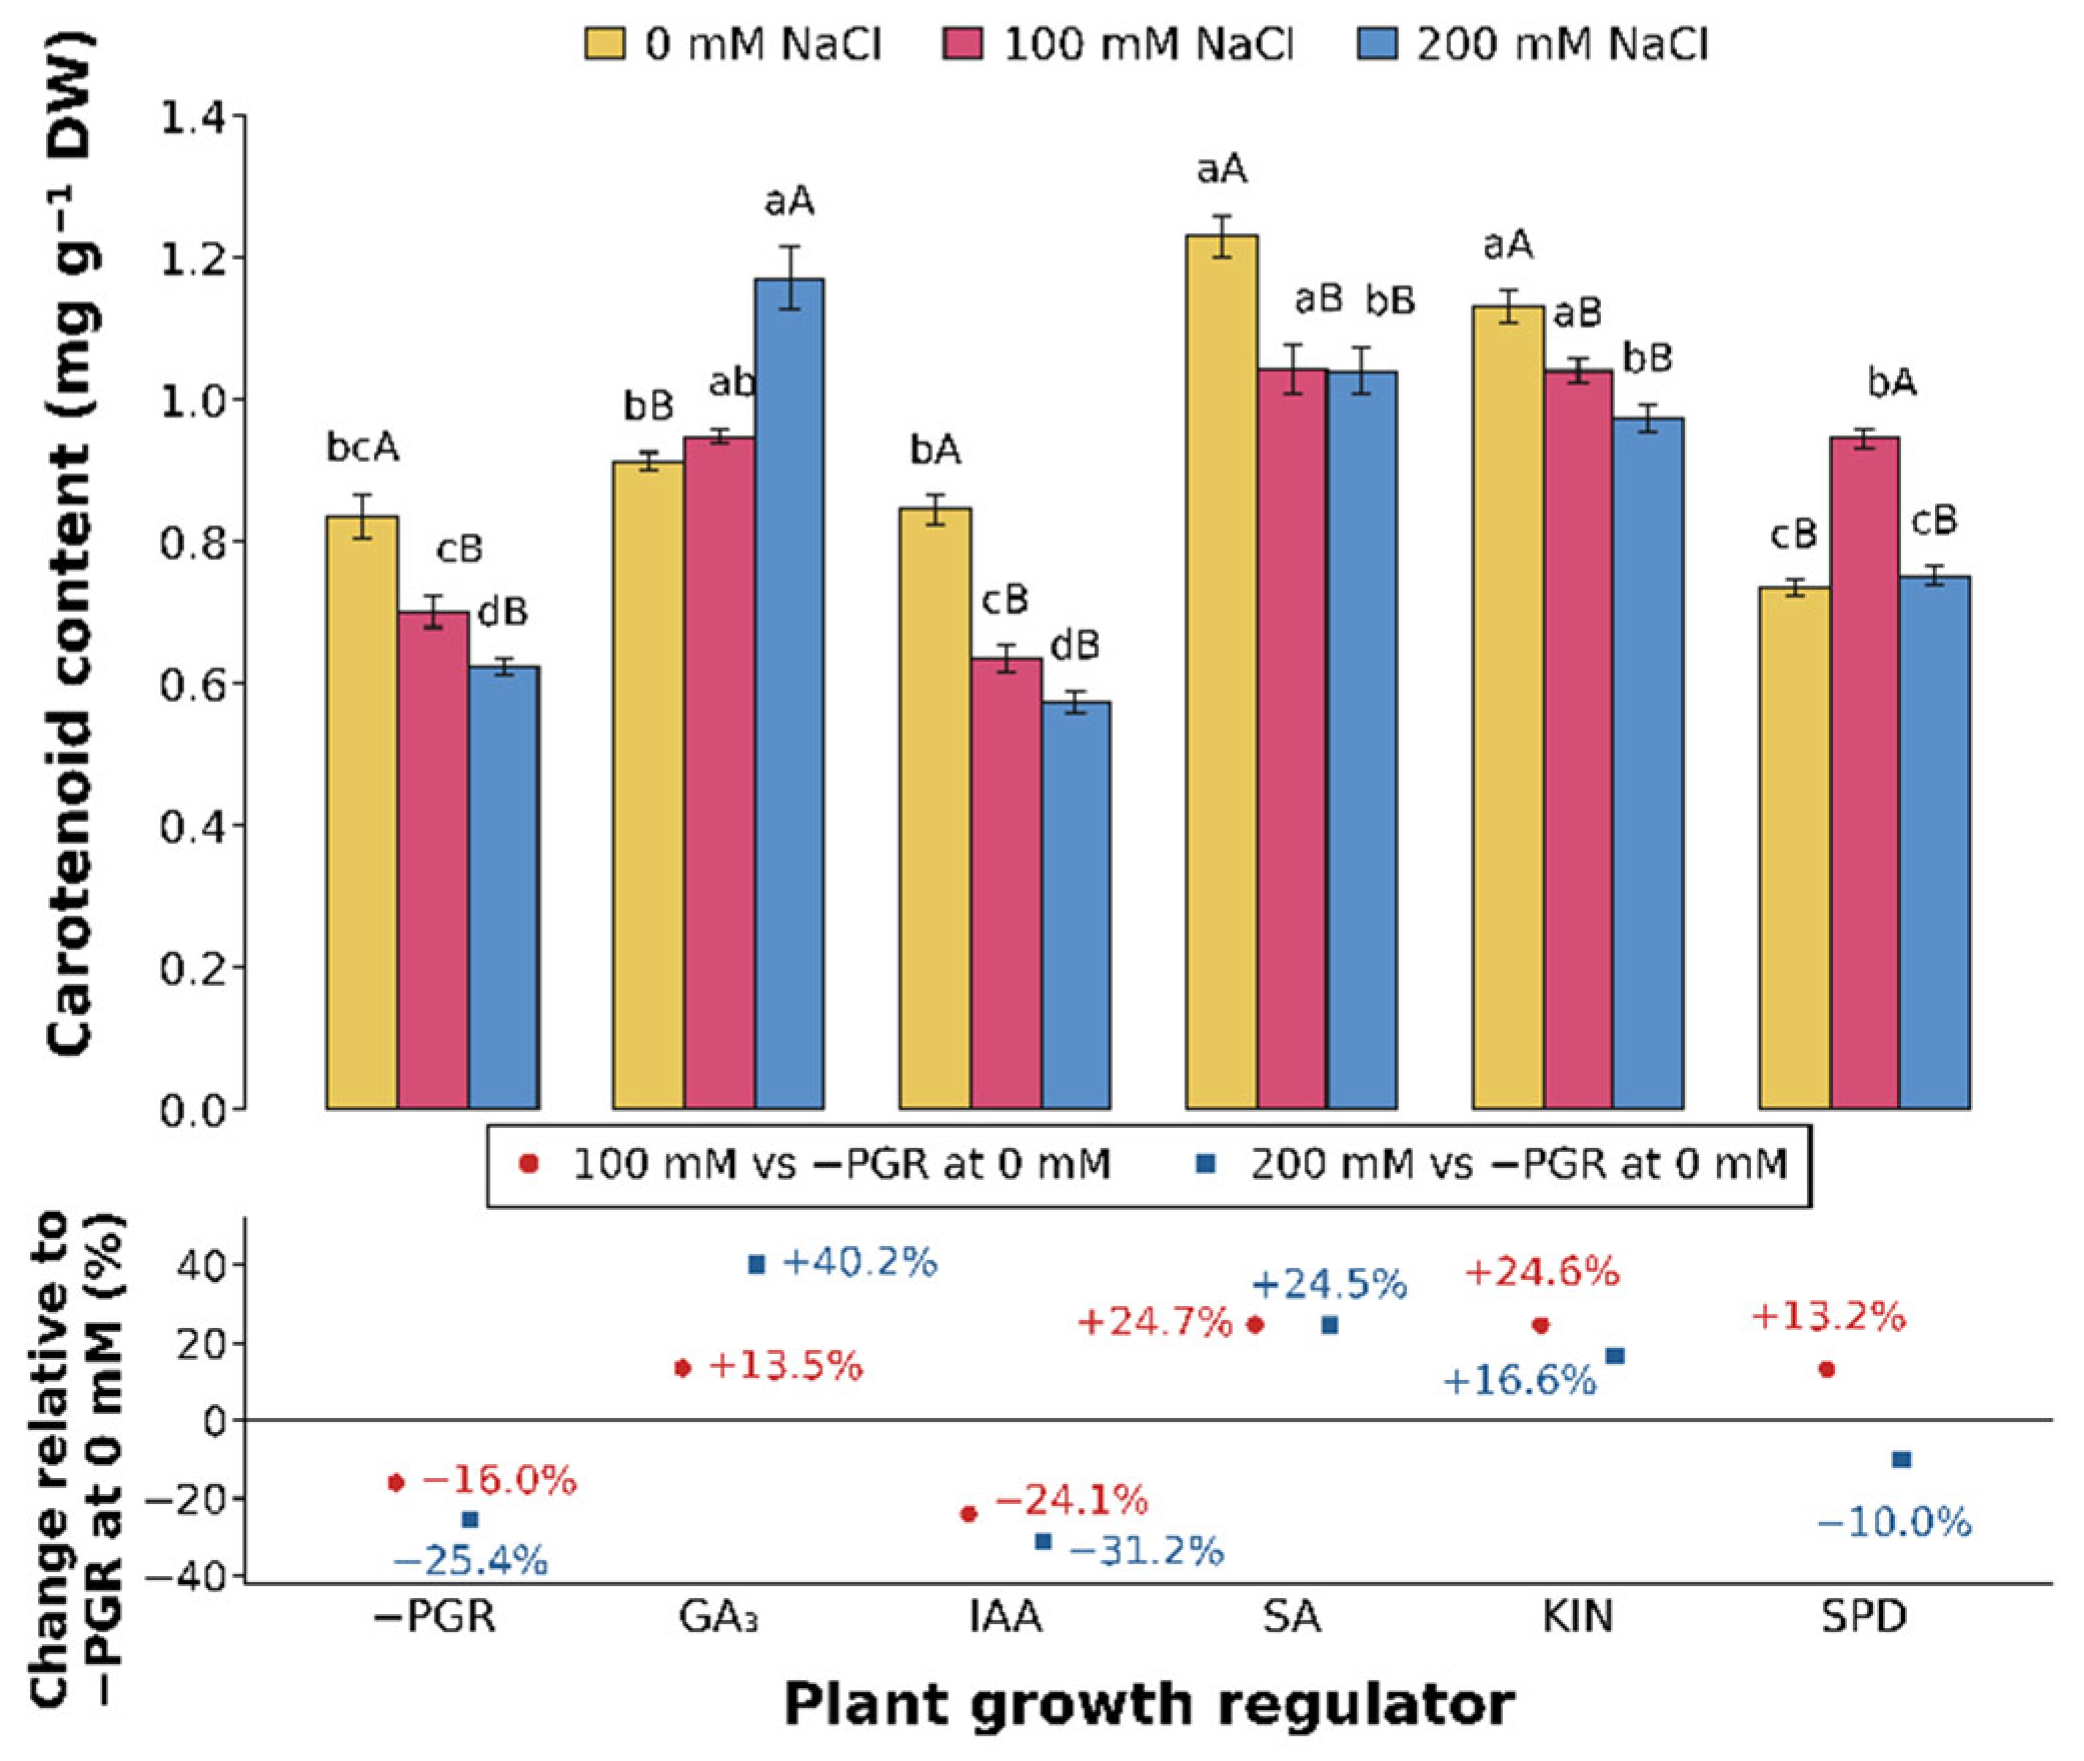
Figure 4.
Effects of plant growth regulator (PGR) treatments and salinity (0, 100, and 200 mM NaCl) on (A) net CO₂ assimilation rate (A), (B) stomatal conductance (gₛ), (C) transpiration rate (E), (D) apparent carboxylation efficiency (A/Cᵢ), (E) instantaneous water-use efficiency (WUE), and (F) intrinsic water-use efficiency (WUEᵢ) in leaves of one-year-old olive plants. Values are means ± standard error (SE; n = 3). Different lowercase letters indicate significant differences among PGR treatments within the same NaCl concentration, whereas different uppercase letters indicate significant differences among NaCl concentrations within the same PGR treatment, according to Tukey’s test (p < 0.05). Abbreviations: −PGR, without plant growth regulator; GA3, gibberellic acid; IAA, indole-3-acetic acid; SA, salicylic acid; KIN, kinetin; SPD, spermidine.
Figure 4.
Effects of plant growth regulator (PGR) treatments and salinity (0, 100, and 200 mM NaCl) on (A) net CO₂ assimilation rate (A), (B) stomatal conductance (gₛ), (C) transpiration rate (E), (D) apparent carboxylation efficiency (A/Cᵢ), (E) instantaneous water-use efficiency (WUE), and (F) intrinsic water-use efficiency (WUEᵢ) in leaves of one-year-old olive plants. Values are means ± standard error (SE; n = 3). Different lowercase letters indicate significant differences among PGR treatments within the same NaCl concentration, whereas different uppercase letters indicate significant differences among NaCl concentrations within the same PGR treatment, according to Tukey’s test (p < 0.05). Abbreviations: −PGR, without plant growth regulator; GA3, gibberellic acid; IAA, indole-3-acetic acid; SA, salicylic acid; KIN, kinetin; SPD, spermidine.
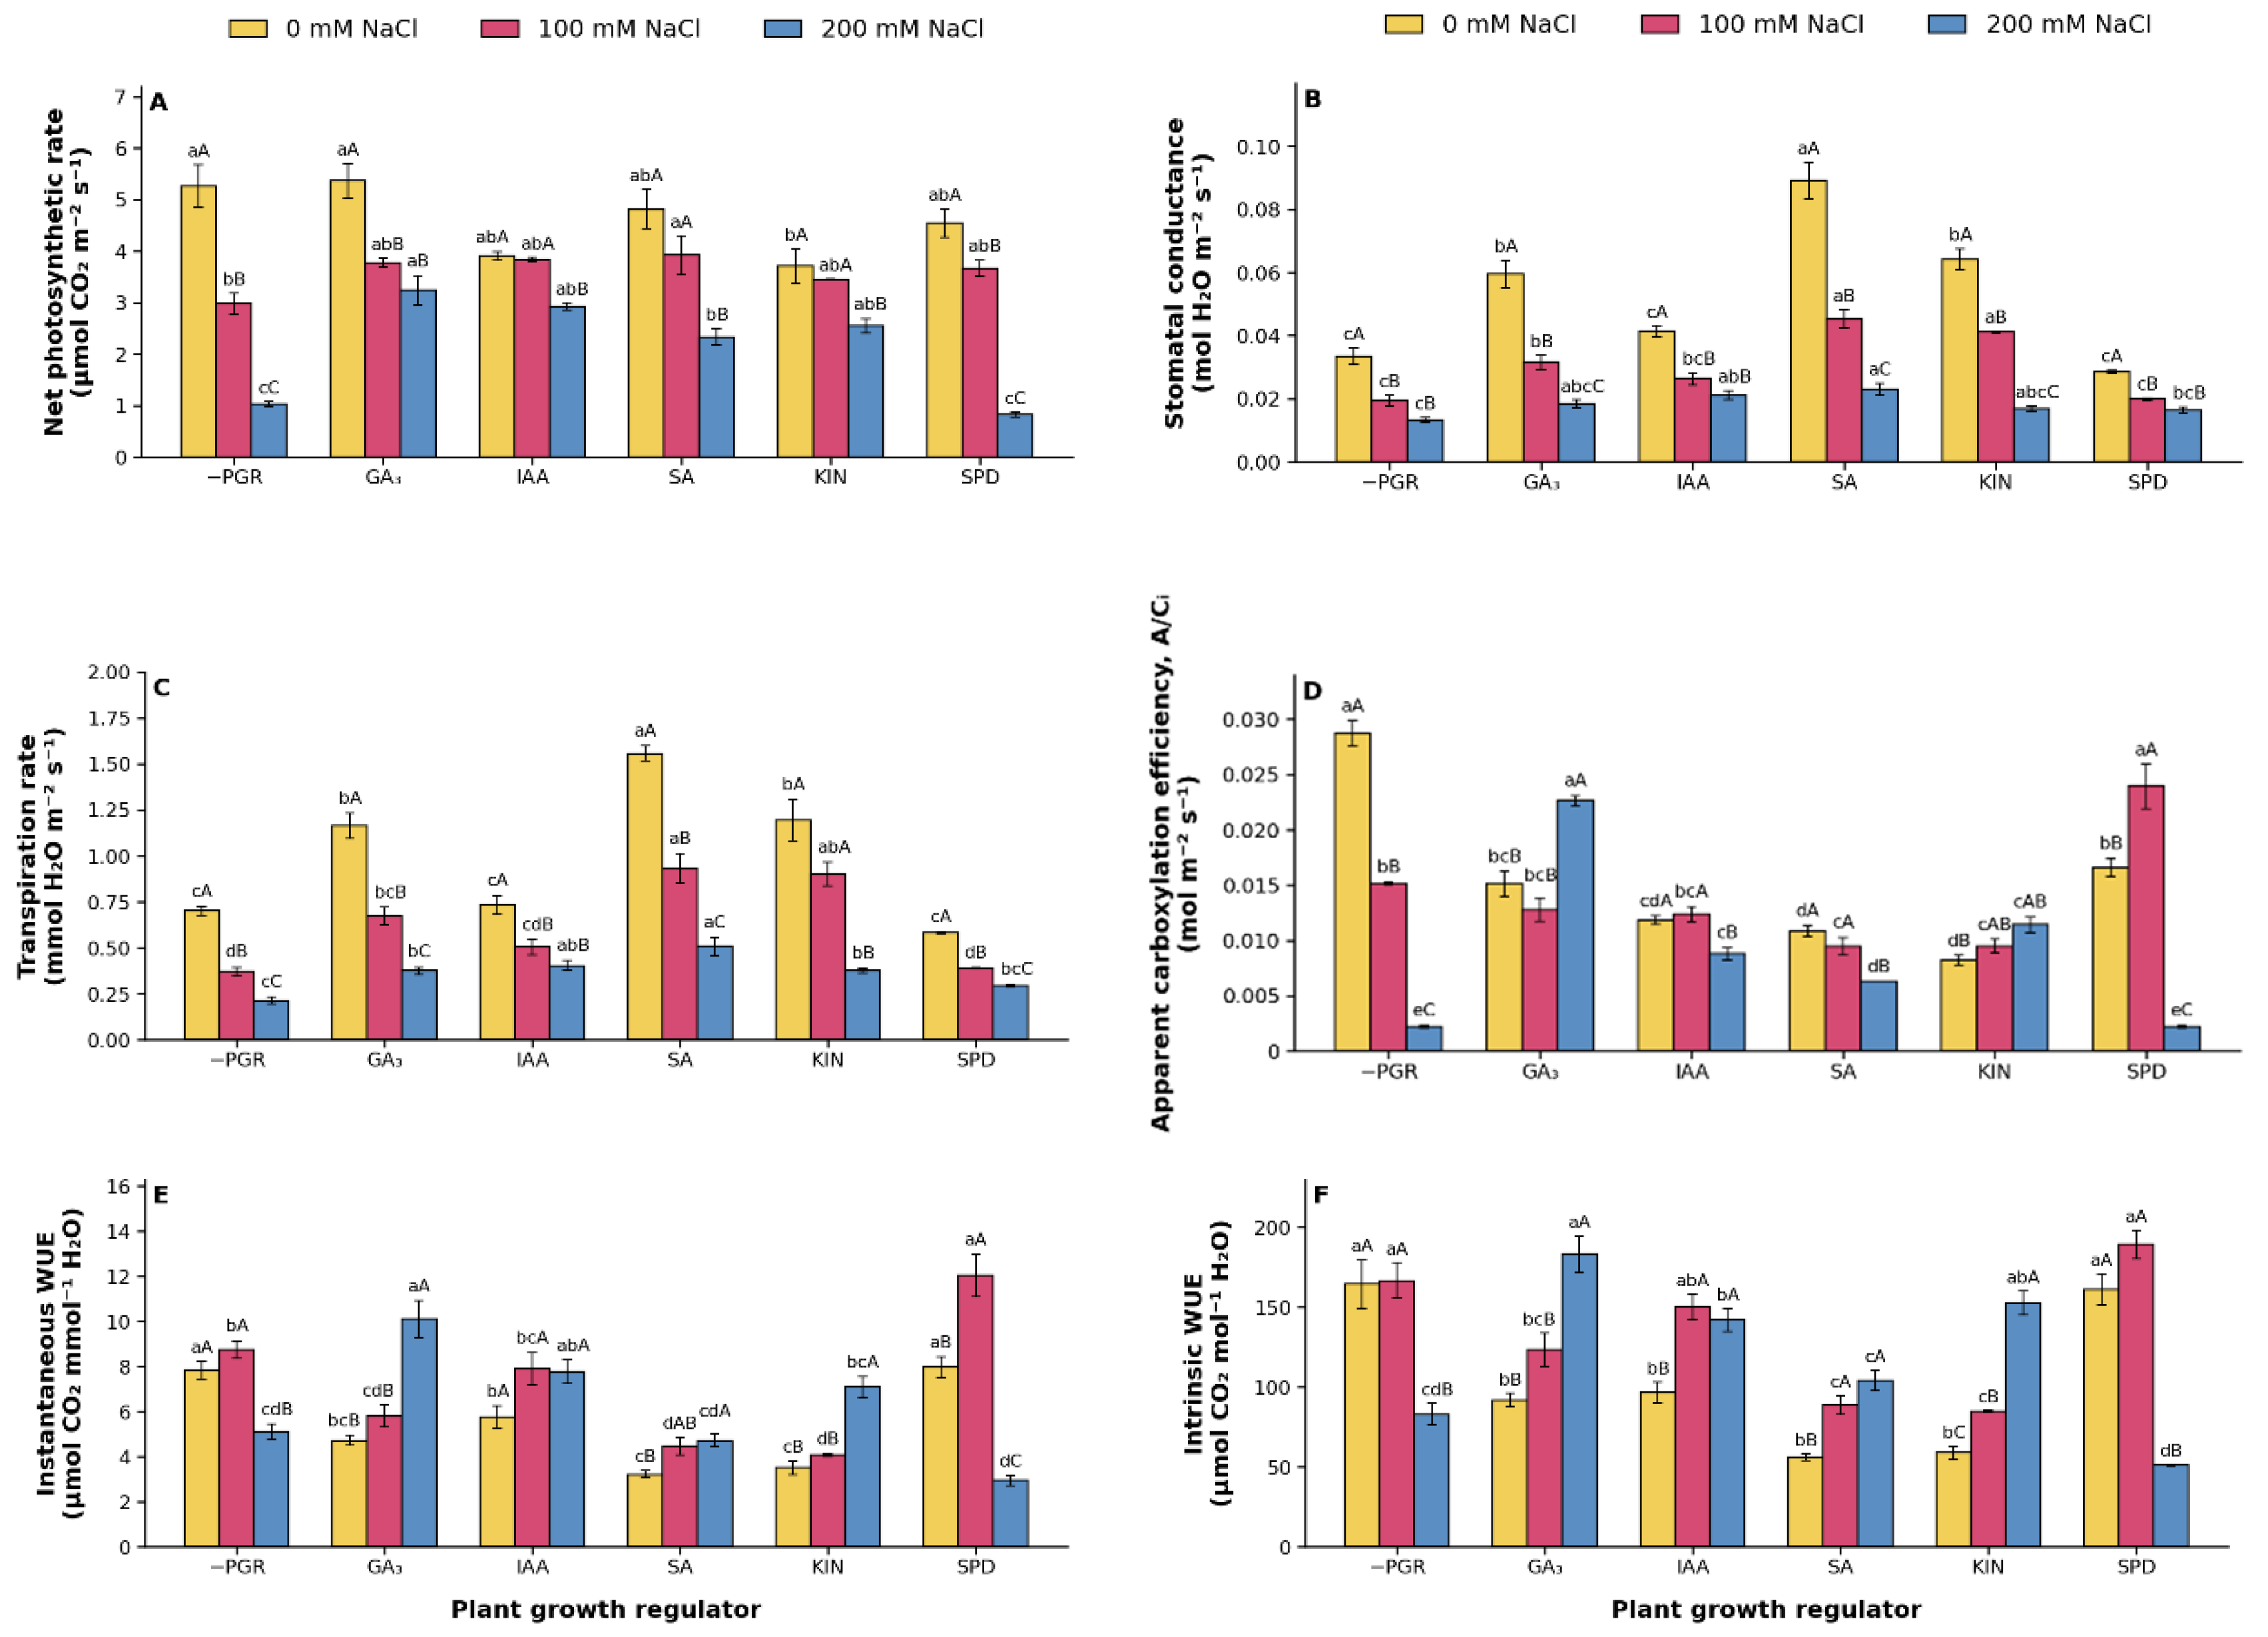
Figure 6.
Effects of plant growth regulator (PGR) treatments and salinity (NaCl: 0, 100, and 200 mM) on (A) total free amino acid content (TFAA), (B) proline content (Pro), and (C) ethylene production (C₂H₄) in leaves of one-year-old olive plants. Values are means ± standard error (SE; n = 4 for TFAA and Pro; n = 3 for C2H4). Different lowercase letters indicate significant differences among PGR treatments within the same NaCl concentration, whereas different uppercase letters indicate significant differences among NaCl concentrations within the same PGR treatment, according to Tukey’s test (p < 0.05). Abbreviations: DW, dry weight; FW, fresh weight; −PGR, without plant growth regulator; GA3, gibberellic acid; IAA, indole-3-acetic acid; SA, salicylic acid; KIN, kinetin; SPD, spermidine.
Figure 6.
Effects of plant growth regulator (PGR) treatments and salinity (NaCl: 0, 100, and 200 mM) on (A) total free amino acid content (TFAA), (B) proline content (Pro), and (C) ethylene production (C₂H₄) in leaves of one-year-old olive plants. Values are means ± standard error (SE; n = 4 for TFAA and Pro; n = 3 for C2H4). Different lowercase letters indicate significant differences among PGR treatments within the same NaCl concentration, whereas different uppercase letters indicate significant differences among NaCl concentrations within the same PGR treatment, according to Tukey’s test (p < 0.05). Abbreviations: DW, dry weight; FW, fresh weight; −PGR, without plant growth regulator; GA3, gibberellic acid; IAA, indole-3-acetic acid; SA, salicylic acid; KIN, kinetin; SPD, spermidine.
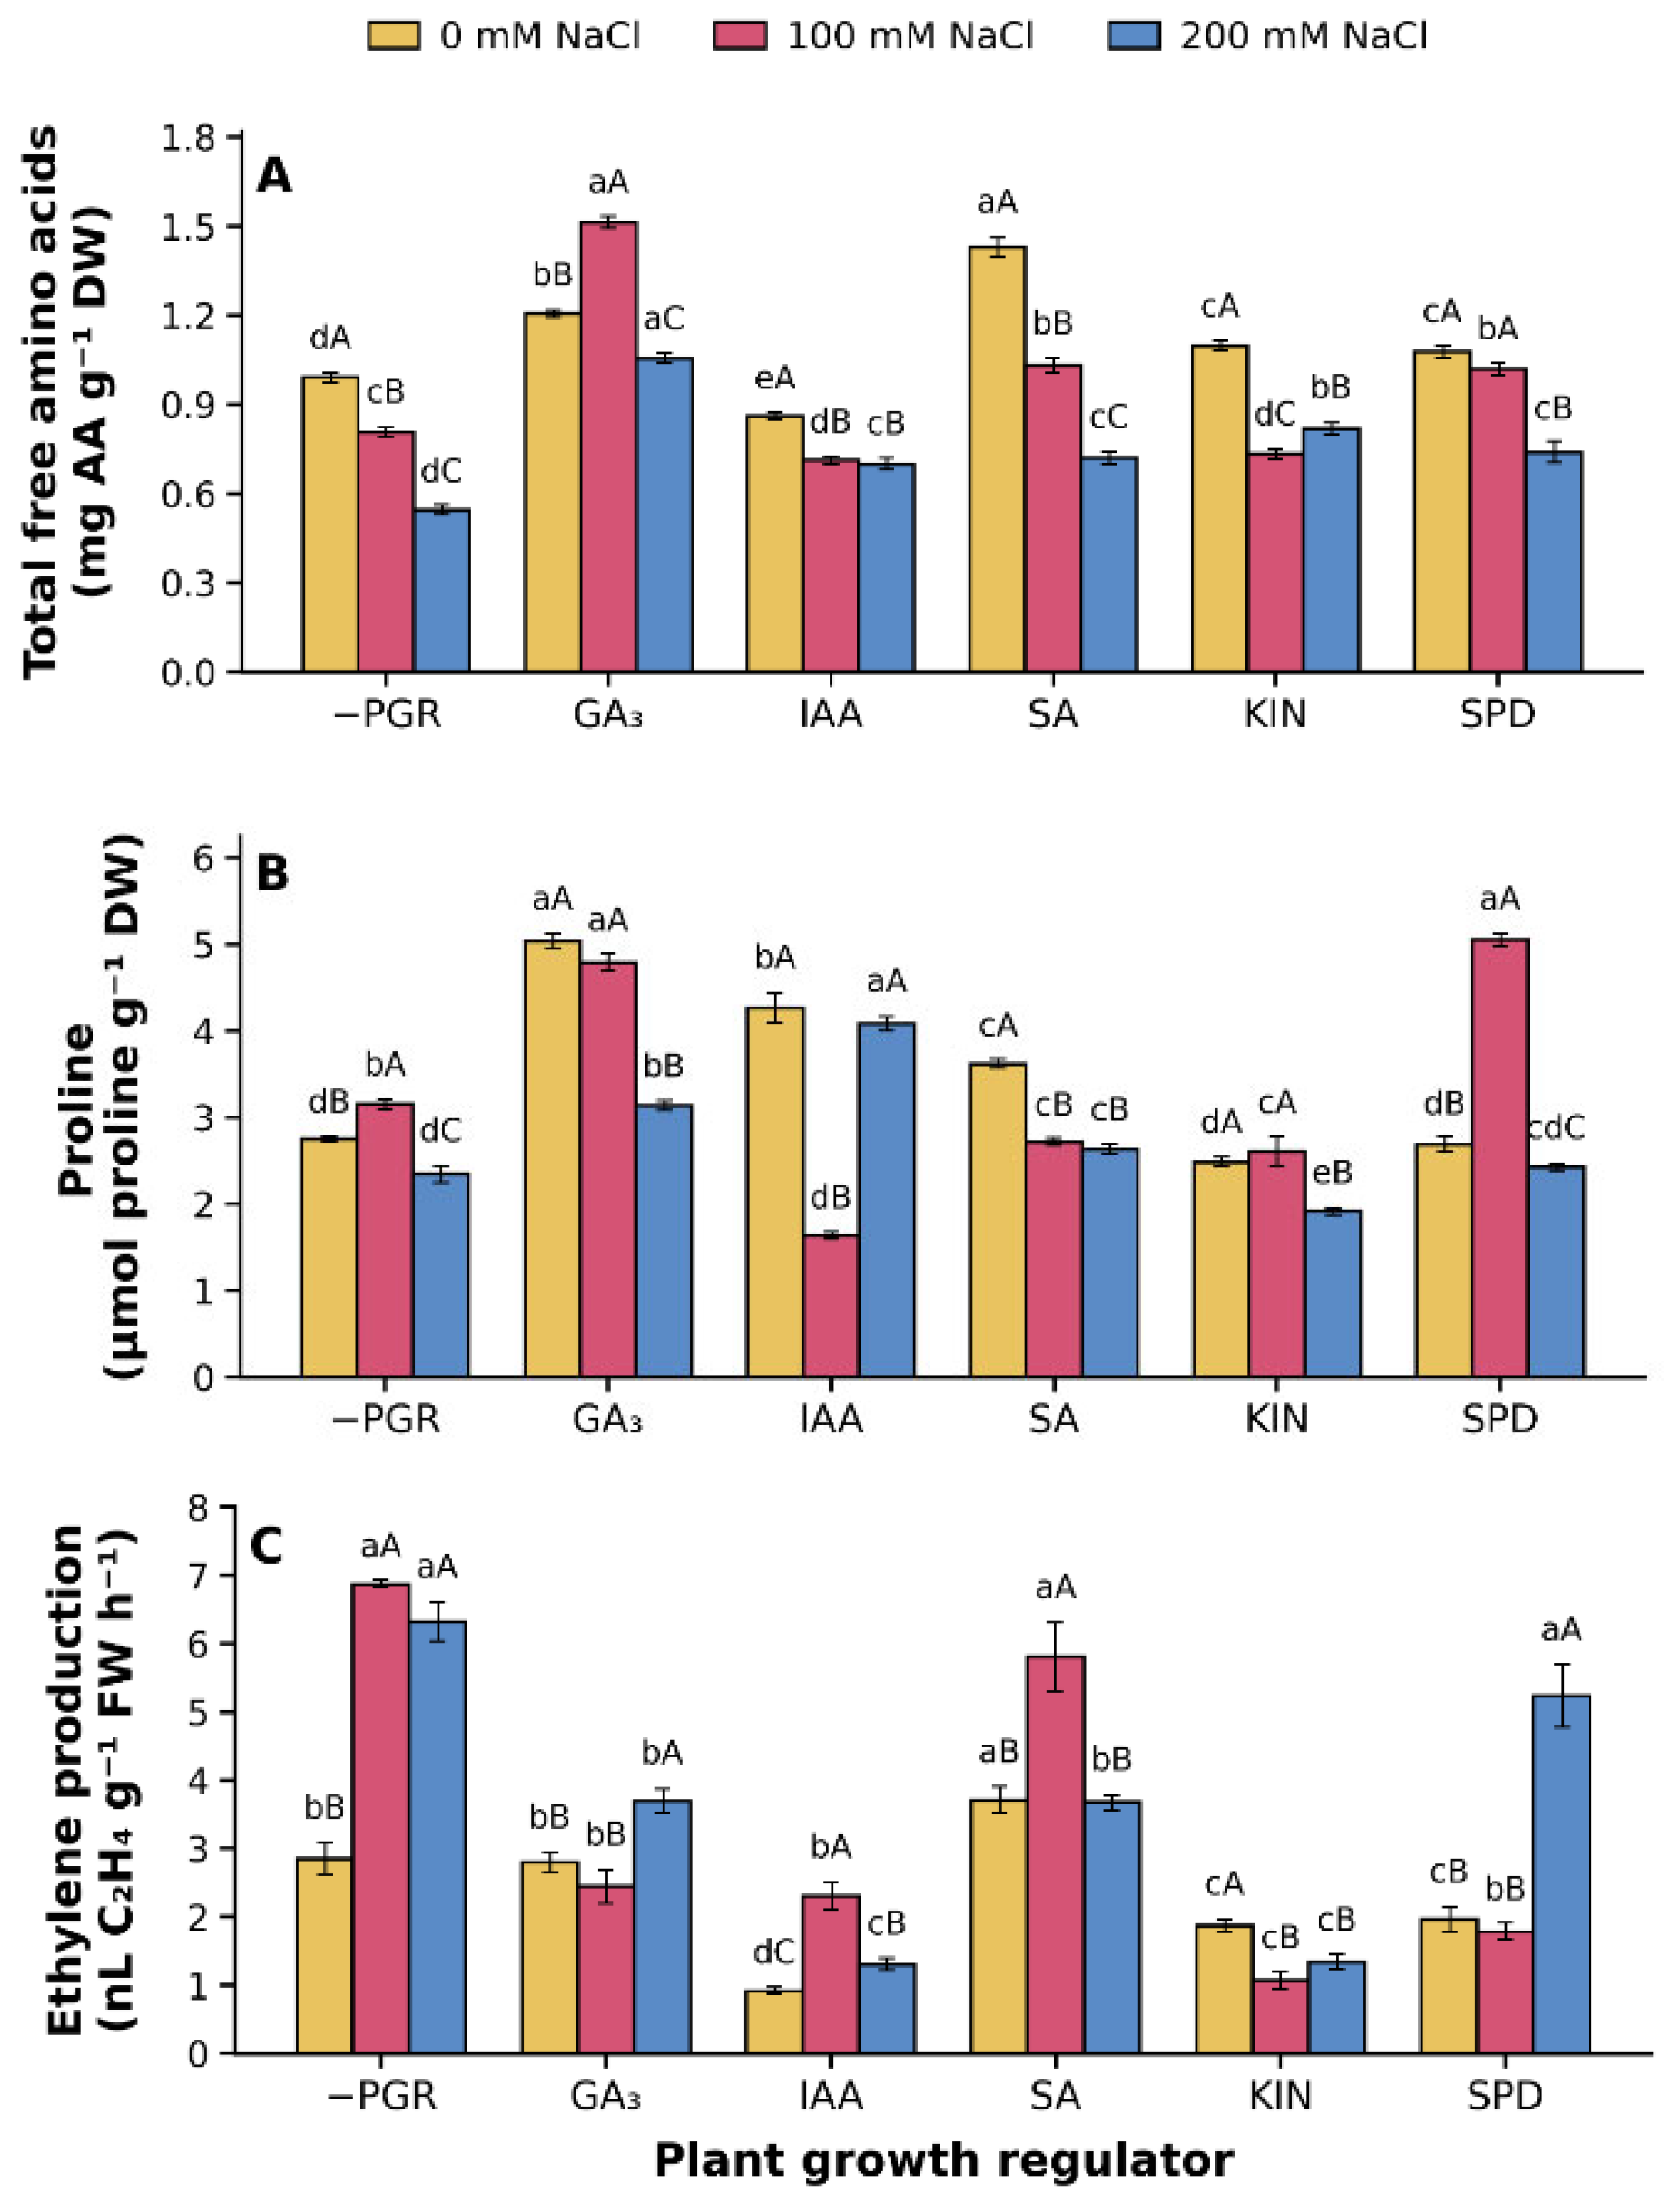
Figure 7.
Effects of plant growth regulator (PGR) treatments and salinity (NaCl: 0, 100, and 200 mM) on the activities of (A) ascorbate peroxidase (APX), (B) glutathione reductase (GR), and (C) guaiacol peroxidase (GPX) in leaves of one-year-old olive plants. Values are means ± standard error (SE; n = 4). Different lowercase letters indicate significant differences among PGR treatments within the same NaCl concentration, whereas different uppercase letters indicate significant differences among NaCl concentrations within the same PGR treatment, according to Tukey’s test (p < 0.05). Abbreviations: −PGR, without plant growth regulator; GA3, gibberellic acid; IAA, indole-3-acetic acid; SA, salicylic acid; KIN, kinetin; SPD, spermidine; FW, fresh weight.
Figure 7.
Effects of plant growth regulator (PGR) treatments and salinity (NaCl: 0, 100, and 200 mM) on the activities of (A) ascorbate peroxidase (APX), (B) glutathione reductase (GR), and (C) guaiacol peroxidase (GPX) in leaves of one-year-old olive plants. Values are means ± standard error (SE; n = 4). Different lowercase letters indicate significant differences among PGR treatments within the same NaCl concentration, whereas different uppercase letters indicate significant differences among NaCl concentrations within the same PGR treatment, according to Tukey’s test (p < 0.05). Abbreviations: −PGR, without plant growth regulator; GA3, gibberellic acid; IAA, indole-3-acetic acid; SA, salicylic acid; KIN, kinetin; SPD, spermidine; FW, fresh weight.
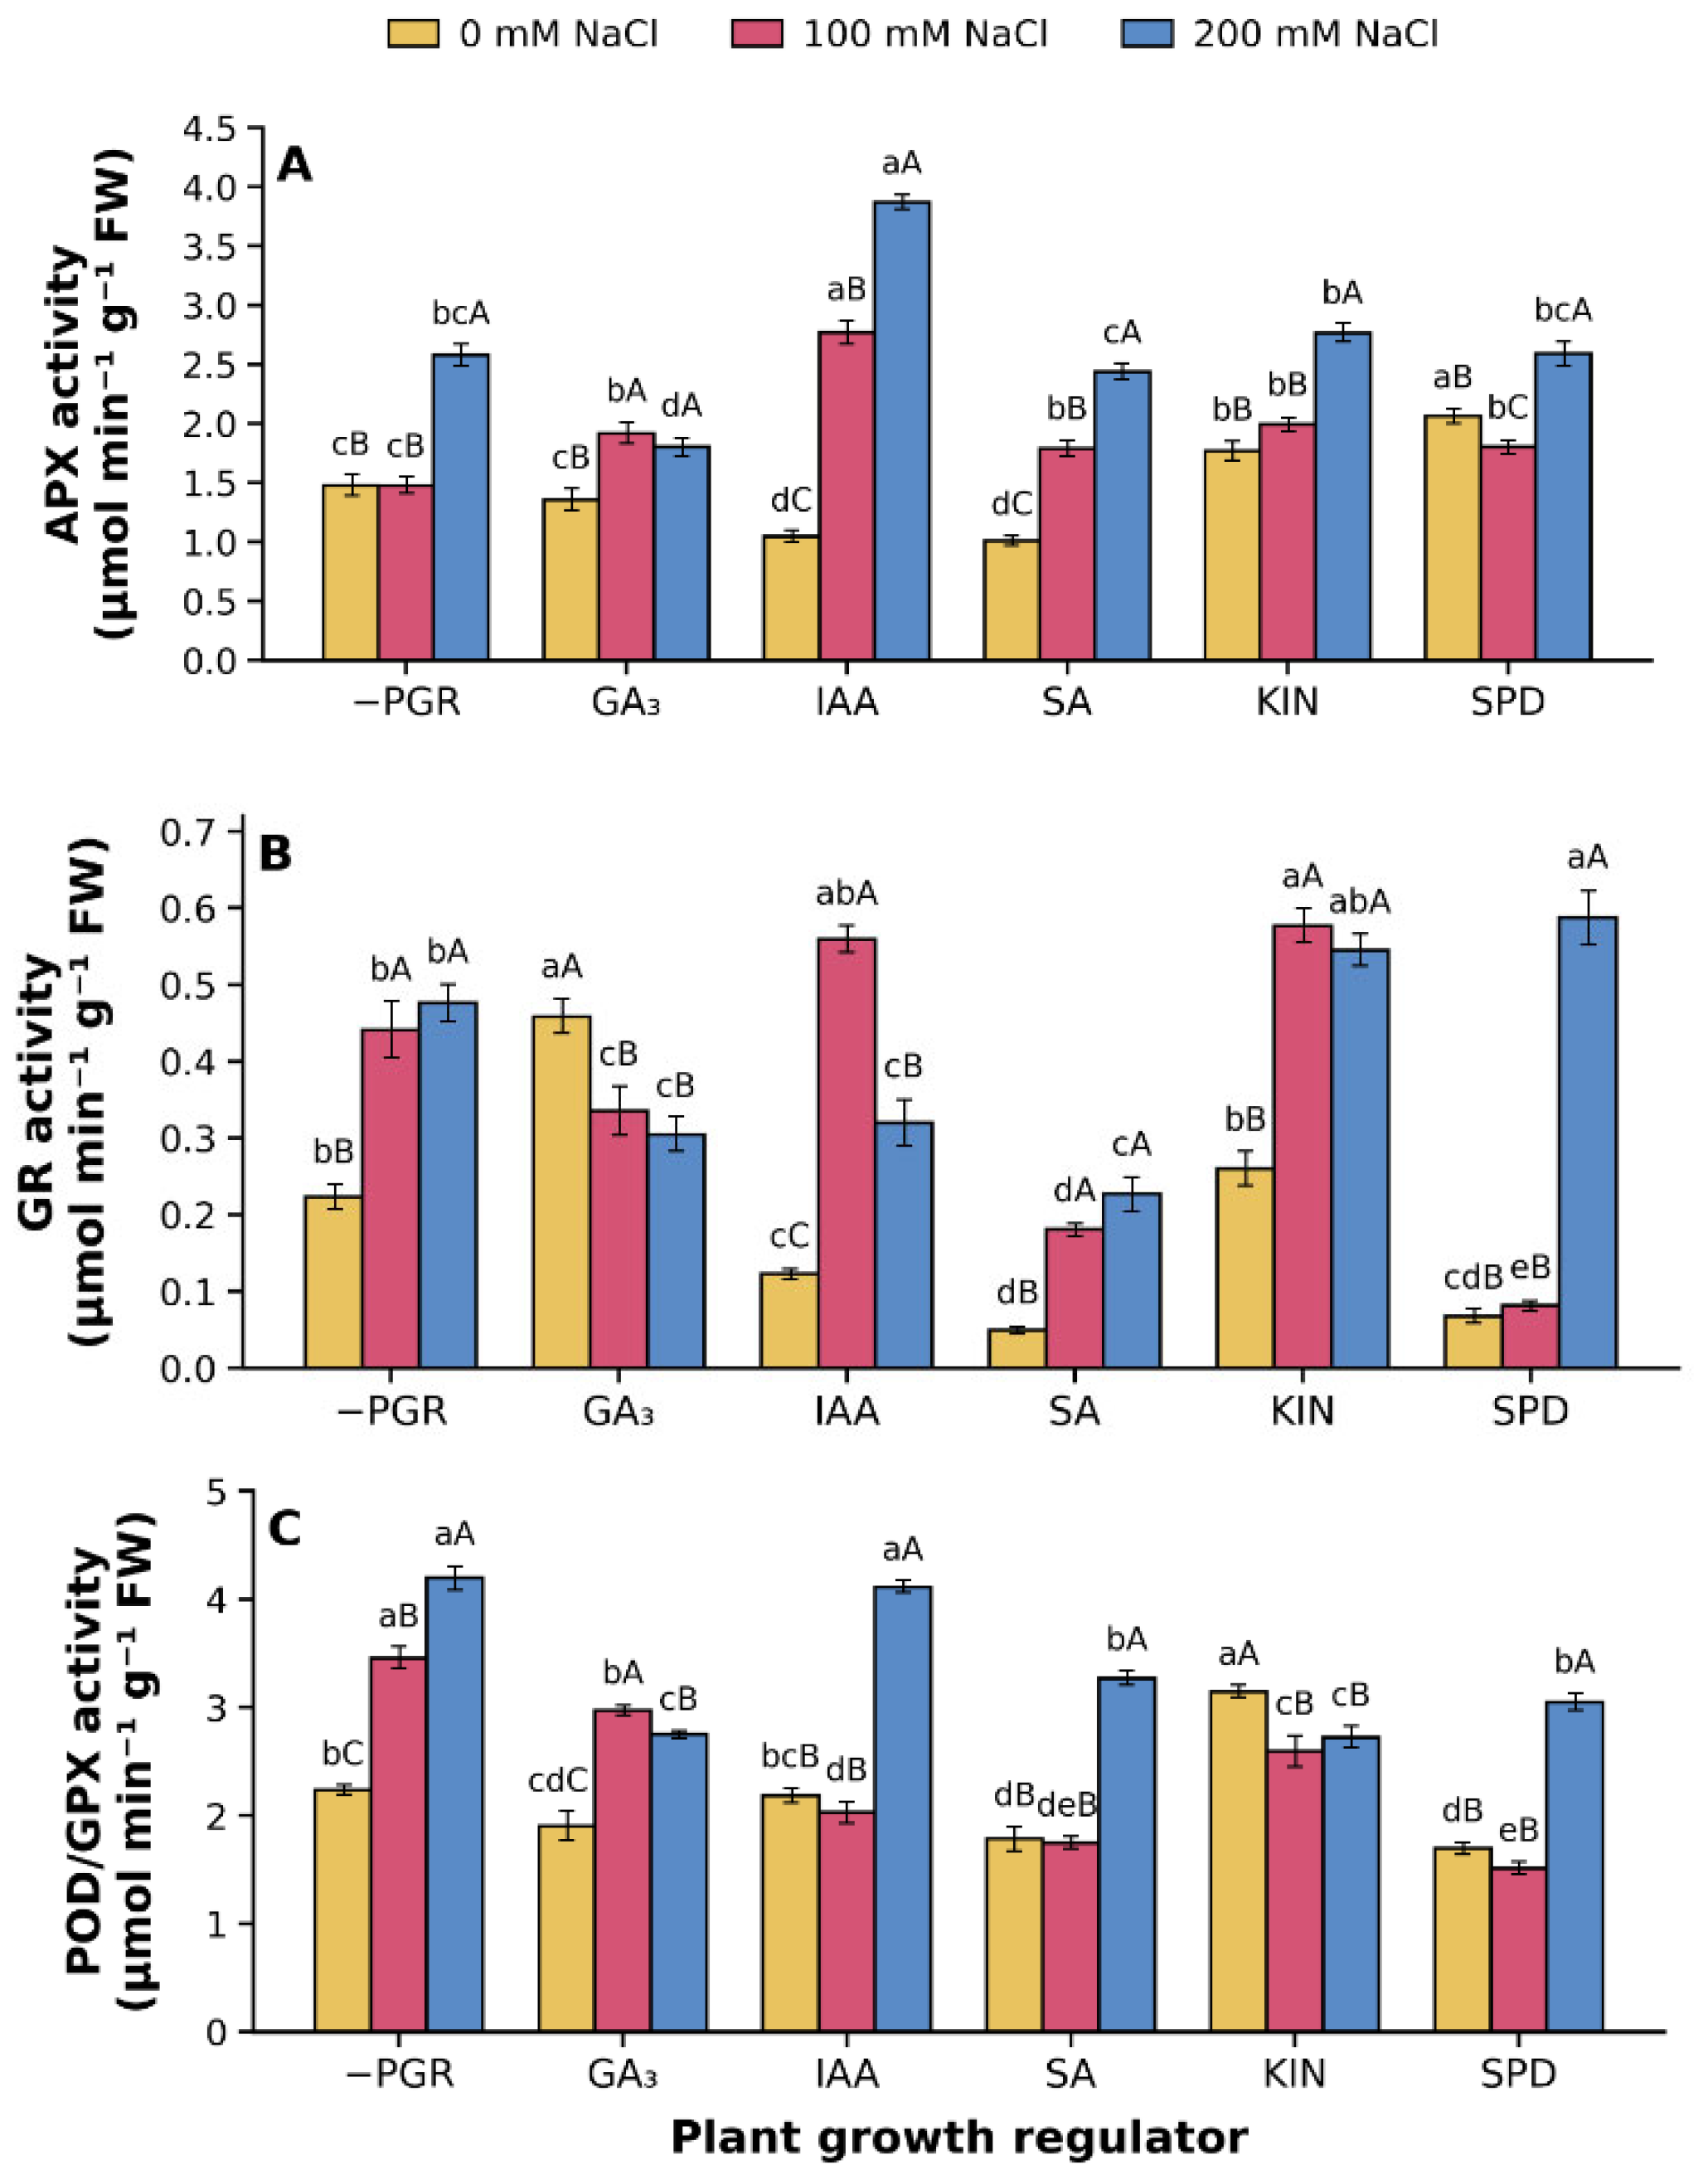
Figure 8.
Effects of plant growth regulator (PGR) treatments and salinity (NaCl: 0, 100, and 200 mM) on (A) total phenolic content (TPC) and (B) total flavonoid content (TFC) in leaves of one-year-old olive plants. Values are means ± standard error (SE; n = 4). Different lowercase letters indicate significant differences among PGR treatments within the same NaCl concentration, whereas different uppercase letters indicate significant differences among NaCl concentrations within the same PGR treatment, according to Tukey’s test (p < 0.05). Abbreviations: DW, dry weight; −PGR, without plant growth regulator; GA3, gibberellic acid; IAA, indole-3-acetic acid; SA, salicylic acid; KIN, kinetin; SPD, spermidine.
Figure 8.
Effects of plant growth regulator (PGR) treatments and salinity (NaCl: 0, 100, and 200 mM) on (A) total phenolic content (TPC) and (B) total flavonoid content (TFC) in leaves of one-year-old olive plants. Values are means ± standard error (SE; n = 4). Different lowercase letters indicate significant differences among PGR treatments within the same NaCl concentration, whereas different uppercase letters indicate significant differences among NaCl concentrations within the same PGR treatment, according to Tukey’s test (p < 0.05). Abbreviations: DW, dry weight; −PGR, without plant growth regulator; GA3, gibberellic acid; IAA, indole-3-acetic acid; SA, salicylic acid; KIN, kinetin; SPD, spermidine.
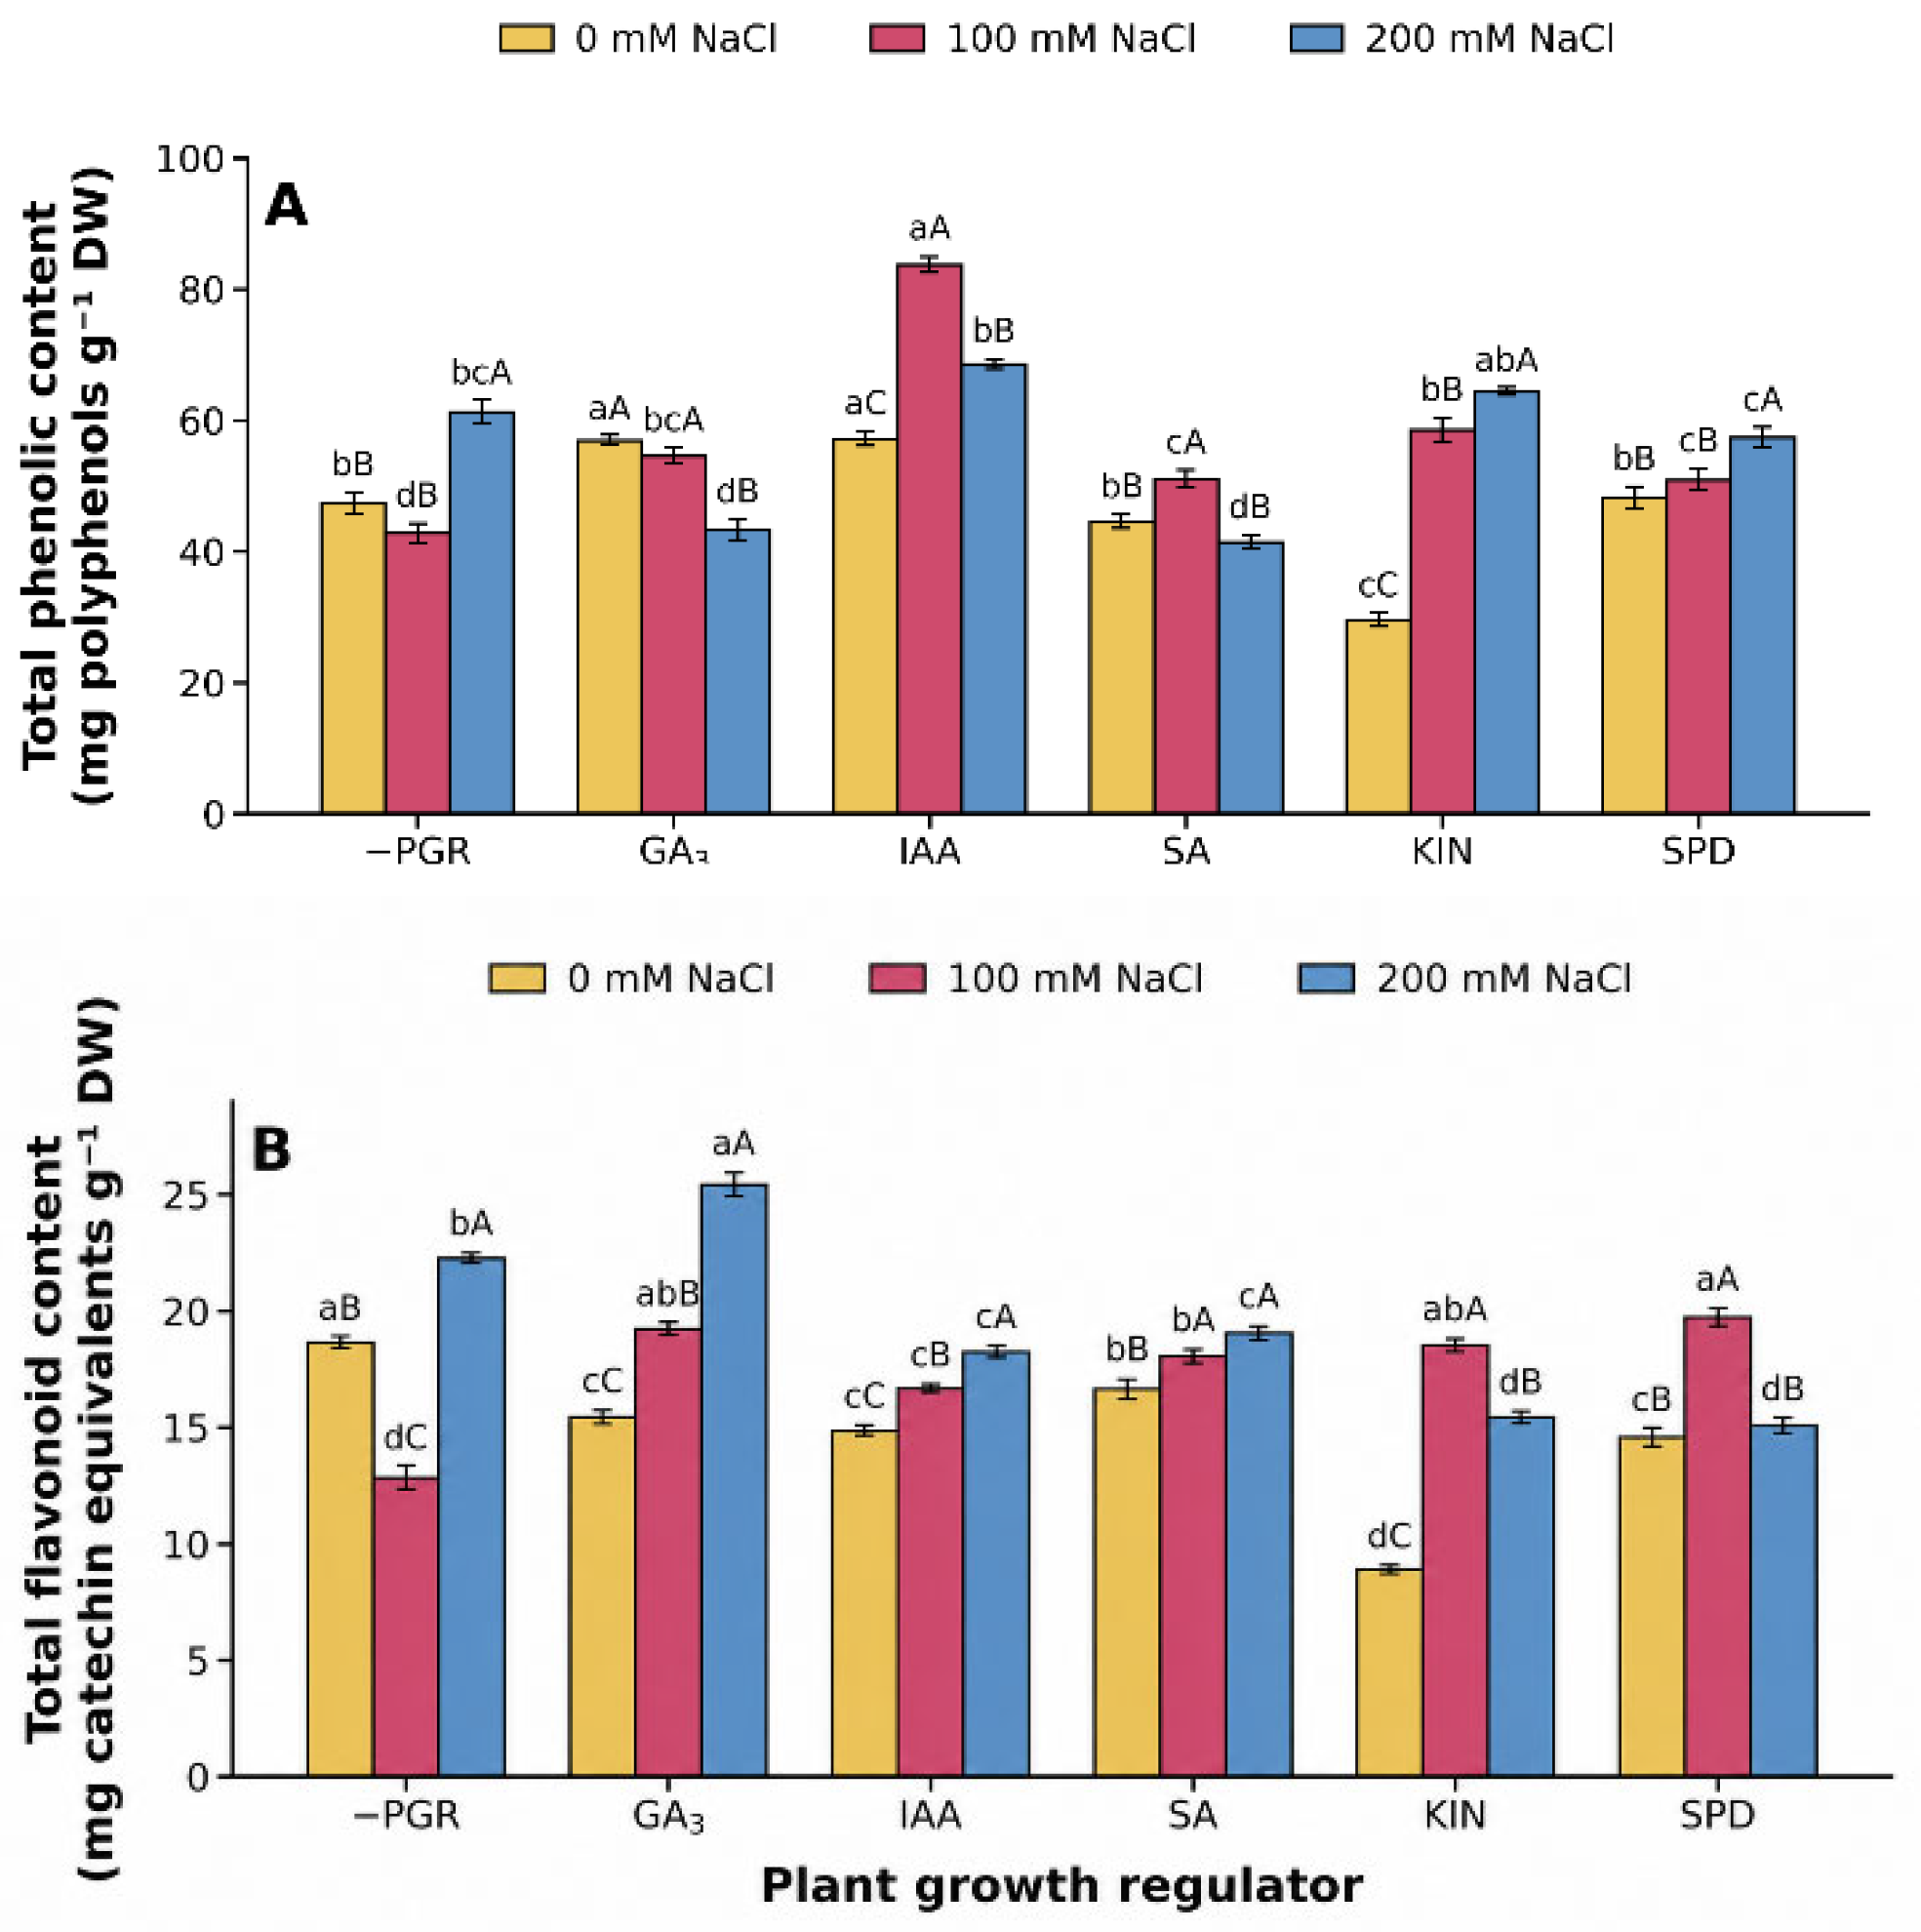
Figure 9.
Pearson correlation matrices among physiological and biochemical parameters of olive plants subjected to six plant growth regulator treatments and three NaCl concentrations (n = 18 treatment means). (A) Growth, water status, nutrition, pigments, and photosynthesis. (B) Integrative variables and biochemical stress responses. The upper triangle shows Pearson correlation coefficients (r), whereas the lower triangle indicates significance after Benjamini–Hochberg correction: * p < 0.05, ** p < 0.01, and *** p < 0.001. Abbreviations: LDM, leaf dry mass; RDW, root dry weight; TLA, total leaf area; RWC, relative water content; WUC, water uptake capacity; Chl, total chlorophyll; Car, carotenoids; A, net photosynthetic rate; gs, stomatal conductance; Ci, intercellular CO2 concentration; E, transpiration rate; TFAA, total free amino acids; C2H4, ethylene; APX, ascorbate peroxidase; GR, glutathione reductase; GPX, guaiacol peroxidase; IC50, half-maximal inhibitory concentration.
Figure 9.
Pearson correlation matrices among physiological and biochemical parameters of olive plants subjected to six plant growth regulator treatments and three NaCl concentrations (n = 18 treatment means). (A) Growth, water status, nutrition, pigments, and photosynthesis. (B) Integrative variables and biochemical stress responses. The upper triangle shows Pearson correlation coefficients (r), whereas the lower triangle indicates significance after Benjamini–Hochberg correction: * p < 0.05, ** p < 0.01, and *** p < 0.001. Abbreviations: LDM, leaf dry mass; RDW, root dry weight; TLA, total leaf area; RWC, relative water content; WUC, water uptake capacity; Chl, total chlorophyll; Car, carotenoids; A, net photosynthetic rate; gs, stomatal conductance; Ci, intercellular CO2 concentration; E, transpiration rate; TFAA, total free amino acids; C2H4, ethylene; APX, ascorbate peroxidase; GR, glutathione reductase; GPX, guaiacol peroxidase; IC50, half-maximal inhibitory concentration.
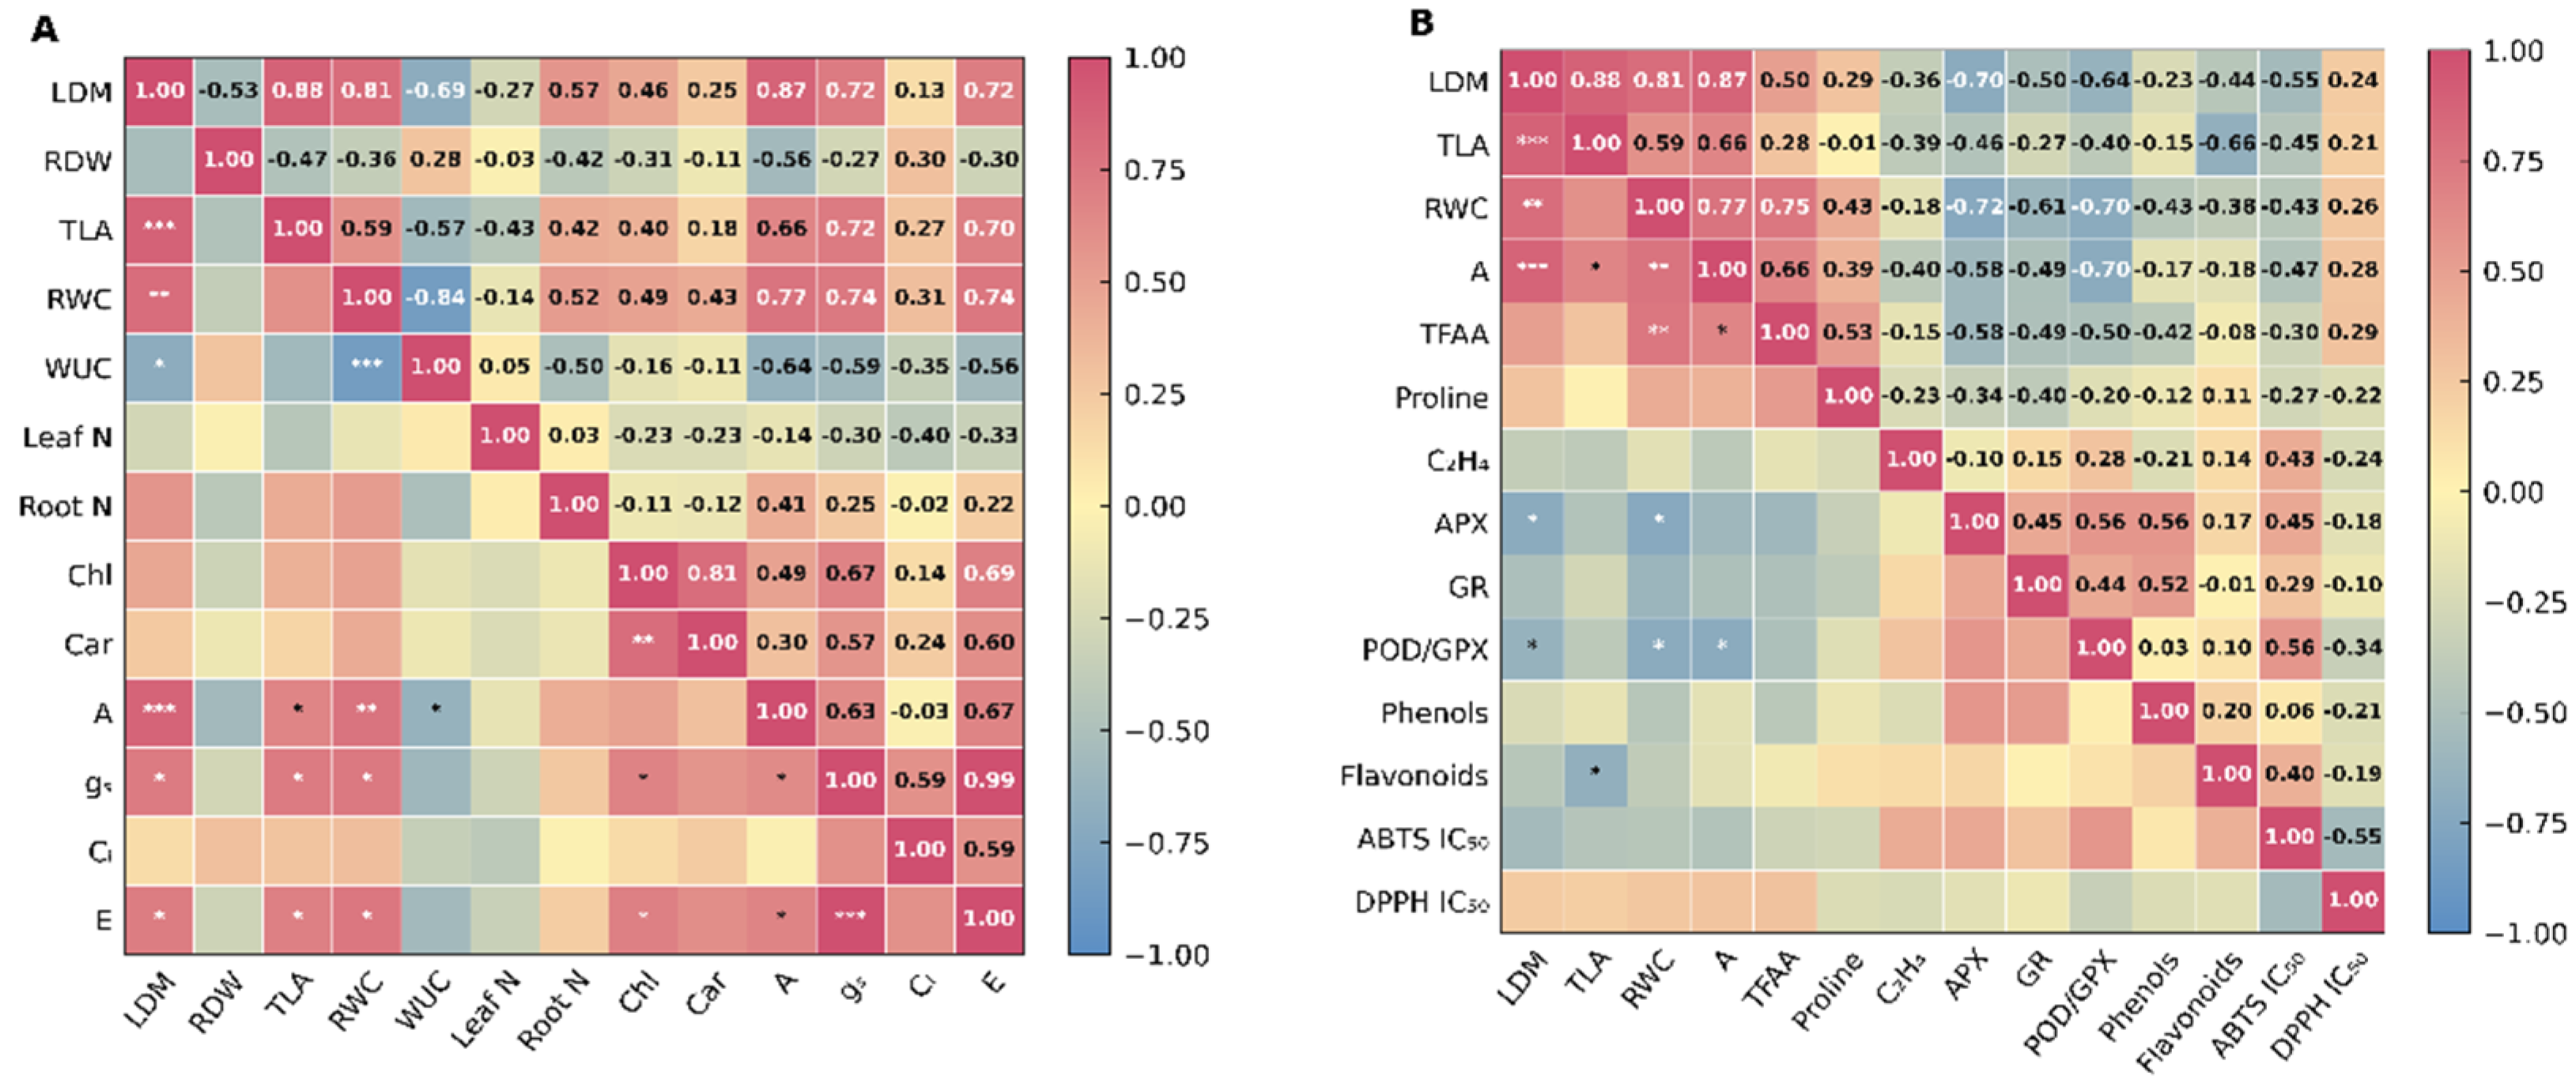
Figure 10.
Hierarchical-clustering heatmap showing the integrated response of one-year-old olive plants to growth-regulator treatments and salinity. Rows represent the 18 combinations of growth-regulator treatment and NaCl concentration, whereas columns represent the 23 selected growth, water-relation, photosynthetic-pigment, gas-exchange, nitrogen-metabolism, antioxidant and phenolic variables. Values were standardised within each variable and are expressed as z-scores. Abbreviations: −PGR, without plant growth regulator; GA3, gibberellic acid; IAA, indole-3-acetic acid; SA, salicylic acid; KIN, kinetin; SPD, spermidine; LDM, leaf dry mass; RDW, root dry weight; TLA, total leaf area; RWC, relative water content; WUC, water uptake capacity; Leaf N and Root N, nitrogen concentrations in leaves and roots, respectively; Total Chl, total chlorophyll; Car, carotenoids; A, net photosynthetic rate; gₛ, stomatal conductance; Cᵢ, intercellular CO₂ concentration; E, transpiration rate; TFAA, total free amino acids; APX, ascorbate peroxidase; GR, glutathione reductase; GPX, guaiacol peroxidase; IC50, half-maximal inhibitory concentration.
Figure 10.
Hierarchical-clustering heatmap showing the integrated response of one-year-old olive plants to growth-regulator treatments and salinity. Rows represent the 18 combinations of growth-regulator treatment and NaCl concentration, whereas columns represent the 23 selected growth, water-relation, photosynthetic-pigment, gas-exchange, nitrogen-metabolism, antioxidant and phenolic variables. Values were standardised within each variable and are expressed as z-scores. Abbreviations: −PGR, without plant growth regulator; GA3, gibberellic acid; IAA, indole-3-acetic acid; SA, salicylic acid; KIN, kinetin; SPD, spermidine; LDM, leaf dry mass; RDW, root dry weight; TLA, total leaf area; RWC, relative water content; WUC, water uptake capacity; Leaf N and Root N, nitrogen concentrations in leaves and roots, respectively; Total Chl, total chlorophyll; Car, carotenoids; A, net photosynthetic rate; gₛ, stomatal conductance; Cᵢ, intercellular CO₂ concentration; E, transpiration rate; TFAA, total free amino acids; APX, ascorbate peroxidase; GR, glutathione reductase; GPX, guaiacol peroxidase; IC50, half-maximal inhibitory concentration.
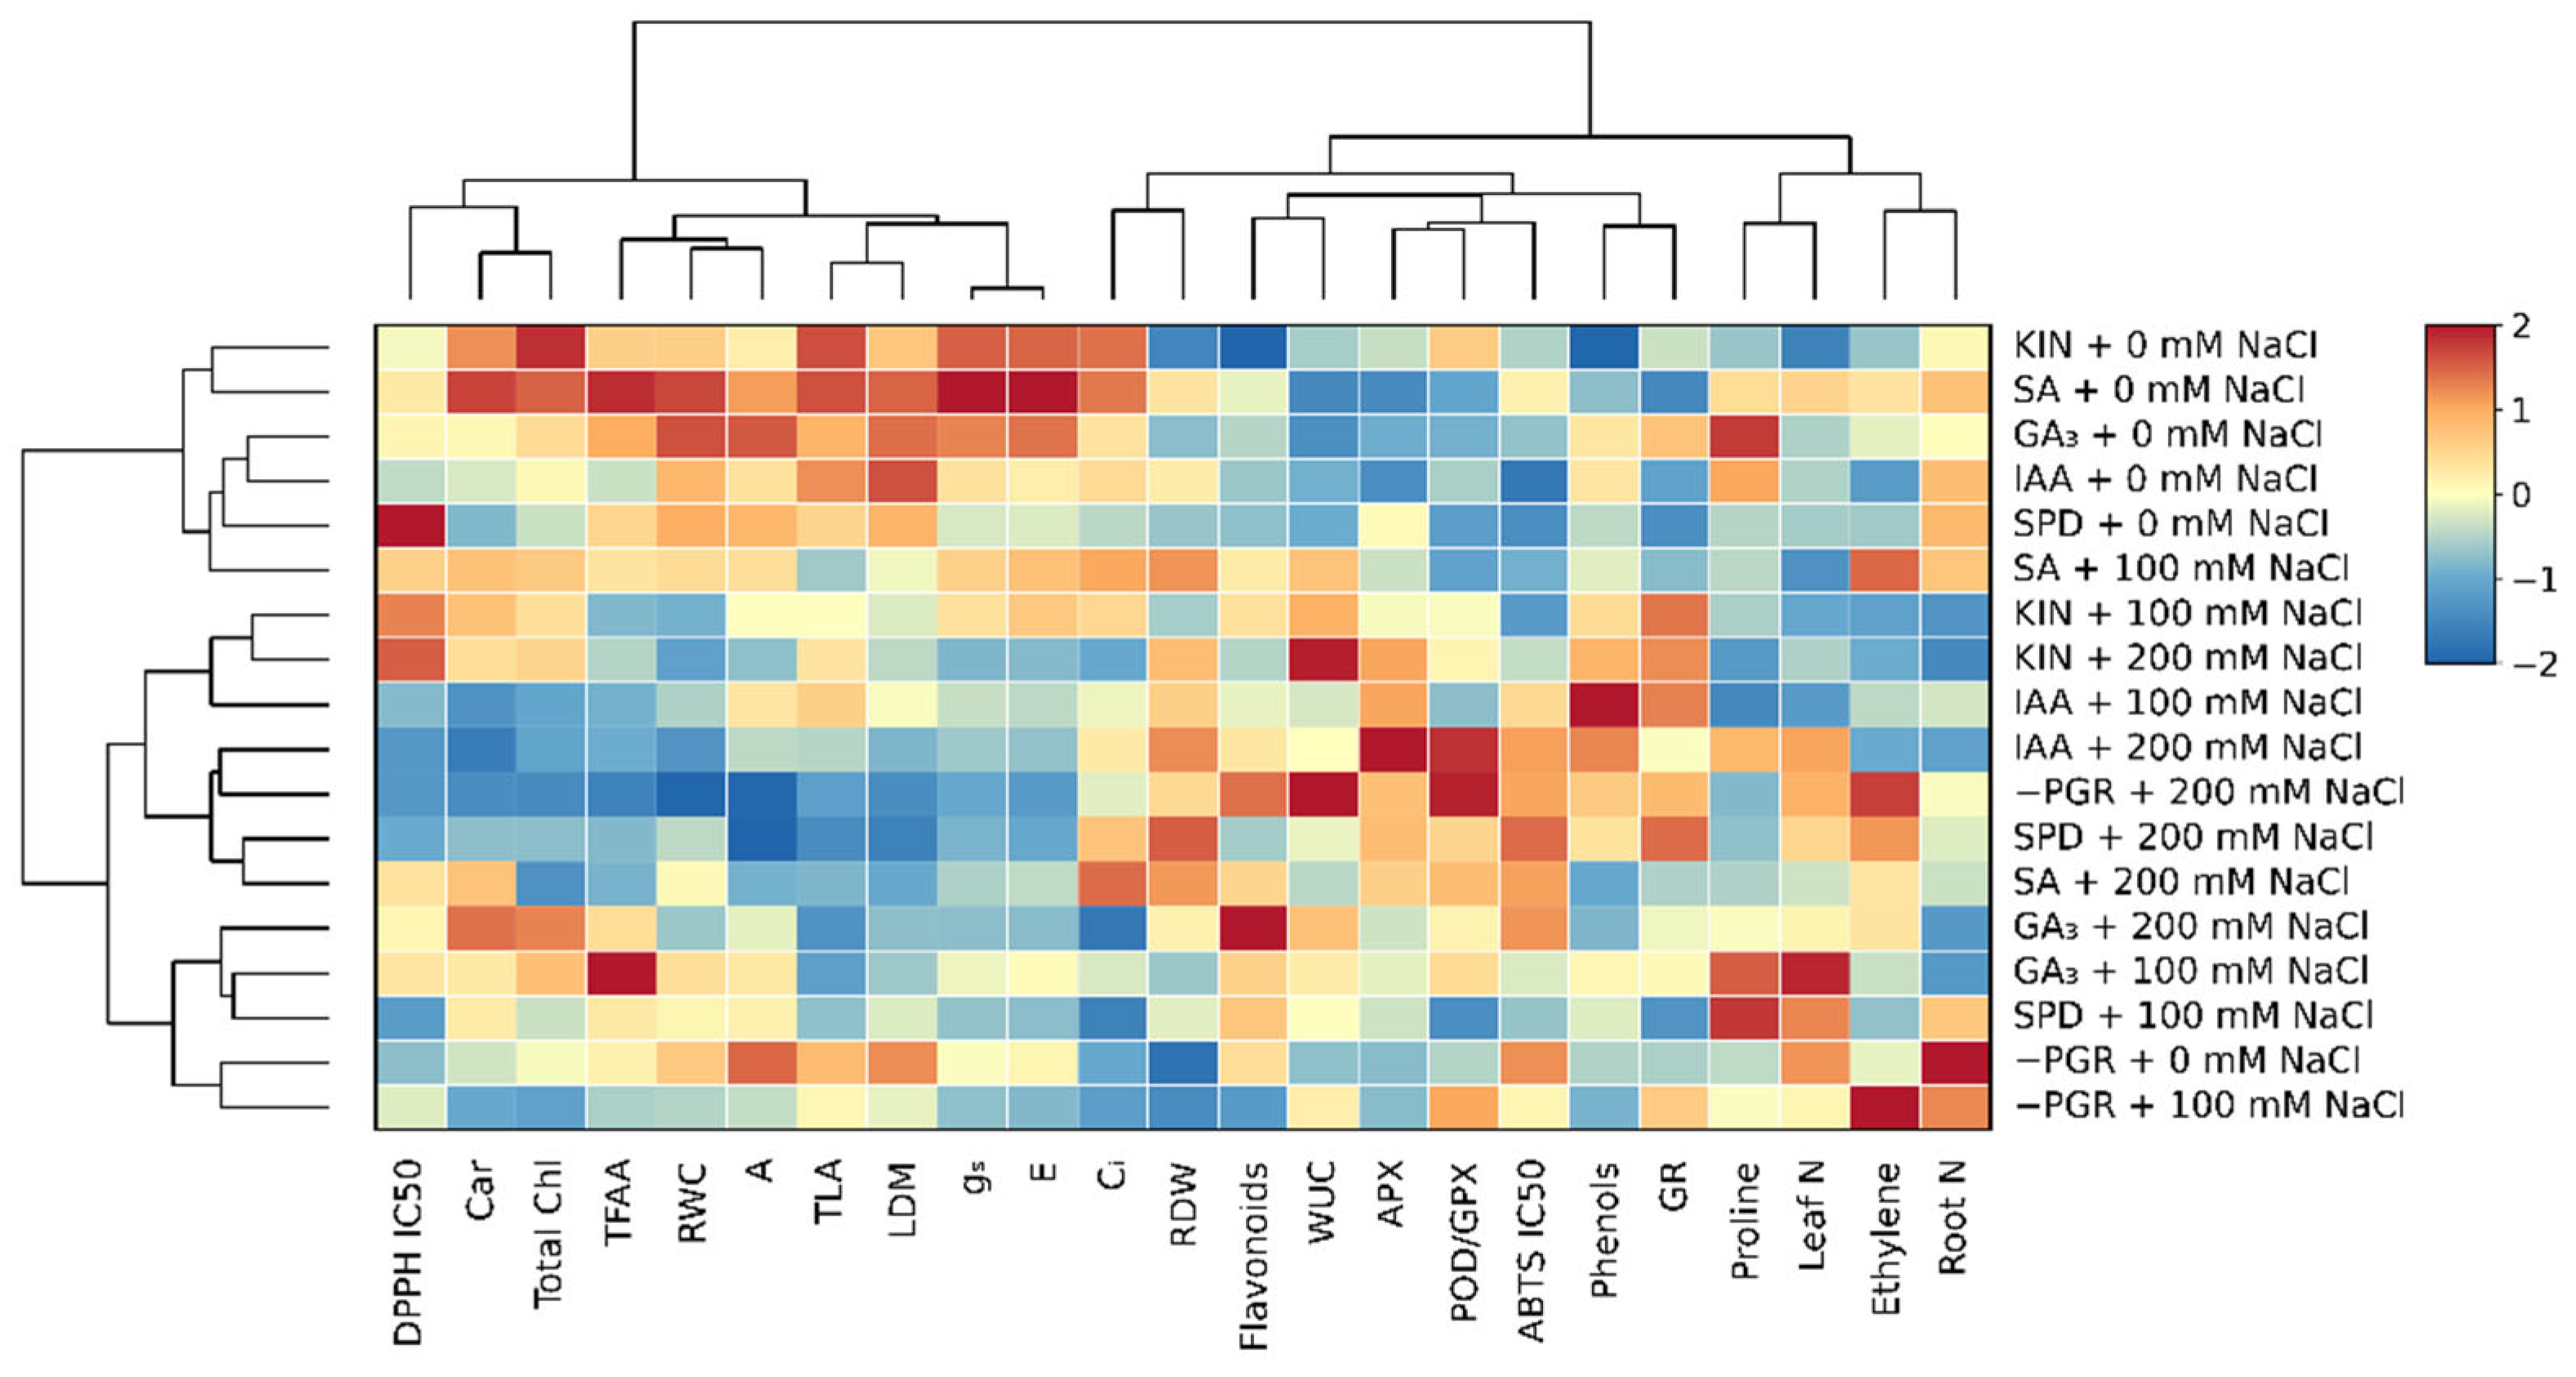
Figure 11.
Principal component analysis (PCA) based on the standardised values of 23 growth, water-status, nutritional, photosynthetic, pigment, and biochemical variables obtained from the 18 treatment means. (A) PCA biplot showing treatment scores and variable loadings. Shaded ellipses represent the descriptive dispersion of the six treatment means within each salinity level. (B) PGR-induced displacements in the common PCA score space, shown separately at 0, 100, and 200 mM NaCl. Arrows originate from −PGR and indicate the direction and magnitude of the multivariate displacement associated with each PGR; they are visual connectors between treatment scores and do not represent variable loadings.
Figure 11.
Principal component analysis (PCA) based on the standardised values of 23 growth, water-status, nutritional, photosynthetic, pigment, and biochemical variables obtained from the 18 treatment means. (A) PCA biplot showing treatment scores and variable loadings. Shaded ellipses represent the descriptive dispersion of the six treatment means within each salinity level. (B) PGR-induced displacements in the common PCA score space, shown separately at 0, 100, and 200 mM NaCl. Arrows originate from −PGR and indicate the direction and magnitude of the multivariate displacement associated with each PGR; they are visual connectors between treatment scores and do not represent variable loadings.
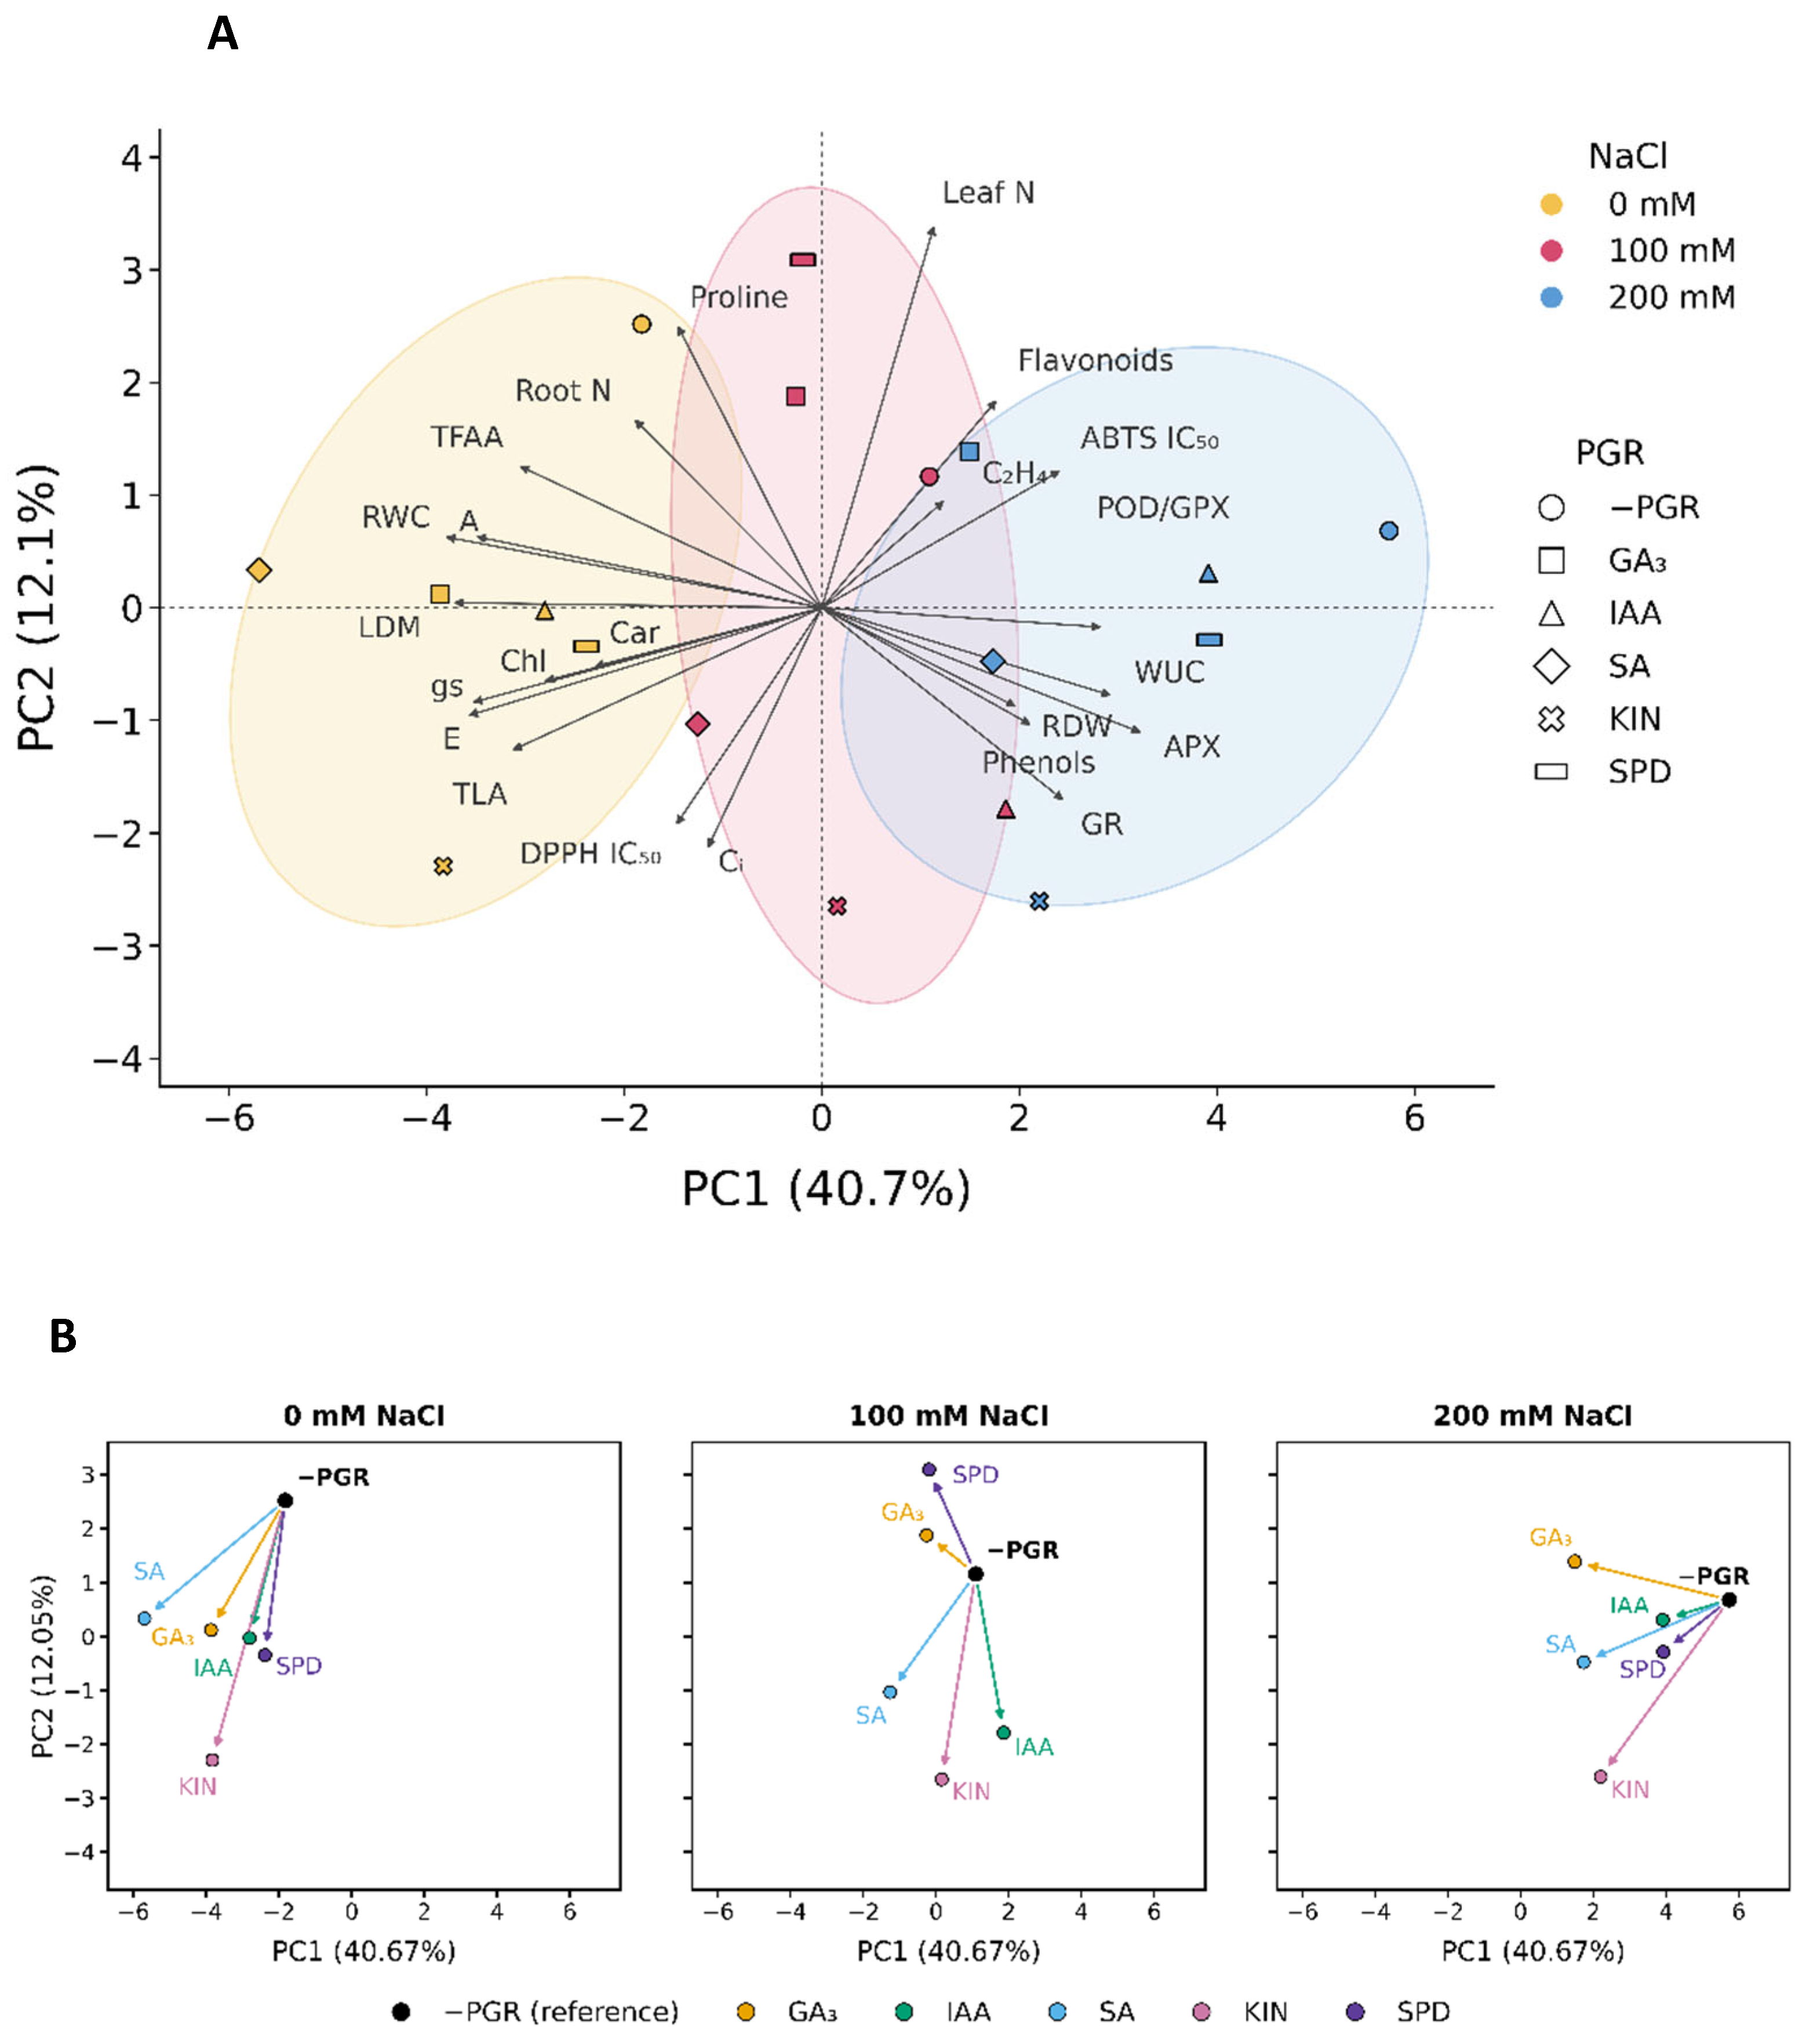

Table 1.
Effects of plant growth regulator (PGR) treatments and salinity (0, 100, and 200 mM NaCl) on R/S, TLA, TSL, RWC, and WUC in one-year-old olive plants. Values are means ± standard error (SE; n = 6 for R/S, TLA, and TSL; n = 3 for RWC and WUC). Different lowercase letters indicate significant differences among PGR treatments within the same NaCl concentration, whereas different uppercase letters indicate significant differences among NaCl concentrations within the same PGR treatment, according to Tukey’s test (p < 0.05). Shared letters indicate no significant differences. Abbreviations: R/S, root-to-shoot ratio; TLA, total leaf area; TSL, total shoot length; RWC, relative water content; WUC, water uptake capacity; −PGR, without plant growth regulator; GA3, gibberellic acid; IAA, indole-3-acetic acid; SA, salicylic acid; KIN, kinetin; SPD, spermidine.
Table 1.
Effects of plant growth regulator (PGR) treatments and salinity (0, 100, and 200 mM NaCl) on R/S, TLA, TSL, RWC, and WUC in one-year-old olive plants. Values are means ± standard error (SE; n = 6 for R/S, TLA, and TSL; n = 3 for RWC and WUC). Different lowercase letters indicate significant differences among PGR treatments within the same NaCl concentration, whereas different uppercase letters indicate significant differences among NaCl concentrations within the same PGR treatment, according to Tukey’s test (p < 0.05). Shared letters indicate no significant differences. Abbreviations: R/S, root-to-shoot ratio; TLA, total leaf area; TSL, total shoot length; RWC, relative water content; WUC, water uptake capacity; −PGR, without plant growth regulator; GA3, gibberellic acid; IAA, indole-3-acetic acid; SA, salicylic acid; KIN, kinetin; SPD, spermidine.
| PGR | R/S | TLA (cm² plant-1) | TSL (cm plant-1) | RWC (%) | WUC (g H2O g-1 DW) | |
| 0 mM NaCl | ||||||
| −PGR | 0.18 ± 0.005 dC | 178.61 ± 8.474 bA | 24.47 ± 0.304 aA | 81.82 ± 1.416 aA | 0.388 ± 0.077 aB | |
| GA3 | 0.22 ± 0.010 bcdB | 181.63 ± 6.956 abA | 21.17 ± 0.848 bA | 88.33 ± 1.382 aA | 0.266 ± 0.027 aB | |
| IAA | 0.28 ± 0.019 aA | 192.27 ± 3.102 abA | 24.67 ± 0.529 aA | 83.23 ± 1.149 aA | 0.350 ± 0.033 aB | |
| SA | 0.26 ± 0.010 abB | 207.77 ± 9.193 aA | 22.01 ± 0.664 abA | 88.67 ± 1.099 aA | 0.246 ± 0.018 aC | |
| KIN | 0.19 ± 0.009 cdC | 208.81 ± 4.747 aA | 19.50 ± 0.518 bA | 81.53 ± 3.875 aA | 0.416 ± 0.036 aB | |
| SPD | 0.23 ± 0.007 abcB | 167.21 ± 5.449 bA | 16.50 ± 0.933 cA | 83.94 ± 1.163 aA | 0.341 ± 0.009 aB | |
| 100 mM NaCl | ||||||
| −PGR | 0.20 ± 0.003 dB | 152.40 ± 4.168 aB | 18.13 ± 0.320 aB | 74.15 ± 3.141 aAB | 0.564 ± 0.058 abB | |
| GA3 | 0.24 ± 0.012 cdB | 107.21 ± 6.327 cB | 17.98 ± 0.895 aB | 80.02 ± 1.520 aAB | 0.567 ± 0.048 abA | |
| IAA | 0.29 ± 0.012 abA | 169.67 ± 7.609 aA | 18.20 ± 0.858 aB | 74.02 ± 0.132 aB | 0.471 ± 0.022 bAB | |
| SA | 0.31 ± 0.010 aA | 125.98 ± 5.425 bcB | 15.96 ± 0.493 aB | 80.30 ± 3.144 aAB | 0.661 ± 0.049 abA | |
| KIN | 0.24 ± 0.007 cdB | 148.25 ± 4.774 abB | 15.93 ± 0.564 aB | 71.49 ± 3.419 aA | 0.703 ± 0.054 aA | |
| SPD | 0.26 ± 0.012 bcB | 121.87 ± 4.075 cB | 17.57 ± 0.400 aA | 78.29 ± 1.264 aAB | 0.522 ± 0.027 abA | |
| 200 mM NaCl | ||||||
| −PGR | 0.30 ± 0.007 bcA | 106.49 ± 2.166 cC | 10.90 ± 0.756 cdC | 64.20 ± 5.409 aB | 0.914 ± 0.021 aA | |
| GA3 | 0.28 ± 0.008 cA | 99.72 ± 2.195 cB | 16.32 ± 0.704 aB | 73.15 ± 4.191 aB | 0.666 ± 0.064 bcA | |
| IAA | 0.33 ± 0.013 abA | 130.82 ± 6.432 bB | 13.90 ± 0.667 abC | 68.72 ± 1.775 aB | 0.524 ± 0.033 cA | |
| SA | 0.33 ± 0.008 abA | 117.44 ± 7.342 bcB | 12.82 ± 0.447 bcC | 77.95 ± 2.064 aB | 0.440 ± 0.033 cB | |
| KIN | 0.30 ± 0.005 bcA | 160.11 ± 7.479 aB | 14.32 ± 0.658 abB | 70.14 ± 1.627 aA | 0.894 ± 0.077 abA | |
| SPD | 0.35 ± 0.013 aA | 96.55 ± 1.771 cC | 9.60 ± 0.586 dB | 74.58 ± 2.756 aB | 0.499 ± 0.037 cA | |
Table 2.
Effects of plant growth regulator (PGR) treatments and salinity (NaCl: 0, 100, and 200 mM) on nitrogen (N) and carbon (C) concentrations and the carbon-to-nitrogen ratio (C/N) in leaves and roots of one-year-old olive plants. Values are means ± standard error (SE; n = 3). Different lowercase letters indicate significant differences among PGR treatments within the same NaCl concentration, whereas different uppercase letters indicate significant differences among NaCl concentrations within the same PGR treatment, according to Tukey’s test (p < 0.05). Abbreviations: DW, dry weight; −PGR, without plant growth regulator; GA3, gibberellic acid; IAA, indole-3-acetic acid; SA, salicylic acid; KIN, kinetin; SPD, spermidine.
Table 2.
Effects of plant growth regulator (PGR) treatments and salinity (NaCl: 0, 100, and 200 mM) on nitrogen (N) and carbon (C) concentrations and the carbon-to-nitrogen ratio (C/N) in leaves and roots of one-year-old olive plants. Values are means ± standard error (SE; n = 3). Different lowercase letters indicate significant differences among PGR treatments within the same NaCl concentration, whereas different uppercase letters indicate significant differences among NaCl concentrations within the same PGR treatment, according to Tukey’s test (p < 0.05). Abbreviations: DW, dry weight; −PGR, without plant growth regulator; GA3, gibberellic acid; IAA, indole-3-acetic acid; SA, salicylic acid; KIN, kinetin; SPD, spermidine.
| PGR | Leaves | Roots | ||||||
| N (% DW) | C (% DW) | C/N | N (% DW) | C (% DW) | C/N | |||
| 0 mM NaCl | ||||||||
| −PGR | 2.38 ± 0.023 aA | 49.33 ± 0.071 dB | 20.72 ± 0.210 dB | 2.97 ± 0.033 aA | 43.02 ± 0.330 bcA | 14.47 ± 0.218 dB | ||
| GA3 | 2.07 ± 0.017 cC | 49.51 ± 0.045 cdA | 23.96 ± 0.194 bA | 2.40 ± 0.042 cA | 42.55 ± 0.275 cA | 17.76 ± 0.427 abB | ||
| IAA | 2.07 ± 0.019 cB | 49.87 ± 0.034 bC | 24.12 ± 0.237 bB | 2.61 ± 0.012 bA | 43.04 ± 0.078 bcA | 16.47 ± 0.097 cC | ||
| SA | 2.26 ± 0.018 bA | 50.36 ± 0.108 aA | 22.27 ± 0.211 cC | 2.60 ± 0.017 bA | 42.55 ± 0.271 cA | 16.34 ± 0.038 cB | ||
| KIN | 1.87 ± 0.015 dC | 49.39 ± 0.064 dB | 26.42 ± 0.224 aA | 2.42 ± 0.005 cA | 43.93 ± 0.090 abA | 18.18 ± 0.073 aB | ||
| SPD | 2.05 ± 0.042 cC | 49.78 ± 0.051 bcA | 24.25 ± 0.485 bA | 2.63 ± 0.046 bA | 44.30 ± 0.198 aA | 16.85 ± 0.368 bcA | ||
| 100 mM NaCl | ||||||||
| −PGR | 2.19 ± 0.013 cB | 49.06 ± 0.099 cB | 22.44 ± 0.182 bA | 2.74 ± 0.067 aB | 43.72 ± 0.327 aA | 15.98 ± 0.462 cA | ||
| GA3 | 2.52 ± 0.029 aA | 48.53 ± 0.054 dB | 19.26 ± 0.218 cC | 2.05 ± 0.032 cB | 42.07 ± 0.217 bA | 20.58 ± 0.378 aA | ||
| IAA | 1.94 ± 0.041 dC | 51.11 ± 0.057 aA | 26.37 ± 0.552 aA | 2.31 ± 0.062 bB | 41.50 ± 0.237 bB | 18.00 ± 0.520 bB | ||
| SA | 1.91 ± 0.015 dC | 49.26 ± 0.087 cB | 25.77 ± 0.227 aA | 2.58 ± 0.029 aA | 41.87 ± 0.115 bAB | 16.20 ± 0.145 cB | ||
| KIN | 1.97 ± 0.017 dB | 49.63 ± 0.041 bB | 25.17 ± 0.204 aB | 2.03 ± 0.028 cB | 43.88 ± 0.099 aA | 21.65 ± 0.335 aA | ||
| SPD | 2.40 ± 0.016 bA | 46.91 ± 0.070 eB | 19.54 ± 0.138 cC | 2.58 ± 0.032 aAB | 44.53 ± 0.106 aA | 17.24 ± 0.185 bcA | ||
| 200 mM NaCl | ||||||||
| −PGR | 2.34 ± 0.015 aA | 50.19 ± 0.095 abA | 21.47 ± 0.167 cB | 2.38 ± 0.035 aC | 41.30 ± 0.105 bcB | 17.34 ± 0.266 dA | ||
| GA3 | 2.19 ± 0.006 bB | 49.45 ± 0.148 cdA | 22.59 ± 0.011 bB | 2.05 ± 0.036 cB | 42.40 ± 0.267 abA | 20.71 ± 0.493 abA | ||
| IAA | 2.36 ± 0.018 aA | 50.70 ± 0.052 aB | 21.48 ± 0.152 cC | 2.08 ± 0.013 bcC | 41.79 ± 0.251 bcB | 20.07 ± 0.179 abA | ||
| SA | 2.10 ± 0.025 cB | 49.36 ± 0.075 dB | 23.47 ± 0.243 aB | 2.30 ± 0.032 abB | 41.15 ± 0.190 cB | 17.91 ± 0.208 cdA | ||
| KIN | 2.07 ± 0.020 cA | 50.13 ± 0.119 bA | 24.26 ± 0.232 aB | 1.98 ± 0.036 cB | 42.06 ± 0.311 abB | 21.26 ± 0.340 aA | ||
| SPD | 2.26 ± 0.012 bB | 50.01 ± 0.177 bcA | 22.17 ± 0.191 bcB | 2.33 ± 0.093 aB | 42.89 ± 0.370 aB | 18.46 ± 0.923 cdA | ||
Table 3.
Effects of plant growth regulator (PGR) treatments and salinity (NaCl: 0, 100, and 200 mM) on pigment ratios in leaves of one-year-old olive plants. Values are means ± standard error (SE; n = 4). Different lowercase letters indicate significant differences among PGR treatments within the same NaCl concentration, whereas different uppercase letters indicate significant differences among NaCl concentrations within the same PGR treatment, according to Tukey’s test (p < 0.05). Abbreviations: Chl a/b, chlorophyll a-to-chlorophyll b ratio; Chl a+b/Car, total chlorophyll-to-carotenoids ratio; −PGR, without plant growth regulator; GA3, gibberellic acid; IAA, indole-3-acetic acid; SA, salicylic acid; KIN, kinetin; SPD, spermidine.
Table 3.
Effects of plant growth regulator (PGR) treatments and salinity (NaCl: 0, 100, and 200 mM) on pigment ratios in leaves of one-year-old olive plants. Values are means ± standard error (SE; n = 4). Different lowercase letters indicate significant differences among PGR treatments within the same NaCl concentration, whereas different uppercase letters indicate significant differences among NaCl concentrations within the same PGR treatment, according to Tukey’s test (p < 0.05). Abbreviations: Chl a/b, chlorophyll a-to-chlorophyll b ratio; Chl a+b/Car, total chlorophyll-to-carotenoids ratio; −PGR, without plant growth regulator; GA3, gibberellic acid; IAA, indole-3-acetic acid; SA, salicylic acid; KIN, kinetin; SPD, spermidine.
| PGR | Chl a/b | Total chlorophyll/carotenoids | |||||
| 0 mM | 100 mM | 200 mM | 0 mM | 100 mM | 200 mM | ||
| −PGR | 2.702 ± 0.008 bcB | 2.596 ± 0.005 bcC | 2.766 ± 0.007 aA | 4.092 ± 0.128 bcA | 3.441 ± 0.124 cdB | 3.353 ± 0.062 dB | |
| GA3 | 2.718 ± 0.019 bcA | 2.674 ± 0.016 bA | 2.716 ± 0.007 abA | 4.239 ± 0.023 bB | 4.426 ± 0.014 aA | 3.989 ± 0.008 bC | |
| IAA | 2.808 ± 0.037 aA | 2.562 ± 0.043 cB | 2.631 ± 0.031 bB | 4.183 ± 0.044 bcA | 3.889 ± 0.031 bB | 4.243 ± 0.016 aA | |
| SA | 2.787 ± 0.008 abA | 2.851 ± 0.023 aA | 2.200 ± 0.048 dB | 3.961 ± 0.013 cA | 3.914 ± 0.024 bA | 2.084 ± 0.035 eB | |
| KIN | 2.721 ± 0.015 abcA | 2.644 ± 0.019 bcB | 2.455 ± 0.001 cC | 4.604 ± 0.020 aA | 3.672 ± 0.021 bcC | 4.058 ± 0.006 bB | |
| SPD | 2.659 ± 0.015 cA | 2.659 ± 0.008 bcA | 2.352 ± 0.002 cB | 4.256 ± 0.013 bA | 3.309 ± 0.010 dC | 3.637 ± 0.011 cB | |
Table 4.
Effects of plant growth regulator (PGR) treatments and salinity (0, 100, and 200 mM NaCl) on intercellular CO₂ concentration (Cᵢ) and photosynthetic nitrogen-use efficiency (PNUE) in leaves of one-year-old olive plants. Values are means ± standard error (SE; n = 3). Different lowercase letters indicate significant differences among PGR treatments within the same NaCl concentration, whereas different uppercase letters indicate significant differences among NaCl concentrations within the same PGR treatment, according to Tukey’s test (p < 0.05). Abbreviations: Cᵢ, intercellular CO₂ concentration; PNUE, photosynthetic nitrogen-use efficiency; −PGR, without plant growth regulator; GA3, gibberellic acid; IAA, indole-3-acetic acid; SA, salicylic acid; KIN, kinetin; SPD, spermidine.
Table 4.
Effects of plant growth regulator (PGR) treatments and salinity (0, 100, and 200 mM NaCl) on intercellular CO₂ concentration (Cᵢ) and photosynthetic nitrogen-use efficiency (PNUE) in leaves of one-year-old olive plants. Values are means ± standard error (SE; n = 3). Different lowercase letters indicate significant differences among PGR treatments within the same NaCl concentration, whereas different uppercase letters indicate significant differences among NaCl concentrations within the same PGR treatment, according to Tukey’s test (p < 0.05). Abbreviations: Cᵢ, intercellular CO₂ concentration; PNUE, photosynthetic nitrogen-use efficiency; −PGR, without plant growth regulator; GA3, gibberellic acid; IAA, indole-3-acetic acid; SA, salicylic acid; KIN, kinetin; SPD, spermidine.
| PGR | 0 mM NaCl | 100 mM NaCl | 200 mM NaCl | |||
|
Cᵢ (µmol CO₂ mol⁻¹) |
PNUE (µmol CO₂ mol⁻¹ N s⁻¹) |
Cᵢ (µmol CO₂ mol⁻¹) |
PNUE (µmol CO₂ mol⁻¹ N s⁻¹) |
Cᵢ (µmol CO₂ mol⁻¹) |
PNUE (µmol CO₂ mol⁻¹ N s⁻¹) |
|
| −PGR | 232.62 ± 12.09 dB | 30.57 ± 0.49 aA | 218.13 ± 15.65 cB | 15.75 ± 1.44 bB | 307.17 ± 6.17 cA | 4.00 ± 0.28 cC |
| GA3 | 358.10 ± 8.78 bA | 31.71 ± 0.94 aA | 301.21 ± 12.08 bA | 20.56 ± 1.62 abB | 166.41 ± 13.69 eB | 22.48 ± 1.80 aB |
| IAA | 366.90 ± 15.90 bA | 23.84 ± 0.69 bcA | 314.52 ± 17.00 bA | 25.24 ± 0.34 aA | 350.00 ± 13.40 bcA | 13.70 ± 0.79 bB |
| SA | 450.86 ± 12.01 aA | 26.87 ± 0.47 bA | 420.46 ± 15.15 aA | 23.84 ± 1.77 aA | 459.32 ± 13.10 aA | 12.06 ± 0.69 bB |
| KIN | 455.54 ± 12.16 aA | 21.98 ± 1.00 cA | 369.63 ± 10.51 abB | 5.03 ± 0.25 cB | 233.50 ± 15.02 dC | 2.99 ± 0.18 cB |
| SPD | 284.11 ± 5.44 cB | 22.20 ± 0.81 cA | 179.59 ± 15.63 cC | 17.61 ± 1.49 bB | 393.83 ± 15.95 abA | 3.83 ± 0.19 cC |
Table 5.
Effects of plant growth regulator (PGR) treatments and salinity (NaCl: 0, 100, and 200 mM) on the antioxidant capacity of leaf extracts from one-year-old olive plants, determined using the ABTS and DPPH radical-scavenging assays. Values are means ± standard error (SE; n = 6). Within each assay, different lowercase letters indicate significant differences among PGR treatments within the same NaCl concentration, whereas different uppercase letters indicate significant differences among NaCl concentrations within the same PGR treatment, according to Tukey’s test (p < 0.05). Abbreviations: IC50, concentration required to inhibit 50 % of the radical; −PGR, without plant growth regulator; GA3, gibberellic acid; IAA, indole-3-acetic acid; SA, salicylic acid; KIN, kinetin; SPD, spermidine. ABTS IC₅₀ estimated by extrapolation beyond the experimental range of 50–700 µg mL⁻¹. DPPH IC50 estimated by extrapolation beyond the experimental range of 10–50 µg mL⁻¹.
Table 5.
Effects of plant growth regulator (PGR) treatments and salinity (NaCl: 0, 100, and 200 mM) on the antioxidant capacity of leaf extracts from one-year-old olive plants, determined using the ABTS and DPPH radical-scavenging assays. Values are means ± standard error (SE; n = 6). Within each assay, different lowercase letters indicate significant differences among PGR treatments within the same NaCl concentration, whereas different uppercase letters indicate significant differences among NaCl concentrations within the same PGR treatment, according to Tukey’s test (p < 0.05). Abbreviations: IC50, concentration required to inhibit 50 % of the radical; −PGR, without plant growth regulator; GA3, gibberellic acid; IAA, indole-3-acetic acid; SA, salicylic acid; KIN, kinetin; SPD, spermidine. ABTS IC₅₀ estimated by extrapolation beyond the experimental range of 50–700 µg mL⁻¹. DPPH IC50 estimated by extrapolation beyond the experimental range of 10–50 µg mL⁻¹.
| A. ABTSIC50 (µg mL-1) | |||
| Growth regulator | 0 mM NaCl | 100 mM NaCl | 200 mM NaCl |
| −PGR | 277.74 ± 0.16 fC | 403.05 ± 0.47 eA | 301.31 ± 1.05 bB |
| GA3 | 562.04 ± 2.07 cA | 453.31 ± 2.43 dB | 286.36 ± 0.45 cC |
| IAA | 1093.70 ± 2.18 aA1 | 359.57 ± 1.48 fB | 297.68 ± 0.53 bC |
| SA | 402.44 ± 0.21 eB | 646.49 ± 0.80 bA | 288.85 ± 1.04 cC |
| KIN | 518.95 ± 1.05 dB | 769.30 ± 7.35 aA1 | 499.73 ± 2.81 aC |
| SPD | 893.53 ± 3.95 bA1 | 559.34 ± 2.47 cB | 245.43 ± 0.51 dC |
| B. DPPHIC50(µg mL-1) | |||
| Growth regulator | 0 mM NaCl | 100 mM NaCl | 200 mM NaCl |
| −PGR | 31.00 ± 0.15 fB | 44.45 ± 0.27 dA | 18.89 ± 0.35 eC |
| GA3 | 52.46 ± 0.37 cB2 | 57.07 ± 0.53 cA2 | 52.54 ± 0.26 cB2 |
| IAA | 39.44 ± 0.06 eA | 30.00 ± 0.18 eB | 18.60 ± 0.47 eC |
| SA | 55.83 ± 0.14 bC2 | 63.50 ± 0.29 bA2 | 58.40 ± 0.15 bB2 |
| KIN | 47.74 ± 0.43 dC | 81.00 ± 1.16 aB2 | 87.24 ± 1.49 aA2 |
| SPD | 108.46 ± 2.50 aA2 | 20.49 ± 0.34 fC | 25.22 ± 0.15 dB |
1 ABTS IC50 values not reached within the tested extract-concentration range. 2 DPPH IC₅₀ values not reached within the tested extract-concentration range.
Disclaimer/Publisher’s Note: The statements, opinions and data contained in all publications are solely those of the individual author(s) and contributor(s) and not of MDPI and/or the editor(s). MDPI and/or the editor(s) disclaim responsibility for any injury to people or property resulting from any ideas, methods, instructions or products referred to in the content. |
© 2026 by the authors. Licensee MDPI, Basel, Switzerland. This article is an open access article distributed under the terms and conditions of the Creative Commons Attribution (CC BY) license (http://creativecommons.org/licenses/by/4.0/).
Copyright: This open access article is published under a Creative Commons CC BY 4.0 license, which permit the free download, distribution, and reuse, provided that the author and preprint are cited in any reuse.