

Submitted:
31 October 2026
Posted:
03 November 2026
You are already at the latest version
Abstract
We present a comprehensive, time-resolved dataset of yeast cultivation dynamics to support data-driven bioprocess engineering and process analytical technology development. The dataset comprises 52 controlled bioreactor cultivations of two industrially relevant yeast species, Saccharomyces cerevisiae and Saccharomyces pastorianus, each conducted over 72 – 76 h at two scales (0.7 L and 10 L working volume) under systematic parameter variation. A total of 43 variables are provided, comprising 30 inline variables (30 s resolution) and 13 offline variables sampled up to three times per day, enabling multimodal characterization of cultivation dynamics. Importantly, the dataset preserves real experimental conditions, including measurement noise, outliers, and different types of missing data arising from sensor failures, transmission errors, and process interruptions. By retaining these non-ideal characteristics, the dataset enables realistic evaluation of modeling, monitoring, and control approaches. It provides a valuable resource for dynamic process analysis, system identification, soft sensor development, fault detection, and validation of advanced data-driven methods under practical operating conditions.
Keywords:
bioprocess
; brewer’s yeast
; process analytical technology (PAT)
; yeast propagation
Background & Summary
Yeasts of the genus Saccharomyces are widely used in biotechnology, food production, and fundamental research. Their application spans diverse areas, including model organism research and industrial fermentation processes such as beer brewing, where controlled yeast propagation is a critical step. In these contexts, understanding the dynamic behavior of yeast cultivation processes is essential for improving productivity, robustness, and product quality [1]. Despite the long-standing importance of yeast-based processes, the availability of comprehensive, time-resolved experimental datasets describing cultivation dynamics remains limited. However, the increasing adoption of Process Analytical Technology (PAT) and data-driven approaches in bioprocess engineering has created a growing demand for datasets that combine high-frequency measurements, multiple sensing modalities, and process-relevant cultivation conditions [2]. Such datasets are critical for the development and validation of dynamic models, soft sensors, and advanced control strategies [3]. However, publicly available resources that integrate these aspects in yeast cultivation systems are scarce.
To address this gap, we present a dataset of 52 cultivations, each comprising 30 inline variables (30 s resolution) and 13 offline variables sampled up to three times per day. To place this dataset in the context of existing publicly available resources, a structured search of data repositories was conducted. The search covered the platforms Scientific Data, Zenodo, IEEE DataPort, and FORDATIS, using a consistent query across all databases: (yeast OR saccharomyces) AND ((cultivation OR fermentation OR propagation) OR (sensor OR probe OR sensing OR PAT)). The search returned 140 records in total (FORDATIS: n = 0; IEEE DataPort: n = 0; Scientific Data: n = 39; Zenodo: n = 101). Records were screened based on title and topic relevance. Only four publications were identified as partially comparable, based on the availability of experimental data or sufficiently detailed methodological descriptions related to yeast cultivation and measurement strategies. A large proportion of retrieved records were excluded because they either focused on genomic or omics data without process context, or did not provide publicly accessible datasets or sufficient descriptions.
Existing datasets in this domain predominantly focus on either high-throughput strain screening or targeted metabolic investigations, typically relying on discrete offline sampling. For example, Contreras-Ruiz et al. [4] performed microfermentation experiments to assess competitive fitness and nutrient uptake across multiple Saccharomyces cerevisiae strains. While this study provides extensive biological coverage, measurements were obtained at predefined time points using analytical techniques such as HPLC and qPCR, resulting in limited temporal resolution. Similarly, Monnin et al. [5] investigated variability in primary fermentation metabolite yields across 51 Saccharomyces cerevisiae strains under wine fermentation conditions. Fermentation progress was primarily monitored using gravimetric measurements, while metabolite quantification was conducted at the beginning and end of the process. This approach enables comparative analysis across strains but does not capture continuous process dynamics. Costello et al. [6] combined laboratory- and pilot-scale fermentations to study yeast–bacteria interactions, including systems up to 50 L. However, data acquisition relied on manual sampling and offline analysis of selected compounds, without integration of inline sensors or continuous monitoring. In contrast to these fermentation-based studies, Peters et al. [7] demonstrated high-frequency metabolic measurements using hyperpolarized nuclear magnetic resonance spectroscopy, achieving temporal resolutions in the range of seconds. While this approach enables real-time observation of metabolic conversions, experiments were conducted in small-volume systems (µL scale), which may limit the direct transferability to larger-scale bioprocess environments.
The dataset presented here differs from the identified studies in several key aspects. First, it comprises 52 cultivations of two yeast strains, each of 72 – 76 h duration, conducted under parameter variation in bioreactor systems at 0.7 L and 10 L scales (working volume). The experimental design was inspired by brewing-related propagation processes: a top-fermenting (Saccharomyces cerevisiae) and a bottom-fermenting (Saccharomyces pastorianus) yeast were cultivated in wort-based media to approximate conditions relevant to industrial yeast propagation. At the same time, the dataset is not restricted to brewing applications but provides a generalizable representation of yeast cultivation dynamics under defined, process-relevant conditions. Second, the dataset includes high-resolution inline measurements recorded at 30-second intervals using six sensors, complemented by offline measurements of 13 additional variables sampled up to three times per day. The inline sensors provide 30 distinct variables, as several sensors record multiple parameters simultaneously. In total, the dataset contains 43 process and analytical variables, enabling a detailed, time-resolved characterization of yeast cultivation dynamics. Importantly, the dataset reflects real experimental process conditions, including typical imperfections encountered in bioprocess monitoring [3]. As such, the data contain measurement noise, outliers, and missing values, arising from practical limitations such as power cut-offs and temporary sensor failures. Different types of data gaps are represented, ranging from the loss of individual sensors to partial or complete temporary loss of multiple sensor signals. These include contiguous, block wise missing intervals affecting all variables simultaneously, for example due to a temporary power outage, as well as sporadic, short-term gaps in individual sensor signals, typically caused by temporary sensor glitches or random transmission errors (sensor jitter). Both types of missingness arise from exogenous technical factors and can therefore be considered largely independent of the underlying bioprocess state, i.e., approximating a Missing Completely at Random (MCAR) mechanism [8]. While block wise gaps result in extended interruptions of the data streams, short-term gaps typically affect only one or two consecutive observations and are often amenable to standard interpolation approaches [9,10]. Rather than being removed or artificially corrected, these characteristics are preserved in the published dataset. This aspect represents a deliberate design choice and a key advantage of the dataset. In contrast to simulated or heavily curated datasets, which often exhibit idealized behavior, the present data enable the investigation of realistic process scenarios, including faulty measurements and incomplete data streams. This makes the dataset particularly suitable for data-driven modeling, monitoring, and analysis under non-ideal conditions, including process modeling, system identification, fault detection, and the development and validation of soft sensors and control approaches.
In combination, these characteristics distinguish the dataset from existing resources, which typically emphasize either experimental breadth or measurement resolution. The presented dataset instead provides a time-resolved, multimodal description of yeast cultivation processes, supporting applications such as dynamic process analysis, model development, and evaluation of process analytical technologies.
Methods
Medium Preparation
Hopped wort was prepared from malt extract (Weyermann® Bavarian Pilsner, Weyermann Spezialmalze, Bamberg, Germany). To achieve the target original extract (12 or 24 °Plato), malt extract was dissolved in warm tap water and subsequently boiled. Hop extract (46 % α-acids; Hallertau/Bitter Hopsteiner total resin extract, Simon H. Steiner, Hopfen, Mainburg, Germany) was added at 0.17 g L-1, followed by boiling for 30 min. The original extract was adjusted to 12 or 24 °Plato by tap water addition. The wort was stirred to induce a whirlpool effect in order to separate the cold trub, then cooled to approx. 80 °C for 15 – 20 min with the lid closed, filled hot into bags, and frozen until use.
Pre-Culture
The dry yeasts Saccharomyces pastorianus (SafLager™ W-34/70) and Saccharomyces cerevisiae (SafAle™ W-68; both Fermentis by Lesaffre, Marcq-en-Barœul, France) were used in this study. In the following and in the datasets, the yeasts are consistently referred to as W-3470 and W-68, respectively. For the precultures, 150 mL of thawed wort (12 °Plato) were dispensed into 1 L narrow-neck flasks without baffles, sealed with gas-permeable stoppers. For the 3-hour preculture, 50 g L⁻¹ dry yeast was added. For the 24-hour preculture, 5 g L⁻¹ dry yeast was added for the small-scale (0.7 L working volume) experiments; for the pilot-scale (10 L working volume), 17 g L⁻¹ W-34/70 and 34 g L⁻¹ W-68 were used. The flasks were incubated for 3 h or 24 h (depending on the chosen pre-culture duration, see Tab. 1) at 22 °C and 140 rpm, with a shaking amplitude of 50 mm.
Viable cell densitiy (VCD) of the pre-culture was determined via methylene blue staining (see Offline Analysis). For reactor inoculation, the volume of pre-culture required to achieve an inoculation cell density of typically 15 million viable cells mL-1 was centrifuged (5 min, 4050 × g).
Cultivation Setup
Cultivations were performed in batch mode at small and pilot-scale. Small-scale cultivations were performed in a parallel bioreactor system (DASGIP Plant, CTPC03994, Eppendorf, Germany) consisting of four identical 1 L reactors with a working volume of 0.7 L each. Pilot-scale cultivations were performed in a 15 L bioreactor (Biostat C, Sartorius, Germany) with a working volume of 10 L. The small-scale reactors were equipped with a magnetic stirrer (51 x 20 mm), while the pilot-scale reactor was equipped with three 6-blade Rushton impellers. In both setups, yeast suspensions were agitated at 400 rpm and aerated via submerged air sparging, using a sparger tube at small-scale and a ring sparger at pilot-scale. Dissolved oxygen and pH were monitored but not actively controlled. Foam formation was managed differently depending on scale: small-scale reactors were not equipped with automatic antifoam dosing, and antifoam was therefore added manually based on visual inspection. In contrast, the pilot-scale reactor was equipped with an antifoam probe (Sartorius, Germany) enabling automatic antifoam addition.
At small-scale, twelve experiments were conducted, each comprising four parallel cultivations (R01 – R04). At pilot-scale, four experiments were performed. In order to test different cultivation conditions, yeast, pre-culture length, temperature, aeration rate, and initial sugar concentration were varied in small-scale experiments (Table 1), while yeast, pre-culture length and temperature were varied in pilot-scale experiments (Table 2). The cultivations lasted 76 h in the first four experiments and 72 h in all subsequent experiments.
Offline Analysis
Sampling was performed within an approximately 8 h daily time window, with a maximum frequency of three samples per day; extended intervals occurred between sampling days.
Offline cell analysis was conducted using methylene blue exclusion and image-based analysis on a Countstar Mira FL (Alit Biotech, Shanghai, P.R. China). VCD, total cell density (TCD), viability, and average cell diameter were automatically determined by the instrument. For this purpose, a 0.25 % aqueous methylene blue solution (Th. Geyer, Renningen, Germany) was diluted to 0.1 % with distilled water and mixed with the samples in equal volumes. Subsequently, 20 µL of each mixture were loaded into three chambers of a single-use plastic slide. After a sedimentation time of 3 min, the samples were immediately imaged and analyzed. The technical triplicates were performed in order to account for potential variability in cell distribution and chamber loading and were averaged for further analysis. Parameter settings followed the manufacturer’s recommendations: ‘Focal length = 1.271’; ‘Consumable = Countstar Slide-8.0X’; ‘Exposure = 160’; ‘Gain = 0’; ‘Prob = 0.25’; ‘Nms = 0.25’; ‘Min-Size = 4.0’; ‘Max-Size = 25.0’; ‘Thresh = 10’; ‘Fit-Min = 5.0’; ‘Fit-Max = 25.0’; ‘Min-Ave-Gray = 0.0’; ‘Max-Ave-Gray = 255.0’; ‘Activity = Close’.
The remaining sample was centrifuged at 4050 × g for 10 min at room temperature. The supernatant was used to analyze osmolality (Osmomat 3000 Basic, Gonotec, Berlin, Germany) and multiple physicochemical parameters (density, refractive index, original gravity, real extract, residual extract, alcohol content, degree of fermentation, and energy) using a combination of the SmartRef and EasyDens devices (Anton Paar, Graz, Austria), each measured in single determination.
Inline Analysis
In addition to the plant’s internal temperature sensor, each reactor was equipped with the following probes: dissolved oxygen (VisiFerm RS485-ECS, Hamilton, Bonaduz, Switzerland), pH-sensor (EasyFerm Plus PHI K8 (small-scale); EasyFerm Bio PHI K8 (pilot-scale)), Hamilton, Bonaduz, Switzerland), dielectric spectroscopy, here referred to as permittivity (Incyte Arc, Hamilton, Bonaduz, Switzerland), turbidity (Dencytee RS485, Hamilton, Bonaduz, Switzerland), dissolved carbon dioxide (CO2NTROL RS485, Hamilton, Bonaduz, Switzerland). The arrangement of the components in the small-scale reactors is displayed in Figure 1, in the pilot-scale reactor in Figure 2.
Temperature, pH value, and dissolved oxygen were recorded every 30 s using the DASGIP Control system (version 4.5; revision 237) for small-scale and BioPAT® MFCS system (version 4.15.0) for pilot-scale. The data from permittivity, turbidity, and dissolved carbon dioxide measurement were recorded every 30 s using the ArcAir software (version 3.10.1 for small-scale experiments and version 3.11 for pilot-scale experiments), with sensors connected via USB power cables.
Permittivity measurement was operated in frequency scanning mode at 17 independent frequencies logarithmically spaced between 300 kHz and 1 MHz. The sensor firmware fitted the dispersion curves using the Cole–Cole function and automatically determined the characteristic frequency (‘fc’), the permittivity drop between low and high frequencies (‘DeltaEps’), the empirical slope parameter (‘Alpha’), as well as fitting quality and fitting error as quantitative indicators of the goodness-of-fit of the Cole–Cole model.
Computational Processing
Although the data acquisition system (DASGIP Control and BioPAT® MFCS system) was configured to record measurements at 30-second intervals, the logging software only recorded values when a change relative to the previous measurement occurred. As a result, the time series contains gaps in the recorded variables. To obtain a consistent dataset, missing parameter values were imputed using a forward-fill (last observation carried forward) approach. This ensures that each timestamp is associated with a complete set of measurements while preserving the most recently observed state until a new value is recorded, thereby enabling downstream time-series analyses. This applies to the inline_ProcessParameters.
As small-scale reactors were not equipped with automatic antifoam dosing, antifoam was added manually and not recorded automatically. The dataset was retrospectively annotated by adding an Antifoam column to the inline_ProcessParameters. Time points without antifoam addition were labeled FALSE, while each addition event was represented by a single TRUE entry at the corresponding start timestamp, reflecting the short duration (a few seconds) of dosing.
The individual sensor systems exhibited slight deviations from their nominal sampling intervals (e.g., 31 s instead of 30 s), causing small temporal offsets to accumulate over time across data streams. To correct for this drift and obtain a temporally consistent dataset, all inline signals were aligned to a common master time axis using a nearest-neighbor assignment within a tolerance window of half the sampling interval. Time points without a valid match from all streams were discarded, ensuring that every row in the resulting dataset contains temporally consistent measurements across all recorded variables.
Data Record
The dataset described in this study is publicly available in the Zenodo repository with the identifier https://doi.org/10.5281/zenodo.19690248. It is divided into two main categories: individual raw data tables and time-axis aligned raw data tables, as described in more detail below. In this context, ‘raw’ refers to data that have been subjected to only minimal computational processing (see corresponding section). In all data files, the first row contains the column headings.
Individual Raw Data Tables
For each experiment (referred to as ‘EXP’ in the datasets), a single Excel (.xlsx) file is provided containing the unprocessed raw data. Each file contains multiple worksheets, each corresponding to specific data and, in the case of small-scale experiments, to a specific reactor (referred to as ‘R’ in the datasets). Within each worksheet, the time axis starts at the point of inoculation, which is defined as 0 hours. An overview of the structure of the Excel files, including the worksheets and their corresponding columns, is given in Table 3. For experiments conducted at small-scale, each Excel file contains 24 worksheets, corresponding to four reactors with six worksheets per reactor. For experiments conducted at pilot-scale, each Excel file contains six worksheets in total. The Excel files are named according to the experiment number and the yeast strain and scale used. For example, the file EXP001_W-68_small-scale.xlsx corresponds to the first experiment which was performed with the top-fermenting yeast strain W-68 in small-scale (0.7 L working volume).
Time-Axis Aligned Raw Data Tables
In addition to the individual raw data tables, time-axis aligned raw data tables are provided to enable direct comparison between different sensors and measurement methods, and to facilitate reuse and interpretation. For each experiment (EXP) and reactor (R), two comma-separated value (.csv) files are available: one containing inline measurement data and one containing offline measurement data. The .csv files use commas as delimiters between values within a row and periods as decimal separators. File names encode the experiment number, yeast strain, scale, reactor identifier (for small-scale experiments), and measurement type. For example, EXP001_W-68_small-scale_R01_inline.csv contains inline measurement data from reactor 1 of the first experiment which was conducted with yeast strain W-68 in small-scale (0.7 L working volume). Columns with ‘Status’ were excluded from the inline data for time-axis alignment.
Folder Structure
The main archive (Dataset.zip) is organized into two primary subfolders: individual raw data tables and time-axis aligned raw data tables. The folder individual raw data tables contains 16 .xlsx files corresponding to the 16 experiments performed, including 12 experiments at small-scale and 4 experiments at pilot-scale. The folder time-axis aligned raw data tables contains a total of 104 .csv files, comprising 96 files from small-scale experiments (12 experiments × 4 reactors × 2 measurement types) and 8 files from pilot-scale experiments (4 experiments × 2 measurement types).
Technical Validation
All sensors were inspected for contamination or damage prior to each cultivation. pH probes were calibrated using a two-point calibration (pH 7.00 and 4.00), and dissolved oxygen probes were calibrated using a one-point calibration at 100 % air saturation before every experiment. Small-scale reactors were autoclaved, whereas the pilot-scale reactor was steam-sterilized to prevent contamination. Medium samples were microscopically examined for contamination prior to inoculation. Measurements obtained from the automated cell counter were periodically cross-checked by microscopy. Sensor condition for permittivity, turbidity, and dissolved carbon dioxide was monitored throughout. For turbidity and dissolved carbon dioxide, status signals consistently indicated valid measurements without warnings. For permittivity, warning states were occasionally observed during early cultivation. These warnings did not reflect sensor malfunction or compromised signal acquisition, but were associated with reduced goodness-of-fit of the Cole–Cole model under low biomass conditions. As cell density increased and model fitting improved, status signals returned to valid operation.
The recorded data were consistent with expected fermentation behavior, including oxygen uptake and carbon dioxide evolution during exponential growth, progressive acidification, increasing biomass-associated optical and dielectric signals, rising alcohol concentrations, and decreasing residual extract.
Several limitations and anomalies were identified. Target inoculation densities (15 million viable cells mL⁻¹) were not consistently achieved. The largest deviations occurred in short pre-cultures (3 h), where incomplete deagglomeration of dry yeast resulted in aggregates that could not be reliably resolved, leading to inaccuracies in viable cell counts (Figure 3). In some cases, particularly for yeast strain W-68, this resulted in inoculation densities reaching up to about twice the intended VCD. These deviations were considered acceptable, as precise inoculation density was not critical for the study.
In several experiments, dissolved oxygen measurements exhibited implausible negative values (down to −1), indicating sensor artifacts rather than physiologically meaningful signals. Transient anomalies in inline measurements, particularly in dissolved oxygen and dielectric signals, were associated with the addition of antifoam agent. In EXP002, a power outage led to partial re-polarization of the electrode interfaces, resulting in a signal offset in the permittivity sensor signal after measurement resumed.
Temperature control was stable across most experiments conducted at a setpoint of 22 °C (mean 22.14 °C, SD = 0.25 °C), whereas EXP010 showed increased variability due to technical issues (mean 23.19 °C, SD = 1.47 °C; range 19.54 – 26.81 °C).
Data gaps occurred in nearly all experiments and were predominantly short-term interruptions on the order of minutes rather than extended outages. These were most pronounced in dissolved CO₂ measurements and in inline data from pilot-scale experiments. Given their predominantly technical origin, the occurrence of missing values can be considered largely independent of the underlying bioprocess state and thus broadly consistent with a Missing Completely at Random (MCAR) mechanism8, although deviations from this assumption cannot be fully excluded.
Usage Notes
The dataset is suitable for the development and evaluation of data-driven and hybrid modeling approaches, including soft sensors, as commonly applied in bioprocess engineering. Inline measurements such as permittivity, turbidity, dissolved oxygen, dissolved carbon dioxide, pH, and temperature have been widely used as predictor variables for biomass estimation, metabolic activity, and process state monitoring. In particular, permittivity has been extensively applied for the estimation of viable biomass concentrations [11,12,13], while turbidity is commonly correlated with total cell density [14,15]. Dissolved gas concentrations, pH, and temperature provide complementary information on metabolic activity and process dynamics and are frequently combined in multivariate soft-sensing frameworks [2,16].
For meaningful interpretation, inline sensor data should be considered in conjunction with the corresponding offline reference measurements provided in this dataset (e.g., viable and total cell counts, residual extract, and alcohol concentration). Users are encouraged to account for known sensor limitations and artifacts described in the Technical Validation section and to critically assess the plausibility and consistency of derived relationships. As with other complex bioprocess datasets, careful preprocessing, and domain-informed interpretation are essential to avoid misinterpretation of sensor signals and inferred process states.
Author Contributions
S.U.: Conceptualization, Methodology, Software, Validation, Investigation, Data Curation, Writing - Original Draft, Writing - Review & Editing, Visualization, Funding acquisition; R.F.: Software, Validation, Writing - Review & Editing; J.E.: Software, Validation, Writing - Review & Editing; J.S.: Conceptualization, Validation, Writing - Review & Editing, Funding acquisition; B.F.: Conceptualization, Validation, Resources, Writing - Review & Editing, Supervision, Funding acquisition; M.P-H.: Conceptualization, Validation, Resources, Writing - Review & Editing, Supervision, Project administration, Funding acquisition.
Funding
This study was funded by the German Federal Ministry of Research, Technology and Space through the funding program ‘Forschung an Fachhochschulen’ under contract number 13FH045KX2.
Data Availability Statement
The dataset generated during the study is openly available in the Zenodo repository with the identifier https://doi.org/10.5281/zenodo.19690248.
Acknowledgments
The authors thank Tatsiana Burankova and Katharina Dahlmann for valuable discussions, Veronika Gassenmeier and Sebastian Feldt for support in the laboratory, and Dominic Dralle for conducting the osmolality measurements. Selina Uhlendorff gratefully acknowledges the Joachim Herz Foundation for supporting her through the Add-on Fellowship.
Competing Interests: The authors declare that they have no competing interests.
Code Availability: No custom code has been used.
References
- Aranda, A., Orozco, H., Picazo, C. & Matallana, E. Yeast Life Span and its Impact on Food Fermentations. Fermentation 5, 37 (2019). [CrossRef]
- Birle, S., Hussein, M. A. & Becker, T. On-line yeast propagation process monitoring and control using an intelligent automatic control system. Engineering in Life Sciences 15, 83–95 (2015). [CrossRef]
- Kadlec, P., Gabrys, B. & Strandt, S. Data-driven Soft Sensors in the process industry. Computers & Chemical Engineering 33, 795–814 (2009). [CrossRef]
- Contreras-Ruiz, A., Alonso-Del-Real, J., Barrio, E. & Querol, A. Saccharomyces cerevisiae wine strains show a wide range of competitive abilities and differential nutrient uptake behavior in co-culture with S. kudriavzevii. Food Microbiology 114 (2023). [CrossRef]
- Monnin, L., Nidelet, T., Noble, J. & Galeote, V. Insights into intraspecific diversity of central carbon metabolites in Saccharomyces cerevisiae during wine fermentation. Food Microbiology 121 (2024). [CrossRef]
- Costello, P. J. et al. Transient acetaldehyde production by SO2-producing Saccharomyces cerevisiae promotes the survival of Oenococcus oeni during co-fermentation. OENO One 57, 399–415 (2023). [CrossRef]
- Peters, J. P. et al. Yeast Solutions and Hyperpolarization Enable Real-Time Observation of Metabolized Substrates Even at Natural Abundance. Analytical Chemistry 96, 17135–17144 (2024). [CrossRef]
- Pedersen, A. B. et al. Missing data and multiple imputation in clinical epidemiological research. Clinical Epidemiology 9, 157–166 (2017). [CrossRef]
- Ribeiro, S. M. & Castro, C. L. Missing Data in Time Series: A Review of Imputation Methods and Case Study. Learning and Nonlinear Models 20, 31–46 (2022). [CrossRef]
- Niako, N., Melgarejo, J. D., Maestre, G. E. & Vatcheva, K. P. Effects of missing data imputation methods on univariate blood pressure time series data analysis and forecasting with ARIMA and LSTM. BMC Medical Research Methodology 24 (2024). [CrossRef]
- Wang, R., Lorantfy, B., Fusco, S., Olsson, L. & Franzén, C. J. Analysis of methods for quantifying yeast cell concentration in complex lignocellulosic fermentation processes. Scientific Reports 11 (2021). [CrossRef]
- Tibayrenc, P., Preziosi-Belloy, L. & Ghommidh, C. On-line monitoring of dielectrical properties of yeast cells during a stress-model alcoholic fermentation. Process Biochemistry 46, 193–201 (2011). [CrossRef]
- Brunauer, G. C., Spadiut, O., Gruber, A. & Slouka, C. Yeast Propagation Control: Low Frequency Electrochemical Impedance Spectroscopy as an Alternative for Cell Counting Chambers in Brewery Applications. Chemosensors 8 (2020). [CrossRef]
- Brunner, V., Klöckner, L., Kerpes, R., Geier, D. U. & Becker, T. Online sensor validation in sensor networks for bioprocess monitoring using swarm intelligence. Analytical and Bioanalytical Chemistry 412, 2165–2175 (2020). [CrossRef]
- Biechele, P., Busse, C., Solle, D., Scheper, T. & Reardon, K. Sensor systems for bioprocess monitoring. Engineering in Life Sciences 15, 469–488 (2015). [CrossRef]
- Boulton, C. 125th Anniversary Review: Advances in analytical methodology in brewing. Journal of the Institute of Brewing 118, 255–263 (2012). [CrossRef]
Figure 1.
Arrangement of components in the small-scale reactors: left, top view of the lid with ports; right, side view of the reactor shown in cross-section.
Figure 1.
Arrangement of components in the small-scale reactors: left, top view of the lid with ports; right, side view of the reactor shown in cross-section.
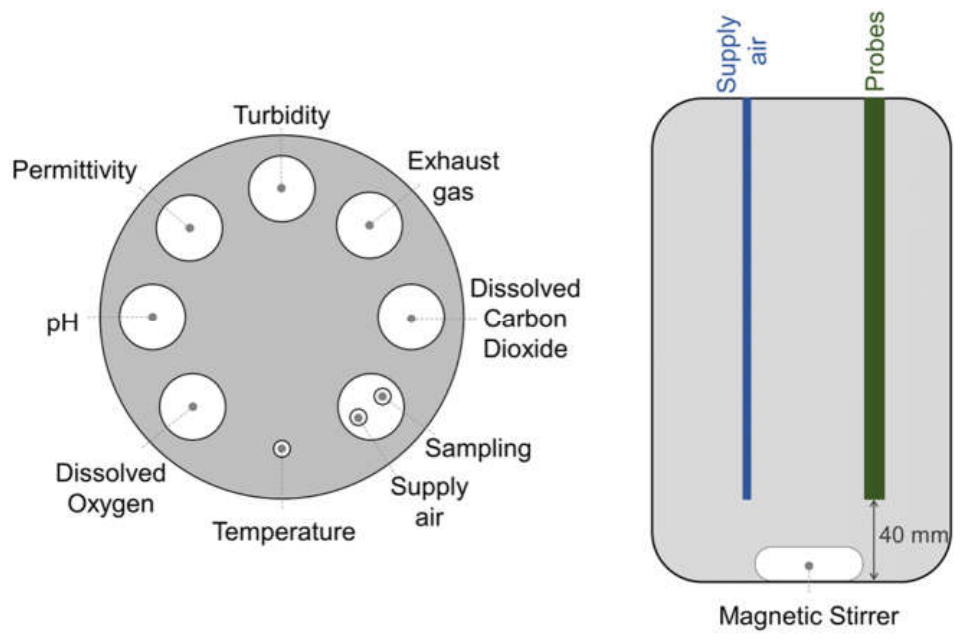
Figure 2.
Arrangement of components in the pilot-scale reactor: left, top view of the lid with ports; center, external side view of the reactor; right, side view of the reactor shown in cross-section.
Figure 2.
Arrangement of components in the pilot-scale reactor: left, top view of the lid with ports; center, external side view of the reactor; right, side view of the reactor shown in cross-section.
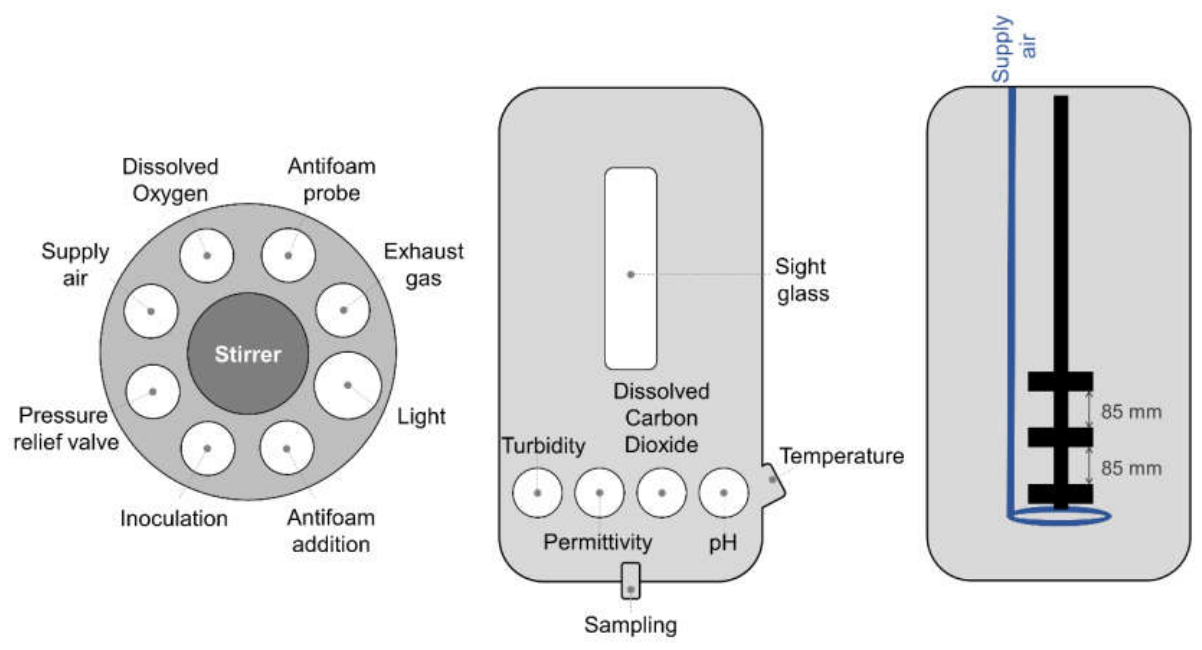
Figure 3.
Representative image of a 3 h shake flask pre-culture (EXP011_W-68), showing incomplete deagglomeration of yeast cell aggregates.
Figure 3.
Representative image of a 3 h shake flask pre-culture (EXP011_W-68), showing incomplete deagglomeration of yeast cell aggregates.
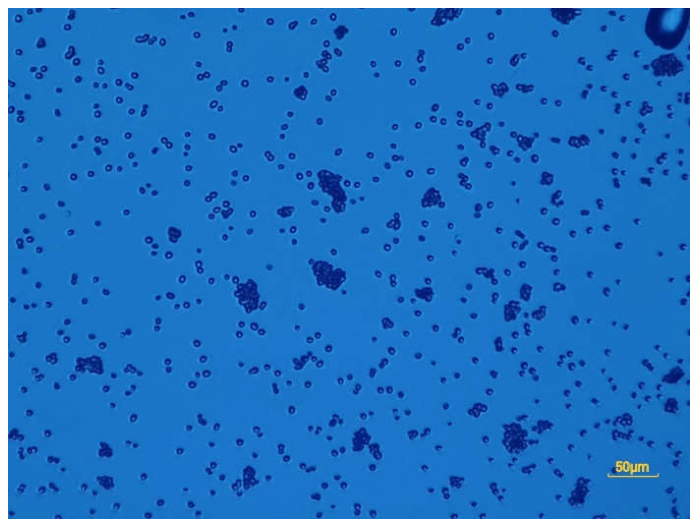

Table 1.
Experimental conditions for small-scale (0.7 L working volume) cultivations. R01 – R04 denote the four reactors of the parallel bioreactor system.
Table 1.
Experimental conditions for small-scale (0.7 L working volume) cultivations. R01 – R04 denote the four reactors of the parallel bioreactor system.
| Experiment | Yeast | Duration of pre-culture (h) | Wort con-centration (°P) | Aeration rate (vvm) | Temperature (°C) | ||||||
| R01 | R02 | R03 | R04 | R01 | R02 | R03 | R04 | ||||
| EXP001 | W-68 | 24 | 12 | 1 | 22 | ||||||
| EXP002 | W-68 | 24 | 12 | 1 | 22 | ||||||
| EXP003 | W-34/70 | 24 | 12 | 1 | 22 | ||||||
| EXP004 | W-34/70 | 24 | 12 | 1 | 22 | ||||||
| EXP005 | W-68 | 3 | 12 | 1 | 22 | ||||||
| EXP006 | W-34/70 | 3 | 12 | 1 | 22 | ||||||
| EXP007 | W-68 | 3 | 12 | 0.5 | 22 | 37 | |||||
| EXP008 | W-34/70 | 3 | 12 | 0.5 | 22 | 37 | |||||
| EXP009 | W-68 | 3 | 24 | 1 | 0.5 | 22 | |||||
| EXP010 | W-34/70 | 3 | 24 | 1 | 0.5 | 22 | |||||
| EXP011 | W-68 | 3 | 24 | 0.5 | 22 | 30 | |||||
| EXP012 | W-34/70 | 3 | 24 | 0.5 | 22 | 30 | |||||
Table 2.
Experimental conditions for pilot-scale (10 L working volume) cultivations.
| Experiment | Yeast | Duration of pre-culture (h) | Wort con-centration (°P) | Aeration rate (vvm) | Temperature (°C) |
| EXP013 | W-68 | 3 | 12 | 0.5 | 22 |
| EXP014 | W-34/70 | 24 | 12 | 0.5 | 22 |
| EXP015 | W-34/70 | 3 | 12 | 0.5 | 30 |
| EXP016 | W-68 | 24 | 12 | 0.5 | 30 |
Table 3.
Overview of the structure of the Excel files, listing all worksheets with their corresponding columns and relevant notes.
Table 3.
Overview of the structure of the Excel files, listing all worksheets with their corresponding columns and relevant notes.
| Worksheet | Columns | Notes |
| [R01 – R04]_inline_CO2 | Time (h); Dissolved CO2 (%-sat); Status | Status: diagnostic information on sensor condition |
| [R01 – R04]_inline_Turbidity | Time (h); Transmission (arb. unit); Reflection (arb. unit); Status | Status: diagnostic information on sensor condition |
| [R01 – R04]_inline_Permittivity | Time (h); Conductivity (mS/cm); Permittivity (pF/cm); fc (kHz); DeltaEps (pF/cm); Alpha; Fitting Quality (Cole fit R2); Fitting Error (Cole fit RMSE); C (300 kHz) – C (9995 kHz); Status | fc: characteristic frequency; DeltaEps: permittivity drop; Alpha: slope parameter; Status: diagnostic information on sensor condition and Cole–Cole model fit quality |
| [R01 – R04]_inline_ProcessParameters |
small-scale: Time (h); pH; Dissolved O2 (% air sat); Temperature (°C); Agitation rate (rpm); Antifoam pilot-scale: Time (h); Antifoam volume (mL); pH; Dissolved O2 (% air sat); Agitation rate (rpm); Temperature (°C) |
|
| [R01 – R04]_offline_CellAnalysis | Time (h); VCD Mean (cells/mL); VCD SEM (cells/mL); TCD Mean (cells/mL); TCD SEM (cells/mL); Viability Mean (%); Viability SEM (%); Avg. diameter Mean (µm); Avg. diameter SEM (µm) | VCD: viable cell density; TCD: total cell density |
| [R01 – R04]_offline_MediumAnalysis | Time (h); Density (g/cm³); Refractive index; Original gravity (SG); Real extract (SG); Residual extract (SG); Alcohol content (% w/w); Degree of fermentation (%); Energy (kcal/100 mL); Osmolality (mOsmol/kg) |
Disclaimer/Publisher’s Note: The statements, opinions and data contained in all publications are solely those of the individual author(s) and contributor(s) and not of MDPI and/or the editor(s). MDPI and/or the editor(s) disclaim responsibility for any injury to people or property resulting from any ideas, methods, instructions or products referred to in the content. |
© 2026 by the authors. Licensee MDPI, Basel, Switzerland. This article is an open access article distributed under the terms and conditions of the Creative Commons Attribution (CC BY) license (http://creativecommons.org/licenses/by/4.0/).
Copyright: This open access article is published under a Creative Commons CC BY 4.0 license, which permit the free download, distribution, and reuse, provided that the author and preprint are cited in any reuse.