
Submitted:
31 October 2026
Posted:
04 November 2026
You are already at the latest version
Abstract
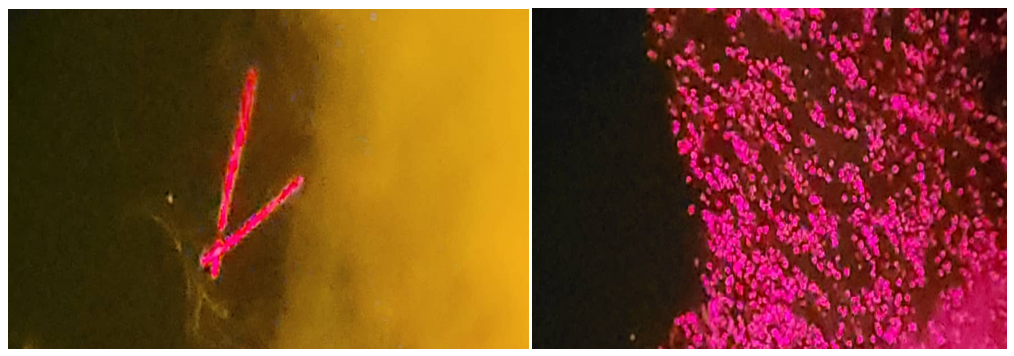
Microalgae are promising biological platforms for the sustainable production of biodegradable polymers, particularly polyhydroxybutyrate (PHB), a member of the polyhydroxyalkanoate (PHA) family. The environmental impacts of conventional plastics underscore the need for rapid, reliable screening methods to identify microalgal strains that accumulate PHB. Staining-based methods offer a cost-effective approach for the preliminary detection of intracellular polymer inclusions. This study, conducted in Yemen, compared three staining techniques—Nile Red, Nile Blue A, and Sudan Black B—for screening PHB accumulation in microalgal isolates. Nile Blue A was used to visualize putative PHB granules by fluorescence microscopy, Nile Red to detect intracellular hydrophobic inclusions, and Sudan Black B to provide a qualitative assessment by light microscopy. The findings indicate that the highest positive-reading rate was 100% for Nile Blue A dissolved in dimethyl sulfoxide (DMSO), followed by 98.20% for Nile Red in DMSO, 92.79% for Nile Blue A in acetone, and 88.29% for Nile Red in acetone. Sudan Black B in 70% ethanol yielded the lowest positive-reading rate (40.54%), with positive inclusions appearing blue-black. Negative reactions were characterized by pink or red cells or granules (Appendix A). Of the 37 samples examined in triplicate, 32 were classified as positive for intracellular biopolymer accumulation (86.49%). These samples may warrant further investigation for biotechnological applications. FTIR spectra of extracts from selected algal isolates showed absorption bands consistent with PHB, including an ester carbonyl (C=O) stretching band at approximately 1720–1724 cm⁻¹. These spectral features support the preliminary identification of PHB; additional confirmatory analyses are needed to establish polymer identity conclusively.
Keywords:
microalgae
; polyhydroxybutyrate (PHB)
; Nile Blue A
; Nile Red
; Sudan Black B
; biopolymers
; staining techniques
; Fourier-transform infrared (FTIR) spectroscopy
1. Introduction
The search for sustainable, biodegradable alternatives to petroleum-based polymers has intensified in response to growing environmental concerns [1,2]. Polyhydroxyalkanoates (PHAs) are microbial biopolymers that serve as intracellular carbon and energy reserves and are considered promising alternatives to conventional plastics [3,4,5]. Poly-β-hydroxybutyrate (PHB), one of the best-studied PHAs, has thermoplastic properties and is both biodegradable and biocompatible [6]. These properties support its potential use in biomedical, packaging, and agricultural applications [2]. Although bacterial PHB production has been extensively investigated, microalgae have also attracted interest as potential producers because of their rapid growth, capacity to fix carbon dioxide, and ability to tolerate varied environmental conditions [7]. PHB accumulation in microalgae may be influenced by stressors such as nutrient limitation, elevated salinity, and changes in light intensity [7]. Microalgal cultivation may also be integrated with wastewater treatment and can reduce direct competition with food crops, depending on the cultivation system [8].
Accurate, rapid screening is needed to identify algal strains with potential for PHB production. Conventional approaches, including polymer extraction and chromatographic analysis, can be reliable but may require substantial time, labour, and specialized equipment [9,10]. Staining methods are therefore frequently used for preliminary screening of intracellular hydrophobic inclusions. Sudan Black B and Nile Red have been applied because of their affinity for hydrophobic cellular components [10,11]. Sudan Black B is generally examined by light microscopy, whereas Nile Red can produce fluorescence when associated with intracellular lipid or polymer structures [11,12]. Nile Blue A is also used as a fluorescent stain for PHB granules [12,15]. Nile Red has been widely used to detect neutral lipids in microalgae, and fluorescence intensity may correlate with intracellular lipid content, supporting rapid phenotypic screening [13,14,15]. However, staining approaches can differ in sensitivity, specificity, image contrast, cost, and ease of use [16].
Comparative evaluations of these staining methods in algal isolates remain limited, particularly for strains collected from distinctive habitats such as those found in Yemen. Yemen includes freshwater systems, irrigation channels, wastewater environments, and marine coastal habitats that may harbour underexplored algal diversity. The performance of different stains for preliminary detection of PHB-like inclusions in algae isolated from Yemeni environments therefore requires systematic evaluation. This study aimed to isolate algae from selected Yemeni environments and compare staining techniques for detecting putative intracellular PHB accumulation. The objective was to identify a practical preliminary screening approach by comparing the positive-reading rates and microscopic appearance obtained with different stains and solvent systems.
2. Materials and Methods
2.1. Study Area and Sample Collection
Environmental samples were collected from several types of sites in Yemen, including freshwater bodies, wastewater locations, and agricultural irrigation canals. Samples were collected in sterile 500-mL glass bottles. Surface-water samples were taken from depths of 0–50 cm and transported to the laboratory in insulated containers maintained at 4 °C. Samples were processed within 24 h of collection.
Temperature, pH, and salinity were measured in situ using portable multiparameter instruments.
2.2. Isolation and Cultivation of Algal Strains
2.2.1. Isolation
To obtain unialgal cultures, samples were serially diluted and inoculated into liquid and onto solid BG-11 medium. Cultures were incubated at 25 ± 2 °C under a 12:12-h light: dark photoperiod, with white-light intensity of approximately 60–80 µmol photons m⁻² s⁻¹. The manuscript indicates that CO₂ was supplied during incubation; the delivery method should be specified. Individual colonies were purified through repeated streaking and microscopic examination [17,18,19,20,21].
2.2.2. Biomass Cultivation and PHB Induction
To promote intracellular PHB accumulation, algal isolates in exponential growth were transferred to nitrogen-depleted BG-11 medium supplemented with 1% glucose. Cultures were incubated for 7–14 days under the same environmental conditions. Before staining, biomass was harvested by centrifugation at 6,000 rpm for 20–30 min and washed twice with sterile distilled water [22,23,24]. After staining, cultures were shaken overnight. A culture maintained in standard BG-11 medium without PHB-induction treatment served as the control. Further comparisons of the extracted polymer with commercial PHB, including GC–MS analysis, are planned for future work.
2.3. Preparation of Staining Solutions
2.3.1. Nile Blue A Staining Solution
2.3.2. Nile Red Staining Solutions
Separate Nile Red stock solutions (1 mg mL⁻¹) were prepared using analytical-grade DMSO and acetone as solvents.
2.3.3. Sudan Black B Staining Solution
A 0.3% (w/v) Sudan Black B stock solution was prepared in 70% ethanol and filtered. The solution was stored at room temperature in amber bottles [25,26].
All solutions were prepared under low-light conditions and stored at 4 °C. Immediately before use, working solutions (10 µg mL⁻¹) were prepared by dilution in the appropriate solvent.
2.4. Staining Procedures for PHB Detection
2.4.1. Nile Blue A Staining
Approximately 1 mL of algal suspension was spread onto a clean glass slide and heat-fixed. The slide was flooded with 0.02% Nile Blue A solution and incubated at 55 °C for 20 min. After cooling, the slide was gently rinsed with distilled water and air-dried. The stained material was examined by fluorescence microscopy using an excitation wavelength of 460–490 nm. Bright orange fluorescence was interpreted as a positive indication of intracellular PHB-like granules [15,16]. A second, modified procedure involved adding the stain directly to an algal culture, shaking the culture overnight, and then examining a wet mount by fluorescence microscopy. The manuscript states that this modified procedure produced results similar to those obtained with the slide-based method; the two procedures should be described separately in the final methods if both were used to generate the reported data.
2.4.2. Nile Red Staining
For each solvent system (DMSO and acetone), 10 µL of Nile Red working solution was added to 1 mL of concentrated algal suspension. The samples were mixed and incubated in the dark at room temperature overnight to facilitate dye penetration.
Stained cells were examined as wet mounts by fluorescence microscopy, using an excitation wavelength of 460–490 nm and an emission wavelength of ≥575 nm. Bright red-orange fluorescent spots in the cytoplasm were interpreted as putative PHB granules.
Nile Red staining under the two solvent conditions was compared in terms of staining uniformity, background interference, and fluorescence intensity.
2.4.3. Sudan Black B Staining
For each sample, 10 µL of 0.3% Sudan Black B solution was added to 1 mL of algal suspension, and the mixture was shaken overnight. Wet-mount preparations were examined under a light microscope at 1000× magnification using oil immersion. Putative PHB granules were identified as dark-blue to black intracellular inclusions.
2.5. Microscopic Analysis and Imaging
Each stained sample was examined using the appropriate microscopy method and a digital imaging system. For each isolate and staining treatment, at least ten randomly selected microscopic fields were assessed across three replicates. Images intended for comparison of fluorescence intensity were captured under identical exposure conditions [15,16,27].
2.6. Extraction of Bioplastic from Algal Biomass
Extraction was based on the method described by Hahn et al. [28], with modifications. Cells were harvested by centrifugation at 4,000 × g for 20 min at 25 °C and then rinsed with acetone for 20 min. The dried cells were incubated with 50 mL of chloroform at 30 °C for 48 h. PHB-containing material was recovered by centrifugation. The extracted material was then precipitated using a methanol–water mixture (3:7, v/v) and filtered.
2.7. FTIR Characterization of the Extracted Bioplastic
Fourier-transform infrared (FTIR) spectroscopy was used to examine functional groups in the extracted material over the range of 4000–400 cm⁻¹. A band at 1279.13 cm⁻¹ was reported as a characteristic –CH-related band. Bands between 1000 and 1300 cm⁻¹ were attributed to C–O stretching in ester groups. Bands at 2979.97 and 2937.73 cm⁻¹ were assigned to methyl (CH₃) and methylene (CH₂) stretching vibrations, respectively, while a weaker band at 3502.57 cm⁻¹ was associated with terminal –OH groups [29,30,31,32]. And verify these peak positions and assignments against the spectra and identify the sample(s) from which they were obtained.
3. Results
3.1. Isolation and Selection of PHB-Producing Algae
3.1.1. Positive-Reading Frequencies and Percentages for Different Stains and Solvents
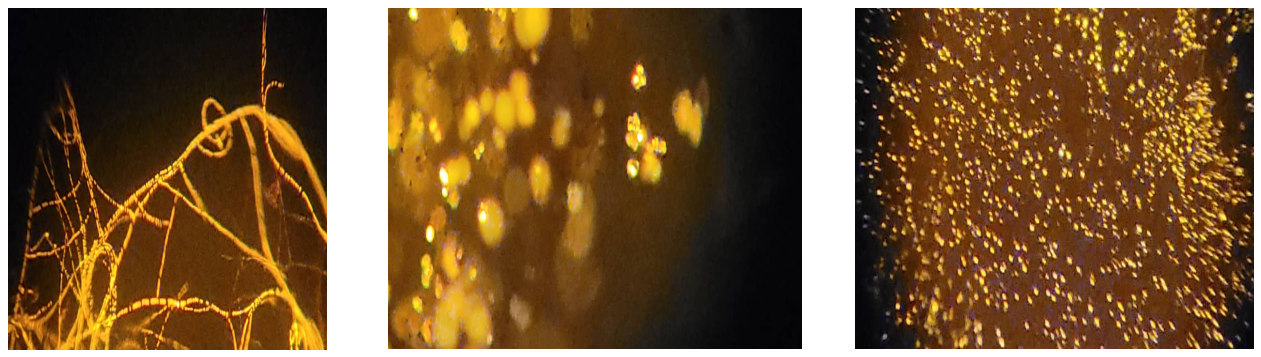
Thirty-seven samples collected from different locations were selected for screening. Each sample was assessed in triplicate, yielding 111 readings per staining treatment. The screening procedure was adapted from Bormann et al. [22,23], with modifications. Stained cultures containing 1% glucose in BG-11 were shaken at 120–150 rpm overnight; BG-11 cultures and cultures containing 1% glucose without stain were used as controls. Wet mounts were examined by fluorescence microscopy at an excitation wavelength of 450–490 nm. As shown in Appendix A, positive reactions appeared as orange granules. Strong orange granules were observed with Nile Blue A in DMSO, Nile Red in acetone, and Nile Red in DMSO.
For Sudan Black B in 70% ethanol, 45 of 111 readings showed blue-black inclusions, corresponding to 40.54% positive readings. For Nile Blue A, the reported counts were 103 positive readings with acetone and 111 with DMSO. These counts correspond to 92.79% and 100%, respectively, out of 111 readings.
For Nile Red, 98 of 111 readings were positive with acetone (88.29%), while 109 of 111 were positive with DMSO (98.20%). These percentages have been aligned with the reported positive counts; the stain–solvent assignments should still be checked against the original scoring records before submission.
The positive-reading rates, interpreted alongside the reported counts, were 100% for Nile Blue A in DMSO, 98.20% for Nile Red in DMSO, 92.79% for Nile Blue A in acetone, 88.29% for Nile Red in acetone, and 40.54% for Sudan Black B in 70% ethanol. Positive reactions were generally characterized by orange or blue-black inclusions, depending on the stain, whereas some negative reactions showed pink or red cells or granules (Appendix A).
Of the 37 samples tested in triplicate, 32 were classified as positive for intracellular biopolymer accumulation (86.49%), while five were negative (13.51%). The positive samples were selected for potential further investigation in biotechnological applications (Figure 1).
3.1.2. Principal Component Analysis
Principal component analysis (PCA) was applied to four staining variables. The first principal component (PC1) had an eigenvalue of 1.512 and explained 37.8% of the total variance. The largest loadings on PC1 were observed for Nile Blue A in acetone (0.738) and Nile Red in acetone (0.661), followed by Nile Red in DMSO (0.603) and Sudan Black B (0.409) (Table 3). These loadings describe the contributions of the variables to the component and should not be interpreted as direct measures of staining sensitivity.
Using the Kaiser criterion, only one component with an eigenvalue greater than 1 was retained; PC1 explained 37.8% of the total variance [33]. Nile Blue A in DMSO was excluded from this PCA because its readings reportedly showed no variance. The exclusion criterion and the underlying data should be documented clearly (Table 1, Table 2 and Table 3).

Table 1.
Percentage of positive readings for each stain–solvent treatment.
| Stain–solvent treatment | Positive readings (%) |
|---|---|
| Nile Blue A in DMSO | 100.00 |
| Nile Red in DMSO | 98.20 |
| Nile Blue A in acetone | 92.79 |
| Nile Red in acetone | 88.29 |
| Sudan Black B in 70% ethanol | 40.54 |
Table 2.
Total variance explained by principal component analysis of the four staining variables.
| Component | Initial eigenvalue | Variance (%) | Cumulative variance (%) | Extraction sums of squared loadings | Extracted variance (%) | Extracted cumulative variance (%) |
|---|---|---|---|---|---|---|
| 1 | 1.512 | 37.800 | 37.800 | 1.512 | 37.800 | 37.800 |
| 2 | 0.956 | 23.890 | 61.691 | – | – | – |
| 3 | 0.840 | 21.005 | 82.696 | – | – | – |
| 4 | 0.692 | 17.304 | 100.000 | – | – | – |
Note: Extraction method, principal component analysis.
Table 3.
Component loadings from principal component analysis.
| Component | |
| 1 | |
| 0.603 | Nile Red in DMSO, BG-11 + 1% glucose, nitrogen-limited |
| 0.661 | Nile Red in acetone, BG-11 + 1% glucose, nitrogen-limited |
| 0.738 | Nile Blue A in acetone, BG-11 + 1% glucose, nitrogen-limited |
| 0.409 | Sudan Black B in 70% ethanol |
3.1.3. Statistical Analysis
Each experiment was performed in triplicate. Percentages were calculated using Microsoft Excel. PCA was used to describe patterns among the staining variables and solvent systems. Because PCA is a descriptive multivariate method, it does not, by itself, establish statistically significant differences among treatments. The eigenvalues and variance explained are reported in Table 2 and Table 3.
3.2. Fourier-Transform Infrared (FTIR) Spectroscopy Results
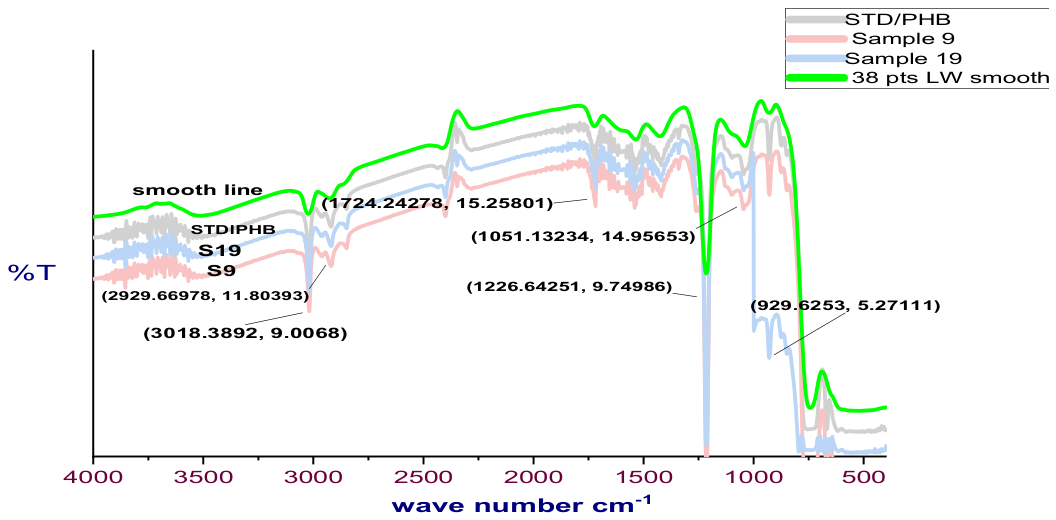
The FTIR spectra of the extracted material were compared with the spectrum of a PHB standard.
The recovered material was analyzed by FTIR spectroscopy to examine its chemical structure and compare its absorption bands with those of a standard poly-β-hydroxybutyrate sample (STD/PHB). The reported spectra showed similar absorption features. A prominent ester carbonyl (C=O) stretching band appeared at approximately 1720 cm⁻¹ in the standard spectrum and 1724 cm⁻¹ in one of the extracted samples. Additional reported bands included C–H stretching at approximately 2932 and 3018 cm⁻¹ and an ester-related C–O–C band near 1203 cm⁻¹. Peak positions should be reported consistently for each sample and the standard.
These absorption bands are consistent with ester linkages and aliphatic hydrocarbon groups associated with PHB. The similarity between the reported peak positions in the isolates and the standard supports a preliminary identification of PHB-like material. Differences in band intensity may reflect variation in crystallinity, purity, concentration, or sample preparation; however, FTIR data alone should not be described as conclusive proof of polymer identity.
Characteristic FTIR absorption bands reported for PHB include:
Approximately 1720 cm⁻¹: ester carbonyl (C=O) stretching, a major PHB-associated band.
Approximately 2920–2960 cm⁻¹: aliphatic C–H stretching.
Approximately 1220–1280 cm⁻¹: ester-related C–O–C vibrations.
Approximately 1050–1100 cm⁻¹: C–O vibrations.
Approximately 3000–3018 cm⁻¹: reported CH₂/CH₃ stretching-related bands.
4. Discussion
This study indicates that microalgae isolated from Yemeni environments may have potential for producing biodegradable biopolymers, particularly PHB. Concern about pollution from petroleum-based plastics has increased interest in renewable alternatives such as PHAs [34]. The use of microalgae as potential platforms for biopolymer production may offer environmental advantages, although productivity and polymer identity must be established experimentally for each isolate.
Staining-based methods provided a rapid preliminary screen for putative PHB accumulation in the algal samples. Based on the reported counts, Nile Blue A in DMSO produced the highest positive-reading rate (100%). This result is broadly consistent with the use of Nile Blue A as a fluorescent stain for PHB granules [35]. However, fluorescence-based staining is a screening tool and may not, on its own, confirm polymer identity or distinguish PHB from all other hydrophobic inclusions.
Nile Red also produced high positive-reading rates: 98.20% in DMSO and 88.29% in acetone, based on the reported counts. Nile Red has been used to stain intracellular lipids and hydrophobic inclusions, including in studies of polyhydroxyalkanoate-accumulating microorganisms [14,36]. The present results suggest that Nile Red may be useful for preliminary screening of these algal isolates, but they should be confirmed by independent chemical characterization.
Sudan Black B produced the lowest positive-reading rate (40.54%) but provided qualitative visualization of dark inclusions under light microscopy. Because Sudan Black B can stain a range of hydrophobic cellular components, positive staining should be interpreted cautiously and should not be treated as a PHB-specific result without confirmatory analysis.
A total of 32 of the 37 samples (86.49%) were classified as positive for intracellular biopolymer-like inclusions. This finding suggests that the sampled Yemeni aquatic environments may contain algal isolates worth screening further. Potential future applications include biopolymer production and integration with wastewater treatment or carbon-management systems, but these possibilities require additional strain identification, productivity measurements, and process evaluation [38].
The study also illustrates the potential value of low-cost staining as an initial screening step, particularly where advanced analytical facilities are not readily available. Nevertheless, staining should be used to prioritize isolates rather than replace validated analytical techniques. Methods such as gas chromatography and nuclear magnetic resonance require specialized equipment and expertise, but they can provide stronger evidence about polymer composition than staining alone [39].
Overall, the reported results suggest that Nile Blue A in DMSO and Nile Red in DMSO may be useful for preliminary screening of the tested isolates. Further work should include taxonomic or molecular identification, optimization of culture conditions, quantitative determination of PHB content, and validation of the extracted polymer before commercial potential is assessed.
Extracts from isolates grown in freshwater and wastewater environments showed FTIR absorption bands consistent with PHB-like material. The principal reported band was associated with ester carbonyl (C=O) stretching at approximately 1720–1724 cm⁻¹. This feature is commonly reported in the FTIR characterization of PHAs, including PHB [37,40,41,42,43,44]. The supporting references should be checked to ensure that each specifically substantiates the spectral interpretation and the claims made here.
5. Conclusions and Recommendations
This study evaluated chemical staining methods for the preliminary detection of putative PHB accumulation in microalgae isolated from Yemeni environments. Based on the reported positive counts, Nile Blue A in DMSO had the highest positive-reading rate, followed by Nile Red in DMSO, Nile Blue A in acetone, Nile Red in acetone, and Sudan Black B in 70% ethanol. These methods may be useful for initial screening, but staining results and FTIR spectra should be supported by quantitative and confirmatory analyses before the isolates are described as confirmed PHB producers.
The findings support continued development of microalgal research, culture collections, and green-biotechnology initiatives in Yemen. Collaboration between academic institutions and industry could help assess the feasibility of producing biodegradable polymers from locally sourced biological resources. Such applications should be pursued alongside evaluation of strain identity, process performance, environmental effects, and production costs.
Future work should examine additional algal isolates from diverse Yemeni environments, standardize staining and cultivation conditions, and apply molecular, biochemical, and quantitative polymer analyses to determine PHB productivity. Investment in environmental biotechnology and renewable biological resources may contribute to sustainable development and environmental protection.
Acknowledgments
The authors thank the Yemeni Standardization, Metrology and Quality Control Organization, including its director and laboratory staff, as well as the staff of the wastewater treatment plants in Sana’a and Ibb. The first author thanks New Scan Laboratory for permission to use its fluorescence microscope. The authors also thank Mr Mohammed Al-Ghail for importing the chemical stains and reference materials into Yemen.
Conflicts of Interest
The authors declare no conflict of interest.
Abbreviations
The following abbreviations are used in this manuscript:
| MDPI | Multidisciplinary Digital Publishing Institute |
| PHB | Polyhydroxybutyrate |
| PHA | Polyhydroxyalkanoate |
| DMSO | Dimethyl sulfoxide |
| PCA | Principal component analysis |
| FTIR | Fourier-transform infrared spectroscopy |
Appendix A
References
- Narayanan, M.; Kandasamy, S.; Kumarasamy, S.; Gnanavel, K.; Ranganathan, M.; Kandasamy, G. Screening of polyhydroxybutyrate producing indigenous bacteria from polluted lake soil. Heliyon 2020, 6(10), 1–8. [Google Scholar] [CrossRef] [PubMed]
- Mascarenhas, J.; Aruna, K. Screening of Polyhydroxyalkonates (Pha) accumulating bacteria from diverse habitats. J. Glob. Biosci. 2017, 6(3), 4835–4848. Available online: http://www.mutagens.co.in/jgb/vol.06/3/060304.pdf.
- Calero, M.; Godoy, V.; Quesada, L.; Martín-Lara, M.Á. Green strategies for microplastics reduction. Curr. Opin. Green Sustain. Chem. 2021, 28, 1–6. [Google Scholar] [CrossRef]
- Meereboer, K.W.; Misra, M.; Mohanty, A.K. Review of recent advances in the biodegradability of polyhydroxyalkanoate (PHA) bioplastics and their composites. Green Chem. 2020, 22(17), 5519–5558. [Google Scholar] [CrossRef]
- Marjadi, D.; Dharaiya, N. Bioplastic: A better alternative for sustainable future. Everyman’s Sci. 2010, 45(2), 90–92. [Google Scholar]
- TANAMOOL, 6. Varavut; IMAI, Tsuyoshi; DANVIRUTAI, Paiboon; KAEWKANNETRA, Pakawadee. Biopolymer generation from sweet sorghum juice: screening, isolation, identifcation, and fermentative polyhydroxyalkanoate production by Bacillus aryabhattai . Turk. J. Biol. 2013, 37, 259–264. Available online: http://journals.tubitak.gov.tr/biology/Turkish. [CrossRef]
- Zaher, S. S.; Ibrahim, S. M. Challenges and opportunities of bioplastics produced from algae. Egypt. J. Aquat. Biol. Fish. 2023, 27(5), 365–386. [Google Scholar] [CrossRef]
- Hempel, F.; Bozarth, A. S.; Lindenkamp, N.; Klingl, A.; Zauner, S.; Linne, U. ... β Maier, U. G. Microalgae as bioreactors for bioplastic production. Microb. Cell Fact. 2011, 10(1), 81. [Google Scholar] [CrossRef] [PubMed]
- Puttagunta, M.; Ravi, S. Medical image analysis based on deep learning approach. Multimed. Tools Appl. 2021, 80(16), 24365–24398. [Google Scholar] [CrossRef] [PubMed]
- Asgharnejad, H.; Sarrafzadeh, M.-H. Development of digital image processing as an innovative method for activated sludge biomass. Front Microbiol. 2020, 11, 574966. [Google Scholar] [CrossRef] [PubMed]
- P, Y. R.; Das, M.; Maiti, S.K. Recent progress and challenges in cyanobacterial autotrophic production of polyhydroxybutyrate (PHB), a bioplastic. J. Environ. Chem. Eng. 2021, 9, 2213–3437. [Google Scholar] [CrossRef]
- Jendrossek, D.; Pfeiffer, D. New insights in the formation of polyhydroxyalkanoate granules (carbonosomes) and novel functions of poly(3-hydroxybutyrate). Environ. Microbiol. 2014, 16(8), 2357–2373. [Google Scholar] [CrossRef] [PubMed]
- Selvaraj, K.; Vishvanathan, N.; Dhandapani, R. Screening, optimization and characterization of poly hydroxybutrate from fresh water microalgal isolates. Internatiobal J. Biobased Plast. 2021, 3(1), 139–162. [Google Scholar] [CrossRef]
- Cooksey, K. E.; Guckert, J. B.; Williams, S. A.; Callis, P. R. Fluorometric determination of neutral lipids in microalgae using Nile Red. J. Microbiol. Methods 1987, 6(6), 333–345. [Google Scholar] [CrossRef]
- Ansari, S.; Fatma, T. Cyanobacterial Polyhydroxybutyrate (PHB): Screening, Optimization and Characterization. PLoS ONE 2016, 11(6), e0158168. [Google Scholar] [CrossRef] [PubMed]
- Jendrossek, D.; Selchow, O.; Hoppert, M. Poly(3-hydroxybutyrate) granules at the early stages of formation are localized close to the cytoplasmic membrane in caryophanon latum. Appl. Environ. Microbiol. 2007, 73(2), 586–593. [Google Scholar] [CrossRef] [PubMed]
- Lourenço, S.O.; Vieira, A.A.H. Culture collec–tions of microalgae in Brazil: progress and constraints. Nova Hedwig. 2004, 79(1–2), 149–173. [Google Scholar] [CrossRef]
- Takács, G.; Gergely, I.; Molnár, Z.; Ördög, V. Plant biostimulating effects of the green alga chlamydopodium fusiforme on winter wheat in field experiments. In in Book of abstract, 9th symposium on microalgae and seaweed products in Plant/Soil systems; Mosonmagyaróvár, Hungary, 2019; p. 34. [Google Scholar]
- KumarJ; RamlaA; MallickD; MishraV. An overview of some biopesticides and their importance in plant protection for commercial. Plants 2021, 10(6), 1185. [Google Scholar] [CrossRef] [PubMed]
- Robert, Rebecca; Iyer, Priya R. Isolation and Optimization of PHB (Poly-β-hydroxybutyrate) Based Biodegradable Plastics from Chlorella vulgaris. In J Bioremediat Biodegrad, an open access journal; ISSN: 2155-6199, 2018; p. 9 • Issue 2 • 1000433. [Google Scholar]
- WangY; GuoW; YenH, W.; HoS, H.; LoY, C.; ChengC, C. Cultivation of Chlorella vulgaris JSC-6 with swine wastewater for simultaneous nutrient/COD removal and carbohydrate production. Bioresour. Technol. 2015, 198, 619–625. [Google Scholar] [CrossRef] [PubMed]
- Bormann, E. J.; Leibner, M.; Beer, B. Growth-associated production of poly(hydroxybutyric acid) by Azotobacter beijerinckii from organic nitrogen substrates. In Applied Microbiology and Biotechnology; Springer, 1998a; Volume 49, 1, pp. 84–88. [Google Scholar] [CrossRef]
- Bormann, E. J.; Leibner, M.; Roth, M.; Beer, B.; Metzner, K. Production of polyhydroxybutyrate by Ralstonia eutropha from protein hydrolysates. In Applied Microbiology and Biotechnology; Springer, 1998b; Volume 50, pp. 604–607. [Google Scholar] [CrossRef]
- Mercan, N.; Aslim, B.; Yüksekda˘g, Z.N.U.R.; Beyatli, Y. Production of Poly-b Hydroxybutyrate (PHB) by Some Rhizobium Bacteria. Turk.J.Biol. 2002, 26, 215–219. [Google Scholar]
- Schlegel, H.G.; Lafferty, R.; Krauss, I. The isolation of mutants not accumulating Poly-B-hydroxybutyrate. Arch. Microbiol. 1970, 71, 283–294. [Google Scholar] [CrossRef]
- Mahitha, G.; Madhuri, R. Purification and Characterization of Polyhydroxybutyrate Produced from Marine Bacteria. Int.J.Sci.Eng.Res. 2015, 6, 71–75. [Google Scholar]
- Bhagowati, P.; Pradhan, S.; Dash, H.R.; Das, S. Production, Optimization and Characterization of Polyhydroxybutyrate, a Biodegradable Plastic by Bacillus spp. Biosci.Biotechnol.Biochem. 2015, 79, 1454–1463. [Google Scholar] [CrossRef] [PubMed]
- Hahn, S.K.; Chang, Y.K.; Kim, B.S.; Chang, H.N. Communication to the editor: Optimization of microbial poly (3hydroxybutyrate) recovery using dispersions of sodium hypochlorite solution and chloroform. Biotechnol. Bioeng. 1994, 44, 256–261. [Google Scholar] [PubMed]
- Hong, K.; Sun, S.; Tian, W.; Chen, G.Q.; Hudrg, W. A rapid method for detecting bacterial polyhydroxyalkanoates in intact cells by fourier transform infrared spectroscopy. Appl. Microbiol. Biotechnol. 1999, 51, 523–526. [Google Scholar] [CrossRef]
- Edward, G.; Bellinger. Freshwater algae: identification and use as bioindicators. In Environmental Science and Policy; Book FTIR MM. identification, microscopic, chemical methods ftir; Central European University, Hungary and David C. Sigee Manchester University: UK, 2010; ISBN 978-0-470-05814-5. [Google Scholar]
- Roja, K.; Ruben Sudhakar, D.; Anto, S.; Mathimani, T. Extraction and characterization of polyhydroxyalkanoates from marine green alga and cyanobacteria. Biocatal. Agric. Biotechnol. 2019, 22, 101358. [Google Scholar] [CrossRef]
- Silva, P.E.d.C.e.; Houllou, L.M. Obtainment of Polyhydroxyalkanoates (PHAs) from microalgae supplemented with agro-industry residue corn steep liquor. J. Bot. Res. 2022, 5. [Google Scholar] [CrossRef]
- Kaiser, Henry F. The application of electronic computers to factor analysis. Educ. Nd Psychol. Meas. 1960, 20(1), 141–151. [Google Scholar] [CrossRef]
- Anderson, A. J.; Dawes, E. A. Occurrence, metabolism, metabolic role, and industrial uses of bacterial polyhydroxyalkanoates. Microbiol. Rev. 1990, 54(4), 450–472. [Google Scholar] [CrossRef]
- Ostle, A. G.; Holt, J. G. Nile blue A as a fluorescent stain for poly-β-hydroxybutyrate. Appl. Environ. Microbiol. 1982, 44(1), 238–241. [Google Scholar] [CrossRef] [PubMed]
- Spiekermann, P.; Rehm, B. H.; Kalscheuer, R.; Baumeister, D.; Steinbüchel, A. A sensitive, viable-colony staining method using Nile red for direct screening of bacteria that accumulate polyhydroxyalkanoic acids. Arch. Microbiol. 1999, 171, 73–80. [Google Scholar] [CrossRef] [PubMed]
- Koller, M.; Salerno, A.; Dias, M.; Reiterer, A.; Braunegg, G. Modern biotechnological polymer synthesis: a review. Food Technol. Biotechnol. 2010, 48(3), 255–269. [Google Scholar]
- Sudesh, K.; Abe, H.; Doi, Y. Synthesis, structure and properties of polyhydroxyalkanoates: biological polyesters. Prog. Polym. Sci. 2000, 25(10), 1503–1555. [Google Scholar] [CrossRef]
- Verlinden, R. A.; Hill, D. J.; Kenward, M. A.; Williams, C. D.; Radecka, I. Bacterial synthesis of biodegradable polyhydroxyalkanoates. J. Appl. Microbiol. 2007, 102(6), 1437–1449. [Google Scholar] [CrossRef] [PubMed]
- Madison, L. L.; Huisman, G. W. Metabolic engineering of poly(3-hydroxyalkanoates): from DNA to plastic . Microbiol. Mol. Biol. Rev. 1999, 63(1), 21–53. [Google Scholar] [CrossRef] [PubMed]
- Khanna, S.; Srivastava, A. K. Recent advances in microbial polyhydroxyalkanoates. Process Biochem. 2005, 40(2), 607–619. [Google Scholar] [CrossRef]
- Lu, C. Dancing with a versatile microbe: Rendering Pseudomonas putida a mediumchain-length α, ω-diol producer. Doctoral dissertation, Wageningen University and Research, 2023. [Google Scholar]
- Iqbal, K.; Balasubramanian, S.; Rana, P.; Jain, K.; Tyagi, J.; Varma, A.; Mishra, A. Sustainable Use of Algal Biomass for Bioplastic Production. In Algal Biomass Technology and Research; Apple Academic Press, 2025; pp. 247–274. [Google Scholar]
- Nawaz, S.; Zahra, I.; Liaqat, A.; Muneer, B.; Mustafa, G.; Arshad, A.; Shakoori, F. R. Solvent extraction and analytical characterization of polyhydroxyalkanoate inclusions produced by the microeukaryote Paramecium jenningsi. J. Microbiol. Methods 2026, 107642. [Google Scholar] [CrossRef] [PubMed]
Figure 1.
Proportion of algal samples classified as positive or negative for intracellular biopolymer accumulation based on staining.
Figure 1.
Proportion of algal samples classified as positive or negative for intracellular biopolymer accumulation based on staining.
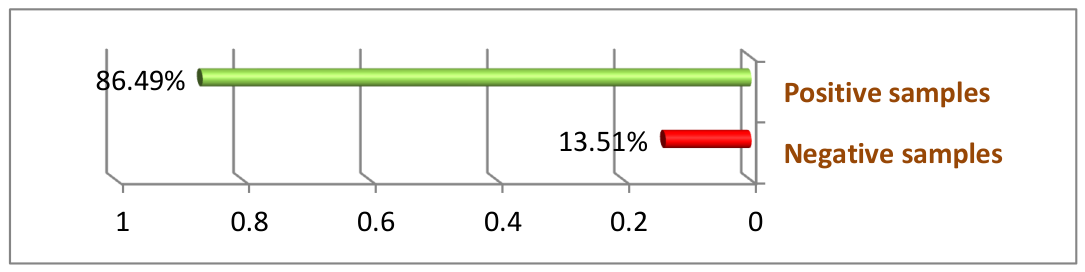
Figure 2.
FTIR spectrum of the PHB standard.
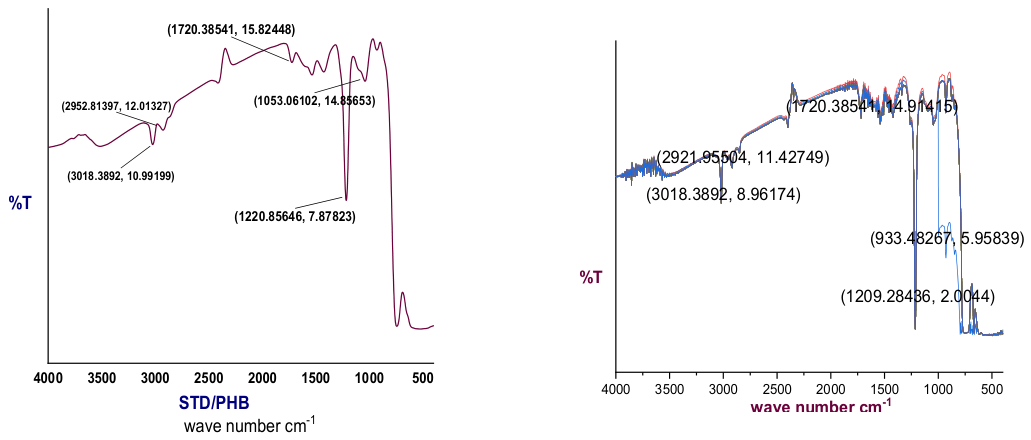
Figure 3.
FTIR spectra of extracted material from selected algal isolates compared with the PHB standard.
Figure 3.
FTIR spectra of extracted material from selected algal isolates compared with the PHB standard.
Disclaimer/Publisher’s Note: The statements, opinions and data contained in all publications are solely those of the individual author(s) and contributor(s) and not of MDPI and/or the editor(s). MDPI and/or the editor(s) disclaim responsibility for any injury to people or property resulting from any ideas, methods, instructions or products referred to in the content. |
© 2026 by the authors. Licensee MDPI, Basel, Switzerland. This article is an open access article distributed under the terms and conditions of the Creative Commons Attribution (CC BY) license (http://creativecommons.org/licenses/by/4.0/).
Copyright: This open access article is published under a Creative Commons CC BY 4.0 license, which permit the free download, distribution, and reuse, provided that the author and preprint are cited in any reuse.