

Submitted:
29 October 2026
Posted:
30 October 2026
You are already at the latest version
Abstract
Passive House proponents consider it a universally robust solution to mitigate the climate-related environmental impacts of energy consumption in buildings. Deep systems analysis, however, reveals significant limitations to the approach for much of warm climates such as Australia: a) climatic (in)appropriateness, cold climate versus warm climate, b) addressing the flawed premise of air tightness, c) improving design phase validation arising from lack of sophistication in calculations - blunt tools limit the design palette. e) localization of high-value insulation and air tightness redirects capital, e) use high solar energy yields, which trades off lower insulation and air tightness, for high solar energy yields. Given that solar is now approximately 50c/watt installed in Australia, in specific circumstances, such as when occupants use solar for self-consumption. Yields are very high due to solar availability; in this context, the current approach to GHG benefits misdirects capital and is fundamentally bad economics. Net-zero energy is already in reach for Australian homeowners. Therefore, the value proposition in Australia rests on thermal comfort and indoor air quality, both of which are much weaker than in traditional passive solar design.
Keywords:
Passive House
; climate
; energy consumption
; air tightness
; insulation
; solar energy
; GHG (greenhouse gas)
; thermal comfort
; indoor air quality
; net-zero energy
1. Introduction
Passive House (PH) is increasingly recognized globally as the most reliable ultra-low-energy home energy-efficiency standard and the highest certification standard for high-performance, low-impact buildings in Australia [1].
The cold-climate design priorities dictated by Passive House are counterintuitive to the passive design of warm-climate buildings. Passive House, therefore, provokes a rethink of priorities for Australia. Should effort and capital be directed towards insulation, vapor barriers, airtight construction, and balanced mechanical ventilation systems? Will this come at the expense of traditional warm-climate passive control systems such as passive solar design, thermal mass, and natural ventilation?
The controversy extends to the conjecture that regulators, builders, and owners may see this as an uncomplicated specification-led approach to achieving energy efficiency, making it easier to regulate than passive solar thermal design, which is normally delivered through the discipline of design. Hence, there is a perception that there is increasing pressure on agencies to adopt it as a minimum standard for procurement. If the promised benefits do not translate into the Australian context, there could be several unintended consequences arising from increased adoption, including misdirected effort and capital that could otherwise achieve better environmental outcomes; risks of reduced indoor air quality; reduced thermal comfort; and reduced resilience.
A review suggests the Passive House value proposition is severely challenged in Australia, and that broad use of the standard is counter to good design for the climate context. It is therefore important that the vocal enthusiasm and commercial promotion for Passive House is tempered by an objective and contextual understanding of benefits. This note outlines areas of preliminary investigation against claims and highlights immediate challenges to the claims made.
The core design principles identified in the Passive House standard that may be problematic as it is rolled out across different countries and climate conditions are:
- Creating a super airtight dwelling is necessary for the high level of performance
- Better indoor air quality is achieved by continuous balanced mechanical ventilation
- Standardizing passive strategies and thermal requirements across counties and diverse climate zones is invaluable
These principles raise further questions. Should research look more closely at the role of the building envelope whether super insulation and airtightness are beneficial? Whether standardizing performance across the diverse climate zones is sensible, and whether fully mechanical systems as the default are appropriate in a climate where natural ventilation is seen as a priority? And what are the consequences for human health?
2. Literature Review
The value proposition is defined as the business case for potential projects. The study of the characteristics of buildings and how they inspire or detract from the creation of value through the perceptions of owners, users, and, indeed, the wider community is essential [2]. Important are the embedded technical assumptions rather than surveys of owner and occupant feedback. Drivers such as climate change and higher energy prices have focused attention on the energy consumption and efficiency of houses, with governments and businesses seeking ways to change human behavior from new goals and objectives. [1].
2.1. The Passive House Value Statement
2.1.1. Aims and Objectives
‘The Passive House approach is ideally suited to bringing the goal of on-site net-zero energy within reach, by reducing annual energy demand to the point where renewable energy can be cost-effective.’ [3]
What that means is that the design aim is to reduce the energy consumption of dwellings to a level that occupants can cost-effectively generate on-site through systems such as solar thermal and solar electric.
‘Passive House (PH), or in the original German Passivhaus, denotes a highly energy-efficient building, one that can be conditioned passively without much, if any, fossil fuel use. Contrary to the somewhat misleading label, Passive House buildings do not depend solely on passive solar energy to keep them comfortable, and they are not necessarily houses.’[3]
‘The Darmstadt row houses, which were completed in 1990, established that PH was not just a theoretical construct, but that a building could be kept warm and comfortable throughout a German winter and still have a maximum heat load of just 10 watts per square meter (W/m2) of living space.’
The above principles established the performance standard for annual space heating and cooling energy demands to be below 15 kWh/(m²a). The value position stands out because it relies on a single performance standard derived from houses designed for Germany’s cold climate.
Furthermore, ‘… the Passive House approach incorporates a thorough understanding of building physics that, when applied, creates super-insulated, very airtight buildings that require minimal energy use to heat, cool, dehumidify, and ventilate—while simultaneously delivering superior indoor air quality and year-round comfort’ [3]. The basic principles are as follows.
- Super insulate the entire envelope of the building—walls, roof, and foundation or crawlspace.
- Eliminate thermal bridges, or areas with relatively higher thermal conductivity than surrounding areas.
- Create an airtight structure. A continuous air barrier layer around the entire building envelope reduces heating and cooling needs, eliminates drafts, and makes the building more durable.
- Specify mechanical ventilation with heat or energy recovery, depending on the local climate.
- Install high-performance windows and doors.
- Minimize energy losses and manage energy gains.
- Use the PHPP for steady state energy modeling
From these principles, the use of passive elements creates a highly defensive building envelope that reduces to a minimum the heat and moisture flux between the internal and external environments. Active systems and automated controls provide environmental control. Occupants are assumed to be passive elements. [4].
2.1.1 Adapting to Different Climates
There are associated with untested technology transfer and commercialization driven by climate and cultural determinants [5]. The development of an International Standard for Passive House, which facilitates increased use worldwide, raises questions about the effectiveness of technical transfer across different cultures and climatic regions. Commercial organizations are quick to develop business models around perceived innovation and incorporate PH value propositions into their marketing and building projects, often uncritically. Perceived innovation is an important part of creating a value proposition [2].
2.1.2. Research and Development
Hence, Passive House has published research and case material to support the application to climates outside the northern European region. Wolfgang Feist and others conducted a simulation study of Passive House design adaptations for Yekaterinburg, Tokyo, Shanghai, Las Vegas, Abu Dhabi, and Singapore. They reported that the resulting annual energy demand for space conditioning in Passive Houses is 75-95% lower than that of a traditionally insulated building of the same geometry. They acknowledged that different adaptations are needed to accommodate humid climates. The typical annual energy demand can range from 15kWh/(m2a) to 70kWh/(m2a) to accommodate the humid conditions [6]. Furthermore, to achieve these outcomes, a better understanding of the technical and nontechnical aspects (i.e., human factors), building and its context is needed [7].
2.1.3. Technical and Nontechnical Adaptations
Recent research has highlighted some of the issues, for example, the use of mechanical ventilation systems. their study of case studies of Passive House buildings in IAQ issues with the application of different climates report.
‘In warmer marine climates, in buildings where the leaving of windows open does not trigger safety or allergen concerns, the mechanical system may be turned off during the warmer, summer months, but this approach can lead to problems with poor IAQ [3].
Research on the nontechnical aspects of operating a Passive House is evolving, adding further dimensions to understanding the value proposition [8]. This complexity is evident in many case studies where cultural traditions, specific climate conditions, and the need for energy efficiency coincide.
2.1.4 Cultural Traditions in Housing and Challenges of Climates with Large Seasonal Differences
A case study from South Korea adds to the discussion. Located in the Iksan area of South Korea, it has a Köppen Climate Classification subtype of “Dwa” (Hot Summer Continental Climate). This type of climate is perhaps most challenging for the standard, since it has a large seasonal range: cool temperate with very cold winters and hot, humid summers. The House blends traditions of Korean architecture for compact form and natural ventilation with the standard [3].
2.1.5. Potential Overheating, Latent Heat Loads from High Humidity.
An adaptation, such as an air conditioning system, is needed to complement the mechanical ventilation system, and operable windows are provided for natural ventilation when conditions are suitable. The concept of overheating in high-humidity climates suggests that latent heat loads, which dehumidification addresses, may pose a greater challenge than sensible heat loads.
2.2. The Challenge of Australian Climates and Conditions
2.2.1. Housing in Norms and Changing Traditions
In Australia, there is a diverse range of climates and conditions, cool temperate in the south and hot, humid in the north. From an early time, both indigenous and pioneering cultures have used passive elements to create highly interactive building envelopes. This is the selective use of passive elements to control, as necessary, the heat and moisture flux between the internal and external environment. Environmental control is left to the passive system with maximum use of ambient energy and a minimum use of active systems. Buildings are not sealed. Occupants are seen as active elements in adapting to changing climate conditions. It is argued that most of the housing stock built up to the turn of the century was based on this tradition. However, with the increase in the use of air conditioning, this value proposition may be changing [9].
2.2.2. New Niche Markets and the Changing Building Context- the Heat Gain Model
Passive House may provide a niche in the housing market in Australia, with PH houses being built in cool temperate climates and subtropical climates of Australia [10]. At the centre of the debate seems to be the pressure to move to a heat gain model for energy assessment, tighter limits to thermal comfort in all buildings, and increased energy efficiency. Not only in houses but also in public buildings. This has sparked interest in the PH across a range of building types, including a recent cost-benefit study of the use of Passive House techniques in schools. [11]. The value proposition offered by PH is attractive to stakeholders seeking to balance human needs, climate adaptation, and energy consumption in procurement and, by extension, approaches to low-energy housing encouraged through the star rating system of the Australian National House Energy Rating system (NatHERS).
Testing of the efficacy of NatHERS in reducing emissions has also pointed to the challenges of applying only any energy measure. Contrary to design intent, better-rated NatHERS buildings are shown to substantially increase energy loads in Australia’s warm temperate climate. The failure to recognize occupiers’ behaviour and preferences is suggested as the reason, with heat being trapped in increasingly insulated and sealed structures not being relieved through the intervention of passive systems overnight. [12,13}
Furthermore, the recent study by David Kroll et al of the use of PH for suburban housing in Southern Australia demonstrates the issues with ‘one size fits all.’ The market is driven by increasing urban sprawl, where low-rise high-density housing solutions are occurring. This kind of development approach appears to give little opportunity for an interactive passive design approach embedded in the Australian tradition for housing. It seems to be polarising housing as air-conditioned defensive entities. Hence, housing developers are looking at the use of PH standards for this type of situation. The consequences for passive design and cultural traditions in Australia are profound [14.].
2.2.4 Renewable energy and the Opportunity of Rethinking Low-Energy Housing
Rethinking low-energy housing is occurring with pioneering work by Jason Gaekwad, in his paper’ Passivhaus (Passive House) in Australian Climates,’ May 2019, Ecolibrium [15]. There are some new Passive House principles for Sydney climates that can assist with the unfolding socio-technical discourse.
The success of the Roof Top Solar scheme in Australia is emerging as a major source of affordable site-based renewable energy. PH has developed new metrics to support this initiative as part of evolving the approach in different climates [16].
2.3. Socio-Technical Discourse
Passive House is not the only standard that proposes using cold climate passive design principles for buildings; it is now becoming more widely adopted for a wide range of energy efficiency and decarbonization approaches [1]. Hence, looking more broadly at the principles that underpin the standard, its ability to meet contextual parameters to achieve its goal, and the potential effects on indoor air quality and overheating. This debate pulls together a range of cultural, social, economic, and environmental perspectives, which help to form the value propositions.
This research reveals that the value proposition is more complex than previously thought. It is evident that a ‘one size fits all’ approach is not effective, and relying solely on energy use as an indicator of performance—specifically, a fixed annual useful energy demand below 15 kWh/(m²a)—is not credible. The authors concluded that researchers should re-evaluate the existing prescriptive standards for building envelopes to include additional indicators.
The foregoing analysis leads to four questions, which are crucial to that debate.
- Do the climate differences between German and Australian climates undermine the value proposition for active systems?
- Passive air infiltration in most parts of Australia is not the biggest determinant of comfort or energy expense; is creating a super airtight dwelling necessary for the high level of performance?
- Is the assumption that PH provides superior indoor air quality, as it provides continuous mechanical ventilation, valid?
- Are standard energy annual demand requirements applicable to the diverse conditions in Australia?
This research reveals that the value proposition is more complex than previously thought. It is evident that a ‘one size fits all’ approach is not effective, and relying solely on energy use as an indicator of performance—specifically, a fixed annual useful energy demand below 15 kWh/(m²a)—is not credible. The authors concluded that researchers should re-evaluate the existing prescriptive PH standards for building envelopes to include additional indicators.
3. Materials and Methods
The first question concerning climate differences necessitates providing additional data to help evaluate decisions on selecting active systems, including a mechanical ventilation system with heat recovery. This data helps determine the optimal approach to meet a heating and cooling/dehumidification load of 15 kWh/m² per year. Additionally, the specified space cooling load is 10 W/m², outlining the annual heating and cooling space requirements.
This evaluation compares the climate of German and Australian cities by using the Degree-Day methodology to assess heating and cooling days. Local weather stations in provide the necessary data [17]. This methodology operates on the principle that when the average daily temperature falls below comfort levels, heating is necessary, and when it exceeds those levels, cooling is needed. To calculate Heating Degree Days (HDDs) and Cooling Degree Days (CDDs), we determine the differences between the average daily temperature and the BASE (comfort level) temperatures, which we set at 12 and 18 degrees Celsius for heating and 18 and 24 degrees Celsius for cooling.
Although the Degree Day methodology is a common tool for assessing building energy performance, it relies on average weather data, which creates a linear relationship between climate conditions and energy consumption. However, other factors, such as solar radiation, significantly affect cooling loads and influence this relationship (De Rosa, 2014). Therefore, in addition to solar radiation, this analysis also considers solar radiation.
The evaluation of solar heat availability from direct sunlight reveals significant climate differences between Australian and German cities, even more pronounced than the temperature differences. Comparing Australian cities using hourly data extracted from the Reference Meteorological Years (RMYs) for each city. The analysis includes a review of sky conditions and solar radiation levels based on the collected data. It highlights the presence of climates with very sunny conditions as well as those with overcast skies, which typically indicate the wet season in tropical regions. The results found that Sydney serves as a suitable proxy for average seasonal solar direct radiation.
Furthermore, the evaluation of solar heat availability from direct sunlight for each hour of the year in various Australian and German cities reveals climate differences that are even more pronounced than temperature variations. The analysis utilizes hourly data extracted for the nominated Reference Meteorological Years (RMYs) for each city. This data enables a comprehensive review of sky conditions and solar radiation levels, highlighting the contrast between sunny and overcast climates. Overall, Sydney effectively represents average seasonal levels of direct solar radiation.
The next questions concerned airtightness and indoor air quality, discussed with reference to a survey of Australian housing. The CSIRO energy-efficiency study of 20 houses in Australian capital cities included blower-door testing of 129 houses [18]. The final question concerns studies that compare the standardization energy demand requirements with NatHERS and local standards such as BASIX for New South Wales. NatHERS has a 10-star rating system across 56 climate zones. Within NatHERS, Star Bands are set for each Climate Zone to allow fair comparisons of buildings despite extreme regional variability in weather conditions across Australia.
Key Features of the 2012 Criteria
- Thermal Load Measurement: Star ratings are determined using accredited software (such as Chenath, AccuRate, FirstRate5, or BERS) that simulates the energy required to maintain a comfortable home.
- Climate Zone Specifics: Australia hosts a wide range of climates, from the tropical north to the alpine south. Consequently, the maximum energy load assigned to a specific star rating (e.g., a 6-star rating) varies by local climate zone. For example, a 6-star home in South Australia has an approximate thermal load benchmark of 96 MJ/m²/year, whereas the equivalent star ratings differ in hotter or colder regions.
- Regulatory Baseline: Following the 2010 update to the Building Code of Australia, the standard minimum regulatory requirement for new Class 1 detached and attached residential buildings in most Australian states and territories was set at 6 stars.
- Area Correction Factor (ACF): NatHERS star ratings apply an area adjustment to standardize thermal loads based on the net conditioned floor area and exposed building fabric, ensuring equity for both smaller and larger homes.
Energy Loads (thermal) corresponding to these Star Bands increments in each Climate Zone (Star Band criteria 2012) [19]. BASIX is regulated in New South Wales and comprises a Sustainability Index that uses multiple criteria. In 2017, researchers revised the thermal comfort caps for heating and cooling loads. This study compares the PH and BASIX requirements using that data. It is important to note that these caps are based on energy consumption and account for additional socio-technical factors, including construction practices, cost-benefit analyses, and architectural criteria. Stringency reviews determine the level of energy efficiency across different locations in Australia. The study uses this data to compare the PH and BASIX requirements (BASIX, 2017) [20].
These caps reflect not only energy consumption but also additional socio-technical factors, such as construction practices, cost-benefit analyses, and architectural criteria. Stringency reviews assess the energy efficiency levels across various locations in Australia.
The final question concerns studies that compare the standardization energy demand requirements with NatHERS and local standards such as BASIX for New South Wales. NatHERS has a 10-star rating system across 56 climate zones. Within NatHERS, Star Bands are set for each Climate Zone to allow fair comparisons of buildings despite extreme regional variability in weather conditions across Australia. This table shows the maximum Energy Loads (thermal) corresponding to these Star Bands (shown in half-star [0.5] increments) in each Climate Zone (Star Band criteria 2012) [19]. BASIX is regulated in New South Wales and comprises a Sustainability Index that uses multiple criteria. In 2017, researchers revised the thermal comfort caps for heating and cooling loads. This study compares the PH and BASIX requirements using that data. It is important to note that these caps are based on energy consumption and account for additional socio-technical factors, including construction practices, cost-benefit analyses, and architectural criteria. Stringency reviews determine the level of energy efficiency across different locations in Australia. The study uses this data to compare the PH and BASIX requirements (BASIX, 2017) [20]. These caps reflect not only energy consumption but also additional socio-technical factors, such as construction practices, cost-benefit analyses, and architectural criteria. Stringency reviews assess the energy efficiency levels across various locations in Australia.
4. Results
The next section presents the questions using these methodologies. Each part starts with the PH metric for the issues to facilitate a comparative analysis of the Australian response to these issues.
4.1. Do the Climate Differences Between German and Australian Climates Undermine the Value Proposition for Air Tightness and the Use of a Mechanical Ventilation System and Comfort?
4.1.1. Respecting Climate Diversity- Heating, Cooling, and Degree Days
A simple comparison between German and Australian cities highlights the similarities and differences that should guide design choices. In our preliminary study, we compare annual heating and cooling degree days, which can be used to estimate the potential savings from reducing air infiltration and implementing energy recovery in mechanical ventilation systems.
The analysis of heating degree days (HDD) and cooling degree days (CDD) outside normal internal comfort ranges reveals a clear distinction between the two locations. German cities consistently exhibit a heating-dominated climate, with little to no need for cooling (Figure 1).
A simple comparison between German and Australian cities highlights the similarities and differences that should guide design. A comparison of annual heating and cooling degree days to estimate the energy savings from reducing air infiltration and recovering energy through mechanical ventilation systems (Figure 2). The analysis reveals a clear difference in heating degree days (HDD) and cooling degree days (CDD) outside normal internal comfort ranges between German and Australian cities. When comparing German cities, all are heating-dominated with little need for cooling.
Different mechanical ventilation systems with heat recovery (HVR) or enthalpy ventilation recovery (EVR) effectively control both heat and humidity. In the German climate, builders often couple the HVR with high air tightness to minimize the infiltration of cold air. These systems reclaim heat from outgoing air to warm incoming air and operate 24/7, which results in an energy penalty. This energy use justifies the implementation of HVR systems. In milder climates where occupants can open windows, users can turn off these systems [3].
By comparison, Australian cities exhibit a diverse range of climates, with none as heat dominated as the German cohort. CDD indicated that daytime outdoor air is warmer than indoor air for a greater proportion of the year in all Australian cities, even Canberra and Hobart. Analysis shows substantial differences; Australia’s cold cities have half the heating demand of Germany’s warmest cities. Some Australian cities have no heating demand. The conclusions suggest that energy recovery from these systems is not viable and that their contribution to reducing cooling and heating demand is questionable.
4.1.2. The use of a Mechanical Ventilation System and Comfort.
The design of certified MHRV units faces challenges when applied to Australian conditions. Manufacturers quote high heat-recovery efficiencies during winter operation. However, these figures hold only when they account for the waste heat generated by the fan in the supply air stream. By utilizing the ‘free’ heat from the motor in winter to improve recovery efficiency, these systems may deliver warm ventilation air during summer, depending on how effectively the heat-exchange systems cool the incoming air.
4.1.3 Solar Access and Shading
The starkest difference between the traditional Australian integration of passive solar design and the passive design approach used in cold climates is the attention given to solar access and shading In The use of shading to selectively screen the harsh summer sun while allowing in the warming winter sun is fundamental to the Australian approach but is notably absent from the Passive House primary requirements. A seasonal comparison of German cities, overlaid on Sydney for ease of comparison, shows that solar radiation is not significantly different; it remains higher in German cities for only a small portion of the year. In contrast, Australian cities experience a high level of direct solar radiation for a much longer period of the season.
Comparing psychrometric data, the importance of a comprehensive approach using passive design is noted. The area under the plotted lines indicates the total amount of direct sunlight received in each city throughout all seasons. Solar heat from direct sunlight is significantly more abundant in Australia. High levels of direct sunlight enhance the benefits of effective solar shading in the summer, helping prevent overheating, while also allowing sunlight to be harnessed in the winter to reduce heating needs.
The next comparison plots the German and Australian cities against their summertime and wintertime total direct solar radiation. Each city is also color-coded by heating and/or cooling requirements, indicated by deviations in degree days outside the upper and lower comfort limits, indicating cities that need to consider both passive and active cooling and heating strategies.
This straightforward mapping indicates that direct solar radiation is not a significant design consideration for passive design in most German cities, primarily due to their low levels of sunshine cities that experience more sunlight during the summer months, solar-control glass can mitigate heat, as harnessing solar energy in winter offers little benefit. Additionally, most German cities do not require cooling solutions. In contrast, the only Australian city where cooling is deemed less important is Hobart. Most Australian cities need to consider both heating and cooling, falling into the quadrant that benefits from effective passive solar design strategies. These strategies involve minimizing solar heat through shading in summer while maximizing solar heat capture in winter. Based solely on this climatic comparison, the Passive House standard appears to have significant shortcomings when applied to Australia.
4.1.3. Comfort, Natural Ventilation, and Mitigating Overheating
The Australian tradition of passive solar design uses natural ventilation to provide occupants with fresh air and cooling and to reduce internal heat loads [21]. Occupants’ adaptive behavior is also considered part of this tradition. Setting an upper limit of 25 degrees C for the internal temperature for 10 percent of the time may confound these assumptions, suggesting the use of design strategies based on ASHRAE Standard 55 and the current fundamental Comfort Model. (Figure 3) In this model, thermal comfort is based on dry bulb temperature, clothing level (clo), metabolic activity (met), air velocity, humidity, and mean radiant temperature. Indoors, assumptions that the mean radiant temperature is close to the dry bulb temperature of 25 degrees C and 60 percent humidity. The zone in which most people are comfortable is calculated using the PMV (Predicted Mean Vote) model and is used primarily for office buildings [22].
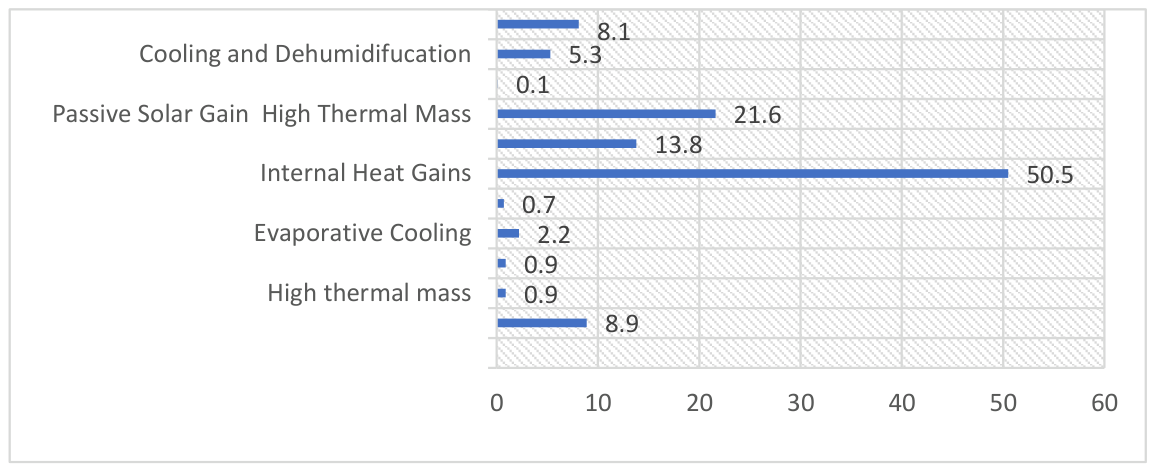
A study of the comparison of PH and Passive Solar Design is in Appendix A. When comparing Passive House and Passive Solar design strategies, the effectiveness is shown using data from Climate Consultant, as the percentage of time passive strategies are effective.
- Sun shading of Windows: Passive Solar strategy is effective 8.9%.
- High Thermal Mass: Both scores equally at 0.9%.
- High Thermal Mass with Night Flushing: Both score at 0.9%.
- Evaporative Cooling: Both systems score 2.2%.
- Natural Ventilation Cooling: Passive Solar scores 0.7%.
- Internal Heat Gains: Passive House at 80.5%, Passive Solar at 50.5%.
- Passive Solar Gain (High Thermal Mass): Passive Solar at 21.6%.
- Wind Protection: Both score 0.1%.
- Cooling and Dehumidification: Both score 5.3%.
- Heating and Dehumidification: Both score 8.1%.
In summary, Passive Houses enhance internal heat gains and thermal performance, while Passive Solar designs utilize natural solar gain and thermal mass. Each approach suits specific climates and design goals.
However, energy consumption and comfort standards are linked, so for naturally conditioned buildings, ASHRAE has adopted the Adaptive model of thermal comfort, which offers broader comfort bands. (see Figure 5). If used in free-running residential buildings, as commonly found in Australia, in a cool temperate climate such as Sydney, natural conditioning can provide comfort for approximately 19 percent of the year and flow-on energy conservation benefits [22].
Of additional importance, Lomas points out that temperate-climate buildings designed to reduce winter heat gains overheat in summer, particularly in new houses [23] Mitigation is by natural ventilation or air conditioning. Current CIBSE guidance uses a simple definition of overheating as where internal temperatures exceed 28 °C for more than 1% of occupied hours, based on simulations using weather files from a ‘design summer year’ (DSY) [24] . Empirical definitions of overheating based on adaptive thinking and occupant behavior can support the use of natural ventilation when the building is better connected to the external environment, thereby reducing dissatisfaction [25] Hence, rethinking the nexus between natural ventilation and occupants’ engagement may offer more potential in reducing carbon pollution.
4.3. Airtightness in Buildings in Australia is Discretionary, and Creating a Super Airtight Dwelling Is Necessary for the High Level of Performance.
Residential building standards for air tightness in Australia are poor European standards, and a super airtight standard is claimed to be necessary [18]
A significant point of difference is the strict control of a building’s envelope air tightness to address cold-climate passive principles, which contrasts with Australia, where air tightness is not regulated. The NatHERS software does not explicitly specify a required level of air tightness. Instead, it defines the infiltration rate as ‘A + B.v,’ where ‘A’ represents the stack infiltration factor, ‘B’ denotes the wind infiltration factor, and ‘v’ is the local wind speed [26].
Ambrose and Symes’ study of over 125 houses found that, on average, 15.5 ACH@50Pa. The average value for Sydney is 22 air changes per hour ACH50 at 50 pa, which meets the cold-climate requirement of 0.6 ACH50 [18]. The inference being that Sydney dwellings are over 30 times worse than the best-practice airtightness standard requires. There are two problems with the imperative for super airtightness in Australia.
4.3.1. Passive Air Infiltration and Its Benefits
The ACH50 measurement illustrates the extent of the leaky building issue in Australia, but it often gets presented out of context. It is crucial to understand that this measurement does not reflect real-world conditions or typical passive air infiltration in buildings. Such infiltration primarily concerns the loss of heat energy from homes. The 50 Pascal (Pa) level used in this measurement is too high to represent actual infiltration rates accurately; instead, it serves as a benchmark to obtain reliable readings from blower door test equipment. This pressure level corresponds to wind speeds of about 9 m/s (or 32.5 km/h), which occur for less than 5% of all hours throughout the year at a weather monitoring station located 10 meters above open, unobstructed terrain.
The Sydney weather station records a typical medium wind speed of 2.5 m/s, corresponding to a wind pressure of 3.8 Pa. In an urban street setting, buildings experience even lower wind pressures than those recorded at the weather monitoring station due to the broad urban topology and the presence of adjacent buildings. Additionally, an oblique wind approach angle further decreases the resulting pressure on the facade.
Air tightness is not mandatory for residential buildings in Australia, making it one of the few OECD countries without a specific, mandatory, numerical airtightness standard for new homes. While the National Construction Code (NCC) requires buildings to be draught proof, it does not mandate pressure testing (blower door tests) to verify performance [26.] Generally, the typical air infiltration rate at a test pressure of 50 Pa is about one-twentieth of the test value. In Sydney, the average air infiltration rate in homes is approximately 1 air change per hour (ACH), which is considered relatively good for the country. In dense urban environments, such as apartments, this rate tends to be even lower due to the reduced external envelope areas. Some level of infiltration is necessary to prevent the accumulation of pollutants and moisture within the home. For a typical 75 m² dwelling, an air change rate of 0.25 to 1 ACH requires a ventilation flow of 14 to 28 liters per second (l/s), which is the minimum ventilation needed to ensure acceptable living conditions for 1 to 3 occupants.
4.3.2 Super Air Tightness Is Not Necessarily Better
0.6 ACH50 effectively eliminates infiltration in a dwelling under real-world environmental conditions. Passive air infiltration under median wind speed conditions in Sydney will produce less than 1 l/s of ventilation. Whilst this may offer some benefit in limiting heat loss, it dictates an absolute reliance on mechanical ventilation to remove moisture and air pollutant build-up from the dwelling, which is necessary to prevent mold growth and maintain a minimum acceptable air quality for human occupation.
For energy savings, a preliminary analysis in the Sydney climate shows that the energy required to run the mechanical ventilation system to make good the loss of infiltration will exceed any energy saved from reducing the heat losses associated with passive air infiltration, confirming that the air tightness required by Passive House carries an energy penalty in warm temperate climates.
4.4. Better Indoor Air Quality Is Provided by Continuous Mechanical Ventilation (MV)
Exploring the consequences of high levels of airtightness and the use of continuous mechanical ventilation. It is necessary for human health, i.e., for maintaining metabolic and other physiological conditions. recognize the suitability of these techniques and the close coupling of IAQ with external environmental conditions. It would be logical to assume that cold-climate techniques are consistent with cold-climate conditions. Given cold-climate psychrometric conditions, with their adverse effects of very low temperatures and humidity variability, it may be sensible to control IAQ by maintaining absolute indoor air humidity below 12 g/kg for more than 20% of the occupied time.
In temperate Australia, external environmental conditions, psychrometric factors, and techniques vary significantly. This discussion highlights how natural ventilation promotes human health by utilizing natural air infiltration and operable windows in dwellings. Additionally, the common assumption that mechanical ventilation provides excellent air quality and effectively filters out harmful outdoor pollutants, such as pollen and other airborne irritants, needs to be examined.
4.4.1 Better Indoor Air Quality
In Australian Standards, the National Construction Code (NCC) sets higher minimum requirements, if dwellings will have sufficient openable windows to provide sufficient indoor air quality. The NCC does not necessarily require an increase in capacity to meet the standards set by AS 1668.2, which defines the minimum for natural ventilation. Regardless, there is a significant difference between meeting the minimum ventilation requirements and providing adequate ventilation for excellent indoor air quality.
Minimum ventilation rates specified by various national codes and standards aim primarily to eliminate odors and pollutants produced by occupants, rather than to ensure excellent indoor air quality. The verification method outlined in the NCC also requires consideration of internal pollutant emissions unrelated to occupants, such as total volatile organic compounds (TVOCs) emitted from furnishings, finishes, and other household items. To significantly reduce indoor air pollutant concentrations and improve indoor air quality, it is essential to increase ventilation rates.
The correlation between increased mechanical ventilation rates and higher illness rates. When evaluating air quality, health, and overall well-being, it is essential to exceed minimum ventilation requirements, highlighting the contradiction between ensuring excellent air quality and the technical objective of minimizing ventilation (Figure 6).
4.3.2. Consequences of restricting ventilation rates
The combination of super-airtightness and minimal mechanical ventilation increases the risk of poor indoor air quality in Australian dwellings. The rates nominated in the NCC and the Australian Standard would normally also benefit from passive infiltration to remove indoor pollutants. Removing this mechanism could result in internal air pollution exceeding the Australian Standard for a normally constructed dwelling (Figure 6). The threat of restricting ventilation too far in the interest of energy efficiency has been demonstrated in many studies [28]. One study predicted a 2-3% increase in asthma for every incremental improvement in the UK energy standards, resulting in increased air tightness [29].
4.4. Are standard energy demand requirements applicable to the diverse conditions in Australia?
4.4.1 Harmonizing with Local Conditions
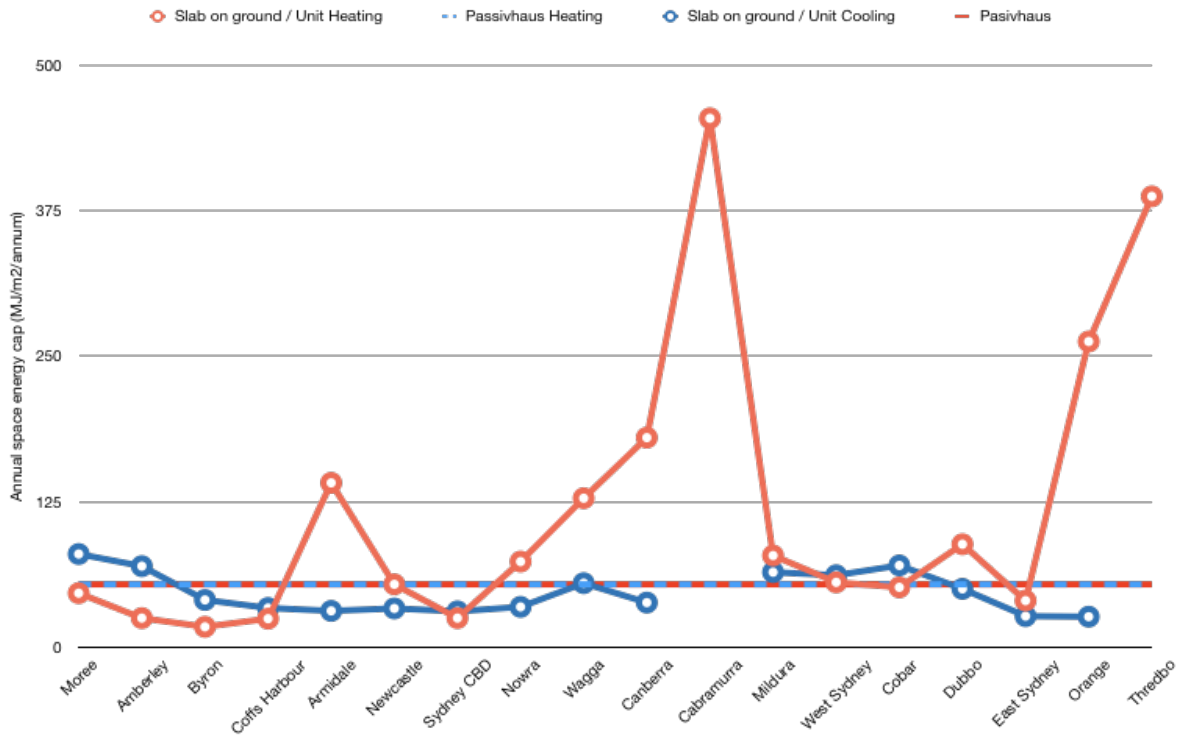
The effect of using a global energy benchmark of annual primary energy demand of 120kWh/m2yr. Space heating and cooling load caps for peak demand and annual space energy loads in a dwelling.
These requirements are consistent globally, except for some provisions to modify the cooling load cap in tropical climates and allow higher internal process loads. The caps for annual space energy are directly comparable to the thermal comfort caps in BASIX. Global targets such as Passive House do not vary to account for differences in local climate or between a house and an apartment. To demonstrate the value of enforcing stricter targets within the BASIX-regulated framework, we must show how extreme climate conditions directly affect the investments required to meet them. Therefore, establishing local variations of targets is essential to ensure an equitable cost-benefit impact (Figure 7)..
The graph comparing simple climate-corrected BASIX targets to static targets indicates that slab-on-ground houses or apartments constructed with energy efficiency levels below global standards for both cooling and heating. While some BASIX caps are more stringent, others are significantly more relaxed, raising concerns about the effectiveness of global standards that are said to improve thermal efficiency, especially when the fundamental targets are less stringent in certain locations.
4.4.2 Methods of Calculations
To validate compliance with BASIX thermal comfort targets, the NatHERS protocol requires the use of representative hourly weather data suitable for the region. It also requires the use of an approved dynamic thermal modeling software package that operates on the validated Accurate calculation engine developed by CSIRO. This engine effectively models the dynamic thermal response of materials, provides a detailed treatment of solar radiation, and facilitates multi-zone natural ventilation.
By comparison, there is criticism of using only a simple, steady-state calculation. It follows the monthly method of EN 1370, which is the least sophisticated method included in the standard. Using this method yields only one heat balance calculation per month, which relies on significant simplifications of all climate-related impacts and inherently limits the capacity to model complex dynamic interactions, such as between solar gain, the thermal response of materials, and natural ventilation, all of which are fundamental to passive design.
When climatic inputs for a steady-state assessment, as found in PH standards, are compared with the NatHERS process, the calculation considers only 1 average temperature per month for the year and a single average solar radiation value for each of the north, east, south, west, and horizontal orientations. These monthly averages are supplemented with the monthly average dew point temperature and sky temperature to complete the 8 climate data points used to confirm thermal compliance. This comparison highlights a significant disadvantage when evaluating the dynamic thermal simulation used by Accurate. Their method uses hourly weather data to simulate each hour of the month, yielding at least 5,040 climatic variables for a 30-day month. In contrast, the Passive House approach only considers 8 variables.
4.4.3 Renewable Energy Integration and Primary Energy Demand
A prevailing question is how to integrate renewable energy with the concept of low-energy buildings and how effectively to account for RE in energy efficiency codes. The lack of definitions and processes is at the center of the debate, which has given rise to terms such as Net Zero Energy Buildings (NZEB) [31] and Nearly Zero Energy Buildings [32]. However, local, national, and global ‘welfare’ (subsidies and incentives) is needed as nation-states respond differently to this welfare capacity, promoting or penalizing NZEB building methodologies [33]. Part of the problem is calculating the energy balance between energy used and energy supplied by renewable energy sources. Providing two Primary Energy Demand requirements.
Their rising importance of renewable energy and one without, seems to be out of step with the drive to reduce carbon pollution, mandating only 50% off set from renewable energy seems to deny the contextual variability of climates such as Australia, which can potentially displace the domestic energy demand through renewables. (see Appendix A)
In Australia, subsidies for solar installations, high yields, and rising electricity costs have changed the value proposition for low-energy houses (see Appendix B. Energy codes like BASIX now account for renewable energy offsets, suggesting that a site-based approach can yield significant improvements in energy efficiency through these technologies. This shift not only alters the value proposition but also raises the question of whether local standards should dictate it or global norms should take precedence.
Australia also has a well-established practice of using greenhouse gas emissions to represent the differing impacts of energy sourcing and generation [34]. A Greenhouse Gas measure benefits from technically informed derivation, whereas Primary Energy Factors are often subject to political influence, creating bias toward certain fuel stocks and making comparisons between countries difficult [35] The most significant difference lies in off-site sources, where in Australia accurately accounts for PVs’ contribution to grid decarbonization. In most EU member states, assign a PEF of 1 to both renewable energy sources and natural gas. Many consider PH’s reliance on Primary Energy accounting a significant weakness compared to contemporary Australian practices.
4. Conclusions
This analysis suggests that globally low-energy building standards based on cold-climate principles, such as Passive House, may provide a poor fit for Australia. The claimed benefits do not appear to have been sufficiently substantiated in the Australian context, raising concerns that practitioners and regulators should apply caution before promoting the use (refer to where in some locations the global energy target is higher than the local standard, meaning Passive House buildings may not comply)
This tension presents an opportunity to leverage global standards and the certification process to develop a business case and establish a niche market for ‘ultra-low energy houses.’ Anecdotal evidence indicates that people perceive ‘energy efficiency’ as a new commodity, paving the way for a ‘new way of life.’ [36] (Kemp 2020).
Lane points out that for a ‘0-3 percent cost premium buys guaranteed comfort and low energy.’ [37]
The lessons learned from these new Australian ultra-low-energy house types follow an envelope-dominant approach. Their capacity to adapt to seasonal extremes in temperature and humidity, as seen from the Korean case study, is key to harmonizing local cultural preferences for environmental control with global energy targets.
The move to decarbonize Australia’s economy, and the need to improve the energy efficiency, health, and resilience of Australia’s residential building stock, require careful consideration to ensure that effort and capital directed towards improving outcomes deliver the necessary improvements and do not result in expensive sub-optimal thermal outcomes, degraded amenity, or reduced resilience. The analysis suggests that outcomes in each of these areas in Australia are substantially different from the promise. That robust local testing is essential to support the current claims.
Author Contributions
For research articles with several authors, a short paragraph specifying their individual contributions must be provided. The following statements should be used “Conceptualization, CW.; methodology, CW.; software, CW.; validation, CW formal analysis, CW.; investigation, CW.; resources, CW.; data curation, CW.; writing—original draft preparation, CW.; writing—review and editing, CW and RH.; visualization, CW.; supervision, CW.; project administration, RH; funding acquisition, CW. All authors have read and agreed to the published version of the manuscript.
Funding
This research received no external funding.
Institutional Review Board Statement
Not applicable.
Informed Consent Statement
Not applicable.
Data Availability Statement
Data is available on request.
Acknowledgments
During the preparation of this manuscript the author(s) used Grammarly for the purposes of spell checking and text editing and Goggle AI for fact checking. The authors have reviewed and edited the output and take full responsibility for the content of this publication.
Conflicts of Interest
The authors declare no conflicts of interest.
Abbreviations
The following abbreviations are used in this manuscript:
| PH | Passive House |
| PHPP | Passive House Planning Package |
| NatHERS | Nationwide House Energy Rating Scheme |
| CSIRO | Commonwealth Scientific and Industrial Research Organisation |
| BASIX | Building Sustainability Index) is a New South Wales (NSW) Government planning framework and web-based assessment tool used to regulate the sustainability and environmental performance of residential buildings |
| ASHRAE | American Society of Heating, Refrigerating and Air-Conditioning Engineers |
| CIBSE | Chartered Institution of Building Services Engineers |
| ACH50 | Air Changes per Hour at 50 Pascals stands for Air Changes per Hour at 50 Pascals |
| 0.6 ACH50 | A pressure difference of 50 Pascals (equivalent to a 32–33 km/h wind blowing against the building), the total amount of air leaking through the building envelope per hour is no more than 0.6 times the total internal volume of the house |
| EU | European Union |
| NABERS | National Australian Built Environment Rating System |
Appendix A
When exploring the key differences between Passive House and Passive Solar design principles, it is crucial to delve into their distinct approaches to energy efficiency, comfort, and climate responsiveness. Both strategies aim to create sustainable living environments, but they employ different methods and principles to achieve their goals.
Energy Efficiency: Passive House is a rigorous standard for energy-efficient buildings. It focuses on minimizing the energy usage for heating and cooling through superior insulation, airtightness, and high-performance windows. A Passive House typically has a heat demand of less than 15 kWh/m² per year and total primary energy demand of less than 120 kWh/m² per year. The use of energy recovery ventilation systems further enhances energy performance by ensuring a constant supply of fresh air without significant energy loss. In contrast, Passive Solar design leverages the sun’s energy for heating and lighting without relying on mechanical systems. It employs strategies such as optimizing window placement and size, incorporating thermal mass, and designing overhangs for effective sun shading. While it can be highly efficient, its energy performance can vary significantly depending on the climate and specific design choices.
Comfort: Comfort in Passive House design is achieved through stable indoor temperatures, thanks to its stringent building envelope and controlled ventilation, which leads to excellent air quality and reduced drafts.
Figure 1.
1 Passive Solar Options.
The focus on constant indoor conditions allows occupants to enjoy a consistently comfortable environment regardless of external weather fluctuations. Passive Solar design promotes comfort by harnessing natural heating from the sun and requires careful design to avoid overheating during the summer months. Thermal mass, such as concrete or stone used in walls or floors, stores heat during the day and releases it at night, contributing to thermal comfort. However, without proper shading and ventilation strategies, there is a risk of discomfort due to excessive heat gain.
Climate Responsiveness: Passive House design principles prioritize local climate conditions to achieve optimal energy performance. The strategy emphasizes building orientation, the amount and type of glazing, and thermal insulation, enabling the structure to remain energy-efficient throughout various weather scenarios. On the other hand, Passive Solar design relies heavily on climate responsiveness by adapting the design to specific environmental conditions. It utilizes solar gains in cold climates while employing shading devices and ventilation in warmer climates to reduce cooling loads. This adaptability can lead to varying effectiveness in different contexts; thus, the success of Passive Solar strategies depends on the climate context and how well the architecture responds to it.
Strategies for Performance Analysis: Using data from Climate Consultant, analysis of the effectiveness of passive strategies across different climates, examining parameters such as sun shading, thermal mass, and internal heat gains. For example, models might show that overhangs are highly effective in summer months in certain climates, while thermal mass varies in effectiveness based on daily temperature fluctuations. In conclusion, while both Passive House and Passive Solar design principles aim to create energy-efficient, comfortable spaces, their methodologies diverge significantly. Passive House focuses on a rigorous set of performance criteria and energy standards, whereas Passive Solar emphasizes climate adaptability and natural energy use. Each approach offers valuable strategies, and understanding their strengths can help architects and builders implement the most suitable practices for their projects.
Figure 1.
2 Comparison between Passive House and Passive.
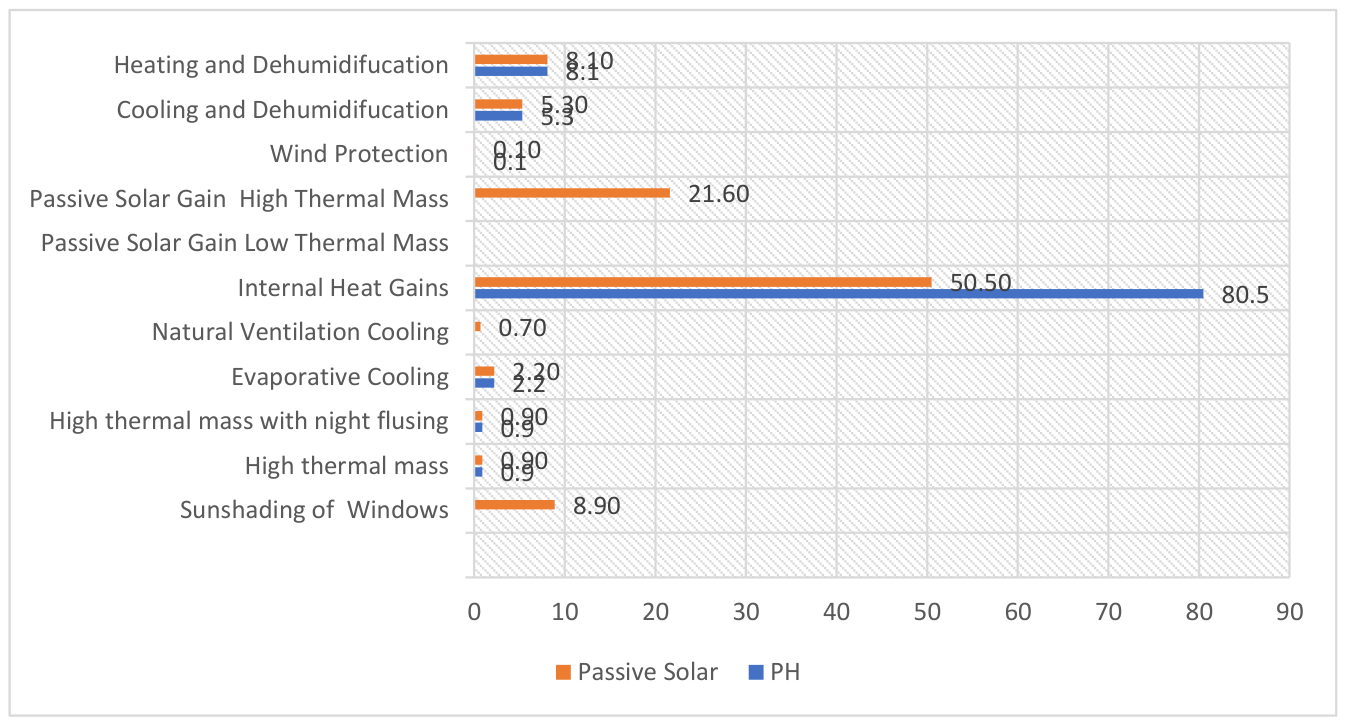
A comparison between Passive House and Passive Solar is provided (Figure 1.2) For the PH specification, several assumptions should be noted. First, shading, natural ventilation, and passive solar gain are excluded; the Mechanical Ventilation System with humidity and heat control provides environmental control. are excluded. The system better manages internal heat gain.
A comparison between Passive House and Passive Solar is provided (Figure 1.2) For the PH specification, several assumptions should be noted. First, shading, natural ventilation, and passive solar gain are excluded; the Mechanical Ventilation System with humidity and heat control provides environmental control. are excluded. The system better manages internal heat gain. A summary of the assumptions are below.
1. Sun shading of Windows: Passive House: Not specified Passive Solar: 8.9%
2. High Thermal Mass: Both systems perform equally here with a score of 0.9%, indicating a strong ability to absorb and retain heat, which can enhance indoor comfort and reduce heating needs.
3. High Thermal Mass with Night Flushing. Both systems also score 0.9,% showing that they effectively utilize thermal mass strategies to naturally cool spaces at night.
4. Evaporative Cooling: Both systems have a score of 2.2%, showcasing their effectiveness in using moisture evaporation for cooling purposes.
5. Natural Ventilation Cooling: Passive House: Not specified. Passive Solar: 0.7%, indicating a moderate capability for natural ventilation strategies that can aid in cooling.
6. Internal Heat Gains: Passive House: 80.5%. Passive Solar: 50.5%, demonstrating that Passive Houses potentially better use internal heat sources, which can lead to enhanced energy performance in colder months.
7. Passive Solar Gain (Low Thermal Mass): Not specified for both systems.
8. Passive Solar Gain (High Thermal Mass): Passive House: Not specified. Passive Solar: 21.6%, indicating a higher efficiency in using solar gain through materials with high thermal mass.
9. Wind Protection: Both systems score 0.1%, showing a limited focus on wind protection strategies.
10. Cooling and Dehumidification: Both systems score 5.3%, indicating they are similarly effective in managing humidity and cooling.
11. Heating and Dehumidification: Both systems score 8.1%, showing they can maintain comfort in heating while managing humidity effectively.
Appendix B. The Current Solar Yield in Australia
Australia has achieved remarkable solar energy yields as of early 2026, largely due to its high solar availability and widespread adoption of solar technologies. The country leads the world in per-capita rooftop solar, with over 4.3 million installations by April 2026, covering nearly 40% of Australian households. The 2026 Solar Yield and Generation Statistics Total Contribution: In 2024, solar energy accounted for approximately 15.3% of Australia’s total electricity generation. By early 2026, solar (both rooftop and utility-scale) will frequently contribute a quarter of the country’s electricity during peak times, particularly noted in October 2024 ([38].
Rooftop Solar Output
Rooftop photovoltaic (PV) systems alone accounted for 12.4% of Australia’s total electricity generation in 2024, totaling 30,178 GWh. Daily solar generation peaked at 222 GWh in January 2026, with rooftop solar contributing approximately 11.2% to 12.4% of the total power supply. By early 2026, rooftop solar capacity reached 28.3 GW, surpassing the combined capacity of all Australian coal-fired generators, which stands at 22.5 GW. Utility-Scale Performance has increased, and grid-scale solar generation reached an average output of 2,706 MW in the first quarter of 2026. Regional and seasonal Yields have increased. New South Wales (NSW) has the highest total installed capacity, nearing 8 GW, while Queensland (QLD) has the most installations, with over 1.16 million systems. In February 2026, top-performing utility-scale solar farms in Western Australia, such as the Merredin Solar Farm, achieved capacity factors of up to 41.2%. Winter output, even during winter, solar systems in southern regions like Adelaide can maintain respectable output levels, with one study showing daily averages of around 8.3 kWh for a standard system in June
The reasons for high yields.
- High Solar Radiation: Australia receives the highest average solar radiation per square meter of any continent.
- Technological Improvements: Advances in photovoltaic (PV) technology, coupled with a significant reduction in installation costs (75% lower in 2024-25 compared to 2010-11), have boosted adoption rates.
- Storage Integration: The rapid uptake of home batteries (over 57,000 units in 2023) and utility-scale storage solutions has increased the efficiency of capturing and using solar energy.
Over 4.3 million homes and businesses in Australia have installed solar panels, showcasing the country’s commitment to renewable energy [39].
Yield from Solar Energy in Australia
In Australia, the “yield” in cents per kilowatt-hour (kWh) largely depends on whether you are selling excess energy to the Grid (Feed-in Tariff) or saving costs by using it yourself (self-consumption).
- 1.
-
Feed-in Tariffs (Selling to the Grid) in Australia: As of 2026, most residential solar owners receive between 3 and 10 cents per kWh for the energy they export to the Grid. However, these rates have significantly declined as more solar energy feeds into the Grid:
- -
- New South Wales: 5–8¢/kWh
- -
- Victoria: 3–6¢/kWh
- -
- Queensland: 5–9¢/kWh
- -
- South Australia: 6–10¢/kWh
- -
- Western Australia: 2.5–7¢/kWh
- -
- Northern Territory: Up to 15–18¢/kWh in certain areas [40].
- 2.
- Self-Consumption Yield (Savings Value): The most beneficial yield from solar energy comes from avoiding grid electricity purchases. By using their own solar energy during daylight hours, homeowners can save the full retail price of electricity, National Average Savings: Approximately 25–40 cents per kWh.High-Cost Areas: In regions like South Australia, savings can reach 42–50 cents per kWh during peak times [41].
- 3.
- Generation Cost vs. Value: Over the lifespan of a solar energy system, the cost to produce each kWh is significantly lower than the price paid for grid power:
- -
- Levelized Cost of Solar: For a quality 6.6 kW system in 2026, the cost to produce electricity over its 25-year lifespan is estimated at approximately 4.1 cents per kWh.
- -
- Wholesale Yield: Large-scale utility solar in Australia produces energy at a wholesale cost of roughly 4.5 to 5.5 cents per kWh (or $45 to $55 per MWh) [42].
To maximize financial returns, recommended to shift heavy appliance usage to daylight hours or invest in battery storage to capture excess energy rather than exporting it for the lower 5-cent rate. Instead of exporting electricity for only a few cents, households can use battery storage to keep more of their solar energy and maximize its value [43].
References
- Our Energy Low energy, passive and zero-energy houses. Available online: URL (accessed on 22 October 2026). https://www.our-energy.com/low_energy_passive_and_zero_energy_houses.html.
- Haddadi, A.; Johansen. A.; Value Proposition in Different Types of Buildings- Characteristics and Means, Journal of Modern Project Management, Volume, 3, 2025. Available online: URL (accessed on 22 October 2026) https://www.journalmodernpm.com/index.php/jmpm/article/view/412.
- James, M.; and Bill, J.; Passive house in different climates: the path to net zero. Routledge, 2016, pp 2008.
- Hastings, R. and Wall, M.; Sustainable Solar Housing, Volume 2- Exemplary Buildings and Technologies, Earthscan, Oxford.
- H4 Living, Available online: URL (accessed on 22 October 2026). https://h4living.com.au/high-performance-homes/passive-house?gclid=Cj0KCQjw6PD3BRDPARIsAN8pHuEV-qkEpIeY6fwOXDpSqhi3nBW8614ulsRddDGri93koeAnvfm5AmsaAsSiEALw_wcB.
- Schnieders, J., Feist, W., Rongen, L, Passive Houses for different climate zones, Energy and Buildings, 2025, Volume 105, 71-87, ISSN 0378-7788, Available online: URL (accessed on 22 October 2026). (http://www.sciencedirect.com/science/article/pii/S0378778815301481). [CrossRef]
- Janda, K. B., Buildings don’t use energy: people do, Architectural Science Review, 2011, 54:1, 15-22. Available online: URL (accessed on 22 October 2026). https://www.researchgate.net/publication/233501311_Buildings_don’t_use_energy_People_do. [CrossRef]
- Foster, J., Sharpe, T., Poston, A., Morgan, C., Musau, F., 2016, ’Scottish Passive House: Insights into Environmental Conditions in Monitored Passive Houses,’ SUSTAINABILITY, Volume: 8, Issue 5, 412. https://www.mdpi.com/2071-1050/8/5/412.
- Hyde R, Rajapaksha U, Rajapaksha I, Riain MO, Silva F. A design framework for achieving net zero energy commercial buildings. In Proceedings of the 46th Annual Conference of the Architectural Science Association (ASA/ANZAScA), Griffith University, Gold Coast, Australia 2012 Nov (pp. 14-16). https://www.researchgate.net/publication/273689771_A_Design_Framework_for_Achieving_Net_Zero_Energy_Commercial_Buildings.
- Passive House Association Australia, Educating, promoting, and supporting the delivery of Certified Passivhaus buildings in Australia. Available online: URL (accessed on 22 October 2026). https://www.passivhausassociation.com.au/publications-and-submissions.
- Closing the performance gap: Passive House for schools. Available online: URL (accessed on 22 October 2026). http://renew.org.au/sanctuary-magazine/ideas-advice/closing-the-performance-gap-passive-house-for-schools/.
- Ambrose, M., and Syme, M., (20160, ‘Air tightness of new Australian residential buildings. In the proceedings of International High- Performance Built Environment Conference – A Sustainable Built Environment Conference 2016 Series (SBE16), iHBE 2016 Available online at www.sciencedirect.com ScienceDirect Procedia Engineering 00 (2017) 000–000.
- CSIRO Annual Report, Available online: URL (accessed on 22 October 2026). https://csiropedia.csiro.au/csiro-annual-report-2013-14/.
- Kroll, D., Breen Lovett, S., Jimenez-bescos, C., Chisnall, P.M., & Aitchison, M.H. Passive house vs. passive design: sociotechnical issues in a practice-based design research project for a low-energy house. Architectural Science Review, 2020. Volume,63, 361 - 371. https://www.tandfonline.com/doi/abs/10.1080/00038628.2019.1697924.
- Greymane, J. & Adams, D.; Passivhaus (Passive House) in Australian Climates, 2019. https://airah.org.au/Common/Uploaded%20files/Archive/Ecolibrium/2019/05-19-Eco-technical-paper.pdf.
- Clean Energy Council. Rooftop solar and storage report: July—December. Available online: URL (accessed on 22 October 2026). https://cleanenergycouncil.org.au/news-resources/rooftop-solar-and-storage-report-july-to-dec-2025.
- BOM (2019) Annual and monthly heating and cooling degree days. Available online: URL (accessed on 22 October 2026). http://www.bom.gov.au/climate/map/heating-cooling-degree-days/documentation.shtml.
- Ambrose, M., Syme, M. Air tightness of new Australian residential buildings, In the proceedings of the International High- Performance Built Environment Conference – A Sustainable Built Environment Conference 2016 Series (SBE16), iHBE 2016 Available online at www.sciencedirect.com ScienceDirect Procedia Engineering 00 (2017) 000–000. https://www.sciencedirect.com/journal/procedia-engineering/vol/180/suppl/C.
- BASIX (2012), ‘BASIX Stringency Review The Impact of decreased BASIX caps in attached and multi unit housing,’ Available online https://www.basix.nsw.gov.au/iframe/images/4050pdfs/EfficiencyAssessments_Part1.pdf.
- BASIX, (2017), Thermal Comfort Climate Zones (1 July 2017) Available online https://basix.nsw.gov.au/iframe/images/4050pdfs/BASIX_thermal_comfort_caps.pdf.
- Hyde, R.A., Climate Responsive Design, Earthscan, London, 2000. Pp. 241. https://www.taylorfrancis.com/books/mono/10.4324/9781315024905/climate-responsive-design-peter-woods-richard-hyde.
- Milne, M., Liggett, R., & Al-Shaali, R. (2007, July). Climate consultant 3.0: A tool for visualizing building energy implications of climates. In proceedings of the Solar Conference (Vol. 1, p. 466). AMERICAN SOLAR ENERGY SOCIETY; AMERICAN INSTITUTE OF ARCHITECTS. https://energy-design-tools.sbse.org/papers/ASES07-CC.pdf.
- Lomas, K. J., & Porritt, S. M. Overheating in buildings: lessons from research. Building Research & Information, 2017, 45(1-2), 1-18. https://www.tandfonline.com/doi/pdf/10.1080/09613218.2017.1256136.
- Liu, C., & Coley, D. Overheating risk of UK dwellings under a changing climate. Energy Procedia, 2015, 78, 2796-2801. https://www.sciencedirect.com/science/article/pii/S1876610215023607.
- Nicol , F.J., J Hacker, J., Brian Spires, B. and Davies, H. Suggestion for new approach to overheating diagnostic , Building Research & Information, 2009, 37:4, 348-357. https://www.tandfonline.com/doi/pdf/10.1080/09613210902904981. [CrossRef]
- Ren, Z., & Chen, D. Estimation of air infiltration for Australian housing energy analysis. Journal of Building Physics 2015.Volume, 39(1), 69-96. https://journals.sagepub.com/doi/abs/10.1177/1744259114554970.
- Fisk, W. J. How home ventilation rates affect health: A literature review. Indoor air 2018, Volume 28(4), 473-487. https://escholarship.org/content/qt2qm0d7rx/qt2qm0d7rx.pdf.
- National Construction Code. Available online: URL (accessed on 22 October 2026). https://ncc.abcb.gov.au.
- Sundell, J., Levin, H. NAzaroff, W.W., Cain, W.S, Fisk, W.J., Grimsrud, D.T., Persily, A.K., Pickering, A.C., Samet, J.M., Spengler, J.D., Taylor, S.T., Weschler, C.L.Li,Y, Ventilation rates and health: multidisciplinary review of the scientific literature, Indoor Air, 2010. [CrossRef]
- Sharpe, R. A., Thornton, C. R., Nikolaou, V., & Osborne, N. J. (2015). Higher energy efficient homes are associated with increased risk of doctor diagnosed asthma in a UK subpopulation. Environment international, 75, 234-244. https://journals.sagepub.com/doi/abs/10.1177/1744259114554970.
- Torcellini, P., Pless, S., Deru, M., & Crawley, D. (2006). Zero energy buildings: a critical look at the definition (No. NREL/CP-550-39833). National Renewable Energy Laboratory (NREL), Golden, CO. https://logisticslighting. com/content/Resources/Library-Reference%20Documents/Net%20Zero%20Definition.PDF.
- D’Agostino, D., & Mazzarella, L. (2019). What is a Nearly zero energy building? Overview, implementation and comparison of definitions. Journal of Building Engineering, 21, 200-212. https://www.sciencedirect.com/science/article/abs/pii/S2352710218306053.
- Hyde, R., Rajapaksha, U., Rajapaksha, I., Riain, M. O., & Silva, F. (2012, November). A design framework for achieving net zero energy commercial buildings. In Proceedings of the 46th Annual Conference of the Architectural Science Association (ASA/ANZAScA), Griffith University, Gold Coast, Australia (pp. 14-16). https://www.researchgate.net/publication/273689771_A_Design_Framework_for_Achieving_Net_Zero_Energy_Commercial_Buildings.
- National Greenhouse and Energy Reporting Scheme. Available online: URL (accessed on 22 October 2026). https://cer.gov.au/schemes/national-greenhouse-and-energy-reporting-scheme.
- Balaras, C. A., Dascalaki, E. G., Psarra, I., & Cholewa, T. Primary energy factors for electricity production in Europe. Energies, 2022, Volume 16(1), 93. https://www.mdpi.com/1996-1073/16/1/93.
- Fifth Estate. Passivhaus is affordable and effective, why isn’t it legislated? Available online: URL (accessed on 22 October 2026). https://thefifthestate.com.au/innovation/residential-2/passivhaus-isnt-legislated/.
- Solar Calculator. Solar panel install statistics in Australia. Available online: URL (accessed on 22 October 2026). https://solarcalculator.com.au/blog/solar-energy-facts-and-statistics/.
- Clean Energy Council, Guide To Installing Solar For Households. Available online: URL (accessed on 22 October 2026). https://assets.cleanenergycouncil.org.au/documents/consumers/solar-guide-for-consumers.pdf.
- Gillies, P., & Blazey, P. Feed-in tariffs in Australia: fiscal incentives and regulatory regimes–current developments and policies for the future. International Journal of Private Law, 2010, Volume, 3(3), 317-331. https://papers.ssrn.com/sol3/Delivery.cfm?abstractid=1585104&__cf_chl_tk=c4Y7HMSt6UNIXIi8wgbJ5buBFx33.Mfuu1y.LdZQNhg-1792293283-1.0.1.1-4.dZQDhnb4wibYOm7i7xcRXjDMvMFiEQhhEleCB9pBc.
- Goldsworthy, M. Solar PV self-consumption trends in Australia. Solar Energy Advances, 100119. https://www.sciencedirect.com/science/article/pii/S2667113125000324.
- Australian Bureau of Statistics 2026. Available online: URL (accessed on 22 October 2026). https://www.abs.gov.au/articles/household-solar-electricity-generation-australian-national-accounts.
- Medium. Solar battery vs. feed-in tariffs in Australia (2026): The ultimate showdown for your savings. Available online: URL (accessed on 22 October 2026). https://medium.com/@soham.tantrata/solar-battery-vs-feed-in-tariffs-in-australia-2026-the-ultimate-showdown-for-your-savings-4e2a77e9bb15.
Figure 1.
Degree Day analysis of the heating and cooling loads related to the use of the mechanical ventilation system and with energy recovery (Flux consultants).
Figure 1.
Degree Day analysis of the heating and cooling loads related to the use of the mechanical ventilation system and with energy recovery (Flux consultants).
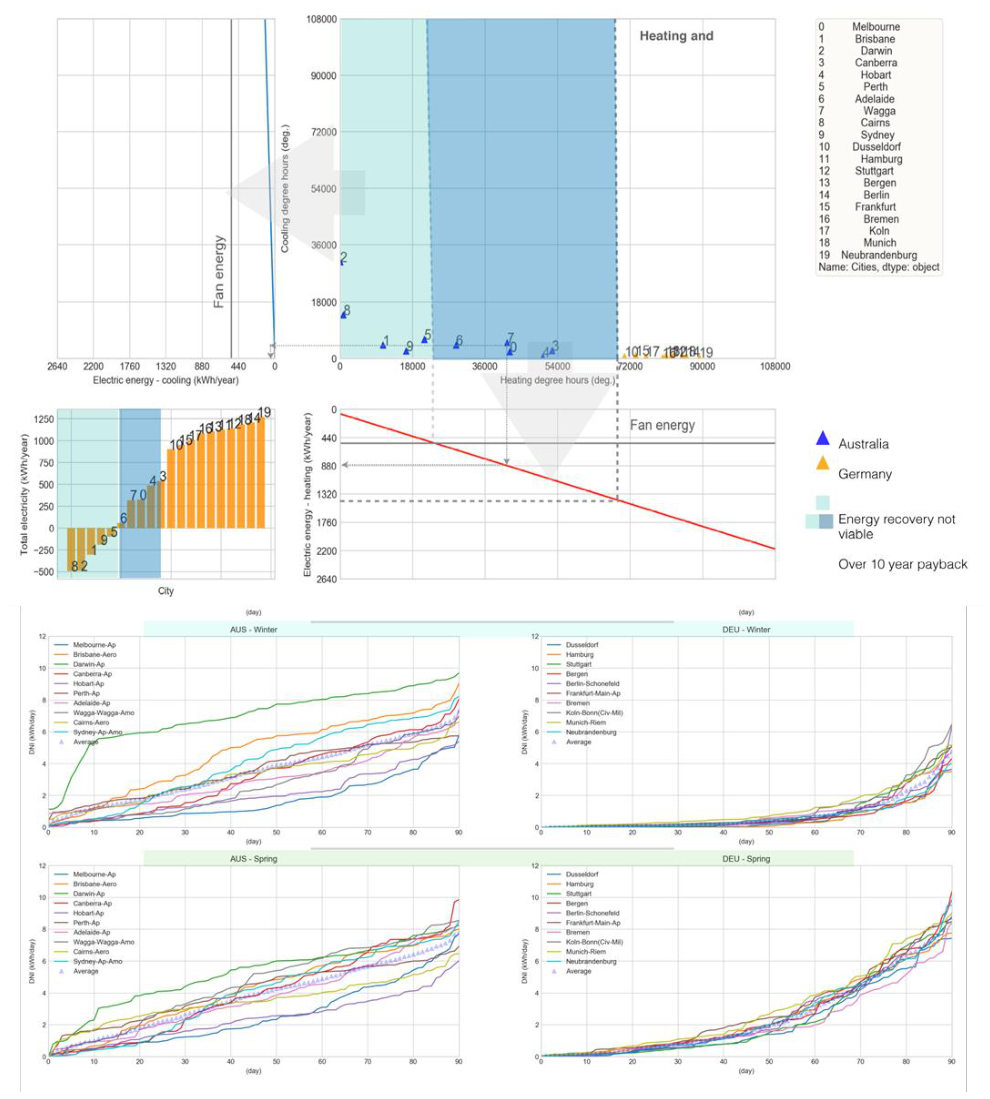
Figure 2.
A seasonal comparison of German cities, which Sydney overlaid for ease of comparison (Flux consultants).
Figure 2.
A seasonal comparison of German cities, which Sydney overlaid for ease of comparison (Flux consultants).
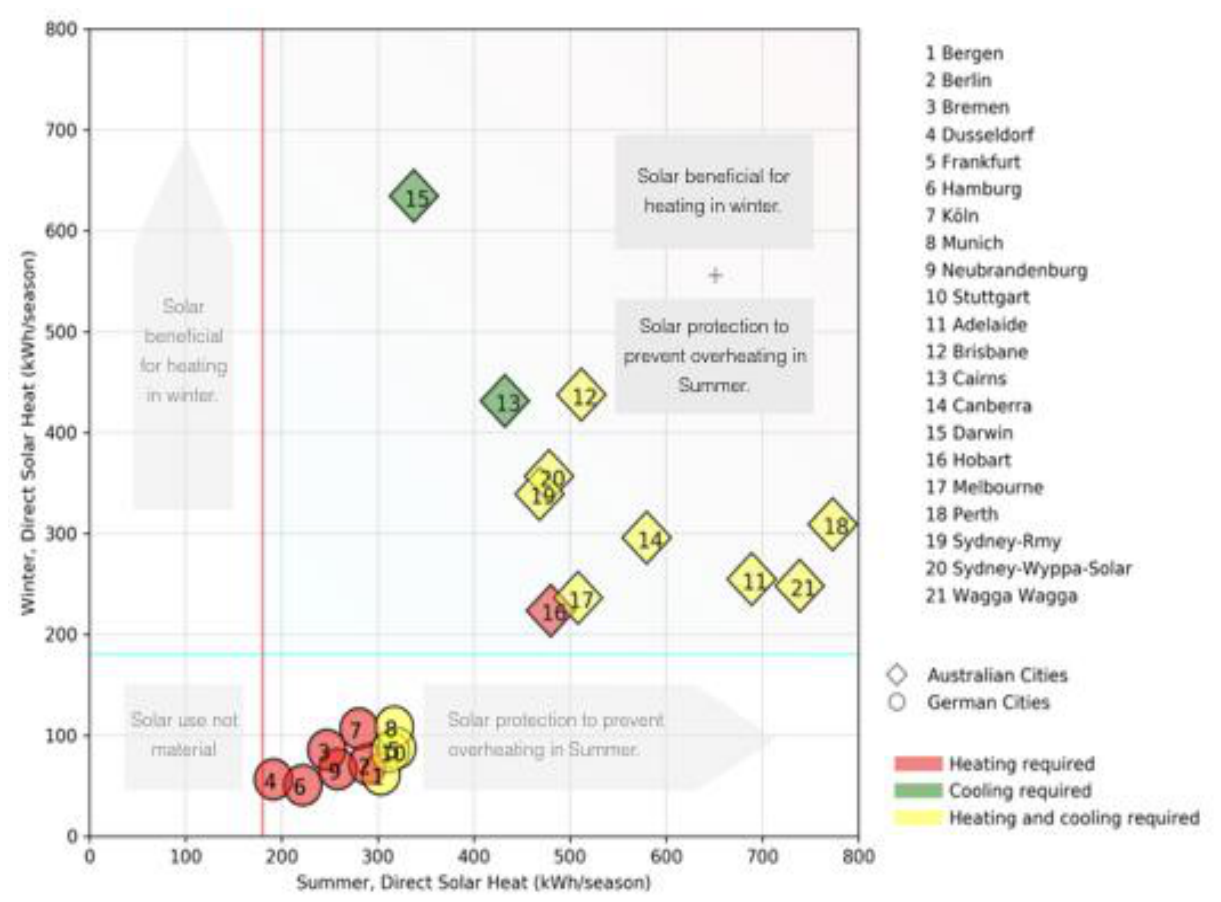
Figure 3.
Psychrometric chart for Sydney using ASHRAE 2004 and PMV model of thermal comfort.
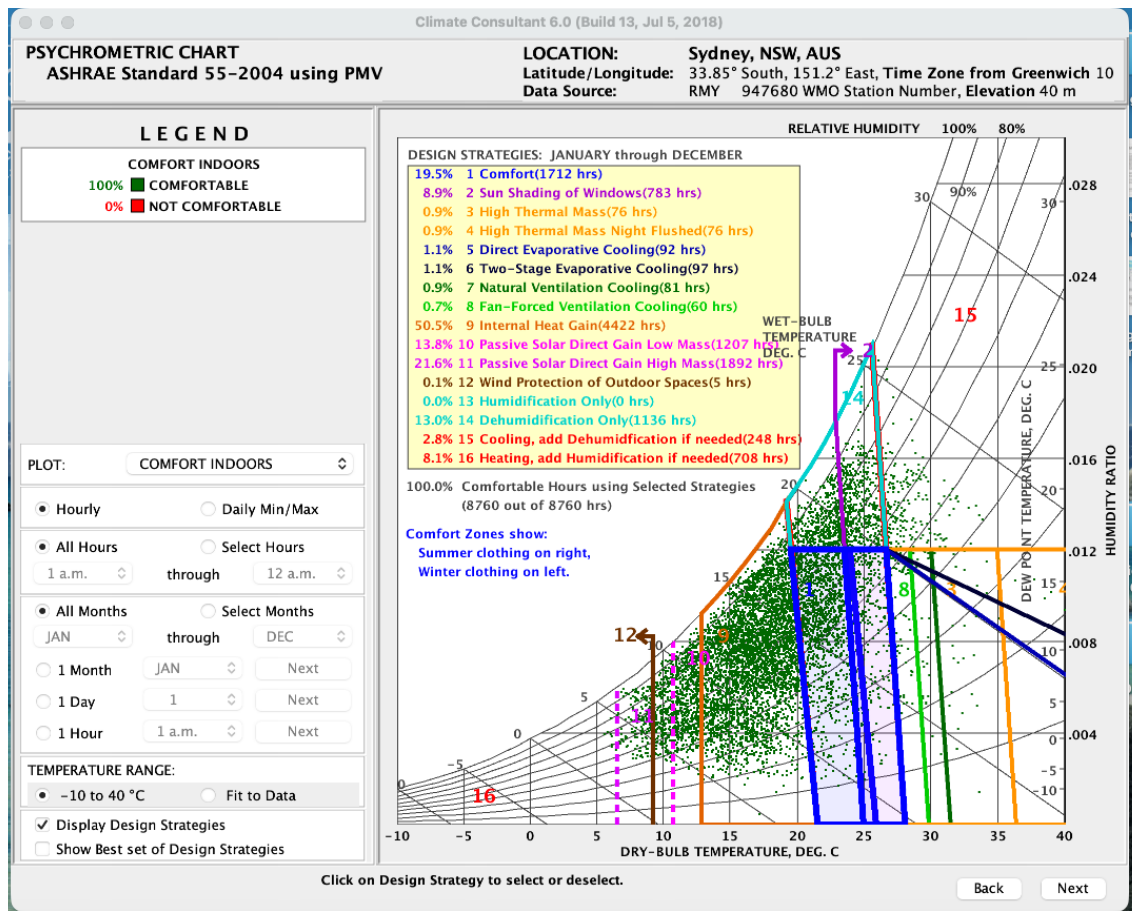
Figure 5.
Psychrometric chart for Sydney using Adaptive Model of thermal comfort.
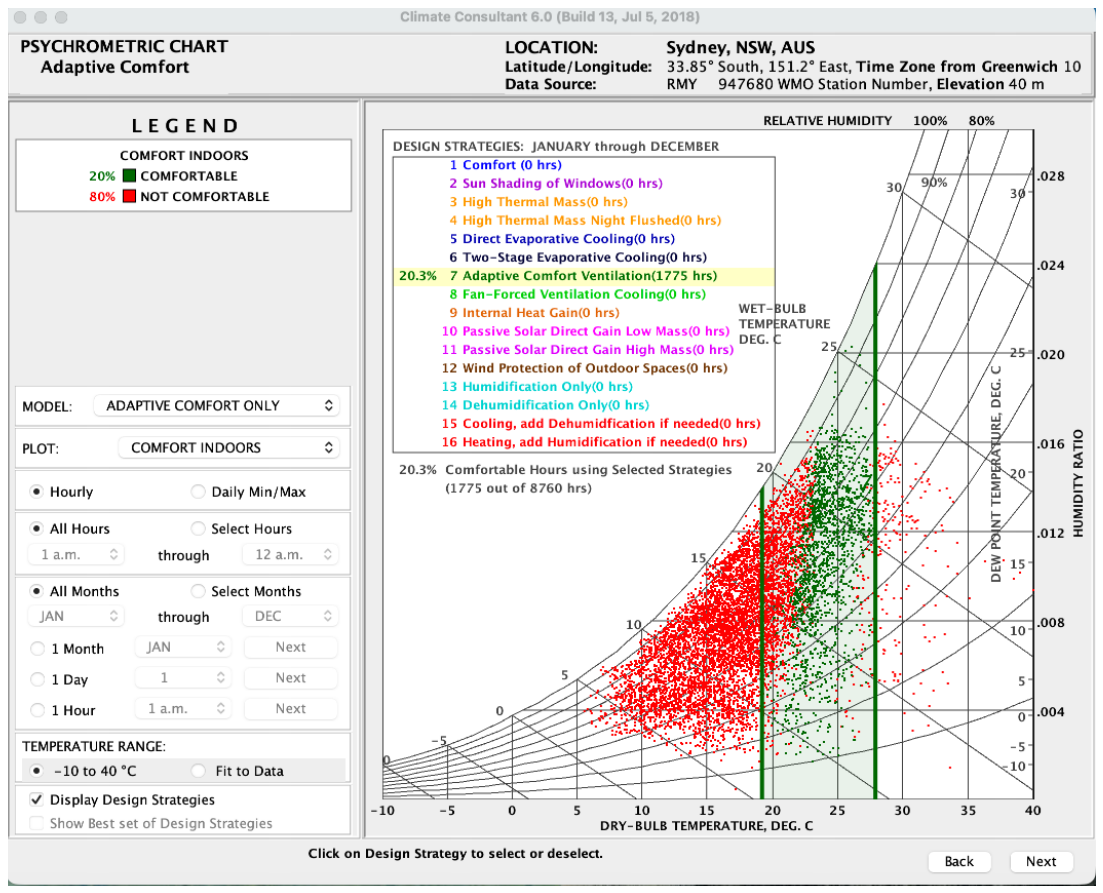
Figure 6.
Importance of ventilation rates from a study by Fisk 2018 [27].
Figure 6.
Importance of ventilation rates from a study by Fisk 2018 [27].
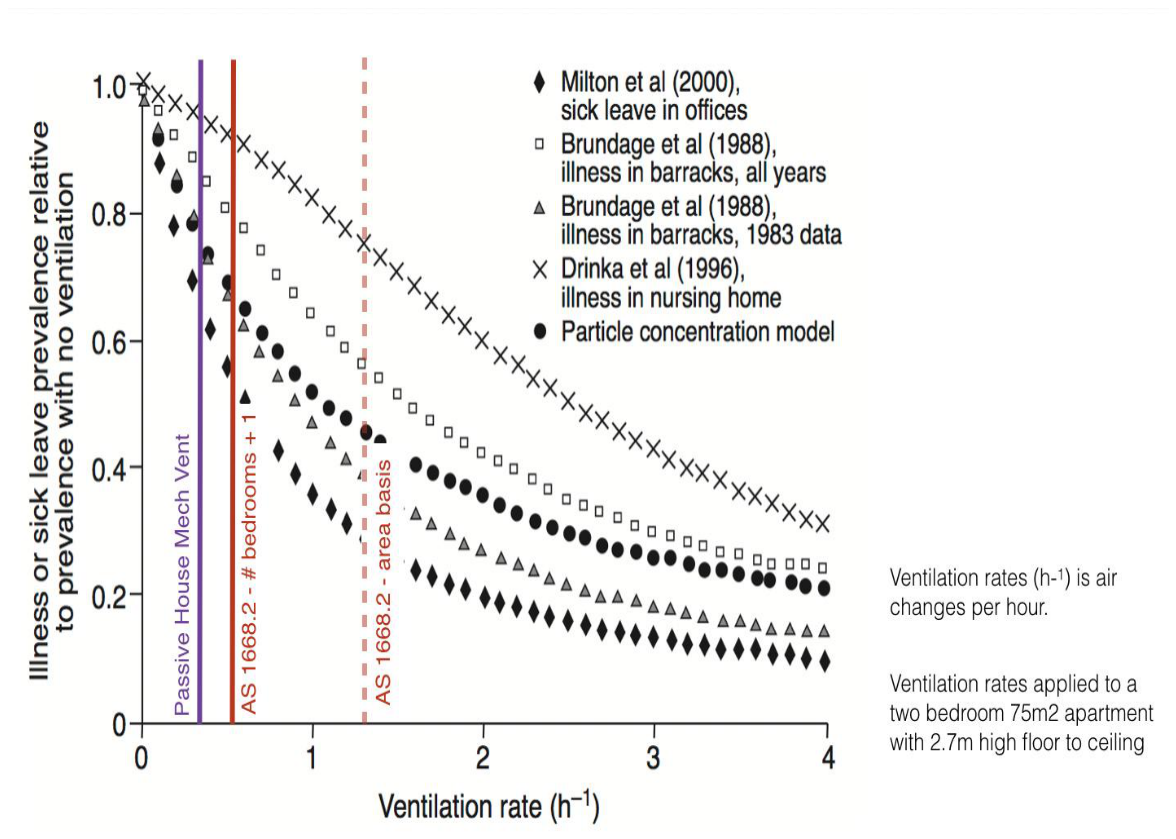
Figure 7.
An analysis of BASIX energy caps for apartments in different locations in New South Wales compared to a global energy cap of 120kWh/m2yr. The locations below the benchmark are for milder locations, and those above are for harsher locations.
Figure 7.
An analysis of BASIX energy caps for apartments in different locations in New South Wales compared to a global energy cap of 120kWh/m2yr. The locations below the benchmark are for milder locations, and those above are for harsher locations.
Disclaimer/Publisher’s Note: The statements, opinions and data contained in all publications are solely those of the individual author(s) and contributor(s) and not of MDPI and/or the editor(s). MDPI and/or the editor(s) disclaim responsibility for any injury to people or property resulting from any ideas, methods, instructions or products referred to in the content. |
© 2026 by the authors. Licensee MDPI, Basel, Switzerland. This article is an open access article distributed under the terms and conditions of the Creative Commons Attribution (CC BY) license (http://creativecommons.org/licenses/by/4.0/).
Copyright: This open access article is published under a Creative Commons CC BY 4.0 license, which permit the free download, distribution, and reuse, provided that the author and preprint are cited in any reuse.