

Submitted:
28 October 2026
Posted:
30 October 2026
You are already at the latest version
Abstract
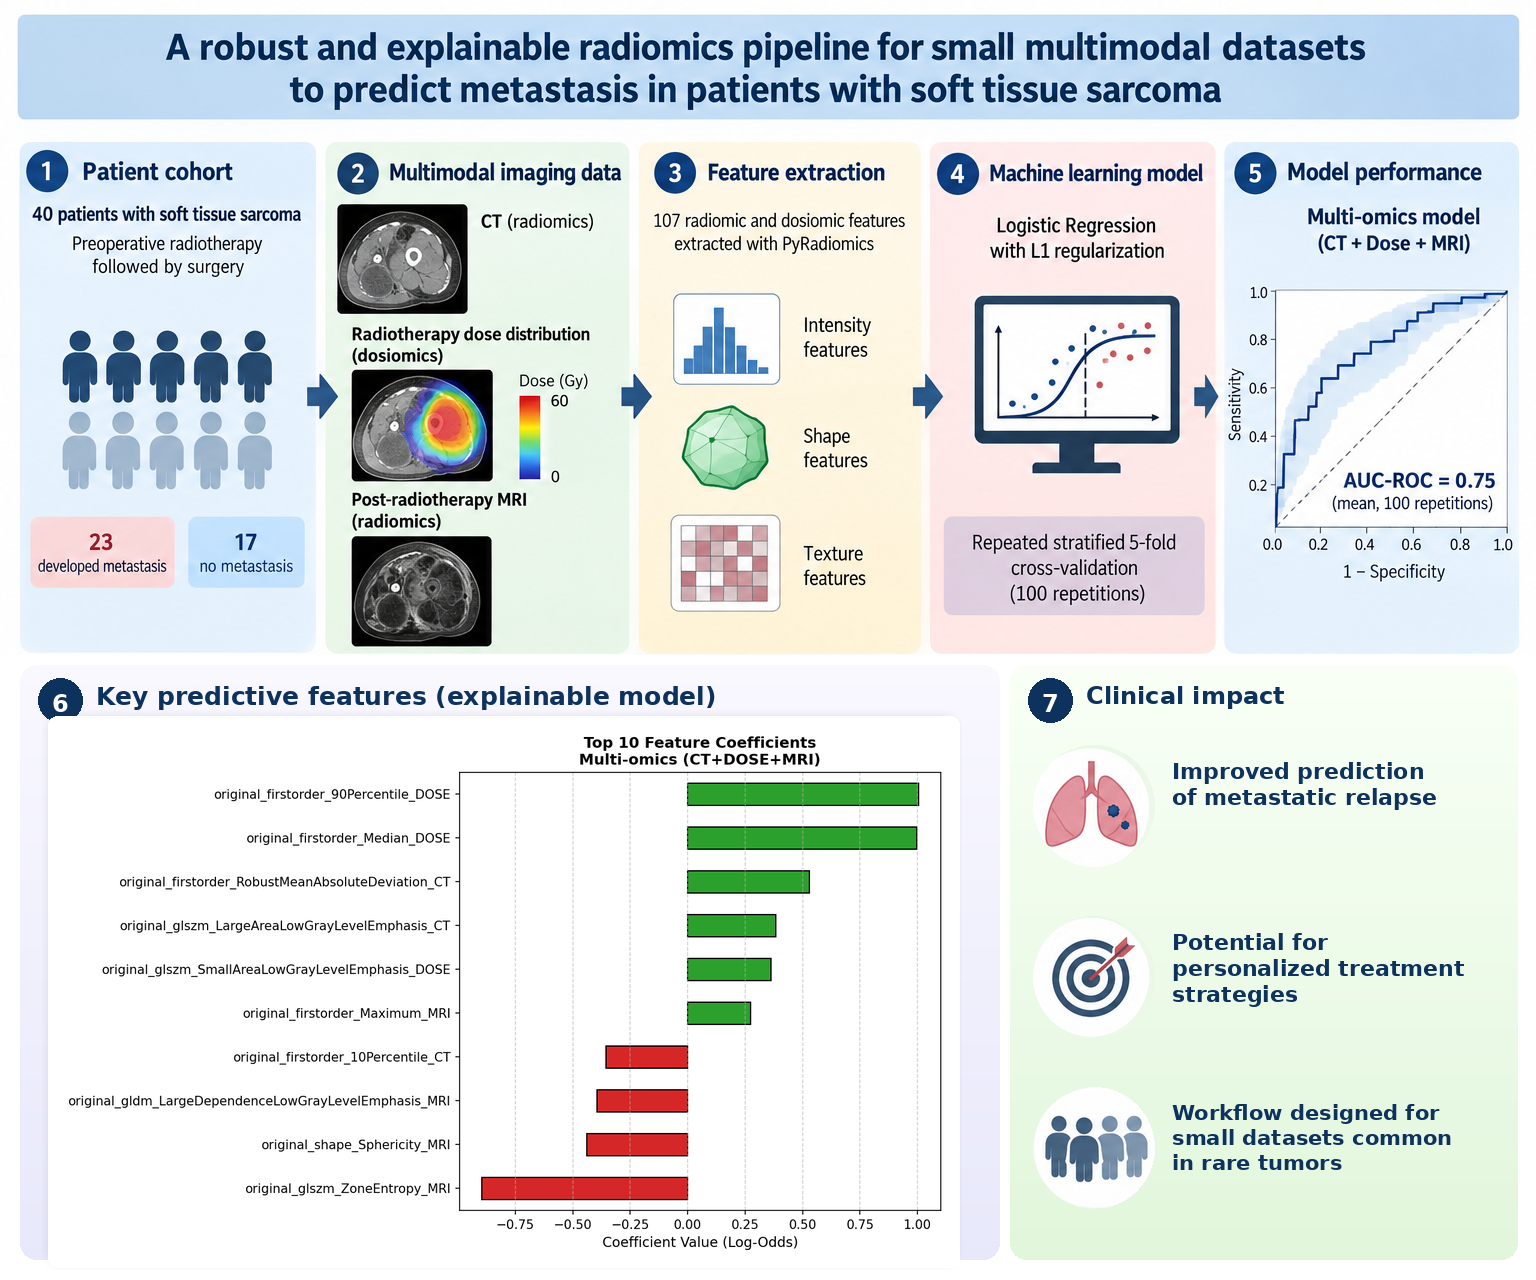
Preoperative radiotherapy and surgery are standard treatments for high-risk soft tissue sarcomas (STS), yet distant metastasis remains a significant clinical challenge. This study aims to develop a robust and interpretable multi-omics predictive model for metastasis, specifically addressing the limitations of small datasets. A retrospective analysis included 40 STS patients (23 with metastasis) treated with preoperative radiotherapy and surgery. Using PyRadiomics, 107 radiomic and dosiomic features were extracted from CT scans, dose distributions, and post-treatment contrast-enhanced T1-weighted MRI. A Logistic Regression classifier with L1 regularization was identified as optimal and rigorously evaluated via Stratified 5-Fold Cross-Validation repeated 100 times. Single-modality models demonstrated limited predictive performance, yielding mean AUC-ROC values of 0.52 for CT, 0.59 for dose distribution, and 0.62 for normalized MRI. Integrating these features into a combined multi-omics signature substantially improved the mean AUC-ROC to 0.75. Furthermore, model explainability was ensured using Log-Odds to identify key predictive features. Combining anatomical, dosiomic, and MRI-derived features significantly enhances the prediction of metastatic relapse in STS patients. This interpretable approach shows strong potential for guiding personalized clinical treatments.
Keywords:
radiomics
; dosiomics
; soft tissue sarcoma
; medical imaging
; precision medicine
; machine learning
; quantitative analysis
; small dataset
; explainable AI
; radiotherapy
1. Introduction
Soft tissue sarcomas are rare cancers that can spread to distant organs even after treatment with radiotherapy and surgery. Predicting which patients are more likely to develop metastases could help clinicians tailor follow-up and treatment, but this is difficult because these tumors are uncommon and available patient datasets are often small. In this study, we combined quantitative information obtained from computed tomography scans, magnetic resonance images, and radiotherapy dose distributions to develop an interpretable prediction model. The combined approach performed better than models based on any single type of data and identified image- and dose-related features that contributed most to the prediction. Although the results need to be confirmed in larger, independent groups of patients, this study shows that integrating different sources of medical information may improve metastasis risk assessment and support the development of more personalized treatment strategies for patients with soft tissue sarcoma.
Artificial intelligence (AI) includes a broad range of technologies designed to enable machines or computers to replicate human cognitive abilities, such as learning, solving problems, and making decisions [1]. The rapid advancement of artificial intelligence technologies, particularly machine learning (ML) and deep learning, is profoundly influencing medical fields that utilize ionizing radiation, ultrasound, and magnetic fields for diagnostic and therapeutic purposes. The field of radiomics has emerged as a significant area within medical image analysis. Radiomics focuses on extracting and analyzing quantitative features from medical images, providing valuable data to enhance clinical decision-making. This synergy between AI and radiomics highlights the transformative potential of these technologies in modern medicine [2]. Traditionally, medical images are visually interpreted by specialists, but this approach overlooks potentially valuable quantitative information embedded in the images. Radiomics aims to exploit this information for tasks like diagnosis, prognosis, and predicting a patient's response to therapy [3].
Radiomic features, which describe properties such as size, shape, intensity distribution, and the relationships between pixels or voxels, can be extracted from a variety of medical imaging modalities, including computed tomography (CT), positron emission tomography (PET), and magnetic resonance imaging (MRI) [4]. A similar methodology known as dosiomics is focused on the extraction of features from radiotherapy dose distributions. Machine learning and deep learning algorithms have proven effective in managing such data due to their ability to make predictions without the need for explicit programming [5]. However, the successful application of these methods often requires large, well-annotated datasets. In radiomics, datasets are often limited in size, which presents significant challenges. Working with small datasets can lead to issues like overfitting, where models learn patterns specific to the training data but fail to generalize to new cases. Additionally, small datasets may not fully represent the variability seen in broader patient populations, thus limiting the model's predictive power and generalizability. In clinical practice, it is also difficult to compile large datasets due to the heterogeneity of data collected over time, which can affect both dataset quality and size [3]. Despite the challenges posed by small datasets, machine learning techniques are still widely applied to analyze radiomic features.
Soft tissue sarcomas (STS) are a rare and heterogeneous group of tumors comprising more than 100 histological subtypes and account for 1% of adult solid malignancies. The extremities are the most common primary site of the STS. Their clinical management is particularly challenging [6,7]. Interdisciplinary management of extremity and superficial trunk soft tissue sarcoma includes a multimodal combination of treatments, such as wide surgical resection, external beam radiation therapy and chemotherapy. Generally accepted guidelines suggest applying pre-operative external beam Radiotherapy (RT), conventionally fractionated in 25 - 28 fractions of 1.8 - 2 Gy to a total dose of 50 - 50.4 Gy in 5 - 6 weeks. Post-operative RT instead provides 60 - 66 Gy delivered in 1.8 - 2 Gy fractions over 6 - 7 weeks [8,9]. These regimens aim to increase the local control probability as compared to conservative surgery alone. Classically, in STS, tumor size, location, depth, and the French Federation of Cancer Centers Sarcoma Group (FNCLCC) histologic grading system (based on tumor differentiation, tumor necrosis, and mitotic activity) are the most important prognostic factors [10]. As well as stage, surgery, and preoperative RT may play crucial roles in achieving personalized treatment [11,12].
This work explores the full image analysis pipeline from radiomic feature extraction to the development of predictive models. This study aimed to identify factors predictive of distant metastasis in patients with soft tissue sarcoma treated with radiotherapy. We specifically address the issues encountered when applying machine learning algorithms to small datasets of radiomic features from various imaging modalities to answer key clinical questions. The overall radiomic approach used in this study can be broken down into four key steps: feature extraction, feature pre-processing, the application of machine learning methods, and the interpretation of results. All feature extraction, analysis, and modeling procedures were implemented using Python. Given the small size of the dataset, particular care was taken to avoid overfitting and ensure that the models would generalize well to other data. In cases where satisfactory model performance was achieved, a ranking system was implemented to identify the most important features contributing to the classification, representing a step toward developing explainable machine learning models in this domain.
2. Materials and Methods
Data from a consecutive cohort of STS patients treated with preoperative RT and surgery from 2011 to 2020 were retrospectively reviewed. This dataset, collected by the Radiotherapy unit of Careggi Hospital, included 40 patients affected by STS, 23 of whom developed distant metastasis at the time of our analysis. All patients received preoperative radiotherapy to a dose of 50 Gy in 25 fractions followed by surgery after 4 weeks. At diagnosis, all patients underwent contrast-enhanced MRI. Prior to surgery, a restaging contrast-enhanced MRI was performed to assess response to treatment. For all patients for whom available, simulation CT, dose distribution and restaging T1 gadolinium-injected MRI were analyzed.

Figure 1.
Timeline of the multimodal clinical management and imaging acquisition pathway for soft tissue sarcoma (STS) patients.
Figure 1.
Timeline of the multimodal clinical management and imaging acquisition pathway for soft tissue sarcoma (STS) patients.
We converted the image file format from DICOM to NIfTI, which is one of the formats accepted by Pyradiomics. Dose distributions are converted to physical units [Gy] by multiplying their voxel values by the Dose Grid Scaling factor, which is available for each subject in the DICOM metadata of the dose distribution. In this way, the dose distributions are expressed in the same scale. Dosiomic features are extracted from the Planning Target Volume (PTV), Gross Tumor Volume (GTV), Clinical Target Volume (CTV) ROIs and from the region of isodose volume corresponding to the 50%, 70%, 90%, 95%, 98% of the maximum value. The extraction is performed by setting the bin count parameter equal to 32 and 50. For the CT scans, features were extracted from the PTV, GTV, and CTV ROIs, using a bin count of 50, as recommended in the literature [13]. For MRI analysis, we considered post-treatment contrast-enhanced T1-weighted images. Radiomic features were extracted from the GTV using multiple bin counts (bc = 16, 25, 32, 50, 64, and 128) to evaluate the impact of intensity discretization on feature stability and reproducibility. Feature extraction was performed on both original and normalized images. The normalization method applied was robust intensity normalization, which helps to mitigate inter-patient variability and scanner-related differences while preserving relevant texture information. Radiomic and dosiomic features were extracted using the Python package PyRadiomics, which enabled the extraction of 107 features. The scheme followed is shown in Figure 2.
To determine the optimal predictive model, an exhaustive combinatorial analysis of the extracted features was performed. Feature sets derived from CT, dose distributions, and MRI were systematically evaluated. Every possible combination of these modalities was independently assessed to ensure a comprehensive exploration of the multi-omics feature space. Model performance was evaluated using 5-fold Cross Validation (5-fold CV) repeated 10 times, a strategy to obtain realistic performance estimates of Artificial Intelligence-based algorithms, across a group of machine learning classifiers, including Random Forest (RF), Logistic Regression (LR), Support Vector Classifier (SVC), and k-Nearest Neighbors (KNN). This approach is described in Figure 3. Detailed performance metrics for all evaluated feature combinations and classifiers are provided in Table S1 (Supplementary Materials).
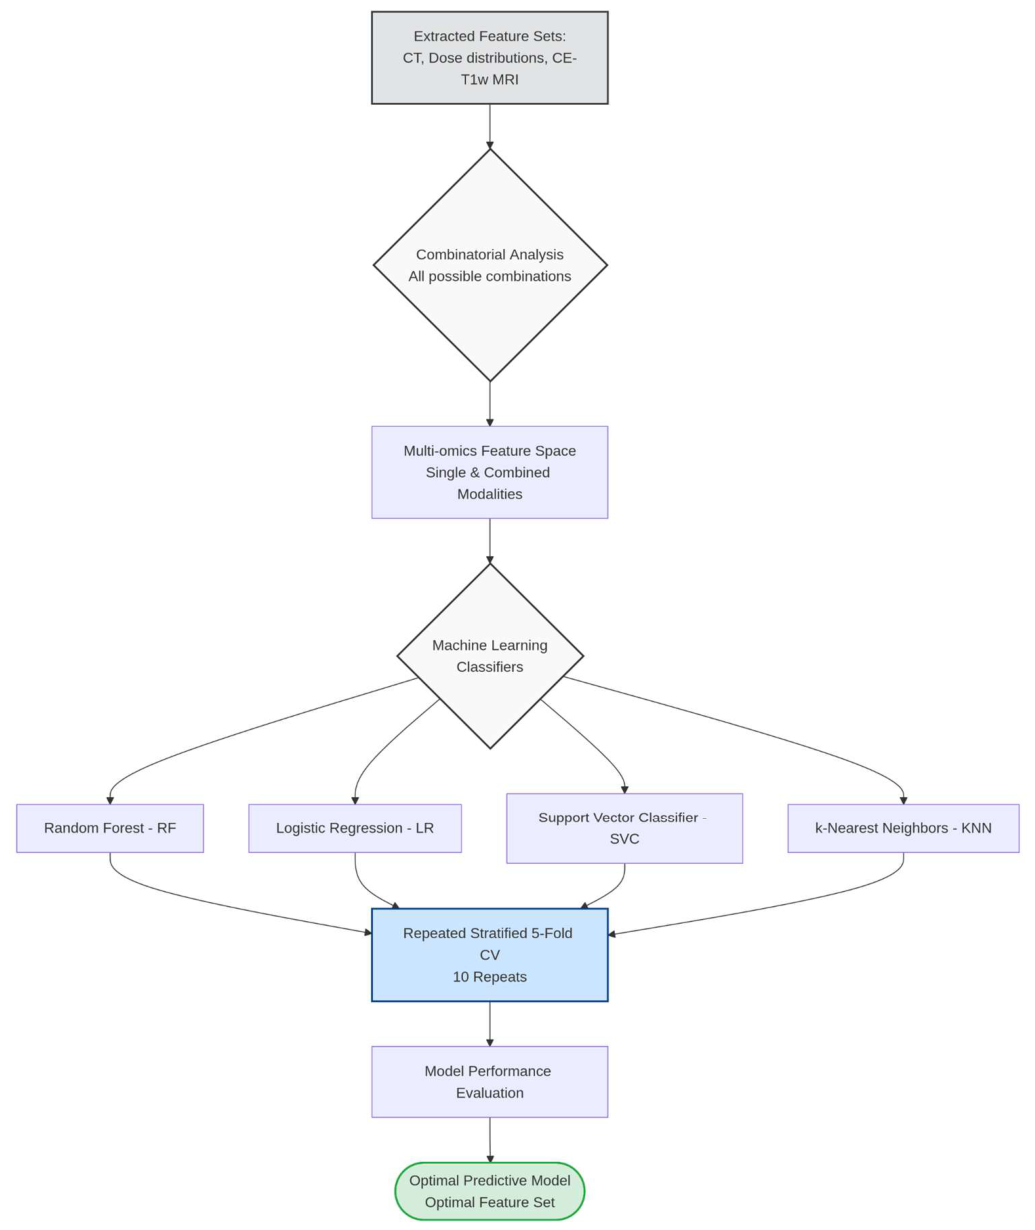
Figure 3.
Workflow of the machine learning pipeline and model selection. Following a combinatorial analysis of the multi-omics feature space, four distinct classifiers (RF, LR, SVC, KNN) were trained and evaluated via 5-fold CV. The optimal predictive model was then selected, and its intrinsic coefficients were extracted to assess feature importance. .
Figure 3.
Workflow of the machine learning pipeline and model selection. Following a combinatorial analysis of the multi-omics feature space, four distinct classifiers (RF, LR, SVC, KNN) were trained and evaluated via 5-fold CV. The optimal predictive model was then selected, and its intrinsic coefficients were extracted to assess feature importance. .
Following this initial selection phase, we proceed with a definitive statistical validation using the optimal feature combinations and the best-performing classifier identified in the previous step, which is described in Figure 4. To certify the final model performances, this chosen classifier—specifically Logistic Regression with L1 (Lasso) regularization—was employed. For this rigorous stress test, the Stratified 5-Fold Cross-Validation was scaled up to 100 repetitions. To accurately quantify the uncertainty associated with the training set sampling, 95% Confidence Intervals (CIs) for all evaluation metrics were rigorously calculated across the 100 iterations utilizing the Student's t-distribution. Finally, feature importance was evaluated by fitting a single definitive model on the entire patient cohort. From this global model, the intrinsic feature weights were extracted as Log-Odds to map the directional impact of each radiomic feature across the study population. Generative artificial intelligence, specifically Google Gemini 1.5 Pro, was used to assist in cleaning and debugging the Python scripts for the data analysis. The authors have rigorously reviewed, tested, and edited all generated code.
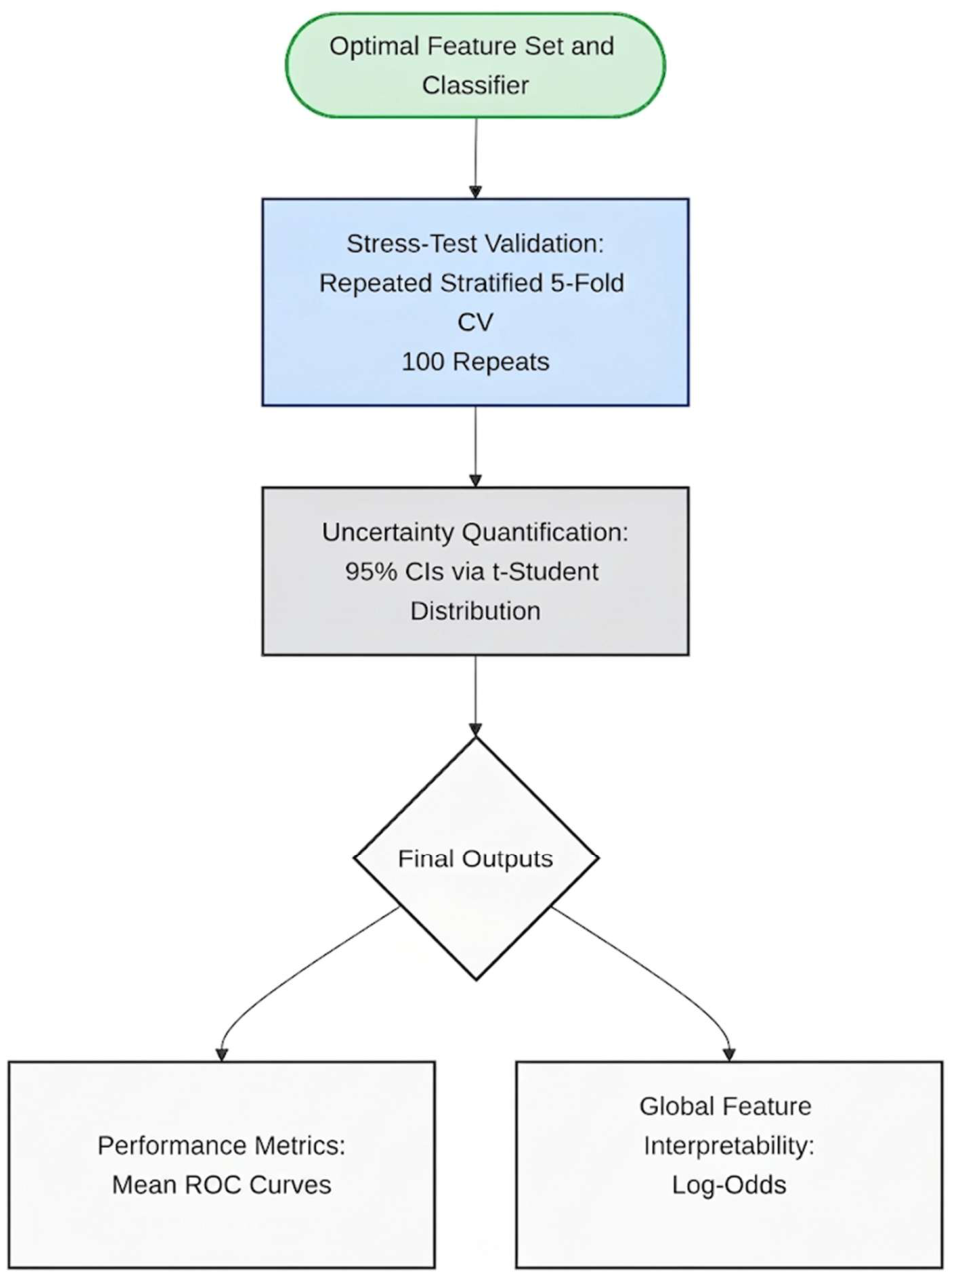
Figure 3.
Workflow of the machine learning pipeline and model selection. Following a combinatorial analysis of the multi-omics feature space, four distinct classifiers (RF, LR, SVC, KNN) were trained and evaluated via 5-fold CV. The optimal predictive model was then selected, and its intrinsic coefficients were extracted to assess feature importance.
Figure 3.
Workflow of the machine learning pipeline and model selection. Following a combinatorial analysis of the multi-omics feature space, four distinct classifiers (RF, LR, SVC, KNN) were trained and evaluated via 5-fold CV. The optimal predictive model was then selected, and its intrinsic coefficients were extracted to assess feature importance.
3. Results
Among the classifiers, the Logistic Regression, optimized with balanced class weights and L1 regularization to handle high dimensionality and prevent overfitting, demonstrated the highest performance in terms of the Area Under the Receiver Operating Characteristic Curve (AUC-ROC). The multi-omics signature that allows to obtain that performance is composed by features extracted from: PTV in CT, isodose volume corresponding to the 70% of the maximum value of dose distribution using bc = 32 and from normalized MRI using bc = 32.
In Table 1, the mean AUC-ROC value computed with the 5-fold CV strategy repeated 100 times is shown. We compare the performance of the best signature against that of its individual components. We observe that the performance obtained using features extracted from CT and dose distribution is comparable to a random classifier, as the AUC-ROC is close to 0,52. However, when considering features extracted from normalized MRI scans, higher performance levels are achieved, specifically with AUC-ROC value of 0.62. Providing the model with features extracted from CT scans, dose distributions, and normalized MRI scans, the AUC-ROC further increases to 0.75. The ROC curves for the individual models and the multi-omics signature are shown in Figure 5. The comprehensive evaluation, confidence intervals, and detailed performance metrics of the optimal predictive model are available in Table S2 (Supplementary Materials).
For the case with the highest performance, the most important features for the model are represented in Figure 6. This figure presents the top 10 coefficients of the logistic regression model trained with combined multi-omics signature for the classification task.
The coefficients indicate the direction and relative strength of association between each radiomic feature and the likelihood of belonging to the positive class. Positive coefficients suggest that higher values of the corresponding feature increase the probability of metastasis, whereas negative coefficients suggest an inverse relationship. It is important to note that these values represent raw model coefficients, not odds ratios, and therefore provide information about linear contributions to the decision boundary rather than multiplicative effects on risk. In this model, features such as original_firstorder_90Percentile_DOSE and original_firstorder_Median_DOSE, which describe the dose distribution, show strong positive contributions. Conversely, features like original_glszm_ZoneEntropy_MRI display negative coefficient, suggesting higher values, which indicates more heterogeneity in the texture patterns, is associated with a reduced likelihood of recurrence. Furthermore, it can be observed from the MRI-derived tumor sphericity that a more spherical lesion is associated with a decreased probability of metastasis. Overall, the figure highlights the most relevant radiomic predictors used by the logistic regression classifier and provides insights into the model’s interpretability by identifying features that drive the decision-making process.
4. Discussion
The present study aimed to evaluate the predictive value of radiomic and dosiomic features in forecasting the development of distant metastases in patients with soft tissue sarcoma treated with preoperative radiotherapy. Our results demonstrate that individual imaging modalities, such as CT, and dose distribution exhibit limited predictive performance, with an AUC-ROC close to random classification. In contrast, features extracted from normalized MRI scans achieved a moderate predictive capability (AUC-ROC = 0.62). Notably, the combination of CT, dosiomic, and MRI-based features yielded a substantial improvement, achieving an AUC-ROC of 0.75, indicating that a multimodal approach significantly enhances model performance.
These findings underscore the importance of integrating complementary information from different imaging sources. While CT images primarily provide anatomical detail, MRI captures soft-tissue contrast and tumor heterogeneity, and dosiomic features represent the spatial distribution of delivered radiation dose. Previous studies have suggested that radiomic features extracted from MRI can serve as valuable biomarkers for treatment response and prognosis in STS [13]. Similarly, dosiomic features have emerged as relevant predictors of treatment outcomes, as they reflect variations in dose deposition within the tumor and surrounding tissues [14]. Our study corroborates these observations and demonstrates that a combined feature set outperforms individual modalities, which is consistent with the concept of radiomics-based data fusion enhancing predictive modeling in oncology.
The impact of intensity discretization, particularly for MRI features, was also evident in our analysis. We tested multiple binning strategies and found that a bin count of 32 produced the most stable and reproducible features for MRI-derived radiomics. This observation aligns with recommendations in the literature suggesting that feature robustness is sensitive to quantization parameters [15]. The improvement achieved through careful normalization and discretization highlights the necessity of harmonization steps to mitigate inter-patient variability and scanner differences.
From a methodological perspective, our study employed a 5-fold CV, which is widely regarded as a rigorous approach for performance estimation, particularly in small datasets [16]. This strategy minimizes the risk of overfitting and ensures that reported performance metrics provide a realistic estimate of model generalizability. Despite these precautions, the small sample size (n = 40) remains a significant limitation. Small datasets are inherently prone to variability and lack representation of the full heterogeneity observed in real-world STS populations. Consequently, external validation on larger, multicentric cohorts is required to confirm the robustness of our findings.
Another important consideration is the interpretability of the predictive models. We utilized logistic regression, a linear and inherently interpretable algorithm, to assess feature importance and provide insights into the relative contribution of each modality. This is particularly relevant in the clinical domain, where transparency and explainability are essential for fostering trust among clinicians and facilitating regulatory approval [14]. The ability to identify which features drive predictions represents a critical step toward developing explainable artificial intelligence models for clinical decision support.
Clinically, the improved performance observed with multimodal integration has relevant implications. Accurate prediction of metastasis risk in STS patients could inform personalized treatment strategies, such as intensified systemic therapy for high-risk patients. Furthermore, incorporating dosiomic information into predictive models may help identify patients who could benefit from ultra-hypofractionated radiotherapy regimens, whose efficacy in terms of local control has been supported by phase II clinical trials and retrospective studies. Such regimens could shorten the duration of locoregional treatment, allowing systemic therapy to be initiated as early as possible.
Nevertheless, several limitations must be acknowledged. In addition to the small sample size, our study is retrospective in nature, which may introduce selection bias. Furthermore, the lack of external validation limits the generalizability of our findings. Emerging deep learning approaches could provide an alternative by automatically learning hierarchical representations from imaging data, although their application in small datasets remains challenging due to the risk of overfitting [17] .
Future research should prioritize the collection of large, harmonized datasets through multi-institutional collaborations to enable robust model training and validation. Standardization of imaging acquisition protocols and preprocessing steps is also essential to ensure reproducibility and feature stability across centers. Additionally, the integration of clinical, genomic, and pathological data with imaging and dose features holds promise for developing comprehensive predictive models that reflect the multifactorial nature of STS progression.
5. Conclusions
In conclusion, our study highlights the potential of combining radiomic and dosiomic features for predicting distant metastasis in STS patients treated with preoperative radiotherapy. While individual imaging modalities offer limited predictive value, multimodal feature integration substantially improves model performance. Despite the encouraging results, validation on larger datasets and continued methodological advancements are necessary before these approaches can be translated into routine clinical practice.
Supplementary Materials
The following supporting information can be downloaded at the website of this paper posted on Preprints.org, Table S1: Model selection supplementary materials; Table S2: Best model supplementary material.
Funding
This work was supported by the Italian National Institute for Nuclear Physics (INFN) through the NEXT and AIM-MIA research projects, funded by the INFN National Scientific Commission V (CSN5). No specific grant numbers were assigned to these projects.
Institutional Review Board Statement
his study was conducted as part of the SPRINT (Sarcoma Preoperative Radiation with simultaneous INTegrated boost) trial. This study was conducted in accordance with the Declaration of Helsinki, and approved by the Local Ethics Committee "Comitato Etico Regione Toscana-Area Vasta Centro" of Azienda Ospedaliero-Universitaria Careggi (protocol code 21665_spe, date of approval 19/07/2022).
Informed Consent Statement
Each patient provided written informed consent to participate in the trial. Clinical and radiological data for the present study was obtained from patients who participated in the SPRINT trial and therefore additional written informed consent for this specific study was waived".
Data Availability Statement
The radiomic and dosiomic feature dataset generated and analyzed during this study is available from the corresponding author upon reasonable request. The underlying patient-level clinical data, computed tomography and magnetic resonance images, and radiotherapy dose distributions are not publicly available because they contain sensitive health information and are subject to privacy, ethical, and institutional restrictions. Furthermore, the small cohort size and the rarity of soft tissue sarcoma may increase the potential risk of patient re-identification. Requests for access to the extracted feature dataset will be evaluated in accordance with applicable data-protection regulations and institutional policies.
Conflicts of Interest
The authors declare no conflicts of interest.
Abbreviations
The following abbreviations are used in this manuscript:
| AI | Artificial intelligence |
| AUC-ROC | Area Under the Receiver Operating Characteristic Curve |
| bc | Three-letter acronym |
| CE-T1w | Contrast-enhanced T1-weighted |
| CI | Confidence Interval |
| CT | Computed tomography |
| CTV | Clinical Target Volume |
| CV | Cross Validation |
| FNCLCC | French Federation of Cancer Centers Sarcoma Group |
| GTV | Gross Tumor Volume |
| KNN | k-Nearest Neighbors |
| LR | Logistic Regression |
| ML | Machine learning |
| MRI | Magnetic resonance imaging |
| PET | Positron emission tomography |
| PTV | Planning Target Volume |
| RF | Random Forest |
| ROI | Region of Interest |
| RT | Radiotherapy |
| STS | Soft tissue sarcomas |
| SVC | Support Vector Classifier |
References
- Xing, L.; Giger, M.L.; Min, J.K. Artificial Intelligence in Medicine: Technical Basis and Clinical Applications; Academic Press, 2020. [Google Scholar]
- Rizzo, S.; Botta, F.; Raimondi, S.; Origgi, D.; Fanciullo, C.; Morganti, A.G.; Bellomi, M. Radiomics: The Facts and the Challenges of Image Analysis. Eur. Radiol. Exp. 2018, 2, 1–8. [Google Scholar] [CrossRef]
- Gillies, R.J.; Kinahan, P.E.; Hricak, H. Radiomics: Images Are More than Pictures, They Are Data. Radiology 2016, 278, 563–577. [Google Scholar] [CrossRef]
- Kumar, V.; Gu, Y.; Basu, S.; Berglund, A.; Eschrich, S.A.; Schabath, M.B.; Forster, K.; Aerts, H.J.; Dekker, A.; Fenstermacher, D.; et al. Radiomics: The Process and the Challenges. Magn. Reson. Imaging 2012, 30, 1234–1248. [Google Scholar] [CrossRef]
- Hrnjica, B.; Danandeh Mehr, A. Optimized Genetic Programming Applications: Emerging Research and Opportunities: Emerging Research and Opportunities; IGI global, 2018. [Google Scholar]
- Igrec, J.; Fuchsjäger, M.H. Imaging of Bone Sarcomas and Soft-Tissue Sarcomas. In Proceedings of the RöFo-Fortschritte auf dem Gebiet der Röntgenstrahlen und der bildgebenden Verfahren; Georg Thieme Verlag KG, 2021; Vol. 193, pp. 1171–1182. [Google Scholar]
- Coindre, J.-M.; Terrier, P.; Guillou, L.; Le Doussal, V.; Collin, F.; Ranchère, D.; Sastre, X.; Vilain, M.-O.; Bonichon, F.; N’Guyen Bui, B. Predictive Value of Grade for Metastasis Development in the Main Histologic Types of Adult Soft Tissue Sarcomas: A Study of 1240 Patients from the French Federation of Cancer Centers Sarcoma Group. Cancer Interdiscip. Int. J. Am. Cancer Soc. 2001, 91, 1914–1926. [Google Scholar]
- Haas, R.L. Preoperative Radiotherapy in Soft Tissue Sarcoma: From General Guidelines to Personalized Medicine. Chin. Clin. Oncol. 2018, 7, 41–41. [Google Scholar] [CrossRef]
- Haas, R.L.; DeLaney, T.F.; O’Sullivan, B.; Keus, R.B.; Le Pechoux, C.; Olmi, P.; Poulsen, J.-P.; Seddon, B.; Wang, D. Radiotherapy for Management of Extremity Soft Tissue Sarcomas: Why, When, and Where? Int. J. Radiat. Oncol. Biol. Phys. 2012, 84, 572–580. [Google Scholar] [CrossRef]
- Sbaraglia, M.; Dei Tos, A.P. The Pathology of Soft Tissue Sarcomas. Radiol. Med. (Torino) 2019, 124, 266–281. [Google Scholar] [CrossRef]
- Soydemir, G.P.; Bahat, Z.; Kandaz, M.; Canyilmaz, E.; Yöney, A. Prognostic Factors and Clinical Course of Extremity Soft-Tissue Sarcomas. J. Cancer Res. Ther. 2020, 16, 903–908. [Google Scholar] [CrossRef]
- Gao, Y.; Ghodrati, V.; Kalbasi, A.; Fu, J.; Ruan, D.; Cao, M.; Wang, C.; Eilber, F.C.; Bernthal, N.; Bukata, S.; et al. Prediction of Soft Tissue Sarcoma Response to Radiotherapy Using Longitudinal Diffusion MRI and a Deep Neural Network with Generative Adversarial Network-Based Data Augmentation. Med. Phys. 2021, 48, 3262–3372. [Google Scholar] [CrossRef]
- Casale, R.; Varriano, G.; Santone, A.; Messina, C.; Casale, C.; Gitto, S.; Sconfienza, L.M.; Bali, M.A.; Brunese, L. Predicting Risk of Metastases and Recurrence in Soft-Tissue Sarcomas via Radiomics and Formal Methods. JAMIA Open 2023. ooad025. [Google Scholar] [CrossRef]
- Avanzo, M.; Trianni, A.; Botta, F.; Talamonti, C.; Stasi, M.; Iori, M. Artificial Intelligence and the Medical Physicist: Welcome to the Machine. Appl. Sci. 2021, 11, 1691. [Google Scholar] [CrossRef]
- Zwanenburg, A.; Vallières, M.; Abdalah, M.A.; Aerts, H.J.; Andrearczyk, V.; Apte, A.; Ashrafinia, S.; Bakas, S.; Beukinga, R.J.; Boellaard, R.; et al. The Image Biomarker Standardization Initiative: Standardized Quantitative Radiomics for High-Throughput Image-Based Phenotyping. Radiology 2020, 295, 328–338. [Google Scholar] [CrossRef]
- Varma, S.; Simon, R. Bias in Error Estimation When Using Cross-Validation for Model Selection. BMC Bioinform. 2006, 7, 91. [Google Scholar] [CrossRef]
- Lao, J.; Chen, Y.; Li, Z.-C.; Li, Q.; Zhang, J.; Liu, J.; Zhai, G. A Deep Learning-Based Radiomics Model for Prediction of Survival in Glioblastoma Multiforme. Sci. Rep. 2017, 7, 10353. [Google Scholar] [CrossRef]
Figure 2.
Flowchart of the radiomic and dosiomic feature extraction pipeline. .
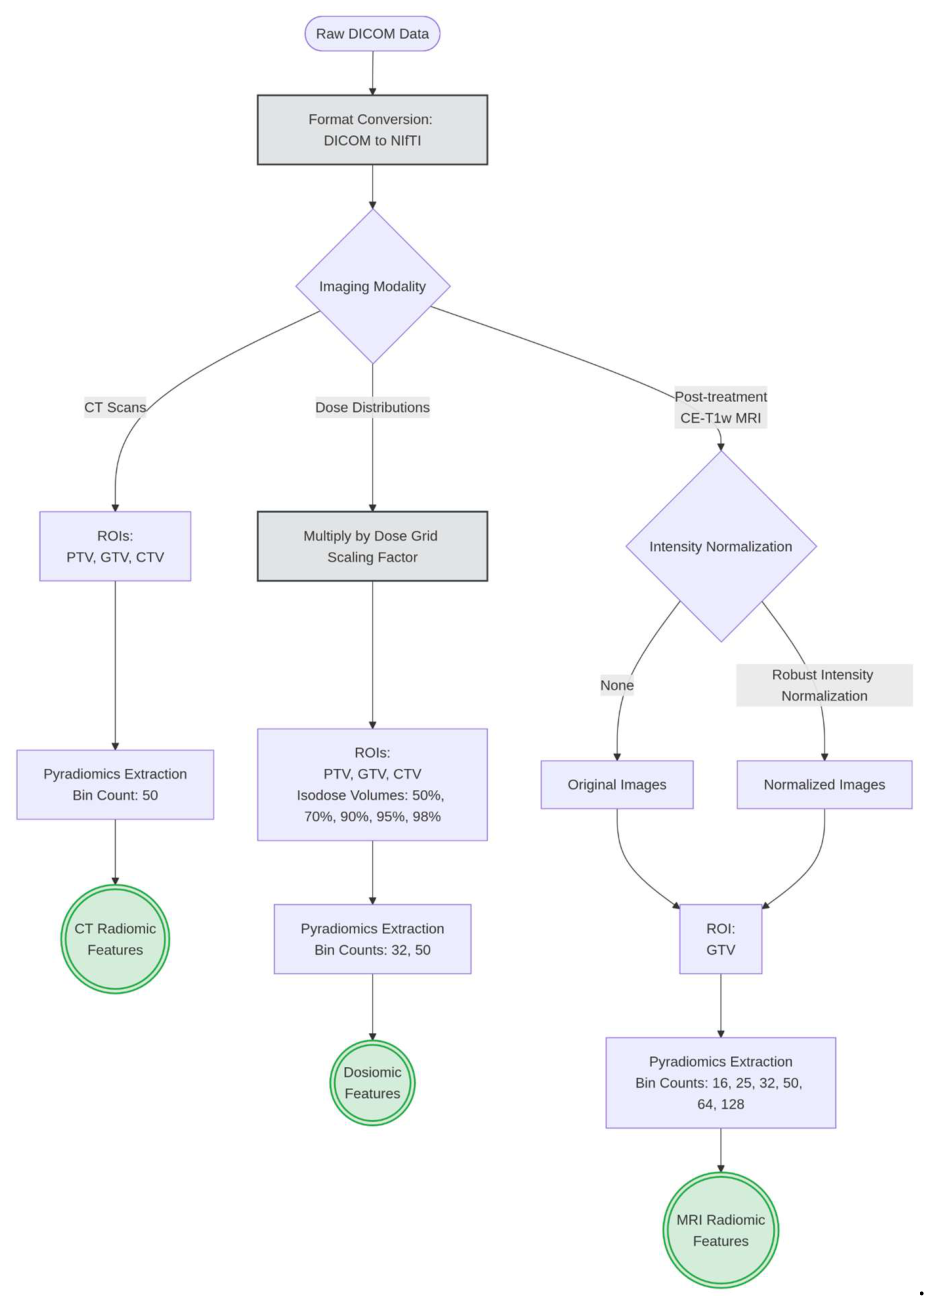
Figure 4.
The optimal feature sets and the best-performing classifier are evaluated through a rigorous stress-test utilizing a Stratified 5-Fold Cross-Validation scaled to 100 repetitions. Model uncertainty is robustly quantified by calculating 95% Confidence Intervals (CIs) via the Student's t-distribution across all iterations. The final outputs aggregate the predictive performance (Mean ROC curves) alongside a comprehensive global feature interpretability analysis Log-Odds. .
Figure 4.
The optimal feature sets and the best-performing classifier are evaluated through a rigorous stress-test utilizing a Stratified 5-Fold Cross-Validation scaled to 100 repetitions. Model uncertainty is robustly quantified by calculating 95% Confidence Intervals (CIs) via the Student's t-distribution across all iterations. The final outputs aggregate the predictive performance (Mean ROC curves) alongside a comprehensive global feature interpretability analysis Log-Odds. .
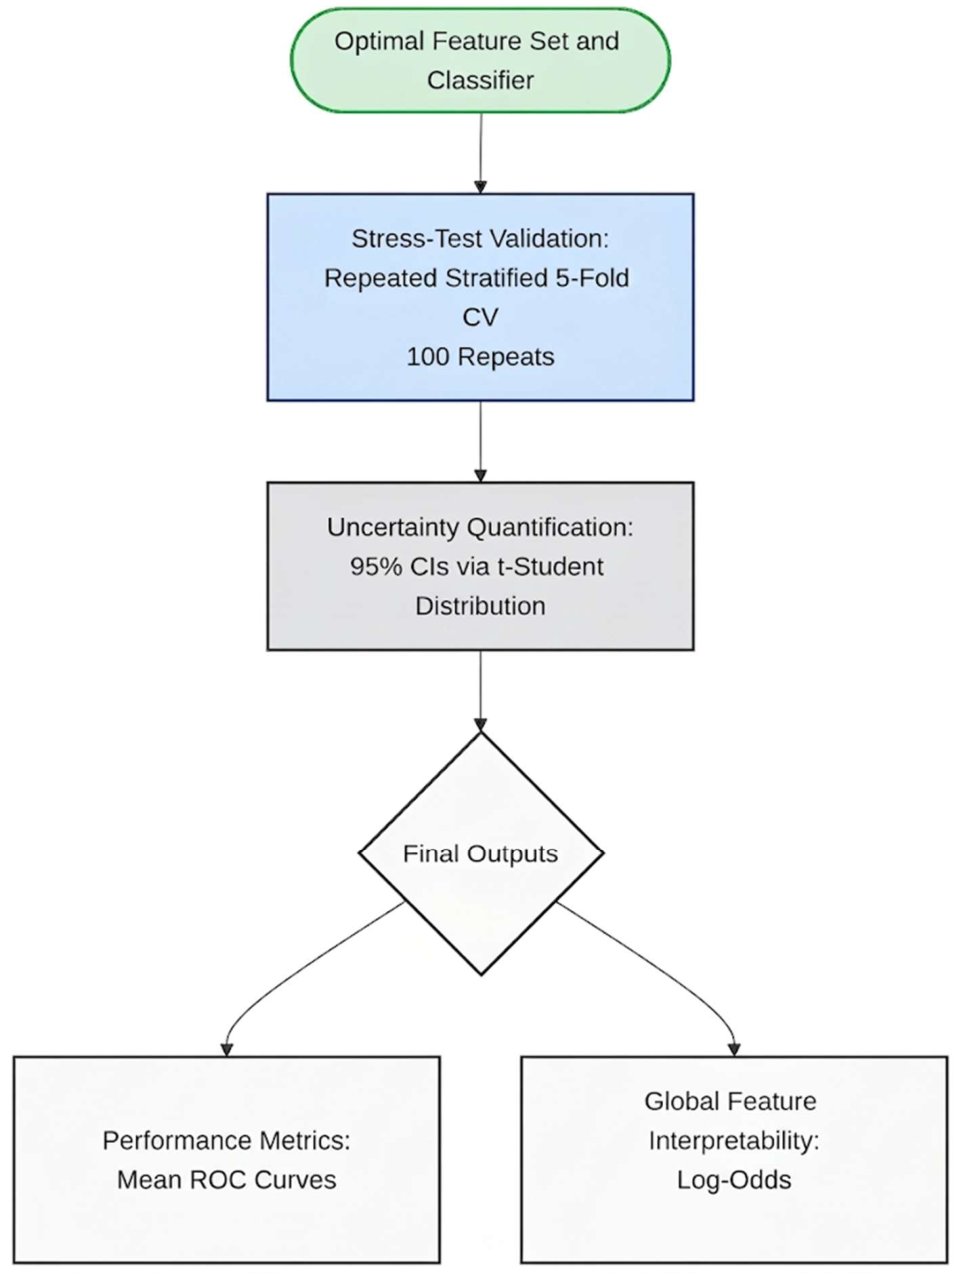
Figure 5.
The plot illustrates the predictive performance of single-omics models (dashed lines) compared to the optimal multi-omics signature (solid red line). The AUC-ROC values for each model are reported in the legend. .
Figure 5.
The plot illustrates the predictive performance of single-omics models (dashed lines) compared to the optimal multi-omics signature (solid red line). The AUC-ROC values for each model are reported in the legend. .
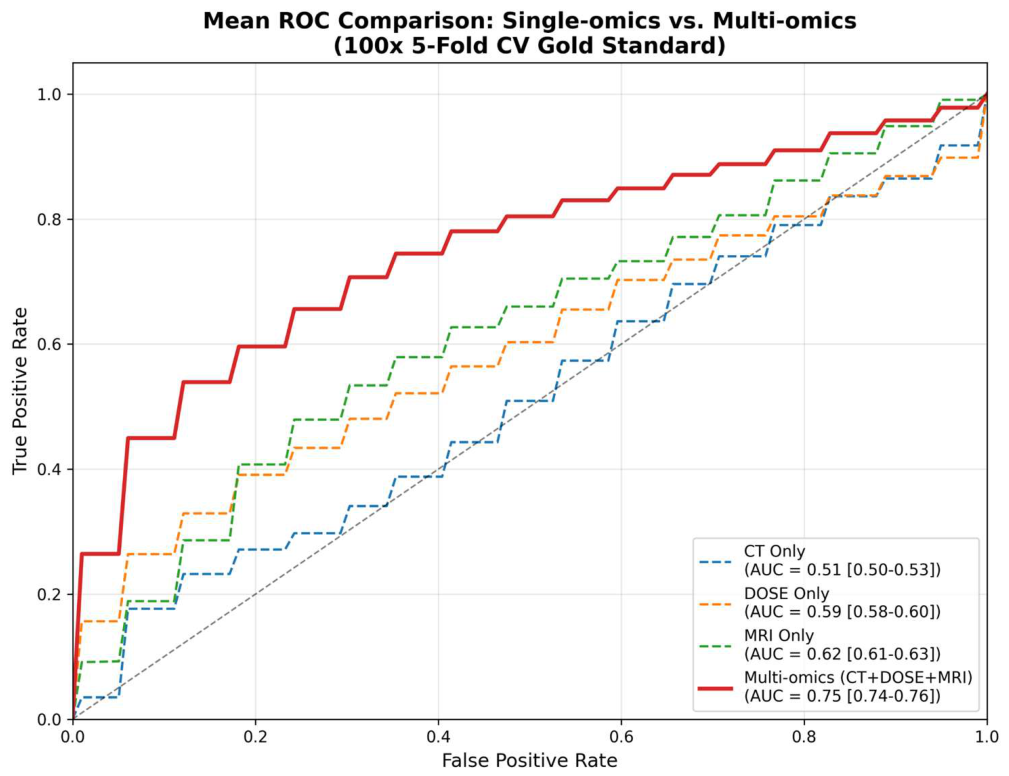
Figure 6.
Top 10 most influential features in the final Logistic Regression model. Bar lengths represent the standardized log-odds coefficients. Green and red bars indicate positive (Class 1) and negative (Class 0) associations with the clinical outcome, respectively.
Figure 6.
Top 10 most influential features in the final Logistic Regression model. Bar lengths represent the standardized log-odds coefficients. Green and red bars indicate positive (Class 1) and negative (Class 0) associations with the clinical outcome, respectively.
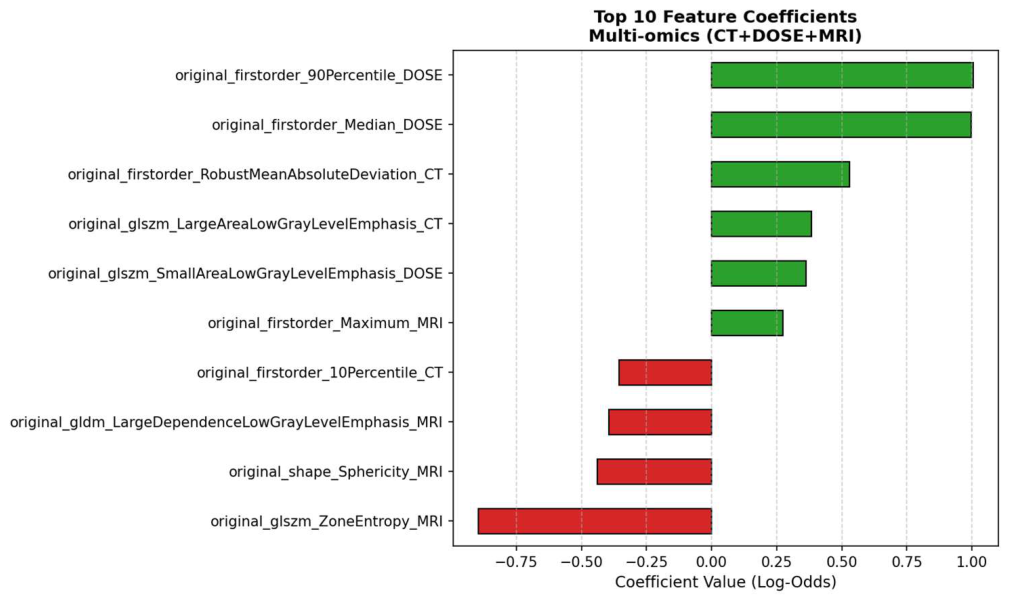

Table 1.
The test AUC-ROC of the single-omics and multi-omics signature obtained using the Logistic Regression classifier with 5-Fold CV strategy is shown. The multi-omics signature in composed by features extracted from CT scans, dose distributions, and normalized MRI scans.
Table 1.
The test AUC-ROC of the single-omics and multi-omics signature obtained using the Logistic Regression classifier with 5-Fold CV strategy is shown. The multi-omics signature in composed by features extracted from CT scans, dose distributions, and normalized MRI scans.
| Feature Combination | Mean Test AUC-ROC | AUC-ROC CI |
| CT | 0.52 | [0.50 - 0.53] |
| Dose distribution | 0.59 | [0.58 - 0.60] |
| MRI normalized | 0.62 | [0.61 - 0.63] |
| Multi-omics signature | 0.75 | [0.74 - 0.76] |
Disclaimer/Publisher’s Note: The statements, opinions and data contained in all publications are solely those of the individual author(s) and contributor(s) and not of MDPI and/or the editor(s). MDPI and/or the editor(s) disclaim responsibility for any injury to people or property resulting from any ideas, methods, instructions or products referred to in the content. |
© 2026 by the authors. Licensee MDPI, Basel, Switzerland. This article is an open access article distributed under the terms and conditions of the Creative Commons Attribution (CC BY) license (http://creativecommons.org/licenses/by/4.0/).
Copyright: This open access article is published under a Creative Commons CC BY 4.0 license, which permit the free download, distribution, and reuse, provided that the author and preprint are cited in any reuse.