

Submitted:
29 October 2026
Posted:
30 October 2026
You are already at the latest version
Abstract
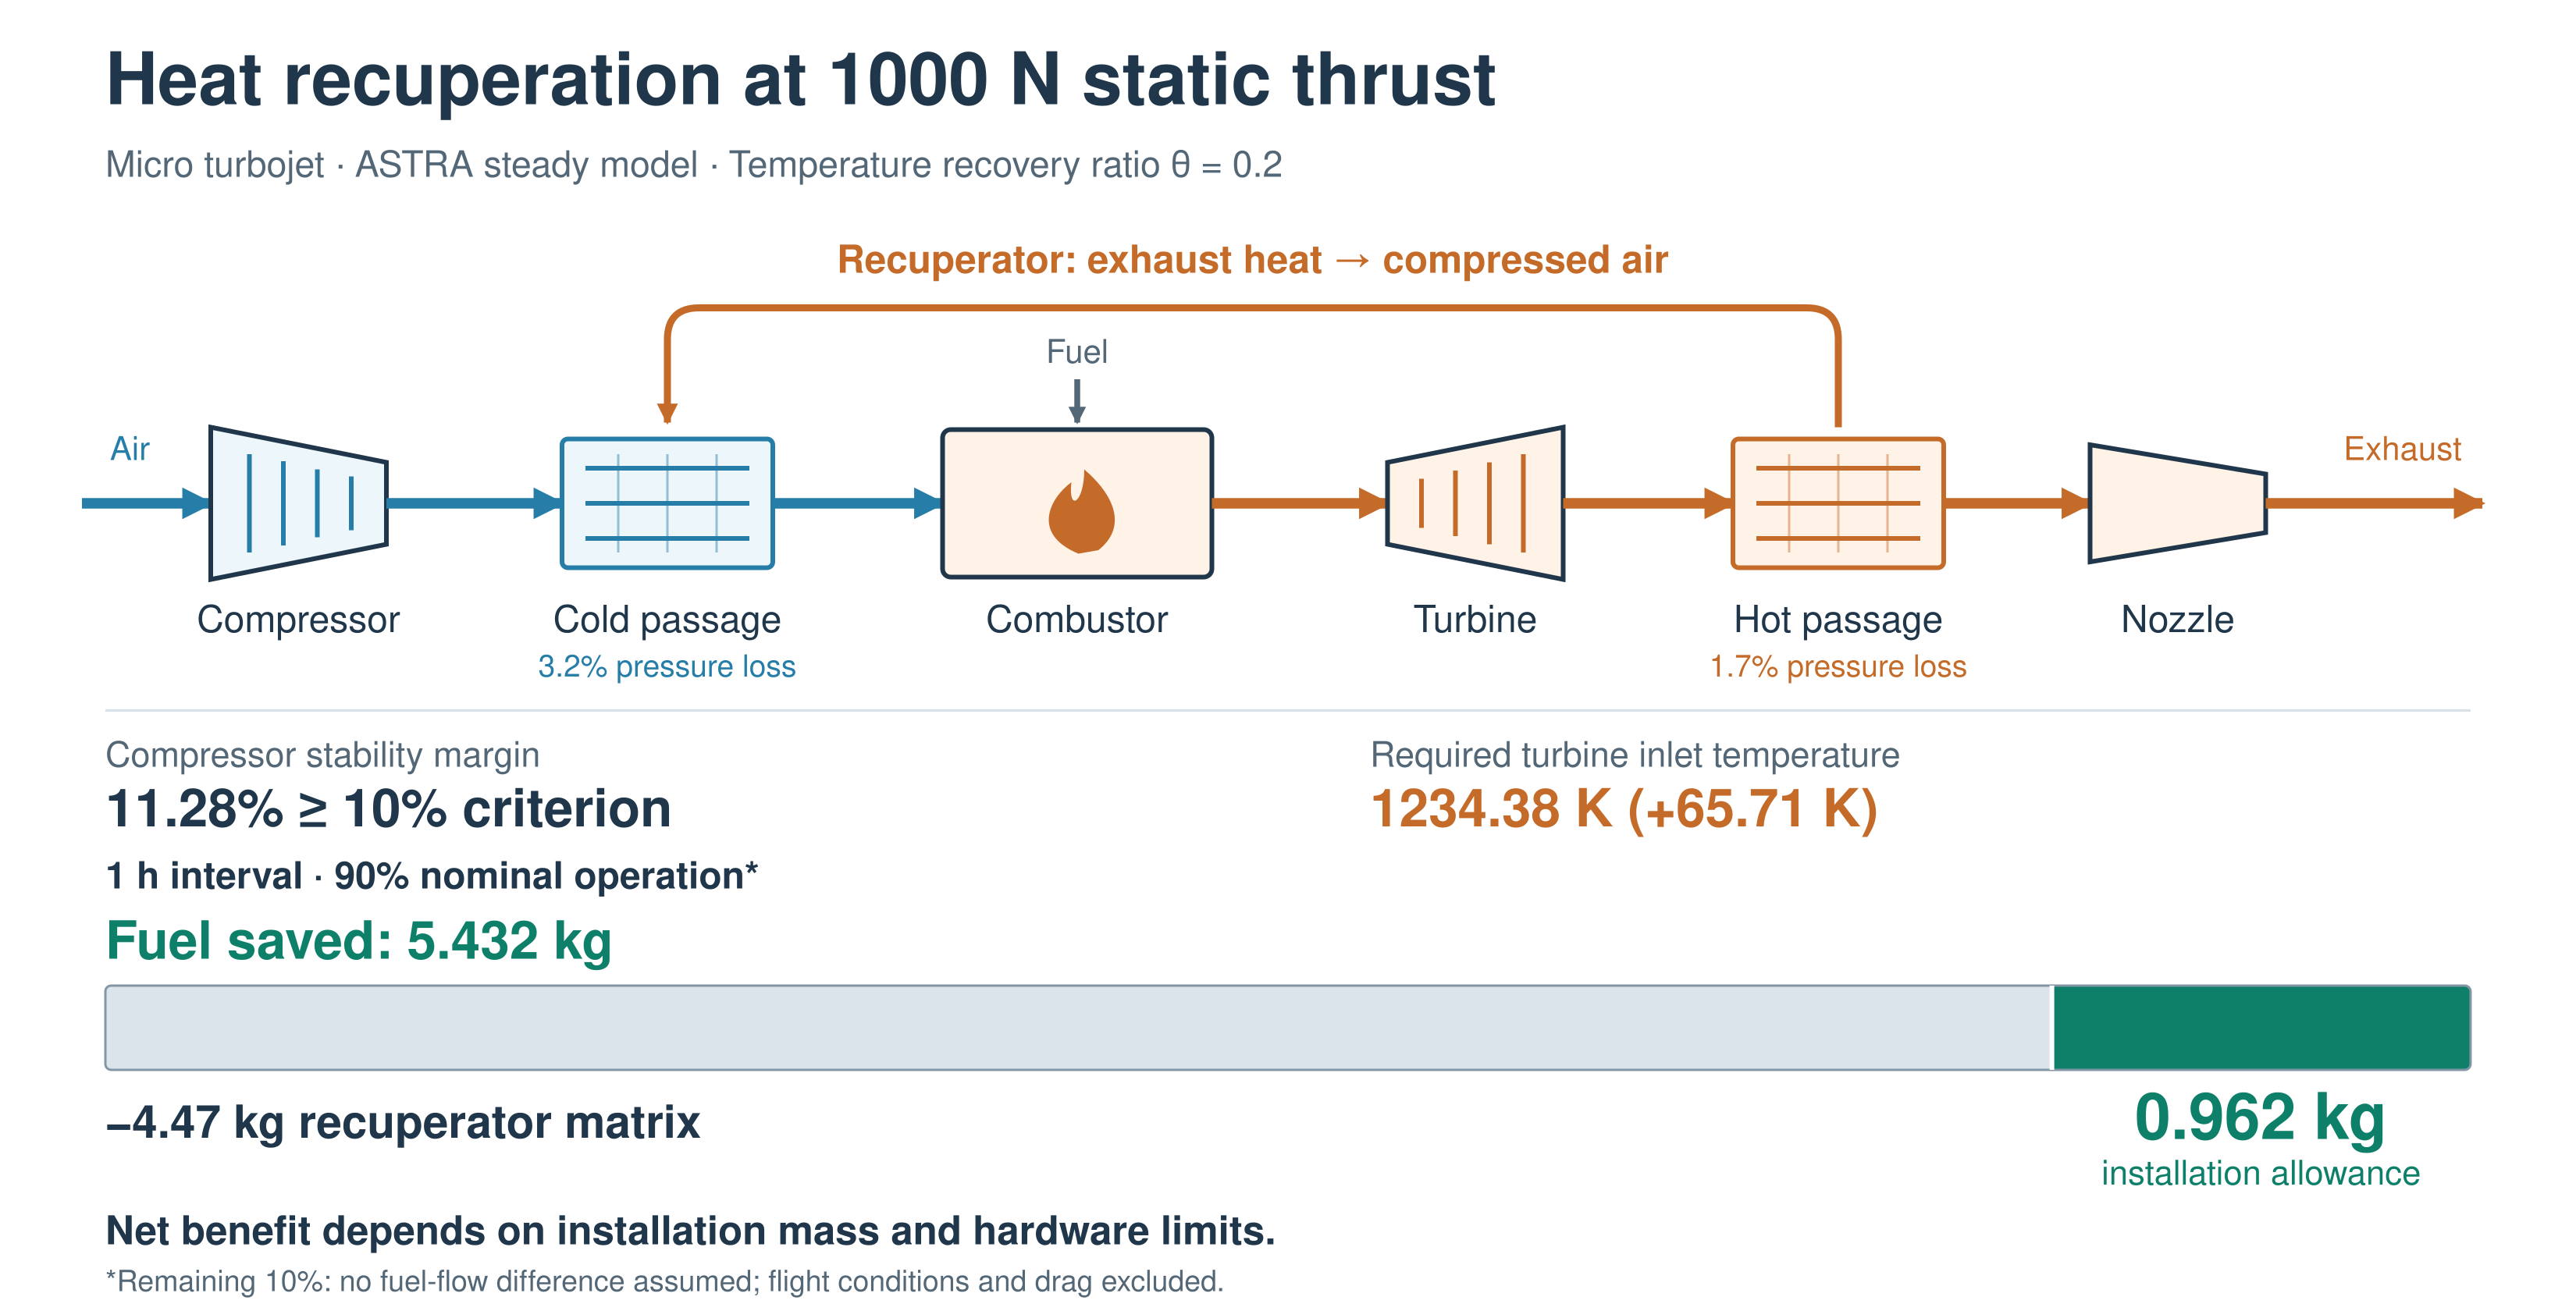
The benefit of exhaust heat recuperation in a micro turbojet depends on the fuel saved at the required thrust and on recuperator mass and pressure losses. A 1000 N engine with a semicircular-channel matrix is analysed in ASTRA at constant static thrust for temperature recovery ratios θ = 0–0.7. Compressor and turbine characteristics are interpolated, scaled and extrapolated during component matching. Original, half and zero pressure-loss cases retain the same matrix mass. With the original losses, the lowest calculated engine-plus-fuel mass for one hour occurs at θ = 0.3, but the compressor stability margin of 5.856% is below the adopted 10% threshold. Among points meeting this thresh-old, θ = 0.2 leaves 1.565 kg for additional installation mass and requires a turbine inlet temperature (TIT) of 1234.38 K, 65.71 K above the reference. For one hour with 90% nominal operation and no fuel-flow difference during the remaining time, the allowance falls to 0.962 kg. Half-loss and ze-ro-loss cases give one-hour allowances of 4.198 and 7.716 kg. These sensitivities define targets for recuperator design; the mass, thermal strength and life of the complete installed assembly remain to be established.
Keywords:
micro turbojet
; recuperator
; constant thrust
; engine matching
; pressure loss
; mass break-even
; compressor stability
1. Introduction
Recuperators can reduce combustor heat addition in low-pressure-ratio gas turbines, but their pressure losses, mass and temperature capability determine whether the cycle benefit is useful [1]–[2]. Compact-recuperator development has long treated these quantities as coupled design variables [3]. Aviation adds a mission-dependent mass penalty: rotorcraft studies explicitly balance fuel economy against recuperator weight [4], [5], while recent work on small unmanned systems demonstrates the continuing relevance of component integration [6]. Results for shaft-power systems cannot be transferred directly to a turbojet, whose exhaust must still provide useful momentum.
For an existing engine, fixing shaft speed and fixing thrust lead to different component operating points. A reduction in fuel flow accompanied by a loss of thrust does not establish a benefit at the required operating condition. This study determines whether fuel savings at 1000 N can offset the mass of a semicircular-channel recuperator while maintaining a compressor stability margin K ≥ 10%. The comparison includes component operating points, heat and shaft-power balances, pressure-loss sensitivity and the time required for fuel savings to offset matrix mass.
A published comparison of nine plate-fin configurations provides the basis for channel selection [7]. The present analysis uses the semicircular channel and examines three pressure-loss cases at constant thrust. It addresses the mass and operating requirements of a recuperated engine, rather than repeating the comparison of channel geometries at fixed shaft speed.
2. Materials and Methods
2.1. Model Data and Calculation Boundary
A steady thermogasdynamic model in the ASTRA computer-aided engineering system represents a 1000 N static micro turbojet with a semicircular-channel recuperator. Three calculation series use the original, half and zero recuperator pressure deficits while retaining the same matrix mass. The exported compressor and turbine characteristics are those used in the engine model. An independent calculation without a recuperator provides a separate 1000 N reference for the same engine class, treated as an analogue of a commercial 1000 N micro turbojet. The results are calculated engine states, not measured commercial-engine performance. ASTRA interpolates and scales both component characteristics and applies ray-based extrapolation outside their tabulated domains. The method applies to both the compressor and the turbine and is described in Section 3.7. Engine operating points beyond the outer exported speed lines are obtained through the same component-matching calculation.

Table 1.
Baseline engine and invariant modelling inputs.
| Quantity | Value | Role |
|---|---|---|
| Static thrust F | 1000 N | Prescribed in every operating point |
| Baseline engine mass me | 10 kg | Excludes added exchanger matrix |
| Baseline fuel flow ṁf,0 | 120.744 kg/h | Reference for fuel and mass savings |
| Baseline air flow / shaft speed | 1.701 kg/s / 67.017 krpm | Matched engine output |
| Baseline compressor pressure ratio | 3.917 | Matched engine output |
| Baseline TIT / compressor efficiency | 1168.67 K / 0.75718 | Thermal and component reference |
| Nozzle exit area / ambient pressure | 0.0074 m² / 101.325 kPa | Fixed geometry; static operation |
| Fuel lower heating value / combustion efficiency | 43,120 kJ/kg / 0.95 | Original workbook inputs |
| Mechanical efficiency / nozzle velocity coefficient | 0.995 / 0.98 | Original workbook inputs |
| Compressor bleed fraction | 0.01 | Removed before cold passage; returned downstream |
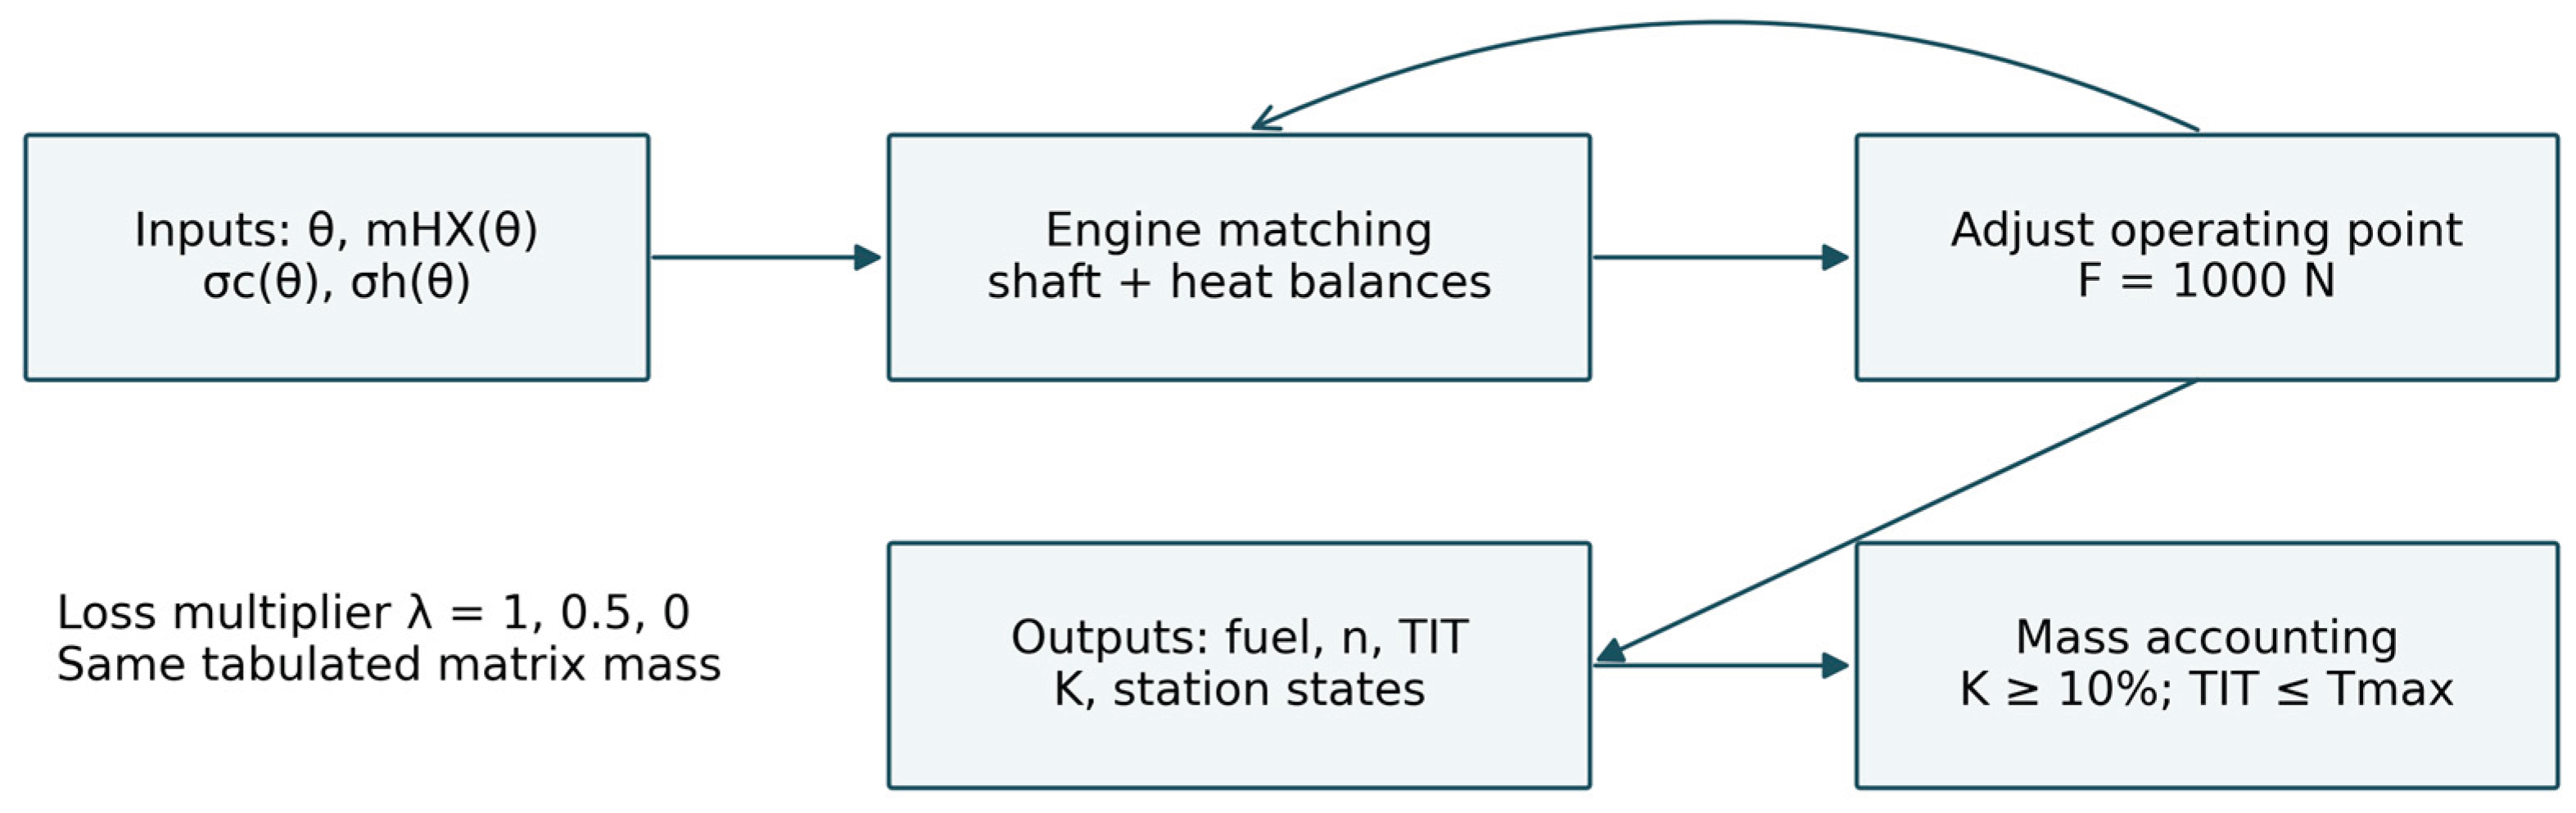
Figure 1.
Input variables, constant-thrust matching and mass accounting for the coupled engine–recuperator calculations.
Figure 1.
Input variables, constant-thrust matching and mass accounting for the coupled engine–recuperator calculations.
The engine arrangement is shown in Scheme 1. Compressor delivery air enters the cold passage of the recuperator at station 3.05 and returns to the combustion chamber at station 3.1 after heating. The turbine drives the compressor on a common shaft. Turbine exhaust passes through the hot passage between stations 5 and 6 before entering the nozzle.
2.2. Heat Recovery and Engine Accounting
Stations 1 and 2 in Scheme 1 denote the intake inlet and compressor inlet. Stations 3.05 and 3.1 denote the cold-side inlet and outlet; stations 5 and 6 denote the hot-side inlet and outlet; station 4 is the turbine inlet and station 9 is the nozzle exit. A superscript * denotes a total property. The workbook defines the recovery ratio through the cold-side temperature rise:
Equation (1) defines the cold-side temperature recovery ratio. Converting it to Q/Qmax requires the heat-capacity rates of both streams. The temperatures used for autonomous matrix sizing do not exactly reproduce Equation (1), whereas the matched engine states do: the largest discrepancy across the three constant-thrust series is 0.007 K. Thermal energy is conserved between passages:
Here ṁf,h is the hourly fuel flow in kg/h, while the other mass flows are in kg/s; enthalpy is in kJ/kg and Q is in kW. Equation (4) applies to static operation with ambient pressure at the nozzle exit. At F = 1000 N, fuel flow in kg/h and thrust-specific fuel consumption (TSFC) in kg/(kN·h) have the same numerical value. The hot- and cold-side heat rates agree in magnitude to the precision of the exported data. Shaft-power residuals are below 0.074 kW and momentum-thrust residuals below 0.263 N. These residuals measure internal consistency; experimental accuracy cannot be inferred from them.
2.3. Pressure-Loss Scenarios
The semicircular matrix is represented by its tabulated mass and separate pressure recovery coefficients. The original, half-loss and zero-loss series use a multiplier λ applied to the pressure deficit, not to the recovery coefficient:
Table 2.
Semicircular recuperator inputs used in the constant-thrust workbook.
| θ | mHX, kg | σc, λ = 1 | σh, λ = 1 |
|---|---|---|---|
| 0.0 | 0.00 | 1.000 | 1.000 |
| 0.1 | 1.96 | 0.986 | 0.993 |
| 0.2 | 4.47 | 0.968 | 0.983 |
| 0.3 | 7.79 | 0.943 | 0.971 |
| 0.4 | 12.36 | 0.908 | 0.954 |
| 0.5 | 19.01 | 0.858 | 0.947 |
| 0.6 | 29.56 | 0.663 | 0.930 |
| 0.7 | 48.71 | 0.629 | 0.822 |
The matrix outer and inner diameters are 0.20 and 0.05 m. Its tabulated mass is retained when λ is reduced, so these cases isolate sensitivity to pressure loss without assuming three separately designed exchangers. At θ = 0.5 and 0.6, the constant-thrust calculations use hot-side recovery coefficients of 0.947 and 0.930, whereas the sizing table lists them in the reverse order. The values used in the engine calculations are retained here. Both passages must be considered when allocating pressure losses [8]; a reduction in λ would require a corresponding hydraulic redesign.
2.4. Mass and Admissibility Criteria
For a constant operating point maintained over t hours, the combined engine, matrix and fuel mass is
A positive ΔM is the mass available for ducts, manifolds, supports and other installation changes after accounting for the matrix. Equation (7) compares mass at a prescribed operating point and duration. The compressor characteristic includes stability-margin values, and the candidate points are selected using K ≥ 10%. Their required turbine inlet temperatures must not exceed the specified allowable value Tmax. Both compressor and turbine characteristics are continued in ASTRA by interpolation, scaling and ray-based extrapolation. The outer lines in an exported table therefore do not define an additional operating limit. Mechanical speed limits, allowable temperatures and component life must be assessed for the engine hardware.
The intended unmanned aerial vehicle (UAV) duty is dominated by nominal 1000 N operation, taken as 90% of the operating time. This makes the nominal point the main basis for the fuel and mass comparison. To estimate the effect of the shorter nominal period, Equation (7) is evaluated with 0.9t in the fuel-saving term and the full matrix mass. The remaining 10% is assigned zero fuel-flow difference because matched off-nominal points are unavailable. This is a duty-time sensitivity of the nominal calculation. The underlying engine states are sea-level static points; flight speed, altitude and installation drag are not included.
3. Results and Discussion
3.1. Fuel Savings at Equal Thrust
Table 3 gives the complete original-loss series. Fuel consumption falls from 120.744 to 104.349 kg/h between θ = 0 and 0.5, a 16.395 kg/h or 13.58% decrease. Unlike a fixed-speed comparison, every row produces 1000 N. The required shaft speed rises from 67.017 to 76.442 krpm and TIT from 1168.67 to 1370.83 K. The nominal fuel minimum therefore carries a 202.16 K temperature increase and a negative reported compressor margin.
Figure 2.
Fuel flow and turbine inlet temperature at constant 1000 N thrust. Fuel flow in kg/h is numerically equal to TSFC in kg/(kN·h) at this thrust. Points with K < 10% are retained to show the calculated trends and are excluded from candidate selection.
Figure 2.
Fuel flow and turbine inlet temperature at constant 1000 N thrust. Fuel flow in kg/h is numerically equal to TSFC in kg/(kN·h) at this thrust. Points with K < 10% are retained to show the calculated trends and are excluded from candidate selection.
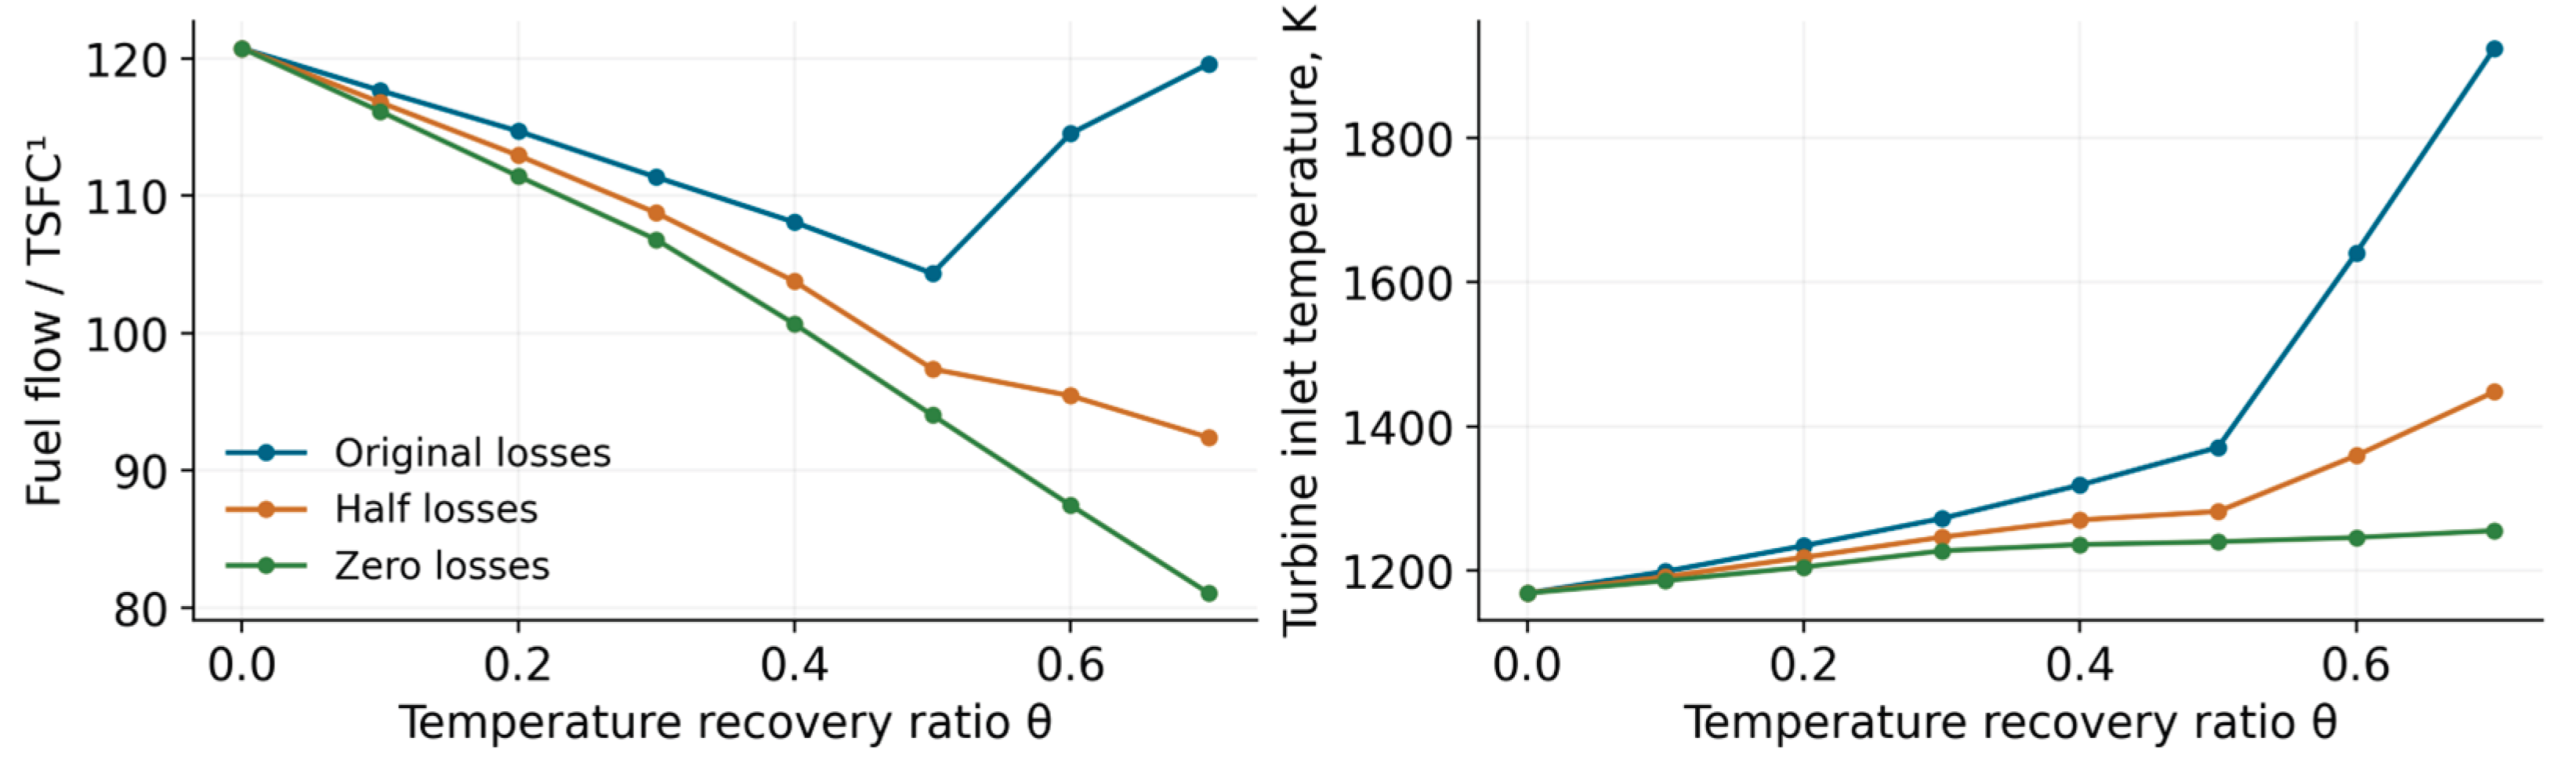
The temperature rise is not eliminated by removing recuperator losses. At θ = 0.4, TIT is 1318.58 K with the original losses, 1270.14 K with half losses and 1236.09 K with zero losses, respectively 149.91, 101.47 and 67.42 K above baseline. The remaining rise in the ideal-loss case reflects engine matching and the redistribution of exhaust energy, rather than hydraulic dissipation alone. Aviation recuperator studies similarly require integration with the engine cycle [9], [10], [11]; the present values quantify that requirement for this static 1000 N model.
3.2. Changes in Component Operating Points
Figure 3 shows the component response to changes in recuperator loss. At θ = 0.4, reducing λ from 1 to 0 lowers the compressor pressure ratio from 4.936 to 4.497, raises shaft speed from 74.139 to 75.703 krpm and decreases compressor efficiency from 0.74124 to 0.69343. Removing recuperator pressure losses therefore does not restore the original compressor operating point.
The shaft-speed changes accompany changes in mass flow. At θ = 0.4, air flow is 1.802, 1.838 and 1.866 kg/s for the original, half and zero losses. Lower recuperator losses permit a larger flow at a smaller compressor pressure ratio, with a different compressor efficiency. The stability margin rises from −0.809% to 6.089% and 12.380%. These changes follow from component matching and would be missed if heat recovery were applied with unchanged compressor and turbine states. Microturbine control and matching studies [12], [13] examine the related system behaviour; the present calculations concern steady states.
Compressor efficiencies become nearly constant over parts of the original- and half-loss series as K becomes negative. Points with K < 10% are retained for analysis but excluded from candidate selection. Some points require characteristics beyond the outer exported speed lines; ASTRA obtains these states by scaling and extrapolating the component maps. Their positions are shown in Section 3.7.
3.3. Internal Heat Recovery and Nozzle Conditions
Table 4 gives the temperatures and pressures at the principal stations. From θ = 0 to 0.4, cold-side outlet temperature rises by 288.77 K and hot-side outlet temperature falls by 101.36 K. Cold-side inlet pressure increases by 101.569 kPa, while nozzle inlet total pressure remains close to 193 kPa. The increase in compressor delivery pressure compensates for the recuperator pressure losses in the matched constant-thrust solution.
Figure 4.
Nozzle mass flow and velocity (left) and recovered heat (right) for original losses. The near-constant momentum product corresponds to the prescribed 1000 N thrust; the two left ordinates have different units.
Figure 4.
Nozzle mass flow and velocity (left) and recovered heat (right) for original losses. The near-constant momentum product corresponds to the prescribed 1000 N thrust; the two left ordinates have different units.
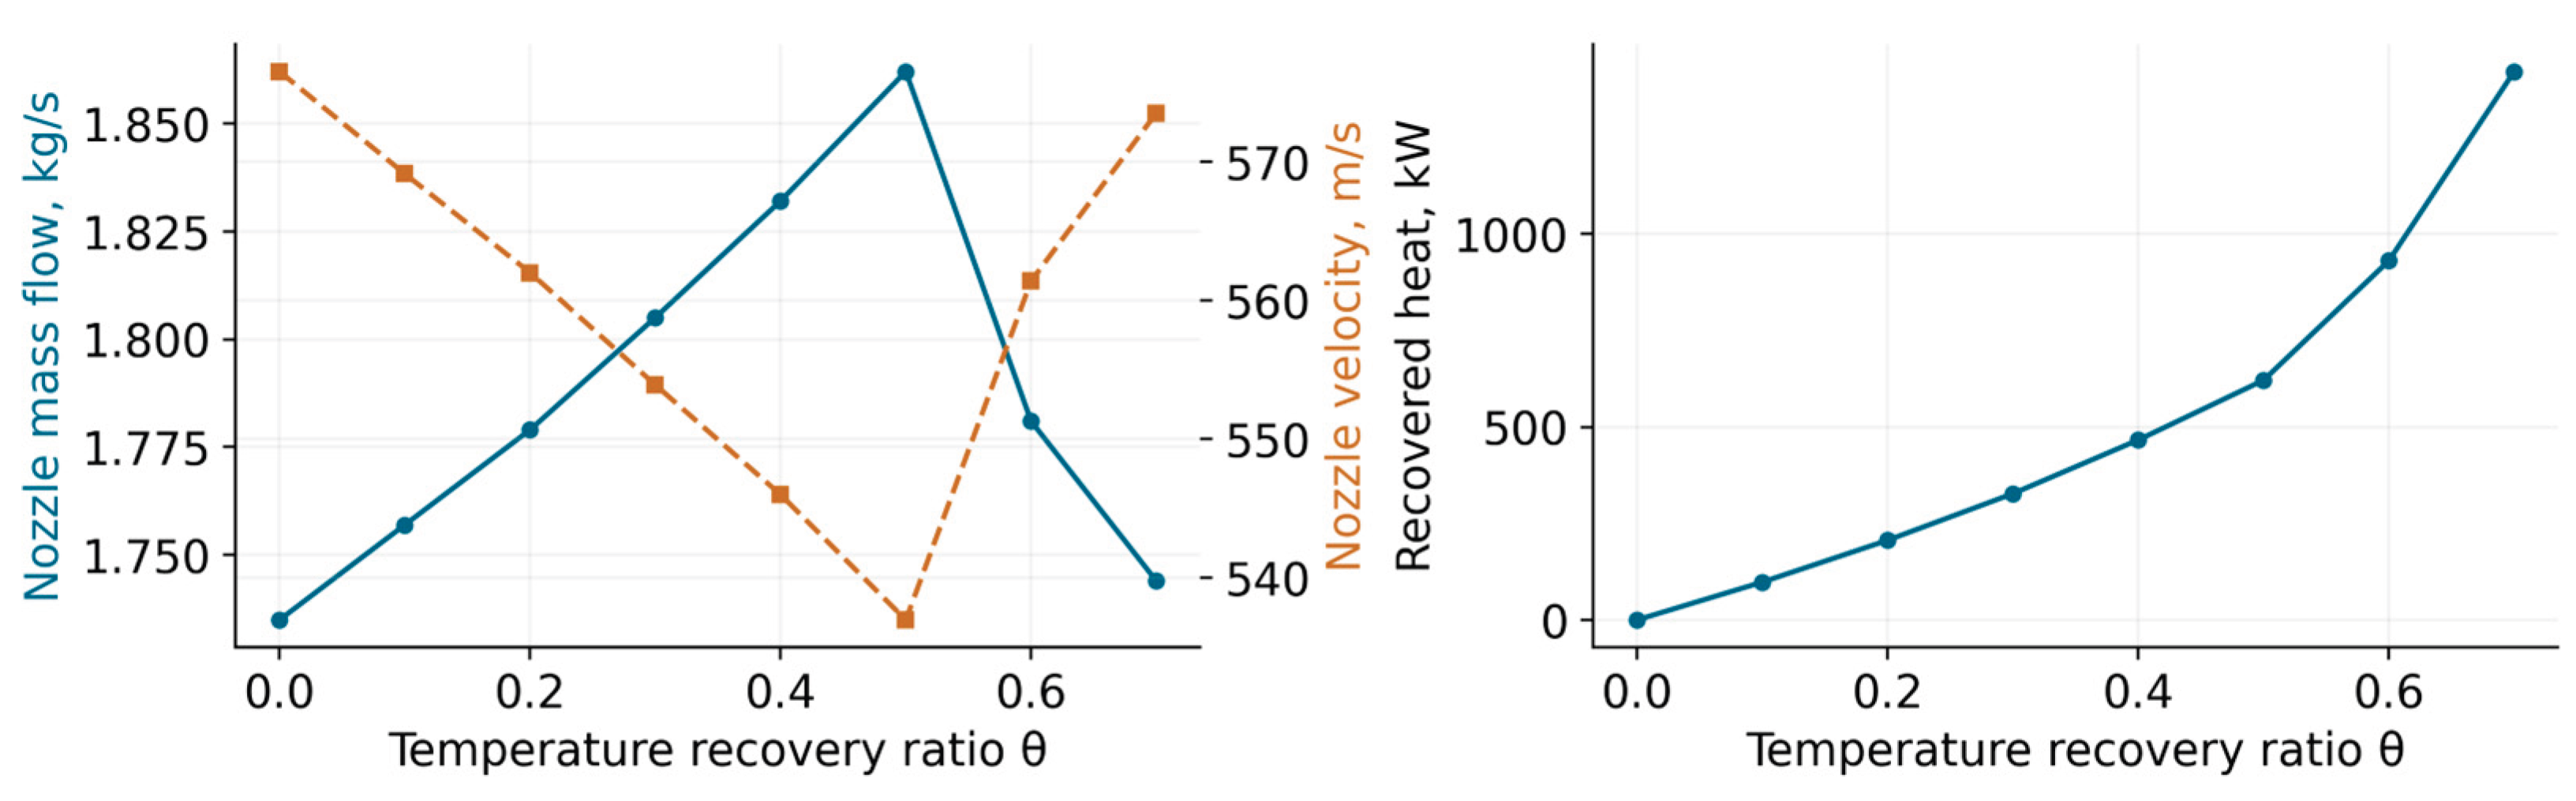
At θ = 0.4, the recovered heat rate reaches 466.1 kW. Nozzle velocity nevertheless falls from 576.52 to 545.99 m/s, a reduction of 5.30%; the larger gas flow maintains 1000 N through Equation (4). Heat transferred within the engine therefore cannot be equated to additional propulsive output. Reduced combustor fuel demand occurs together with a higher turbine inlet temperature and changes in compressor efficiency and nozzle flow. Flight propulsive efficiency is outside this static calculation.
3.4. Effects of Matrix Mass and Pressure Losses
Figure 5 compares four combinations of recuperator mass and pressure loss. The zero-mass case omits mHX from Equation (6) at the same engine operating point. The zero-loss case uses the separately matched λ = 0 series, with its corresponding fuel flow, shaft speed and temperatures.
With original mass and losses, the sampled one-hour minimum is 129.144 kg at θ = 0.3: a 1.600 kg benefit relative to baseline. The θ = 0.2 result is only 0.035 kg heavier, while its margin is 11.284% instead of 5.856%. The smaller unfiltered mass value therefore does not justify selecting θ = 0.3. At θ = 0.5, the exchanger weighs 19.01 kg and saves 16.395 kg of fuel in one hour; the net mass penalty is 2.615 kg. Removing the matrix mass hypothetically changes that point to 114.349 kg, showing how a favourable fuel result can coexist with an unfavourable hardware-plus-fuel result.
With zero pressure losses and the tabulated matrix mass, θ = 0.4 gives 123.028 kg and θ = 0.5 gives 123.029 kg. The 0.001 kg difference is at the resolution of the fuel-flow data and does not resolve a distinct minimum. When matrix mass and pressure losses are both omitted, the calculated mass continues to fall as heat recovery increases because neither penalty remains. Multi-objective studies of recuperators [14], [15] and recuperated propulsion systems [4], [5] address the same competing requirements; the zero-loss case here provides a reference bound for the stated mass assumption.
Table 5.
Pressure-loss sensitivity at matched θ; mass includes the engine and one hour of fuel.
| θ | λ | Fuel, kg/h | TIT, K | K, % | M, kg |
|---|---|---|---|---|---|
| 0.2 | 1 | 114.709 | 1234.38 | 11.284 | 129.179 |
| 0.2 | 0.5 | 112.941 | 1218.23 | 13.835 | 127.411 |
| 0.2 | 0 | 111.431 | 1204.78 | 16.252 | 125.901 |
| 0.3 | 1 | 111.354 | 1272.25 | 5.856 | 129.144 |
| 0.3 | 0.5 | 108.756 | 1246.35 | 10.087 | 126.546 |
| 0.3 | 0 | 106.806 | 1227.39 | 14.071 | 124.596 |
| 0.4 | 1 | 108.076 | 1318.58 | -0.809 | 130.436 |
| 0.4 | 0.5 | 103.769 | 1270.14 | 6.089 | 126.129 |
| 0.4 | 0 | 100.668 | 1236.09 | 12.380 | 123.028 |
Halving the losses at θ = 0.3 reduces fuel consumption by 2.598 kg/h and TIT by 25.90 K, and raises the margin by 4.231 percentage points to 10.087%. At θ = 0.4 it saves more fuel, 4.307 kg/h relative to the original-loss case, but its margin remains only 6.089%. Thus the beneficial hydraulic change does not expand the usable recovery ratio without limit. In a physical redesign, the assumed unchanged matrix mass would also have to be demonstrated; experimental and numerical studies of compact recuperators [16], [17] provide examples of the required component-level validation.
3.5. Mass Break-Even Duration and Candidate Points
Figure 6 gives the nominal operating time required for saved fuel to offset matrix mass. With the original losses, tBE is 0.638, 0.741, 0.830, 0.976 and 1.159 h at θ = 0.1–0.5. A higher recovery ratio therefore does not necessarily shorten this time. At θ = 0.7, tBE reaches 42.80 h because the fuel saving is small and the matrix weighs 48.71 kg. This point also fails the stability-margin criterion.
With the original losses, θ = 0.2 gives the largest one-hour mass allowance among the calculated points satisfying K ≥ 10%. Additional installation mass above 1.565 kg removes this advantage. The corresponding allowances are 4.198 kg for half losses at θ = 0.3 and 7.716 kg for zero losses at θ = 0.4. The half-loss point exceeds the margin threshold by only 0.087 percentage points and is sensitive to changes in the characteristic or operating conditions. For zero losses, θ = 0.5 gives no resolved mass advantage over θ = 0.4 and requires a higher turbine inlet temperature and shaft speed. Section 3.7 locates these points on the component characteristics.
For a one-hour interval with 90% nominal operation, the original-loss θ = 0.2 case saves 0.9 × (120.744 − 114.709) = 5.4315 kg of fuel. After adding the 4.47 kg matrix, 0.962 kg remains for the rest of the installation, compared with 1.565 kg during uninterrupted nominal operation. The mass break-even duration rises from 0.741 to 0.823 h. Under the same duty-time assumption, the allowances are 2.999 kg for half losses at θ = 0.3 and 5.708 kg for zero losses at θ = 0.4. These values assume no fuel-flow difference during the remaining 10%; they are not predictions of UAV payload or endurance.
The allowable turbine inlet temperature must be applied consistently to the reference and recuperated engines. The reference calculation already requires 1168.67 K. Table 6 therefore gives the absolute required temperatures and their increments, without assuming an unverified hardware limit. A candidate can be retained only if its required temperature and shaft speed are compatible with the specified component life. Recuperator material temperatures and thermal stresses [3], [18] require a separate assessment.
3.6. Conditions for Aircraft Application
The calculations identify combinations of heat recovery, pressure loss and matrix mass that leave a positive mass allowance at 1000 N. A complete installation must also include manifolds, ducts, casing and supports. Integrating these parts with the engine structure could reduce the added mass, while changes in channel geometry or manufacturing method could change the relation between heat transfer and pressure loss. Integrated combustor–recuperator designs [19], additively manufactured channels [20], [21] and ceramic turboshaft concepts [22] illustrate alternative design approaches. Their benefit for the present turbojet would require matching with their own thermal, hydraulic and mass characteristics.
For a duty dominated by nominal operation, component tests should first establish heat recovery and pressure losses near the corresponding air and gas flows and temperatures. The complete recuperator must then be assessed for mass, leakage, thermal deformation, strength and life. Start-up and control transients, including exchanger thermal inertia, also require checks; experimental microturbine studies [23], [24] address such effects. Reviews of micro gas turbines and UAV propulsion [25], [26] discuss further integration requirements. The present nominal-point analysis provides fuel-saving and mass targets for this work, while changes with flight conditions and the remaining operating time remain unquantified.
3.7. Compressor and Turbine Characteristics and the Independent Baseline
At 1000 N without a recuperator, the independent engine export gives 66.830 krpm, compressor corrected flow 1.714 kg/s, π*c = 3.910, η*c = 0.75953 and K = 20.111%. Its turbine inlet has T*4 = 1169.64 K, p*4 = 372.579 kPa and gas flow 1.713 kg/s. The ASTRA turbine-map coordinates are corrected speed nt,corr = 33.171 krpm and capacity At = 0.002664 m²; π*t = 1.926 and η*t = 0.88738. Corrected compressor flow uses Tref = 288.15 K and pref = 101.325 kPa: ṁ2,corr = ṁ2√(T*2/Tref)/(p*2/pref), and nc,corr = n√(Tref/T*2). Turbine corrected speed is nt,corr = n√(Tref/T*4), while At is the solver-reported turbine capacity, not the raw mass-flow function ṁ4√T*4/p*4. For the present sea-level static points T*2 = Tref. These definitions identify the actual coordinates plotted in Figure 7 and Figure 8.
For direct comparison with the exported normalized files, compressor pressure ratio is reconstructed as , compressor flow as ṁ2,corr = 1.7281Gc,map kg/s and efficiency as η*c = 0.74781ηc,map. The turbine analogues are , At = 0.002670Gt,map m² and η*t = 0.88022ηt,map, with 31.552 krpm as the reference corrected speed. The map reference coordinates normalize each characteristic; they are not the 1000 N engine state.
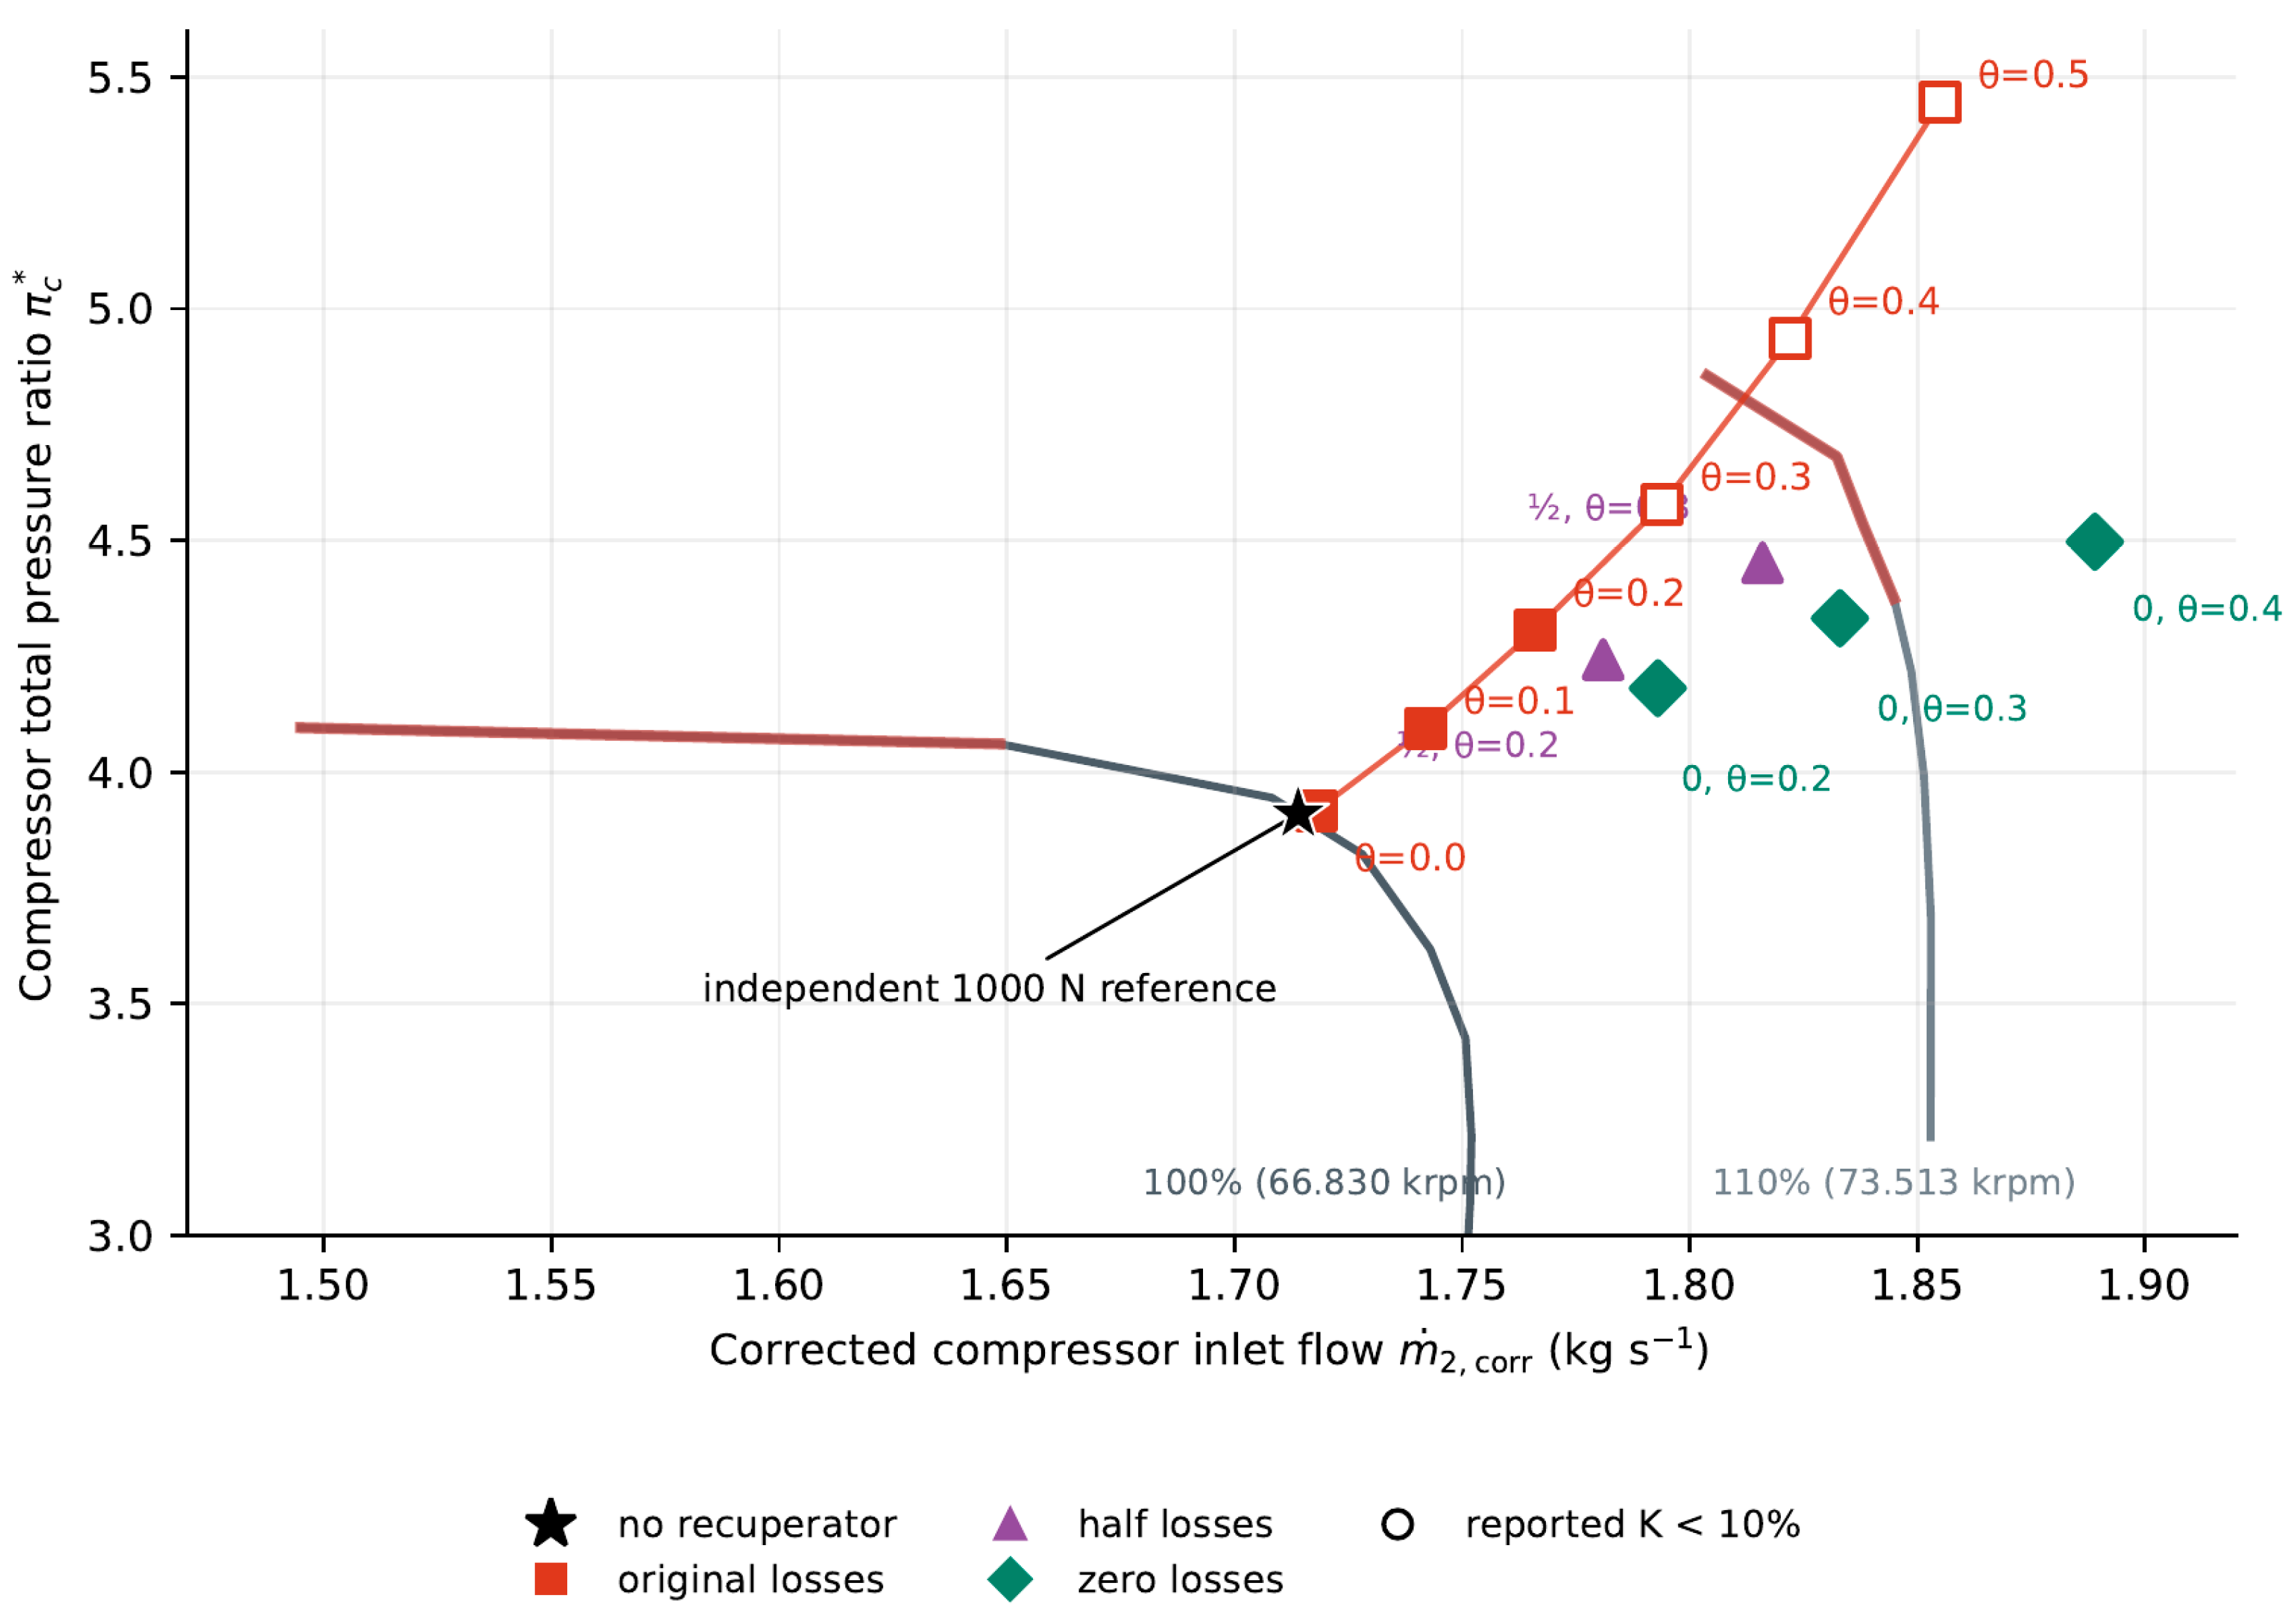
The independent no-recuperator calculation and the θ = 0 constant-thrust series use close but different reference points: shaft speeds are 66.830 and 67.017 krpm, and fuel flows are 120.772 and 120.744 kg/h. Both points are shown separately in Figure 7. For Table 8, the compressor map is interpolated along its 100% speed line at a corrected flow of 1.714 kg/s. The turbine map is interpolated at π*t = 1.926 in its normalized logarithmic expansion-ratio coordinate, first on the 100% and 110% corrected-speed lines and then in corrected speed to 33.171 krpm. This reconstruction checks the consistency of the map coordinates at the independent reference point. It does not reproduce the complete ASTRA matching procedure or provide experimental validation.
With the original losses, the constant-thrust compressor trajectory moves from a corrected flow of 1.718 kg/s and π*c = 3.917 at θ = 0 to 1.822 kg/s and π*c = 4.936 at θ = 0.4. Over this interval, K falls from 20.116% to −0.809%. The exported 110% speed line corresponds to 73.513 krpm, whereas the θ = 0.4 solutions require 74.139 krpm with original losses and 75.703 krpm with zero losses. These points use the extended characteristic calculated in ASTRA. The ray procedure in Scheme 2 is used for both compressor and turbine characteristics; the diagram illustrates it in compressor coordinates.
Outside the tabulated characteristic, a ray from the origin through the required point P intersects the two outer available speed branches at A and B (Scheme 2). ASTRA uses the values at these intersections to continue corrected speed and efficiency for the relevant component according to Equation (9).
Here s is distance along the ray and q denotes corrected speed or isentropic efficiency of the compressor or turbine. Each component retains its own normalized map coordinates and reference quantities. The extrapolation supplies component properties for engine matching; operating constraints are imposed separately.
With the original losses, turbine capacity changes from 0.002664 m² at θ = 0 to 0.002670 m² at θ = 0.4, an increase of about 0.23%, while expansion ratio rises from 1.933 to 2.067. Capacity remains close to the nearly horizontal high-expansion-ratio part of the characteristic as shaft speed, turbine inlet temperature and nozzle conditions adjust. At θ = 0.3, the half-loss and zero-loss solutions require nt,corr = 34.883 and 35.331 krpm; the zero-loss θ = 0.4 point requires 36.551 krpm. These exceed the highest exported line, 34.707 krpm, and are obtained by extending the turbine characteristic in ASTRA using the same ray-based method as for the compressor. The exported speed range is therefore not used as an additional exclusion criterion.
Table 7.
Selected compressor and turbine operating coordinates from the matched engine calculations.
Table 7.
Selected compressor and turbine operating coordinates from the matched engine calculations.
| Case, θ | n, krpm | π*c | K, % | nt,corr, krpm | π*t |
|---|---|---|---|---|---|
| No HX, 1000 N | 66.830 | 3.910 | 20.111 | 33.171 | 1.926 |
| Original, 0.2 | 70.513 | 4.306 | 11.284 | 34.069 | 2.001 |
| Half loss, 0.3 | 72.549 | 4.452 | 10.087 | 34.883 | 2.069 |
| Zero loss, 0.4 | 75.703 | 4.497 | 12.380 | 36.551 | 2.170 |
Table 8.
Map reconstruction at the independent 1000 N no-recuperator point. Difference = (map reconstruction − ASTRA output)/ASTRA output × 100%.
Table 8.
Map reconstruction at the independent 1000 N no-recuperator point. Difference = (map reconstruction − ASTRA output)/ASTRA output × 100%.
| Quantity | Unit | ASTRA output | Map reconstruction | Difference, % |
|---|---|---|---|---|
| Compressor pressure ratio, π*c | – | 3.910 | 3.908823 | −0.0301 |
| Compressor efficiency, η*c | – | 0.759530 | 0.759420 | −0.0145 |
| Turbine capacity, At | 10⁻³ m² | 2.664000 | 2.663730 | −0.0101 |
| Turbine efficiency, η*t | – | 0.887380 | 0.887377 | −0.00030 |
The largest difference in Table 8 is 0.0301%. The residuals are consistent with the precision of the exported coordinates and the use of simple polyline interpolation for this check. The stability margin is taken from the engine calculation; its value is not independently validated by reconstructing the normalized map.
4. Conclusions
1. At constant 1000 N static thrust and with the original recuperator losses, the lowest calculated fuel flow is 104.349 kg/h at θ = 0.5. This point requires a turbine inlet temperature of 1370.83 K and a shaft speed of 76.442 krpm, while K = −9.020%. It therefore fails the adopted stability-margin criterion. Increasing heat recovery without accounting for component matching can reduce fuel flow at an unacceptable engine operating point.
2. Reducing recuperator pressure losses changes the operating points of both turbomachines. At θ = 0.4, removing these losses lowers compressor pressure ratio from 4.936 to 4.497, but raises shaft speed from 74.139 to 75.703 krpm and lowers compressor efficiency from 0.74124 to 0.69343. Heat recovery must therefore be evaluated through the matched compressor, turbine and nozzle states. ASTRA applies interpolation, scaling and ray-based extrapolation to both component characteristics; an outer exported speed line is not itself a physical operating limit.
3. With the original losses, the lowest one-hour engine-plus-fuel mass among the sampled points is 129.144 kg at θ = 0.3, but K is only 5.856%. Among points satisfying K ≥ 10%, θ = 0.2 gives the largest mass allowance, 1.565 kg, after the matrix is included. Halving the losses moves this point to θ = 0.3 and increases the allowance to 4.198 kg. Its margin is 10.087%, only 0.087 percentage points above the threshold, so the selection is sensitive to changes in the calculated characteristic and operating conditions.
4. With zero pressure losses and the tabulated matrix mass, θ = 0.4 leaves a one-hour mass allowance of 7.716 kg. Increasing θ to 0.5 changes the calculated mass by only 0.001 kg and increases the required temperature and shaft speed. The lower-temperature θ = 0.4 point is therefore the preferable sampled reference for this sensitivity. Zero loss at unchanged matrix mass is an ideal bound, not a demonstrated recuperator design.
5. Heat recuperation can be useful for a UAV powerplant only when fuel saved at the required thrust exceeds the complete added installation mass and the engine remains within its thermal, speed and stability limits. For the studied original-loss matrix at θ = 0.2, a one-hour interval with 90% nominal operation saves 5.4315 kg of fuel under the stated assumption for the remaining time. The 4.47 kg matrix leaves only 0.962 kg for manifolds, ducts, casing, supports and other installation changes. The engine also requires 1234.38 K turbine inlet temperature and 70.513 krpm. Thus the calculated fuel saving identifies a narrow mass allowance, while a net benefit for the complete installed engine–UAV system remains conditional on the hardware and flight conditions.
6. Further development should reduce pressure losses and installed mass at the required heat recovery. Channel geometry and flow distribution must be selected jointly: an enhanced surface is useful only if its heat-transfer gain offsets its additional resistance. Microchannels, additively manufactured matrices and suitable joining processes are design options, but their advantage must be assessed with measured thermal and hydraulic characteristics. Integrating the recuperator with the engine casing and shortening manifolds and connecting ducts could reduce the mass omitted from the present matrix calculation.
7. The next assessment should combine measured cold- and hot-side characteristics with the mass of the complete assembly and checks of leakage, thermal deformation, strength and life. Because the intended duty assigns about 90% of the time to nominal thrust, the nominal regime is the appropriate first comparison; start-up, transients and the remaining operating time still require checks. Matching with these component data at the actual flight conditions is needed to determine whether the fuel saving reduces installed powerplant mass or improves UAV endurance. The maximum recovery ratio alone cannot determine recuperator selection.
Author Contributions
To be completed by the authors.
Funding
To be confirmed by the authors.
Institutional Review Board Statement
Not applicable.
Informed Consent Statement
Not applicable.
Data Availability Statement
Availability of the component characteristics and calculation tables is to be confirmed by the authors.
Conflicts of Interest
To be declared by the authors.
Acknowledgments and any journal-required disclosure of AI-assisted manuscript preparation
To be confirmed by the authors.
References
- Xiao, Gang; Yang, Tianfeng; Liu, Huanlei; Ni, Dong; Ferrari, Mario Luigi; Li, Mingchun; Luo, Zhongyang; Cen, Kefa; Ni, Mingjiang. Recuperators for micro gas turbines: A review. Appl. Energy 2017, 197, 83–99. [Google Scholar] [CrossRef]
- Wang, Ruihao; Wang, Yanhua; Chen, Xiaohu; Wang, Meng; Wang, Zhongyi. Research on performance of micro gas turbine recuperator: A review. Int. Commun. Heat Mass Transf. 2024, 154, 107396. [Google Scholar] [CrossRef]
- McDonald, Colin F. Recuperator considerations for future higher efficiency microturbines. Appl. Therm. Eng. 2003, 23(12), 1463–1487. [Google Scholar] [CrossRef]
- Zhang, Chengyu; Gümmer, Volker. Performance assessment of recuperated rotorcraft powerplants: Trade-off between fuel economy and weight penalty for both tubular and primary surface recuperators. Appl. Therm. Eng. 2020, 164, 114443. [Google Scholar] [CrossRef]
- Zhang, Chengyu; Gümmer, Volker. Multi-objective optimization and system evaluation of recuperated helicopter turboshaft engines. Energy 2020, 191, 116477. [Google Scholar] [CrossRef]
- Wei, Zuojun; Duan, Wenhua; Gao, Haotian; Wei, Cunju; Ren, Guangming; Gan, Xiaohua. Preliminary design and key components validation of modular recuperated micro gas turbine for small unmanned systems. Case Stud. Therm. Eng. 2025, 73, 106547. [Google Scholar] [CrossRef]
- Blagin, E.V.; Uglanov, D.A.; Shimanov, A.A.; Shimanova, A.B. Comparative analysis of various channel shapes for a plate-fin heat exchanger of a small-sized gas turbine power plant. J. Int. Acad. Refrig. 2023, 4, 11–21. [Google Scholar] [CrossRef]
- Stevens, Tine; Baelmans, Martine. Optimal pressure drop ratio for micro recuperators in small sized gas turbines. Appl. Therm. Eng. 2008, 28(17-18), 2353–2359. [Google Scholar] [CrossRef]
- Misirlis, Dimitrios; Vlahostergios, Zinon; Flouros, Michael; Salpingidou, Christina; Donnerhack, Stefan; Goulas, Apostolos; Yakinthos, Kyros. Optimization of Heat Exchangers for Intercooled Recuperated Aero Engines. Aerospace 2017, 4(1), 14. [Google Scholar] [CrossRef]
- McDonald, Colin F.; Massardo, Aristide F.; Rodgers, Colin; Stone, Aubrey. Recuperated gas turbine aeroengines. Part III: engine concepts for reduced emissions, lower fuel consumption, and noise abatement. Aircr. Eng. Aerosp. Technol. 2008, 80(4), 408–426. [Google Scholar] [CrossRef]
- Vlahostergios, Zinon; Misirlis, Dimitrios; Flouros, Michael; Salpingidou, Christina; Donnerhack, Stefan; Goulas, Apostolos; Yakinthos, Kyros. Development, Numerical Investigation and Experimental Validation of a New Recuperator Design for Aero Engines Applications. B Turbomach. 2017, Volume 2, V02BT41A035. [Google Scholar] [CrossRef]
- Yang, Rui; Liu, Yongbao; Xia, Ge; He, Xing; Liu, Zhimeng. Multi-factor performance analysis and optimized control strategy for a single-shaft micro gas turbine. Therm. Sci. Eng. Progress. 2025, 64, 103836. [Google Scholar] [CrossRef]
- Kim, Min Jae; Kim, Jeong Ho; Kim, Tong Seop. Program development and simulation of dynamic operation of micro gas turbines. Appl. Therm. Eng. 2016, 108, 122–130. [Google Scholar] [CrossRef]
- Chatzi, Panagiota; Efstathiadis, Theofilos; Skordos, Alex A.; Kalfas, Anestis I. Metal foam recuperators on micro gas turbines: Multi-objective optimisation of efficiency, power and weight. Appl. Therm. Eng. 2024, 242, 122410. [Google Scholar] [CrossRef]
- Maghsoudi, Peyman; Sadeghi, Sadegh; Khanjarpanah, Hossein; Haghshenas Gorgani, Hamid. A comprehensive thermo-economic analysis, optimization and ranking of different microturbine plate-fin recuperators designs employing similar and dissimilar fins on hot and cold sides with NSGA-II algorithm and DEA model. Appl. Therm. Eng. 2018, 130, 1090–1104. [Google Scholar] [CrossRef]
- Shi, Xusheng; Wang, Yongwei; Huai, Xiulan. Experimental and Numerical Studies of a Recuperator in Micro Turbines. E3S Web Conf. 2020, 162, 01005. [Google Scholar] [CrossRef]
- Li, Hui; Zou, Zhengping; Li, Huan; Chen, Yiming; Fu, Chao. Thermal performance of a microchannel primary surface recuperator for portable microturbine generators: Design and experimental study. Appl. Therm. Eng. 2022, 206, 118103. [Google Scholar] [CrossRef]
- Gui, Xiaohong; Song, Xiange; Gong, Haiwen; Yao, Dianbao; Chen, Ruogu; Xu, Guang. Finite Element Analysis of Stress on Cross-Wavy Primary Surface Recuperator Based on Thermal-Structural Coupling Model. Adv. Mater. Sci. Eng. 2021, 2021(1), 9604371. [Google Scholar] [CrossRef]
- Sheykhpoor, Hossein; Darabkhani, Hamidreza Gohari; Awan, Abdul Waheed. Improving efficiency of micro gas turbine systems by integration of combustor and recuperator using additive manufacturing techniques. Int. J. Adv. Manuf. Technol. 2023, 127(1-2), 23–44. [Google Scholar] [CrossRef]
- Rao, Yu; Zhang, Yueliang; Xiao, Kehua. Experimental and numerical study of thermal performance of an additively manufactured microchannel heat exchanger. Therm. Sci. Eng. Prog. 2025, 62, 103572. [Google Scholar] [CrossRef]
- Zhang, Yueliang; Su, Xiyuan; Rao, Yu; Wang, Xintong; Yeranee, Kirttayoth. Experimental studies on the thermal-hydraulic performance of additively manufactured annular TPMS and microchannel heat exchangers. Int. J. Heat Fluid Flow 2026, 121, 110486. [Google Scholar] [CrossRef]
- Vick, Michael J.; Heyes, Andrew; Pullen, Keith. Design Overview of a Three Kilowatt Recuperated Ceramic Turboshaft Engine. J. Eng. Gas. Turbines Power 2010, 132(9), 092301. [Google Scholar] [CrossRef]
- Ferrari, Mario L.; Pascenti, Matteo; Magistri, Loredana; Massardo, Aristide F. Micro Gas Turbine Recuperator: Steady-State and Transient Experimental Investigation. Volume 5: Microturbines and Small Turbomachinery. Oil Gas. Appl. 2009, 37–46. [Google Scholar] [CrossRef]
- Ferrari, Mario L.; Sorce, Alessandro; Pascenti, Matteo; Massardo, Aristide F. Recuperator dynamic performance: Experimental investigation with a microgas turbine test rig. Appl. Energy 2011, 88(12), 5090–5096. [Google Scholar] [CrossRef]
- Li, Jingqi; Li, Yulong. Micro gas turbine: Developments, applications, and key technologies on components. Propuls. Power Res. 2023, 12(1), 1–43. [Google Scholar] [CrossRef]
- Prisăcariu, Emilia Georgiana; Roșu, Raluca Andreea; Dumitrescu, Oana; Ciobanu, Romeo Robert. A Review of Micro Gas Engines for UAV Propulsion: Fundamentals and Emerging Technologies. Drones 2026, 10(7), 543. [Google Scholar] [CrossRef]
Scheme 1.
Schematic longitudinal section of the recuperated micro turbojet with component names and engine stations.
Scheme 1.
Schematic longitudinal section of the recuperated micro turbojet with component names and engine stations.
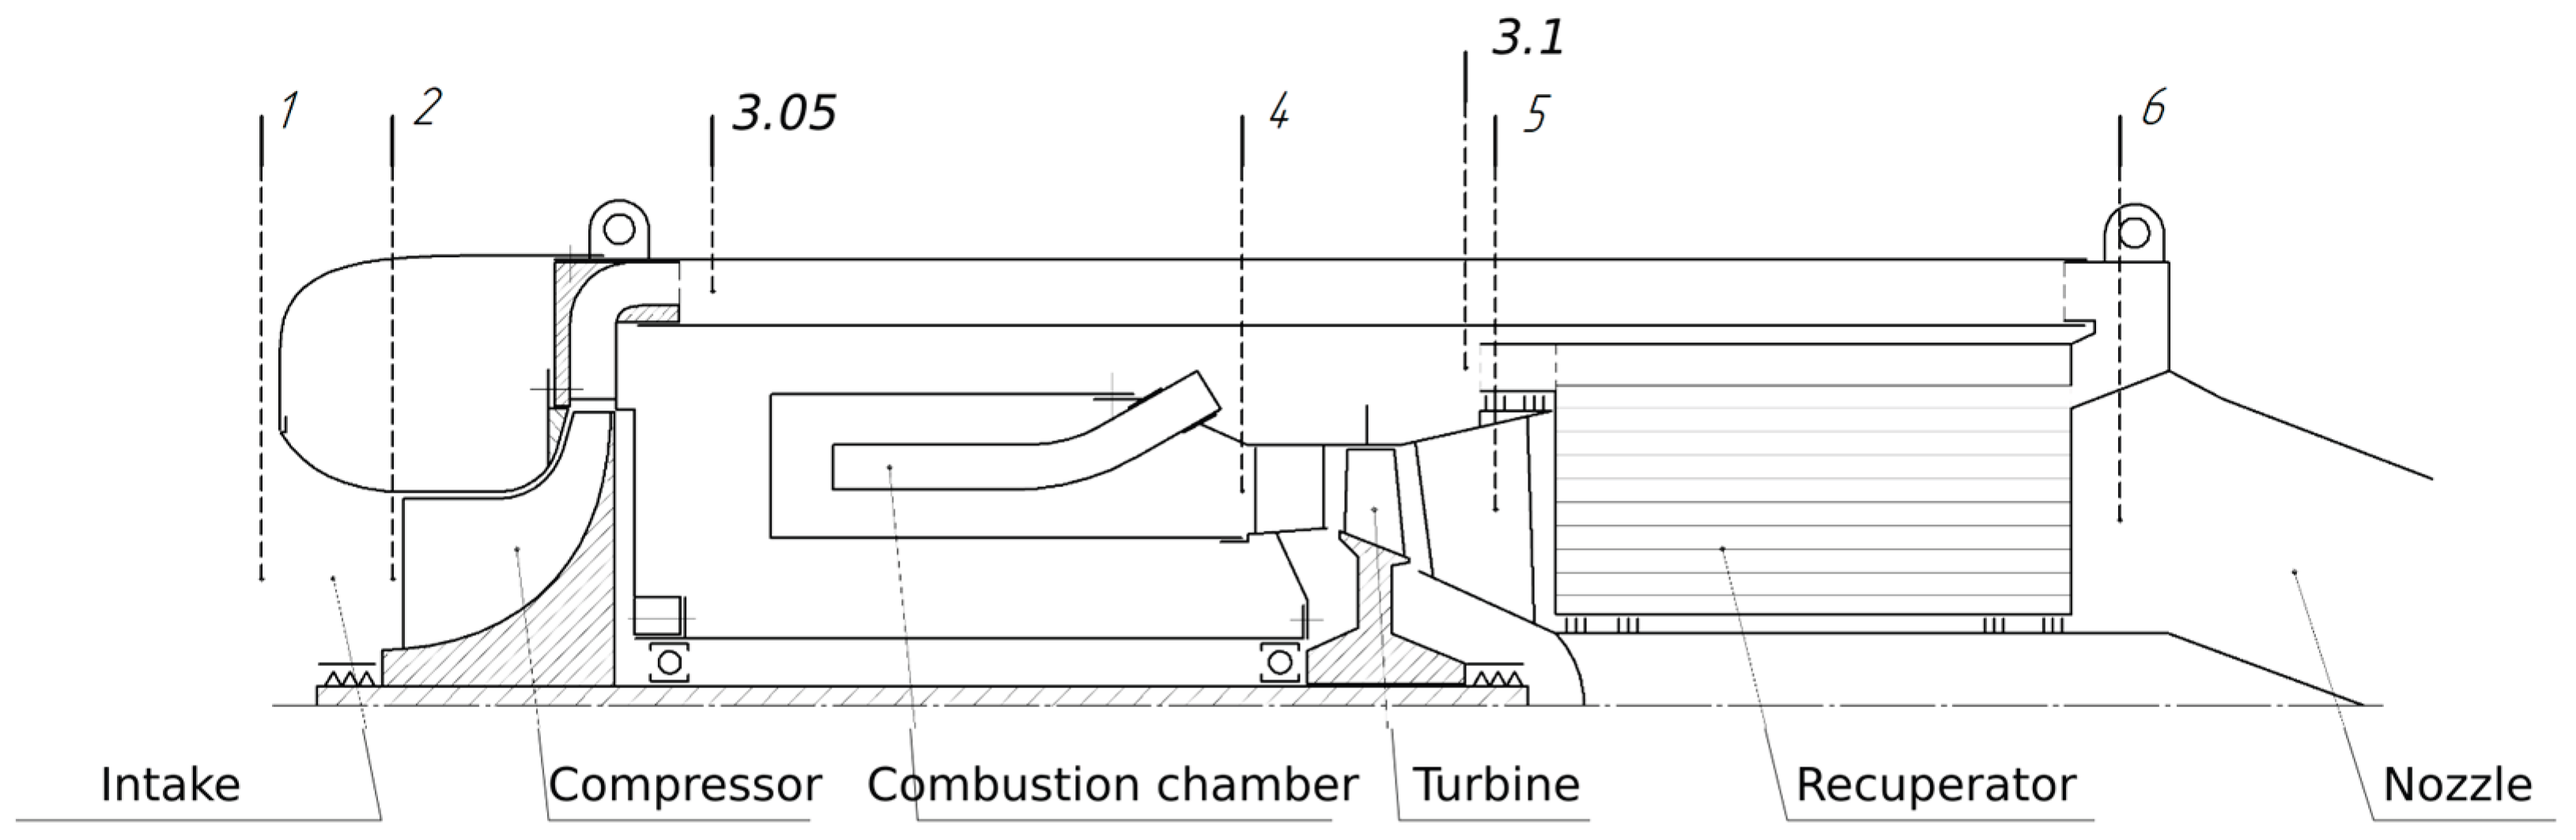
Figure 3.
Shaft speed, compressor pressure ratio, compressor efficiency and compressor stability margin for the three pressure-loss multipliers. The dashed line denotes the adopted K = 10% threshold.
Figure 3.
Shaft speed, compressor pressure ratio, compressor efficiency and compressor stability margin for the three pressure-loss multipliers. The dashed line denotes the adopted K = 10% threshold.
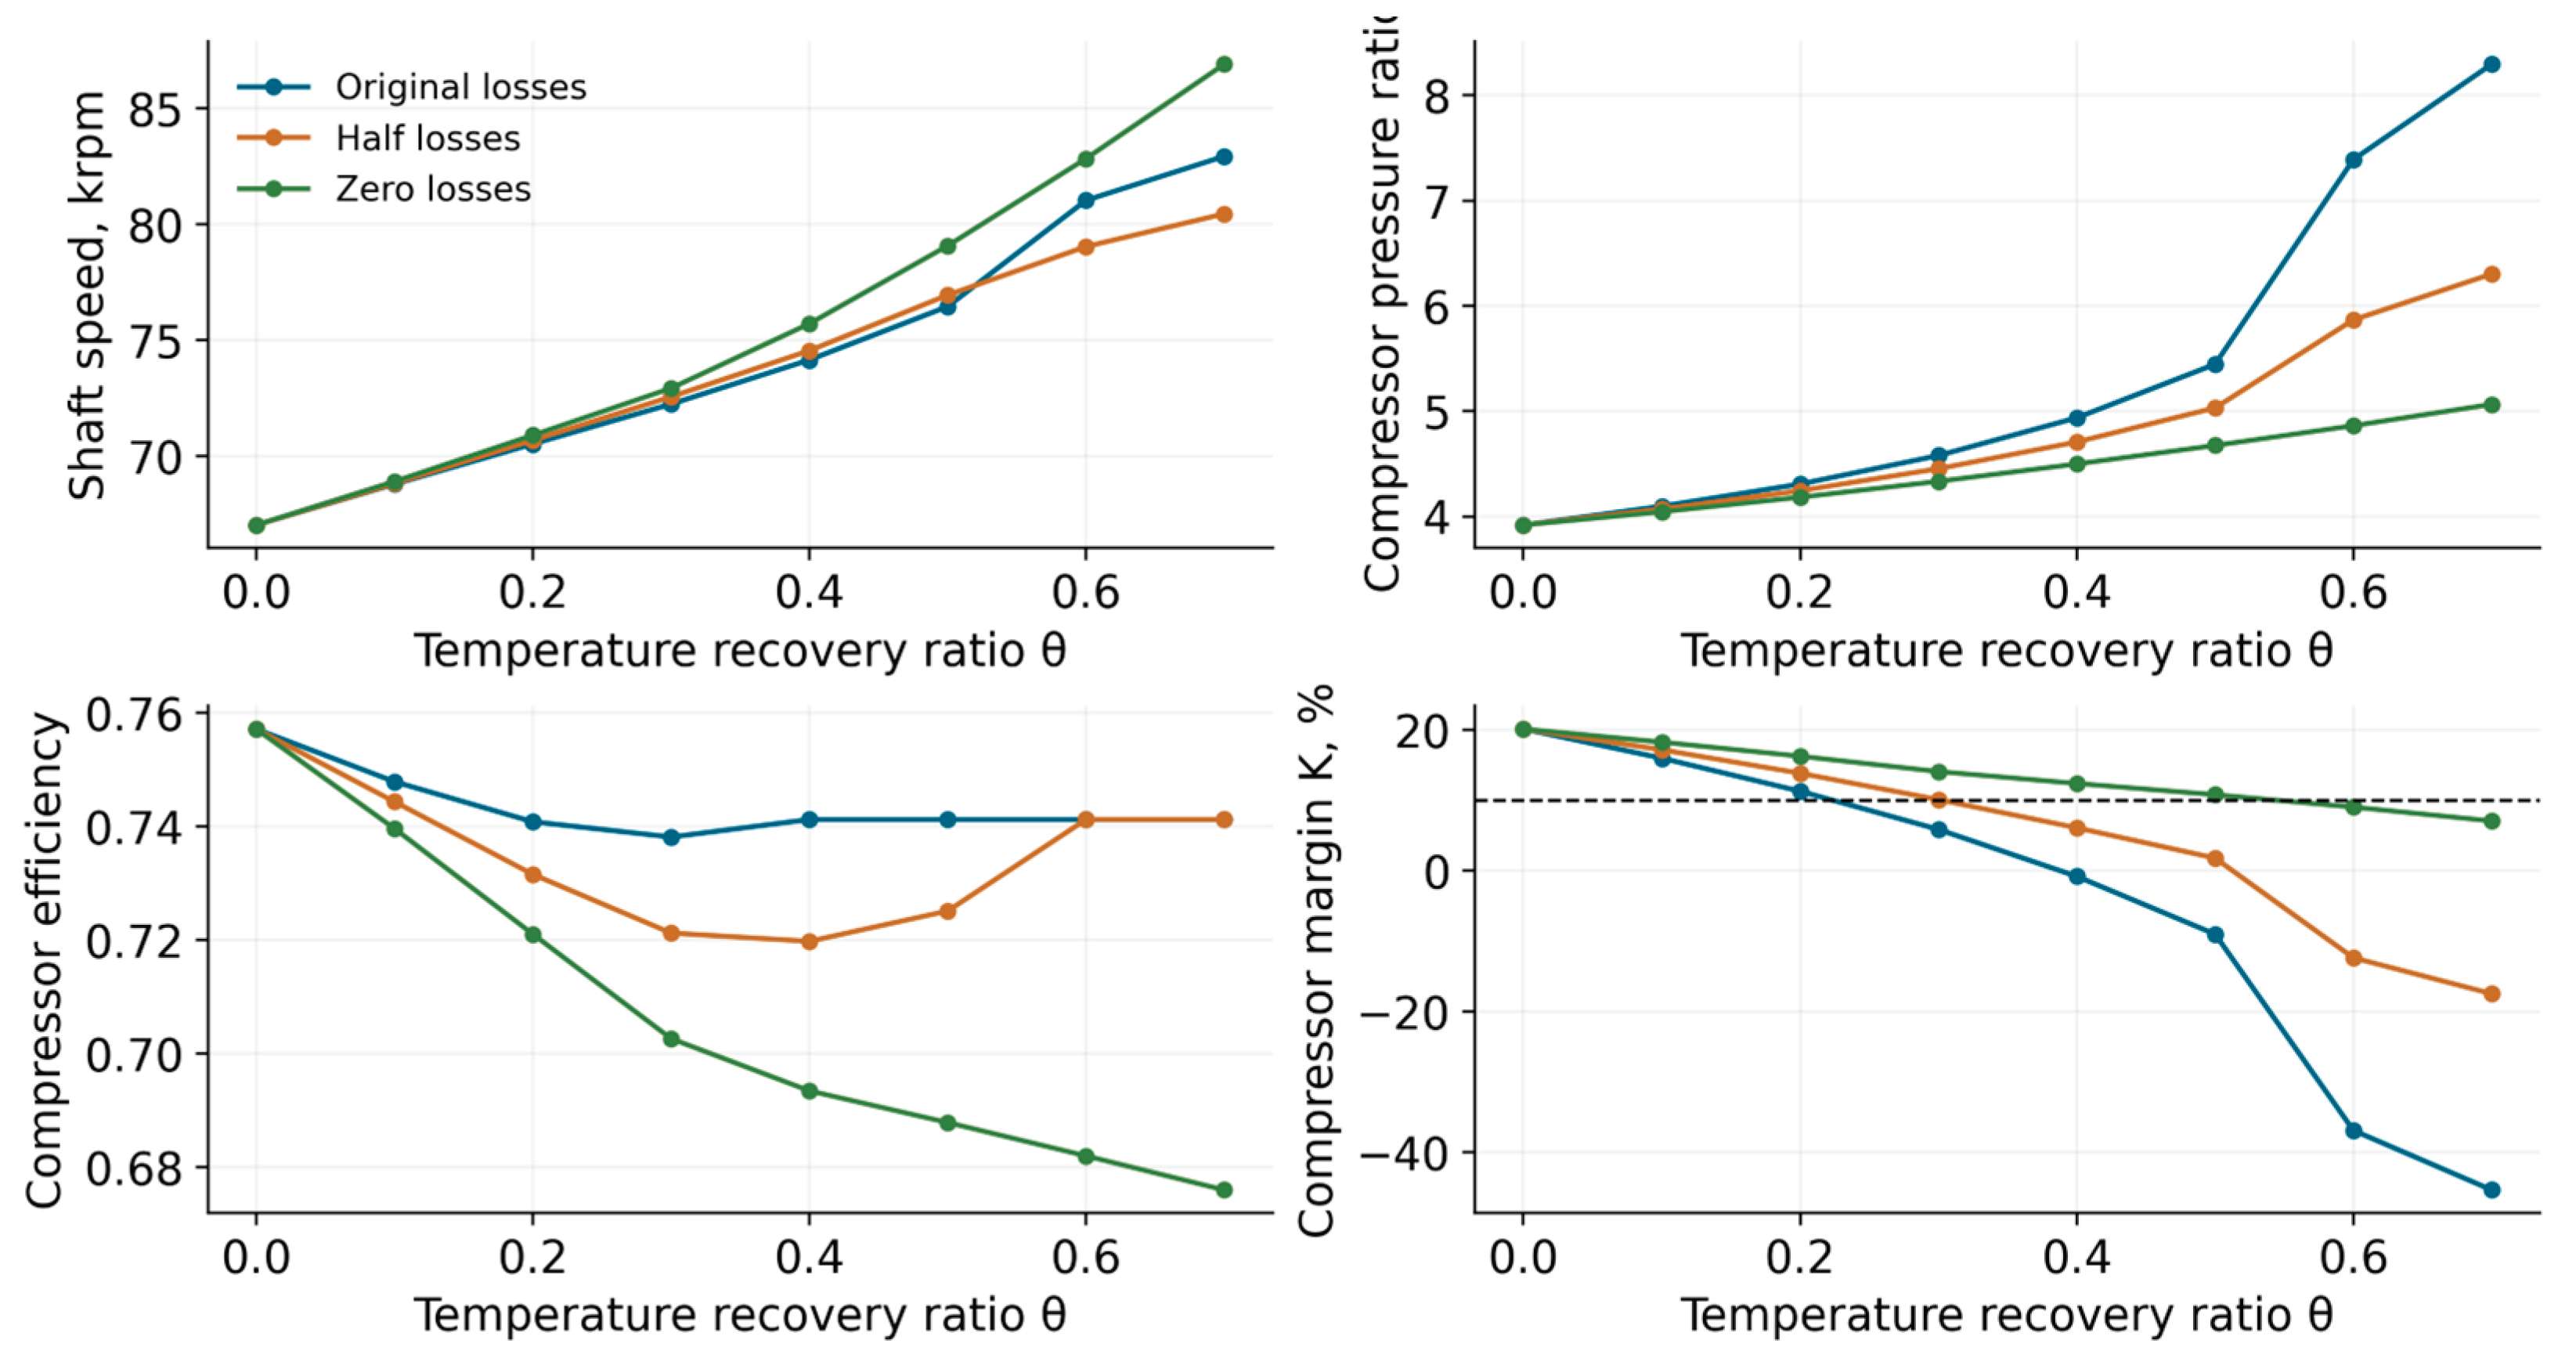
Figure 5.
Left: four combinations of matrix mass and recuperator pressure losses. Right: the low-recovery region including half losses. The dotted baseline is 130.744 kg for the engine and one hour of fuel without recuperation.
Figure 5.
Left: four combinations of matrix mass and recuperator pressure losses. Right: the low-recovery region including half losses. The dotted baseline is 130.744 kg for the engine and one hour of fuel without recuperation.
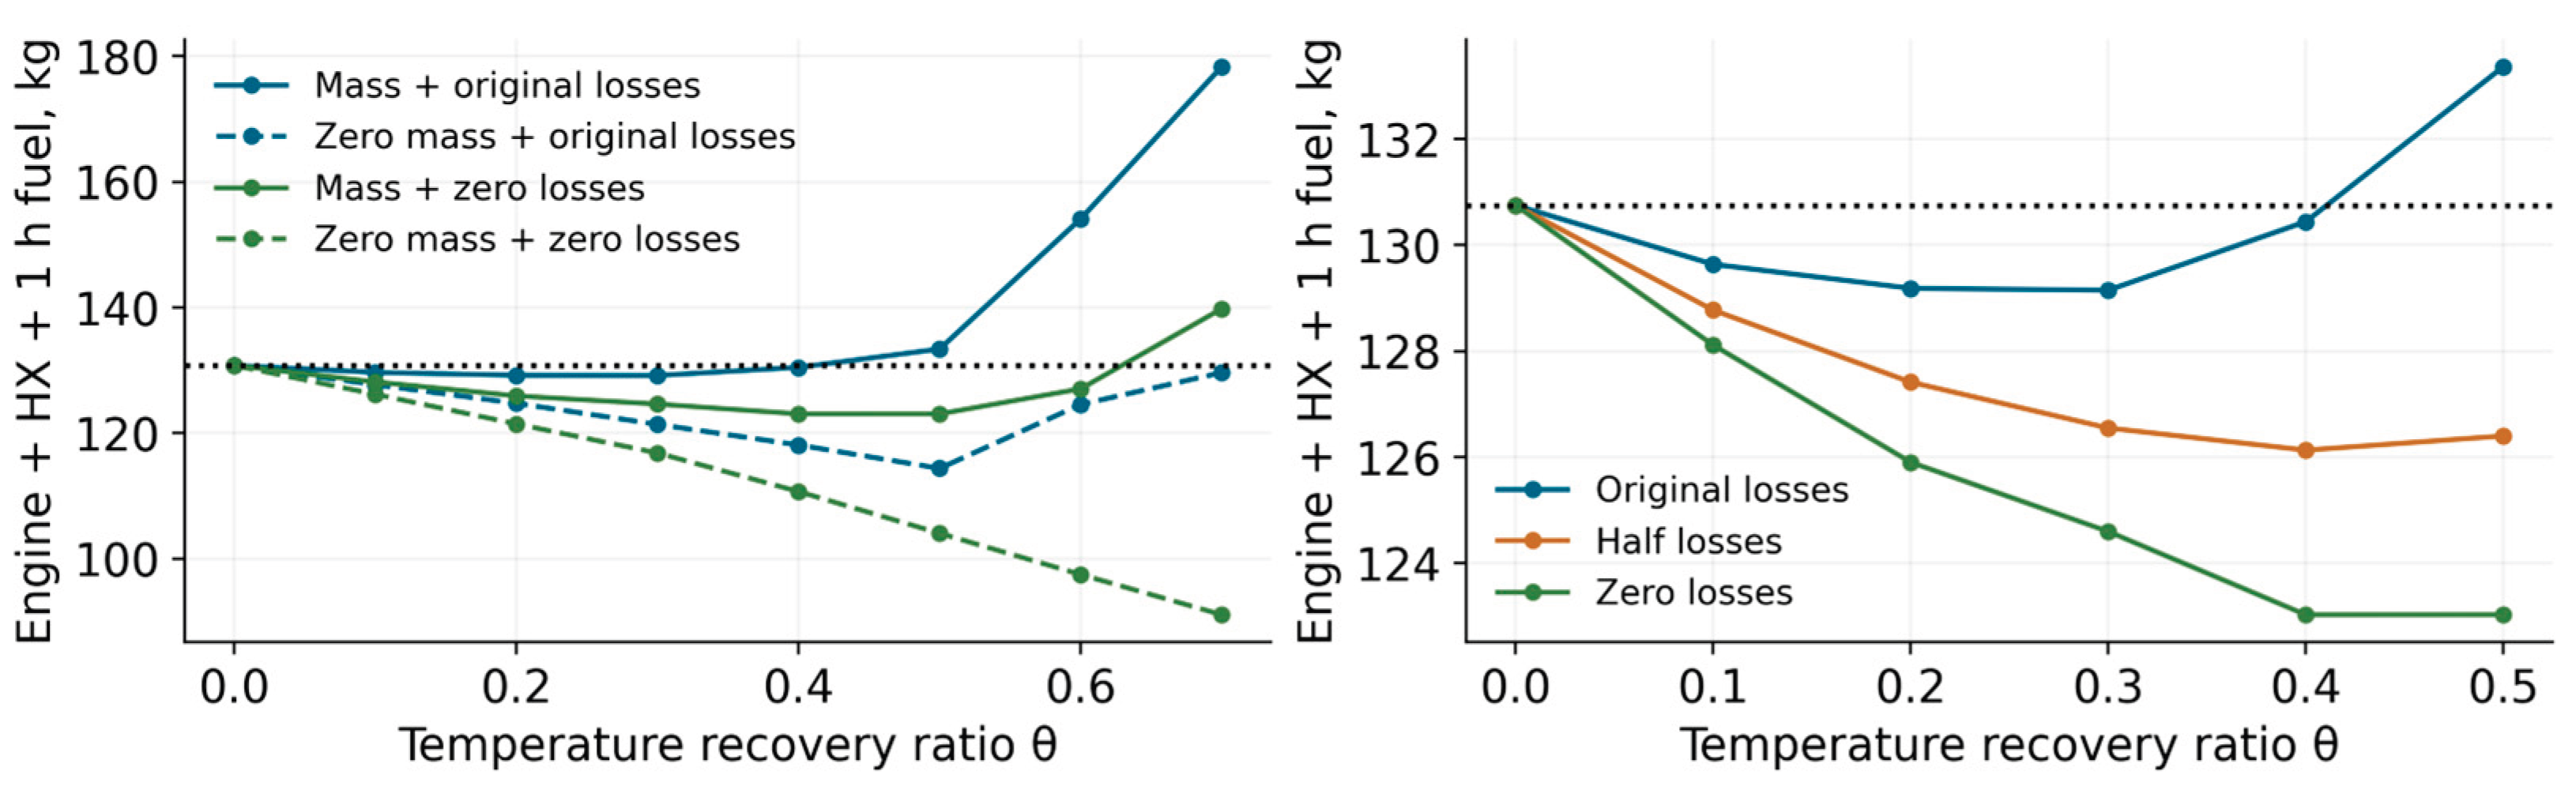
Figure 6.
Time required for fuel savings to offset matrix mass, with a logarithmic ordinate (left), and remaining mass allowance for one hour at θ ≤ 0.5 (right). The calculations use a fixed nominal point and exclude installation drag and changes in flight conditions.
Figure 6.
Time required for fuel savings to offset matrix mass, with a logarithmic ordinate (left), and remaining mass allowance for one hour at θ ≤ 0.5 (right). The calculations use a fixed nominal point and exclude installation drag and changes in flight conditions.
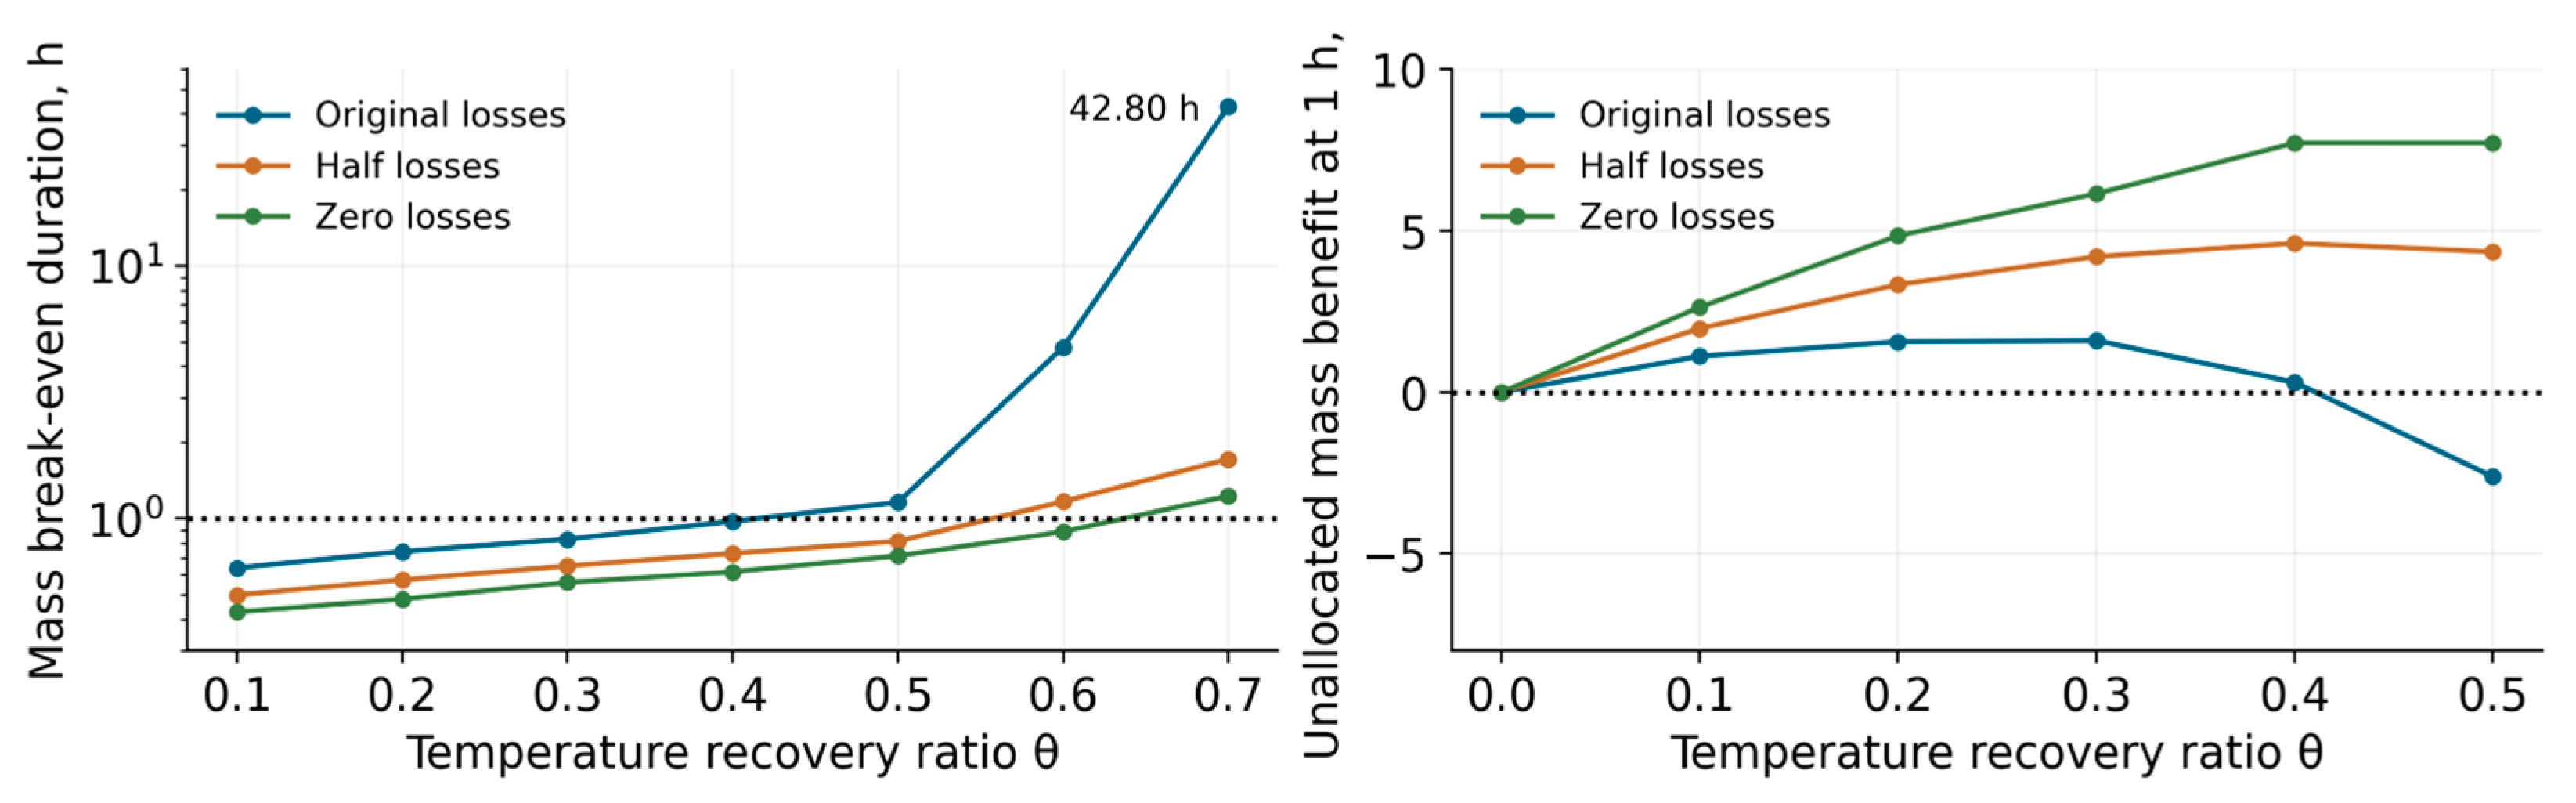
Figure 7.
Compressor pressure-ratio characteristic and matched operating points at 1000 N. Grey curves are the exported 100% and 110% speed lines; brown segments denote tabulated K < 10%. Coloured symbols are matched ASTRA results, including points calculated using extended characteristics. Filled symbols satisfy K ≥ 10%; open symbols do not.
Figure 7.
Compressor pressure-ratio characteristic and matched operating points at 1000 N. Grey curves are the exported 100% and 110% speed lines; brown segments denote tabulated K < 10%. Coloured symbols are matched ASTRA results, including points calculated using extended characteristics. Filled symbols satisfy K ≥ 10%; open symbols do not.
Scheme 2.
Ray extrapolation used for compressor and turbine characteristics in ASTRA, illustrated in compressor coordinates. A and B are intersections with the outer available speed branches; P is the required operating point. The diagram shows the construction and contains no numerical map data.
Scheme 2.
Ray extrapolation used for compressor and turbine characteristics in ASTRA, illustrated in compressor coordinates. A and B are intersections with the outer available speed branches; P is the required operating point. The diagram shows the construction and contains no numerical map data.
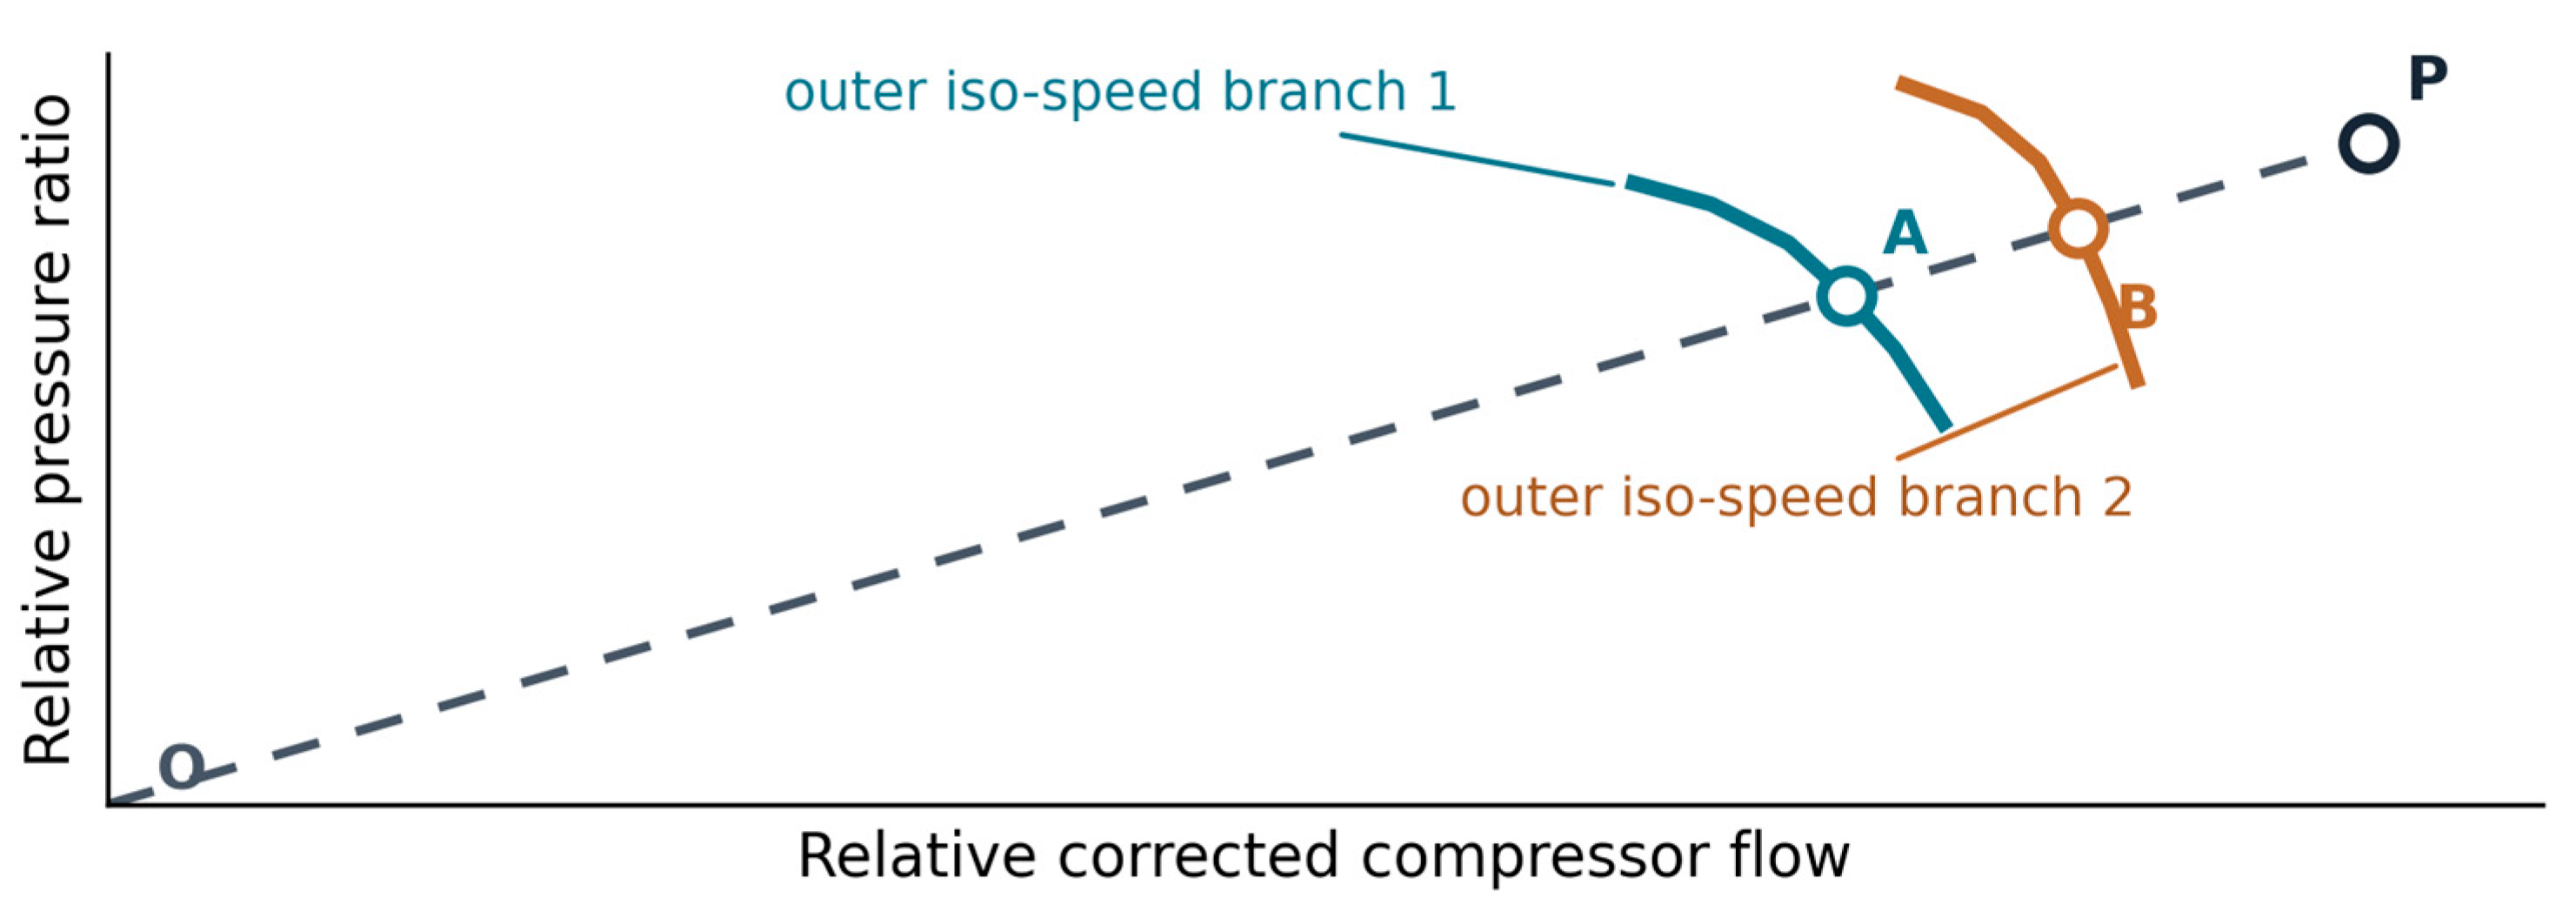
Figure 8.
Turbine efficiency (left) and capacity At (right) versus expansion ratio at corrected turbine speed nt,corr in krpm. Curves show the exported ASTRA characteristic; symbols are matched engine results, including points obtained by extending the characteristic. Filled and open symbols indicate whether the corresponding compressor margin satisfies K ≥ 10%.
Figure 8.
Turbine efficiency (left) and capacity At (right) versus expansion ratio at corrected turbine speed nt,corr in krpm. Curves show the exported ASTRA characteristic; symbols are matched engine results, including points obtained by extending the characteristic. Filled and open symbols indicate whether the corresponding compressor margin satisfies K ≥ 10%.
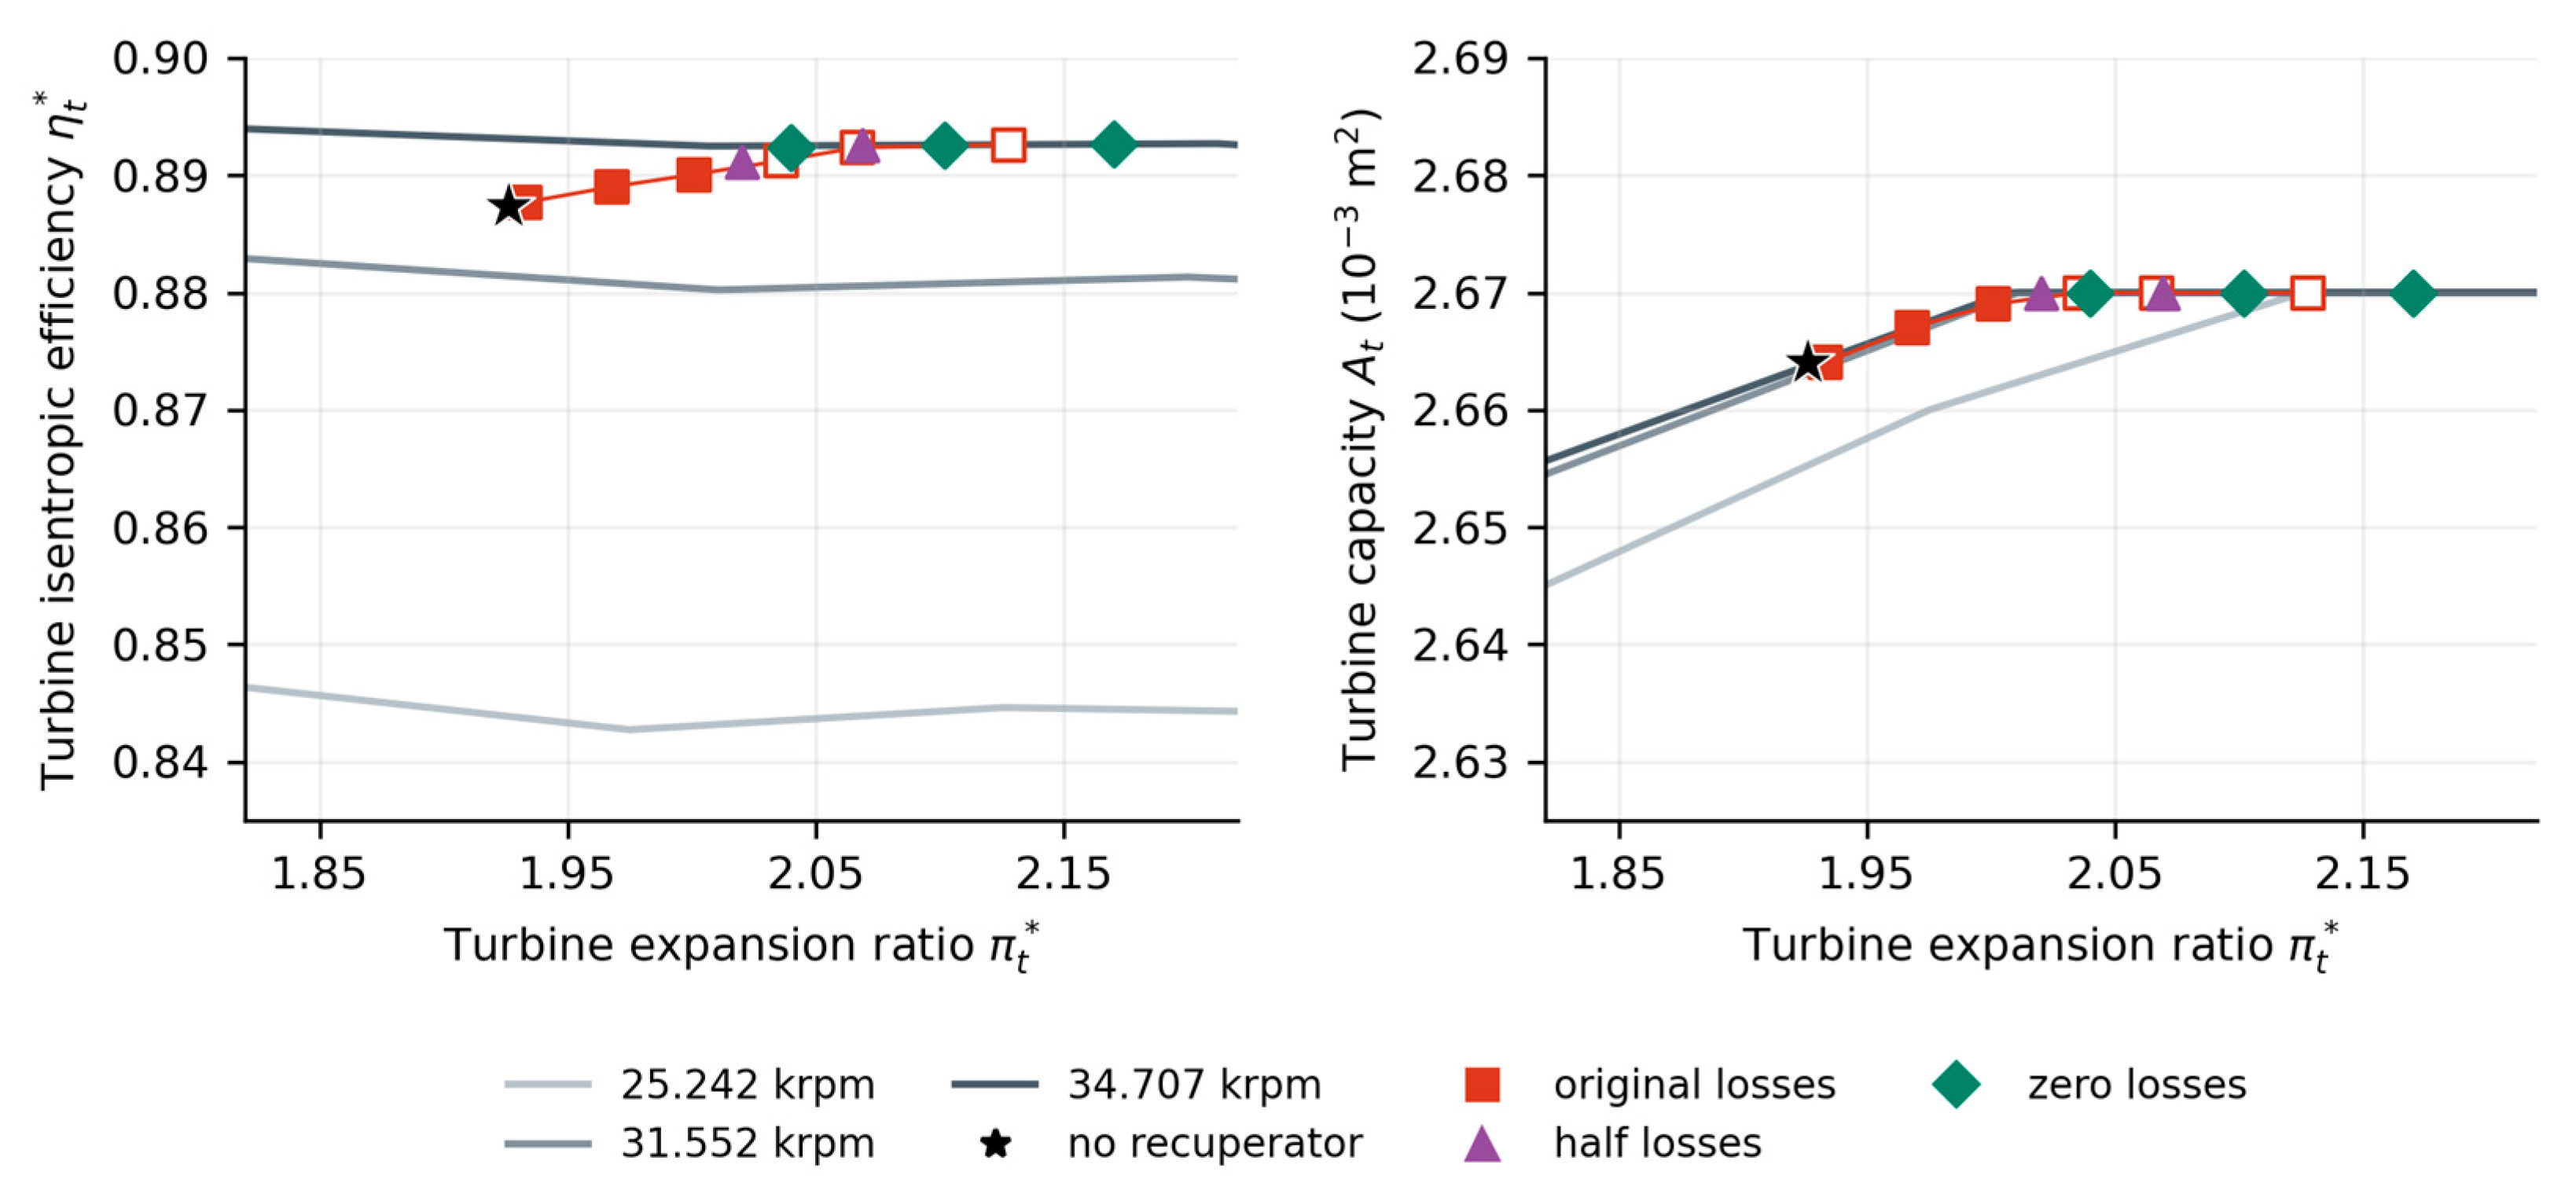
Table 3.
Constant 1000 N thrust with original losses; rows failing K ≥ 10% are numerical continuations.
Table 3.
Constant 1000 N thrust with original losses; rows failing K ≥ 10% are numerical continuations.
| θ | Fuel, kg/h | n, krpm | TIT, K | K, % | M at 1 h, kg |
|---|---|---|---|---|---|
| 0.0 | 120.744 | 67.017 | 1168.67 | 20.116 | 130.744 |
| 0.1 | 117.672 | 68.776 | 1198.78 | 15.972 | 129.632 |
| 0.2 | 114.709 | 70.513 | 1234.38 | 11.284 | 129.179 |
| 0.3 | 111.354 | 72.233 | 1272.25 | 5.856 | 129.144 |
| 0.4 | 108.076 | 74.139 | 1318.58 | -0.809 | 130.436 |
| 0.5 | 104.349 | 76.442 | 1370.83 | -9.020 | 133.359 |
| 0.6 | 114.532 | 81.023 | 1640.45 | -36.897 | 154.092 |
| 0.7 | 119.606 | 82.924 | 1924.51 | -45.356 | 178.316 |
Table 4.
Internal states at constant thrust and original losses.
| Quantity | θ = 0 | θ = 0.2 | θ = 0.4 | θ = 0.5 |
|---|---|---|---|---|
| Cold inlet T*, K | 468.34 | 487.67 | 510.41 | 527.33 |
| Cold outlet T*, K | 468.34 | 602.46 | 757.11 | 846.41 |
| Hot inlet T*, K | 1011.89 | 1061.63 | 1127.17 | 1165.49 |
| Hot outlet T*, K | 1011.89 | 963.08 | 910.53 | 881.52 |
| Cold inlet p*, kPa | 392.945 | 431.708 | 494.514 | 545.294 |
| Nozzle inlet p*, kPa | 193.043 | 192.944 | 192.834 | 192.772 |
| Recovered Q, kW | 0.0 | 206.3 | 466.1 | 620.8 |
| Nozzle velocity, m/s | 576.52 | 562.01 | 545.99 | 536.95 |
Table 6.
Candidate points with K ≥ 10%, their required turbine inlet temperatures and mass allowances before additional installation mass.
Table 6.
Candidate points with K ≥ 10%, their required turbine inlet temperatures and mass allowances before additional installation mass.
| Loss case | θ | K, % | TIT / ΔTIT, K | ΔM at 1 h, kg | tBE, h |
|---|---|---|---|---|---|
| Original | 0.2 | 11.284 | 1234.38 / 65.71 | 1.565 | 0.741 |
| Half | 0.3 | 10.087 | 1246.35 / 77.68 | 4.198 | 0.650 |
| Zero | 0.4 | 12.380 | 1236.09 / 67.42 | 7.716 | 0.616 |
| Zero, near-tie | 0.5 | 10.784 | 1239.97 / 71.30 | 7.715 | 0.711 |
Disclaimer/Publisher’s Note: The statements, opinions and data contained in all publications are solely those of the individual author(s) and contributor(s) and not of MDPI and/or the editor(s). MDPI and/or the editor(s) disclaim responsibility for any injury to people or property resulting from any ideas, methods, instructions or products referred to in the content. |
© 2026 by the authors. Licensee MDPI, Basel, Switzerland. This article is an open access article distributed under the terms and conditions of the Creative Commons Attribution (CC BY) license (http://creativecommons.org/licenses/by/4.0/).
Copyright: This open access article is published under a Creative Commons CC BY 4.0 license, which permit the free download, distribution, and reuse, provided that the author and preprint are cited in any reuse.