

Submitted:
22 October 2026
Posted:
23 October 2026
You are already at the latest version
Abstract
Aviation emits roughly 2–3% of anthropogenic CO2, and demand is projected to grow several-fold by 2050. Because long-haul aircraft cannot be electrified or converted to hydrogen at scale in the near term, drop-in bio-aviation fuels (BAFs; also called sustainable aviation fuels, SAFs) are the only mitigation option compatible with existing engines and airport infrastructure. This review (i) consolidates feedstocks and nine conversion-pathway families (HEFA-SPK, FT-SPK, FT-SPK/A, ATJ-SPK, ATJ-SKA, SIP-SPK, CHJ, HC-HEFA-SPK and HDCJ) into one comparative matrix covering technology readiness level (TRL), blend limit, greenhouse-gas (GHG) abatement and relative cost; (ii) develops a transparent multi-criteria decision-making (MCDM) model, using a weighted-sum model (WSM) and TOPSIS, to rank four dominant pathways under cost-driven, emissions-driven and balanced weightings; (iii) proposes a conceptual integrated biorefinery that shares hydrogen, steam and syngas utilities across HEFA, Fischer–Tropsch and alcohol-to-jet trains; and (iv) summarises life-cycle and techno-economic evidence to quantify the cost-parity gap. HEFA-SPK is the most mature route (TRL 9, abatement up to ∼80%) but is limited by lipid supply, whereas FT-SPK and ATJ-SPK access larger feedstock pools at lower TRL and higher capital cost. Pathway rankings change with stakeholder weighting: HEFA-SPK leads under cost-driven weights, FT-SPK under emissions-driven weights, and the two tie under balanced weights. A research and policy roadmap is outlined.
Keywords:
bio-aviation fuel
; sustainable aviation fuel
; ASTM D7566
; HEFA
; Fischer–Tropsch
; alcohol-to-jet
; life-cycle assessment
; techno-economic analysis
; multi-criteria decision-making
; integrated biorefinery
1. Introduction
Air transport is among the fastest-growing sources of transport demand. Passenger numbers were projected to rise from about 3.8 billion in 2017 to roughly 16 billion by 2050, and aviation already contributes 2–3% of global anthropogenic CO2 [1,2,3,4]. Gas-turbine engines will power most commercial aircraft for decades; battery-electric and hydrogen aircraft are realistic only for short regional missions in the near to medium term [5,6]. Replacing the fuel, rather than the engine, is therefore the main near-term lever. Bio-aviation fuels (also termed SAF, bio-jet or renewable jet fuel) are synthetic paraffinic kerosene (SPK) or blending components made from biomass, waste oils, sugars or alcohols, and are blended into Jet A/A-1 within limits set by ASTM D7566 [7].
Jet fuel must meet tight specifications, namely freezing point below about to −47°C, minimum flash point, controlled aromatics and sulfur, adequate energy density, and full compatibility with existing airframes and distribution systems. These constraints, more than chemistry alone, explain why only a limited number of platforms are certified and why BAF supply is still well below 1% of global jet demand [8,9].
Many reviews already describe feedstocks, pathways and life-cycle performance [7,9,10,11,12,13]. However, they typically present TRL, blend limits, emissions and costs in separate tables, use different system boundaries, and rarely provide a tool for ranking pathways under different stakeholder priorities. This review addresses that gap with four contributions:
2. Policy Context
3. Feedstocks and Conversion Pathways
3.1. Feedstock Generations
Feedstocks are grouped here into four generations and linked to the pathways they feed (Table 2, Figure 1) [12,19,20,21]. First-generation (1-G) oils and sugar crops feed the most mature routes but raise food-versus-fuel and land-use concerns [22]. Second-generation (2-G) wastes and residues avoid most of these concerns but are heterogeneous and costly to collect. Third-generation (3-G) feedstocks (algae, municipal solid waste, industrial off-gases) and fourth-generation (4-G) options (engineered microbes, CO2 plus green H2) offer larger long-term volumes but sit at lower TRL.
3.2. Conversion Platforms
HEFA-SPK hydrotreats triglycerides and free fatty acids (used cooking oil, fats, camelina, jatropha, algal oil) through hydrogenation, deoxygenation (decarboxylation, decarbonylation or hydrodeoxygenation), hydroisomerisation/hydrocracking and fractionation [23??]. It is the only route with substantial commercial history. Its emissions depend strongly on feedstock composition [?].
FT-SPK and FT-SPK/A gasify lignocellulosic biomass or municipal solid waste to syngas, which is cleaned and converted over iron or cobalt catalysts to long-chain paraffins, then hydrocracked to the jet cut [???]. Iron tolerates the low H2:CO ratios of biomass syngas but is less selective to the jet range than cobalt [?]. Adding bio-based aromatics gives FT-SPK/A.
ATJ-SPK and ATJ-SKA convert ethanol or butanols (from sugar, starch, lignocellulosic sugars or gas fermentation) by dehydration, oligomerisation and hydrogenation [??]. Existing ethanol producers can enter the SAF market with relatively low barriers [?].
Other routes are variants of these families: SIP-SPK (direct sugar-to-hydrocarbons via farnesene) [?]; CHJ (hydrothermolysis of triglycerides) [?]; HC-HEFA-SPK (hydrocarbon-rich algal lipids); and HDCJ (fast pyrolysis oil hydrotreated to jet range) [19].
3.3. Consolidated Comparison
Table 3 brings together TRL, blend limit, abatement and relative cost. The TRL values are the author’s qualitative assignments from reported commercialisation status and are indicative only. Abatement and cost entries are literature ranges that depend on feedstock and assumptions (Section 5Section 6). Blend limits follow ASTM D7566 annex limits as commonly reported; HDCJ is not yet blend-certified, and readers should confirm current annex limits before use in regulatory work.
TRL and feedstock flexibility trade off almost monotonically: HEFA-SPK is the most mature but the most feedstock-constrained, while FT and fermentation routes can use larger waste and lignocellulosic pools but trail by one to three TRL steps.
4. Catalysts and Process Studies
Catalyst choice depends on the functional step. Hydrodeoxygenation typically uses Ni, Pt, Pd or sulfided NiMo/CoMo on alumina or zeolite supports at about 300–400 C and 3–10 MPa H2[??]. Isomerisation and cracking use bifunctional Pt/zeolite (e.g., SAPO-11, ZSM-5) catalysts that trade cold-flow improvement against jet-range yield [?]. Fischer–Tropsch synthesis operates at roughly 200–350 °C and 2–3 MPa, with iron favoured for biomass syngas and cobalt where jet selectivity matters [??]. ATJ dehydration and oligomerisation rely on acidic zeolites, whose pore geometry controls oligomer chain length. Numerical studies of kinetics, atomisation and combustion of SAF blends explain trends seen experimentally [??,?], and SAF blending has been shown to reduce particle emissions from aircraft engines at cruise [?]. Closer coupling of experimental catalyst work with kinetic and CFD modelling is a priority.
5. Life-Cycle GHG Performance
Life-cycle assessment (LCA) verifies cradle-to-wake benefits relative to fossil jet, whose intensity is about 88–106 g CO2-eq/MJ [?]. The intensity of a pathway can be written as
where and are the input and emission factor of stage i, is the land-use-change penalty and is the co-product credit. The relative abatement is
Reported examples include 68.8% abatement for algal hydroprocessed jet [?], up to 86% impact reduction through energy-integrated hydrotreatment [?], and up to 95% for optimised waste-based routes [16?]. Figure 2 plots the midpoint and spread used in this review.
Within one pathway, abatement can vary by 15–20 percentage points with feedstock origin (for example, palm oil with indirect land-use risk versus waste cooking oil), collection energy and co-product allocation. Feedstock sourcing is therefore as influential as the choice of conversion chemistry.
6. Techno-Economic Assessment
BAF costs exceed fossil jet because of feedstock cost, hydrogen demand, low utilisation of first-of-a-kind plants and the capital intensity of gasification/FT and fermentation [????]. A simplified minimum fuel selling price is
with the co-product revenue and the annual jet-range volume. Feedstock typically dominates operating cost for hydroprocessing, whereas capital dominates for gasification/FT and fermentation routes [??]. HEFA economics therefore improve mainly through cheaper feedstock (an algae-to-HEFA study reports costs as low as about $4.7 per gallon of gasoline equivalent under optimisation [?]), while FT and ATJ economics improve mainly through scale and capital reduction. Across the nine pathways, costs remain roughly 1.5–5 times fossil jet [8,9,16]. Because the dominant lever differs by pathway, a single technology-neutral incentive is unlikely to work equally well for all routes.
7. Multi-Criteria Pathway Ranking
7.1. Method
Four dominant pathways (HEFA-SPK, FT-SPK, ATJ-SPK, SIP-SPK) were scored 1–9 (9 = most favourable) on five criteria derived from Table 3: technology readiness (), cost (), GHG abatement (), feedstock flexibility () and blend limit () (Table 4). The scores are the author’s judgement and should be tested against expert elicitation in future work. The weighted-sum score is . As a cross-check, the TOPSIS closeness coefficient was computed from vector-normalised, weighted scores. Three weight sets were used: cost-driven , emissions-driven and balanced .
7.2. Results and Discussion
Table 5 shows that no pathway wins under every weighting. HEFA-SPK ranks first under cost-driven weights by both methods. FT-SPK ranks first under emissions-driven weights, with ATJ-SPK second by both methods. Under balanced weights HEFA-SPK and FT-SPK tie on WSM (7.00), and TOPSIS places HEFA-SPK only marginally ahead. SIP-SPK is last in all cases, mainly because of its 10% blend limit. The second-place order under cost-driven weights depends on the method (FT-SPK by WSM, ATJ-SPK by TOPSIS), so the two are close. These results explain why different stakeholders favour different pathways from the same evidence. They also suggest that incentives rewarding abatement and feedstock diversity, not cost alone, would help diversify supply away from HEFA-only dependence.
8. Conceptual Integrated Biorefinery
Capital cost is the main barrier for FT, ATJ and SIP routes. Co-locating trains to share utilities has been suggested in the literature [?], but rarely specified. Figure 3 proposes a site in which HEFA, gasification/FT and ATJ trains share three capital-intensive systems: hydrogen production and purification, a steam and power island, and syngas/CO2 conditioning. Expected benefits are (i) avoided duplicate hydrogen capacity, since light gases from FT can be reformed to supply HEFA hydrogen demand; (ii) better utilisation of steam and power across trains with complementary duty cycles; and (iii) the ability to process lipids, lignocellulosics and sugars at one site, easing the lipid-supply limit on HEFA. This remains a concept: site-specific techno-economic and pinch analysis are needed to quantify real savings.
9. Challenges and Outlook
9.1. SWOT Synthesis
Strengths: drop-in compatibility, up to about 80% lower life-cycle GHG, lower sulfur and particulates, diverse feedstocks. Weaknesses: cost of 1.5–5× fossil jet, lipid-constrained supply for HEFA, lower TRL for flexible-feedstock routes. Opportunities: stronger mandates and credits, waste and algal feedstocks, integrated biorefineries, gas fermentation of industrial CO2. Threats: land-use and biodiversity impacts, food competition for 1-G feedstocks, policy fragmentation, demand outpacing supply growth [12,14???].
9.2. Research and Policy Priorities
Five priorities follow from this analysis: (1) diversify feedstocks beyond waste lipids, with feedstock-specific LCA; (2) develop more selective, lower-cost FT and ATJ catalysts to close the TRL gap; (3) validate shared-utility biorefineries through techno-economic and pinch analysis; (4) extend the MCDM model with region-specific weights, expert-elicited scores and uncertainty analysis; and (5) harmonise mandates, credits and certification across jurisdictions.
10. Conclusions
HEFA-SPK is the most mature and lowest-risk pathway, with abatement up to about 80%, but its dependence on waste lipids limits volume. FT-SPK, ATJ-SPK and related routes can access far larger feedstock pools but lag in TRL and carry higher capital cost. The MCDM analysis shows that the preferred pathway depends on stakeholder priorities: HEFA-SPK under cost-driven weights, FT-SPK under emissions-driven weights, and a near-tie under balanced weights. Policies that reward only cost or volume may entrench HEFA-only supply, whereas incentives tied to abatement and feedstock diversification should favour the FT and ATJ capacity needed for 2050 demand. Reaching cost parity at scale will require simultaneous progress on feedstocks, catalysts, capital reduction through integrated biorefining, and harmonised policy. The TRL, cost and MCDM scores here are qualitative and should be refined with primary data.
Author Contributions
Conceptualization, methodology, formal analysis, writing—original draft preparation, writing—review and editing: D.S.S. The author has read and agreed to the published version of the manuscript.
Funding
This research received no external funding.
Conflicts of Interest
The author declares no conflict of interest.
Abbreviations
The following abbreviations are used in this manuscript:
| ATJ | Alcohol-to-jet |
| BAF/SAF | Bio-aviation / sustainable aviation fuel |
| CHJ | Catalytic hydrothermolysis jet |
| FT | Fischer–Tropsch |
| HDCJ | Hydrotreated depolymerised cellulosic jet |
| HEFA | Hydroprocessed esters and fatty acids |
| LCA | Life-cycle assessment |
| MCDM | Multi-criteria decision-making |
| MFSP | Minimum fuel selling price |
| SIP | Synthesised iso-paraffins |
| SPK | Synthetic paraffinic kerosene |
| TOPSIS | Technique for order preference by similarity to ideal solution |
| TRL | Technology readiness level |
| WSM | Weighted-sum model |
References
- Mazıoğlu, V.; Güngör, H. An Examination of the Sustainability Activities of Global Airline Collaborations within the Scope of IATA’s Sustainability Goals. J. Aviat. 2024, 8, 288–304. [Google Scholar] [CrossRef]
- Macintosh, A.; Wallace, L. International aviation emissions to 2025: Can emissions be stabilised without restricting demand? Energy Policy 2009, 37, 264–273. [Google Scholar] [CrossRef] [PubMed]
- Staples, M.D.; Malina, R.; Suresh, P.; Hileman, J.I.; Barrett, S.R.H. Aviation CO2 emissions reductions from the use of alternative jet fuels. Energy Policy 2018, 114, 342–354. [Google Scholar] [CrossRef]
- Gössling, S.; Humpe, A. The global scale, distribution and growth of aviation: Implications for climate change. Glob. Environ. Change 2020, 65, 102194. [Google Scholar] [CrossRef] [PubMed]
- Hileman, J.I.; De la Rosa Blanco, E.; Bonnefoy, P.A.; Carter, N.A. The carbon dioxide challenge facing aviation. Prog. Aerosp. Sci. 2013, 63, 84–95. [Google Scholar] [CrossRef]
- Jensen, L.L.; Bonnefoy, P.A.; Hileman, J.I.; Fitzgerald, J.T. The carbon dioxide challenge facing U.S. aviation and paths to achieve net zero emissions by 2050. Prog. Aerosp. Sci. 2023, 141, 100921. [Google Scholar] [CrossRef]
- Gutiérrez-Antonio, C.; Gómez-Castro, F.I.; de Lira-Flores, J.A.; Hernández, S. A review on the production processes of renewable jet fuel. Renew. Sustain. Energy Rev. 2017, 79, 709–729. [Google Scholar] [CrossRef]
- Watson, M.J.; et al. Sustainable aviation fuel technologies, costs, emissions, policies, and markets: A critical review. J. Clean. Prod. 2024, 449, 141472. [Google Scholar] [CrossRef]
- Yadav, P.; Dixit, Y.; Sharma, A.K. Current Technological Status and Future Prospect of Biojet Fuel Production; 2024; pp. 229–272. [Google Scholar]
- Wang, M.; et al. Biomass-derived aviation fuels: Challenges and perspective. Prog. Energy Combust. Sci. 2019, 74, 31–49. [Google Scholar] [CrossRef]
- Qasem, N.A.A.; et al. A recent review of aviation fuels and sustainable aviation fuels. J. Therm. Anal. Calorim. 2024, 149, 4287–4312. [Google Scholar] [CrossRef]
- Doliente, S.S.; Narayan, A.; Tapia, J.F.D.; Samsatli, N.J.; Zhao, Y.; Samsatli, S. Bio-aviation Fuel: A Comprehensive Review and Analysis of the Supply Chain Components. Front. Energy Res. 2020, 8, 110. [Google Scholar] [CrossRef]
- Jiang, Y.; Seiple, T.; Pierobon, F.; et al. Feedstocks and Processes for Global-Scale Sustainable Aviation Fuel Production. Nat. Rev. Clean Technol. 2026, 2, 554–570. [Google Scholar] [CrossRef]
- Gegg, P.; Budd, L.; Ison, S. The market development of aviation biofuel: Drivers and constraints. J. Air Transp. Manag. 2014, 39, 34–40. [Google Scholar] [CrossRef]
- Mawhood, R.; Gazis, E.; de Jong, S.; Hoefnagels, R.; Slade, R. Production pathways for renewable jet fuel: a review of commercialization status and future prospects. Biofuels Bioprod. Biorefin. 2016, 10, 462–484. [Google Scholar] [CrossRef]
- Shahriar, M.F.; Khanal, A. The current techno-economic, environmental, policy status and perspectives of sustainable aviation fuel (SAF). Fuel 2022, 325, 124905. [Google Scholar] [CrossRef]
- Lau, J.I.C.; et al. Emerging technologies, policies and challenges toward implementing sustainable aviation fuel (SAF). Biomass Bioenergy 2024, 186, 107277. [Google Scholar] [CrossRef]
- Cantarella, H.; Nassar, A.M.; Cortez, L.A.B.; Baldassin, R. Potential feedstock for renewable aviation fuel in Brazil. Environ. Dev. 2015, 15, 52–63. [Google Scholar] [CrossRef]
- Wang, W.-C.; Tao, L. Bio-jet fuel conversion technologies. Renew. Sustain. Energy Rev. 2016, 53, 801–822. [Google Scholar] [CrossRef]
- Yilmaz, N.; Atmanli, A. Sustainable alternative fuels in aviation. Energy 2017, 140, 1378–1386. [Google Scholar] [CrossRef]
- Yang, J.; Xin, Z.; He, Q.; Corscadden, K.; Niu, H. An overview on performance characteristics of bio-jet fuels. Biofuel 2019, 237, 916–936. [Google Scholar] [CrossRef]
- Vijay, V.; Pimm, S.L.; Jenkins, C.N.; Smith, S.J. The Impacts of Oil Palm on Recent Deforestation and Biodiversity Loss. PLoS ONE 2016, 11, e0159668. [Google Scholar] [CrossRef] [PubMed]
- Song, M.; et al. Hydroprocessing of lipids: An effective production process for sustainable aviation fuel. Energy 2023, 283, 129107. [Google Scholar] [CrossRef]
Figure 1.
Mapping of feedstock generations to conversion chemistries and certified product families.
Figure 1.
Mapping of feedstock generations to conversion chemistries and certified product families.
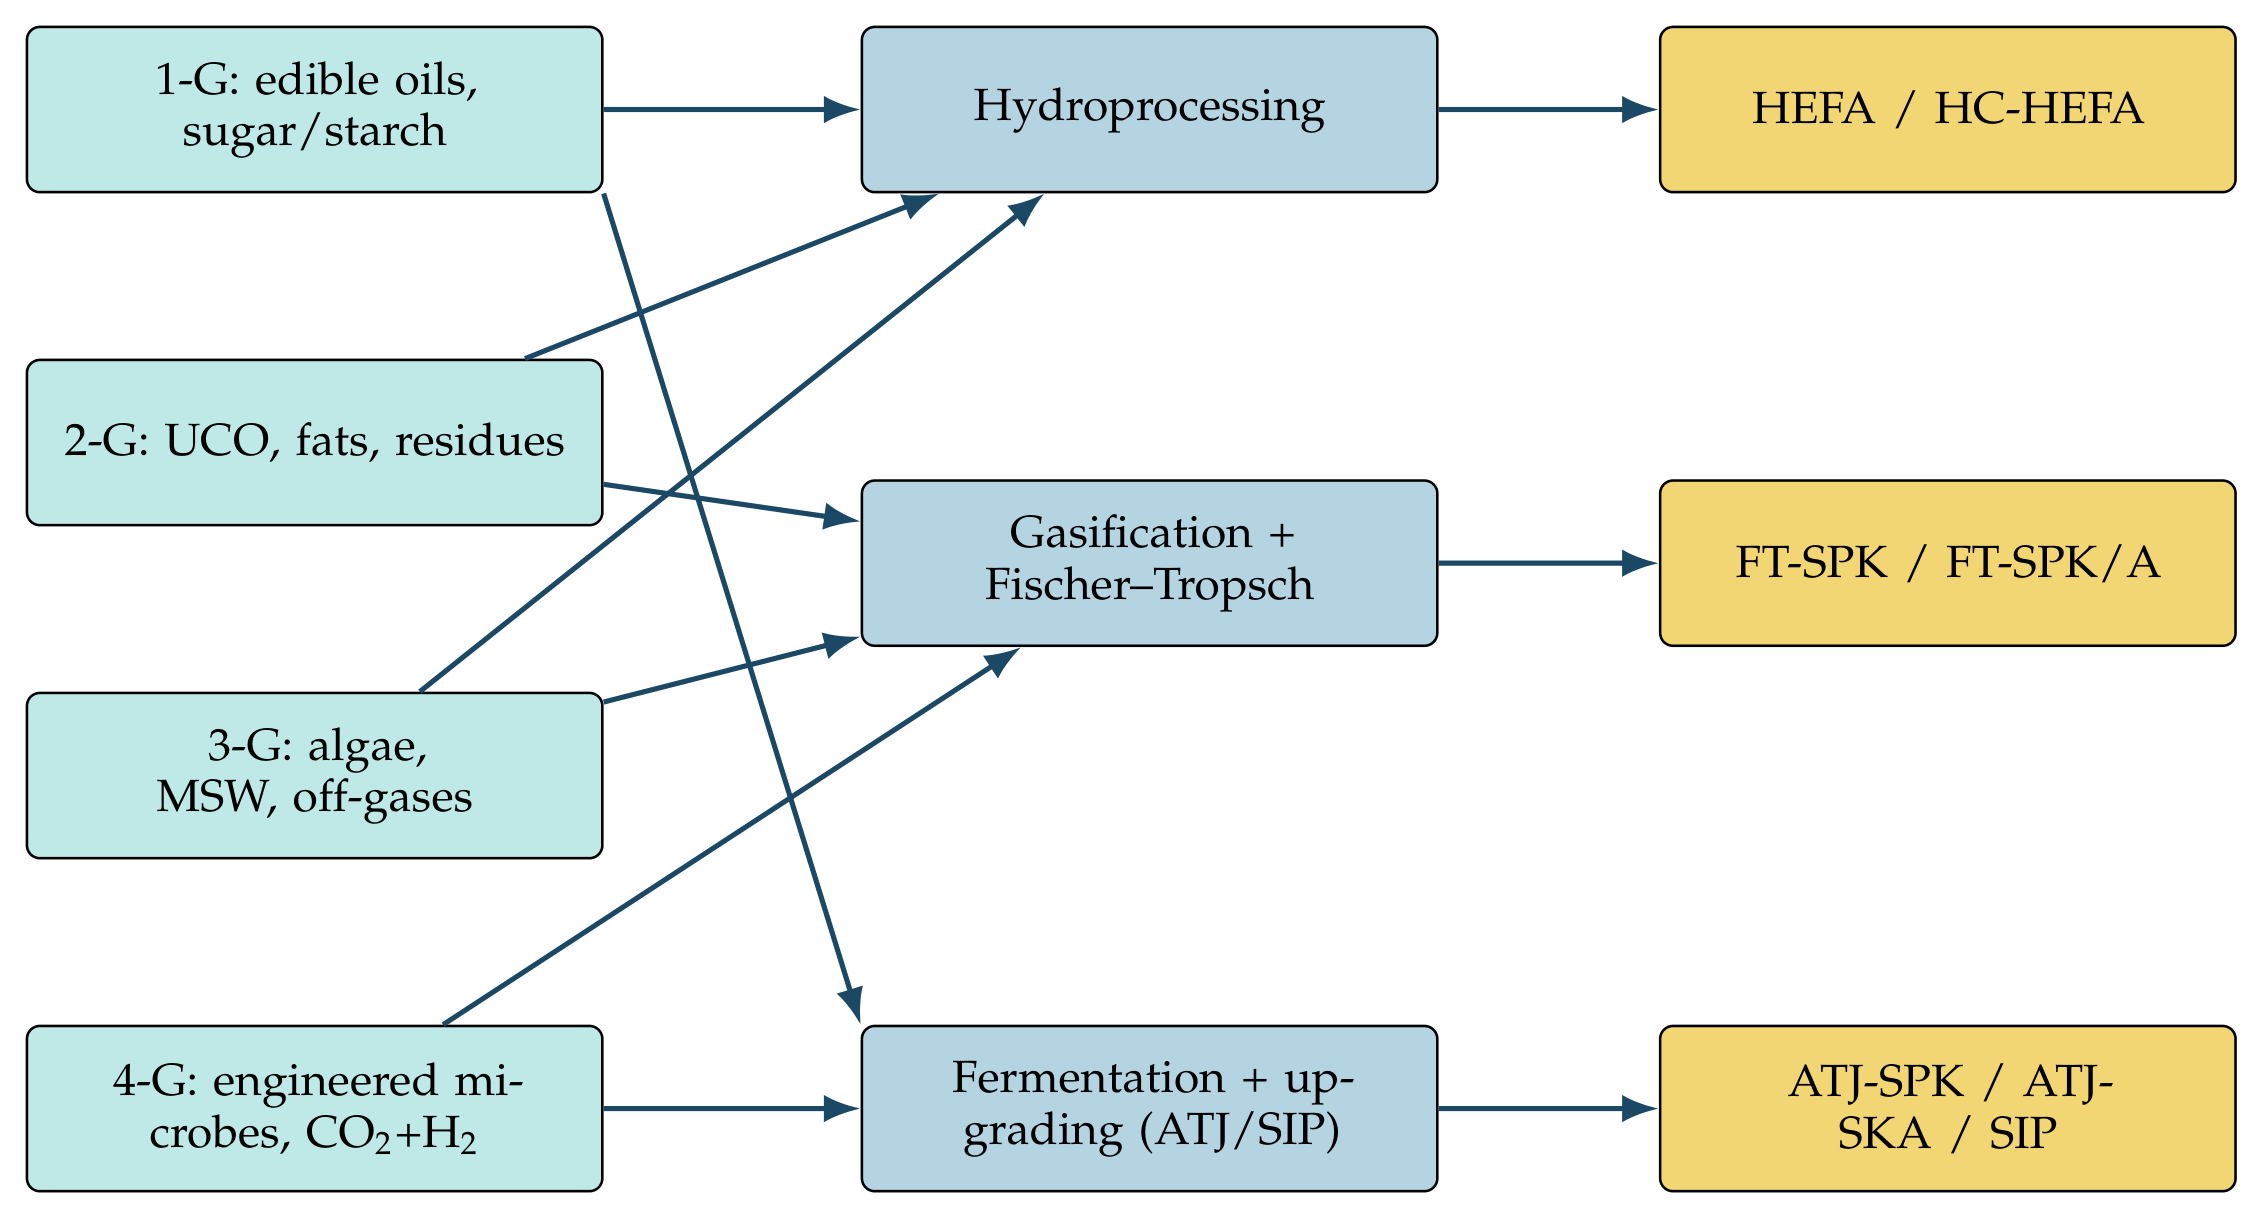
Figure 2.
Midpoint and spread of reported life-cycle GHG abatement by pathway (derived from [8,16?????]; ranges for CHJ, HC-HEFA and HDCJ are inferred by analogy).
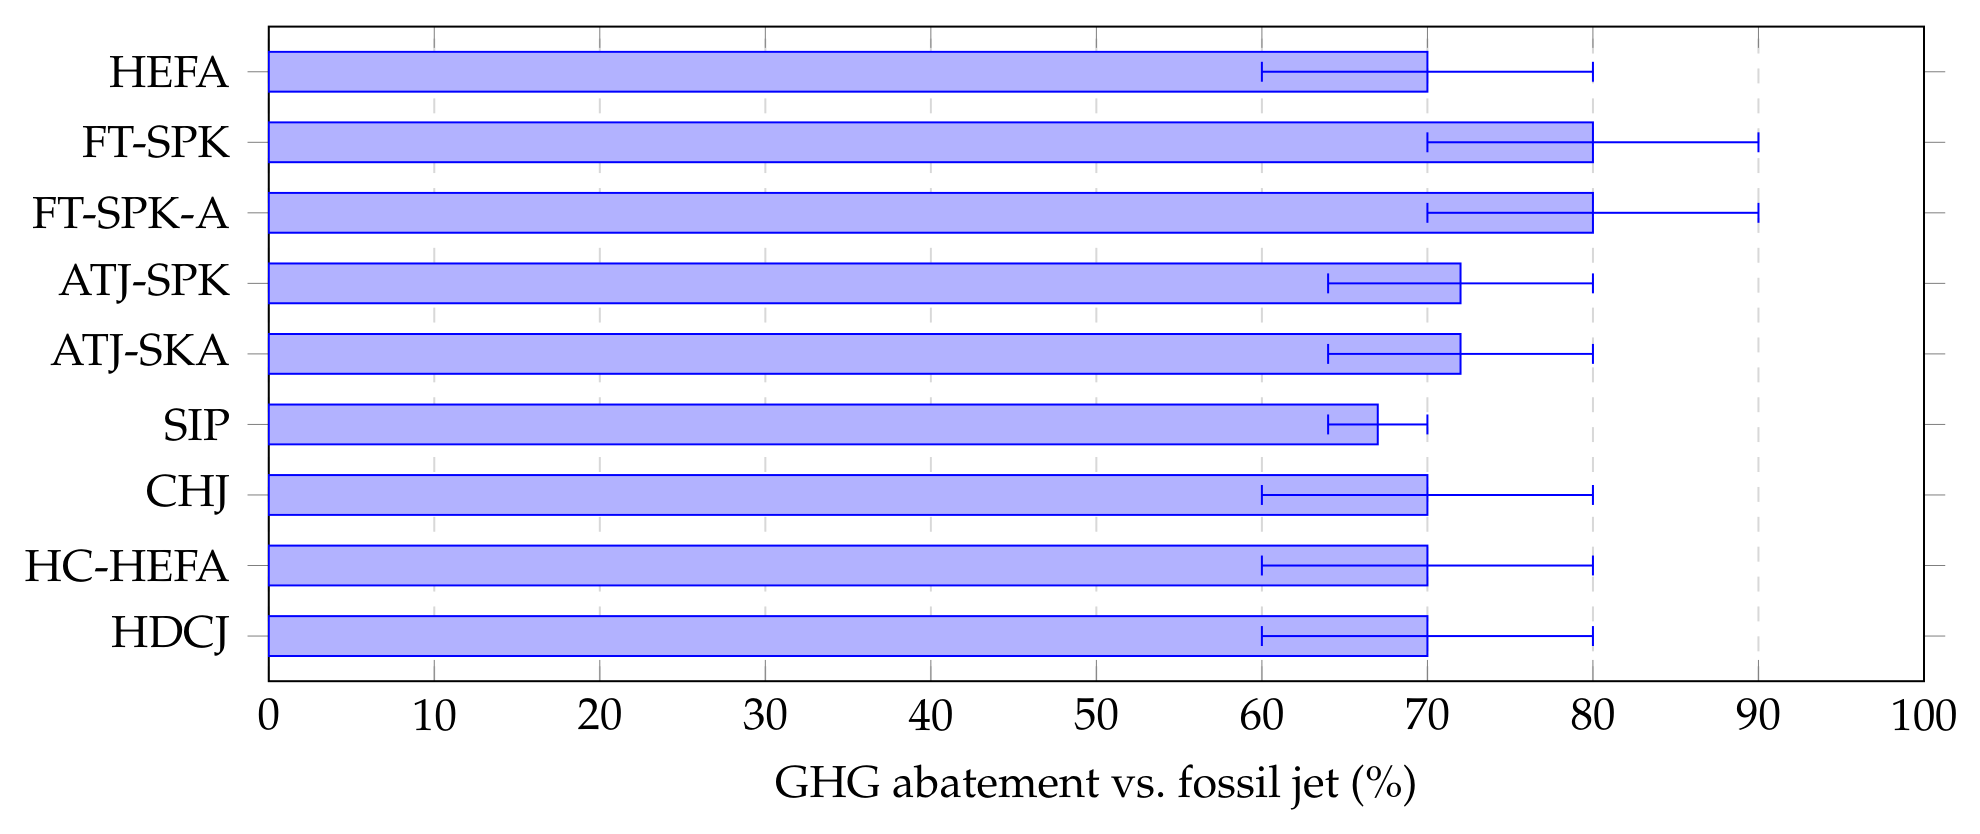
Figure 3.
Conceptual multi-pathway biorefinery sharing hydrogen, steam/power and syngas-conditioning systems.
Figure 3.
Conceptual multi-pathway biorefinery sharing hydrogen, steam/power and syngas-conditioning systems.
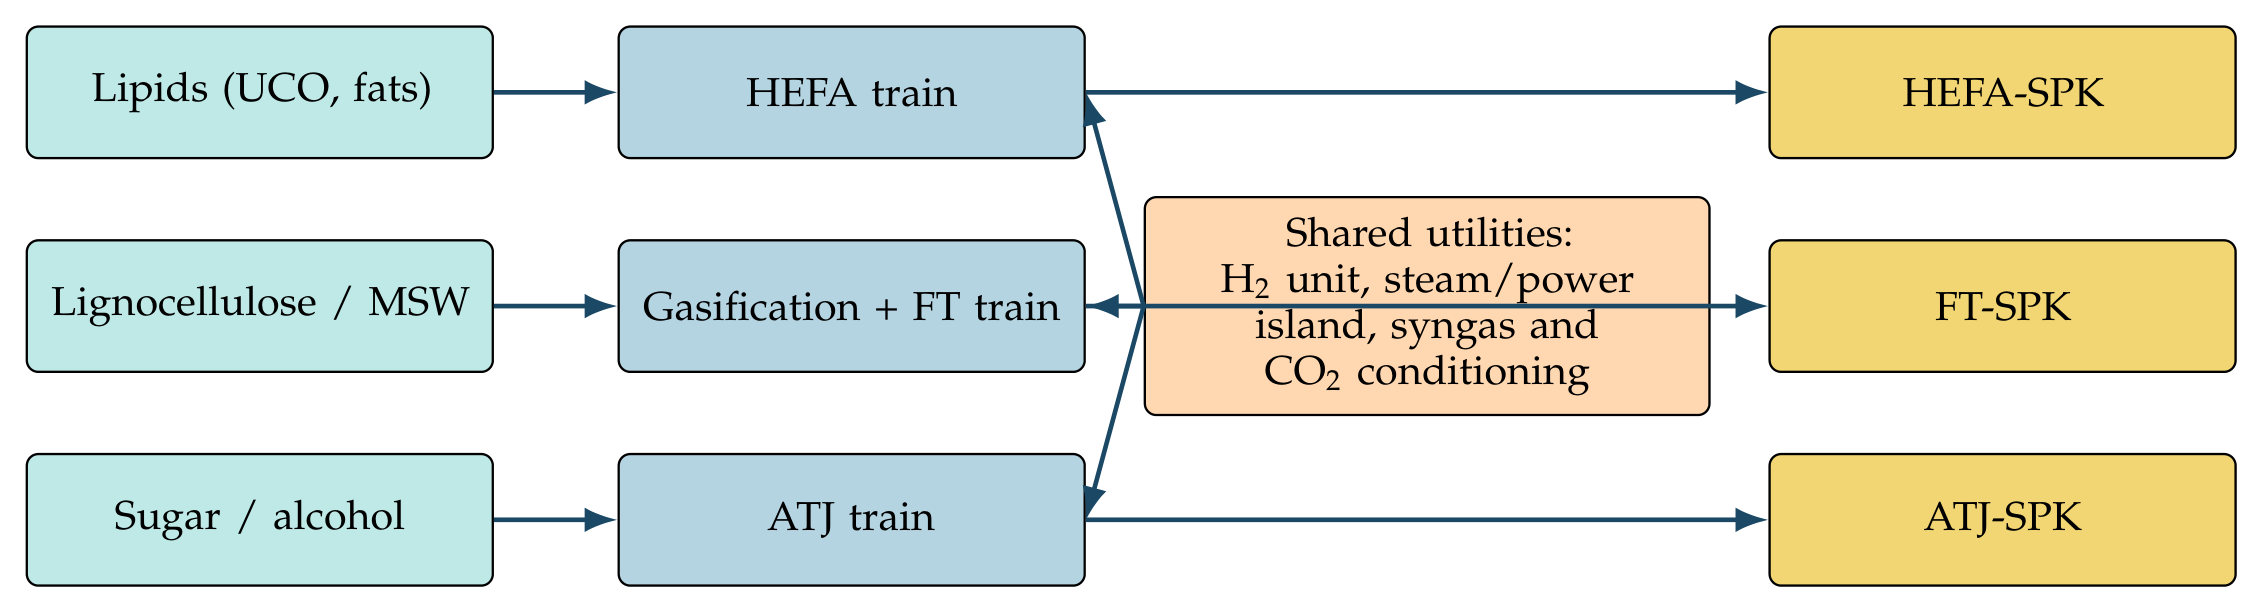

Table 1.
Major regional instruments supporting SAF deployment.
| Jurisdiction | Instrument | Mechanism / notable feature |
|---|---|---|
| European Union | RED II/III; ReFuelEU Aviation | Rising SAF blending quotas at EU airports; sub-mandate for synthetic fuels |
| United States | ASTM D1655/D7566; RFS2; SAF tax credit | Fuel certification plus demand pull; credit value scales with life-cycle GHG reduction |
| ICAO (global) | CORSIA | Eligible SAF reduces offsetting obligations of airlines on international flights |
| Brazil | National feedstock strategy | Mapping and incentives favouring sugarcane and residue feedstocks [18] |
Table 2.
Feedstock generations, key concerns and pathways fed.
| Gen. | Representative feedstocks | Main concern | Pathways fed |
|---|---|---|---|
| 1-G | Edible oils, sugarcane, corn | Food competition; land-use change | HEFA, ATJ, SIP |
| 2-G | Used cooking oil, tallow, agricultural/forestry residues | Heterogeneity; logistics | HEFA, FT, ATJ, HDCJ |
| 3-G | Algae, municipal solid waste, CO/CO2 off-gases | Cultivation and collection cost | HEFA, FT, ATJ (gas fermentation) |
| 4-G | Engineered microbes, CO2 + green H2 | Scale-up risk; electricity demand | Emerging FT (e-fuel), novel ATJ |
Table 3.
Comparison of the nine pathway families.
| Pathway | Main feedstock | TRLa | Blend (vol.%) | GHG abatement | Cost vs. fossil jet |
|---|---|---|---|---|---|
| HEFA-SPK | UCO, fats, vegetable/algal oil | 9 | 50 | up to 80% | 1.5–3× |
| FT-SPK | Lignocellulose, MSW | 8 | 50 | 70–90% | 2–4× |
| FT-SPK/A | Biomass + bio-aromatics | 7 | 50 | 70–90% | 2–4× |
| ATJ-SPK | Sugar/starch/lignocellulosic alcohols | 7–8 | 50 | up to 80% | 2–3× |
| ATJ-SKA | As ATJ + aromatics | 6–7 | 50 | up to 80% | 2–3× |
| SIP-SPK | Sugars (farnesene) | 6–7 | 10 | 65–70% | 2–3.5× |
| CHJ | Triglycerides | 5–6 | 50 | 60–80%b | 2–4× |
| HC-HEFA-SPK | Algal lipids | 5 | 10 | up to 80%b | 3–5× |
| HDCJ | Pyrolysis oil | 4–5 | n/ac | 60–80%b | 3–5× |
Table 4.
Criterion scores (1–9) used in the MCDM analysis.
| Pathway | TRL | Cost | GHG | Feedstock | Blend |
|---|---|---|---|---|---|
| HEFA-SPK | 9 | 7 | 7 | 4 | 8 |
| FT-SPK | 7 | 4 | 8 | 8 | 8 |
| ATJ-SPK | 6 | 5 | 7 | 7 | 8 |
| SIP-SPK | 5 | 4 | 6 | 6 | 3 |
Table 5.
WSM score (rank) and TOPSIS closeness (rank) by scenario.
| Cost-driven | Emissions-driven | Balanced | ||||
|---|---|---|---|---|---|---|
| Pathway | ||||||
| HEFA-SPK | 7.00 (1) | 0.739 (1) | 6.75 (3) | 0.515 (3) | 7.00 (1=) | 0.631 (1) |
| FT-SPK | 6.25 (2) | 0.393 (3) | 7.50 (1) | 0.763 (1) | 7.00 (1=) | 0.612 (2) |
| ATJ-SPK | 6.20 (3) | 0.470 (2) | 6.85 (2) | 0.630 (2) | 6.60 (3) | 0.590 (3) |
| SIP-SPK | 4.60 (4) | 0.144 (4) | 5.25 (4) | 0.242 (4) | 4.80 (4) | 0.211 (4) |
Disclaimer/Publisher’s Note: The statements, opinions and data contained in all publications are solely those of the individual author(s) and contributor(s) and not of MDPI and/or the editor(s). MDPI and/or the editor(s) disclaim responsibility for any injury to people or property resulting from any ideas, methods, instructions or products referred to in the content. |
© 2026 by the authors. Licensee MDPI, Basel, Switzerland. This article is an open access article distributed under the terms and conditions of the Creative Commons Attribution (CC BY) license (http://creativecommons.org/licenses/by/4.0/).
Copyright: This open access article is published under a Creative Commons CC BY 4.0 license, which permit the free download, distribution, and reuse, provided that the author and preprint are cited in any reuse.