

Submitted:
21 October 2026
Posted:
23 October 2026
You are already at the latest version
Abstract
Reliable evaluation of membranes for hypersaline desalination requires an integrated assessment of selectivity, transport behaviour and operational stability. This study develops a four-test diagnostic framework combining water-activity calculations, permeate ionic ratios, final-period flux analysis, and hydraulic and thermal characterisation. The framework is applied to electrospun polystyrene (PS), PS membranes containing polytetrafluoroethylene (PTFE) particles, and commercial PTFE and polyethylene membranes in direct contact membrane distillation of synthetic brines containing 37.8 and 75.7 g L⁻¹ total dissolved solids. Water-activity calculations establish a predicted salinity-related flux reduction of 2.5–5% under the assumed membrane-surface conditions, providing a baseline for interpreting measured flux ratios and temporal behaviour. Final-period analysis resolves start-up effects, yielding commercial PTFE C1/C2 flux ratios of 0.47–0.84. Most PS specimens exhibit low permeate ionic concentrations and chloride-based apparent rejection of 99.987–99.9975%, whereas feed-like ionic ratios in commercial PTFE permeates indicate liquid-feed carryover. Flux–flow exponents of 0.33–0.35 highlight the contribution of external heat transfer. Water-breakthrough pressures of 1.7–7.0 psi and a storage-modulus decrease at 35–55 °C identify priorities for reinforcement and thermal stabilisation. The framework connects separation performance with operating constraints, supports meaningful membrane comparisons, and guides the development of reproducible PS membranes with high selectivity and improved operational robustness.
Keywords:
membrane distillation
; electrospinning
; polystyrene
; pore wetting
; liquid leakage
; water activity
; hypersaline brine
; temperature polarisation
; water-breakthrough pressure
; selective separation
1. Introduction
Membrane distillation (MD) separates water from non-volatile solutes by vapour transport through a hydrophobic microporous membrane, driven by a transmembrane water-vapour partial-pressure difference [1,2,3]. High salt rejection requires the pores to remain unwetted and the membrane and seals to remain intact. Compared with pressure-driven desalination, MD can accommodate concentrated feeds, although its flux remains sensitive to water activity, temperature and concentration polarisation, and deposition [1,4]. Recent studies consider MD for brine concentration and integration with crystallisation or freeze desalination [5,6,7]. These applications require reliable discrimination between vapour transport and liquid-feed carryover through wetted pores, defects or external bypass pathways [8,9,10].
Electrospun nanofibrous membranes offer high porosity, interconnected pores and tunable fibre diameter, and they are widely studied for MD [11,12,13]. Their weaknesses are equally well established: low mechanical strength, a low LEP when fibre packing is loose, and the need for post-treatment to consolidate the mat [5]. Polystyrene (PS) is an inexpensive, intrinsically hydrophobic polymer that forms rough, highly water-repellent electrospun mats [13], and it is widely available as a waste feedstock: expanded-PS waste has been electrospun into DCMD membranes with salt rejection above 98% [14]. Low-surface-energy particles or secondary roughness raise contact angles further [15]. Electrospun mats are, however, mechanically weak, and their pore structure is altered by the pressing steps used to consolidate them [12,16,17]. Our group has developed PS-based membranes within a broader programme on DCMD energy efficiency [18], molecular simulation of fibrous membranes [19], activated carbon-doped PS bilayers [20], and the treatment of synthetic Qatari brines with PS and commercial polyethylene (PE) membranes [17,21,22].
Descriptor-based benchmarking has been proposed to characterise polymeric-membrane stability in hypersaline DCMD, together with a minimum set of reporting criteria for durability assessment [23]. Interpretation of such descriptors requires flux and rejection measurements that adequately distinguish membrane behaviour from operating and analytical effects. Norouzi et al. [7] separated vapour-pressure-driven flux decline from crystal-induced pore blockage in concentrated NaCl solutions approaching saturation. In short screening experiments, start-up transients, unmatched hydrodynamic conditions and background ions can further complicate interpretation. Online methods, including impedance spectroscopy, can detect incipient wetting [8,10], but are not routinely available in all MD laboratories. The present contribution integrates established thermodynamic, analytical, temporal and mechanical diagnostics into a screening workflow and applies them jointly to PS-based membranes. It complements existing wetting and transport analyses rather than introducing the distinction between liquid and vapour transport as a new concept (Section 3.7).
This study develops a four-test diagnostic framework (Figure 1) for electrospun PS and PS–PTFE membranes and commercial PTFE and PE reference membranes tested in the same bench-scale DCMD system. The framework comprises: (T1) comparison of measured salinity-dependent flux ratios with a water-activity-based prediction; (T2) comparison of permeate and feed ionic ratios; (T3) assessment of final-period flux, transients and drift; and (T4) evaluation of hydraulic and thermal constraints using water-breakthrough pressure, dynamic mechanical analysis and flux–flow scaling. The objective is to identify departures from the assumptions underlying membrane comparisons and to define the evidence needed to assess selectivity, reproducibility and operating limits.
2. Materials and Methods
2.1. Membranes
Electrospun PS membranes PS-12 to PS-23 were prepared by dissolving 20.0 g of PS (Mw 159,000; Sigma-Aldrich) in 60 mL of N,N-dimethylformamide (DMF) and 40 mL of acetone, and electrospinning 10 mL of solution at 20 kV, a needle–collector distance of 17 cm, 6 mL h−1 and a drum speed of 560 rpm. PTFE particles (primary size 0.3 µm) were dispersed in the solution at 0.10 g (PS-15 to PS-17; 0.5 wt% of solids) or 1.0 g (PS-21 to PS-23; 4.8 wt%) per 20 g of PS; PS-12 to PS-14 contained no PTFE. A second series containing 0.3, 5.0 or 7.0 µm PTFE particles, consolidated from 3–4 layers under 8 t, was used for water-breakthrough-pressure and contact-angle measurements. Membranes PS-Q1, PS-Q2, PS-MA and PS-MB were electrospun from PS (Mv 192,000) at 14 kV, 15 cm, 6 mL h−1 and 560 rpm and cold-pressed at 1 t, as described in [21,23]. The commercial references were a PTFE flat-sheet membrane (Sterlitech, USA; 73–103 µm [23]) and a PE flat-sheet membrane (Aquastill, the Netherlands; 15.5 µm [22]). Membrane properties are summarised in Table 1.
The prefix PS denotes the polystyrene matrix, and numerical suffixes identify specimens rather than concentrations or dimensions. PS-12–PS-14 contain no PTFE, PS-15–PS-17 contain 0.5 wt% PTFE, and PS-21–PS-23 contain 4.8 wt% PTFE, relative to total polymer–particle solids. PS-Q1 and PS-Q2 identify the additional specimens used for flux–time measurements; PS-MA and PS-MB identify those used for permeate ionic analysis. The separate consolidated series is distinguished by PTFE particle size (0.3, 5.0 or 7.0 µm) or absence of particles. A and B denote independent test series on separate specimens, while C1 and C2 denote feed solutions (Section 2.2). Commercial PTFE and PE designate the reference membranes.
2.2. Feed Solutions
Two synthetic brines representative of thermal-desalination reject in Qatar were prepared using the salt formulation reported in [22] (Table 2). The formulation includes CaCl2·2H2O, KCl, MgCl2, NaCl, MgSO4·7H2O, KBr, SrCl2 and boric acid. The nominal TDS concentrations of C1 and C2 are 75,678 and 37,836 mg L⁻¹, respectively; C2 represents approximately a twofold dilution of C1. Their reported conductivities are 100 and 50 mS cm−1. For the water-activity calculation, these TDS concentrations were converted to mass-based salinities of 71.9 and 36.9 g kg−1 using assumed seawater-type solution densities of 1.053 and 1.026 kg L⁻¹. The seawater correlation is used as an approximation for these multicomponent synthetic brines.
2.3. DCMD Testing
Tests were carried out in a counter-current flat-sheet DCMD cell (Sterlitech) with an active area of 20.6 cm2 and feed and permeate inlet temperatures of 70 and 20 °C. Pump settings of 5, 10, 50, 100 and 150 rpm delivered 0.03, 0.04, 0.6, 1.3 and 1.84 L min−1. The principal PS flux experiments were conducted at 0.03 L min−1, at which the reported transmembrane hydraulic pressure in this cell is 0.13–0.52 psi [23]. The additional PS-14 permeate sample obtained at 0.6 L min−1 is identified separately in Table S4. Each run lasted 2 h, and the permeate mass was logged every 30 s. The flux was calculated as
where Δm is the permeate mass gain (kg) over the interval Δt (h), ρw = 1 kg L⁻¹ and A is the membrane area (m2), giving J in L m⁻² h⁻¹ (LMH). Two independent test series (A and B) were performed on separate membrane specimens of the PS-12–PS-23 membranes.
J = Δm / (ρw A Δt)
2.4. Characterisation
Fibre diameters were measured at four locations per membrane from SEM images (FEI; gold-coated samples). Contact angles were measured by the sessile-drop method and thickness by digital micrometer (0.001 mm resolution). Permeate ions were determined by ion chromatography (IC; Metrohm 850 Professional IC) with conductivity detection. Anions were separated on a Metrosep A Supp 5-150/4.0 column (3.2 mmol L−1 Na2CO3/1.0 mmol L−1 NaHCO3, 0.70 mL min−1) and cations on a Metrosep C 4-150/4.0 column (1.7 mmol L−1 HNO3/0.7 mmol L−1 dipicolinic acid, 0.90 mL min−1), with 3–6-point calibrations. Dynamic mechanical analysis (DMA) was performed in tension on a TA Instruments RSA-G2 from room temperature to 120 °C at 5 °C min−1. The critical water-breakthrough pressure of the consolidated PS membranes was determined using the procedure described by Santoro et al. [36]. The membrane was mounted in a chamber containing 200 mL of deionised water at 20 °C. Nitrogen pressure was increased in 0.1 bar increments, with each increment held for 10 min, until water first passed through the membrane. The pressure at this endpoint is reported as the breakthrough pressure. Water passage alone does not distinguish capillary pore intrusion from physical rupture or seal leakage; consequently, these measurements are not interpreted as independent measurements of mechanical burst strength. The 0.1 bar pressure increment corresponds to approximately 1.45 psi and limits the resolution of the reported thresholds.
2.5. Diagnostic Tests
T1—thermodynamic salinity test. For a given membrane and hydrodynamic condition, the membrane distillation coefficient is independent of feed salinity to first order. The flux ratio between feeds C1 and C2 therefore follows the ratio of the transmembrane vapour-pressure differences [3,24]. The vapour pressure of pure water was calculated with the Hyland–Wexler form used by Nayar et al. [25]:
with a1 = −5.8002206×10³, a2 = 1.3914993, a3 = −4.8640239×10⁻², a4 = 4.1764768×10⁻⁵, a5 = −1.4452093×10⁻⁸ and a6 = 6.5459673, with T in K and pw in Pa (31.20 kPa at 70 °C). The water activity of the brine was obtained from the correlation of Nayar et al. [25], valid to 160 g kg−1:
where S is the absolute salinity (g kg−1). The expected flux ratio is
where Tfm and Tpm are the feed-side and permeate-side membrane-surface temperatures, respectively. Evaluating Φth over 50 ≤ Tfm ≤ 70 °C, 20 ≤ Tpm ≤ 35 °C and concentration-polarisation factors of 1.0–1.1 [26] gives a predicted interval of 0.952–0.975. This interval assumes comparable membrane transport coefficients, surface-temperature conditions and polarisation factors for the paired feeds. Departures indicate that these assumptions, or other operating or structural conditions, differ between runs; they do not uniquely identify a failure mechanism.
ln pw = a1/T + a2 + a3T + a4T2 + a5T3 + a6 ln T
aw = exp(−4.5818×10⁻⁴ S − 2.0443×10⁻⁶ S2)
Φth = JC1/JC2 = [aw(S1) pw(Tfm) − pw(Tpm)] / [aw(S2) pw(Tfm) − pw(Tpm)]
T2 — feed-signature test. Liquid-feed carryover through wetted pores, membrane defects or module bypass pathways may introduce ions into the permeate in proportions approaching those of the feed. Comparison of multiple ionic ratios can therefore support identification of feed-derived contamination, although precipitation, selective retention and analytical background can modify these ratios. The apparent passage and rejection of ion i were calculated as σi = cp,i/cf,i and Ri = 100(1 − σi). Because the permeate loop initially contains distilled water, these concentration-based quantities describe the sampled recirculating solution rather than the instantaneous composition of newly transferred water. Blank correction and a permeate-loop mass balance are required to determine intrinsic salt passage. Ionic-ratio analysis is a compositional screening tool and does not replace a time-resolved solute balance for separating liquid and vapour flux (Section 3.7).
T3 — final-period flux test. For each 2 h record, the run-averaged flux was compared with the mean over the final 30 min. The coefficient of variation and linear drift were also calculated. The final-period mean reduces sensitivity to start-up behaviour but is considered quasi-steady only where the corresponding variability and drift are sufficiently small.
T4 — operating-window test. The transmembrane hydraulic pressure Pch must remain below the measured water-breakthrough threshold Pbreak. The capillary liquid entry pressure is described by the Franken criterion [9]:
where the LEP expression is the Franken criterion [9], with geometric factor B, liquid surface tension γL, contact angle θ and largest pore radius rmax. The thermal window requires the feed temperature to remain below the onset of softening, determined by DMA. The flux–flow dependence was fitted as J ∝ Qn. A weak flow dependence is consistent with membrane-dominated resistance, whereas n ≈ 1/3 is consistent with an appreciable contribution from developing laminar thermal boundary layers [3,27,28]. The feed-side temperature drop due to latent heat alone is
with ΔHv = 2333 kJ kg−1, cp = 4.0 kJ kg−1 K−1 and ṁf obtained from the volumetric flow rate and a density of 1.03 kg L−1. Conductive heat loss adds to this value, so Equation (6) is a lower bound.
Pch < Pbreak, LEP = −2BγL cosθ / rmax
ΔTf,lat = J A ΔHv / (ṁf cp)
Python (NumPy, pandas) was used for the reported calculations. The original numerical time-series files and analysis scripts were unavailable for verification during this revision; the graphical reconstruction in Section 3.1 was used for presentation only.
3. Results and Discussion
3.1. Flux–Time Behaviour and the Quasi-Steady Test (T3)
The flux–time records (Figure 2) demonstrate that run-averaged values can obscure substantial temporal variation. With C1, the commercial PTFE membrane at 0.6 and 1.3 L min⁻¹ exhibited declining flux after the initial 30 min. Final-period means were 18% and 29% below the corresponding run averages, with whole-record drifts of −6.6 and −8.2 LMH h⁻¹ (Table 3). With C2, flux increased during the first 30–60 min, and final-period means were 8–21% above the run averages. The stronger C1 decline at higher flux is consistent with increased concentration polarisation and possible deposition [4,26], but scaling cannot be confirmed from flux records alone. Opposing temporal trends introduce bias into comparisons based only on run averages.
The original numerical time-series files were unavailable for reanalysis. Figure 2 was therefore reconstructed approximately from the existing high-resolution plot for presentation only. Coloured trace pixels were mapped to the source axes; approximate flux values were represented by the median trace ordinate in 1 min bins. Dashed visual guides were generated using a five-bin running median followed by a five-bin moving mean, with interpolation across gaps in the digitised dashed traces. Trace identity was assigned from the source legends and visual separation; overlapping lines and image resolution limit reconstruction accuracy. The isolated green peak in panel (b) was omitted from the reconstructed display by masking the approximately 14–17 min interval of that digitised trace and interpolating the trend guide across the gap. This is a graphical omission and does not establish that the underlying measurement was erroneous. All other visible excursions remain in the faint traces, and Figure S5 retains the original plot including the peak. The previously reported means, variability, drift and flux ratios were not recalculated.
Figure 2 also contains brief downward excursions followed by rapid recovery, particularly in the higher-flow PTFE records with C1 at approximately 25–40 min, and smaller excursions in the PS records. These events differ from the sustained flux declines and gradual increases observed over tens of minutes. Balance disturbance, temporary flow interruption, bubbles, sampling or temperature fluctuations are possible explanations, but none can be assigned without corroborating operating logs. Because flux is calculated from increments in measured permeate mass, short disturbances in mass or timing can produce pronounced excursions in the derived flux. Such events can affect the whole-record coefficient of variation, fitted drift and run-averaged flux; their quantitative influence depends on their magnitude and duration. The isolated excursions identified here precede the final 30 min and therefore do not directly enter that averaging window, although any persistent effect of an operational disturbance would still require assessment. Final-period averaging does not, by itself, establish that these events were measurement artefacts.
Exclusion of individual observations cannot be justified solely by their visual departure from a smooth curve. A defensible assessment requires the original cumulative mass and time records, identification of any documented experimental interruption or measurement error, and comparison of the resulting means, coefficients of variation, drift estimates and paired-feed flux ratios with and without the affected intervals. Any exclusion rule should be applied consistently across runs, with the number and duration of excluded intervals reported and the original records retained. The sustained C1 and PS-Q1 C2 declines should be retained as observed temporal behaviour. In the absence of the original logs and a quantified sensitivity analysis, the influence of the brief excursions on whole-record statistics remains unresolved.
PS-Q1 tested with C2 decreased from approximately 19 to 8.0 LMH over 2 h. The other three PS-Q records increased towards final-period means of 4.6–5.9 LMH, with final-period CVs of 1–3%. The low ionic concentrations observed for other PS specimens (Section 3.3) support their high apparent rejection but cannot independently exclude wetting in PS-Q1, for which paired ionic data are not reported in Table S4. Structural rearrangement under thermal and hydraulic loading is a plausible explanation for the PS-Q1 decline, consistent with the DMA response discussed in Section 3.5; direct before-and-after structural measurements would be required to establish this mechanism.
3.2. Thermodynamic Salinity Test (T1)
Increasing mass-based salinity from 36.9 to 71.9 g kg−1 decreases the calculated water activity from approximately 0.981 to 0.957. At the bulk inlet temperatures of 70/20 °C, the corresponding vapour-pressure driving force decreases from approximately 28.3 to 27.5 kPa, giving Φth ≈ 0.975. Across the assumed surface-temperature and polarisation ranges, Φth remains between 0.952 and 0.975. The predicted 2.5–5% reduction therefore represents the water-activity contribution under these assumptions, rather than an upper bound on the total salinity-related flux loss.
The run-averaged ratios differ markedly from the predicted interval (Figure 3). Across 18 membrane–condition pairs, ratios range from 0.17 to 5.35; 12 exceed unity, and only one lies within ±10% of the predicted interval. A ratio above unity is inconsistent with the water-activity-only prediction when surface temperatures and membrane transport properties are held constant. Potential explanations include different thermal conditions, liquid-feed carryover, structural differences between specimens, and averaging of records with opposing transients. T1 identifies a departure from the comparison assumptions rather than distinguishing these explanations on its own.
Using final-period means reduces all PTFE ratios below unity (0.47–0.84), together with those of PS-Q1 (0.57) and PS-Q2 (0.85), demonstrating the influence of averaging. These ratios remain approximately 11–51% below the lower bound of the water-activity prediction. The largest departure occurs for PTFE at 1.3 L min⁻¹, where the C1/C2 ratio is 0.47. This pattern is consistent with additional concentration polarisation, deposition or changes in membrane condition, but does not establish scaling independently. Norouzi et al. [7] distinguished vapour-pressure suppression from pore blockage near NaCl saturation; their approximately 90%-of-saturation transition cannot be transferred directly to the present multicomponent feeds. Salih et al. [29] reported approximately 20–32% flux reductions for PTFE and PEEK membranes upon adding 10% (w/v) NaCl to PFPeA-containing feeds at 50–60 °C. Their feed chemistry, membrane support and module dimensions differ from those used here, so the comparison supports the importance of coupled operating effects rather than a quantitative ranking. For PS-12–PS-23, paired feeds were tested using separate specimens, and the observed ratios therefore also incorporate specimen variability. Sequential testing of both feeds on the same specimen, with controlled test order and checks for irreversible change, would provide a stronger assessment.
3.3. Feed-Signature Test (T2)
The commercial PTFE permeates contained 238–392 mg L⁻¹ Cl⁻ and 144–238 mg L⁻¹ Na⁺ (Figure 4). The reported sample-specific chloride passages are 0.84–1.51%, corresponding to apparent rejections of 98.49–99.16%. The Cl⁻/Na⁺ mass ratio of 1.64–1.73 approaches the feed value of 1.79, supporting liquid-feed carryover. Ionic ratios alone cannot distinguish pore wetting from membrane defects or module-seal bypass. Sulfate was depleted relative to chloride (SO₄²⁻/Cl⁻ = 0.047–0.067, compared with 0.099 in the feed). Calcium sulfate deposition is one possible explanation, but requires confirmation by deposit analysis and solution speciation. Salih et al. [29] reported NaCl rejection above 99.7% for laminated and unlaminated PTFE membranes in PFPeA-containing brine. Thus, the lower apparent rejection observed here should be attributed to the tested membrane–module system and operating conditions rather than to an intrinsic limitation of PTFE.
Most electrospun PS permeates had substantially lower ionic concentrations. Chloride ranged from 1.02 to 1.32 mg L⁻¹ in 10 of 11 samples, while Na⁺ ranged from 0.08 to 0.78 mg L⁻¹. The Cl⁻/Na⁺ ratios of samples obtained at 0.03 L min⁻¹ varied from 1.70 to 13.2, consistent with a relatively constant chloride contribution rather than a uniform feed-derived signature (Figure 4b). In samples with quantified sulfate, concentrations of approximately 4.1 mg L⁻¹ exceeded chloride concentrations, unlike the feed composition. The eleventh sample, PS-14 tested with C2 at 0.6 L min⁻¹, contained 2.87 mg L⁻¹ chloride and 2.49 mg L⁻¹ sodium (Table S4). These observations suggest an analytical or system background, but blanks and detection limits are needed to distinguish background from trace transport. The reported chloride-based apparent rejections are 99.987–99.9975%; their precision should be interpreted in relation to the analytical uncertainty and permeate-loop dilution. PS-MA contained 6.2 mg L⁻¹ Cl⁻, exceeding the approximately 1 mg L⁻¹ level of the main PS series, whereas PS-MB contained 50.4 mg L⁻¹ Cl⁻ with Cl⁻/Na⁺ = 1.56, consistent with a larger feed-derived contribution and a reported rejection of 99.76%. Topuz [14] summarised recycled-PMMA MD membranes with a peak flux of 9.2 kg m⁻² h⁻¹ at 65 °C and 0.4 L min⁻¹ and salt rejection above 99.994%. This secondary-source comparison demonstrates that high apparent rejection is feasible in recycled-polymer systems, but does not establish equivalent performance for PS under matched conditions.
The results demonstrate lower measured ionic concentrations and higher apparent chloride rejection for most electrospun PS specimens than for the commercial PTFE reference in the present screening experiments. The magnitude of this difference remains subject to background contributions, loop dilution and sample-specific feed concentrations. Multi-ion analysis offers a practical complement to conductivity and online wetting measurements [8,10], while further controls are needed to assign the transport pathway conclusively.
3.4. Hydrodynamic Effects and Comparison at Matched Flow Rates
Increasing the flow rate from 0.03 to 1.84 L min⁻¹ increased the flux of both commercial membranes by a factor of approximately 4.75 (Figure 5a). Power-law fits give n = 0.329 ± 0.038 for PE (R² = 0.962) and n = 0.344 ± 0.025 for PTFE with C2 (R² = 0.984); the PTFE exponent is 0.351 ± 0.030 when final-period means are used. The approximate one-third dependence is consistent with developing laminar thermal boundary layers [27,28] and indicates an important contribution from external heat-transfer resistance. It does not, by itself, quantify the partition between membrane and external resistance. Sarbatly [31] similarly describes how increasing nanofibrous-membrane permeability can shift the dominant resistance towards external transport. The present flow dependence provides experimental support for considering this coupled resistance distribution rather than interpreting flux solely through membrane permeability.
At 0.03 L min⁻¹, Equation (6) predicts a feed temperature decrease of 4.0–4.6 K from latent heat transfer alone at fluxes of 6–7 LMH, compared with less than 0.7 K at flow rates of at least 0.6 L min⁻¹ (Figure 5b). These estimates indicate that low-flow tests are particularly sensitive to heat-transfer limitations. At the matched flow rate of 0.03 L min⁻¹, run-averaged PTFE fluxes were 7.4 and 7.1 LMH for C1 and C2, respectively, compared with 1.5–10.7 and 0.8–8.8 LMH for the PS series. PS-16, containing 0.5 wt% PTFE particles, gave 10.7 and 7.0 LMH, respectively. These screening values are competitive with the reference at matched nominal flow, but final-period performance and replicate uncertainty are required before claiming a reproducible flux advantage. For the listed flux ranges and bulk driving forces of approximately 27.5–28.3 kPa, the calculated apparent coefficients are 0.25–0.27 kg m⁻² h⁻¹ kPa⁻¹ for PTFE and up to approximately 0.39 kg m⁻² h⁻¹ kPa⁻¹ for PS in series A. Series B reached 18.66 LMH for PS-16 with C1, corresponding to approximately 0.68 kg m⁻² h⁻¹ kPa⁻¹. These are system-level coefficients based on bulk temperatures, not intrinsic membrane permeabilities.
3.5. Mechanical, Wetting and Thermal Window (T4)
Consolidated PS membranes exhibited reported water-breakthrough thresholds of 1.7–7.0 psi (11.7–48.3 kPa; Figure 6a). The thresholds increased with thickness (r = 0.75, n = 19; slope 15.1 psi mm−1), but the association does not distinguish changes in pore structure from membrane deformation or leakage. The endpoint was the first passage of water, rather than independently verified rupture. These values therefore characterise the tested membrane–cell configuration and should not be treated as mechanical burst strengths. Their numerical precision is limited by the 0.1 bar pressure increment used in the test.
At 0.03 L min⁻¹, the reported transmembrane hydraulic pressure is 0.13–0.52 psi [23], giving a nominal ratio of at least 3.3 between the lowest reported breakthrough pressure and the highest reported operating pressure. This ratio excludes pressure transients, fatigue and thermal weakening. Assuming hydraulic pressure increases linearly with flow rate gives an approximate intersection with the breakthrough-pressure range between 0.1 and 1.6 L min⁻¹, encompassing the approximately 1 L min⁻¹ condition at which PS damage was observed. This extrapolation is a screening estimate rather than a validated safe-flow limit. Salih et al. [29] also encountered PEEK and PVDF rupture in a 140 cm2 cell and used a 42 cm2 cell to reduce fragility. This comparison emphasises the importance of support geometry and unsupported span. Support layers and inter-fibre bonding should therefore be evaluated alongside capillary wetting resistance [5,12].
Membranes containing 0.3 µm PTFE particles exhibited a water-breakthrough pressure of 5.18 ± 0.46 psi (CV = 0.09), with relatively little variation across the tested thicknesses. Membranes containing 5 or 7 µm particles and particle-free membranes exhibited CVs of 0.32–0.37. These results associate smaller particles with more reproducible breakthrough thresholds. Differences in pore structure, junction formation or particle dispersion are plausible explanations; conversely, particles comparable in size to the 4.4–5.5 µm fibres may introduce local heterogeneity. These mechanisms require direct morphological confirmation. Li et al. [30] demonstrated the importance of controlling fibre morphology and pore architecture, but their results do not independently establish particle-mediated reinforcement in PS.
The PS membranes containing PTFE particles had as-spun contact angles of 133.8–139.6°, compared with 112–130° for the commercial PTFE-coated polypropylene membranes (Figure 6b). Pressing reduced the angles by 2.5–5.4°, and the 0.3 µm particle formulation retained a pressed value of 136.6°. After 2 h of DCMD, contact angles decreased by 3.6–4.9% for PTFE, 6.1–9.2% for PS-Q1 and 5.1–5.8% for PS-Q2. Within PS-12–PS-23, correlations between flux and contact angle were weak (r = −0.08 for C1, n = 6; r = −0.24 for C2, n = 7), as were correlations with thickness (r = −0.23 and −0.09). These small datasets do not support a monotonic relationship between either property and flux. Contact angle remains relevant to LEP, but should be interpreted together with pore-size distribution, surface tension, specimen structure and hydrodynamic conditions.
DMA of PS-Q1 after DCMD showed a reduction in storage modulus from approximately 1.4×10⁷ Pa at 25–30 °C to 1.3×10⁶ Pa at 55 °C, with the principal decrease between 35 and 55 °C (Figure 7). This response occurs below the typical bulk PS glass-transition temperature of approximately 100 °C and below the 70 °C feed temperature. Because the tested fibres are micrometre-sized, the nanoscale confinement mechanism described for thin PS films [32] is not directly applicable. Residual solvent can depress Tg [33], but its contribution cannot be excluded without solvent analysis and independent thermal measurements. Inter-fibre slip, network rearrangement, residual solvent and prior exposure may all contribute. The DMA response is therefore evidence of thermomechanical weakening of the tested mat, rather than proof of a single molecular or structural mechanism. Reinforcement and inter-fibre bonding warrant investigation; the resulting changes in porosity, permeability and wetting resistance must also be assessed.
3.6. Variability Between Membrane Specimens
Test series A and B used separate specimens of each PS membrane under identical nominal conditions. Across the 12 membrane–feed pairs available in both series, the mean symmetric absolute percentage difference, calculated as 100 × mean [2|JB − JA|/(JA + JB)], was 56% (Figure 8a), and membrane rankings changed between series. This variability limits attribution of flux differences to PTFE loading. Local differences in fibre density, thickness, consolidation, handling and module assembly are plausible contributors. Li et al. [30] initially obtained R² < 0.40 for thickness prediction using their raw dataset, but improved thickness prediction to approximately 0.82 after feature engineering and data augmentation. Their final results therefore support improved process representation rather than the claim that thickness is inherently unpredictable. In the present study, replicate testing and spatially resolved characterisation are needed to distinguish fabrication variability from operating and measurement effects before composition-dependent improvements can be established.
3.7. Integrated Interpretation and Comparison with Published Literature
Table 4 summarises the diagnostic outcomes. Most PS specimens exhibit high apparent rejection, but substantial between-specimen variation and limited hydraulic and thermal resistance constrain interpretation of their flux performance. The commercial PTFE reference tolerates the tested flow range, although its permeate ionic composition indicates feed-derived contamination in this membrane–module system. These findings identify a trade-off between apparent separation quality and operating robustness under the tested conditions. Recent literature provides complementary evidence (Table 5). Li et al. [30] obtained 22–26 LMH with a higher-flux architecture that wetted after approximately 10 h, whereas a smaller-pore architecture produced 17–20 LMH with LEP of approximately 0.8–0.9 bar and stable operation beyond 24 h. Their tests used 35 g L⁻¹ NaCl at 60/20 °C, so the absolute flux values cannot be ranked directly against the present multicomponent brines at 70/20 °C. Salih et al. [29] further demonstrated that membrane support and cleaning influence stability over 48–300 h. In contrast, the present 2 h tests identify screening-stage limitations and do not establish comparable durability.
The framework complements durability reporting [23] by integrating thermodynamic, analytical, temporal and mechanical checks. For screening studies, we recommend reporting: final-period flux together with its variability and drift; paired salinity tests on the same specimen with test-order controls; feed and permeate ionic ratios together with blanks, detection limits and loop-volume balances; comparisons at matched hydrodynamic conditions; and water-breakthrough pressure and independent mechanical-strength measurements for unsupported membranes. Arshad et al. [5] place these measurements within the broader requirements of energy efficiency, scaling control and practical brine treatment. Nemmour et al. [6] modelled MD–freeze desalination at reject salinities of 70–130 g L⁻¹, but their integrated energy-recovery estimates do not validate the efficiency of the present cell. Jiao et al. [34] demonstrated localised crystallisation during solar interfacial evaporation of 24 wt% brine; this is a useful design analogy for salt management, rather than a DCMD flux benchmark.
An additional salinity benchmark is provided by Lee et al. [35], who tested electrospun PVDF-HFP membranes with and without 1–2 wt% carbon nanotubes in counter-current DCMD. At 60/20 °C and 0.5 L min−1 on both sides, the unfilled membrane produced 32.42 and 31.29 kg m−2 h−1 with 35 and 70 g L−1 NaCl, respectively. The calculated high-/low-salinity ratio is 0.965, corresponding to a 3.5% flux reduction. This lies within the numerical interval of 0.952–0.975 calculated for the present feeds, but agreement does not validate identical transport conditions: pure NaCl and multicomponent brines have different activities and scaling tendencies, and the present surface-temperature assumptions cannot be transferred directly. Nevertheless, the result demonstrates that a modest salinity penalty is experimentally attainable, strengthening the need to investigate the larger PTFE penalties observed here. Lee et al. also found that changing the modelled mass-transfer coefficient alone did not reproduce the CNT-enhanced flux, whereas coupled heat- and mass-transfer adjustments improved agreement. Their interpretation supports evaluating additive effects through coupled transport rather than attributing flux changes solely to contact angle or vapour permeability.
Santoro et al. [36] provide direct experimental evidence for the thermal-polarisation interpretation of T4. Using temperature-sensitive Ru(phen)3 probes immobilised in electrospun PVDF, they mapped membrane-surface temperatures during DCMD. With distilled-water feed at 60 °C and a distillate inlet temperature of 20 °C, increasing feed velocity from 0.008 to 0.024 m s−1 raised flux from 14.4 to 18.2 kg m−2 h−1, an approximately 26% increase calculated from the reported values. At the highest velocity, the temperature-polarisation coefficient was approximately 0.6 over much of the module interior, with entrance and exit effects. Their flux changed during the first hour before stabilising, also supporting explicit separation of start-up and final-period performance. These measurements substantiate the importance of interfacial temperatures and flow conditions, but their co-current, distilled-water experiments do not establish salt rejection or predict the magnitude of polarisation in the present counter-current brine system. In particular, the present flow exponent is an indirect diagnostic; it is not a substitute for measured membrane-surface temperatures.
The overview by Abid et al. [37], read together with its reference corrigendum [38], provides broader context for electrospinning, membrane characteristics and surface modification in MD. It supports considering pore structure, thickness, wetting resistance and post-treatment jointly. Because it is a review encompassing different materials and configurations, its compiled performance values are not treated as independent matched-condition measurements. The primary comparisons in Table 5 therefore provide the quantitative basis for interpreting the present results, while the review is used to position the membrane-design requirements.
McGaughey and Childress [39] established a solute-mass-balance approach that separates measured net flux into liquid and vapour contributions. Their analysis includes salt accumulation in the recirculating distillate and salt removed through an overflow stream. They also demonstrated that residual solute mixing within the apparatus can increase distillate salinity without indicating progressively increasing wetting. This is directly relevant to the approximately constant low chloride concentrations in the present PS samples: a background contribution is plausible, but cannot be established from endpoint concentrations alone. Their distinction between constant and increasing wetting further shows why the temporal behaviour of liquid flux matters. The present T2 adds a comparison of multiple ionic proportions to the integrated screening workflow; it does not replace quantitative liquid-flux analysis or establish a new method for distinguishing liquid from vapour transport. Initial and time-resolved loop volumes, concentration records, and any sampling or overflow losses are needed before the present data can support that calculation.
Niknejad et al. [40] provide a particularly relevant material-design comparison. Their electroblown PS/HIPS membranes were hot-pressed before DCMD testing, and PS/HIPS blending increased elongation at break from 5.83% for PS to 12.82–14.89% for the blends. Their tensile tests used 1 × 5 cm2 strips at 5 mm min−1 with three replicates; LEP was determined separately from the first visible water droplet during nitrogen pressurisation. These quantities must not be equated with the present water-breakthrough pressures. At feed/permeate temperatures of 55/15 °C and flow rates of 0.48/0.24 L min−1, their P/H-1 and P/H-3 membranes produced 45.8/48.1 kg m−2 h−1 at 35 g L−1 NaCl and 42.1/46.5 kg m−2 h−1 at 70 g L−1. The calculated high-/low-salinity ratios are 0.919 and 0.967, respectively. The latter is numerically close to the present water-activity interval, while the former has a larger penalty; neither comparison identifies a mechanism because operating conditions and membrane structures differ. Salt concentration was increased every 24 h through 35, 70, 105 and 150 g L−1, so the reported 96 h saline test represents sequential exposure rather than 96 h at 150 g L−1. Their results support PS toughening and controlled consolidation as practical development routes, but do not demonstrate a higher PS glass-transition temperature or validate the thermal stability of the present mats.
Rácz et al. [41] distinguish static LEP measurements from measurements performed during MD operation. For a commercial PVDF flat-sheet membrane, they reported a static LEP of 2.37 ± 0.025 bar and a value of 1.90 bar in a vacuum-MD configuration. Their static experiment used distilled water at 21–24 °C, an initial pressure of 0.2 bar for 10 min, and subsequent 0.1 bar increases every 5 min until breakthrough. These measurements illustrate that LEP depends on the test configuration and breakthrough criterion. They support reporting fluid, temperature, pressure increments, holding time and detection method, but are not burst-pressure measurements. The present protocol likewise identifies water breakthrough. Without an independently verified rupture endpoint, it cannot determine whether mechanical failure precedes capillary intrusion.
Shaulsky et al. [42] demonstrate why reinforcement must be optimised together with transport. Thin-layer PVDF coating of electrospun PVDF-HFP reduced the effective pore diameter while leaving the contact angle approximately unchanged (131.9° for the control and 130.6° after thin coating). LEP increased from 56 to 163 kPa, and maximum tensile force increased from 2.38 to 3.38 N. The corresponding extension at maximum strain increased from 16.9 to 24.2 mm, whereas deeper knife-cast coating increased LEP to 325 kPa but reduced extension to 2.1 mm. Because these tensile quantities depend on specimen geometry and loading protocol, they are not directly comparable with burst pressure. In DCMD with 1 M NaCl at 60/20 °C and feed/permeate velocities of 15.2/7.6 cm s−1, the uncoated mat exhibited approximately 70 LMH but began wetting after about 30 min; thin- and thick-coated mats produced approximately 30 and 10 LMH, respectively. The thin-coated membrane also maintained stable performance during a reported 12 h experiment. This evidence supports selective inter-fibre reinforcement and pore-size control rather than maximising either coating thickness or contact angle. Transfer to PS would require a coating chemistry that preserves the PS substrate and verification of hydraulic strength at operating temperature.
Li et al. [43] provide a direct PS-material benchmark using cold-pressed, hierarchically rough electrospun PS-25 membranes. At a temperature difference of 50 °C, with the permeate at 20 °C and both streams circulated at 0.6 L min−1, a 60 µm membrane gave 104.8 ± 4.9 kg m−2 h−1 with 20 g L−1 NaCl, whereas a 120 µm membrane gave 51 ± 4.5 kg m−2 h−1 with 35 g L−1 NaCl over approximately 10 h. Their LEP values were 0.6 and 0.8 bar, respectively. The thinner membrane showed increasing permeate conductivity during a separate, more demanding test with 35 g L−1 NaCl at a temperature difference of 55 °C, while the thicker membrane retained low permeate conductivity. Thus, PS can support substantially higher flux than observed in the present low-flow screening tests, but the literature values were obtained at lower feed salinity and a 20-fold higher volumetric flow rate; module geometry and fibre architecture also differ. Moreover, the two headline fluxes correspond to different feed concentrations and cannot isolate a thickness effect. Their results reinforce the need for matched-condition comparisons and show that thermal response and wetting resistance must be evaluated for each fabricated mat rather than inferred solely from polymer identity.
The principal limitations are the 2 h test duration, the use of different PS series for different measurements, and the absence of matched blanks, permeate-loop mass balances and direct deposit identification in the available dataset. Consequently, inferred background contributions, scaling mechanisms and network rearrangement remain hypotheses. The breakthrough thresholds obtained at 20 °C should not be transferred directly to every PS formulation or to heated operation, and do not establish mechanical strength. The framework is intended to guide screening and subsequent validation, rather than certify long-term membrane performance.
4. Conclusions
This study establishes a four-test diagnostic framework for assessing selectivity, transport behaviour and operating constraints in DCMD. By integrating water-activity calculations, permeate ionic analysis, final-period flux assessment, and hydraulic and thermal characterisation, the framework provides a more informative basis for membrane evaluation than flux or rejection measurements alone. Its application to electrospun PS, PS–PTFE and commercial membranes treating synthetic brines of 37.8 and 75.7 g L⁻¹ yielded the following findings:
- Water-activity calculations establish a thermodynamic baseline of 2.5–5% salinity-related flux reduction under the assumed surface-temperature and polarisation conditions. Comparing this baseline with measured run-averaged flux ratios of 0.17–5.35 identifies the contribution of operating conditions, temporal behaviour and specimen variability to apparent membrane performance.
- Final-period analysis resolves the influence of start-up behaviour on salinity comparisons. Commercial PTFE C1/C2 flux ratios of 0.47–0.84 demonstrate the value of evaluating sustained performance alongside run averages and provide a basis for investigating additional polarisation or deposition effects.
- Permeate ionic ratios provide complementary evidence for assessing separation integrity. The feed-like signature of commercial PTFE permeates supports liquid-feed carryover, whereas most PS specimens exhibit substantially lower ionic concentrations and chloride-based apparent rejection of 99.987–99.9975%. These results identify electrospun PS as a promising candidate for further development, with blank-corrected measurements and permeate-loop balances needed to quantify trace salt passage.
- Flux–flow exponents of 0.33–0.35 highlight the importance of external heat transfer in determining measured flux. Selected PS specimens achieve fluxes comparable to commercial PTFE at matched nominal flow, supporting further optimisation of PS formulations. The approximately 56% between-series variation identifies fabrication and specimen reproducibility as priorities for establishing reliable composition–performance relationships.
- Water-breakthrough pressures of 1.7–7.0 psi and the storage-modulus decrease at 35–55 °C define hydraulic and thermal considerations for membrane development. Together, these measurements guide reinforcement, consolidation and support strategies that preserve selectivity while improving operational robustness.
The principal contribution is an integrated approach that connects measured separation performance with the conditions governing its interpretation. The framework supports more rigorous membrane screening, more meaningful literature comparisons and targeted experimental design. For electrospun PS membranes, the findings establish a clear development pathway centred on high apparent selectivity, reproducible fabrication and improved hydraulic and thermal stability, with extended testing required to establish long-term durability.
Supplementary Materials
Text S1–S3 provide worked calculations; Table S1–S7 report feed composition, membrane properties, flux statistics, ionic concentrations, replicate-series fluxes, breakthrough pressures and flow-scaling fits. Figure S1–S4 provide SEM images and additional flux records; Figure S5 preserves the original version of Figure 2. The original numerical workbook and analysis scripts are not included.
Author Contributions
Conceptualisation, supervision and funding acquisition, M.K.; methodology, investigation, formal analysis, validation and data curation, M.K. and F.A.; writing—original draft preparation, M.K.; writing—review and editing, M.K. and F.A. All authors have read and agreed to the published version of the manuscript.
Funding
This research was made possible by the Qatar National Research Fund (a member of Qatar Foundation) under the National Priorities Research Program, award number NPRP 8-270-2-106. The statements made herein are solely the responsibility of the authors.
Declaration of Generative AI and AI-Assisted Technologies in Manuscript Preparation
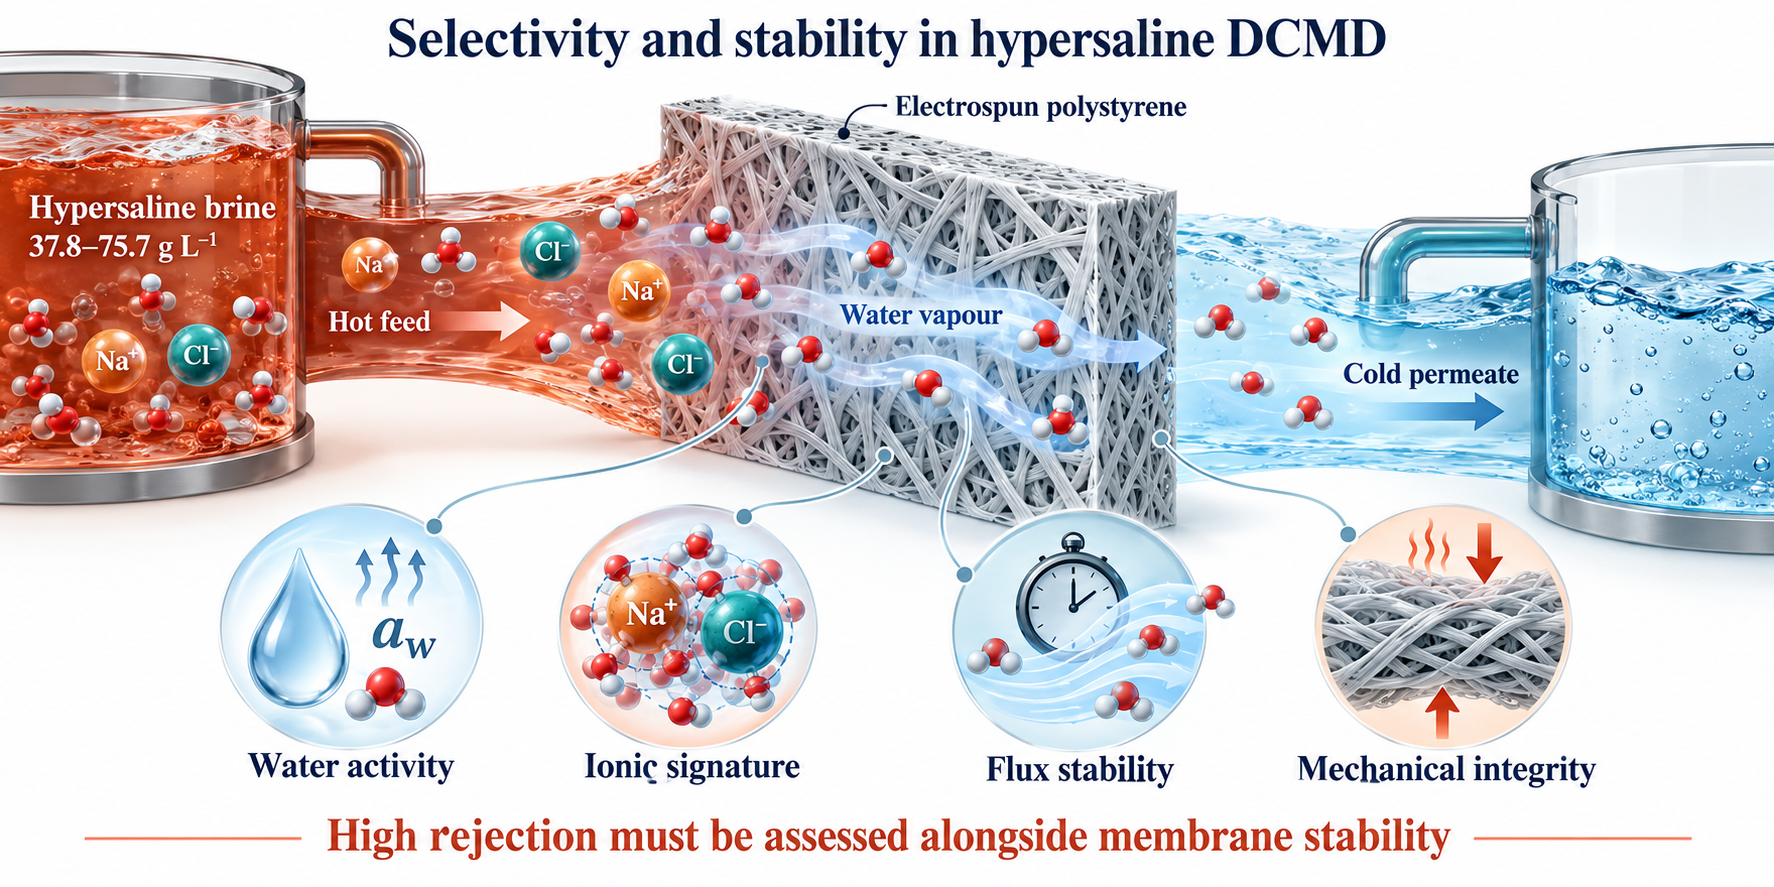
During the preparation of this manuscript, the authors used ChatGPT (OpenAI) to assist with language refinement and editorial revision. All experimental data, scientific analyses, interpretations and conclusions are the work of the authors. The authors reviewed and verified the AI-assisted revisions and take full responsibility for the final content of the manuscript. AI was used in generating the Graphical abstract.
Data Availability Statement
Numerical summary tables and original graphical records are provided in the Supplementary Materials. The original numerical time-series files were unavailable for this revision.
Conflicts of Interest
The authors declare no conflicts of interest.
Abbreviations
CA, contact angle; CV, coefficient of variation; DCMD, direct contact membrane distillation; DMA, dynamic mechanical analysis; DMF, N,N-dimethylformamide; IC, ion chromatography; LEP, liquid entry pressure; LMH, L m−2 h−1; MD, membrane distillation; PE, polyethylene; PS, polystyrene; PTFE, polytetrafluoroethylene; TDS, total dissolved solids.
References
- Alkhudhiri, A.; Darwish, N.; Hilal, N. Membrane distillation: A comprehensive review. Desalination 2012, 287, 2–18. [Google Scholar] [CrossRef]
- Lawson, K.W.; Lloyd, D.R. Membrane distillation. J. Membr. Sci. 1997, 124, 1–25. [Google Scholar] [CrossRef]
- Khayet, M. Membranes and theoretical modeling of membrane distillation: A review. Adv. Colloid Interface Sci. 2011, 164, 56–88. [Google Scholar] [CrossRef] [PubMed]
- Warsinger, D.M.; Swaminathan, J.; Guillen-Burrieza, E.; Arafat, H.A.; Lienhard V, J.H. Scaling and fouling in membrane distillation for desalination applications: A review. Desalination 2015, 356, 294–313. [Google Scholar] [CrossRef]
- Arshad, Z.; Abushaban, A.; Belmabkhout, Y.; Necibi, M.C. Membrane distillation for seawater desalination and brine treatment: Challenges, strategies, and future perspectives. J. Environ. Chem. Eng. 2026, 14, 122675. [Google Scholar] [CrossRef]
- Nemmour, A.; El Kadi, K.; Janajreh, I. A conceptual demonstration of direct contact membrane distillation and freeze desalination hybrid process for reverse osmosis brine treatment. Energy Nexus 2026, 21, 100637. [Google Scholar] [CrossRef]
- Norouzi, E.; Abdelkareem, M.; Park, C. Dual-mechanism modeling of flux degradation and salt crystallization in direct contact membrane distillation with hypersaline brines. Desalin. Water Treat. 2026, 328, 101901. [Google Scholar] [CrossRef]
- Rezaei, M.; Warsinger, D.M.; Duke, M.C.; Matsuura, T.; Samhaber, W.M.; Lienhard, J.H. Wetting phenomena in membrane distillation: Mechanisms, reversal, and prevention. Water Res. 2018, 139, 329–352. [Google Scholar] [CrossRef] [PubMed]
- Franken, A.C.M.; Nolten, J.A.M.; Mulder, M.H.V.; Bargeman, D.; Smolders, C.A. Wetting criteria for the applicability of membrane distillation. J. Membr. Sci. 1987, 33, 315–328. [Google Scholar] [CrossRef]
- Chen, Y.; Wang, Z.; Jennings, G.K.; Lin, S. Probing pore wetting in membrane distillation using impedance: Early detection and mechanism of surfactant-induced wetting. Environ. Sci. Technol. Lett. 2017, 4, 505–510. [Google Scholar] [CrossRef]
- Tijing, L.D.; Choi, J.-S.; Lee, S.; Kim, S.-H.; Shon, H.K. Recent progress of membrane distillation using electrospun nanofibrous membrane. J. Membr. Sci. 2014, 453, 435–462. [Google Scholar] [CrossRef]
- Lalia, B.S.; Guillen-Burrieza, E.; Arafat, H.A.; Hashaikeh, R. Fabrication and characterization of polyvinylidenefluoride-co-hexafluoropropylene (PVDF-HFP) electrospun membranes for direct contact membrane distillation. J. Membr. Sci. 2013, 428, 104–115. [Google Scholar] [CrossRef]
- Ke, H.; Feldman, E.; Guzman, P.; Cole, J.; Wei, Q.; Chu, B.; Alkhudhiri, A.; Alrasheed, R.; Hsiao, B.S. Electrospun polystyrene nanofibrous membranes for direct contact membrane distillation. J. Membr. Sci. 2016, 515, 86–97. [Google Scholar] [CrossRef]
- Topuz, F. From pollutant to purifier: Upcycling plastic waste into electrospun membranes for water and air remediation. J. Environ. Chem. Eng. 2026, 14, 124020. [Google Scholar] [CrossRef]
- Menini, R.; Farzaneh, M. Production of superhydrophobic polymer fibers with embedded particles using the electrospinning technique. Polym. Int. 2008, 57, 77–84. [Google Scholar] [CrossRef]
- Eykens, L.; De Sitter, K.; Dotremont, C.; Pinoy, L.; Van der Bruggen, B. Membrane synthesis for membrane distillation: A review. Sep. Purif. Technol. 2017, 182, 36–51. [Google Scholar] [CrossRef]
- Abdelrazeq, H.; Khraisheh, M. Porosity effect of polystyrene membranes on desalination performance: A combined experimental and numerical heat and mass transfer study in direct contact membrane distillation. Polymers 2023, 15, 1821. [Google Scholar] [CrossRef] [PubMed]
- Ullah, R.; Khraisheh, M.; Esteves, R.J.; McLeskey, J.T., Jr.; AlGhouti, M.; Gad-el-Hak, M.; Vahedi Tafreshi, H. Energy efficiency of direct contact membrane distillation. Desalination 2018, 433, 56–67. [Google Scholar] [CrossRef]
- Hemeda, A.A.; Esteves, R.J.A.; McLeskey, J.T., Jr.; Gad-el-Hak, M.; Khraisheh, M.; Vahedi Tafreshi, H. Molecular dynamic simulations of fibrous distillation membranes. Int. Commun. Heat Mass Transf. 2018, 98, 304–309. [Google Scholar] [CrossRef]
- Esteves, R.J.A.; Gornick, V.; Alqurwani, D.S.; Koenig-Lovejoy, J.; Abdelrazeq, H.; Khraisheh, M.; Forzano, A.V.; Gad-el-Hak, M.; Vahedi Tafreshi, H.; McLeskey, J.T., Jr. Activated carbon-doped polystyrene fibers for direct contact membrane desalination. Emergent Mater. 2020, 3, 807–814. [Google Scholar] [CrossRef]
- Abdelrazeq, H.; Khraisheh, M.; Al Momani, F.; McLeskey, J.T., Jr.; Hassan, M.K.; Gad-el-Hak, M.; Vahedi Tafreshi, H. Performance of electrospun polystyrene membranes in synthetic produced industrial water using direct-contact membrane distillation. Desalination 2020, 493, 114663. [Google Scholar] [CrossRef]
- Abdelrazeq, H.; Khraisheh, M.; Hassan, M.K. Long-term treatment of highly saline brine in a direct contact membrane distillation (DCMD) pilot unit using polyethylene membranes. Membranes 2022, 12, 424. [Google Scholar] [CrossRef] [PubMed]
- Khraisheh, M.; Jawad, Z.; Almomani, F. Polymeric membranes for hypersaline membrane distillation: Stability envelopes and failure-mode benchmarking. SSRN 2026, preprint. [Google Scholar] [CrossRef]
- Phattaranawik, J.; Jiraratananon, R.; Fane, A.G. Heat transport and membrane distillation coefficients in direct contact membrane distillation. J. Membr. Sci. 2003, 212, 177–193. [Google Scholar] [CrossRef]
- Nayar, K.G.; Sharqawy, M.H.; Banchik, L.D.; Lienhard V, J.H. Thermophysical properties of seawater: A review and new correlations that include pressure dependence. Desalination 2016, 390, 1–24. [Google Scholar] [CrossRef]
- Martínez-Díez, L.; Vázquez-González, M.I. Temperature and concentration polarization in membrane distillation of aqueous salt solutions. J. Membr. Sci. 1999, 156, 265–273. [Google Scholar] [CrossRef]
- Schofield, R.W.; Fane, A.G.; Fell, C.J.D. Heat and mass transfer in membrane distillation. J. Membr. Sci. 1987, 33, 299–313. [Google Scholar] [CrossRef]
- Gryta, M.; Tomaszewska, M. Heat transport in the membrane distillation process. J. Membr. Sci. 1998, 144, 211–222. [Google Scholar] [CrossRef]
- Salih, H.H.M.; Huggett, E.; Patterson, C.; Scott, J.; Silva, R.G.; Lee, T.; Speth, T.F.; Nadagouda, M.N. Treatment of per- and polyfluoroalkyl substances (PFAS)-contaminated hypersaline brine by membrane distillation. ACS Environ. Au 2026, 6, 66–73. [Google Scholar] [CrossRef] [PubMed]
- Li, X.; Yan, K.Q.; Wei, X.; Li, M.; Sun, J.; Bi, Y.; Shao, L.; Gao, H.; An, A.K. Machine learning–driven multi-objective optimization of electrospun nanofibrous membranes design for membrane distillation. Water Res. 2026, 301, 126093. [Google Scholar] [CrossRef] [PubMed]
- Sarbatly, R. Structure–transport coupling and resistance redistribution in nanofibrous membrane distillation. Sep. Purif. Technol. 2027, 421, 140433. [Google Scholar] [CrossRef]
- Keddie, J.L.; Jones, R.A.L.; Cory, R.A. Size-dependent depression of the glass transition temperature in polymer films. Europhys. Lett. 1994, 27, 59–64. [Google Scholar] [CrossRef]
- Zheng, W.; Simon, S.L. Polystyrene freeze-dried from dilute solution: Tg depression and residual solvent effects. Polymer 2006, 47, 3520–3527. [Google Scholar] [CrossRef]
- Jiao, J.; Zhao, Y.; Liu, D.; Yu, Z.; Zhang, W.; Fan, L.; Zhang, H.; Liang, J.; Li, G.; Wang, J.; Liang, H. Sustainable solar distillation of hypersaline water enabled by a capillary-driven fibrous membrane with robust salt crystallization. J. Membr. Sci. 2026, 752, 125624. [Google Scholar] [CrossRef]
- Lee, J.-G.; Lee, E.-J.; Jeong, S.; Guo, J.; An, A.K.; Guo, H.; Kim, J.; Leiknes, T.O.; Ghaffour, N. Theoretical modeling and experimental validation of transport and separation properties of carbon nanotube electrospun membrane distillation. J. Membr. Sci. 2017, 526, 395–408. [Google Scholar] [CrossRef]
- Santoro, S.; Vidorreta, I.; Coelhoso, I.; Lima, J.C.; Desiderio, G.; Lombardo, G.; Drioli, E.; Mallada, R.; Crespo, J.; Criscuoli, A.; Figoli, A. Experimental Evaluation of the Thermal Polarization in Direct Contact Membrane Distillation Using Electrospun Nanofiber Membranes Doped With Molecular Probes. Molecules 2019, 24, 638. [Google Scholar] [CrossRef] [PubMed]
- Abid, M.B.; Wahab, R.A.; Salam, M.A.; Moujdin, I.A.; Gzara, L. Desalination technologies, membrane distillation, and electrospinning, an overview. Heliyon 2023, 9, e12810. [Google Scholar] [CrossRef] [PubMed]
- Abid, M.B.; Wahab, R.A.; Salam, M.A.; Moujdin, I.A.; Gzara, L. Corrigendum to “Desalination technologies, membrane distillation, and electrospinning, an overview” [Heliyon Volume 9, Issue 2, February 2023, Article e12810]. Heliyon 2026, 12, e44703. [Google Scholar] [CrossRef]
- McGaughey, A.L.; Childress, A.E. Wetting indicators, modes, and trade-offs in membrane distillation. J. Membr. Sci. 2022, 642, 119947. [Google Scholar] [CrossRef]
- Niknejad, A.S.; Bazgir, S.; Kargari, A. Mechanically improved superhydrophobic nanofibrous polystyrene/high-impact polystyrene membranes for promising membrane distillation application. J. Appl. Polym. Sci. 2021, 138, e50917. [Google Scholar] [CrossRef]
- Rácz, G.; Kerker, S.; Kovács, Z.; Vatai, G.; Ebrahimi, M.; Czermak, P. Theoretical and Experimental Approaches of Liquid Entry Pressure Determination in Membrane Distillation Processes. Period. Polytech. Chem. Eng. 2014, 58, 81–91. [Google Scholar] [CrossRef]
- Shaulsky, E.; Nejati, S.; Boo, C.; Perreault, F.; Osuji, C.O.; Elimelech, M. Post-fabrication modification of electrospun nanofiber mats with polymer coating for membrane distillation applications. J. Membr. Sci. 2017, 530, 158–165. [Google Scholar] [CrossRef]
- Li, X.; Wang, C.; Yang, Y.; Wang, X.; Zhu, M.; Hsiao, B.S. Dual-Biomimetic Superhydrophobic Electrospun Polystyrene Nanofibrous Membranes for Membrane Distillation. ACS Appl. Mater. Interfaces 2014, 6, 2423–2430. [Google Scholar] [CrossRef] [PubMed]
Figure 1.
Four-test diagnostic framework integrating thermodynamic, ionic, temporal and operating-window assessments of bench-scale DCMD screening data.
Figure 1.
Four-test diagnostic framework integrating thermodynamic, ionic, temporal and operating-window assessments of bench-scale DCMD screening data.
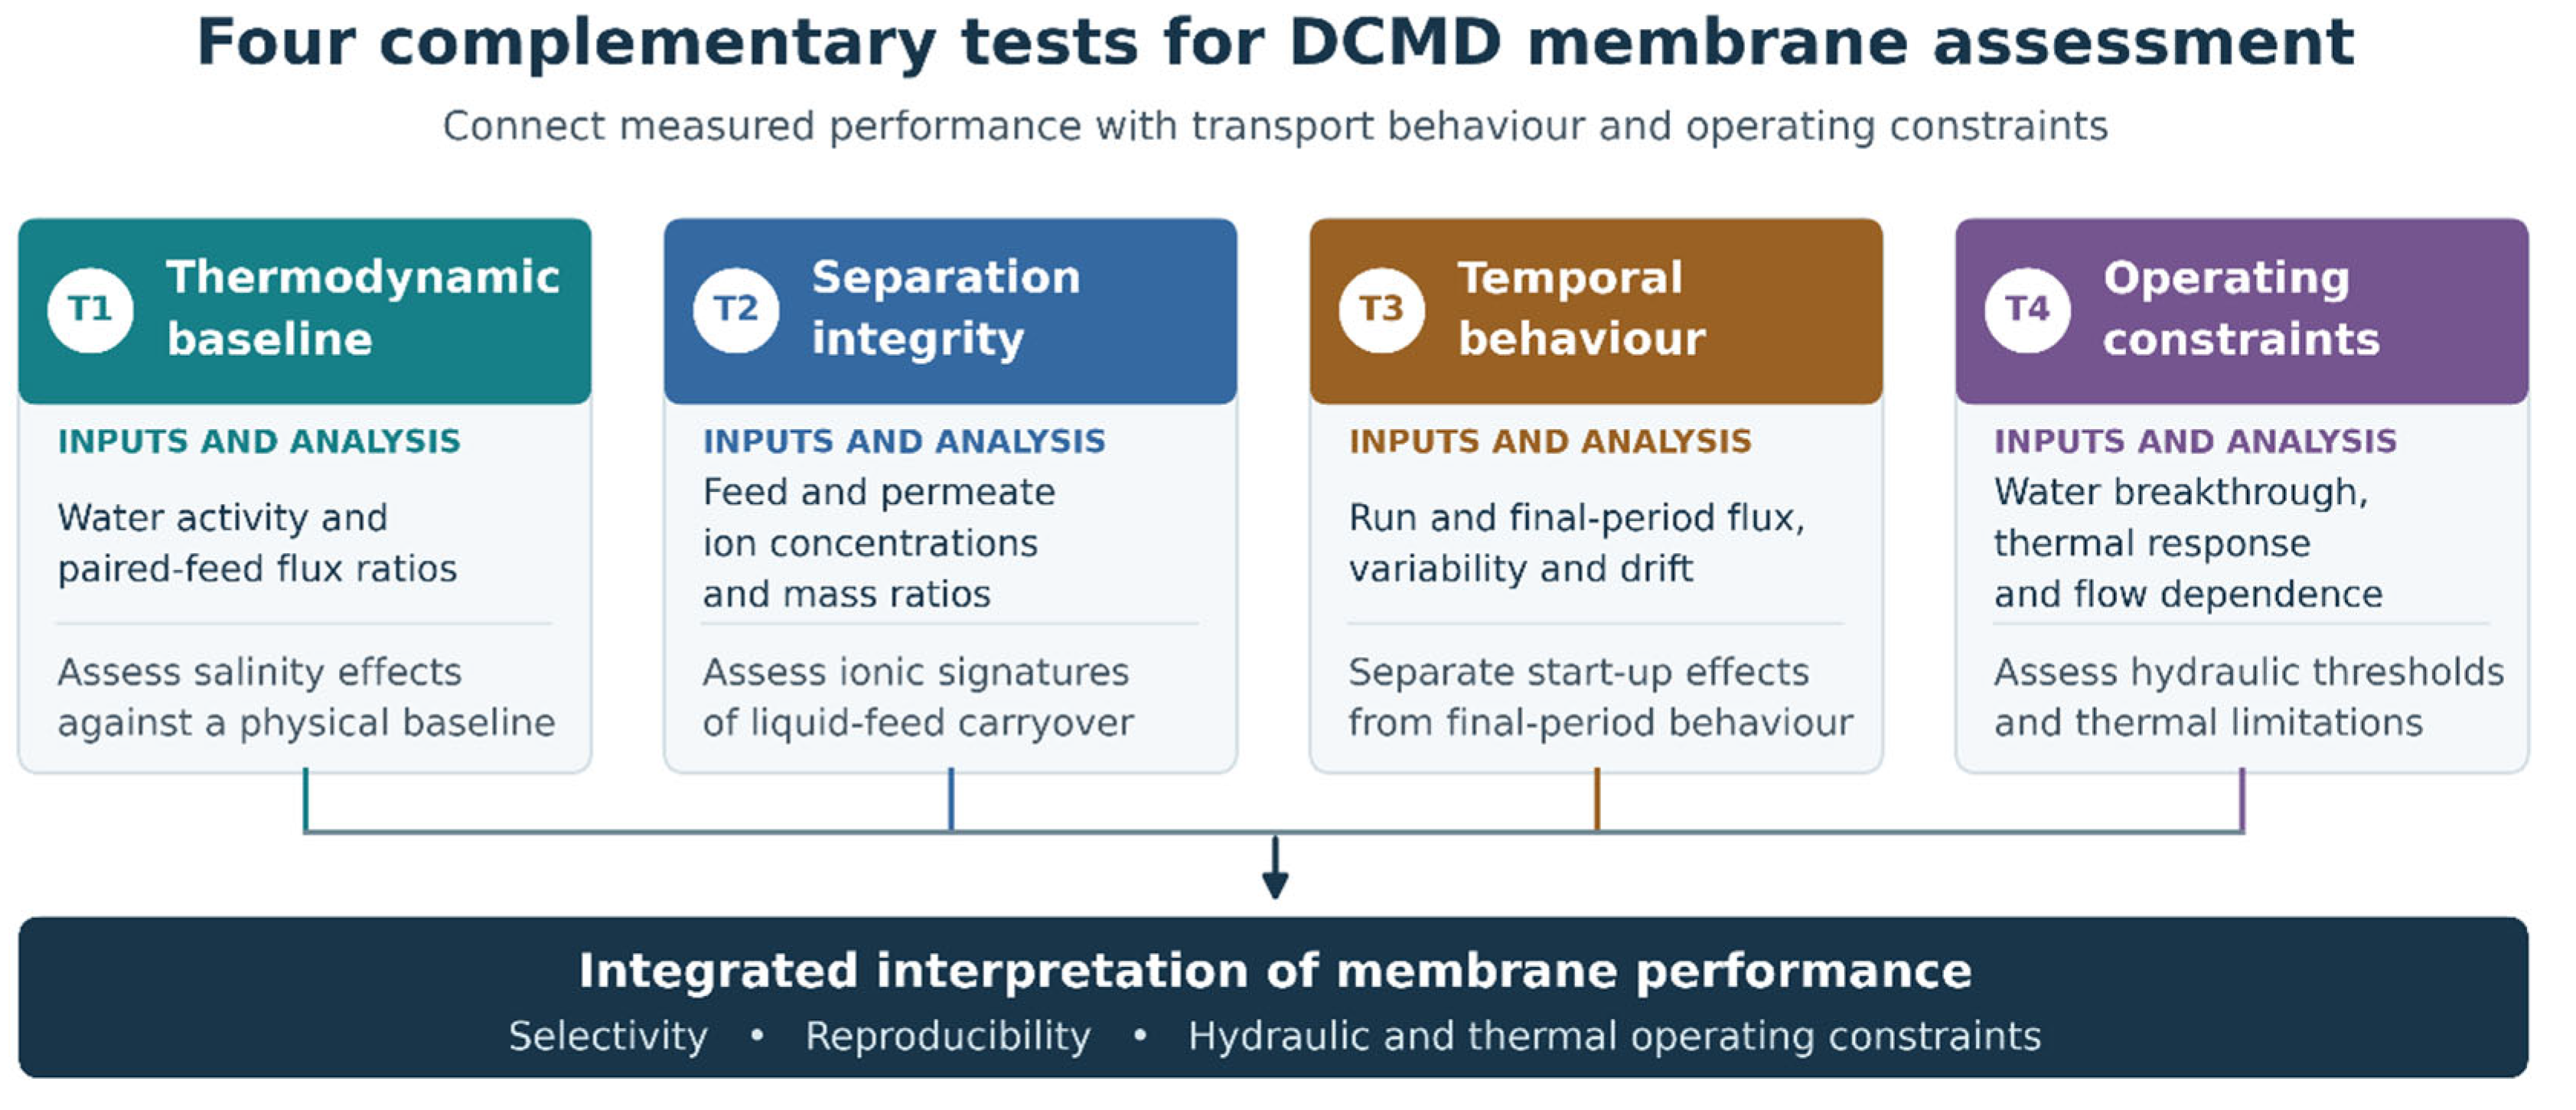
Figure 2.
Flux–time profiles during DCMD at feed/permeate temperatures of 70/20 °C: commercial PTFE membranes with (a) C1 and (b) C2, and (c) electrospun PS-Q1 and PS-Q2 membranes.
Figure 2.
Flux–time profiles during DCMD at feed/permeate temperatures of 70/20 °C: commercial PTFE membranes with (a) C1 and (b) C2, and (c) electrospun PS-Q1 and PS-Q2 membranes.
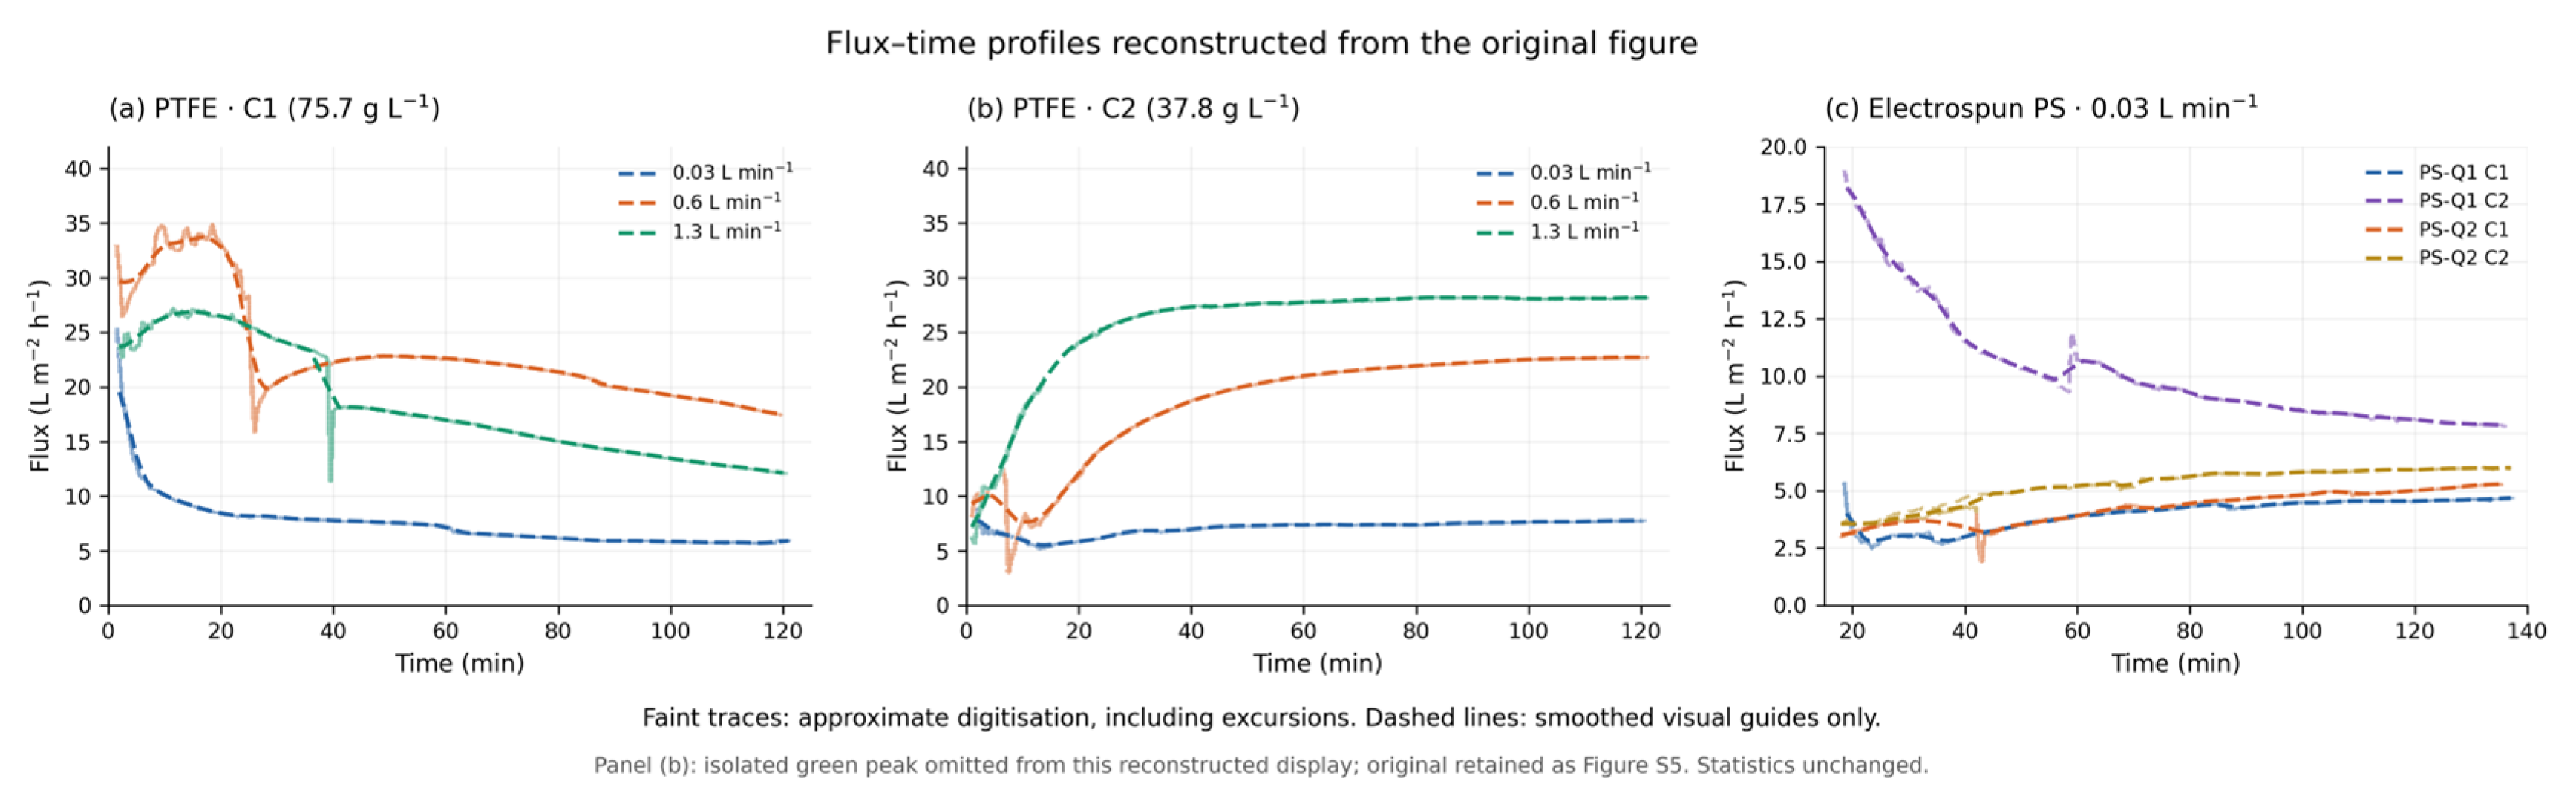
Figure 3.
Thermodynamic salinity test. Filled symbols: ratio of run-averaged fluxes with feeds C1 and C2; open triangles: ratio of final-30-min fluxes for the same runs. The shaded band (0.952–0.975) is the range predicted by Equation (4). PS series values are from test series A and B.
Figure 3.
Thermodynamic salinity test. Filled symbols: ratio of run-averaged fluxes with feeds C1 and C2; open triangles: ratio of final-30-min fluxes for the same runs. The shaded band (0.952–0.975) is the range predicted by Equation (4). PS series values are from test series A and B.
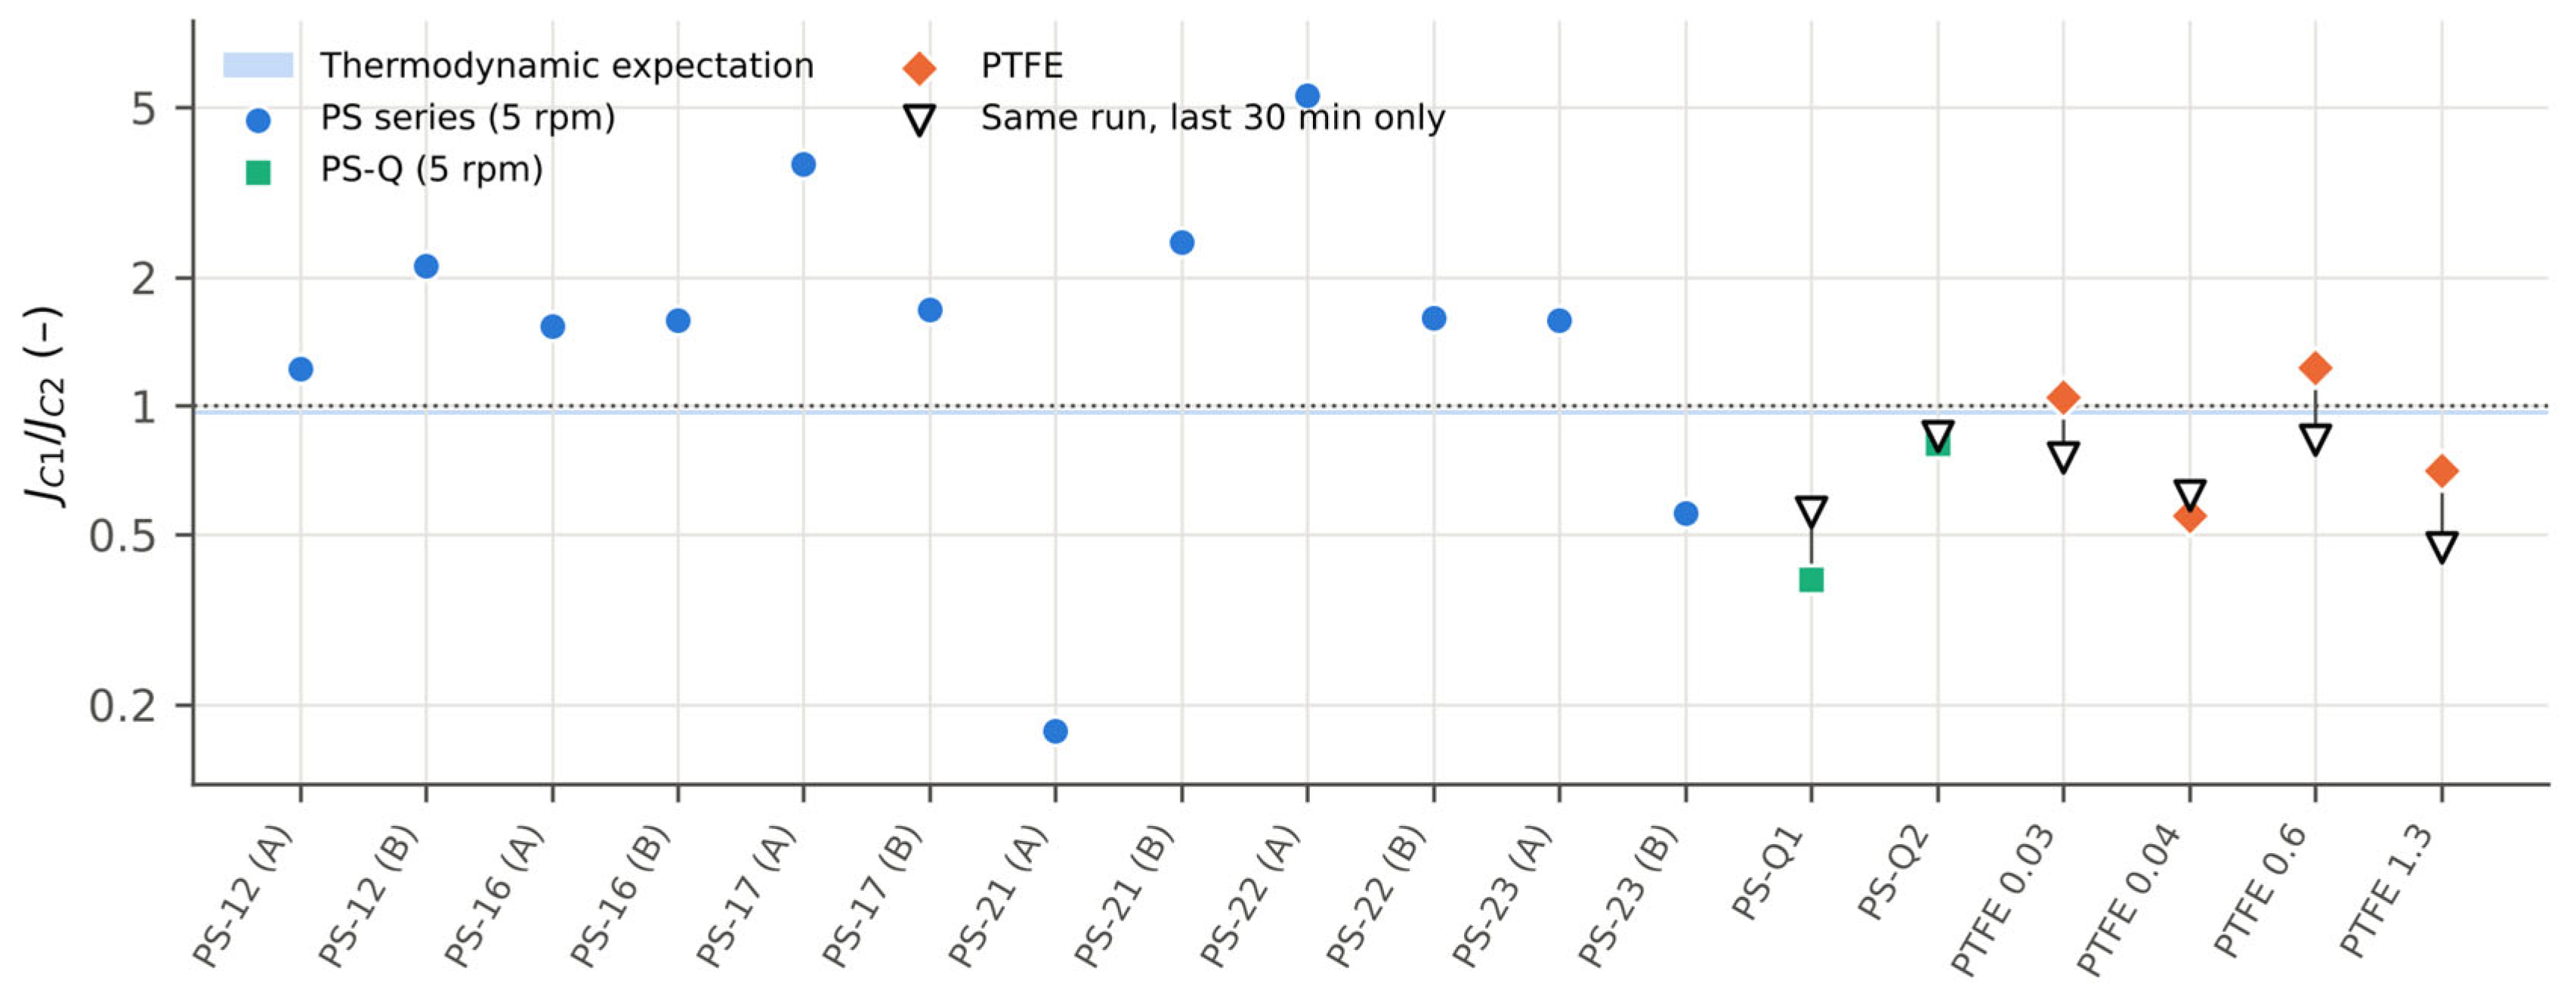
Figure 4.
Feed-signature test. (a) Chloride passage cp/cf (logarithmic scale). (b) Permeate Cl−/Na+ mass ratio versus permeate Na+ concentration. The dashed line denotes the feed Cl−/Na+ ratio; proximity to this line is consistent with liquid-feed carryover. The dotted curve represents a constant chloride concentration of approximately 1 mg L−1 and illustrates a possible background contribution; it is not a blank-corrected transport model.
Figure 4.
Feed-signature test. (a) Chloride passage cp/cf (logarithmic scale). (b) Permeate Cl−/Na+ mass ratio versus permeate Na+ concentration. The dashed line denotes the feed Cl−/Na+ ratio; proximity to this line is consistent with liquid-feed carryover. The dotted curve represents a constant chloride concentration of approximately 1 mg L−1 and illustrates a possible background contribution; it is not a blank-corrected transport model.
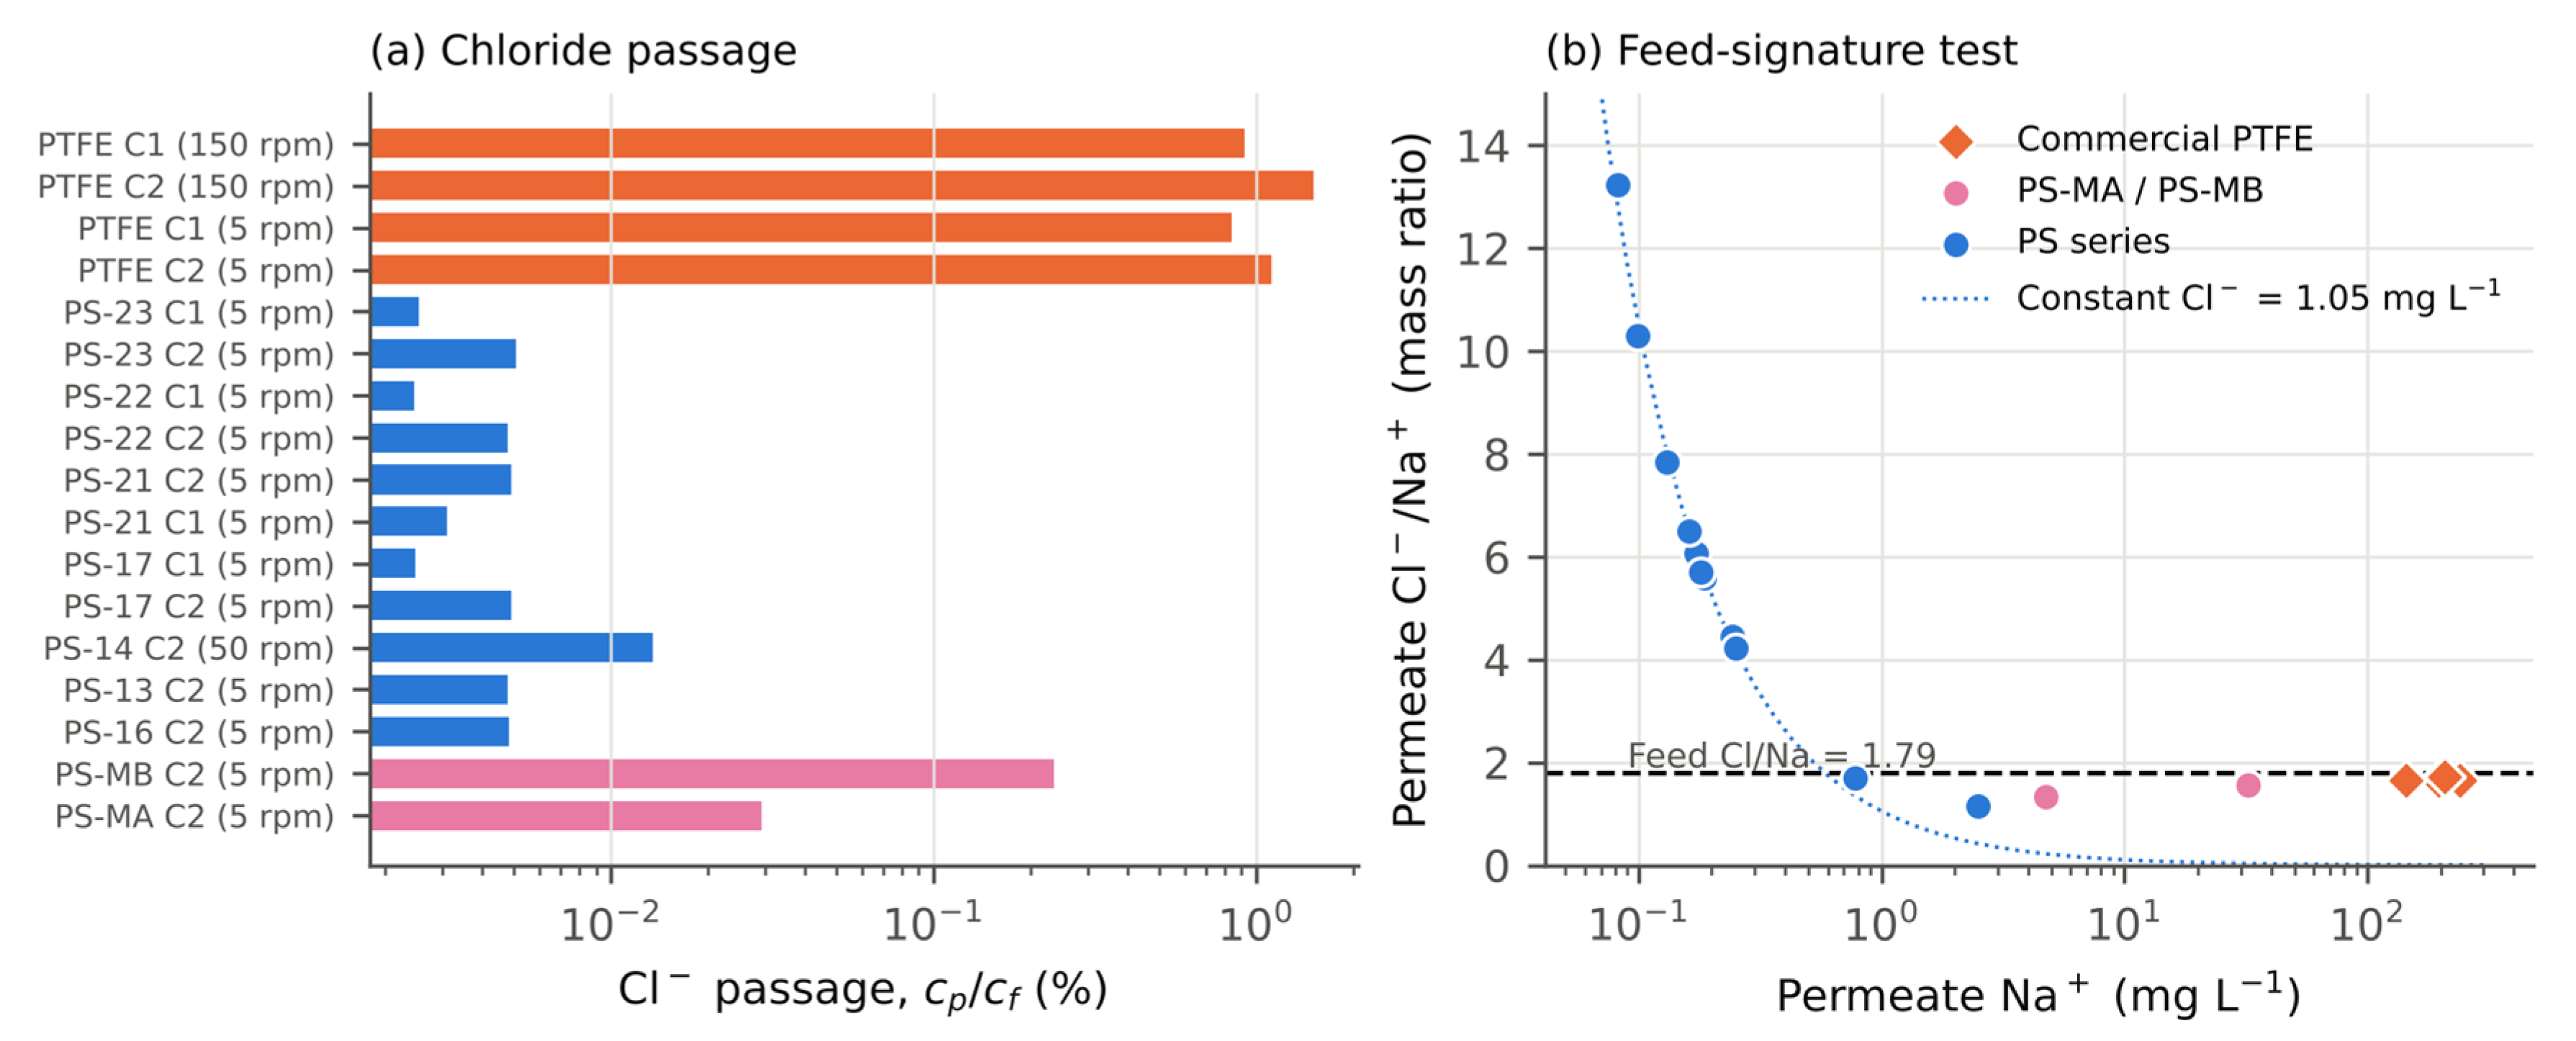
Figure 5.
(a) Flux versus volumetric flow rate for the commercial membranes with power-law fits; the dotted line is a slope-1/3 guide. (b) Feed-side temperature drop due to latent heat alone (Equation 6) for three flux levels; the dotted vertical line marks the 0.03 L min−1 condition used for the PS membranes.
Figure 5.
(a) Flux versus volumetric flow rate for the commercial membranes with power-law fits; the dotted line is a slope-1/3 guide. (b) Feed-side temperature drop due to latent heat alone (Equation 6) for three flux levels; the dotted vertical line marks the 0.03 L min−1 condition used for the PS membranes.
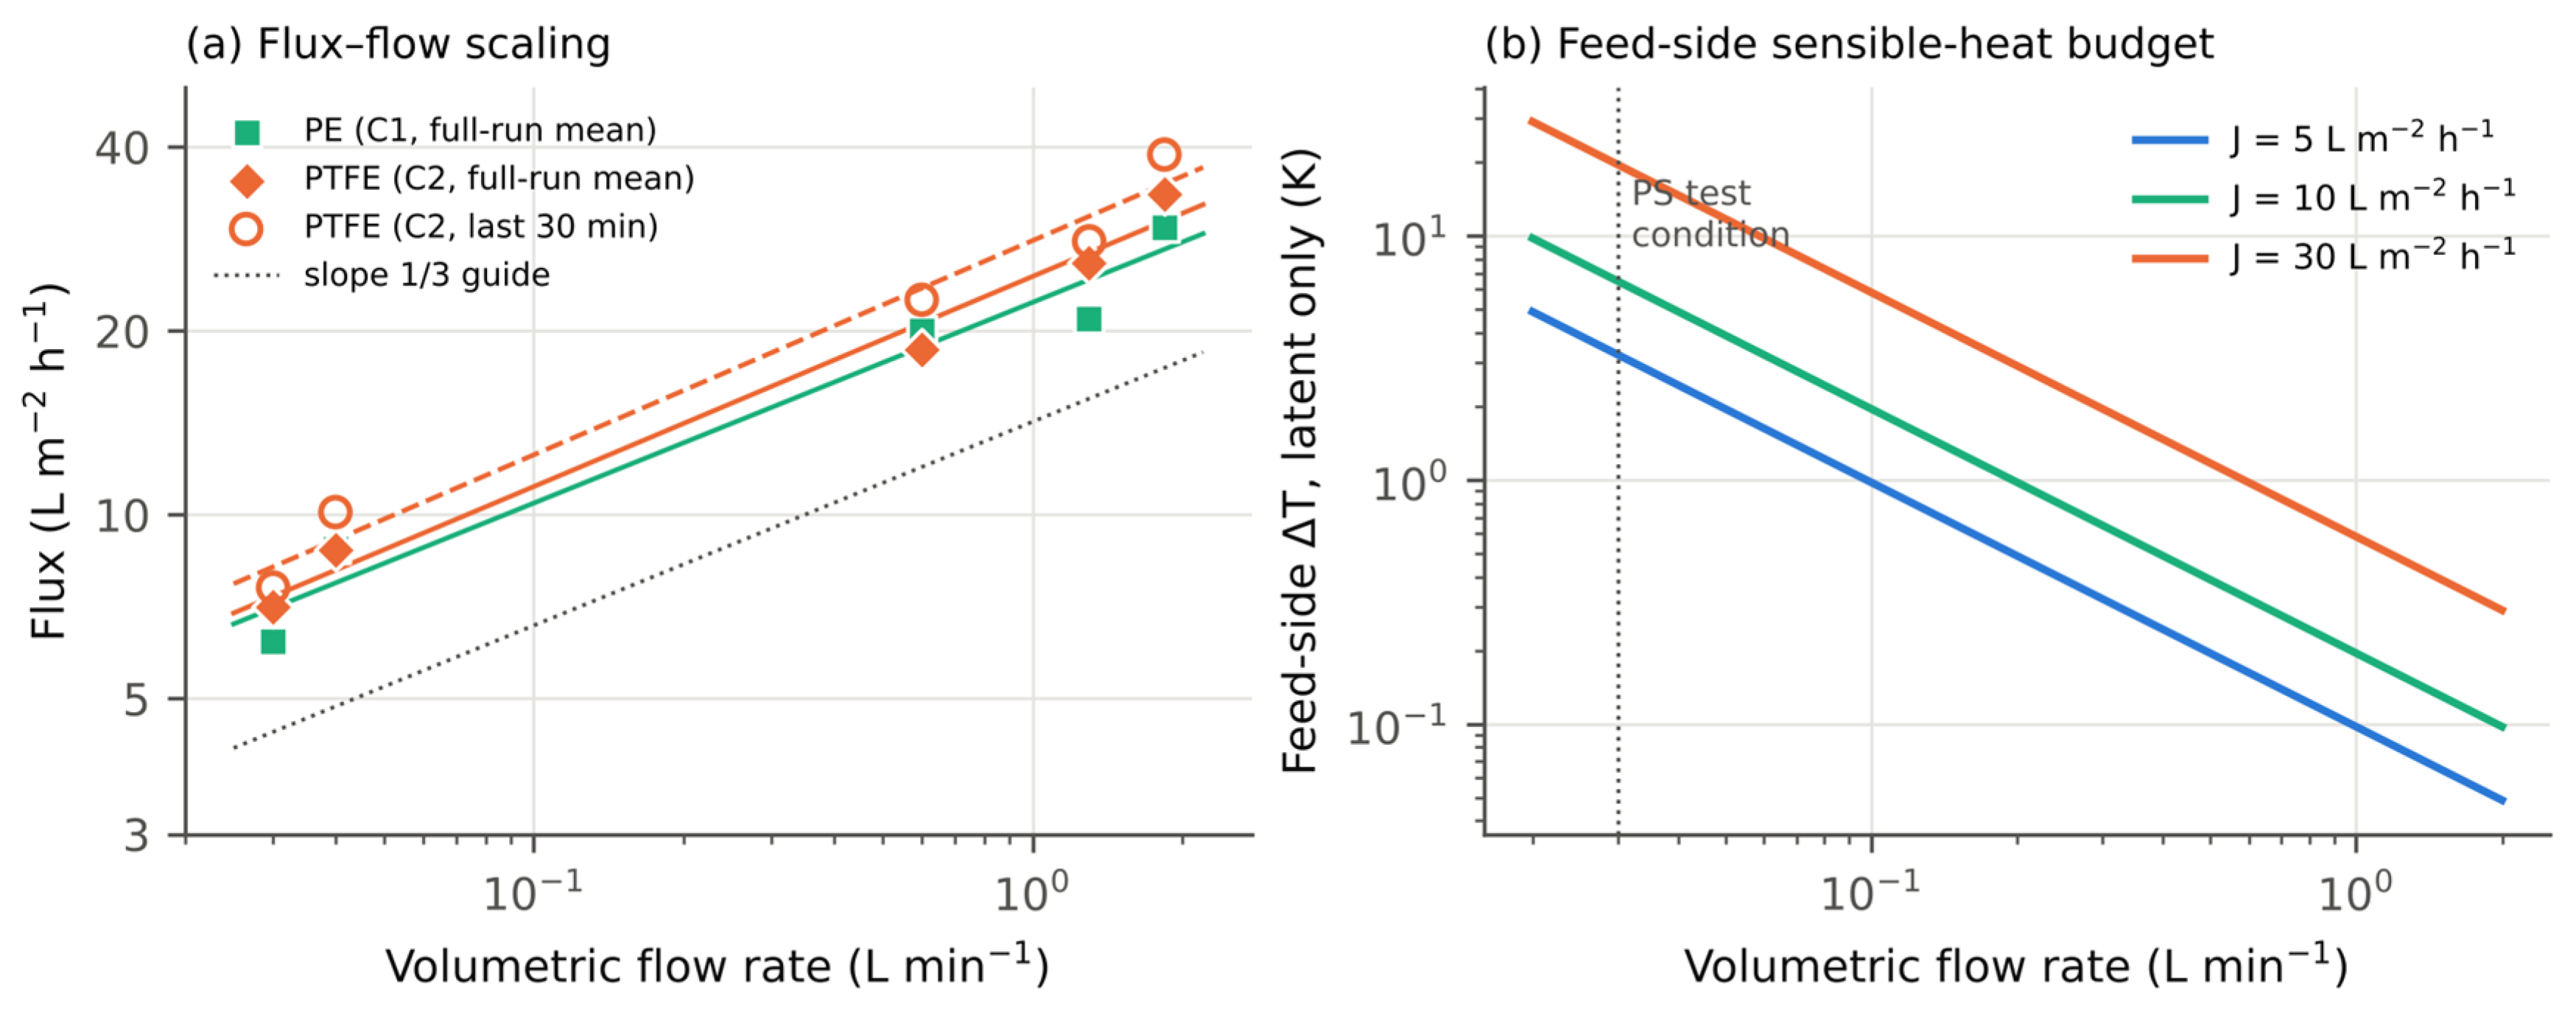
Figure 6.
(a) Water-breakthrough pressure versus thickness of consolidated PS membranes with and without PTFE particles. (b) Contact angles before and after pressing (8 t), compared with commercial PTFE-coated polypropylene membranes of 0.45–5 µm nominal pore size.
Figure 6.
(a) Water-breakthrough pressure versus thickness of consolidated PS membranes with and without PTFE particles. (b) Contact angles before and after pressing (8 t), compared with commercial PTFE-coated polypropylene membranes of 0.45–5 µm nominal pore size.
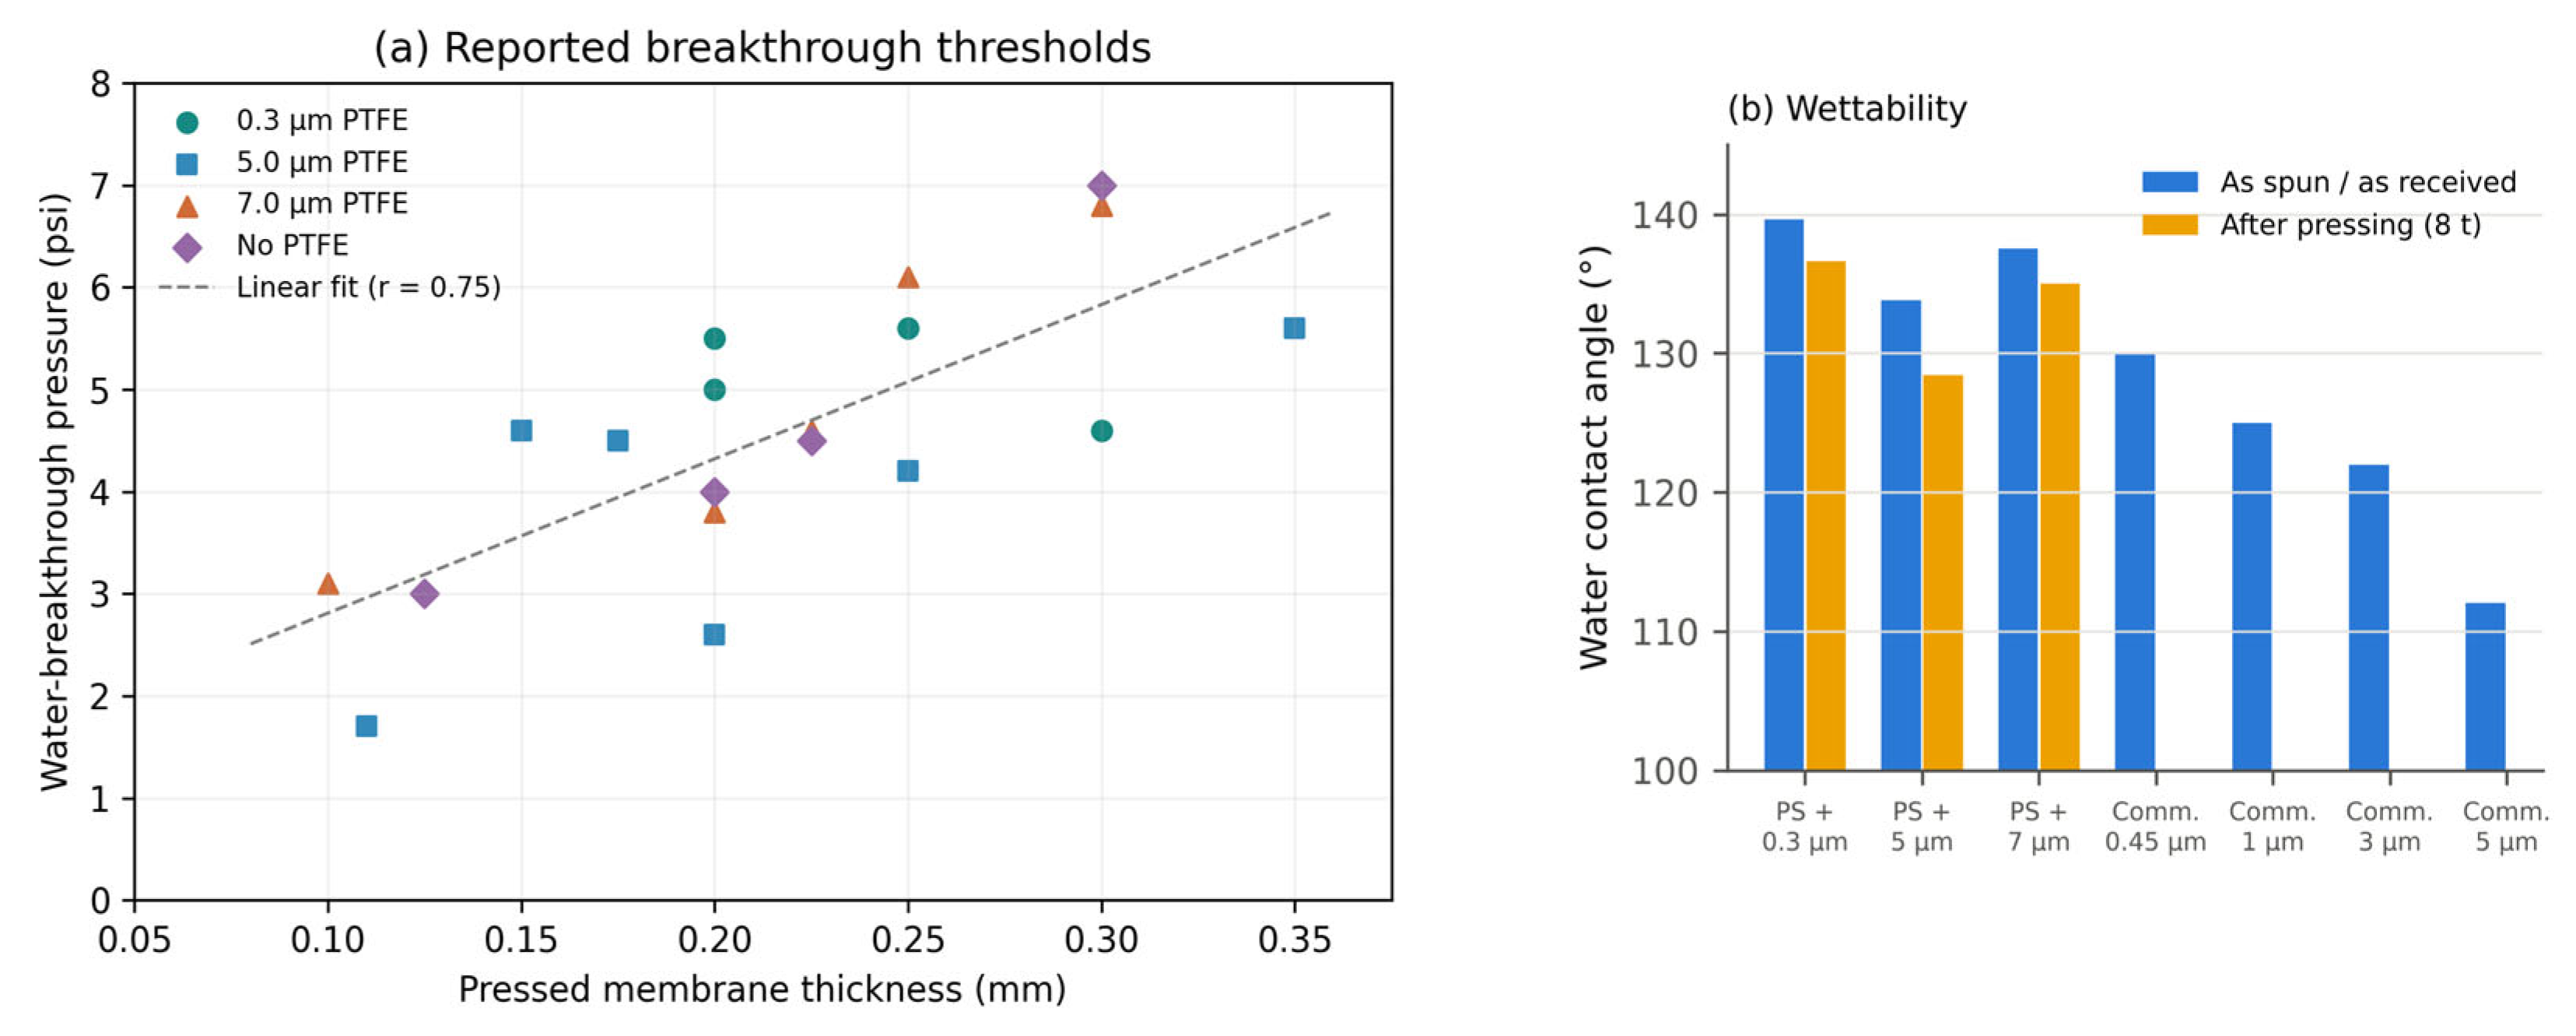
Figure 7.
Storage modulus of electrospun PS-Q1 after DCMD as a function of temperature (DMA, tension, 5 °C min−1). The shaded region marks network softening; the dashed line is the DCMD feed temperature.
Figure 7.
Storage modulus of electrospun PS-Q1 after DCMD as a function of temperature (DMA, tension, 5 °C min−1). The shaded region marks network softening; the dashed line is the DCMD feed temperature.
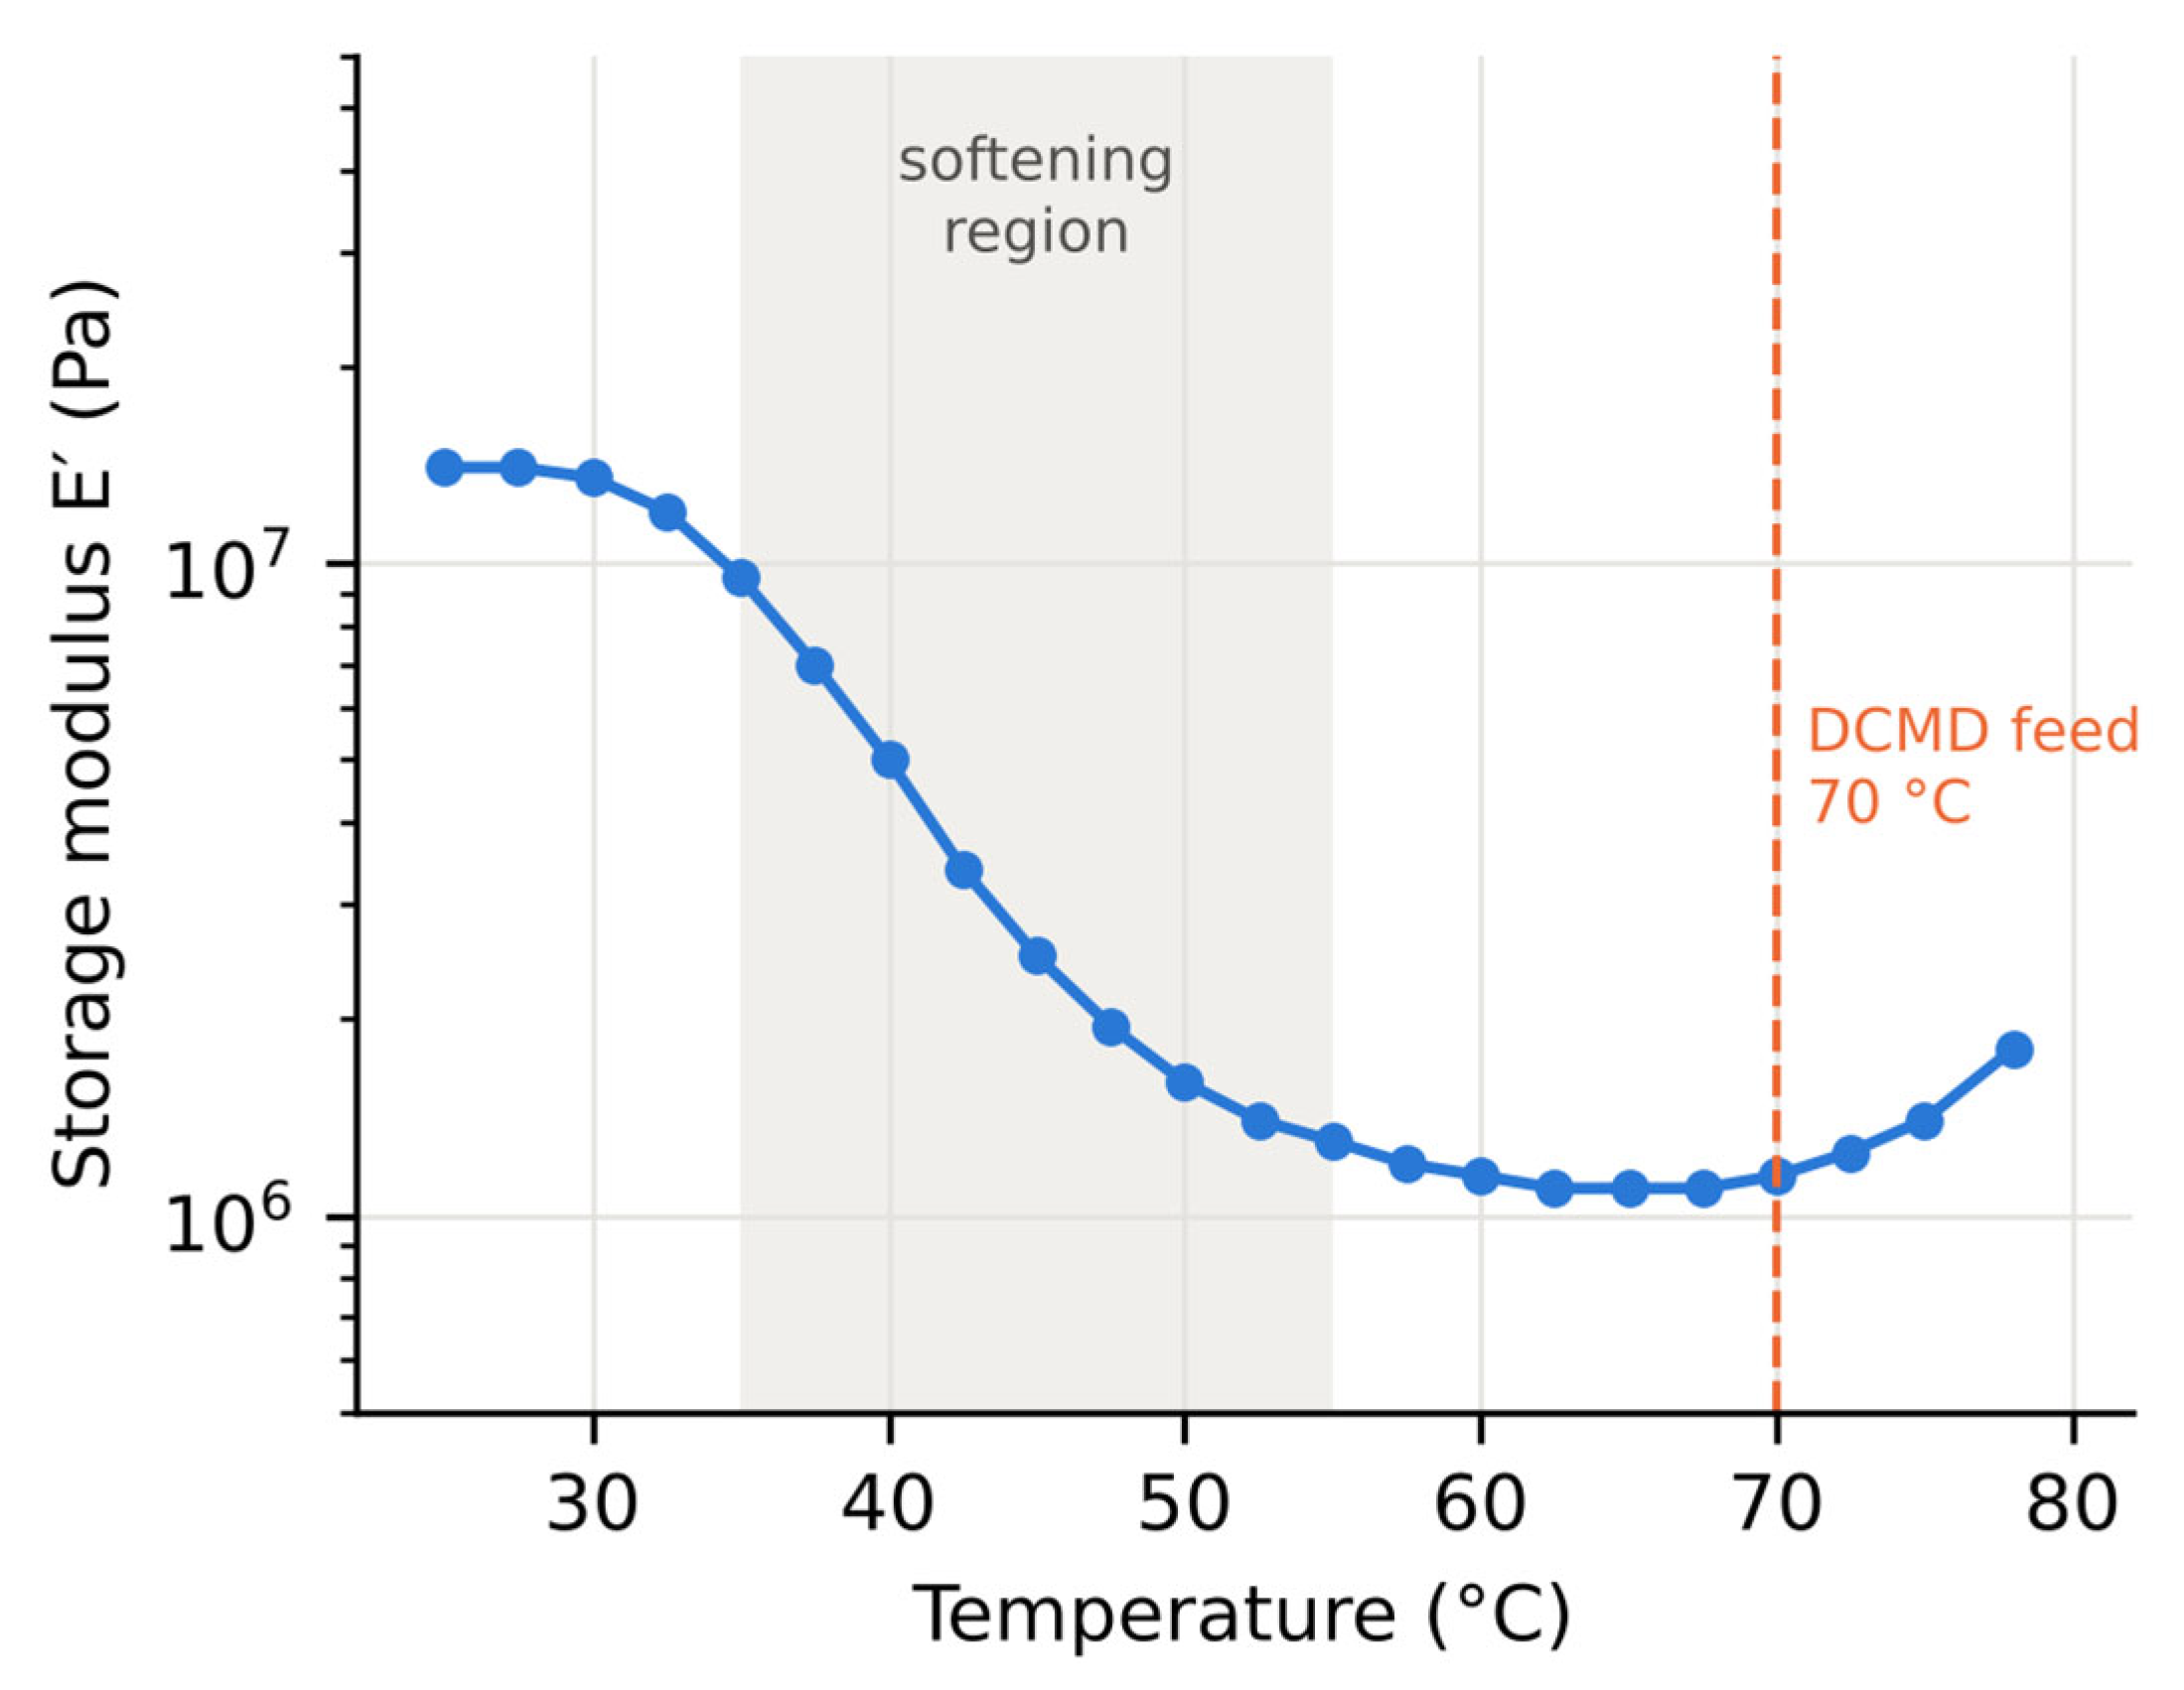
Figure 8.
(a) Fluxes of PS-12–PS-23 in two independent test series at identical nominal conditions; the dashed line is parity. (b) Flux (series A) versus as-prepared contact angle.
Figure 8.
(a) Fluxes of PS-12–PS-23 in two independent test series at identical nominal conditions; the dashed line is parity. (b) Flux (series A) versus as-prepared contact angle.
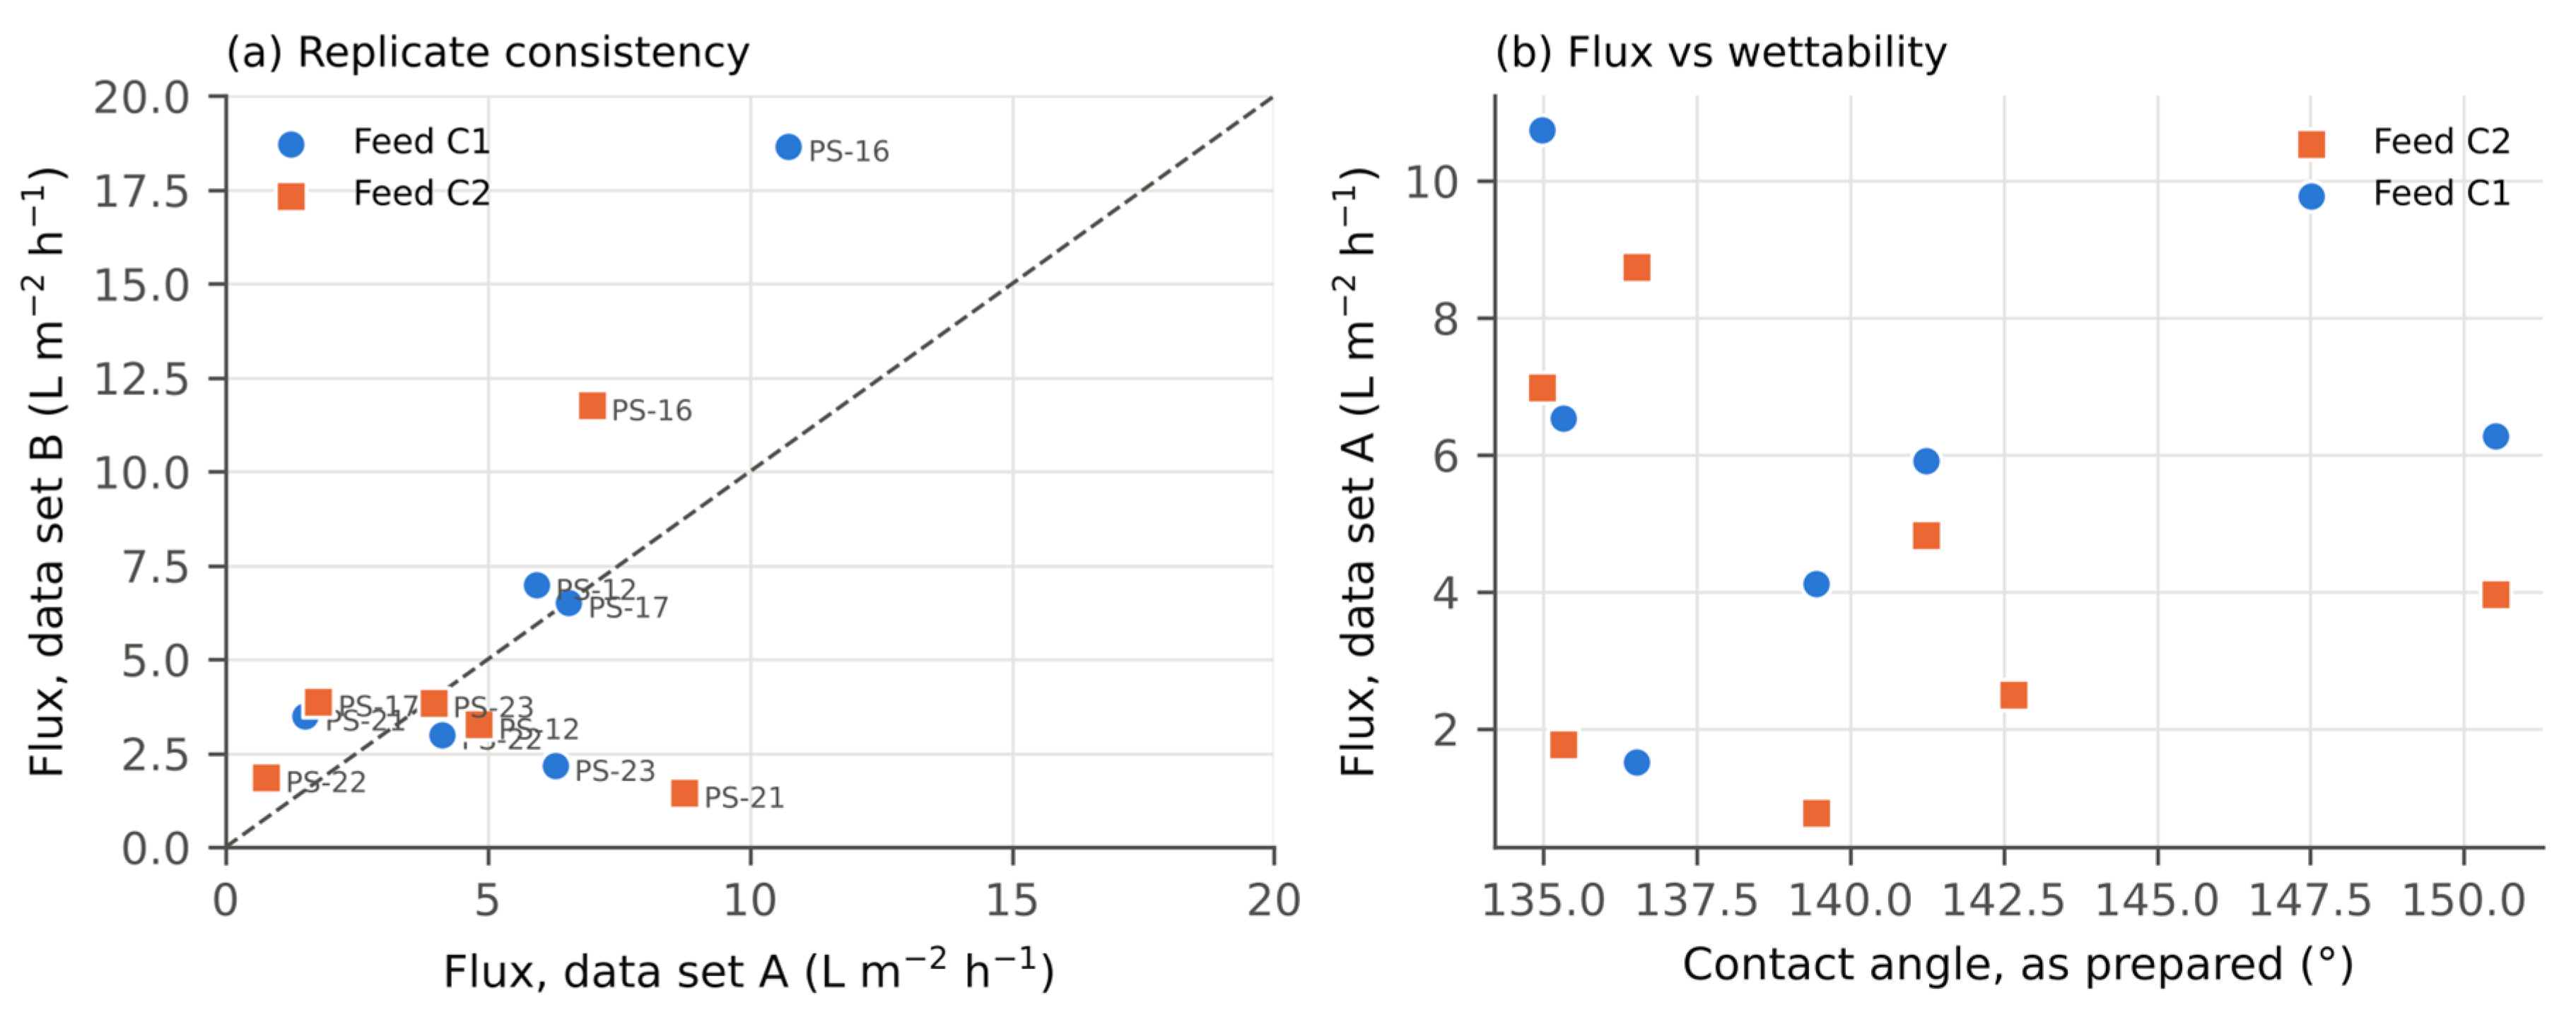

Table 1.
Membrane properties. CA: water contact angle; δ: thickness; df: mean fibre diameter.
| Membrane | PTFE (wt%) | df (µm) | CA (°) | δ (µm) | Measurements |
|---|---|---|---|---|---|
| PS-12 / 13 / 14 | 0 | 4.77 / 3.67 / 5.18 | 141.2 / 142.7 / 146.5 | 80 / 121 / 92 | Flux, IC |
| PS-15 / 16 / 17 | 0.5 | 5.24 / 5.05 / 4.56 | 137.8 / 135.0 / 135.3 | 79 / 62 / 68 | Flux, IC |
| PS-21 / 22 / 23 | 4.8 | 4.70 / 4.53 / 5.41 | 136.5 / 139.4 / 150.5 | 75 / 64 / 20 | Flux, IC |
| PS + 0.3/5/7 µm PTFE | – | 4.4–5.5 | 128–140 | 100–350 | Breakthrough pressure, CA |
| PS-Q1 / PS-Q2 | 0 | – | 139.9 / 146.1 | – | Flux–time, CA, DMA |
| PS-MA / PS-MB | 0 | – | – | 137–191 | IC |
| Commercial PTFE | – | – | 139.8 | 73–103 | Flux–time, IC, CA |
| Commercial PE | – | – | 112.2 | 15.5 | Flux |
Contact angles of the PS series are means of replicate drops (SD 0.5–5.2°).
Table 2.
Ionic composition of the synthetic brines (mg L−1).
| Ion | Na+ | Mg2+ | Ca2+ | K+ | Sr2+ | B | Cl− | SO42− | HCO3− | Br− | TDS |
|---|---|---|---|---|---|---|---|---|---|---|---|
| C1 | 23,876 | 2520 | 765 | 793 | 11 | 9 | 42,682 | 4229 | 726 | 67 | 75,678 |
| C2 | 11,938 | 1260 | 382 | 396 | 5 | 4 | 21,341 | 2114 | 363 | 33 | 37,836 |
Feed mass ratios used in the feed-signature test: Cl−/Na+ = 1.788; SO42−/Cl− = 0.0991; K+/Na+ = 0.0332.
Table 3.
Quasi-steady flux test (T3). Late mean = final 30 min; CV = coefficient of variation over the whole record.
Table 3.
Quasi-steady flux test (T3). Late mean = final 30 min; CV = coefficient of variation over the whole record.
| Run | Q (L min−1) | Run mean (LMH) | Late mean (LMH) | Late vs. run mean | CV (–) | Drift (LMH h−1) |
|---|---|---|---|---|---|---|
| PTFE C1 | 0.03 | 7.42 | 5.75 | −23% | 0.33 | −3.1 |
| PTFE C1 | 0.6 | 22.98 | 18.78 | −18% | 0.21 | −6.6 |
| PTFE C1 | 1.3 | 18.24 | 13.03 | −29% | 0.27 | −8.2 |
| PTFE C2 | 0.03 | 7.06 | 7.60 | +8% | 0.09 | +0.9 |
| PTFE C2 | 0.6 | 18.63 | 22.48 | +21% | 0.26 | +7.3 |
| PTFE C2 | 1.3 | 25.85 | 28.02 | +8% | 0.18 | +5.2 |
| PS-Q1 C1 | 0.03 | 3.97 | 4.56 | +15% | 0.16 | +1.0 |
| PS-Q1 C2 | 0.03 | 10.14 | 8.05 | −21% | 0.25 | −3.8 |
| PS-Q2 C1 | 0.03 | 4.30 | 5.02 | +17% | 0.15 | +1.0 |
| PS-Q2 C2 | 0.03 | 5.25 | 5.91 | +13% | 0.14 | +1.2 |
Table 4.
Summary of diagnostic observations. Unmeasured criteria are identified explicitly; diagnostic departures are not treated as proof of a unique failure mechanism.
Table 4.
Summary of diagnostic observations. Unmeasured criteria are identified explicitly; diagnostic departures are not treated as proof of a unique failure mechanism.
| Membrane | T1 salinity | T2 feed signature | T3 quasi-steady | T4 operating window |
|---|---|---|---|---|
| Commercial PTFE | Final-period ratio 0.47–0.84 | Feed-like ionic ratio; apparent R 98.5–99.2% | C1 decline; C2 rise | Operated across tested flow range; n ≈ 0.34 |
| Commercial PE | Not assessed | Not assessed | Late CV ≤ 0.03 | n ≈ 0.33; strength limits not quantified |
| PS-12–PS-23 | 0.17–5.35; includes specimen variability | Low ionic concentrations; apparent R ≥ 99.987% | Replicate-series difference 56% | Breakthrough pressure 1.7–7.0 psi |
| PS-Q1 / PS-Q2 | Final-period ratio 0.57 / 0.85 | Not assessed | PS-Q1 C2 decline from 19 to 8 LMH | DMA modulus decrease at 35–55 °C for PS-Q1 |
| PS-MA / PS-MB | Not assessed | MA: 6.2 mg L−1 Cl−; MB: possible carryover | Not assessed | Not assessed |
Table 5.
Comparison with published literature. Absolute fluxes are contextual benchmarks; differences in feed composition, temperature, module geometry and test duration preclude a direct performance ranking.
Table 5.
Comparison with published literature. Absolute fluxes are contextual benchmarks; differences in feed composition, temperature, module geometry and test duration preclude a direct performance ranking.
| Study and system | Reported conditions | Principal result | Relevance to this study |
|---|---|---|---|
| Present study: electrospun PS | 37.8/75.7 g L−1 mixed salts; 70/20 °C; 0.03 L min−1; 2 h | Series A: 0.8–10.7 LMH; series B maximum: 18.66 LMH. Reported apparent Cl− rejection ≥99.987% for the main PS series. | High apparent rejection; specimen variation and short test duration limit ranking. |
| Li et al. [30]: electrospun MD | 35 g L−1 NaCl; 60/20 °C | 22–26 LMH with wetting after ~10 h; 17–20 LMH with stability >24 h and LEP ~0.8–0.9 bar | Quantifies the flux–wetting-resistance trade-off under different conditions. |
| Salih et al. [29]: commercial PTFE | 10% (w/v) NaCl plus 10 mg L−1 PFPeA; 50–70/20 °C | PTFE NaCl/PFPeA rejection >99.7%; 48 h tests and 300 h laminated-PTFE study with cleaning | Support and cleaning affect durability; contaminated feed differs from this study. |
| Norouzi et al. [7]: DCMD and crystallisation | NaCl brines approaching saturation | CFD reproduced flux to ~90% saturation; pore-blockage model described subsequent decline | Supports separating water-activity effects from deposition; no transferable scaling threshold. |
| Topuz [14]: review of recycled polymers | Recycled PMMA example: 65 °C; 0.4 L min−1 | Peak flux 9.2 kg m−2 h−1; reported rejection >99.994% | Secondary-source benchmark; PMMA result must not be attributed to PS. |
| Jiao et al. [34]: solar interfacial evaporation | 24 wt% brine; solar irradiation | Stable evaporation with crystals localised on the exterior | Salt-management analogy; configuration differs fundamentally from DCMD. |
| Lee et al. [35]: electrospun PVDF-HFP and CNT composites | 35/70 g L−1 NaCl; 60/20 °C; 0.5 L min−1; counter-current DCMD | Unfilled membrane: 32.42/31.29 kg m−2 h−1 at 35/70 g L−1; ratio 0.965 (~3.5% decline) | Comparable salinity range; different salt chemistry, temperature and hydraulics. CNT flux enhancement required coupled heat/mass-transfer interpretation. |
| Santoro et al. [36]: Ru(phen)3-doped PVDF | Distilled-water feed; 60/20 °C; velocity 0.008–0.024 m s−1; co-current DCMD | Flux 14.4 → 18.2 kg m−2 h−1 (~26% increase); direct surface-temperature mapping | Independent evidence of thermal polarisation and flow effects; not a saline-rejection benchmark. |
| McGaughey and Childress [39]: wetting diagnostics | Multiple membrane types; recirculating distillate with overflow accounting | Solute balance separates net flux into liquid and vapour flux; identifies residual-solute mixing artefacts | T2 complements this established analysis; endpoint ionic ratios cannot quantify time-dependent leakage. |
| Niknejad et al. [40]: hot-pressed electroblown PS/HIPS | 55/15 °C; feed/permeate 0.48/0.24 L min−1; 24 h at each salinity | 35 → 70 g L−1 NaCl: P/H-1, 45.8 → 42.1; P/H-3, 48.1 → 46.5 kg m−2 h−1; rejection >99.9% | Direct PS-based comparator. Improved elongation; tensile strength and LEP were tested separately, not burst pressure. |
| Rácz et al. [41]: LEP methods | PVDF flat sheet; static test at 21–24 °C versus vacuum MD | Static LEP 2.37 ± 0.025 bar; vacuum-MD value 1.90 bar | Configuration-sensitive breakthrough limits; does not provide a rupture-test protocol. |
| Shaulsky et al. [42]: PVDF-coated electrospun PVDF-HFP | 1 M NaCl; 60/20 °C; feed/permeate velocities 15.2/7.6 cm s−1 | Control/thin/thick coating: ~70/~30/~10 LMH; LEP 56/163/325 kPa; thin-coated stability reported for 12 h | Thin coating improved tensile load capacity and extensibility; thick coating reduced extensibility. These are not rupture-pressure tests. |
| Li et al. [43]: cold-pressed electrospun PS-25 | 70/20 °C; 0.6 L min−1 both streams; ~10 h | 60 µm, 20 g L−1 NaCl: 104.8 ± 4.9; 120 µm, 35 g L−1: 51 ± 4.5 kg m−2 h−1; LEP 0.6/0.8 bar | Direct PS benchmark; feeds and flow differ from this study. Thickness and feed effects are confounded between the two flux values. |
Disclaimer/Publisher’s Note: The statements, opinions and data contained in all publications are solely those of the individual author(s) and contributor(s) and not of MDPI and/or the editor(s). MDPI and/or the editor(s) disclaim responsibility for any injury to people or property resulting from any ideas, methods, instructions or products referred to in the content. |
© 2026 by the authors. Licensee MDPI, Basel, Switzerland. This article is an open access article distributed under the terms and conditions of the Creative Commons Attribution (CC BY) license (http://creativecommons.org/licenses/by/4.0/).
Copyright: This open access article is published under a Creative Commons CC BY 4.0 license, which permit the free download, distribution, and reuse, provided that the author and preprint are cited in any reuse.