

Submitted:
20 October 2026
Posted:
21 October 2026
You are already at the latest version
Abstract
Background-oriented schlieren (BOS) is an optical method for measuring refractive dis- 13 placement without inserting a probe into the flow. Fourier-based methods such as fast 14 checker demodulation (FCD) can be affected by background occlusions and may produce 15 large displacement artifacts around obstructed regions or sharp displacement boundaries. 16 Correlation-based methods are generally more robust to local image disturbances, but 17 their spatial resolution is limited by the interrogation-window size. Here, we propose 18 stripe-decomposition BOS (SD-BOS), which extends GPU-accelerated Simplified BOS (S- 19 BOS) to two-component displacement measurement using a monochrome checkerboard. 20 SD-BOS separates the image into two orthogonal stripe carriers and calculates their phase 21 differences independently. Edge-adaptive blending and confidence-based occlusion han- 22 dling are used to reduce artifacts near sharp gradients and background obstructions. In 23 synthetic tests, SD-BOS reduced vector RMSE by 29.8% for a smooth Gaussian field and 24 21.9% for a shock-like field relative to FCD. For an opaque circular obstruction, the 95th- 25 percentile displacement error outside the detected mask was 86.4% lower than for FCD; 26 vectors within the mask were excluded. In wind-tunnel images, SD-BOS showed lower 27 image-space high-pass fluctuations than FCD, but no independent reference displacement 28 field was available to assess absolute accuracy. The complete SD-BOS pipeline processed 29 512 × 512-pixel images at 115.3 frames per second (fps) on an NVIDIA GeForce RTX 4070 30 SUPER GPU, approximately 23 times the CPU rate measured on an AMD Ryzen 7 5700X. 31 These results indicate improved robustness in the evaluated synthetic occlusion case and 32 highlight the need for independent validation of wind-tunnel measurements.
Keywords:
background-oriented schlieren
; stripe decomposition
; phase demodulation
; occlusion
; checkerboard background
; GPU computing
1. Introduction
Background-oriented schlieren (BOS) is a quantitative visualization method that measures refractive-index gradients from the apparent displacement of a patterned background [1,2]. Compared with conventional schlieren techniques, BOS requires a simpler optical arrangement and does not require a probe to be inserted into the flow. It has been applied to wind-tunnel experiments, ballistic measurements, and three-dimensional density reconstruction [3,4,5]. With known optical geometry and constitutive relations, the measured displacement can be related to density, temperature, or concentration distributions. NASA has noted that high-quality experimental data for computational fluid dynamics (CFD) validation of supersonic and hypersonic shock-wave/boundary-layer interactions remain scarce, partly because existing datasets may lack well-defined boundary conditions or sufficient repeatability [6]. Reliable measurement techniques are therefore important for supersonic wind-tunnel experiments.
Time-resolved BOS has also been used for optical velocimetry [7]. Lee et al. reconstructed time-resolved three-dimensional density fields of an underexpanded jet by combining 3D-BOS measurements from seven high-speed cameras operating at 5 kHz with microphone signals sampled at 200 kHz [8]. At this camera count and acquisition rate, the BOS system produces 35,000 camera images per second of measurement (7 × 5,000). Processing these images creates a substantial workload in time-resolved, multi-camera BOS, and the workload grows with camera count, acquisition rate, and recording duration. Higher processing throughput is therefore important for efficient analysis of such datasets.
Cross-correlation is widely used to determine displacement fields in BOS measurements [5,9]. Although correlation-based methods are relatively robust against background occlusions and local image disturbances, their spatial resolution is limited by the interrogation-window size [9]. In contrast, phase-based methods using periodic background patterns can provide displacement measurements at higher spatial resolution without local cross-correlation. Akatsuka et al. introduced Simplified BOS (S-BOS), which calculates displacement algebraically from image intensities using a periodic stripe background [10]. We subsequently implemented the S-BOS phase-difference calculation on a graphics processing unit (GPU), achieving a processing time of 85.0 ms for a 3712 × 5568-pixel image and a 129-fold improvement in pixel-normalized processing rate relative to our previous CPU implementation. Furthermore, real-time flow visualization was demonstrated at approximately 53 frames per second using 1080p images [11]. However, a single stripe pattern allows measurement of only the displacement component normal to the stripes. Colored-grid BOS addresses this limitation by separating the background pattern into two orthogonal stripe directions [12]. A monochrome camera is advantageous for high-speed measurements because displacement can be analyzed using a single intensity channel.
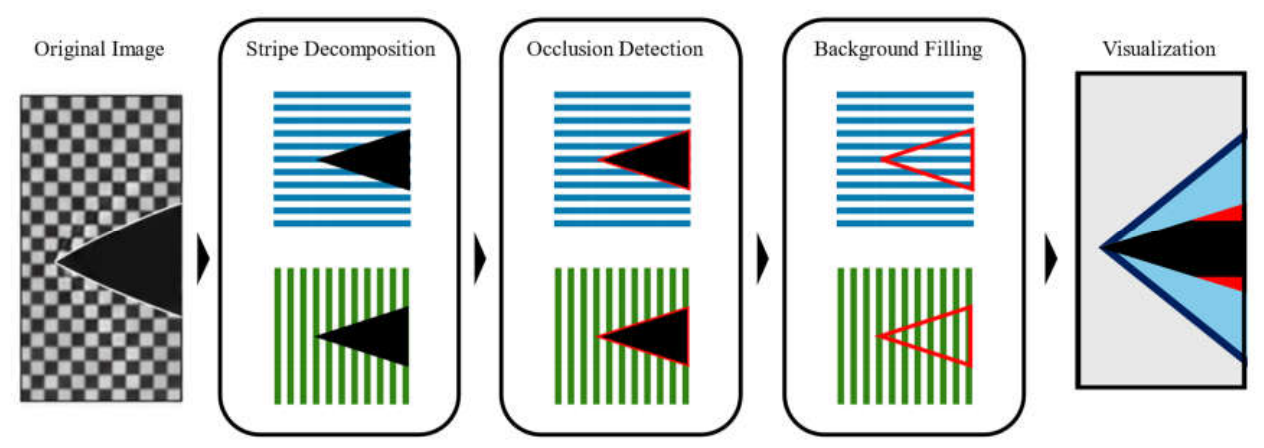
Fast checker demodulation (FCD) is a Fourier-based method that enables two-component displacement measurements using a monochrome checkerboard pattern [13]. FCD extracts two carrier peaks in the Fourier domain and determines displacement components from their phase differences. Opaque objects or saturated regions can add broadband spectral content that interferes with carrier extraction and may produce large displacement artifacts around obstructed regions. Fourier-domain filtering may also smooth sharp displacement boundaries, such as shock waves. These effects are relevant to wind-tunnel and ballistic experiments, where test models can obstruct portions of the background [4,5]. A BOS method that retains the spatial resolution of phase-based measurements while reducing artifacts caused by occlusions and sharp displacement boundaries is therefore of interest. To address these limitations, this study proposes stripe-decomposition BOS (SD-BOS), which extends GPU-accelerated S-BOS from single-component to two-component displacement measurements using a monochrome checkerboard pattern. The method decomposes the checkerboard image into two orthogonal stripe carriers using directional gradients and one-dimensional filtering. The S-BOS phase-difference calculation is then applied independently to each carrier to obtain the two displacement components. Edge-adaptive processing is used near sharp displacement gradients, and confidence-based occlusion masking identifies unreliable measurements in obstructed regions. These steps are intended to reduce artifacts while retaining the spatial resolution of phase-based displacement measurements.
We evaluate SD-BOS using controlled synthetic displacement fields and compare it quantitatively with FCD. The benchmark includes uniform translations, smooth and shock-like displacement fields, and an opaque circular obstruction. We also apply the method to previously acquired double-pass BOS images from a suction-type supersonic wind tunnel to visualize the shock-wave field. Finally, we measure the processing rate of the complete SD-BOS pipeline on a CPU and a GPU.
Figure 1.
Schematic drawing of the SD-BOS workflow.
2. Materials and Methods
2.1. SD-BOS Formulation
SD-BOS extends the GPU-accelerated S-BOS phase calculation to two components by separating a monochrome checkerboard into orthogonal carriers. Let I(x,y) be an experimental image and I0(x,y) be the corresponding reference image. The checkerboard is treated as the superposition of two approximately orthogonal periodic carriers. Directional processing extracts the carrier normal to the x direction and the carrier normal to the y direction. Their phase differences provide the horizontal displacement u and vertical displacement v, respectively. The present implementation uses monochrome images and outputs displacement in pixels.
2.2. Directional Stripe Decomposition
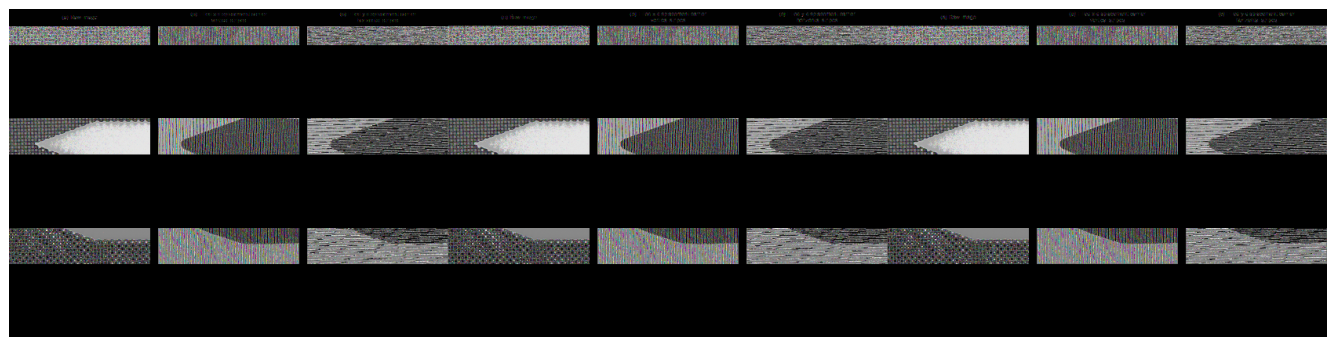
Horizontal and vertical Sobel gradients are calculated to extract the two families of checkerboard edges. The gradient images are not binarized. A one-dimensional box filter is applied perpendicular to each edge family. This suppresses the orthogonal pattern and connects the remaining response into a continuous stripe carrier. Figure 2 shows an example obtained from an experimental image. The vertical stripes are used to calculate horizontal displacement, and the horizontal stripes are used to calculate vertical displacement. The box-filter scale is 1.5 stripe periods. Neither the gradient image nor the reconstructed stripe image is binarized; the grayscale signal is retained to avoid staircase phase behavior that can arise when a smoothed carrier is converted to a square wave.
Here, t = 0 and t = 1 denote the reference and experimental images, respectively; Gx and Gy are the Sobel kernels, and Bx and By are one-dimensional box averages. The box-filter length is selected from the measured carrier frequency and set to 1.5 stripe periods.
Figure 2.
Directional decomposition of a monochrome checkerboard image into horizontal and vertical stripe carriers.
Figure 2.
Directional decomposition of a monochrome checkerboard image into horizontal and vertical stripe carriers.
2.3. Phase Calculation
For each directional carrier, we apply the GPU-accelerated S-BOS phase calculation described previously. The reference and experimental signals are band-pass filtered from 0.7f to 1.3f, where f is the measured carrier frequency for that direction. The resulting components are smoothed using a Gaussian low-pass filter with a cutoff of 0.25f, while a narrow notch suppresses residual energy at the orthogonal carrier. The phase difference is converted to displacement using f. The same parameters are used for all synthetic cases.
The S-BOS calculation combines the filtered reference and experimental stripe signals to form local complex quantities Z0 and Z1. Z0 provides the local reference-phase baseline, whereas Z1 encodes the phase relation between the reference and experimental carriers.
The phase difference is calculated from the argument of the complex product of Z1 and the complex conjugate of Z0, using the four-quadrant argument. Dividing the phase difference by 2πf converts it to displacement in pixels.
SD-BOS was implemented in Python using PyTorch [14], with image data and processing in 32-bit floating-point precision.
2.4. Edge-Adaptive Blending
An edge-sensitive branch is used to retain localized phase changes near a shock wave or model boundary. It uses adaptive smoothing over 1.25 stripe periods, a cutoff ratio of 0.7, and an edge-notch width ratio of 0.025. The Frobenius norm of the spatial gradient of the regular estimate is normalized between 0.02 and 0.05, clipped to [0,1], and smoothed with a 2-pixel Gaussian kernel to obtain the blending weight w. The regular estimate is used where gradients are small; the edge-sensitive estimate contributes progressively as the gradient increases. To limit the influence of the edge-sensitive estimate, it is clipped to the local range of the regular estimate over a neighborhood spanning one stripe period. The weight is set to zero where the edge-sensitive estimate is invalid.
Here, dL and dH denote the regular and edge-sensitive displacement estimates, respectively, and g is the Frobenius norm of the spatial gradient of the regular estimate. The Gaussian operator smooths the blending weight with a standard deviation of 2 px. The clip function limits its argument to [0,1]. LN and UN are the local lower and upper bounds of the regular estimate over a neighborhood N spanning approximately one stripe period. The edge-sensitive estimate is clipped to these bounds before blending; the neighborhood envelope limits dH but does not define the blending weight.
2.5. Occlusion Detection and Background Completion
Occlusion detection uses local confidence in each directional carrier, based on carrier coherence and the balance between reference and experimental carrier powers. The occlusion threshold is 0.2. The initial mask is dilated by one stripe period to include neighboring pixels that may be affected by filtering near the obstruction boundary. The mask is estimated from the first displacement pass.
Here, Cx and Cy denote directional confidence values, Dp denotes dilation by one stripe period, P0 and P1 are the local reference and experimental carrier powers, and τ = 0.2.
Before filtering and phase calculation are repeated, the experimental carrier is replaced with the corresponding reference carrier within the dilated mask. The final vectors in the mask are marked invalid and excluded from measurement statistics; background completion does not assign measured displacement to the occluded region.
2.6. Synthetic Validation Protocol
The synthetic reference image is a 512 x 512 monochrome checkerboard with a 16-pixel period. The pattern is rotated by 1.5 degrees, and Gaussian sensor noise with a standard deviation of 1.25 gray levels is added. The metrics are calculated in a central 400 x 400-pixel region. For each case, SD-BOS and FCD are evaluated on the same pixels: the intersection of this region, the SD-BOS valid mask, and finite FCD vectors. The test cases include known translations, a smooth Gaussian displacement field, a shock-like field, and an opaque circular obstruction with a radius of 88 pixels. FCD is applied to the same reference and deformed images.
2.7. Supersonic Wind-Tunnel Experiment
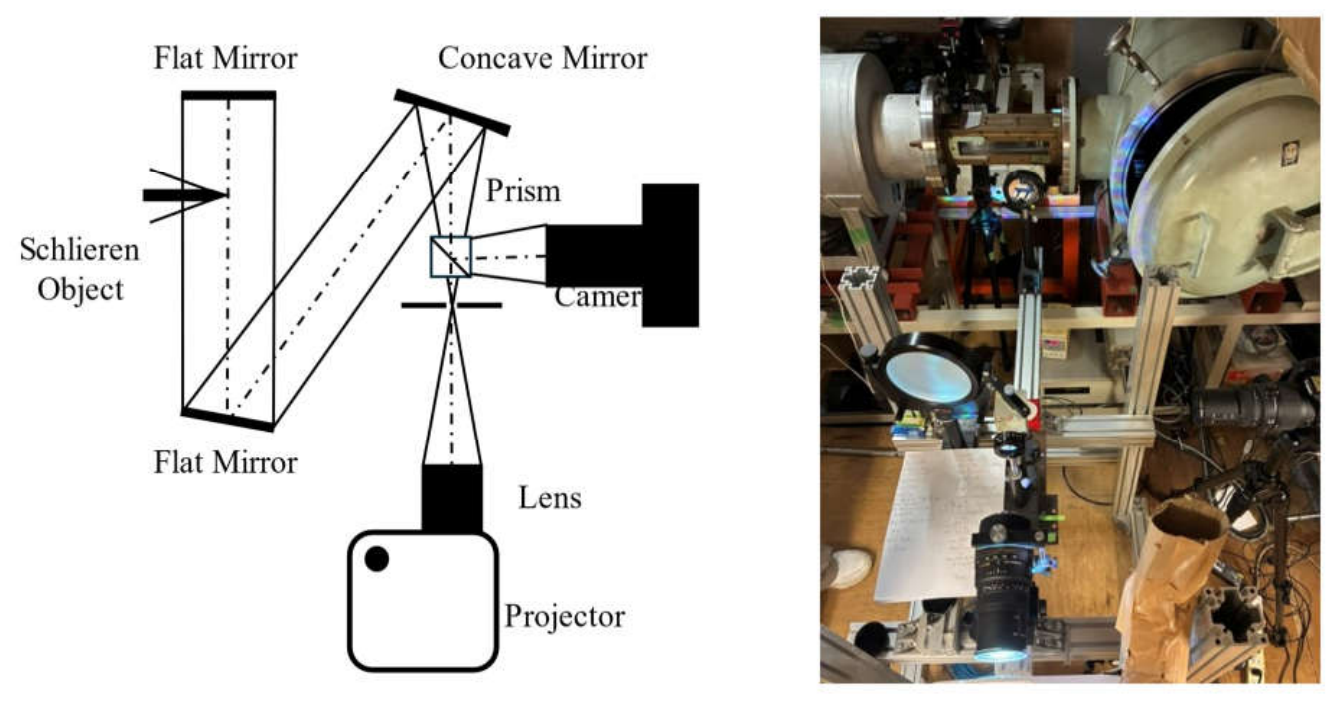
The wind-tunnel experiment was conducted in a suction-type supersonic wind tunnel at Chiba University. The double-pass imaging BOS (DPBOS) arrangement proposed by Hirose et al. [15] was used. As shown in Figure 3, a flat mirror was installed downstream of the test section. The light passed through the flow twice before returning to the camera, increasing the measured refractive displacement compared with a single-pass arrangement. The background and camera axes were aligned coaxially, and a projector displayed a monochrome checkerboard. An axisymmetric model and its shock-wave system were observed.
Three previously acquired wind-tunnel datasets, designated Cases A, B, and C, were reprocessed. The 2000 × 1400-pixel images corresponded to approximately 140 × 98, 282 × 198, and 259 × 181 checker squares (horizontal × vertical) for Cases A, B, and C, respectively. The fill ablation compares the original images with fields calculated after a frequency-predicted reference pattern was inserted into the detected model mask. For each vector field, the high-pass magnitude was calculated after subtracting a Gaussian-smoothed component (sigma = 15 px) from each displacement component. The arithmetic mean of this magnitude was calculated over all pixels outside the detected model mask. This whole-visible-field metric quantifies image-space fluctuations, not displacement error, because no independent displacement reference was available.
Figure 3.
Schematic and photograph of the double-pass BOS wind-tunnel setup.
2.8. Computational Performance Evaluation
GPU throughput was measured for the complete SD-BOS pipeline on 512 × 512-pixel images using an NVIDIA GeForce RTX 4070 SUPER. The image size was selected to match the resolution used for the previously measured FCD throughput. Each timed run processed 1,000 unique 8-bit images after 50 warm-up frames; five timed runs were performed, and the mean frame rate was reported. CUDA was synchronized before and after each timed run. The GPU timing included transfer of each input image from the CPU to the GPU, but excluded camera acquisition and display. The measured pipeline included directional stripe decomposition, phase-difference calculation, edge-adaptive blending, and occlusion handling. CPU throughput was measured separately on an AMD Ryzen 7 5700X using the same image size and algorithm parameters. Processing rate was calculated as the number of frames divided by elapsed time.
3. Results
3.1. Translation Recovery
SD-BOS recovered the imposed translations with near-unity gain and negligible bias across the evaluated range. The fitted slopes were 1.000107 in x and 1.000163 in y, with intercepts of −3.53 × 10⁻⁵ and −9.43 × 10−6 px, respectively. The maximum absolute median errors were 0.0233 px in x and 0.0232 px in y.
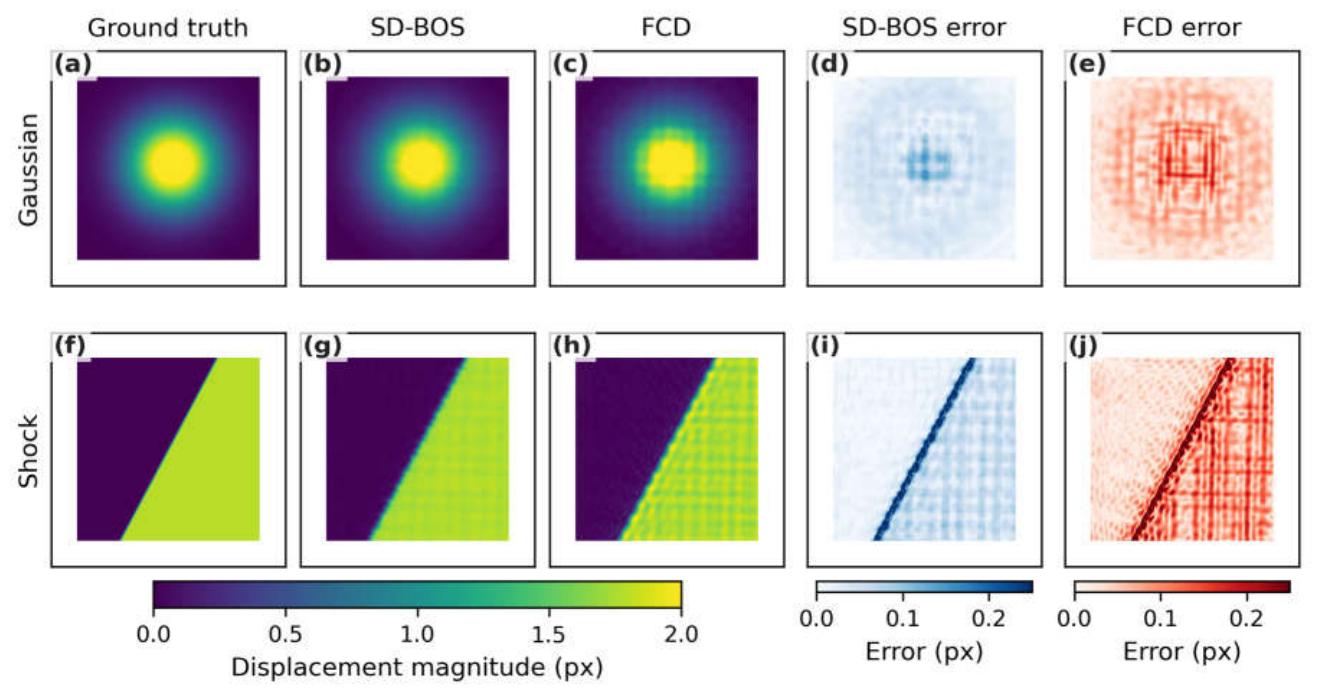
Figure 4.
Synthetic displacement-field comparison.
3.2. Smooth and Shock-Like Displacement Fields
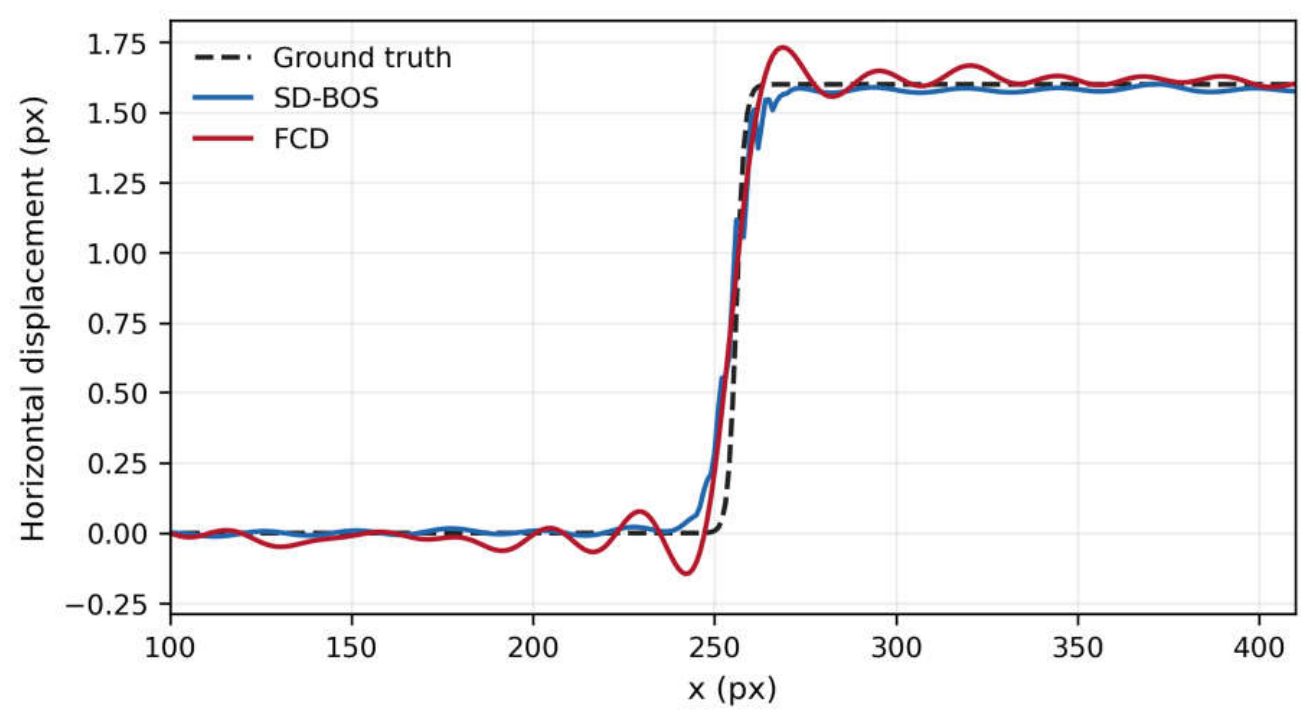
SD-BOS produced lower vector RMSE than FCD for both the smooth Gaussian and shock-like fields, with reductions of 29.8% and 21.9%, respectively. The RMSE values were 0.03997 versus 0.05693 px for the Gaussian field and 0.08334 versus 0.10677 px for the shock-like field. However, the recovered shock profile was less sharp than the prescribed field: its 10–90% edge width was 13.44 px, compared with 5.72 px for the prescribed field. Thus, SD-BOS reduced overall field error but did not fully preserve the sharpness of the shock boundary.
Figure 5.
Recovered shock-profile comparison.
3.3. Occlusion Robustness
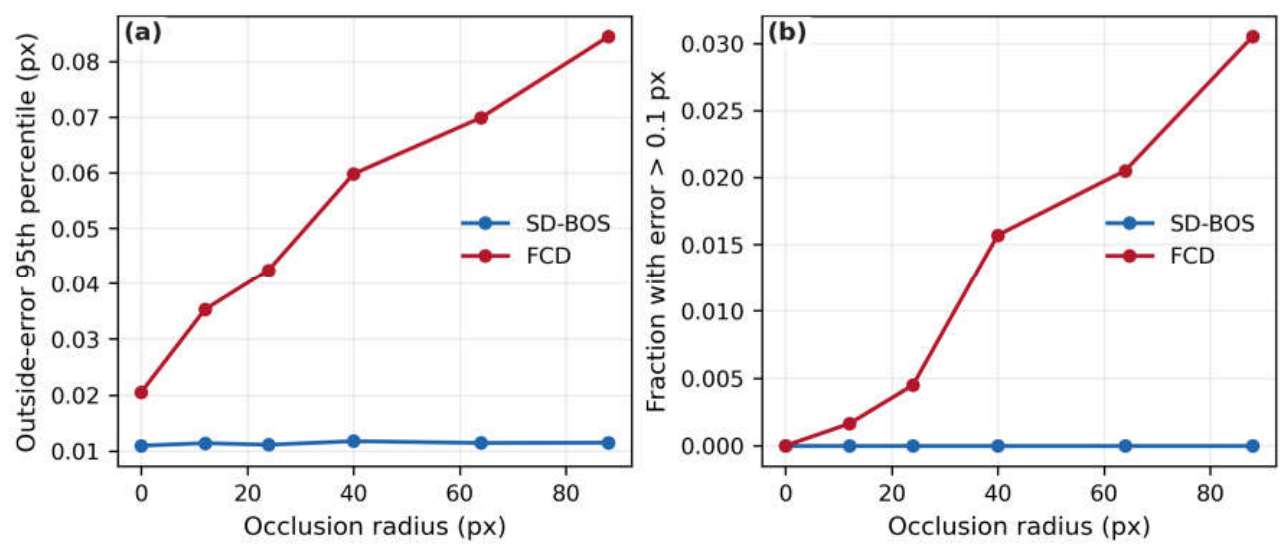
For the opaque obstruction with a radius of 88 pixels, the 95th-percentile displacement error outside the obstruction was 0.01148 px for SD-BOS and 0.08444 px for FCD, an 86.4% reduction. The detected mask captured nearly all of the obstruction (recall 0.99996) with no false positives in the evaluation region (false-positive fraction 0.00000). The valid-pixel fraction was 0.832; vectors in the hidden region remained invalid rather than being assigned a displacement.
Figure 6.
Occlusion robustness.
3.4. Wind-Tunnel Comparison with FCD
Figure 7 compares SD-BOS and FCD displacement magnitudes for three checkerboard frequencies, with and without reference-background filling. The row labels identify the wind-tunnel cases and checkerboard frequencies. For the filled condition, the detected model region was replaced by a pattern estimated from the surrounding reference image before displacement calculation. The field panels share a 0–5 px color range and do not show the model mask; values within the opaque model projection are not physical measurements. Wildeman [13] described reference-pattern fill-in as a way to suppress FCD masking artifacts and showed that it removed most artifacts around a moving hand. In the present wind-tunnel images, the pattern hidden by the model had to be estimated, so the fill approximates the unobstructed checkerboard.
Figure 7.
Wind-tunnel displacement fields.
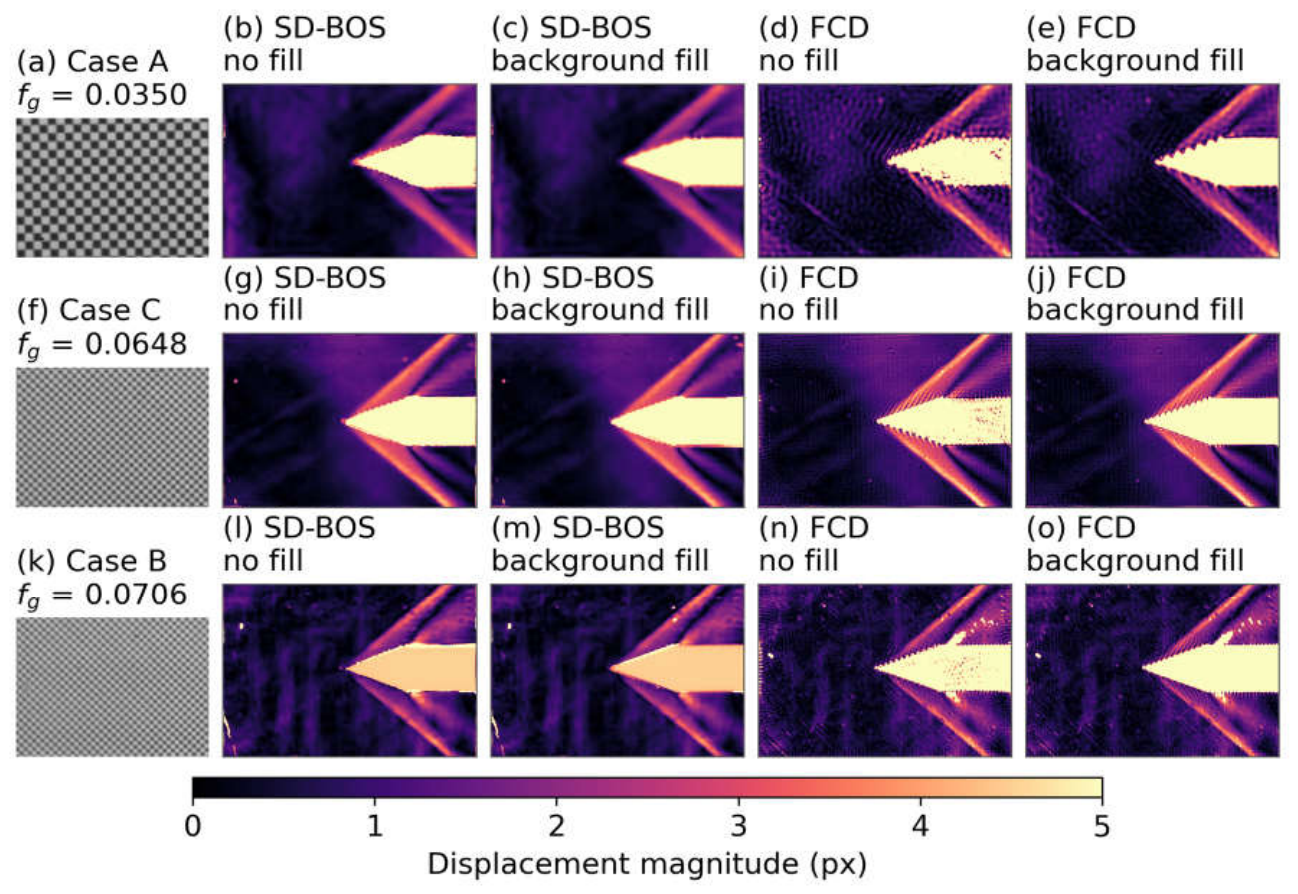
Figure 8 reports the mean high-pass magnitude over the visible field outside the detected opaque-model mask. Averaged across the three cases, SD-BOS decreased from 0.1455 px without fill to 0.1283 px with fill (11.8%), while FCD decreased from 0.3528 to 0.3017 px (14.5%). SD-BOS had a lower whole-field mean than FCD in every case, both before and after filling. The three-case averages do not show a larger overall reduction for SD-BOS or a negligible effect on FCD. The effect varied by case: in Case A, the mean decreased by 40% for SD-BOS and 27% for FCD; reductions were smaller in Cases C and B. These image-space metrics do not establish displacement accuracy.
Figure 8.
Whole-field background-fill effect.
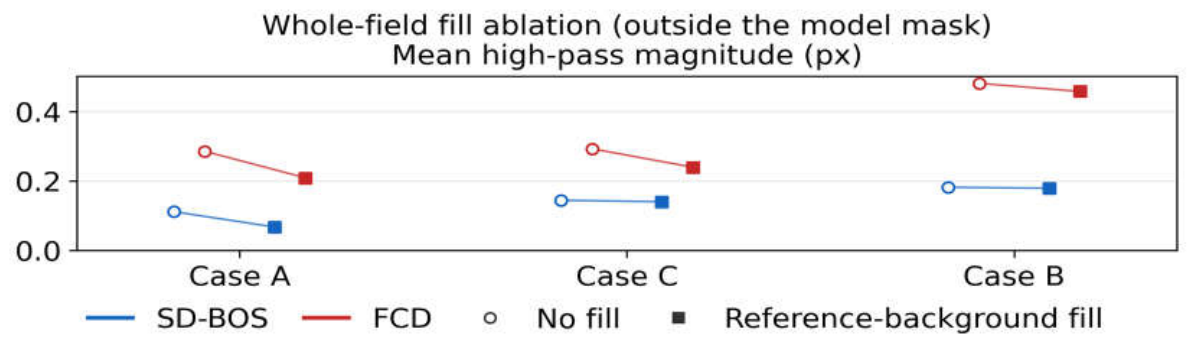
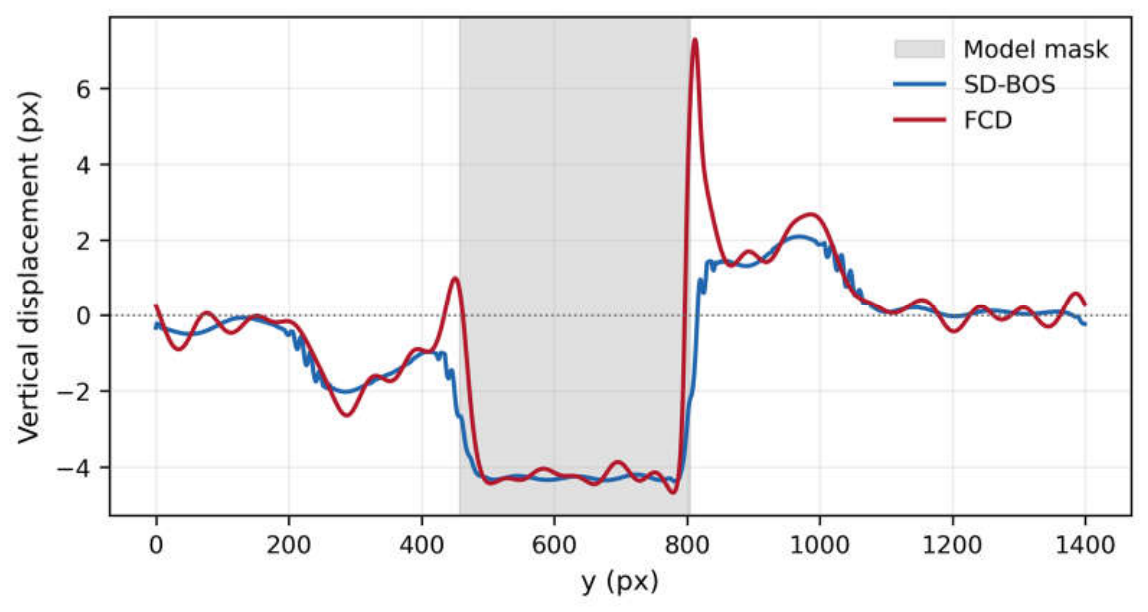
Figure 9 and Figure 10 show Case A profiles from the background-filled condition along the horizontal line at y = 100 px and the vertical line at x = 1500 px, respectively. The y = 100 px line lies outside the detected model mask, whereas the x = 1500 px line crosses it from y = 457 to 803 px. The gray band in Figure 10 marks the projected opaque model; values within it are not physical flow measurements.
Along the unobstructed y = 100 px line, SD-BOS showed smaller fluctuations than FCD. The difference is also visible next to the model boundary in the x = 1500 px profile: FCD has a sharp excursion immediately outside the mask, whereas the corresponding SD-BOS excursion is smaller. These profiles are consistent with the lower whole-field mean for SD-BOS in Case A. Because no independent displacement reference was available, the profiles compare image-space fluctuations rather than absolute displacement accuracy.
Figure 9.
Horizontal displacement profile after reference-background filling at y = 100 px, wind-tunnel Case A.
Figure 9.
Horizontal displacement profile after reference-background filling at y = 100 px, wind-tunnel Case A.
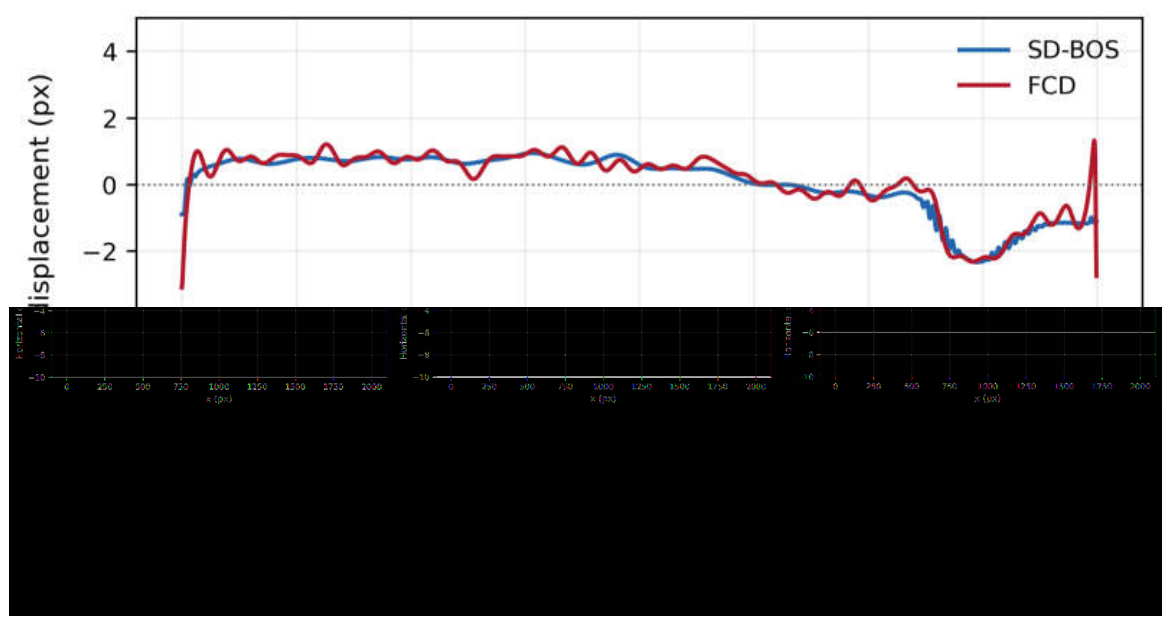
Figure 10.
Vertical displacement profile after reference-background filling at x = 1500 px, wind-tunnel Case A.
Figure 10.
Vertical displacement profile after reference-background filling at x = 1500 px, wind-tunnel Case A.
3.5. Processing Speed
For 512 × 512-pixel images, SD-BOS achieved mean processing rates of 5.0 fps on the AMD Ryzen 7 5700X CPU and 115.3 fps on the NVIDIA GeForce RTX 4070 SUPER GPU, corresponding to an approximately 23-fold GPU speedup under the tested conditions. Previously obtained FCD rates at the same image resolution were 50 fps on the CPU and 190 fps on the GPU. Because the SD-BOS and FCD measurements were performed on different computer systems, these rates do not provide a direct comparison of their computational performance.
4. Discussion
The synthetic benchmark shows that SD-BOS reduces displacement error relative to FCD for the tested smooth and shock-like fields and reduces error outside the tested opaque obstruction. The confidence-based mask keeps vectors within the hidden region invalid, and temporary background completion is intended to limit filtering artifacts near the mask boundary. The recovered shock profile was nevertheless broader than the prescribed profile, so sharp displacement gradients were not fully preserved.
In the wind-tunnel images, SD-BOS had a lower mean high-pass magnitude than FCD in all three cases, both with and without reference-background filling. The line profiles also showed smaller excursions near the model boundary. These measures describe image-space fluctuations and do not establish absolute displacement accuracy. Reduced high-pass fluctuations do not necessarily indicate improved accuracy because physically meaningful sharp displacement variations may also contribute to high-frequency content.
The complete SD-BOS pipeline processed 512 × 512-pixel images at 115.3 fps on the tested GPU and 5.0 fps on the tested CPU. The previously measured FCD rates were obtained on different computer systems and therefore do not support a controlled comparison of computational efficiency. The measured GPU throughput demonstrates that SD-BOS can process these image sizes at more than 100 frames per second.
The present method estimates refractive displacement; it does not directly provide density or pressure. Quantitative reconstruction of these quantities requires suitable optical calibration, geometric information, and refractive-index relations. The main limitations of this study are the broadened recovered shock boundary and the absence of an independent displacement reference for the wind-tunnel images. Further work should validate the method against independent displacement measurements and assess its spatial resolution near sharp flow structures.
5. Conclusions
SD-BOS extends GPU-accelerated Simplified BOS to two-component displacement measurements from a monochrome checkerboard by combining directional stripe decomposition, edge-adaptive blending, and confidence-based occlusion handling. In synthetic tests, it reduced vector RMSE relative to FCD by 29.8% for a smooth Gaussian field and 21.9% for a shock-like field. Outside an opaque circular obstruction, the 95th-percentile error was reduced by 86.4% relative to FCD, while vectors inside the detected mask remained invalid. The recovered shock boundary was broader than the prescribed profile, indicating residual smoothing. For three previously acquired supersonic wind-tunnel datasets, SD-BOS produced two-component displacement fields and lower mean image-space high-pass fluctuations than FCD outside the detected model mask under both reference-background filling conditions. These comparisons do not establish absolute displacement accuracy because no independent reference field was available. The complete SD-BOS pipeline processed 512 × 512-pixel images at 115.3 fps on an NVIDIA GeForce RTX 4070 SUPER GPU, approximately 23 times the rate on the tested CPU. The FCD speed measurements were collected on different computer systems and are not directly comparable. Independent validation is needed to assess accuracy and spatial resolution in experimental shock-wave fields.
Author Contributions
Conceptualization, Y.O. and S.U.; methodology, Y.O.; software, Y.O.; validation, Y.O., S.S., and S.U.; formal analysis, Y.O.; investigation, Y.O. and S.S.; resources, M.O. and S.U.; data curation, Y.O.; writing-original draft preparation, Y.O.; writing-review and editing, S.U.; visualization, Y.O.; supervision, M.O. and S.U.
Funding
This research received no external funding.
Data Availability Statement
The SD-BOS implementation are datasets are available at ZENED[draft].
Conflicts of Interest
The authors declare no conflict of interest.
References
- Meier, G.E.A. Computerized background-oriented schlieren. Exp. Fluids 2002, 33, 181–187. [Google Scholar] [CrossRef]
- Richard, H.; Raffel, M.; Rein, M.; Kompenhans, J.; Meier, G.E.A. Demonstration of the applicability of a Background Oriented Schlieren (BOS) method. In Laser Techniques for Fluid Mechanics; Springer: Berlin, Germany, 2002; pp. 145–156. [Google Scholar] [CrossRef]
- Nicolas, F.; Todoroff, V.; Plyer, A.; Le Besnerais, G.; Donjat, D.; Micheli, F.; Champagnat, F.; Cornic, P.; Le Sant, Y. A direct approach for instantaneous 3D density field reconstruction from background-oriented schlieren (BOS) measurements. Exp. Fluids 2016, 57, 13. [Google Scholar] [CrossRef]
- Yamagishi, M.; Ota, M.; Ohtani, K.; Nagai, H. Three-dimensional density measurement around a Hayabusa re-entry capsule model in the ballistic range. Exp. Fluids 2025, 66, 12. [Google Scholar] [CrossRef]
- Richard, H.; Raffel, M. Principle and applications of the background oriented schlieren method. Meas. Sci. Technol. 2001, 12, 1576–1585. [Google Scholar] [CrossRef]
- Reising, H.H. Turbulent Shock-Wave/Boundary-Layer Interactions Without Sidewall Effects at Mach 2.5, 3.0, and 3.5—PIV Measurements from 2025 Test Entry; NASA Technical Memorandum NASA/TM-20250008885; NASA Glenn Research Center: Cleveland, OH, USA, 2025. [Google Scholar] [CrossRef]
- Zhou, T.; Balakrishnan, S.L.; Blaisdell, G.A.; Bane, S.P.M. Background-oriented-schlieren-based optical velocimetry of low-convective-Mach-number turbulent shear layers. Exp. Fluids 2025, 66, 122. [Google Scholar] [CrossRef]
- Lee, C.; Ozawa, Y.; Nagata, T.; Nonomura, T. Super-resolution of time-resolved three-dimensional density fields of the B mode in an underexpanded screeching jet. Phys. Fluids 2023, 35(6), 065128. [Google Scholar] [CrossRef]
- Raffel, M. Background-oriented schlieren (BOS) techniques. Exp. Fluids 2015, 56, 60. [Google Scholar] [CrossRef]
- Akatsuka, J.; Nagai, S.; Honami, S. Improved flow visualization methods based on the background oriented schlieren technique. Trans. Jpn. Soc. Mech. Eng. B 2011, 77, 2391–2400. [Google Scholar] [CrossRef]
- Ogasawara, Y.; Nose, N.; Ishibashi, A.; Sakuma, S.; Udagawa, S. Refractive displacement calculation with GPU-based acceleration for the BOS method using stripe patterned background image. In Proceedings of the 21st International Symposium on Flow Visualization (ISFV21), Tokyo, Japan, 21-25 June 2025. [Google Scholar]
- Ota, M.; Hamada, K.; Kato, H.; Maeno, K. Computed-tomographic density measurement of supersonic flow field by colored-grid background oriented schlieren (CGBOS) technique. Meas. Sci. Technol. 2011, 22, 104011. [Google Scholar] [CrossRef]
- Wildeman, S. Real-time quantitative schlieren imaging by fast Fourier demodulation of a checkered backdrop. Exp. Fluids 2018, 59, 97. [Google Scholar] [CrossRef]
- Paszke, A.; Gross, S.; Massa, F.; et al. PyTorch: An imperative style, high-performance deep learning library. Adv. Neural Inf. Process. Syst. 2019, 32, 8026–8037. [Google Scholar]
- Hirose, Y.; Yamagishi, M.; Udagawa, S.; Inage, T.; Tagawa, Y.; Ota, M. Double-pass imaging background-oriented schlieren technique for focusing on measurement target. Exp. Fluids 2023, 64, 151. [Google Scholar] [CrossRef]
Disclaimer/Publisher’s Note: The statements, opinions and data contained in all publications are solely those of the individual author(s) and contributor(s) and not of MDPI and/or the editor(s). MDPI and/or the editor(s) disclaim responsibility for any injury to people or property resulting from any ideas, methods, instructions or products referred to in the content. |
© 2026 by the authors. Licensee MDPI, Basel, Switzerland. This article is an open access article distributed under the terms and conditions of the Creative Commons Attribution (CC BY) license.
Copyright: This open access article is published under a Creative Commons CC BY 4.0 license, which permit the free download, distribution, and reuse, provided that the author and preprint are cited in any reuse.