

Submitted:
19 October 2026
Posted:
21 October 2026
You are already at the latest version
Abstract
Strong tip vortices generated by hovering rotors contribute to induced aerodynamic losses. Blade-tip jet injection offers a means of modifying the tip-vortex system and the associated aerodynamic loads. In this study, a computational model of a hovering rotor was developed using the multiple reference frame (MRF) approach and validated against the experimental measurements of the Caradonna–Tung rotor. At a representative high-tip-speed condition, the effects of jet velocities equal to one, two, and three times the blade-tip speed, as well as the effect of jet-orifice diameter, were investigated in terms of rotor thrust, torque, and tip-vortex structure. The results indicate that a jet velocity of 200 m/s (twice the blade-tip speed) yields the greatest thrust increase among the investigated jet-velocity cases: thrust increases by 5.43%, accompanied by a 4.17% increase in torque. Increasing the orifice diameter within the investigated range further increases both thrust and torque. Flow-field visualizations suggest that jet-induced momentum injection modifies tip-vortex coherence, wake organization, and local flow structures. These findings demonstrate the potential of distributed blade-tip injection for controlling hovering-rotor aerodynamics while highlighting the accompanying torque penalty.
Keywords:
hovering rotor
; blade-tip jet
; active flow control
; tip vortex
; multiple reference frame method
1. Introduction
Rotorcraft play important roles in civil and military applications owing to their vertical take-off and landing capabilities and low-speed flight performance. However, the rotor configuration also gives rise to complex aerodynamic interactions. During rotation, concentrated vortices form near the blade tips and convect downstream into the rotor wake. Their subsequent proximity to other blades can produce blade–vortex interactions, affecting aerodynamic performance and generating characteristic interaction noise [1]. These interactions may also influence operational stability and structural integrity [2]. Understanding tip-vortex formation and evolution, and developing effective flow-control strategies to modify these structures, are therefore important for improving rotorcraft performance.
Considerable research has addressed the formation and evolution of rotor tip vortices. Leishman and Bagai [3] discussed the challenges associated with experimental characterization of rotor-wake vortex dynamics. Duraisamy [4] investigated tip-vortex formation and trajectories using high-resolution numerical methods and overset-grid techniques. Han et al. [5] employed a fifth-order Roe–WENO scheme to resolve rotor-wake structures, while Duraisamy et al. [6] combined high-resolution computations and experiments to examine rotary-wing tip-vortex formation. In active flow control, synthetic jets have attracted considerable interest because they can introduce periodic momentum without a net mass flux [7]. Hassan and co-workers [8-11] studied blowing, suction, and zero-net-mass-flux actuation for airfoil and rotorcraft applications. Donovan et al. [12] investigated active separation control on an airfoil, while Duvigneau and Visonneau [13], Ravindran [14], Tuck and Soria [15], and McCormick [16] examined the effectiveness and optimization of jet-based separation-control strategies. Cattafesta and Sheplak [17] reviewed active-flow-control actuators. Numerical and experimental investigations by You and Moin [18], Amitay et al. [19], Vatsa and Turkel [20], Kim and Kim [21], and Zhi et al. [22] further demonstrated the influence of jet actuation on separated flows and airfoil aerodynamic performance.
Although rotor aerodynamics and active flow control have been studied extensively, the mechanisms by which distributed blade-tip injection alters tip-vortex organization and rotor loads in hover require further examination. The present work therefore establishes an MRF-based numerical model for a hovering rotor and investigates the effects of blade-tip jet velocity and orifice diameter on thrust, torque, and wake-vortex structure. The associated flow-field changes are examined to clarify possible mechanisms underlying the observed aerodynamic response.
2. Numerical Methods and Validation
2.1. Numerical Method
Computational fluid dynamics simulations were performed using ANSYS Fluent 2023 R1. An MRF-based numerical model was established to evaluate the aerodynamic performance of the hovering rotor.
The multiple reference frame (MRF) approach divides the computational domain into rotating and stationary regions, where the steady governing equations are solved in rotating and inertial reference frames, respectively [23]. The rotating region has the same angular velocity as the rotor. Rotational effects are represented by Coriolis and centrifugal terms, while the computational mesh remains stationary and the rotor is fixed relative to the rotating region. Flow information is transferred across the rotating–stationary interface in a flux-conservative manner.
The compressible steady Reynolds-averaged Navier–Stokes (RANS) equations were solved in Fluent. The shear-stress transport (SST k − ϖ) turbulence model was employed to describe near-wall flow and separated-flow behavior. Second-order upwind spatial discretization and an ideal-gas model were adopted. The convergence of the numerical solution was assessed by monitoring the residuals of the governing equations and the stabilization of the integrated rotor thrust and torque. The final residual levels are reported in Table 3 and Table 4.
The pressure-based coupled algorithm in Fluent was used to solve the governing equations. This implicit scheme couples pressure and velocity by solving the discretized continuity and momentum equations in a unified framework, thereby accounting for the pressure-gradient and momentum-transport contributions during the iterative solution [24].
2.2. Validation Against the Caradonna–Tung Rotor
The Caradonna–Tung hovering rotor [25] is a widely used validation case for rotor CFD. It consists of two untwisted, untapered rectangular blades with NACA 0012 airfoil sections. The simulations were performed at a blade-tip Mach number of Matip = 0.439and a Reynolds number of Re = 3.93 × 10⁶.
The geometric parameters of the Caradonna–Tung rotor are summarized in Table 1.
The two blades were aligned along their quarter-chord lines and pitched about the quarter-chord axis by 8°. The mesh-refinement, rotating, and stationary regions were represented by cylindrical domains. Their dimensions are listed in Table 2.
For hover, a zero-velocity inlet condition was imposed at the upstream far-field boundary. The remaining far-field boundaries were specified as pressure outlets with zero gauge static pressure, and the blade surfaces were treated as walls. The boundary conditions are illustrated in Figure 1.
A poly-hexcore hybrid mesh was generated to balance mesh quality and computational efficiency. The resulting grid contained approximately 10.6 million cells, with a minimum orthogonal quality of 0.25. The overall mesh and the locally refined blade-surface and boundary-layer meshes are shown in Figure 2, Figure 3 and Figure 4.
After the monitored residuals reached the levels reported in Table 3, the pressure-coefficient distributions were extracted at five radial stations (r/R = 0.50, 0.68, 0.80, 0.89, and 0.96) and compared with the experimental data [25]. The comparisons are presented in Figure 5.
As shown in Figure 5, the computed pressure-coefficient distributions generally agree well with the measurements at the reported convergence levels. At the inboard station r/R = 0.50, the calculated leading-edge suction peak is slightly lower than the experimental value. Overall agreement improves toward the blade tip.
The larger discrepancy at the inboard station may be related to local flow scales and the limitations of the numerical model. Because the local tangential velocity in hover increases approximately linearly with radius, the inboard blade sections operate at lower Reynolds numbers, making the boundary-layer state and transition location more sensitive to the turbulence model and near-wall grid. The induced velocity also represents a larger fraction of the local relative velocity at smaller radii, increasing the sensitivity of local inflow angle and effective angle of attack to induced-velocity prediction errors. In addition, radial flow, Coriolis effects, and other three-dimensional rotational phenomena may not be fully represented by a steady MRF approximation. The steep pressure gradients around the leading-edge suction peak further increase sensitivity to mesh resolution and near-wall treatment.
A substantial fraction of rotor thrust is generated over the mid-to-outboard blade region, while tip-vortex dynamics are particularly important near the blade tip. Consequently, agreement at the outboard stations is relevant to the present investigation. The close correspondence between calculated and measured pressure coefficients near the tip supports the use of the numerical model for the comparative hovering-rotor calculations considered here.
3. Results and Discussion
The reference hovering condition of the Caradonna–Tung rotor was used as the baseline. Distributed blade-tip injection was then applied at different jet velocities to investigate aerodynamic changes and the associated wake response. The influence of orifice diameter was also examined at a selected jet velocity.
3.1. Baseline Rotor Aerodynamics
The MRF model was used to simulate the baseline Caradonna–Tung rotor in hover at a blade-tip speed of 100 m/s. Rotor thrust, torque, and tip-vortex characteristics were evaluated.
The thrust and torque histories obtained after the monitored residuals reached the levels listed in Table 4 are shown in Figure 6. To visualize the morphology and evolution of the wake vortices, an iso-surface of the Q criterion at Q = 20 was extracted and colored by vorticity magnitude, as shown in Figure 7.
At a tip speed of 100 m/s, the baseline rotor produces approximately 205.42 N of thrust and 24.00 N·m of torque (Figure 6).
Figure 7 shows that the baseline hovering-rotor wake is approximately axisymmetric. The tip vortices form relatively regular helical structures with a clear periodic arrangement. The displayed vorticity magnitude decreases downstream, consistent with diffusion and turbulent mixing. The rotor-induced downwash also produces wake contraction, drawing the vortex trajectories toward the rotor axis. Further downstream, interactions between adjacent helical vortices contribute to deformation, spreading, and reduced structural coherence.
To examine the near-wake evolution, five cross-sectional slices were extracted at intervals of one rotor radius, extending to five rotor radii downstream. The resulting vorticity contours are shown in Figure 8.
For further visualization, the vorticity field was sectioned by the X = 0 and Y = 0 planes. The corresponding contours are shown in Figure 9a,b.
3.2. Effect of Jet Velocity
Distributed blade-tip jets were introduced into the baseline rotor model at jet velocities equal to one, two, and three times the blade-tip speed. The corresponding thrust, torque, and tip-vortex structures were compared with those of the uncontrolled rotor.
Six equally spaced jet-control orifices, each with a diameter of 0.5% of the blade chord (0.85 mm), were arranged on the tip face between 25% and 75% chord, as illustrated in Figure 10. The orifices were prescribed as velocity inlets, with jet velocity directed along the blade span. Representative jet-flow fields are shown in Figure 11.
3.2.1. Changes in Aerodynamic Performance
Simulations were performed for jet velocities of 100, 200, and 300 m/s. The resulting thrust and torque histories are presented in Figure 12 and Figure 13, respectively.
Compared with the baseline condition, the application of distributed blade-tip jet injection at jet velocities of 100, 200, and 300 m/s (corresponding to one, two, and three times the blade-tip speed, respectively) resulted in relative thrust changes of −10.41%, +5.43%, and +0.64%, respectively, while the corresponding torque changes were −4.17%, +4.17%, and +0.54%. The variations in rotor thrust and torque under different jet conditions are summarized in Table 5.
3.2.2. Flow-Control Mechanisms
The tip-vortex fields of the baseline rotor and the three jet-controlled cases are compared in Figure 14. The corresponding vorticity contours on the Y = 0 plane are shown in Figure 15.
Figure 14 and Figure 15 indicate that blade-tip injection changes the intensity, spatial distribution, continuity, and coherence of the tip-vortex structures. Without injection, relatively continuous and regular high-vorticity helical structures form near the blade tips. The vortex cores are concentrated and remain recognizable and approximately periodic over a considerable downstream distance. Although local vorticity magnitude decreases with downstream distance owing to diffusion and mixing, the main helical trajectories remain visible, suggesting relatively coherent wake organization in the baseline case.
A comparison of Figure 14a and Figure 14b shows that injection at one blade-tip speed reduces the extent of some high-vorticity regions and decreases the continuity of the original helical tip vortices. Parts of the vortex-core structure become more diffuse and distorted. This suggests that even weak injection introduces local momentum perturbations capable of modifying velocity gradients and shear-layer structures near the blade tip, thereby influencing vortex roll-up and transport. The principal tip vortex is only moderately disturbed, however, and the overall wake is not extensively reorganized. In conjunction with the reduction in thrust and relatively small change in torque, these observations suggest that weak injection does not necessarily improve the induced-flow environment or spanwise load distribution and may instead produce unfavorable local load redistribution.
At a jet velocity of twice the blade-tip speed (Figure 14c), the tip-vortex changes become more pronounced. Portions of the initially continuous high-vorticity helices are visibly deformed, with reduced local continuity and spatial coherence; regions of lower and intermediate vorticity extend over a larger volume. Stronger velocity gradients and shear layers between the injected jet and surrounding flow can alter vorticity production, stretching, and transport near the tip. The vortex roll-up trajectory, core location, and downstream development may therefore be reorganized, potentially changing the induced-velocity field. The corresponding increase in thrust, together with a comparatively modest torque increase, is consistent with a more favorable local inflow and spanwise loading distribution, although quantitative confirmation of these mechanisms would require further analysis of the local velocity field and spanwise blade loading.
At three times the blade-tip speed (Figure 14d), the coherent primary helical tip-vortex structures become less continuous, and fewer regular high-vorticity structures remain downstream. The strong jet therefore exerts a more pronounced influence on vortex formation and roll-up. Nevertheless, the jet also generates additional high-speed shear layers; the observed flow should thus be interpreted as a redistribution of vorticity and weakening of primary-vortex coherence rather than necessarily a monotonic reduction in total vorticity. The lower thrust benefit compared with the 200 m/s case suggests that stronger mixing, local disturbances, or unfavorable load redistribution may offset part of the aerodynamic benefit.
Taken together, the flow-field and aerodynamic results demonstrate a non-monotonic response to jet velocity. Weak injection mainly perturbs the near-tip vortex system, whereas intermediate injection produces more substantial wake reorganization and the greatest thrust increase among the cases examined. At still higher jet velocity, additional momentum input and shear-layer mixing may reduce the net aerodynamic benefit. The results therefore suggest that an intermediate range of jet velocities may provide a more favorable compromise between wake modification and rotor aerodynamic performance.
3.3. Effect of Jet-Orifice Diameter
The jet-controlled cases show only a limited thrust improvement at some jet velocities, and the increase is small at 300 m/s for the original orifice diameter. To investigate whether a larger orifice can enhance the control effect, the jet velocity was held at three times the blade-tip speed while the orifice diameter was doubled from 0.85 to 1.70 mm. All other settings were unchanged (Figure 16).
With a 300 m/s jet and an orifice diameter of 1% chord, the rotor produced approximately 213.63 N of thrust and 25.16 N·m of torque (Figure 17). Compared with the 0.5%-chord orifices at the same jet velocity, thrust and torque increased by 3.34% and 4.27%, respectively. Relative to the uncontrolled baseline, the increases were 4.00% and 4.83%, respectively.
At constant jet velocity, the orifice area is proportional to the square of its diameter. Increasing the diameter therefore raises the jet mass flow rate and momentum flux, allowing more high-momentum fluid to enter the tip region. The increased momentum input broadens the area affected by injection and modifies local velocity gradients, pressure distributions, and shear layers. These changes may further alter tip-vortex roll-up, convection, and downstream development. A corresponding reorganization of the coherent tip-vortex system and induced-flow field can affect local inflow conditions and radial blade loading, contributing to the observed thrust increase.
Increasing orifice diameter can also intensify local shear-layer mixing and tangential momentum exchange. Because the injection region is near the blade tip, where the moment arm is large, changes in tangential loading may have a pronounced effect on overall rotor torque. In the present cases, the percentage increase in torque exceeds that in thrust. Thus, although larger orifices increase rotor thrust, they also increase the torque and shaft-power requirements, illustrating a trade-off between aerodynamic benefit and energy expenditure.
Within the range investigated, increasing orifice diameter increases rotor thrust by increasing injected momentum flux and modifying the near-tip flow. Further increases in diameter, however, may entail additional torque, mixing losses, and jet-supply power, potentially leading to diminishing net benefits.
4. Conclusions
(1) Blade-tip injection modifies local velocity and pressure fields through momentum addition, thereby influencing cross-tip flow and the formation and transport of vorticity. The resulting changes in tip-vortex location, organization, and evolution may affect induced velocity, effective angle of attack, thrust, and torque.
(2) The thrust response to increasing jet velocity is non-monotonic. Among the investigated cases, injection at twice the blade-tip speed produced the greatest thrust increase (5.43%), accompanied by a 4.17% increase in torque.
(3) Jet-orifice diameter affects mass flow and momentum flux and thereby influences the vortex field and aerodynamic loads. At a jet velocity of three times the blade-tip speed, doubling the orifice diameter increased thrust by 3.34% relative to the original-diameter case and by 4.00% relative to the uncontrolled rotor.
(4) The MRF-based simulations indicate that distributed blade-tip injection can modify hovering-rotor aerodynamic performance. The comparative analysis of jet velocity and orifice diameter provides insight into potential flow-control mechanisms and offers guidance for subsequent optimization of blade-tip injection configurations.
(5) The present MRF simulations are steady and therefore cannot fully resolve transient tip-vortex dynamics. Only hover was considered. Future work should employ unsteady sliding-mesh simulations to investigate transient vortex evolution, quantify the coupled effects of jet velocity and orifice diameter, and assess performance under additional flight conditions.
Funding
This research was funded by the National Natural Science Foundation of China, grant number 11972306.
Data Availability Statement
The original contributions presented in this study are included in the article/supplementary material. Further inquiries can be directed to the corresponding author(s).
Acknowledgments
We thank Guang-Yin Zhao of the State Key Laboratory of Aerodynamics in Mianyang, Sichuan, China, for contributing to the initial research concept and participating in the analysis and discussion of selected simulation results. During the preparation of this manuscript, the authors used ChatGPT (OpenAI, version GPT-5) exclusively for translation and language polishing. All scientific content, analyses, and conclusions were developed and written by the authors. After using this tool, the authors reviewed and edited the content as needed and take full responsibility for the content of the publication.
Conflicts of Interest
The authors declare no conflicts of interest.
References
- Yu, Y.H. Rotor Blade–Vortex Interaction Noise. Prog. Aerosp. Sci. 2000, 36, 97–115. [Google Scholar] [CrossRef]
- Crouse, G.L., Jr.; Leishman, J.G. Interactional Aerodynamic Effects on Rotor Performance in Hover and Forward Flight. In Proceedings of the 48th Annual Forum of the American Helicopter Society, Washington, DC, USA, 3–5 June 1992; p. Paper VFS-F48-1042. [Google Scholar] [CrossRef]
- Leishman, J.G.; Bagai, A. Challenges in Understanding the Vortex Dynamics of Helicopter Rotor Wakes. AIAA J. 1998, 36, 1130–1140. [Google Scholar] [CrossRef]
- Duraisamy, K. Studies in Tip Vortex Formation, Evolution and Control. Ph.D. Thesis, University of Maryland, College Park, MD, USA, 2005. [Google Scholar]
- Han, S.; Song, W.; Han, Z. A Novel High-Order Scheme for Numerical Simulation of Wake Flow over Helicopter Rotors in Hover. Chin. J. Aeronaut. 2022, 35, 260–274. [Google Scholar] [CrossRef]
- Duraisamy, K.; Ramasamy, M.; Baeder, J.; Leishman, J.G. High-Resolution Computational and Experimental Study of Rotary-Wing Tip Vortex Formation. AIAA J. 2007, 45, 2593–2602. [Google Scholar] [CrossRef]
- Glezer, A.; Amitay, M. Synthetic Jets. Annu. Rev. Fluid Mech. 2002, 34, 503–529. [Google Scholar] [CrossRef]
- Hassan, A.A.; Straub, F.K.; Charles, B.D. Effects of Surface Blowing/Suction on the Aerodynamics of Helicopter Rotor Blade-Vortex Interactions (BVI)—A Numerical Simulation. J. Am. Helicopter Soc. 1997, 42, 182–194. [Google Scholar] [CrossRef]
- Hassan, A.A.; JanakiRam, R.D. Effects of Zero-Mass “Synthetic” Jets on the Aerodynamics of the NACA-0012 Airfoil. J. Am. Helicopter Soc. 1998, 43, 303–311. [Google Scholar] [CrossRef]
- Hassan, A.A. Applications of Zero-Net-Mass Jets for Enhanced Rotorcraft Aerodynamic Performance. J. Aircr. 2001, 38, 478–485. [Google Scholar] [CrossRef]
- Hassan, A.A. Oscillatory and Pulsed Jets for Improved Airfoil Aerodynamics—A Numerical Simulation. In Proceedings of the 42nd AIAA Aerospace Sciences Meeting and Exhibit, Reno, NV, USA, 5–8 January 2004; pp. Paper 2004–0227. [Google Scholar] [CrossRef]
- Donovan, J.F.; Kral, L.D.; Cary, A.W. Active Flow Control Applied to an Airfoil. In Proceedings of the 36th AIAA Aerospace Sciences Meeting and Exhibit, Reno, NV, USA, 12–15 January 1998; pp. Paper 98–0210. [Google Scholar] [CrossRef]
- Duvigneau, R.; Visonneau, M. Simulation and Optimization of Aerodynamic Stall Control Using a Synthetic Jet. In Proceedings of the 2nd AIAA Flow Control Conference, Portland, OR, USA, 28 June–1 July 2004; pp. Paper 2004–2315. [Google Scholar] [CrossRef]
- Ravindran, S.S. NASA/TM-1999-209838; Active Control of Flow Separation over an Airfoil. NASA Langley Research Center: Hampton, VA, USA, December 1999.
- Tuck, A.; Soria, J. Active Flow Control over a NACA 0015 Airfoil Using a ZNMF Jet. In Proceedings of the 15th Australasian Fluid Mechanics Conference, Sydney, Australia, 13–17 December 2004; pp. 1–4. [Google Scholar]
- McCormick, D.C. Boundary Layer Separation Control with Directed Synthetic Jets. In Proceedings of the 38th Aerospace Sciences Meeting and Exhibit, Reno, NV, USA, 10–13 January 2000; pp. Paper 2000–0519. [Google Scholar] [CrossRef]
- Cattafesta, L.N.; Sheplak, M. Actuators for Active Flow Control. Annu. Rev. Fluid Mech. 2011, 43, 247–272. [Google Scholar] [CrossRef]
- You, D.; Moin, P. Active Control of Flow Separation over an Airfoil Using Synthetic Jets. J. Fluids Struct. 2008, 24, 1349–1357. [Google Scholar] [CrossRef]
- Amitay, M.; Smith, D.R.; Kibens, V.; Parekh, D.E.; Glezer, A. Aerodynamic Flow Control over an Unconventional Airfoil Using Synthetic Jet Actuators. AIAA J. 2001, 39, 361–370. [Google Scholar] [CrossRef]
- Vatsa, V.N.; Turkel, E. Simulation of Synthetic Jets Using Unsteady Reynolds-Averaged Navier–Stokes Equations. AIAA J. 2006, 44, 217–224. [Google Scholar] [CrossRef]
- Kim, S.H.; Kim, C. Separation Control on NACA23012 Using Synthetic Jet. Aerosp. Sci. Technol. 2009, 13, 172–182. [Google Scholar] [CrossRef]
- Zhi, H.; Zhu, Z.; Lu, Y.; Deng, S.; Xiao, T. Aerodynamic Performance Enhancement of Co-Flow Jet Airfoil with Simple High-Lift Device. Chin. J. Aeronaut. 2021, 34, 143–155. [Google Scholar] [CrossRef]
- Xue, C.; Zhou, Z. Propeller-Wing Coupled Aerodynamic Design Based on Desired Propeller Slipstream. Aerosp. Sci. Technol. 2020, 97, 105556. [Google Scholar] [CrossRef]
- ANSYS, Inc. ANSYS Fluent Theory Guide, Release 15.0; ANSYS, Inc.: Canonsburg, PA, USA, November 2013. [Google Scholar]
- Caradonna, F.X.; Tung, C. Experimental and Analytical Studies of a Model Helicopter Rotor in Hover. Vertica 1981, 5, 149–161. [Google Scholar]
Figure 1.
Computational domain and boundary conditions.
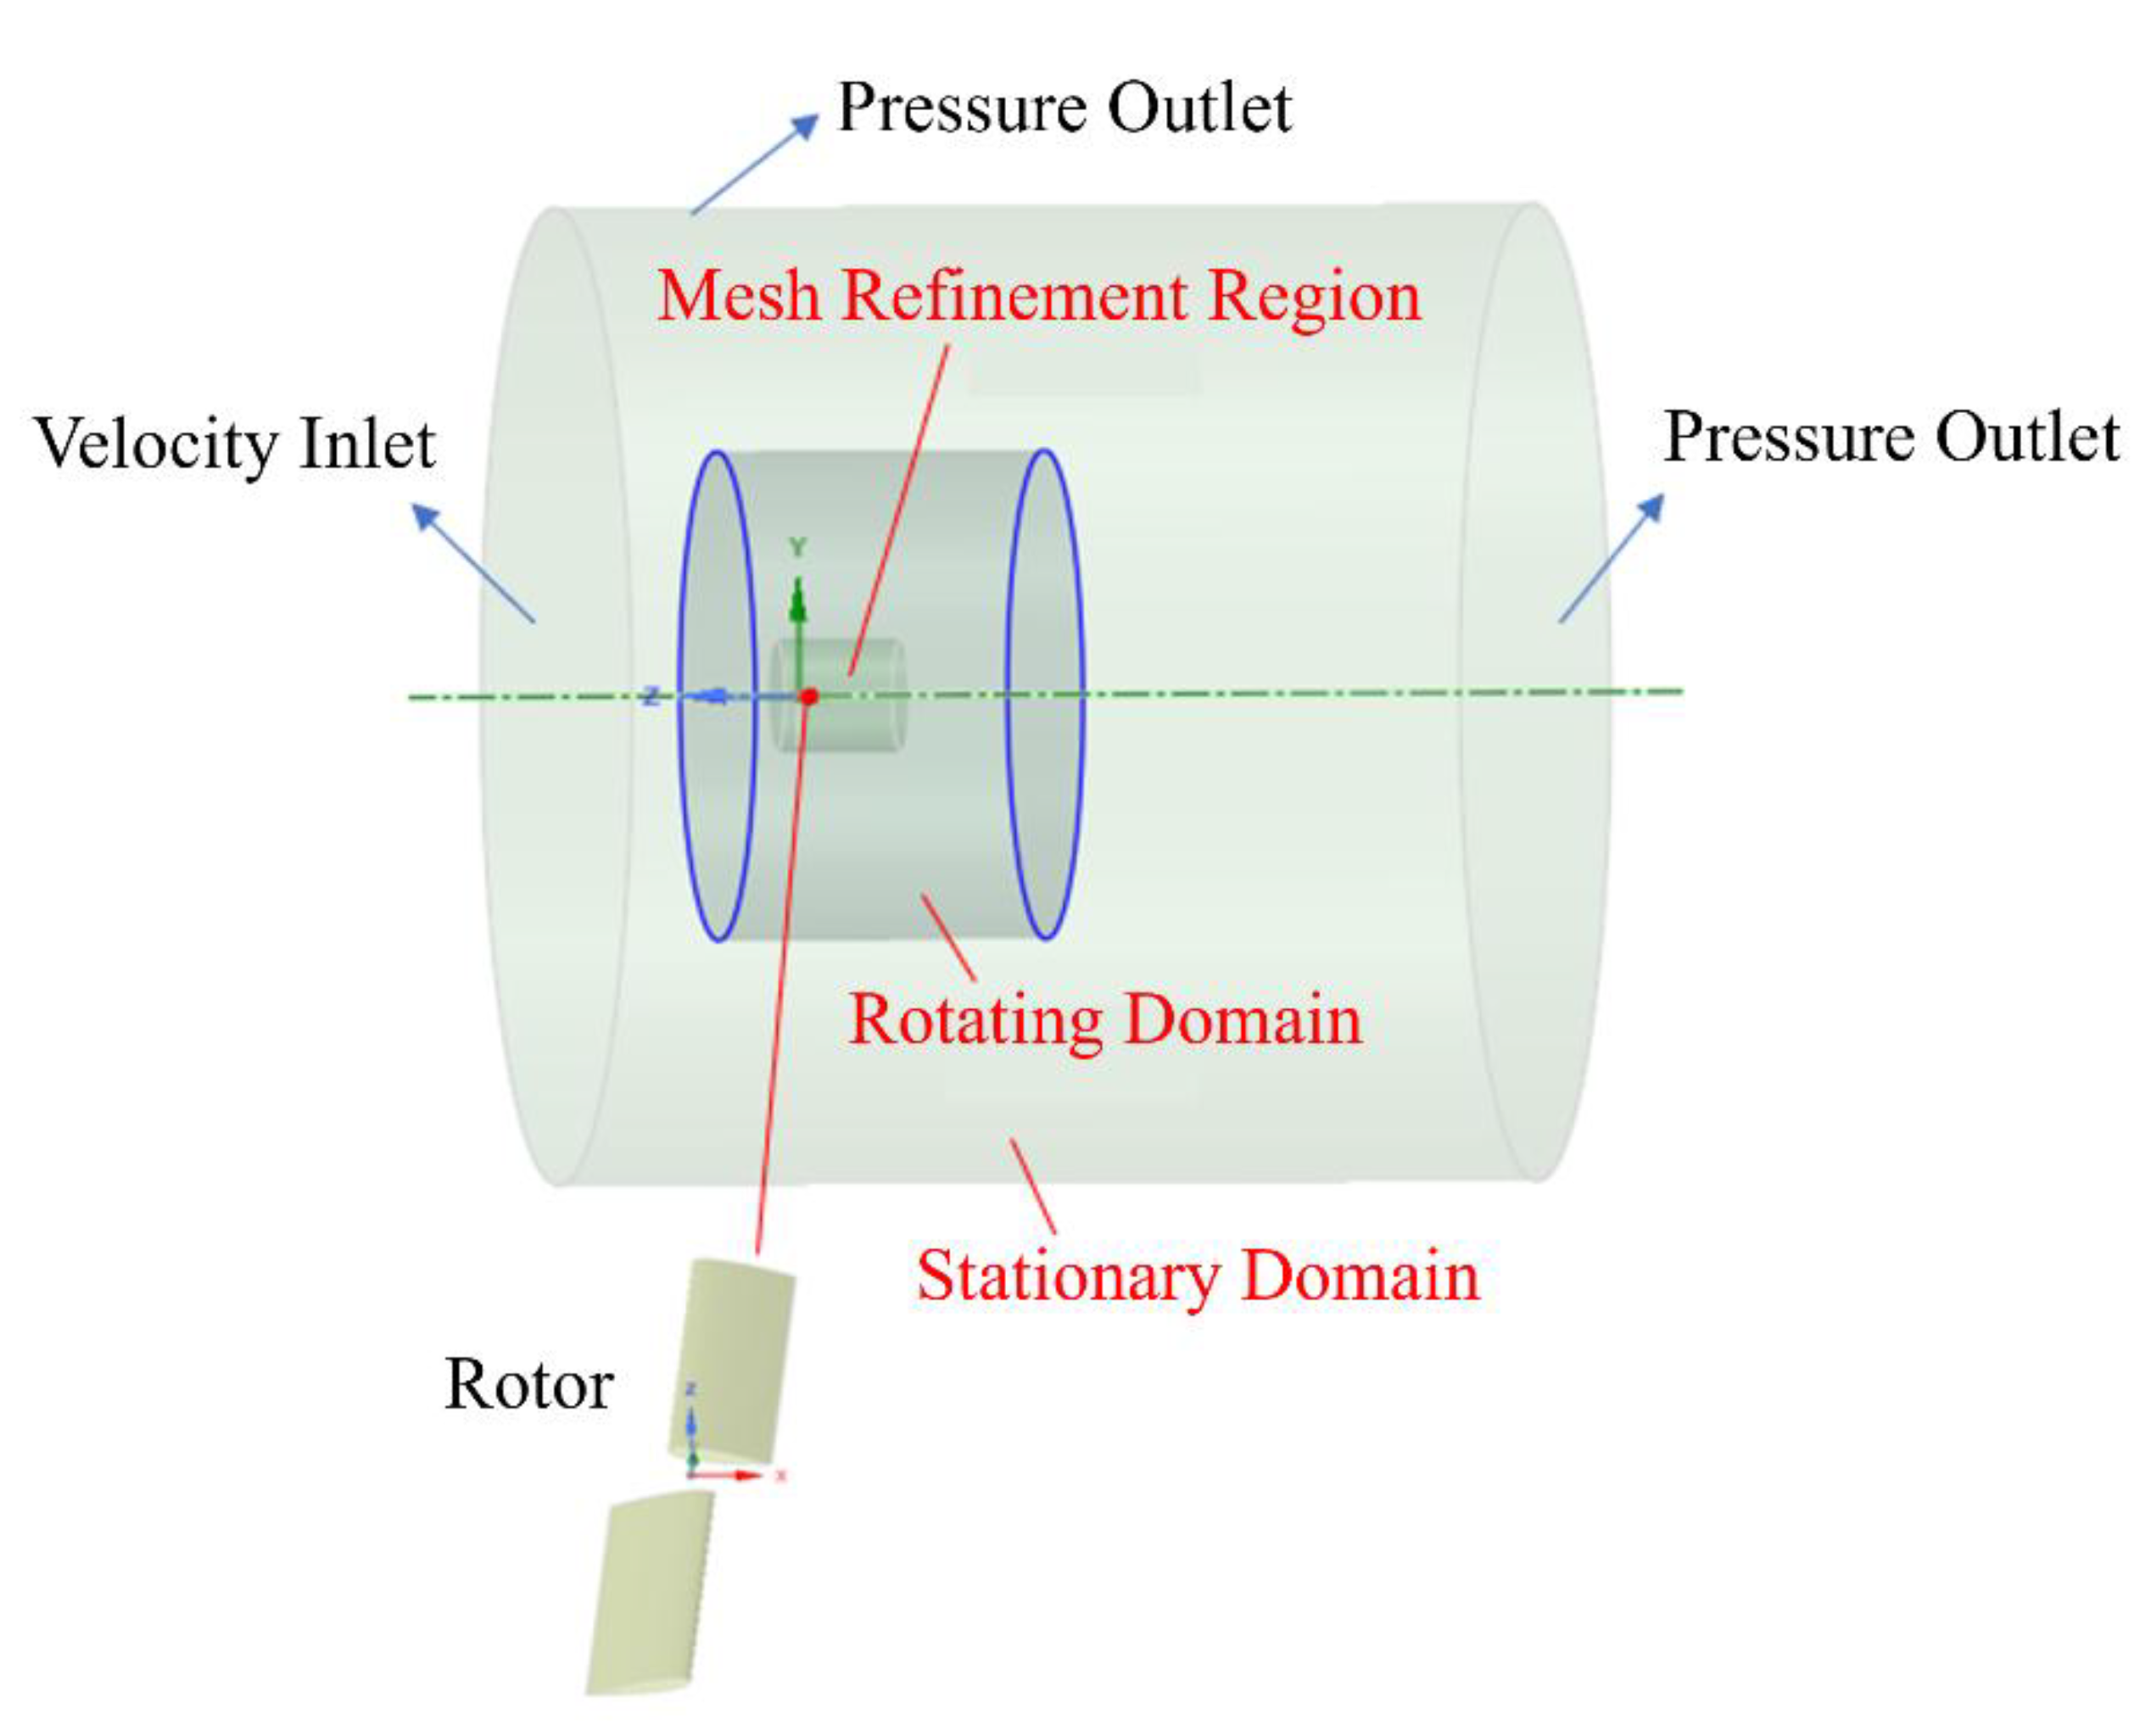
Figure 2.
Overview of the computational mesh.
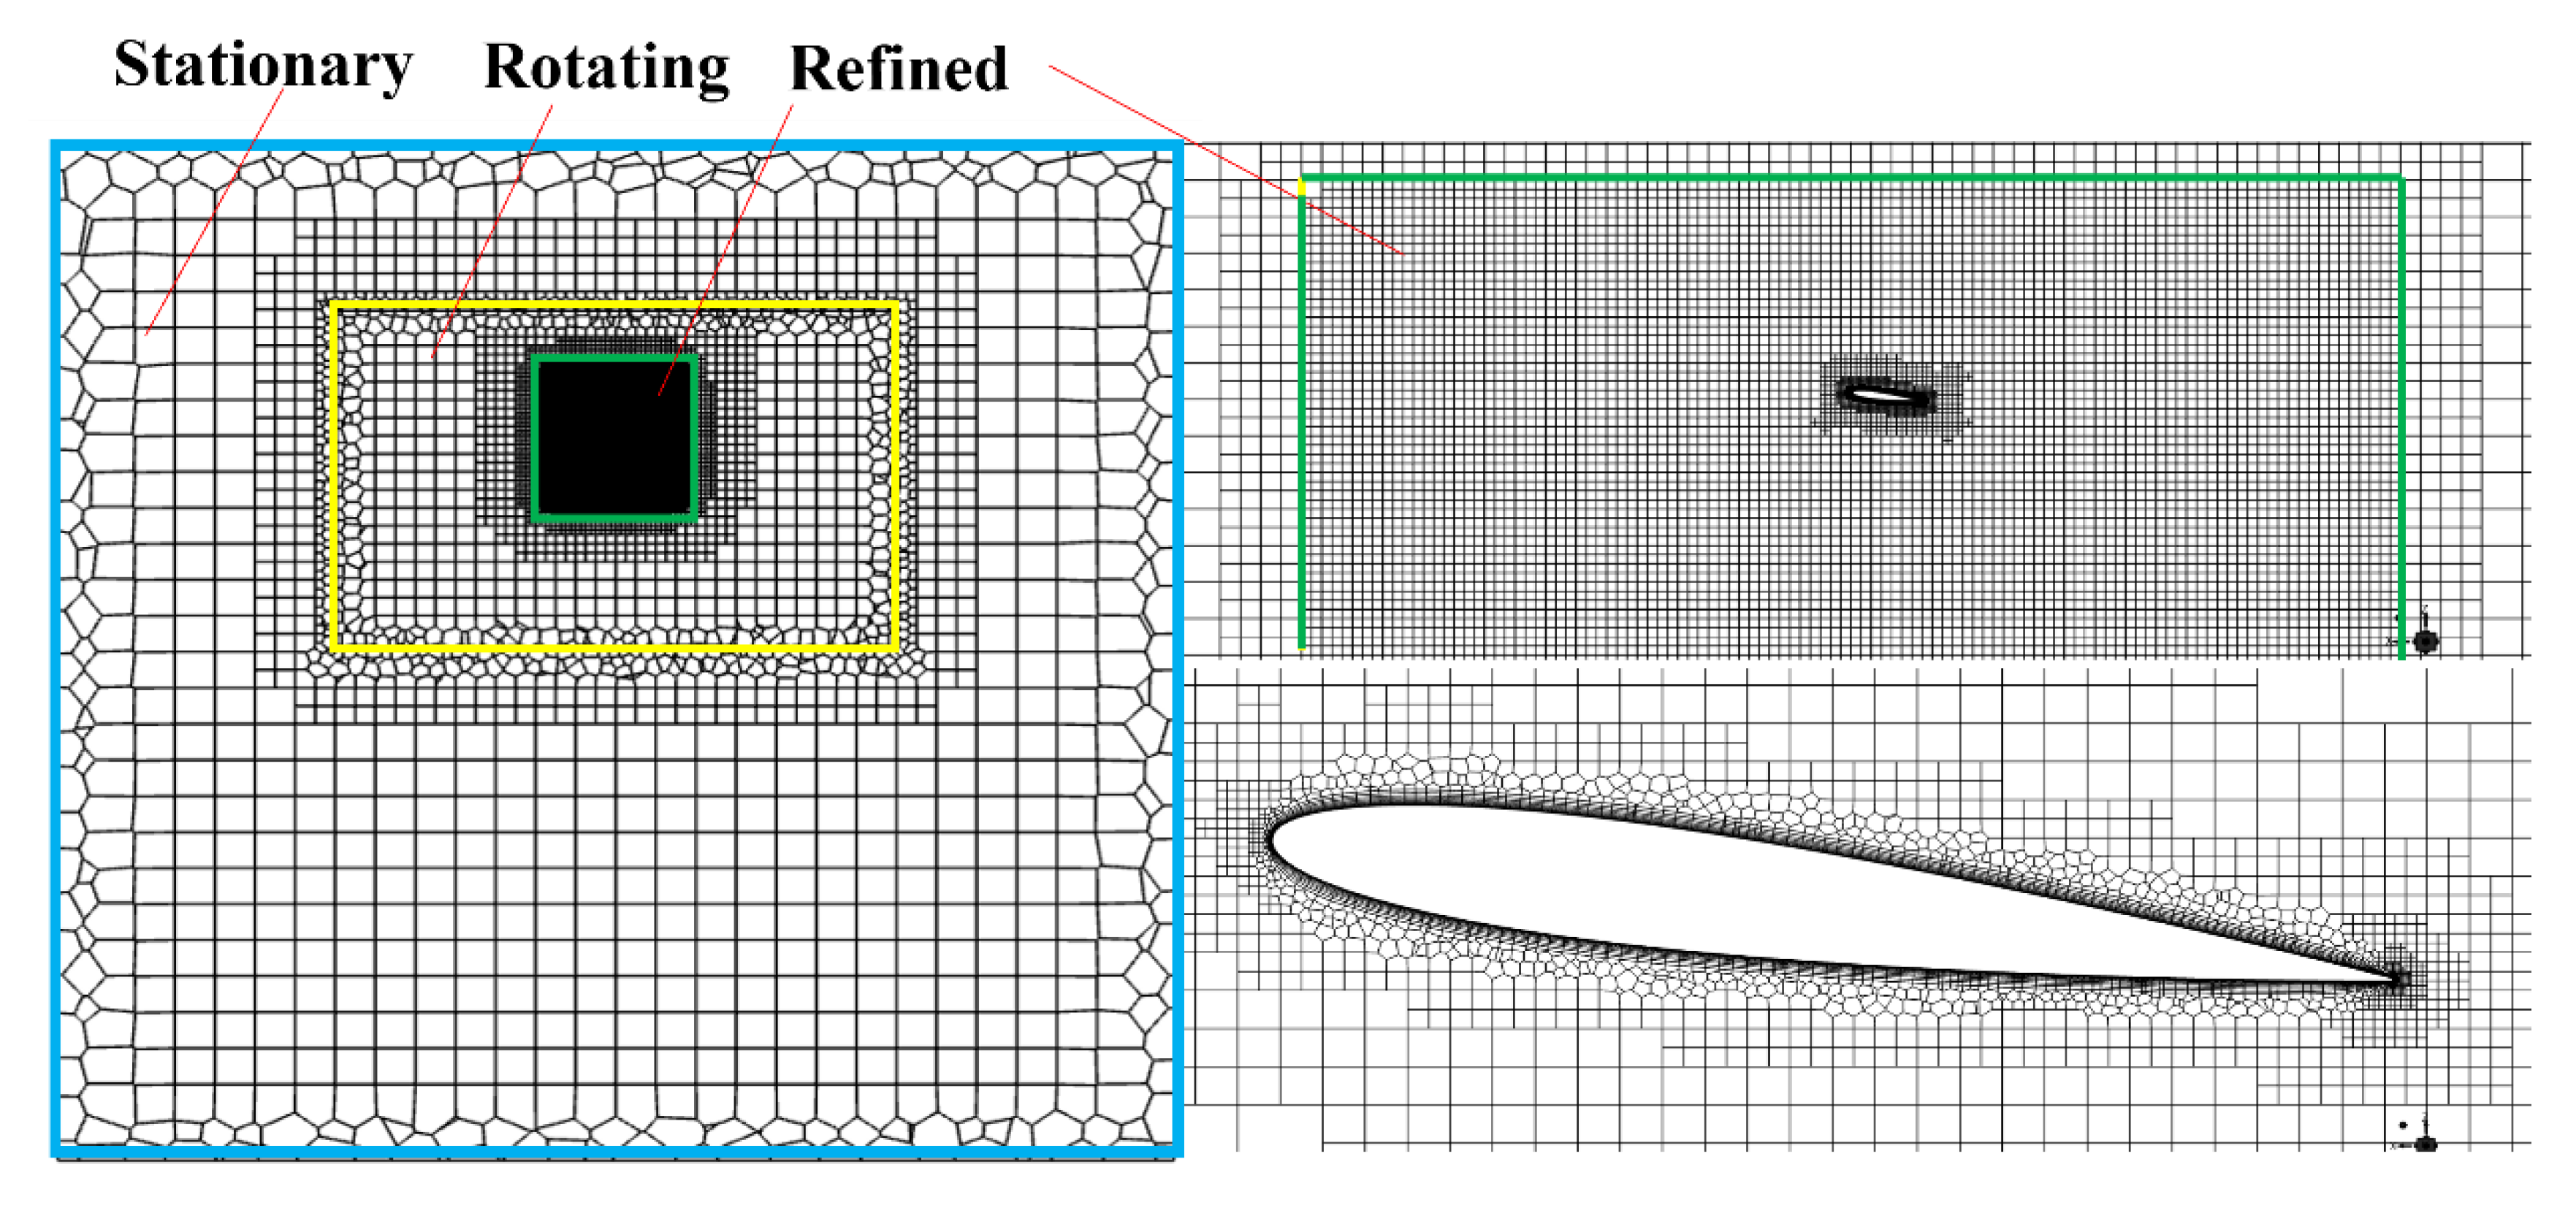
Figure 3.
Mesh refinement on the blade surface, leading edge, trailing edge, and jet-control orifices.
Figure 3.
Mesh refinement on the blade surface, leading edge, trailing edge, and jet-control orifices.
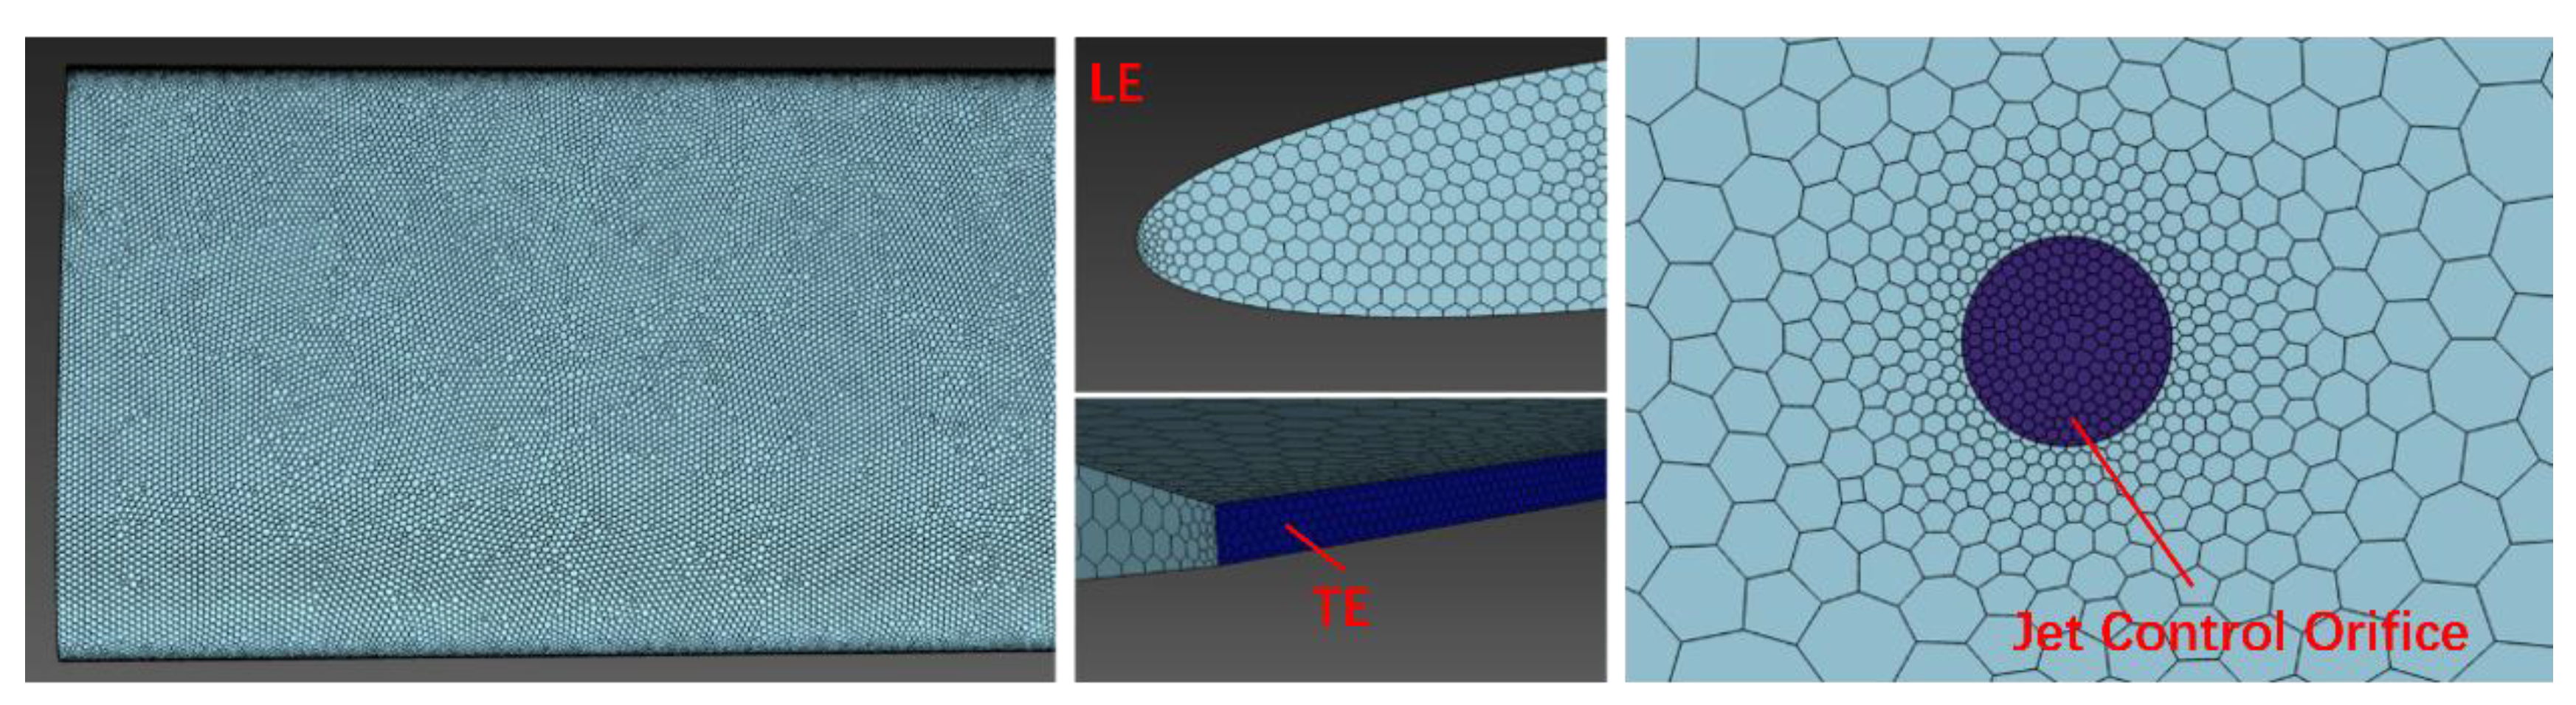
Figure 4.
Boundary-layer meshes near the leading and trailing edges.
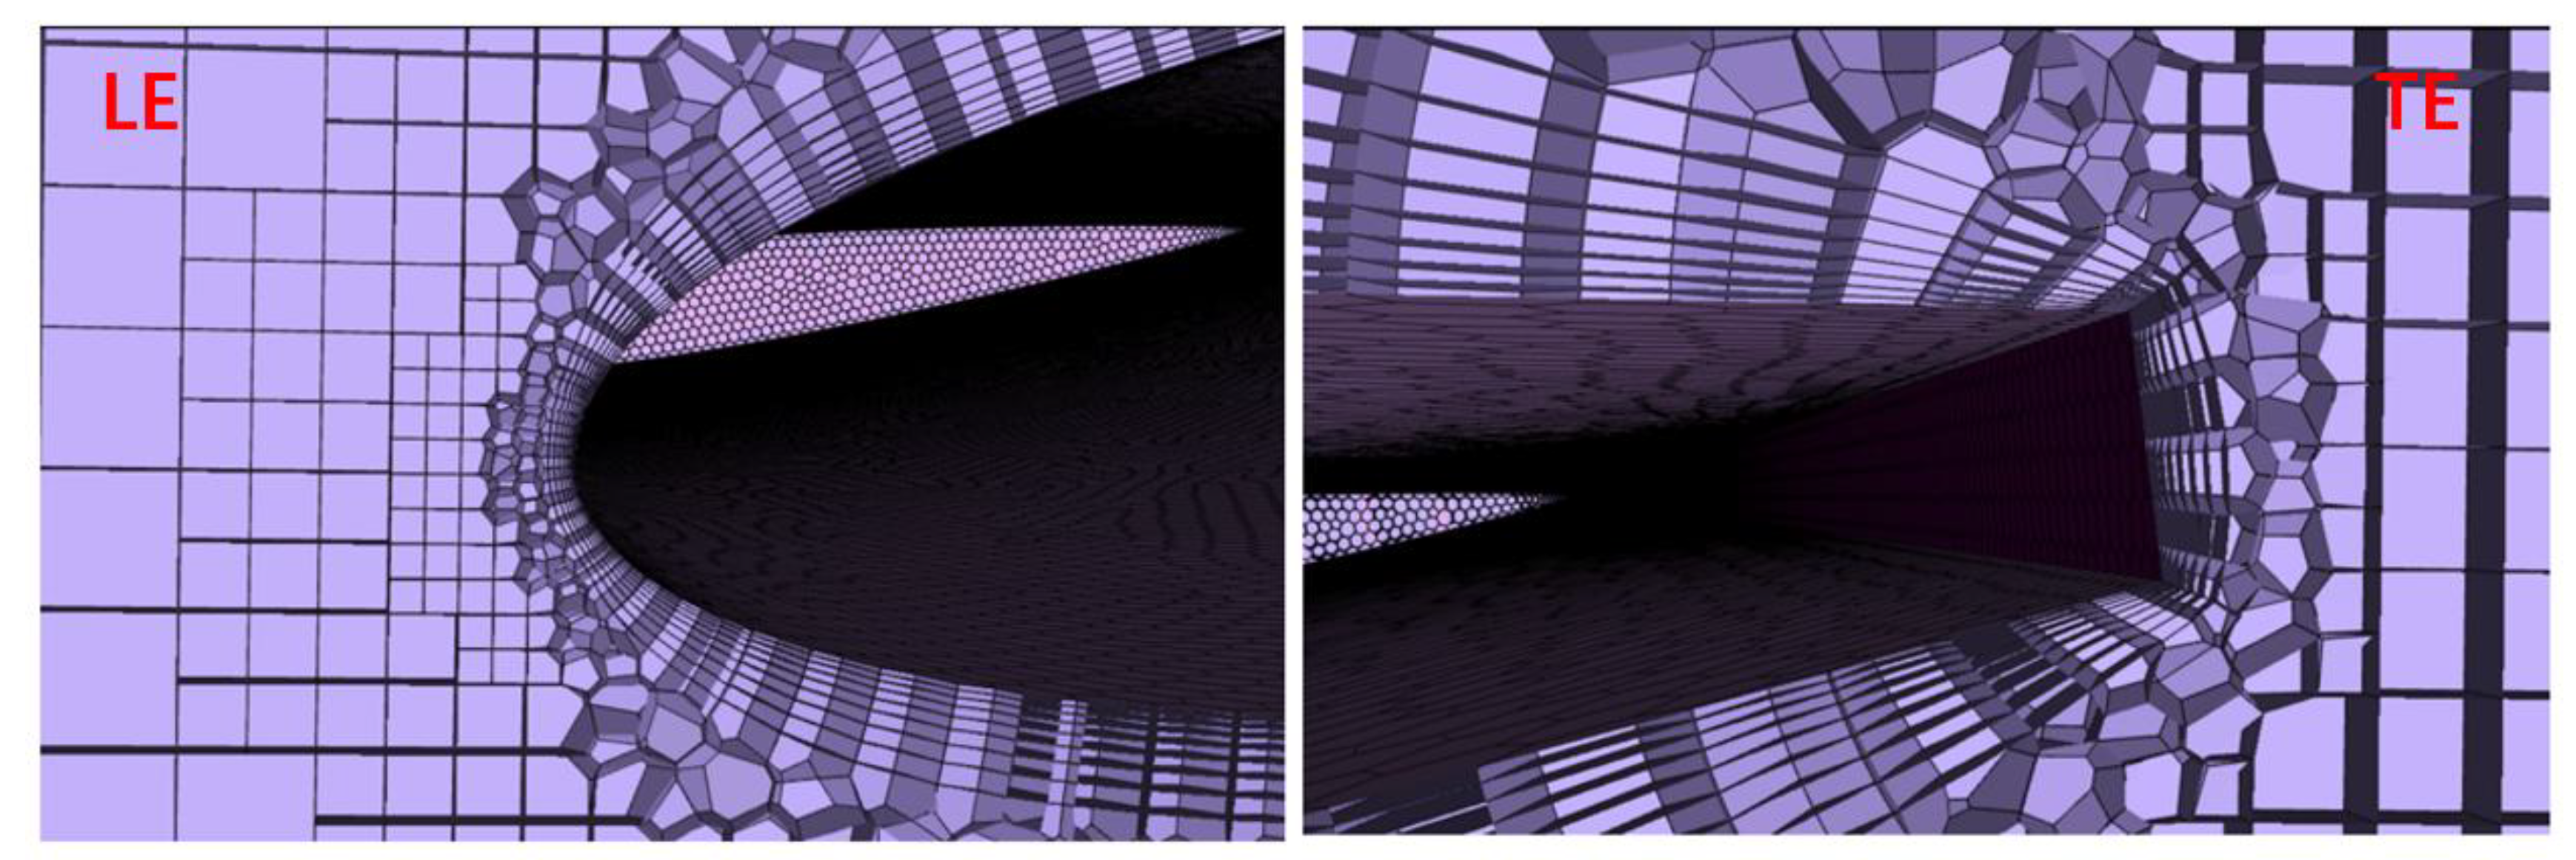
Figure 5.
Comparison of calculated and experimental pressure coefficients at (a) r/R = 0.50, (b) 0.68, (c) 0.80, (d) 0.89, and (e) 0.96.
Figure 5.
Comparison of calculated and experimental pressure coefficients at (a) r/R = 0.50, (b) 0.68, (c) 0.80, (d) 0.89, and (e) 0.96.
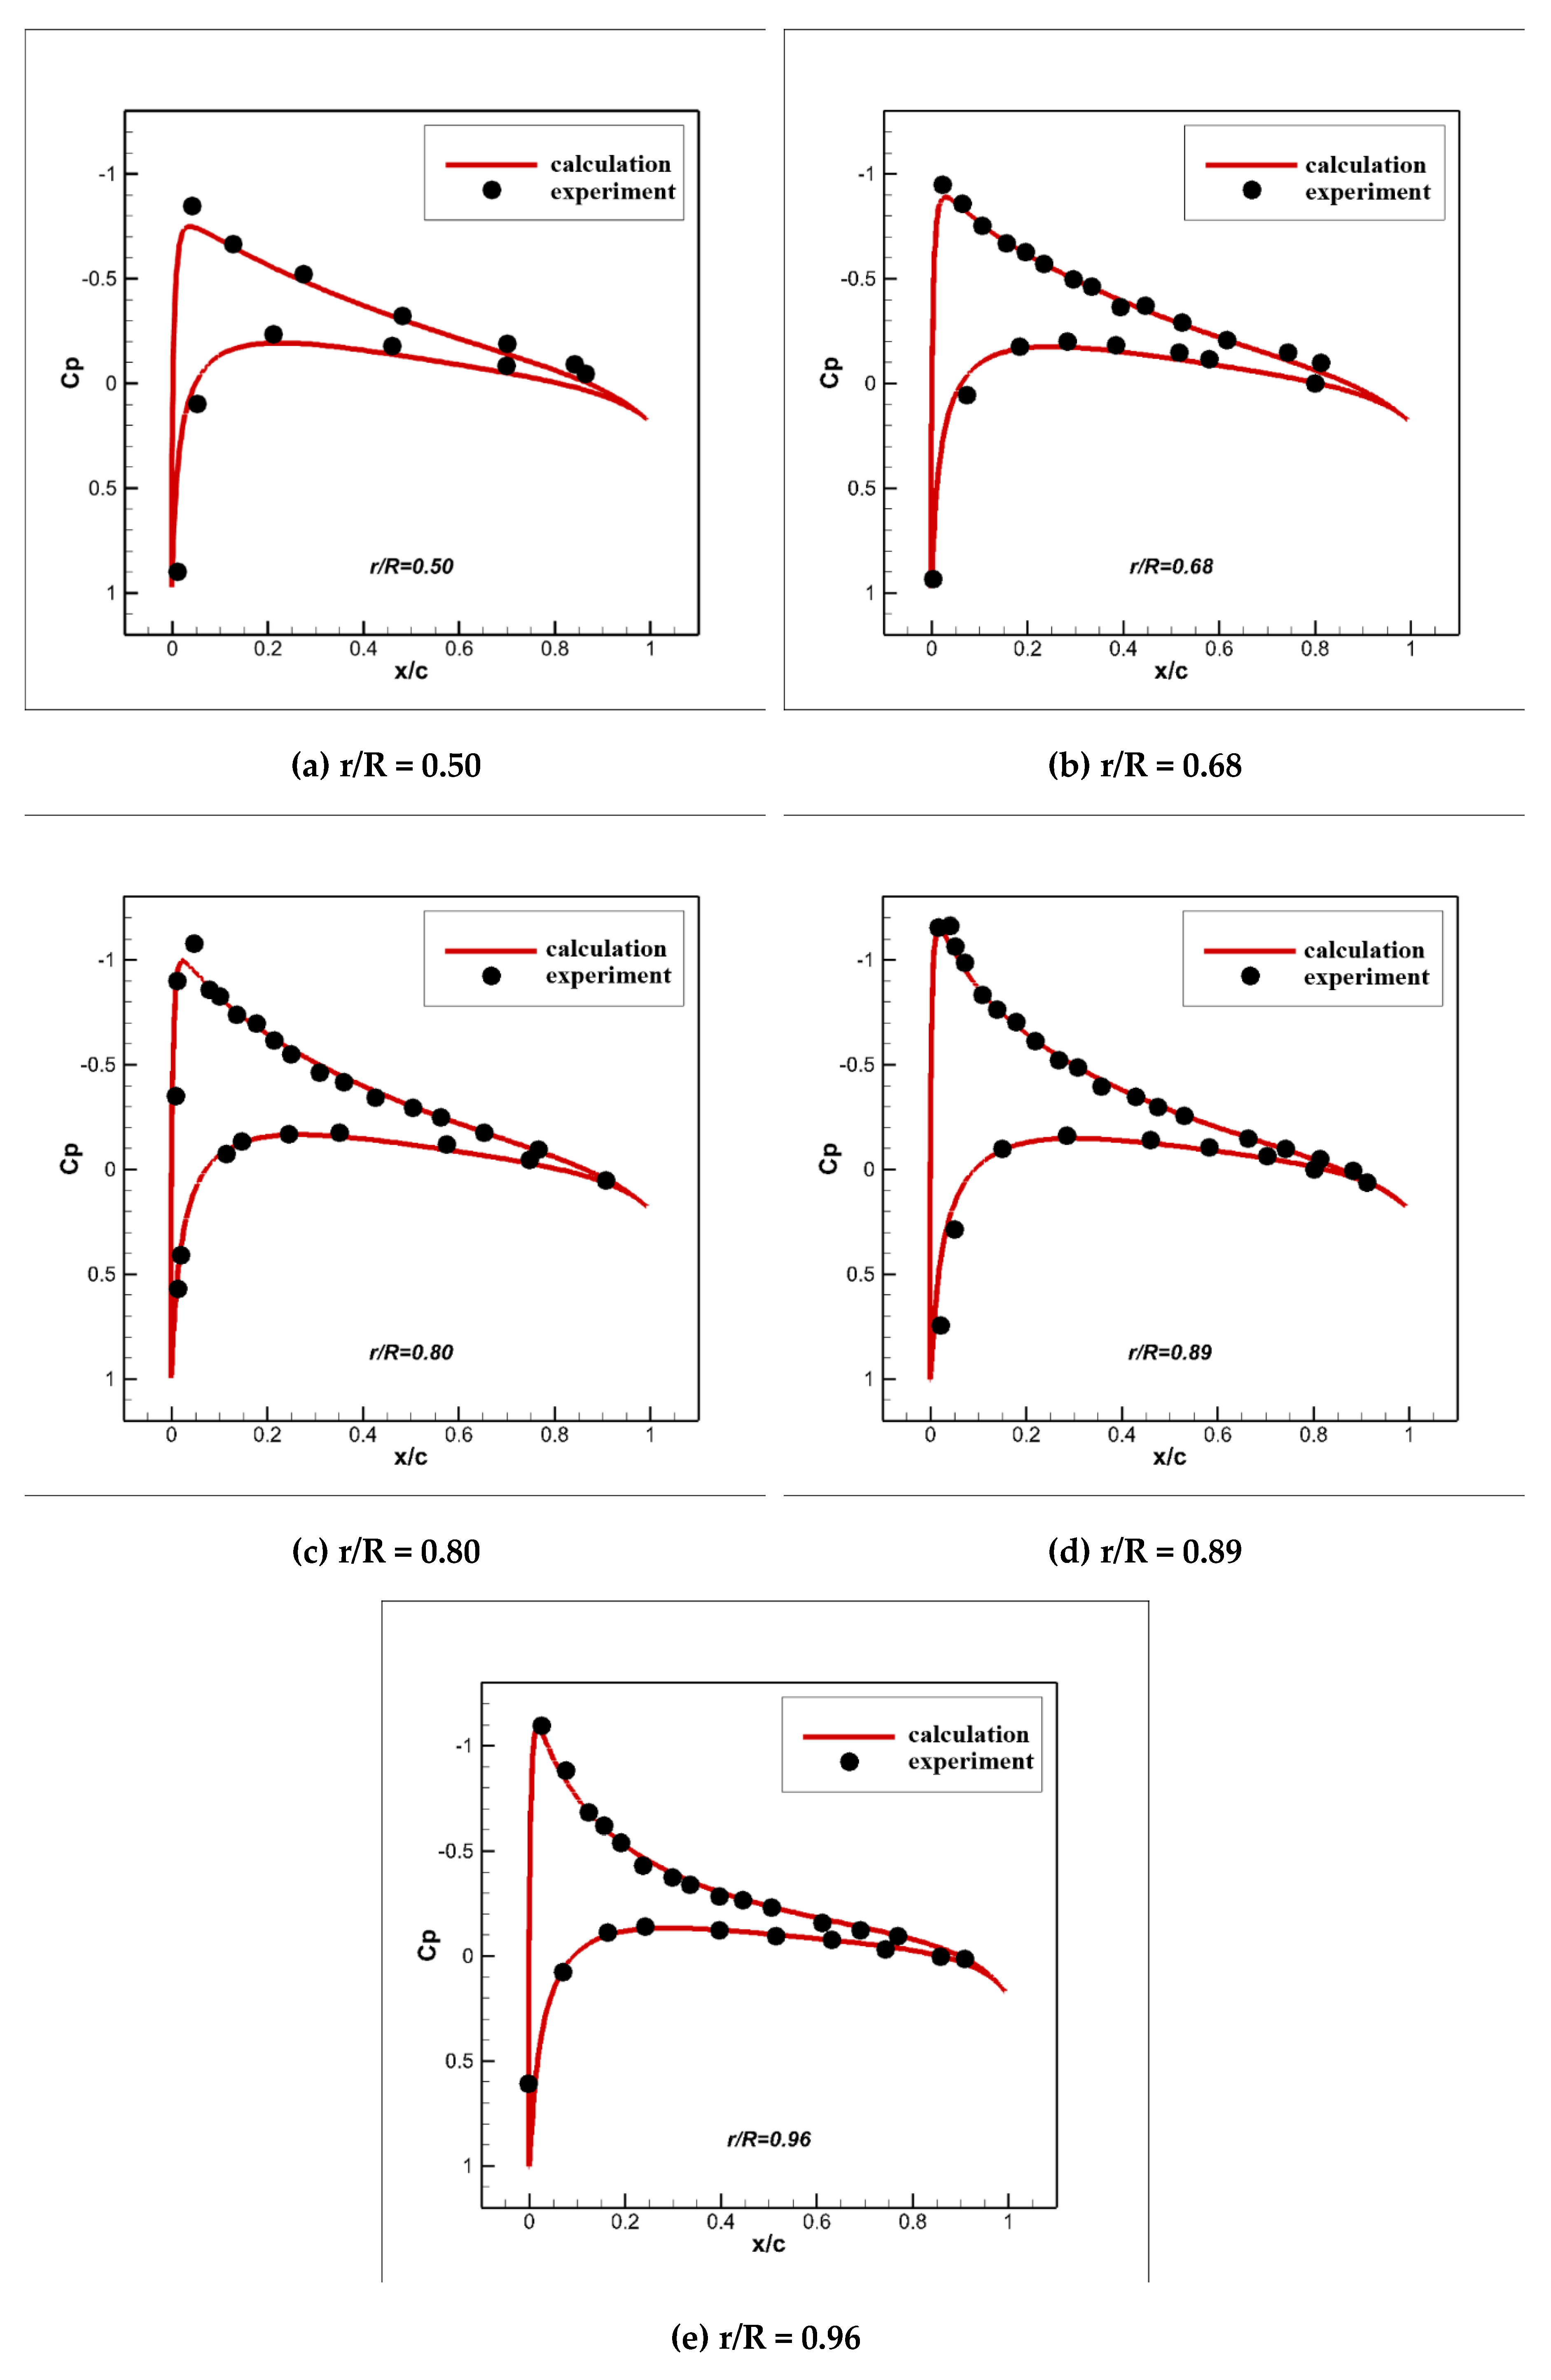
Figure 6.
Baseline rotor: (a) thrust history and (b) torque history.
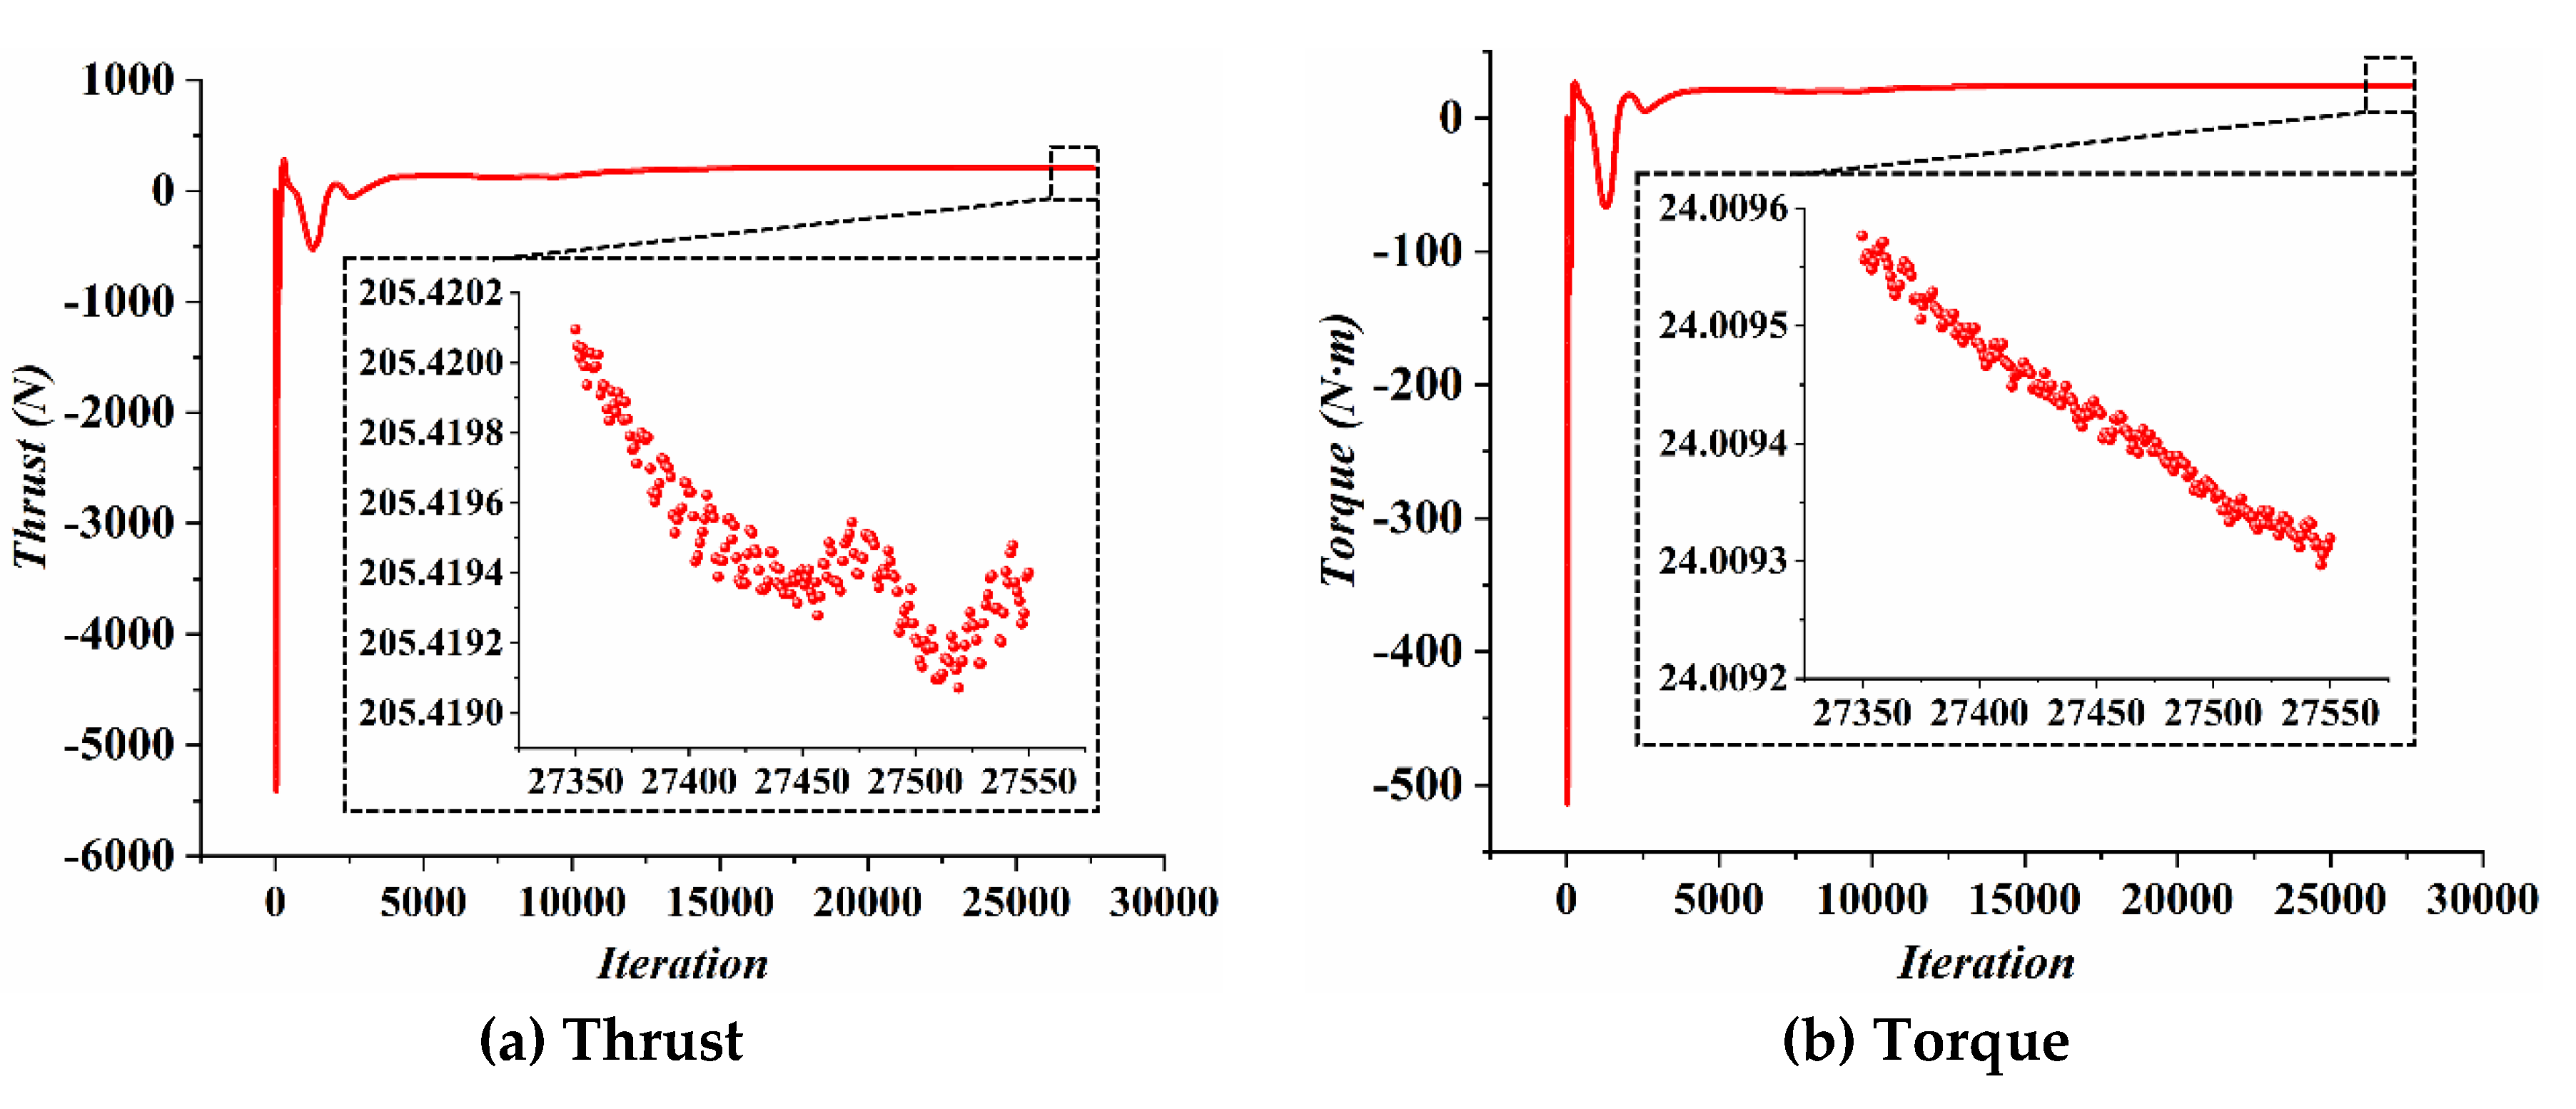
Figure 7.
Tip-vortex structures visualized using a Q-criterion iso-surface (Q = 20s−2) colored by vorticity magnitude.
Figure 7.
Tip-vortex structures visualized using a Q-criterion iso-surface (Q = 20s−2) colored by vorticity magnitude.
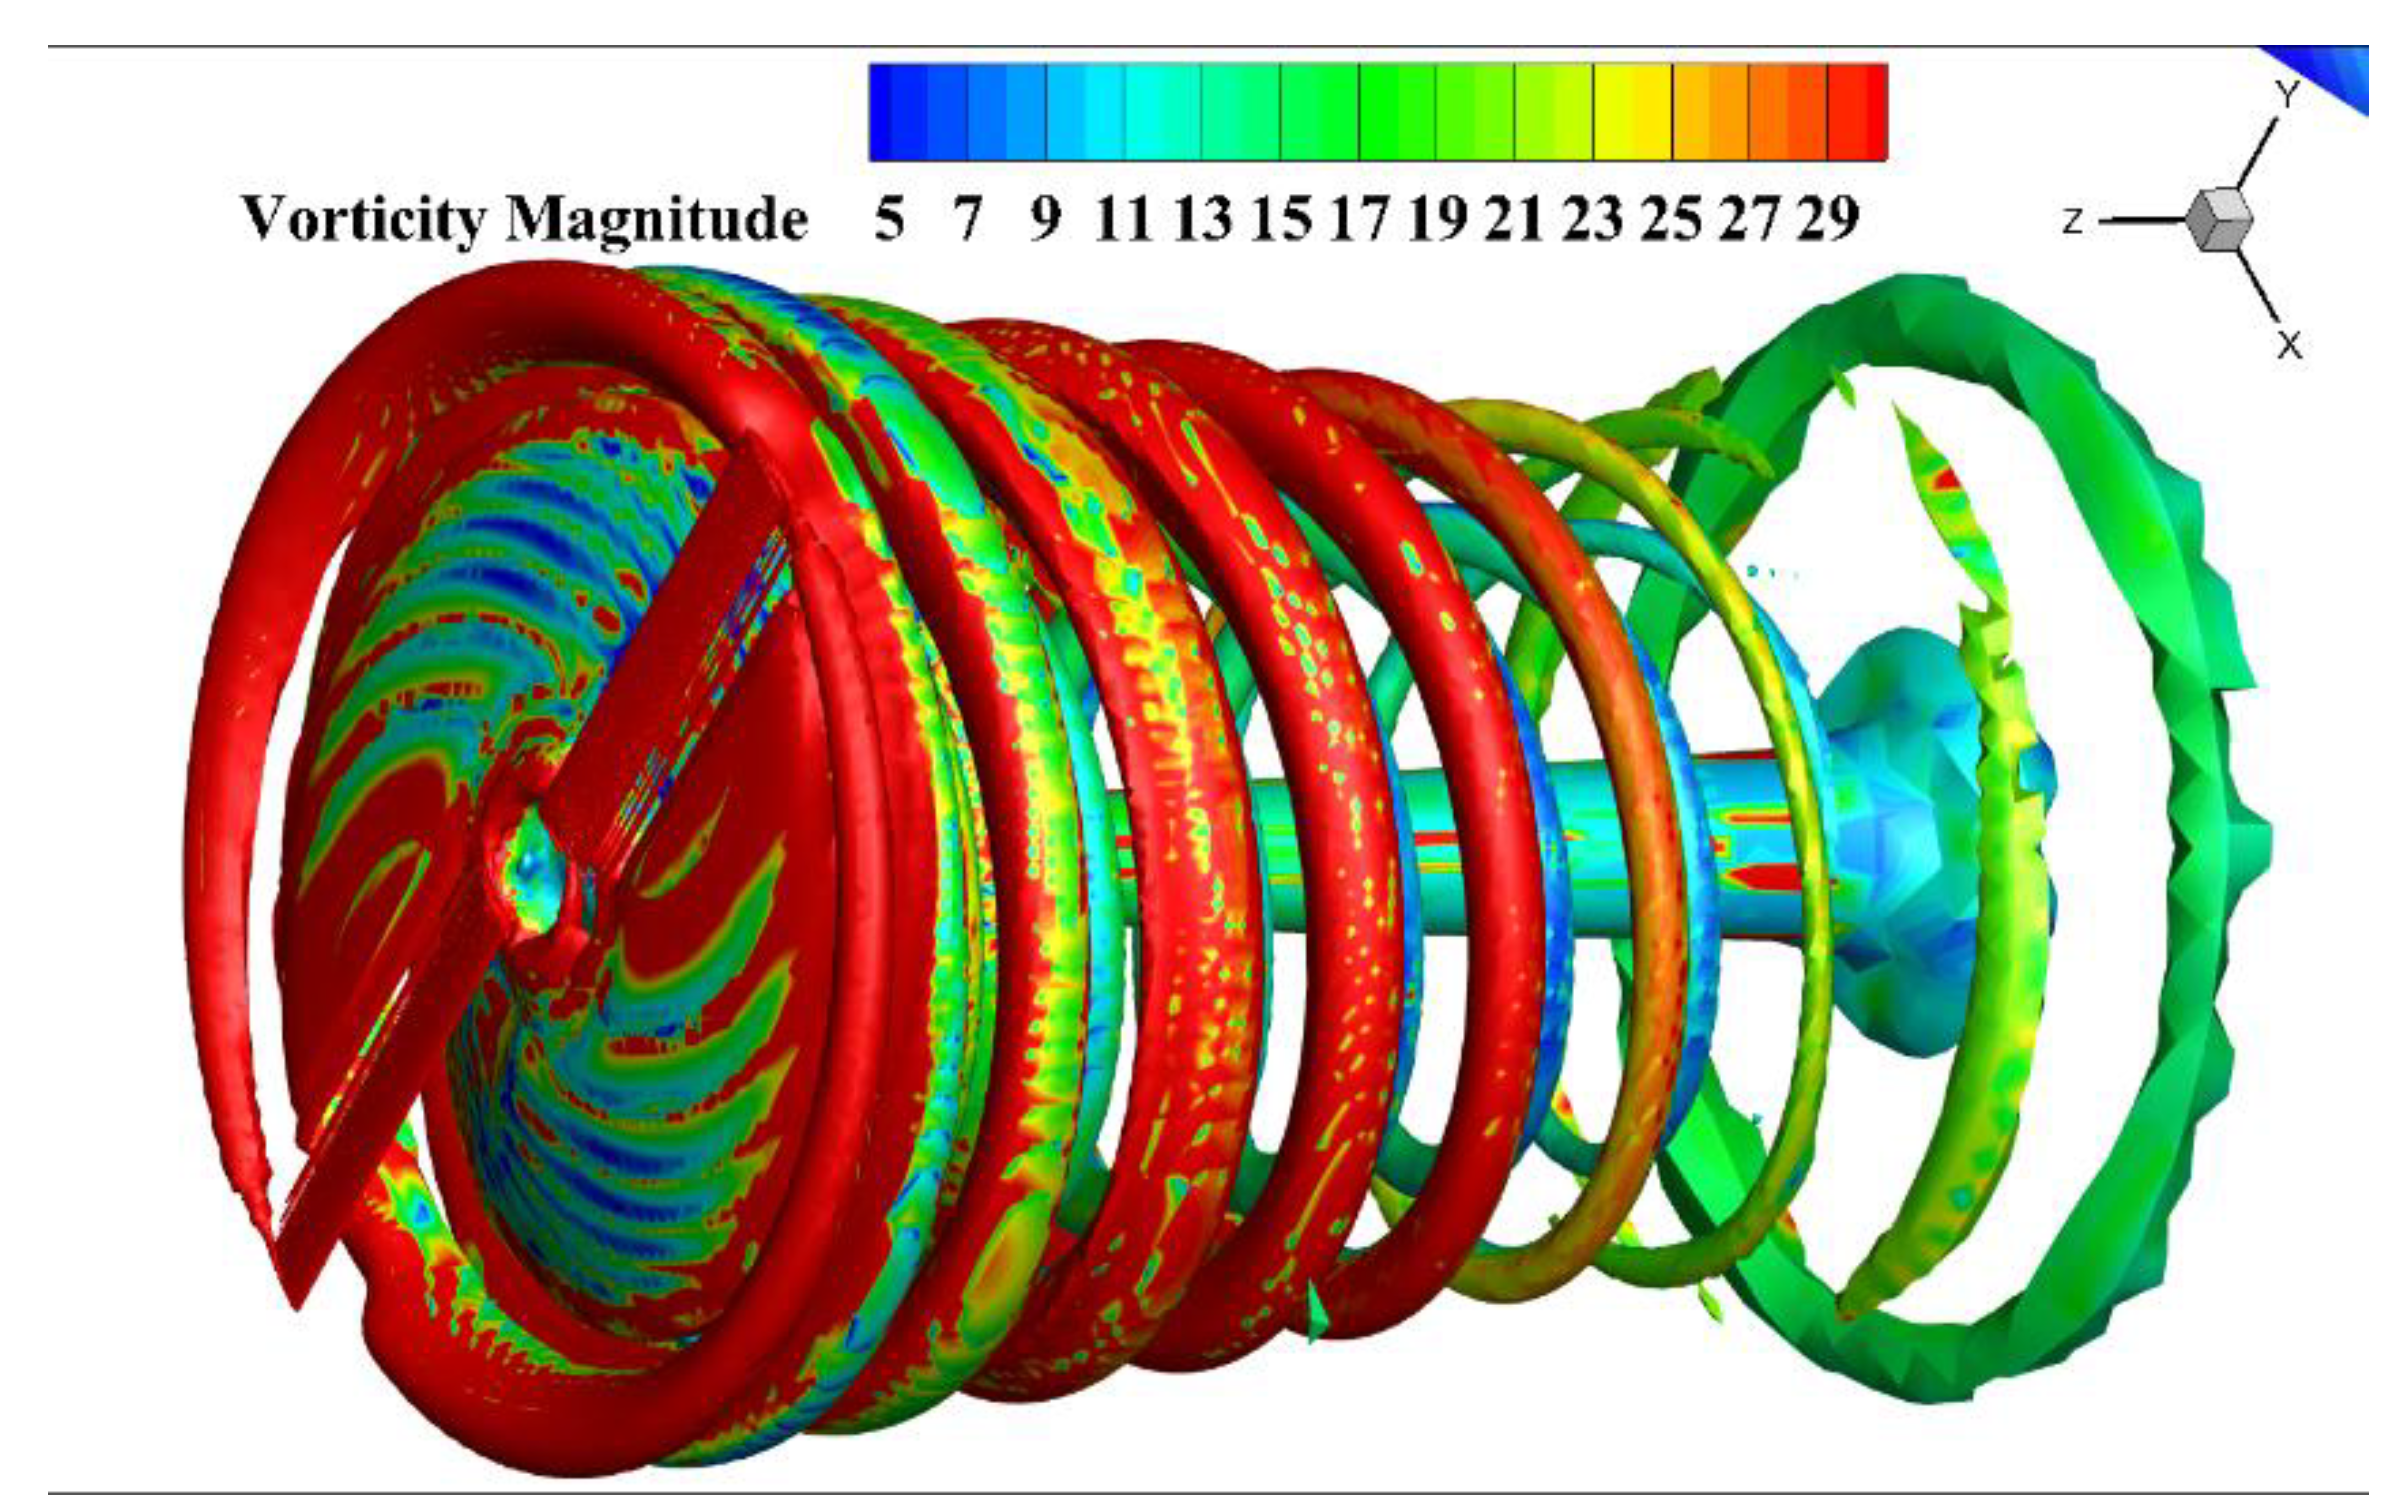
Figure 8.
Vorticity contours on five wake cross sections separated by one rotor radius.
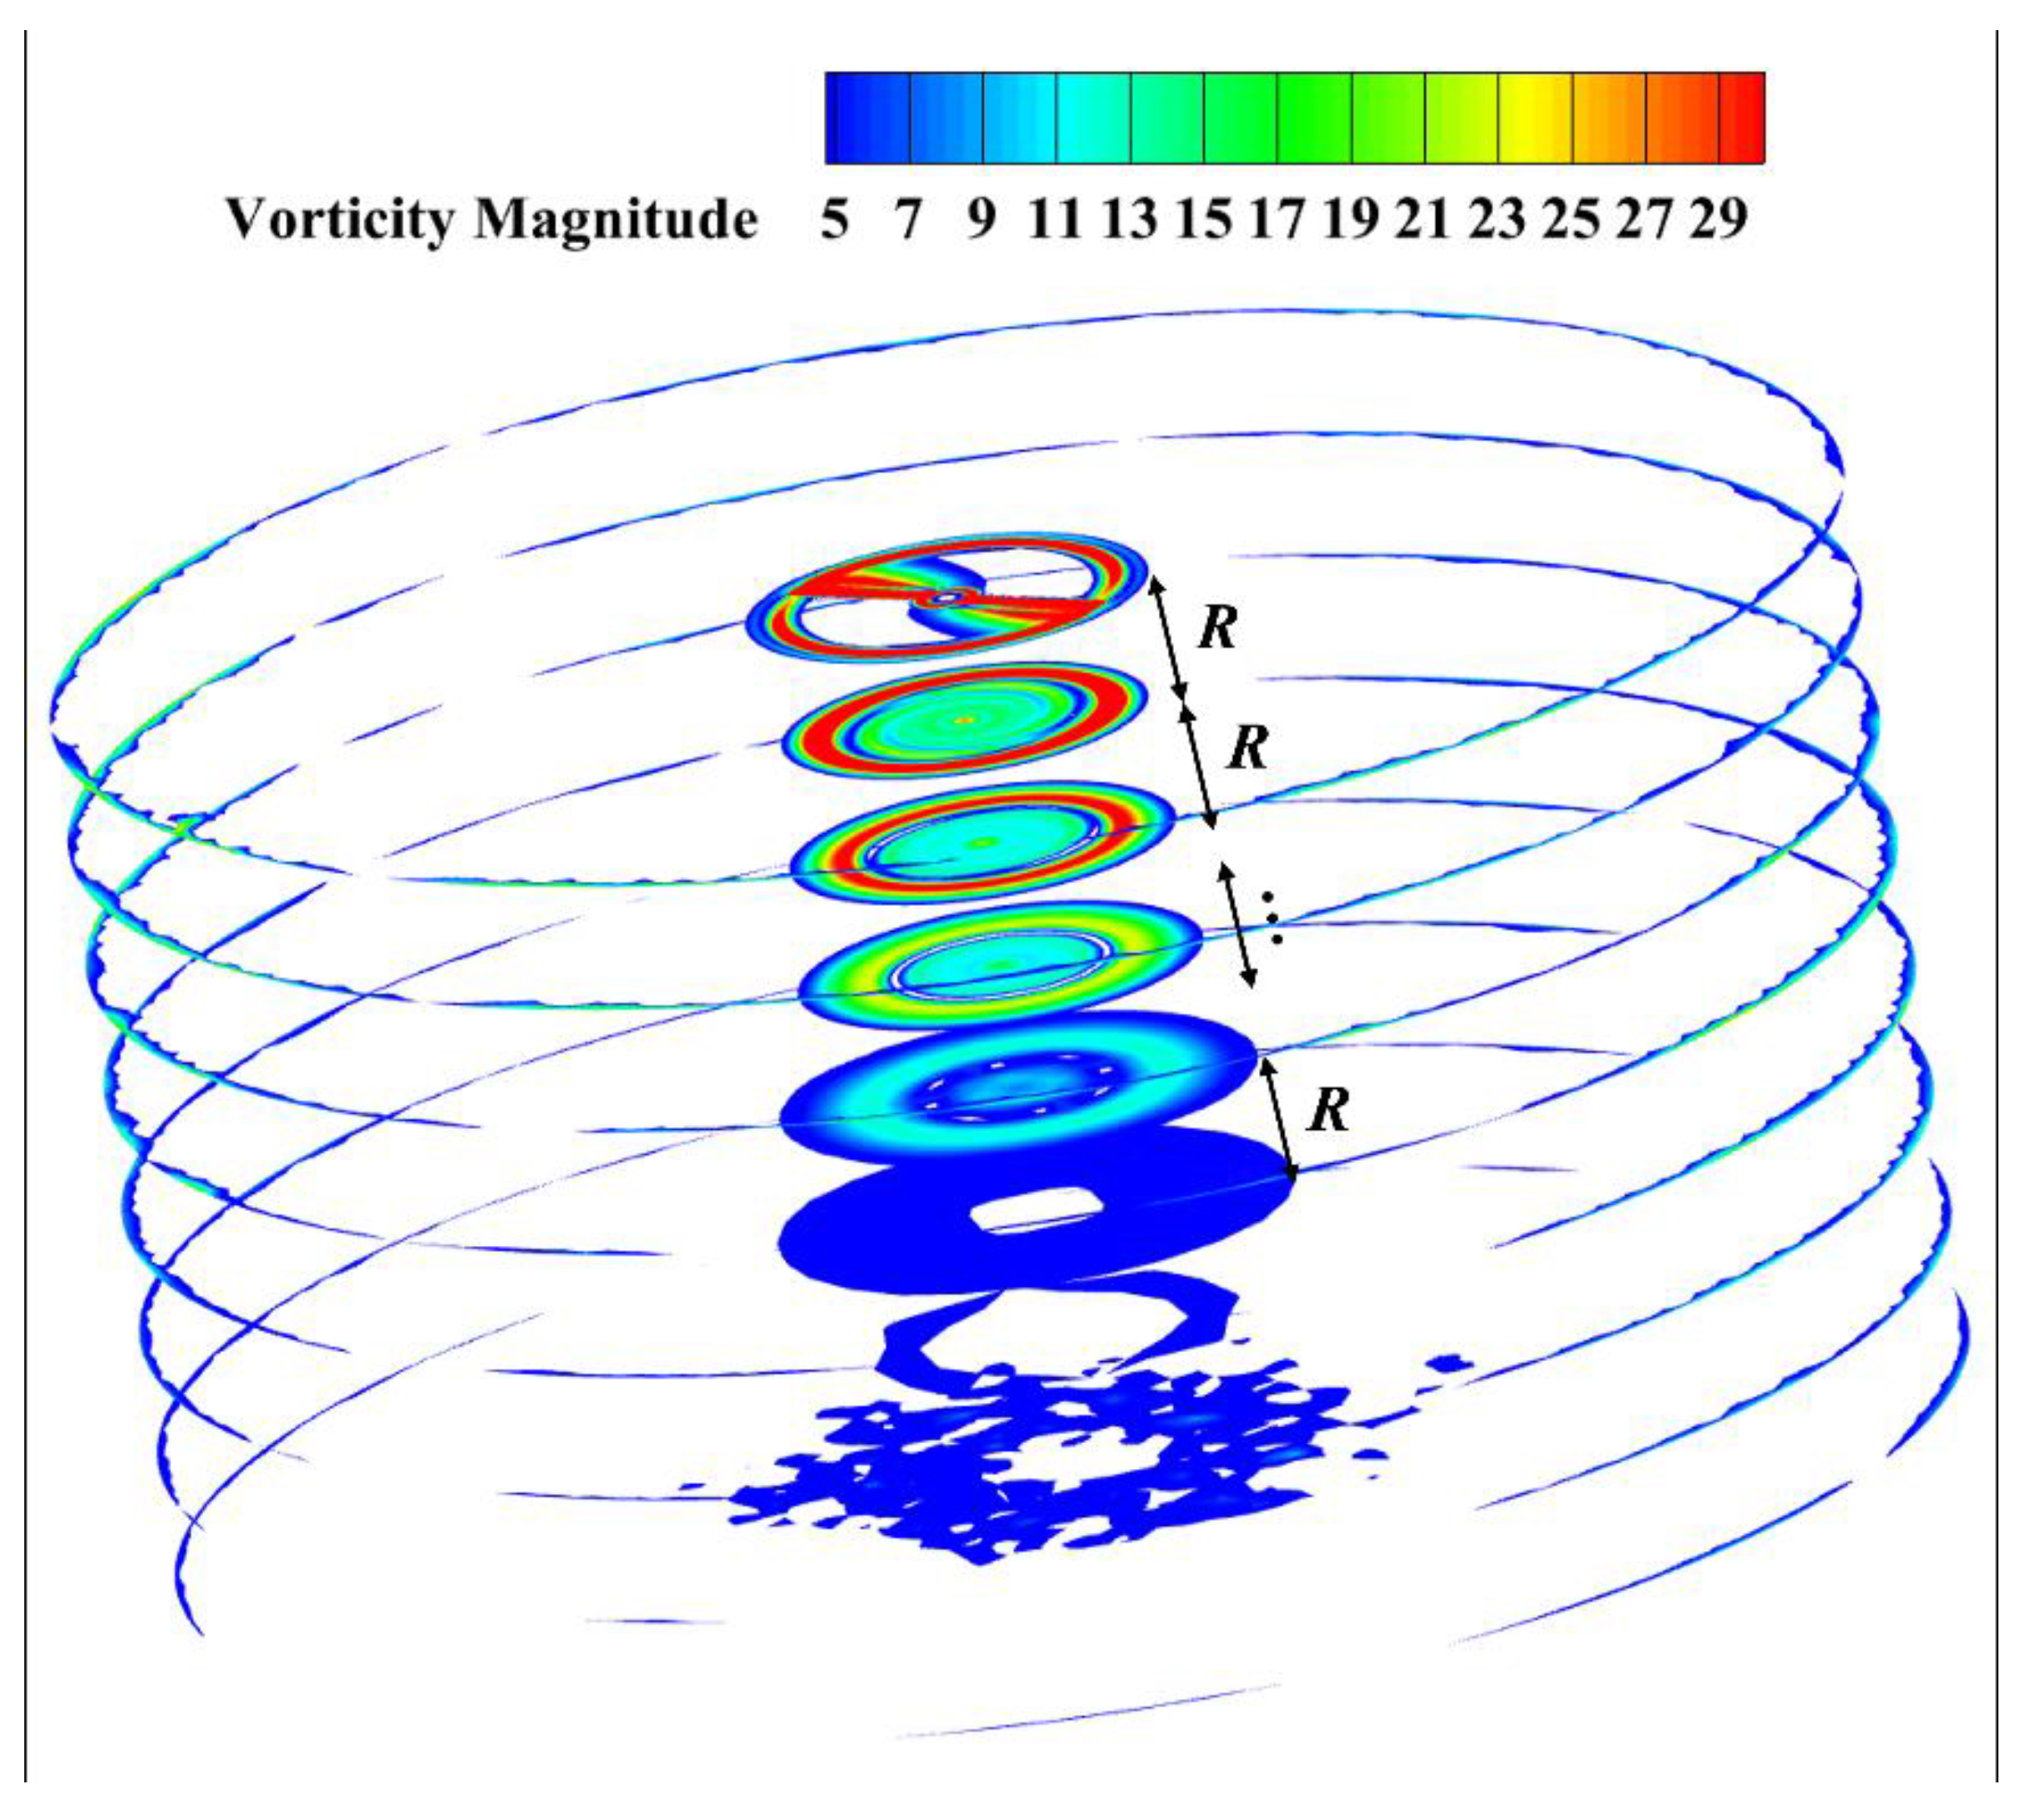
Figure 9.
Vorticity contours on the (a) X = 0 and (b) Y = 0 planes.
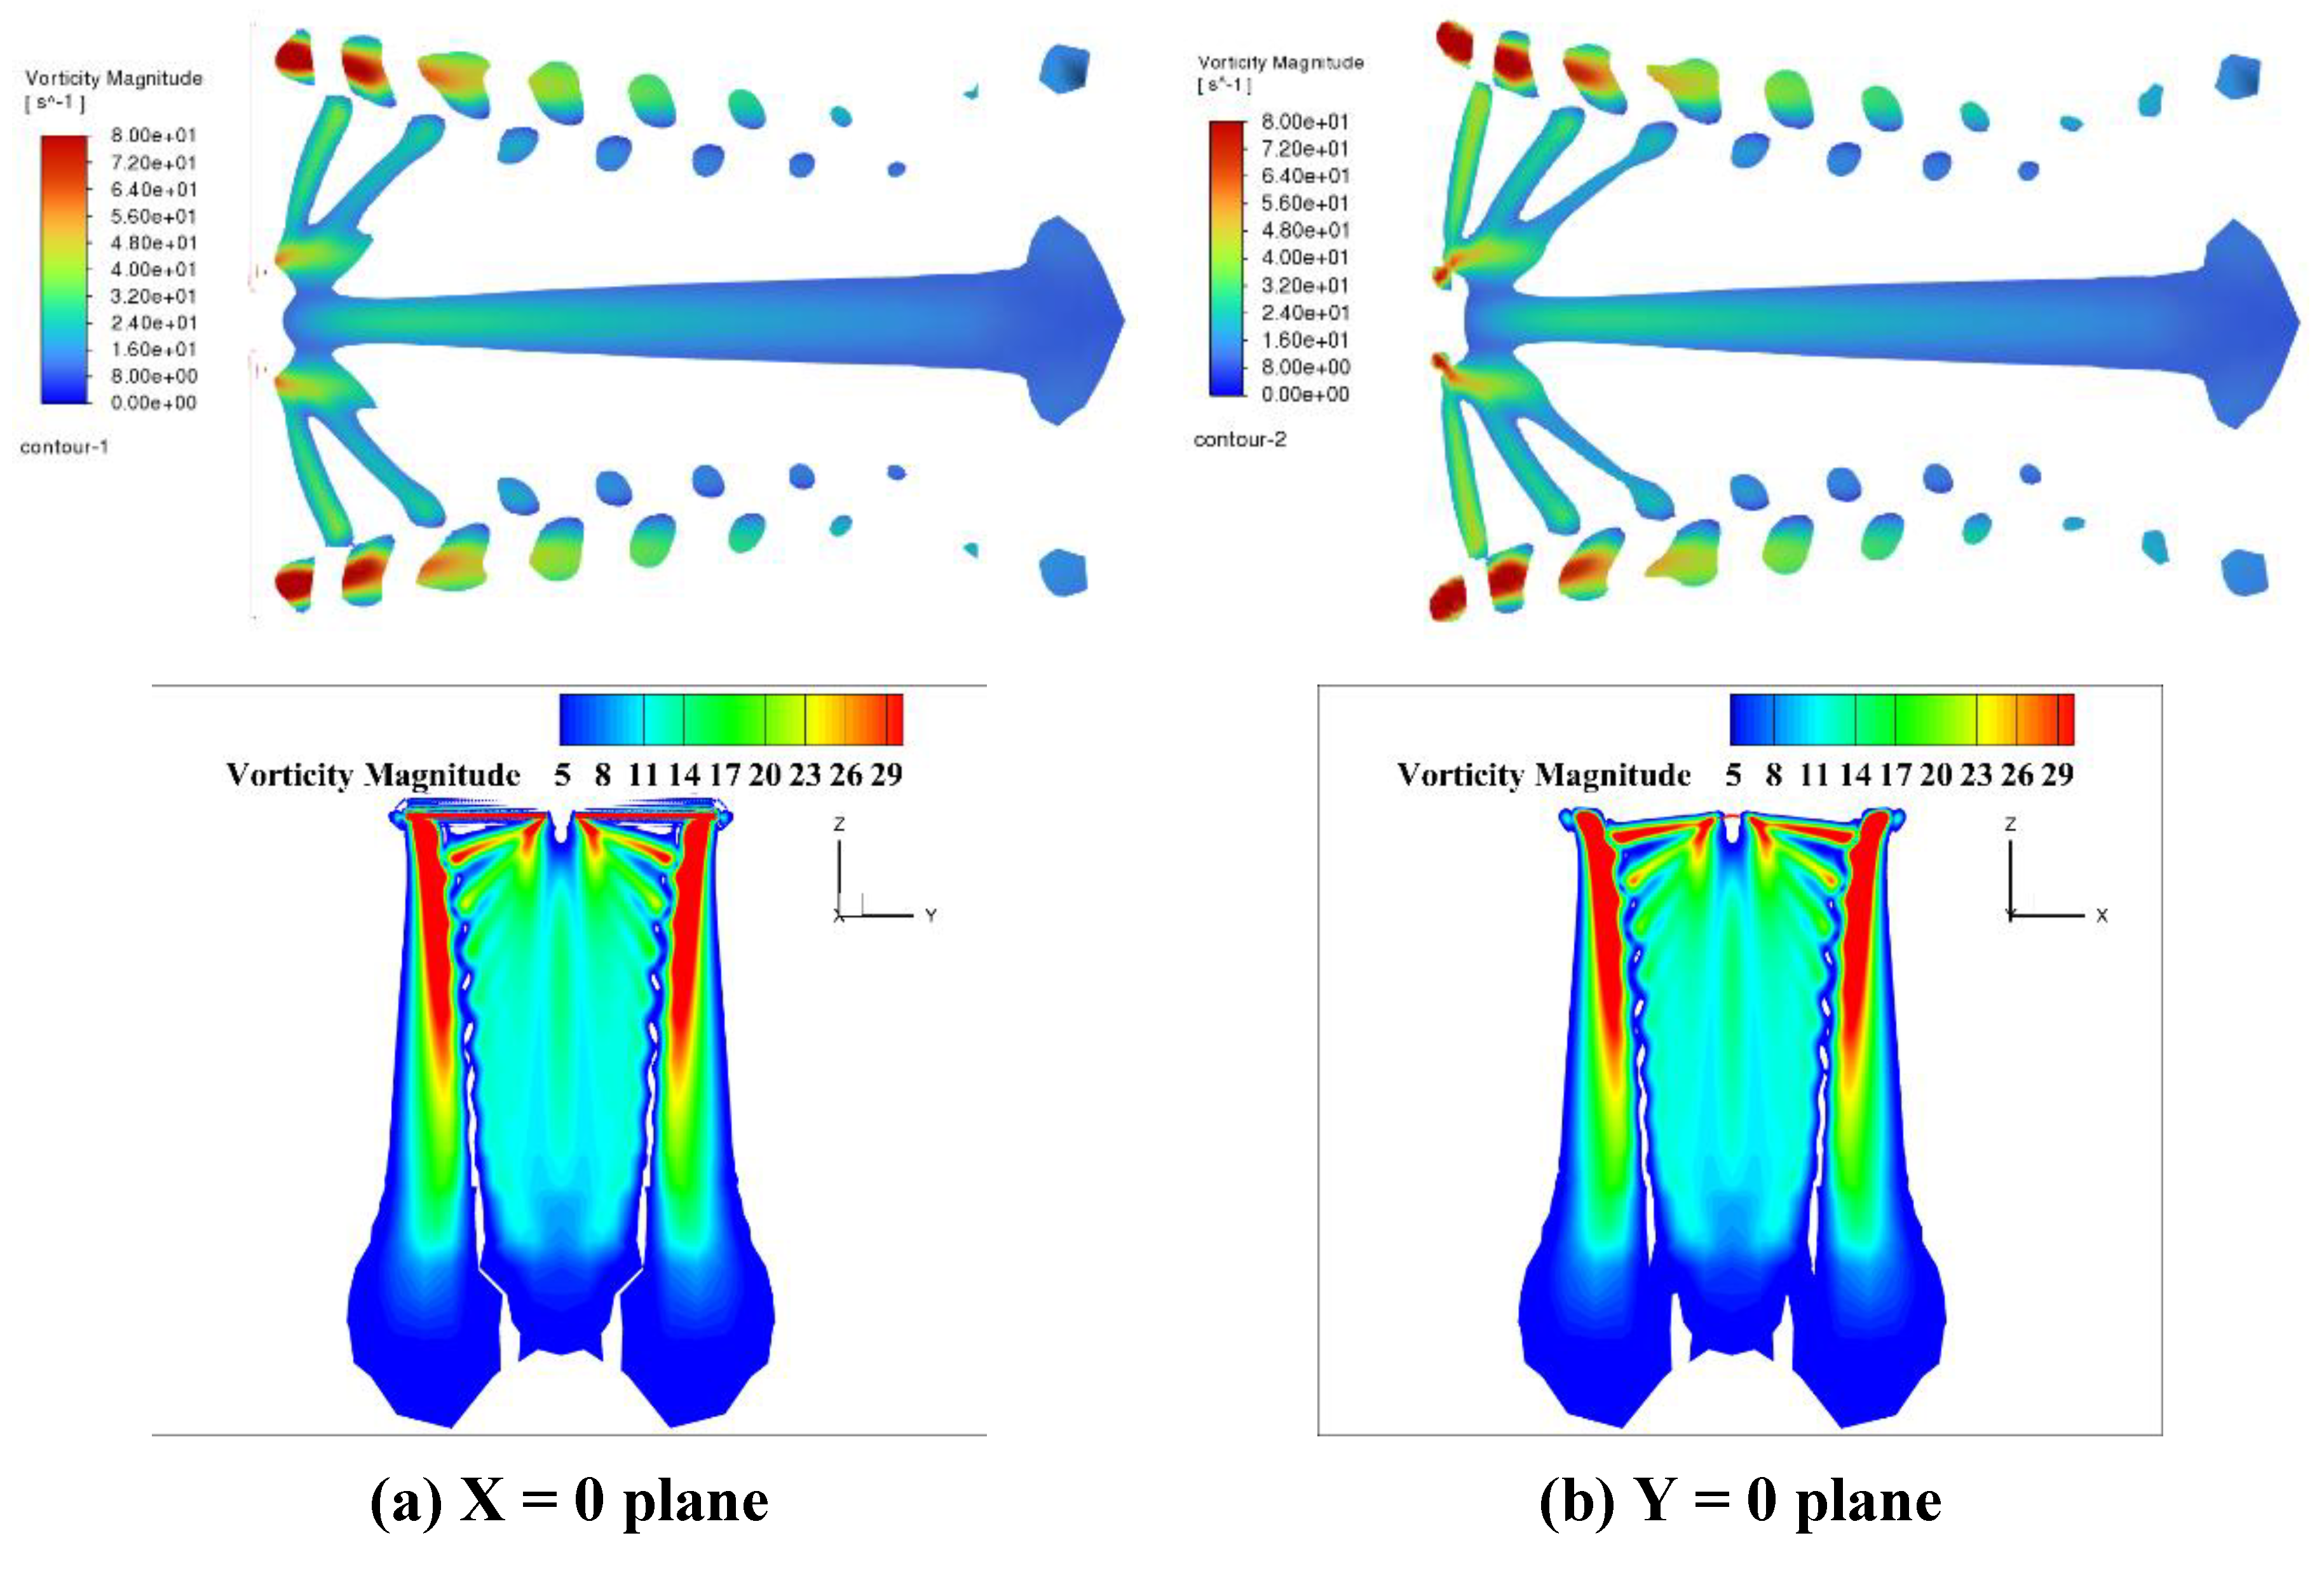
Figure 10.
Arrangement of the distributed blade-tip jet orifices.
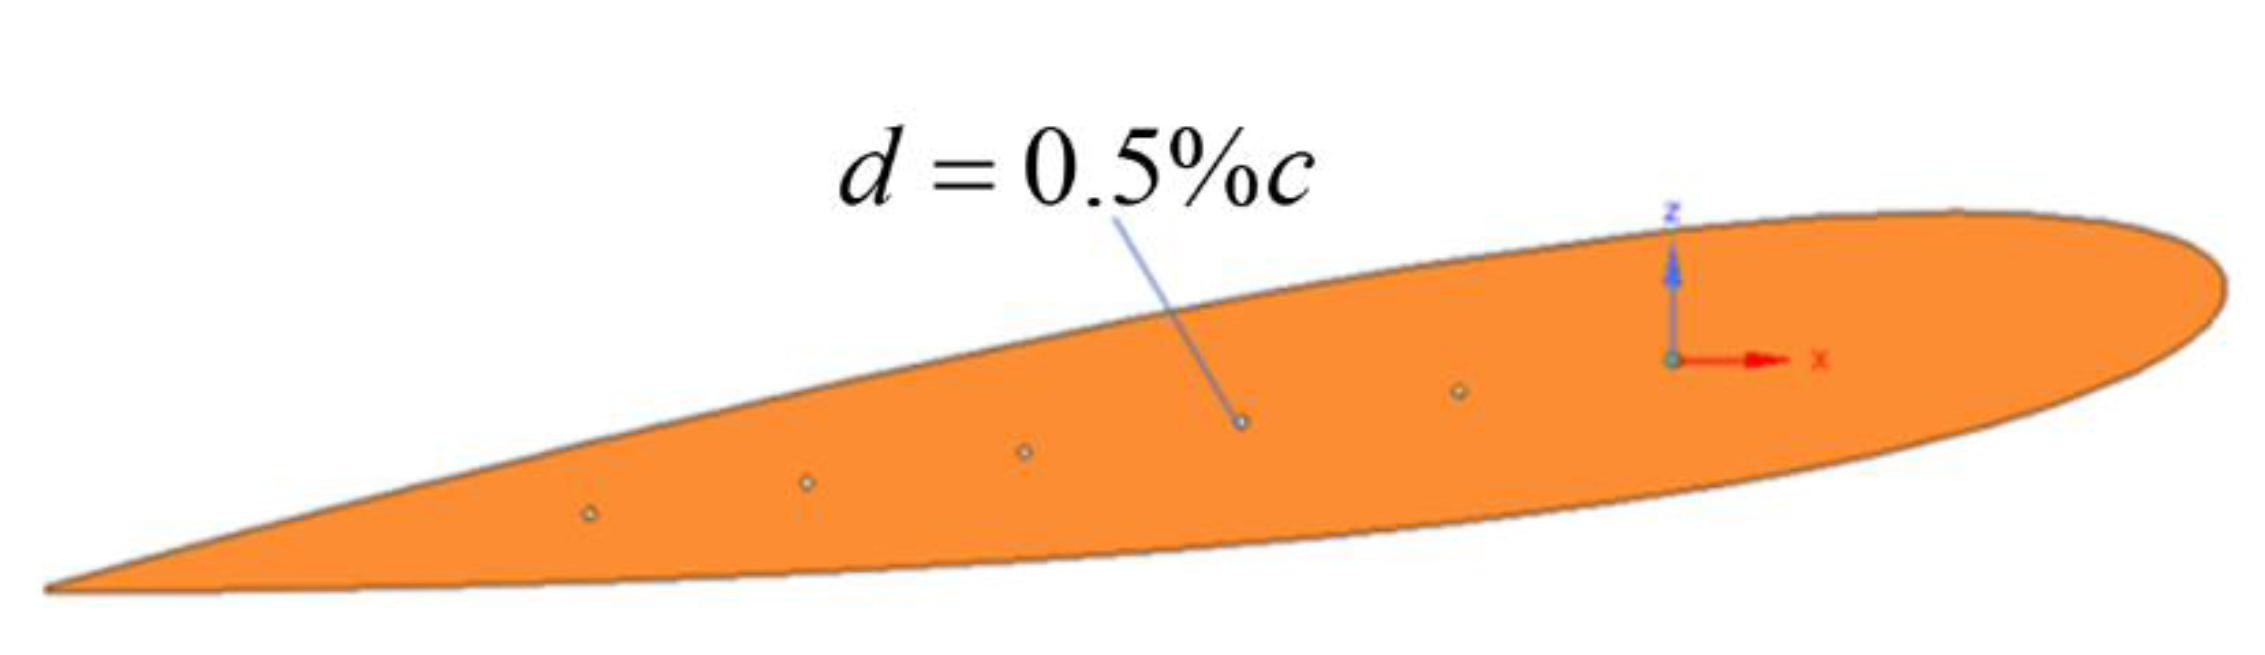
Figure 11.
Local flow fields for jet velocities of (a) 1, (b) 2, and (c) 3 times the blade-tip speed.
Figure 11.
Local flow fields for jet velocities of (a) 1, (b) 2, and (c) 3 times the blade-tip speed.
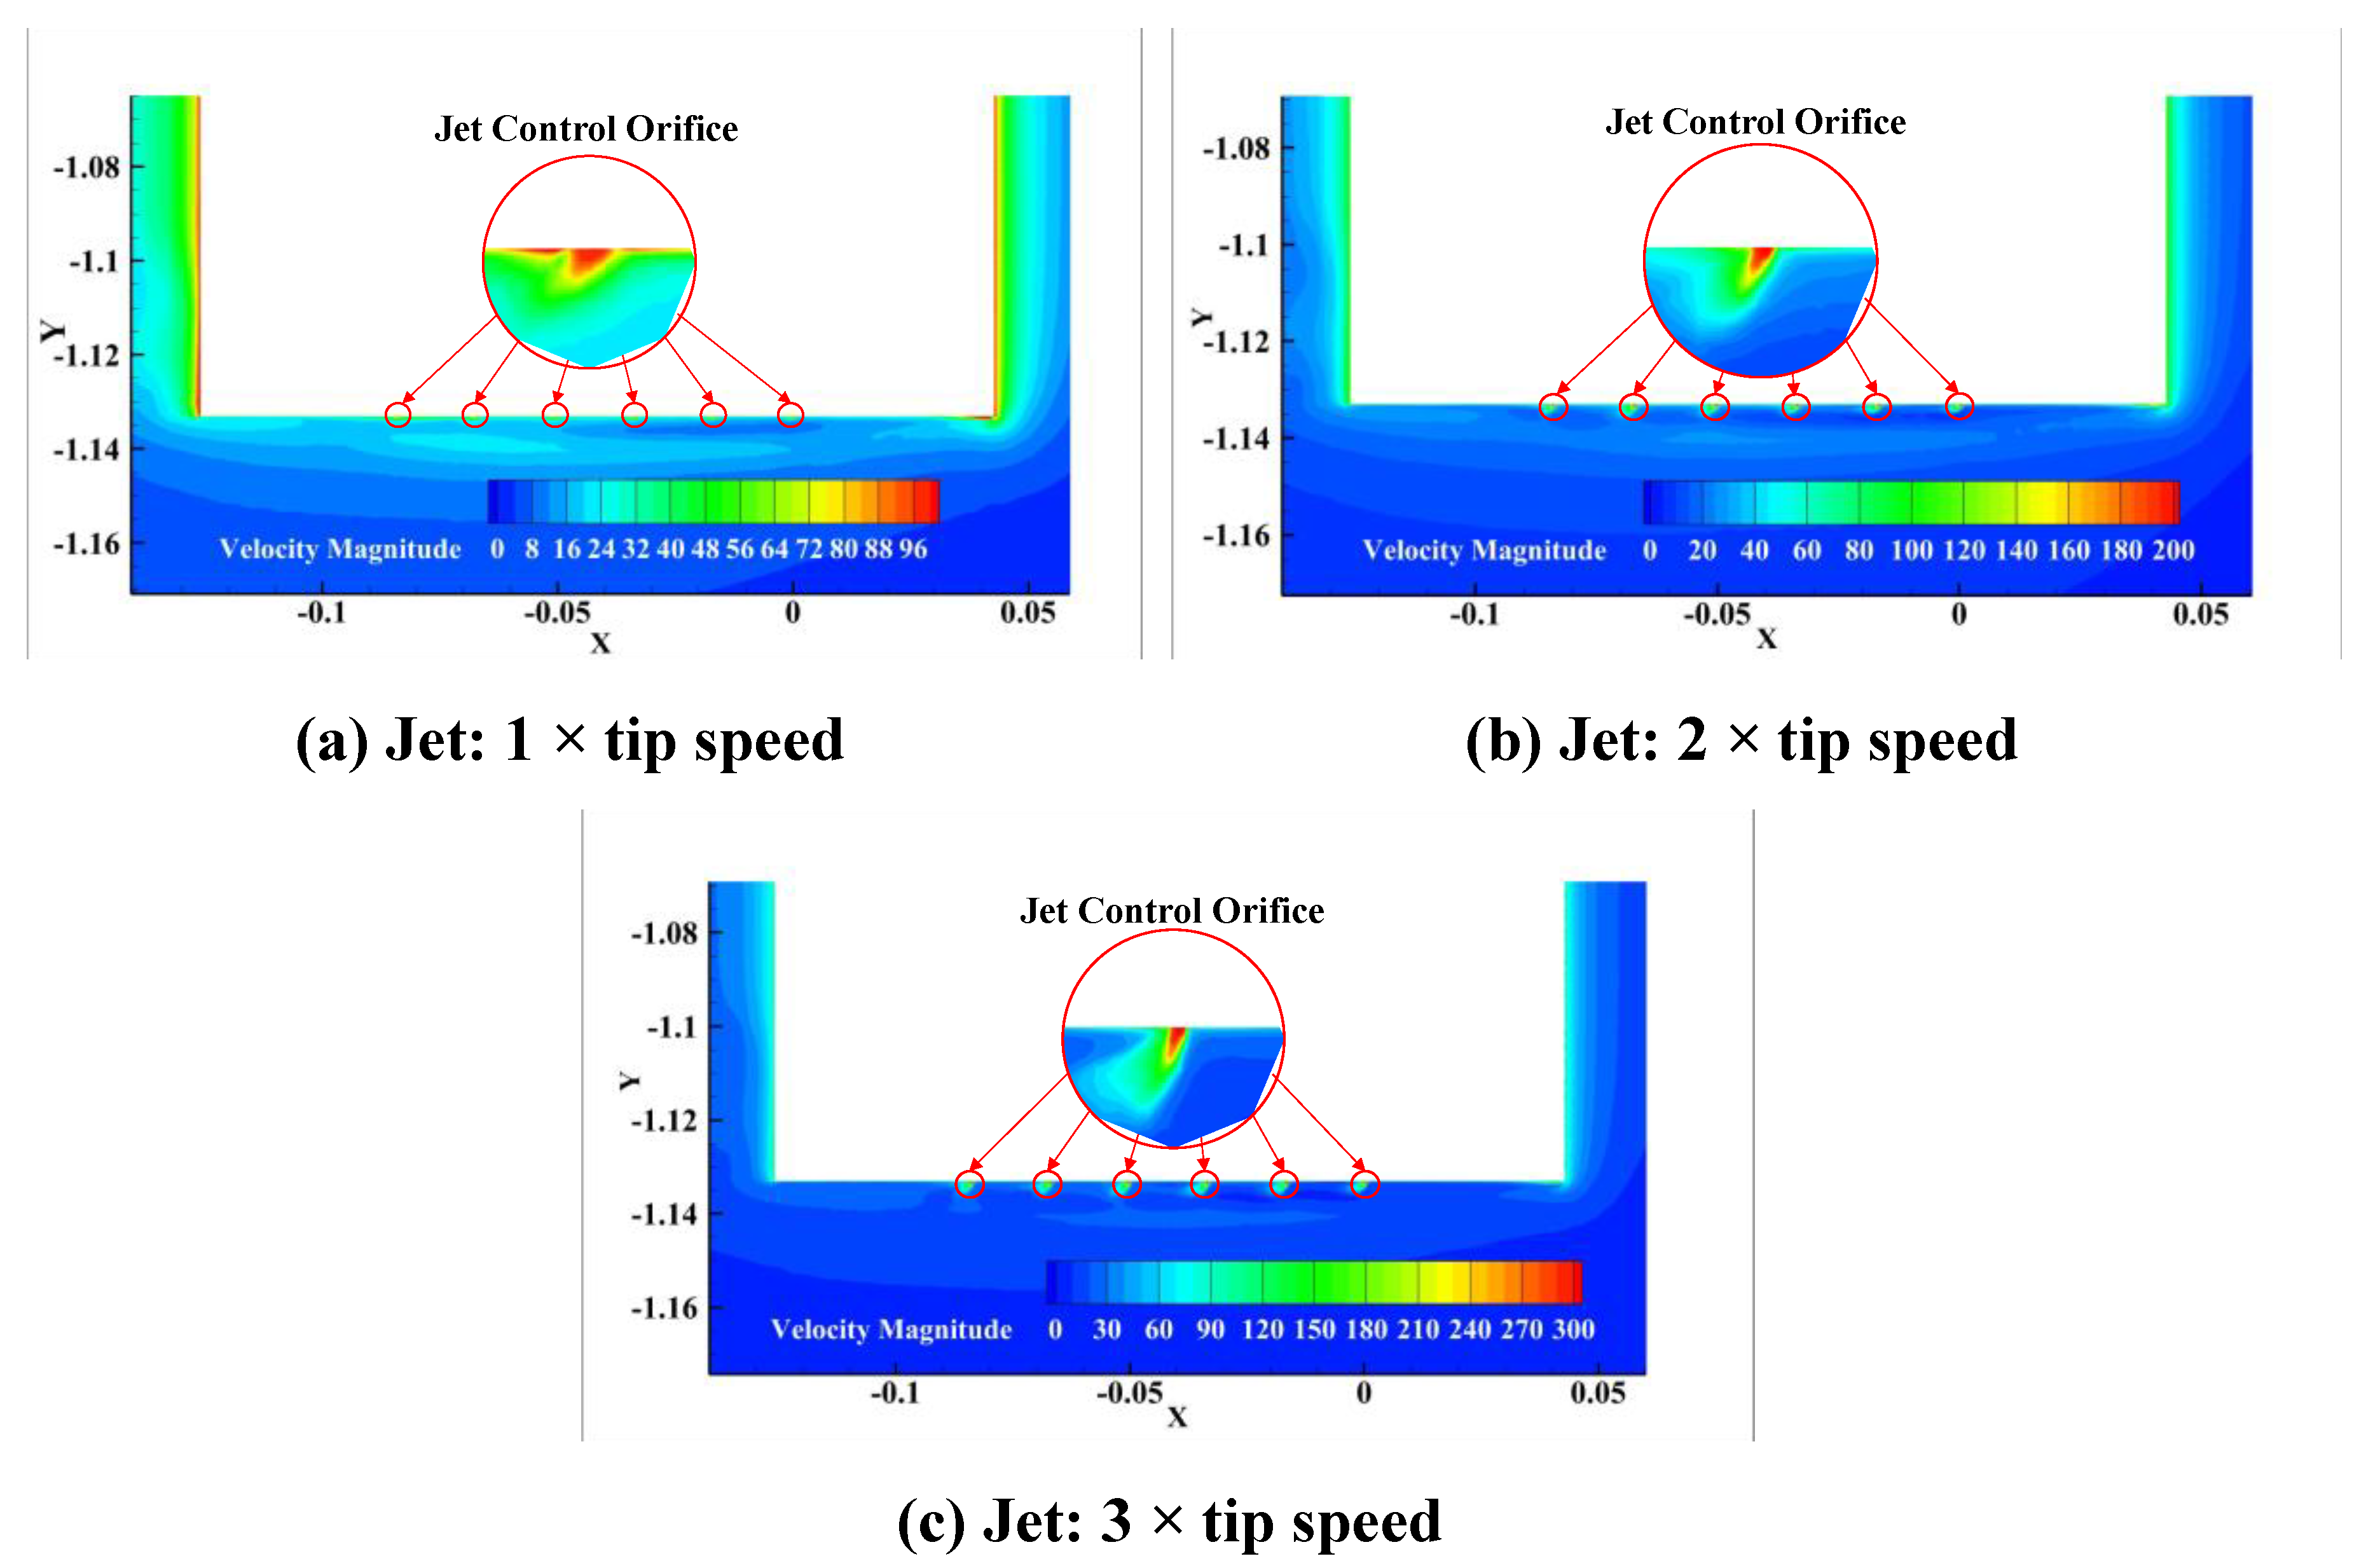
Figure 12.
Rotor thrust histories at jet velocities of (a) 100, (b) 200, and (c) 300 m/s.
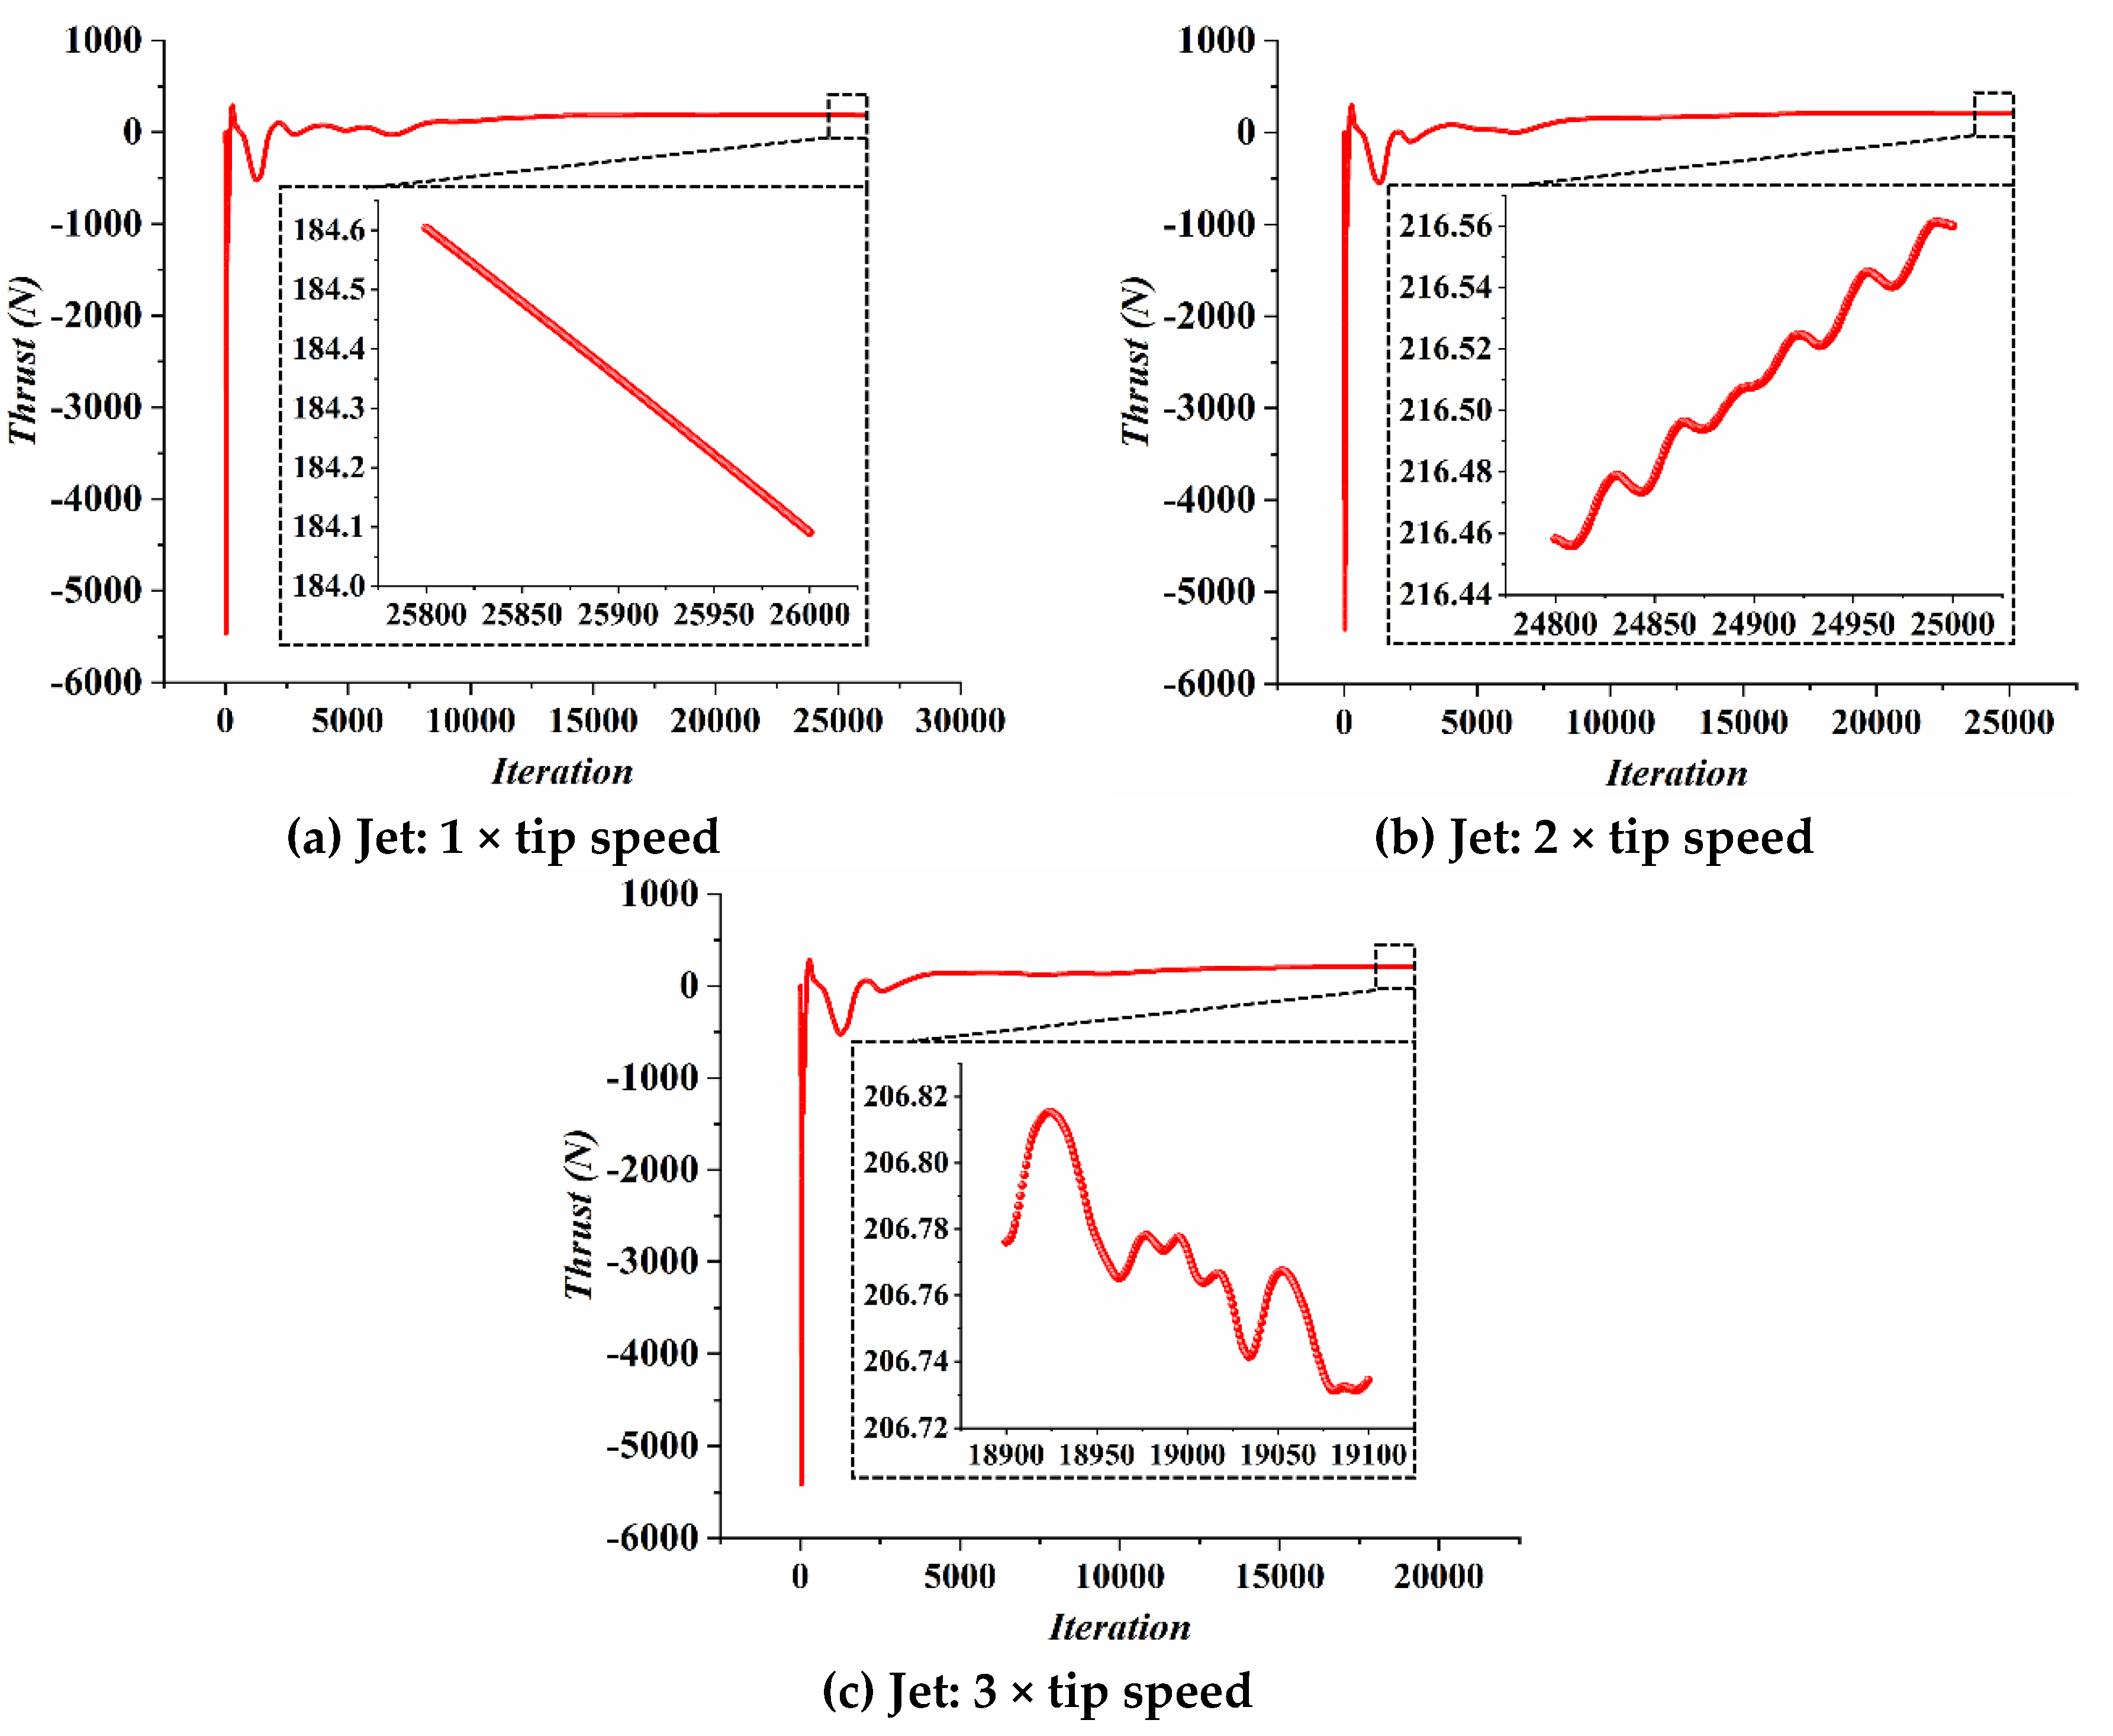
Figure 13.
Rotor torque histories at jet velocities of (a) 100, (b) 200, and (c) 300 m/s.
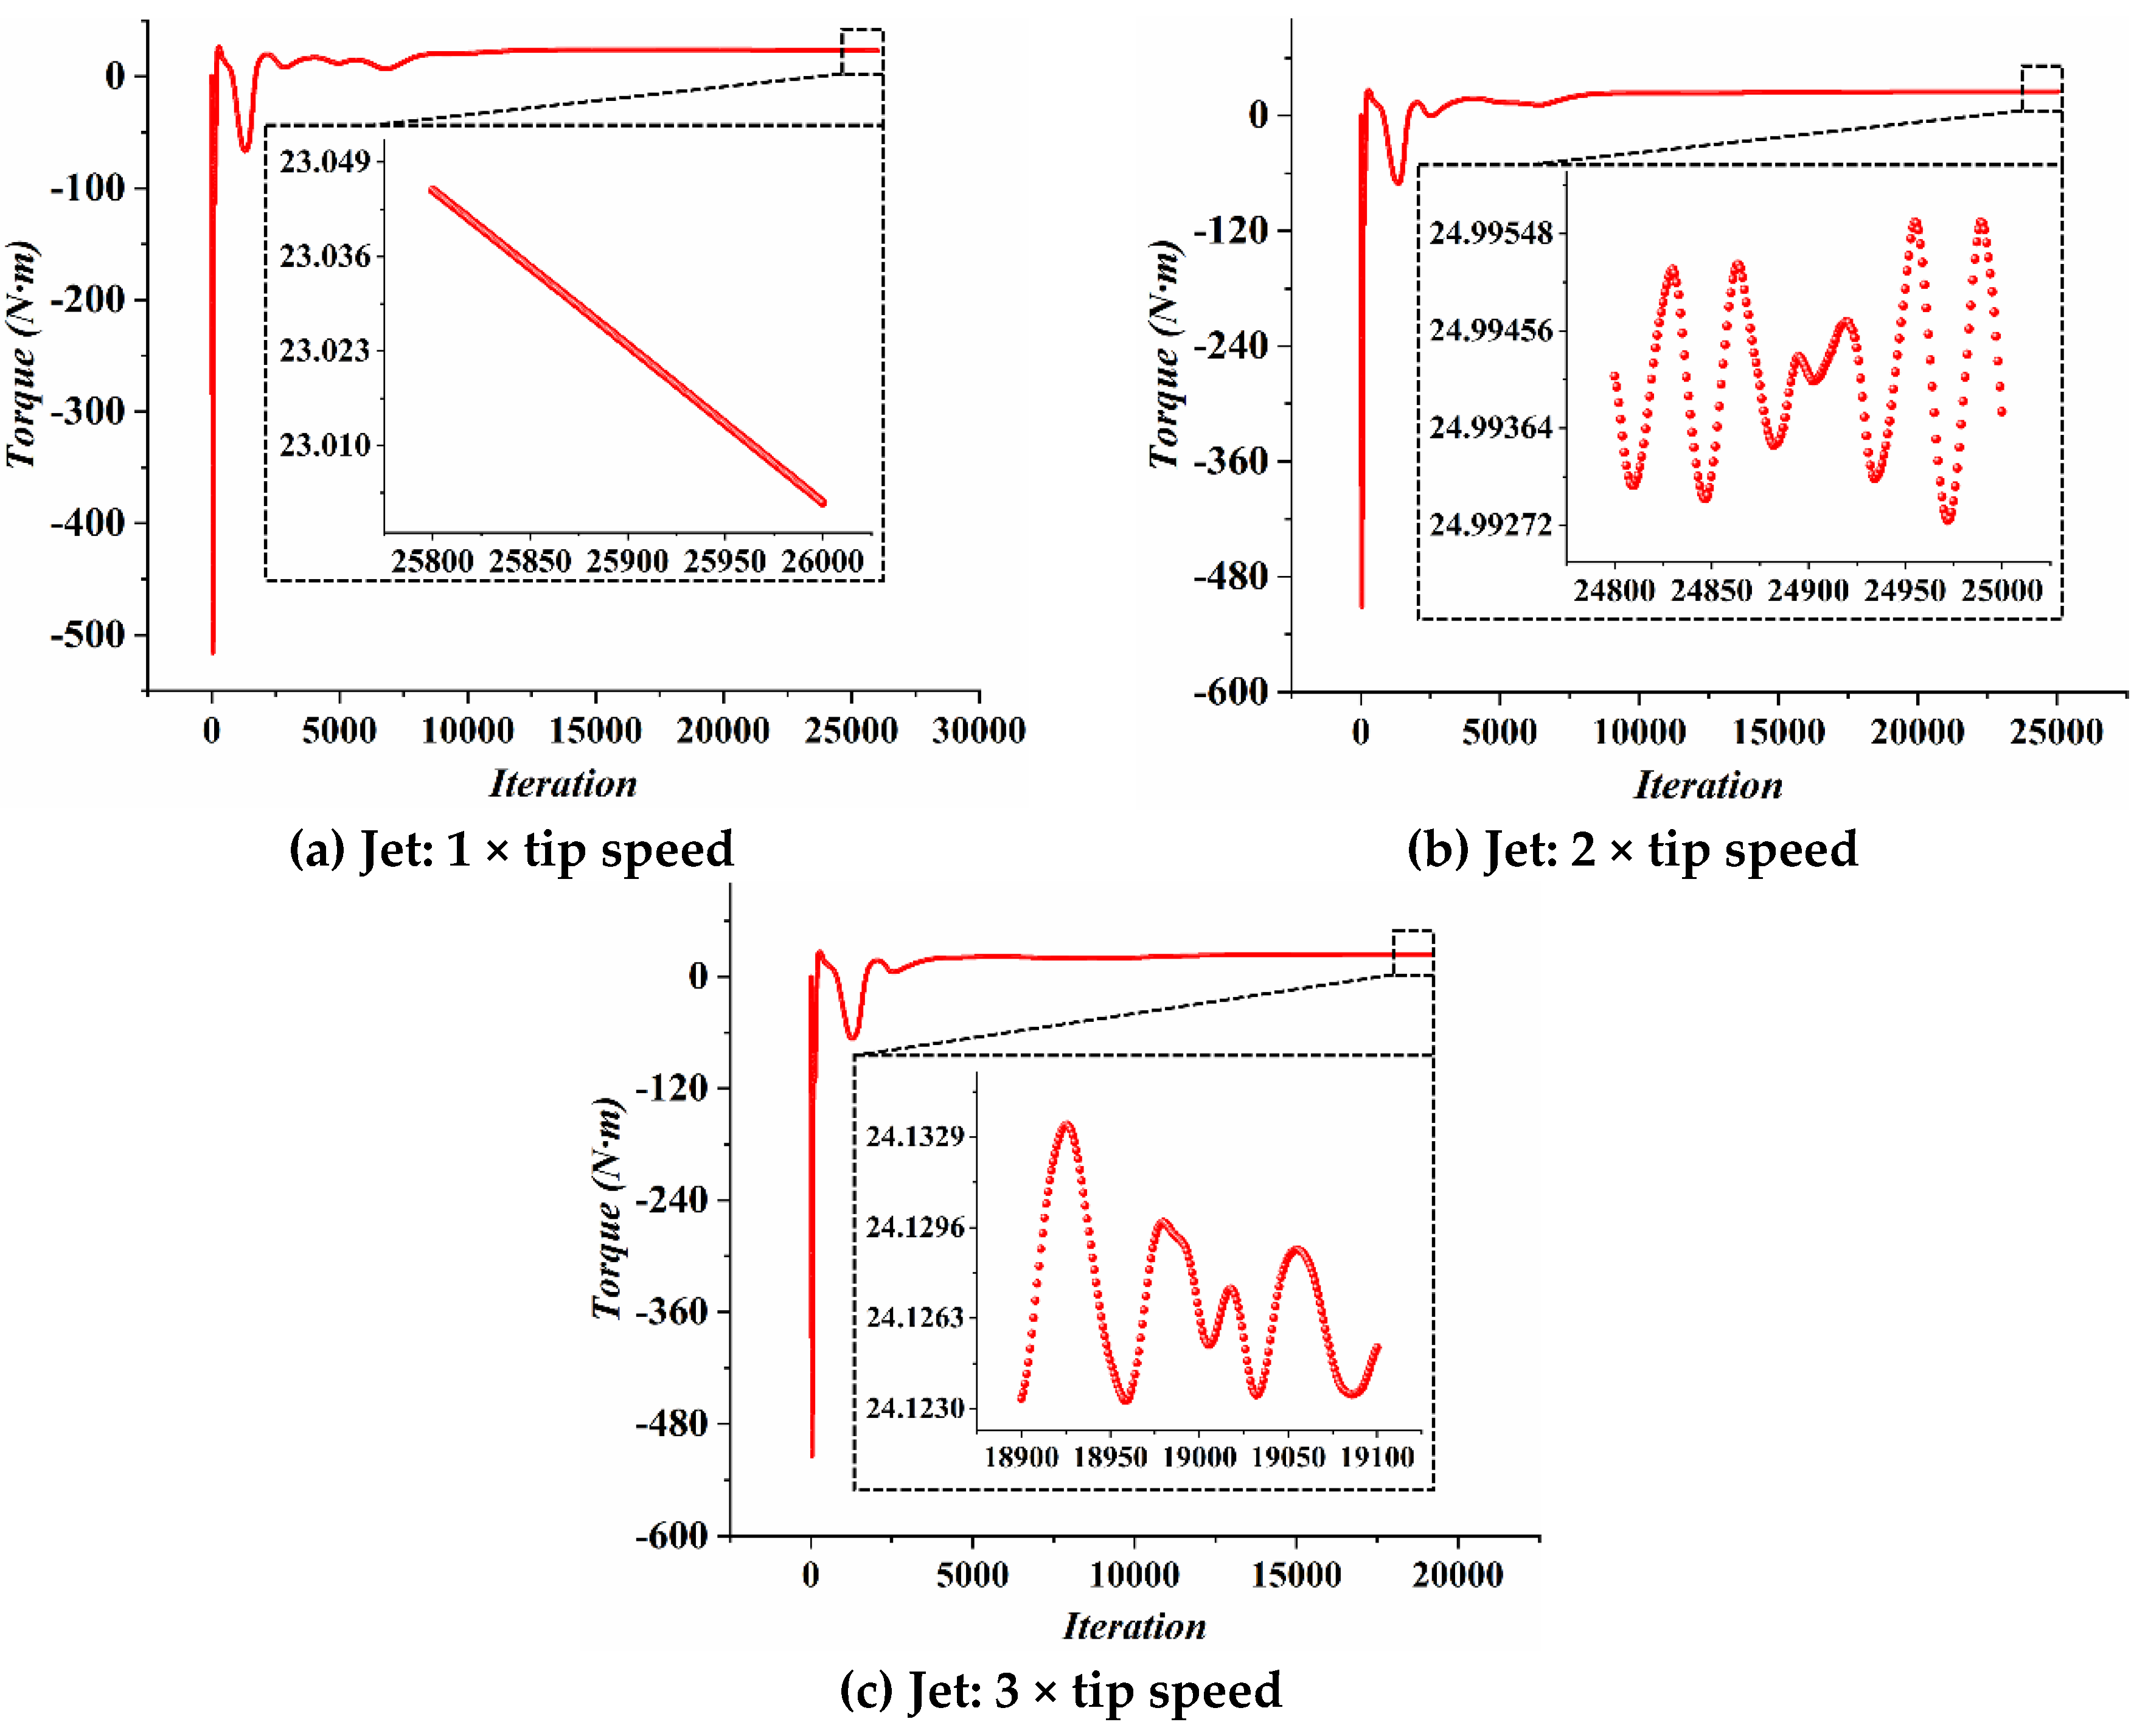
Figure 14.
Comparison of tip-vortex structures: (a) baseline, (b) 100 m/s jet, (c) 200 m/s jet, and (d) 300 m/s jet.
Figure 14.
Comparison of tip-vortex structures: (a) baseline, (b) 100 m/s jet, (c) 200 m/s jet, and (d) 300 m/s jet.
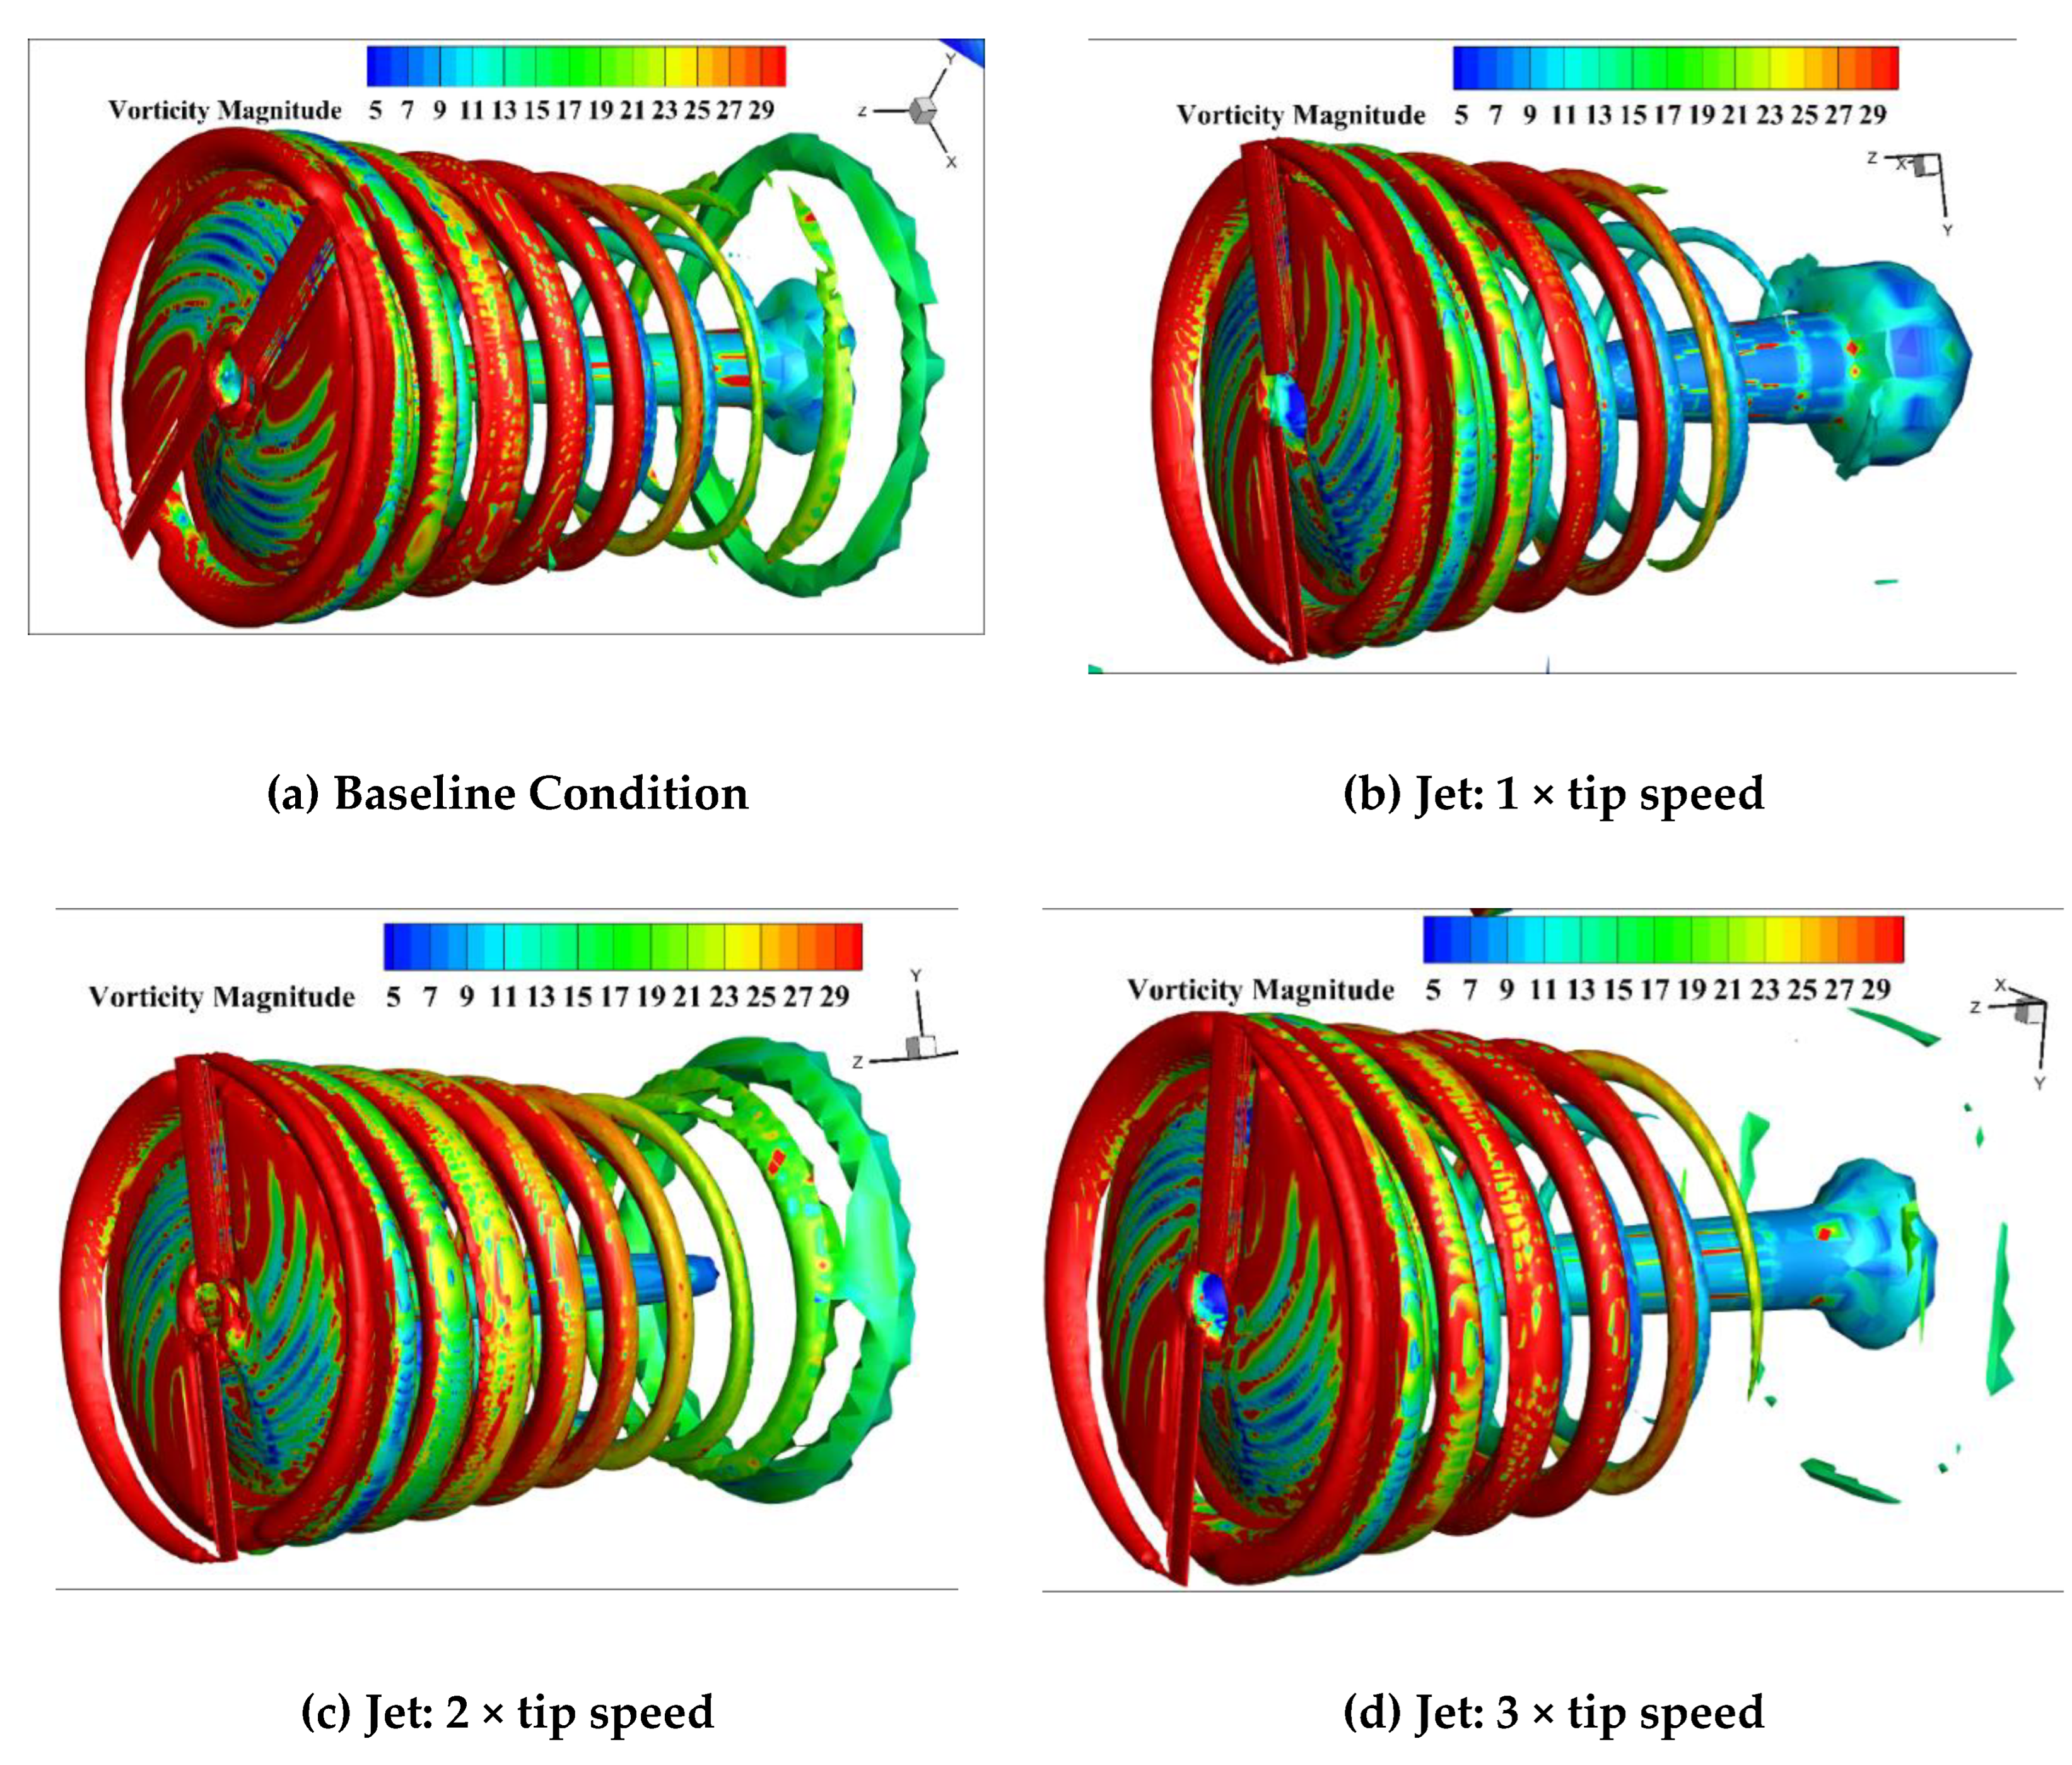
Figure 15.
Vorticity contours on the Y = 0 plane at (a,d) 100 m/s, (b,e) 200 m/s, and (c,f) 300 m/s.
Figure 15.
Vorticity contours on the Y = 0 plane at (a,d) 100 m/s, (b,e) 200 m/s, and (c,f) 300 m/s.
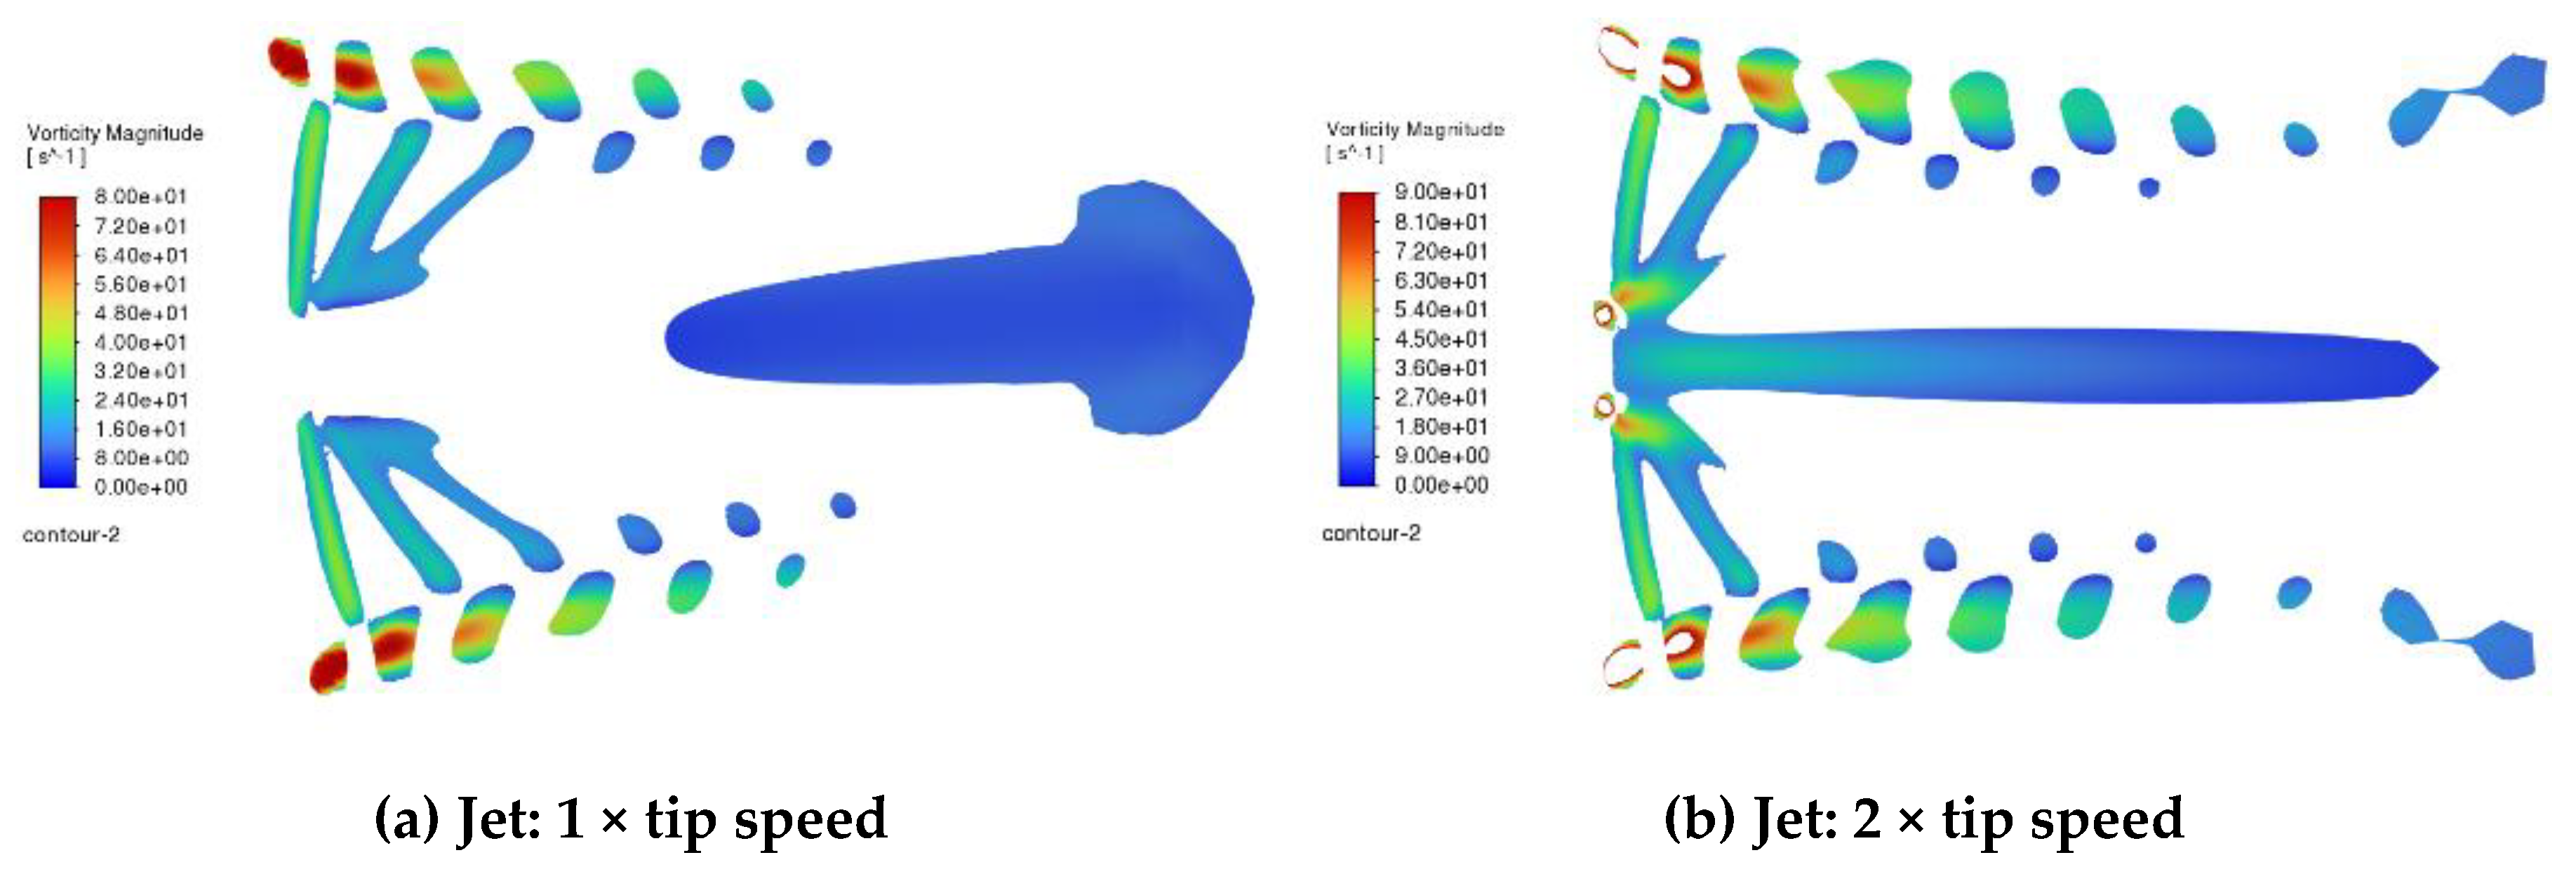
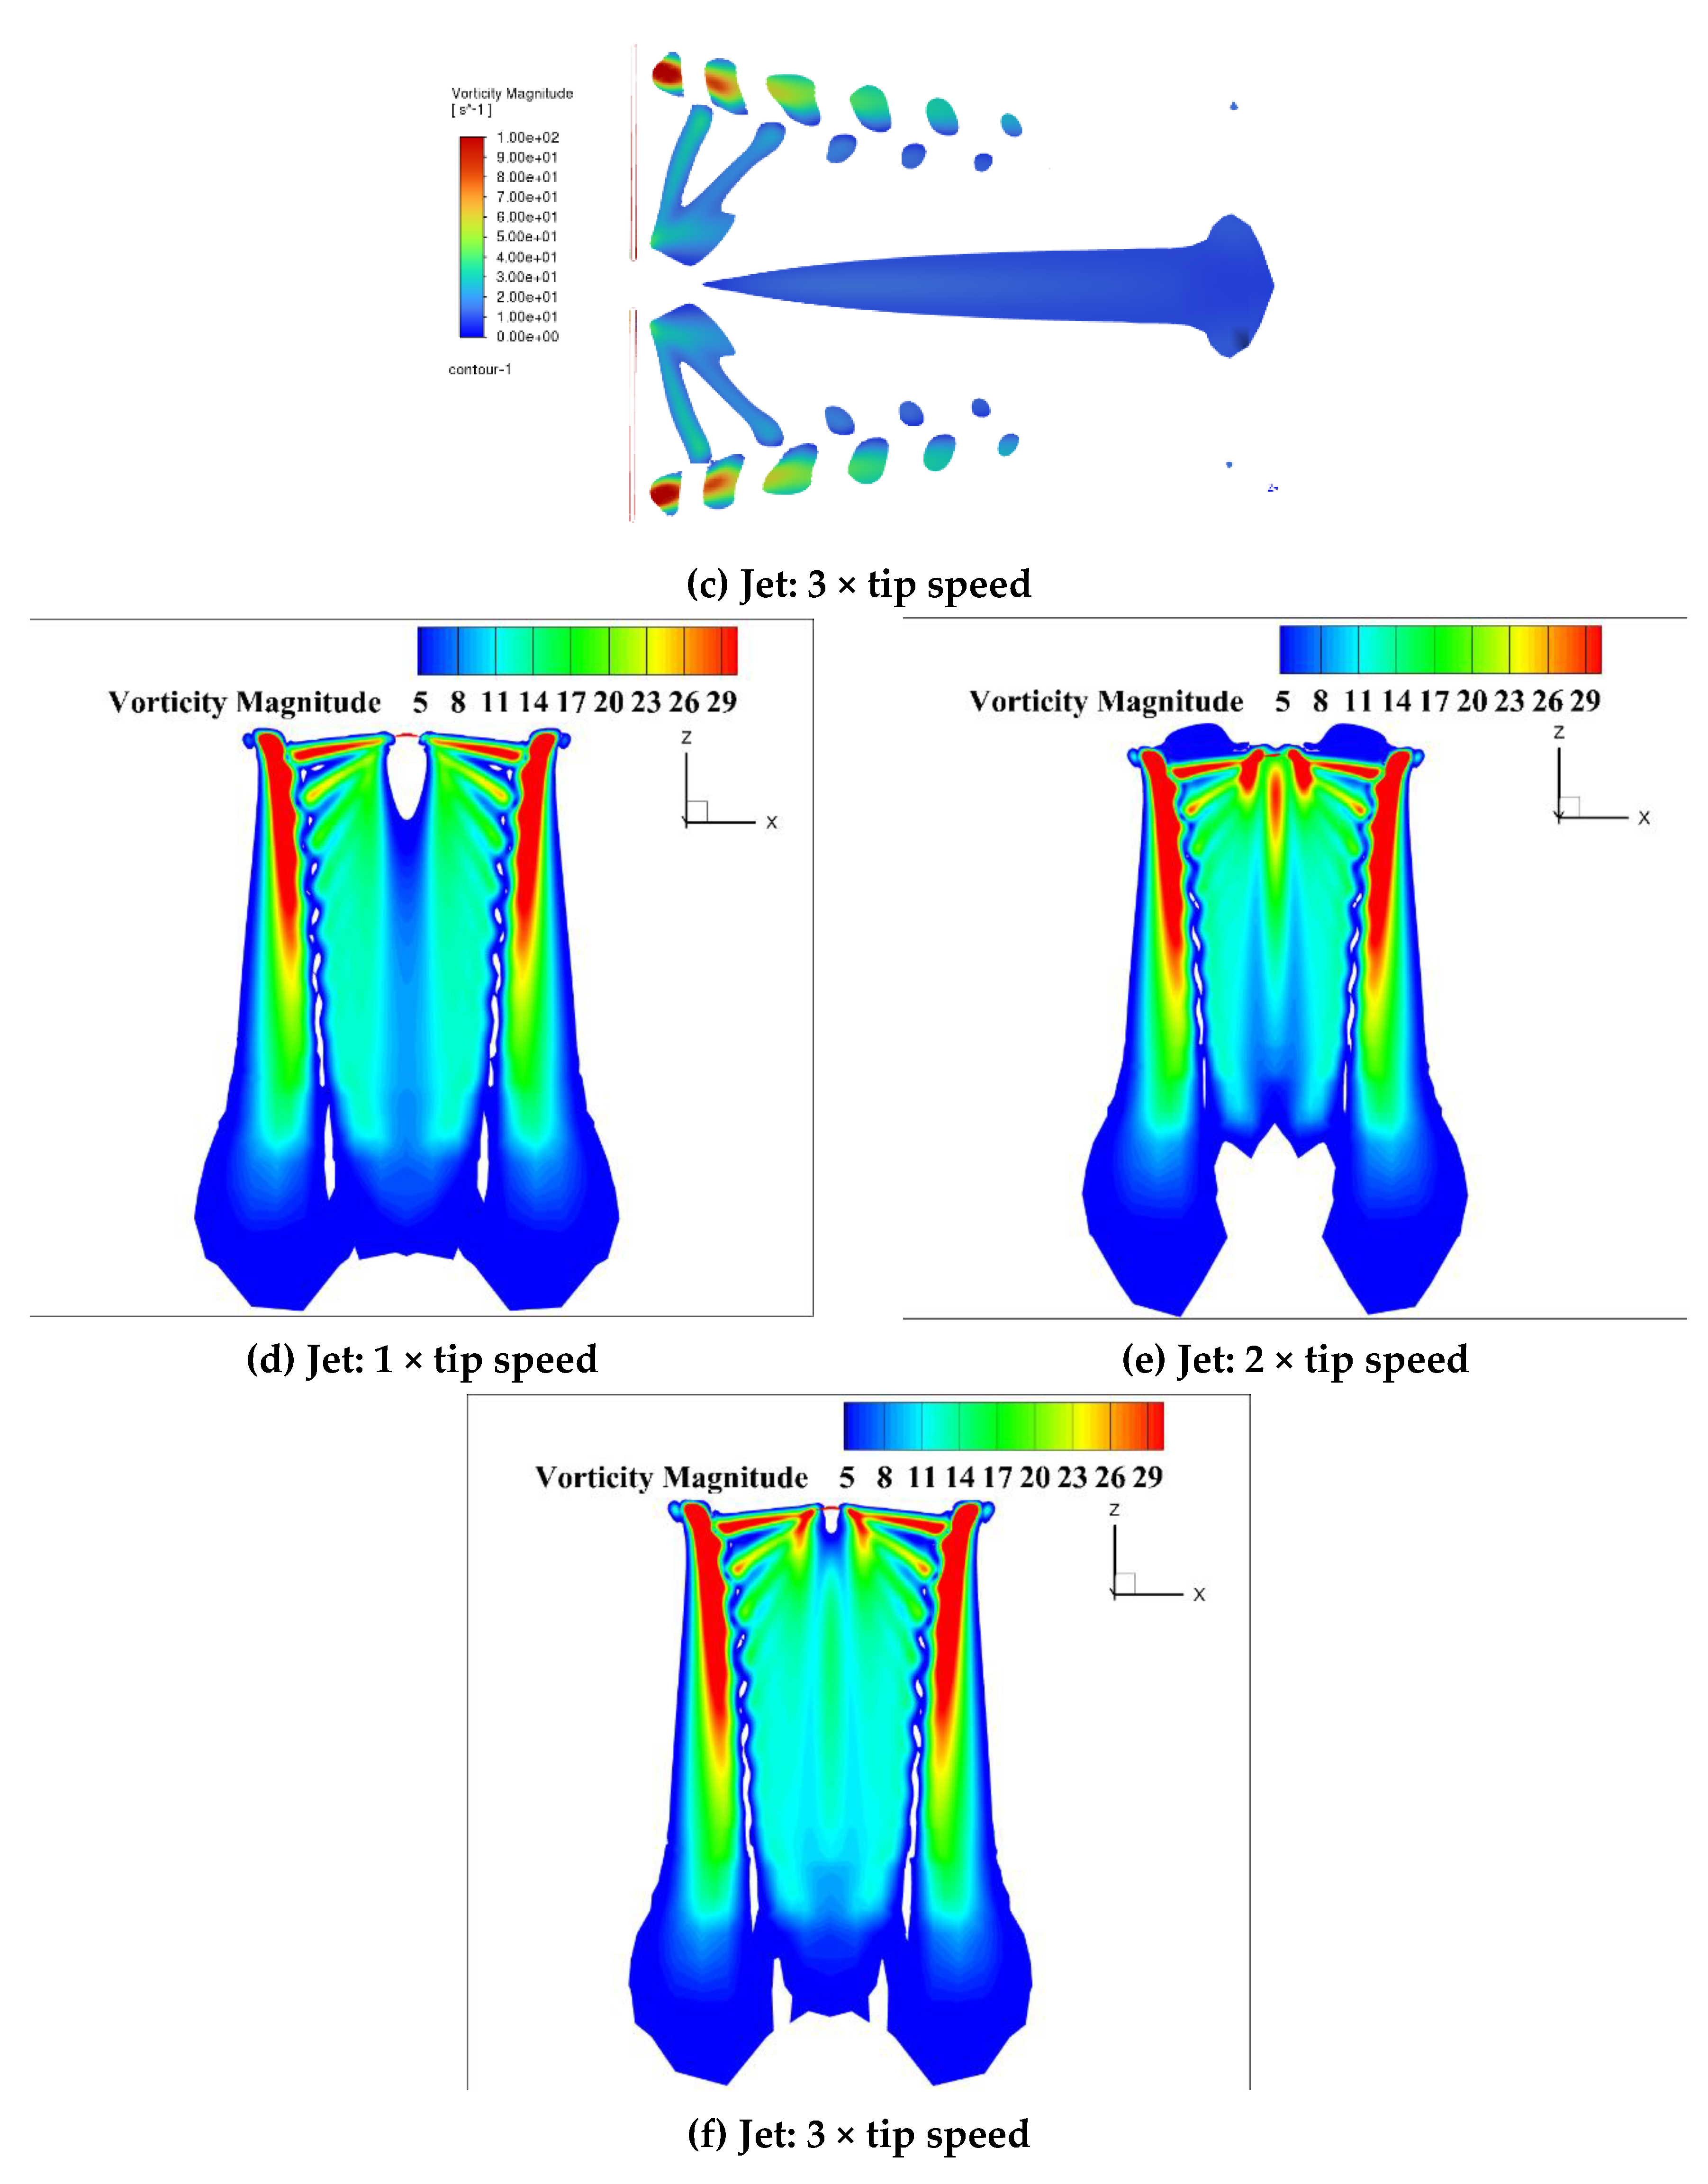
Figure 16.
Blade-tip jet-orifice configuration with doubled diameter (d = 1% c).
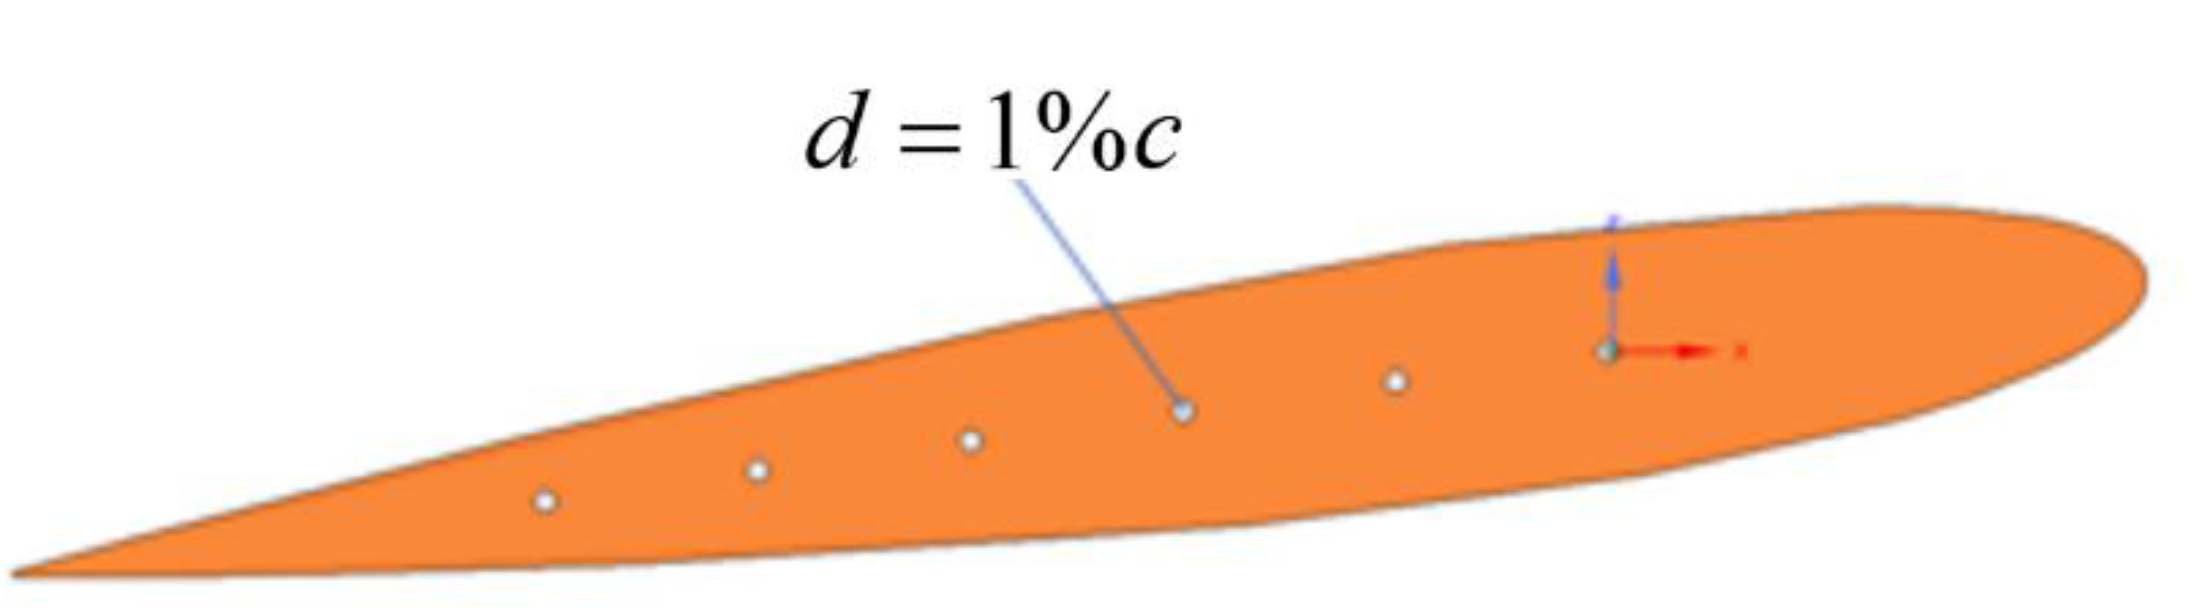
Figure 17.
Rotor performance with doubled jet-orifice diameter: (a) thrust and (b) torque.
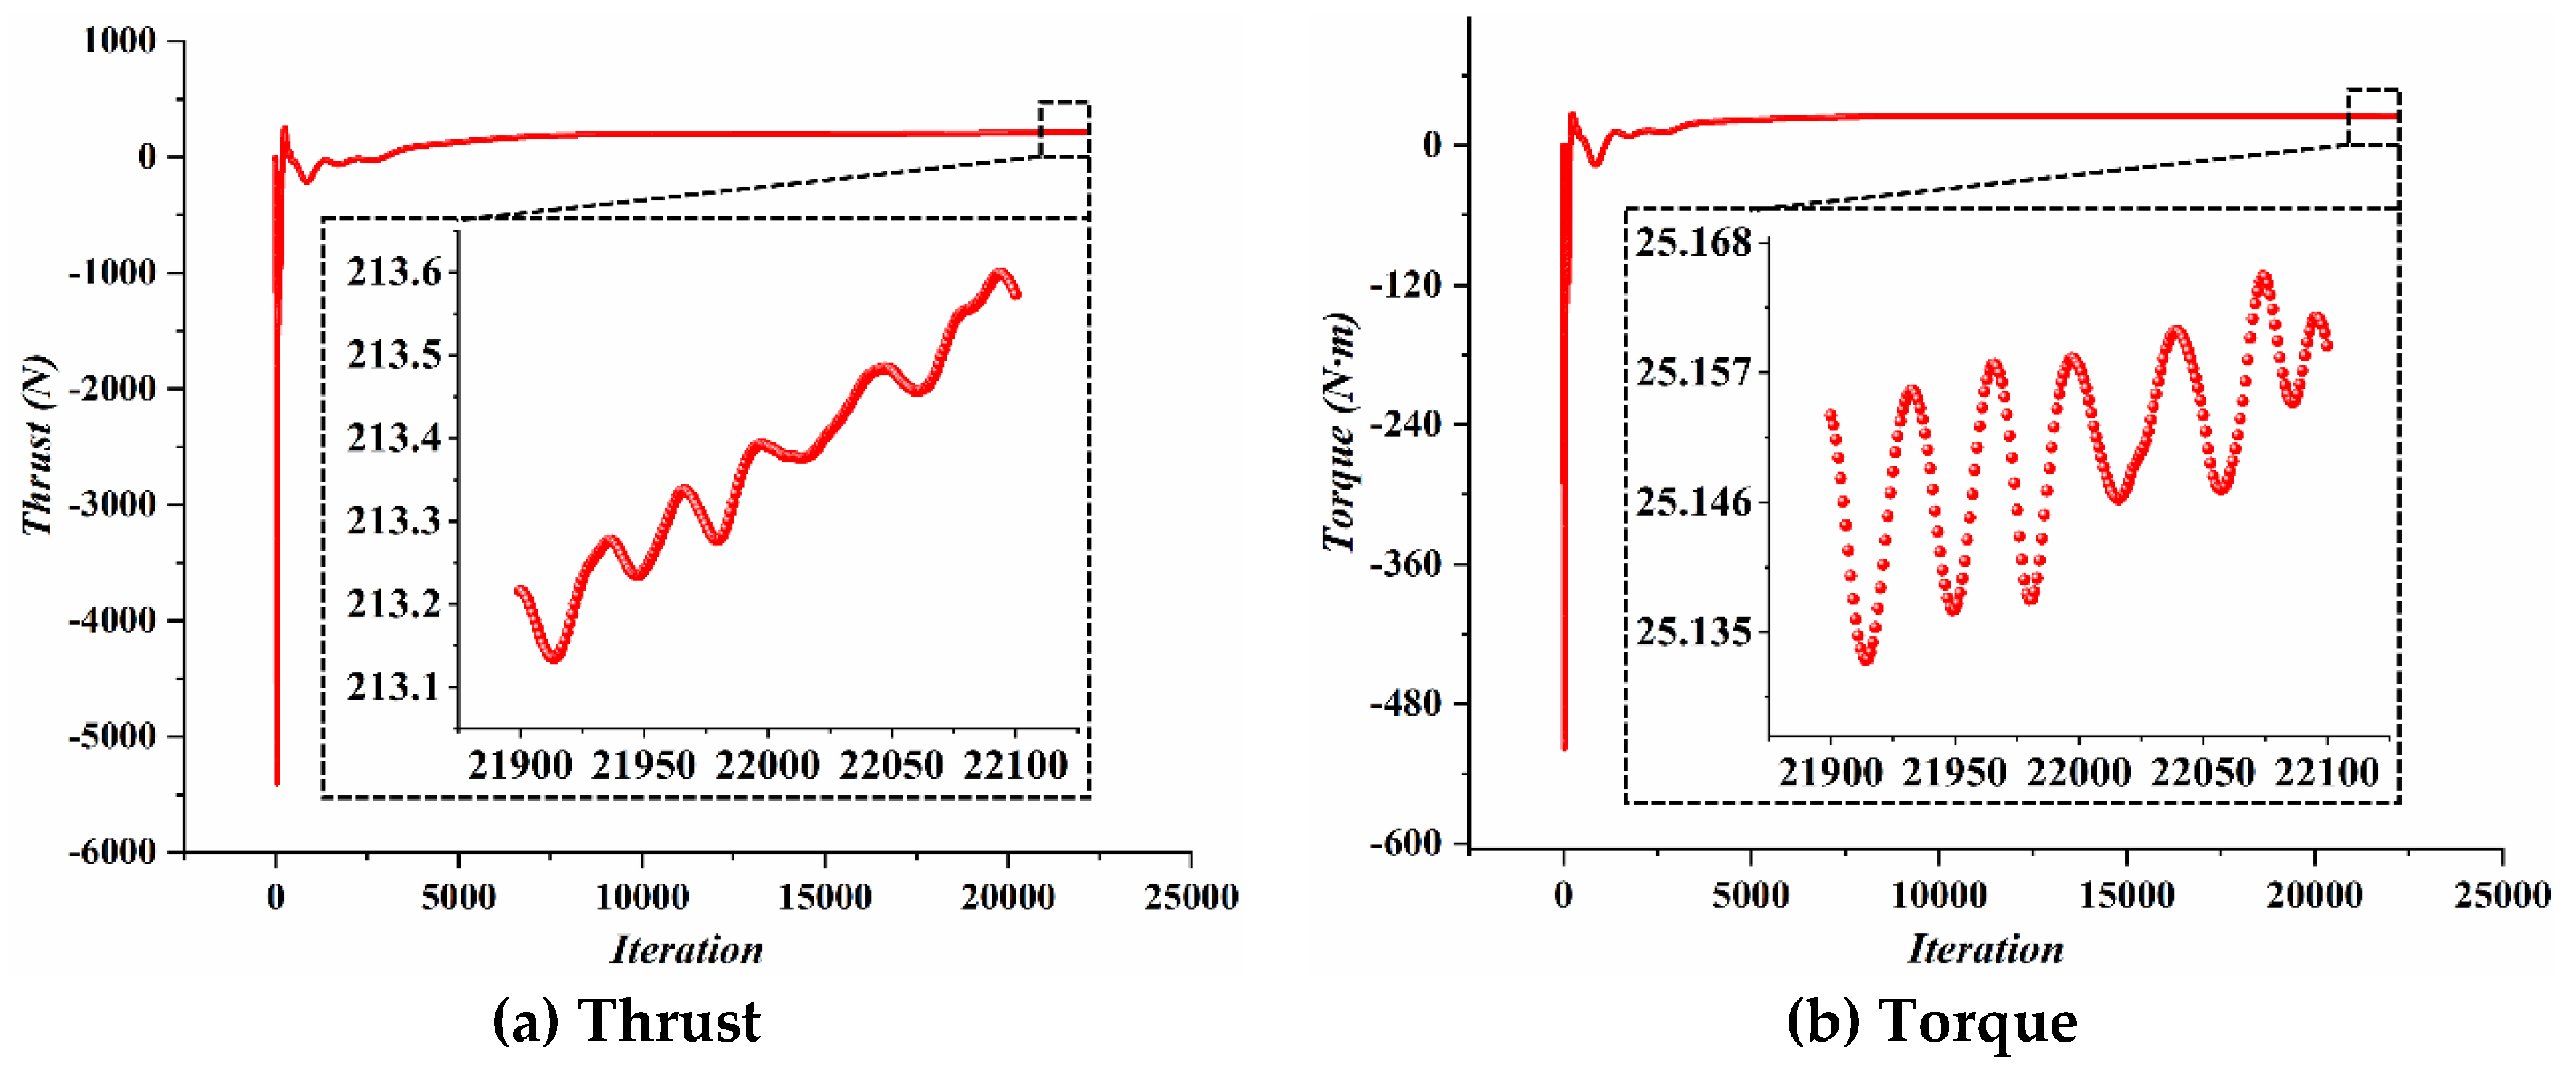

Table 1.
Geometric parameters of the Caradonna–Tung rotor.
| Collective pitch angleθ | 8° |
|---|---|
| Aspect ratioλ | 6 |
| Chord lengthc | 0.17 m |
| Rotor radiusR | 1.143 m |
Table 2.
Dimensions of the computational regions.
| Diameter | Upstream extent | Downstream extent | |
|---|---|---|---|
| Mesh-refinement region | 2.5R | 0.5R | 2.1R |
| Rotating region | 10R | 1.7R | 5.1R |
| Stationary region | 20R | 5R | 15R |
Table 3.
Residual levels for the validation calculation.
| Monitored variable | Residual |
|---|---|
| Continuity | 2.2 × 10⁻⁵ |
| x-velocity | 4.9 × 10⁻⁶ |
| y-velocity | 5.9 × 10⁻⁶ |
| z-velocity | 4.5 × 10⁻⁶ |
| energy | 2.5 × 10⁻⁸ |
| k | 2.1 × 10⁻⁴ |
| omega | 1.4 × 10⁻⁴ |
Table 4.
Residual levels for the baseline calculation.
| Monitored variable | Residual |
|---|---|
| continuity | 1.0×10⁻⁵ |
| x-velocity | 2.4×10⁻⁶ |
| y-velocity | 2.9×10⁻⁶ |
| z-velocity | 2.8×10⁻⁶ |
| energy | 1.7×10⁻⁹ |
| k | 1.3×10⁻⁴ |
| omega | 6.3×10⁻⁵ |
Table 5.
Changes in rotor thrust and torque with distributed blade-tip jet injection.
| Case | Thrust (N) | Thrust change (%) | Torque (N·m) | Torque change (%) |
|---|---|---|---|---|
| Baseline | 205.42 | - | 24.00 | - |
| Jet: 1 × tip speed | 184.04 | -10.41 | 23.00 | -4.17 |
| Jet: 2 × tip speed | 216.58 | 5.43 | 25.00 | 4.17 |
| Jet: 3 × tip speed | 206.73 | 0.64 | 24.13 | 0.54 |
Disclaimer/Publisher’s Note: The statements, opinions and data contained in all publications are solely those of the individual author(s) and contributor(s) and not of MDPI and/or the editor(s). MDPI and/or the editor(s) disclaim responsibility for any injury to people or property resulting from any ideas, methods, instructions or products referred to in the content. |
© 2026 by the authors. Licensee MDPI, Basel, Switzerland. This article is an open access article distributed under the terms and conditions of the Creative Commons Attribution (CC BY) license (http://creativecommons.org/licenses/by/4.0/).
Copyright: This open access article is published under a Creative Commons CC BY 4.0 license, which permit the free download, distribution, and reuse, provided that the author and preprint are cited in any reuse.