

Submitted:
19 October 2026
Posted:
20 October 2026
You are already at the latest version
Abstract
Some edible oils are produced by heterotrophic fermentation of Prototheca, a genus of non-photosynthetic green algae. Establishing the identity of production strains is important, particularly as species assignments have changed and culture collection labels may not reflect the original material. Two UTEX accessions have been used for oil production: UTEX 1435 historically and UTEX 1533 more recently. We compared UTEX 1533 with archival UTEX 1435 sequences, related deposits and six disease-associated (“clinical”) isolates using organellar markers, nuclear phylogeny, whole-genome identity and mitochondrial intron structure. UTEX 1533 matched historical UTEX 1435 at plastid 16S and 23S rRNA, the only available archival loci. UTEX 1533, ATCC 16525 (linked to historical UTEX 1435) and the P. wickerhamii type strain ATCC 16529 shared identical plastid 16S and 23S and mitochondrial cytb sequences. These accessions formed a fully supported nuclear group, with 95.82–98.04% whole-genome identity, versus 88.72–89.83% to the clinical isolates. Two mitochondrial introns shared by this group were absent from all six clinical isolates. Cultures supplied as UTEX 1435 in 2017 and 2026 instead matched P. xanthoriae. These findings identify UTEX 1533 as P. wickerhamii, conspecific with historical UTEX 1435, and suggest a change in material distributed under the UTEX 1435 designation.
Keywords:
Prototheca wickerhamii
; Prototheca moriformis
; UTEX 1533
; UTEX 1435
; culture provenance
; phylogenomics
; average nucleotide identity
1. Introduction
The genus Prototheca was established by Krüger in 1894 for two organisms isolated from tree slime flux, with the genus name proposed by Zopf [1]. The original descriptions distinguished P. zopfii and P. moriformis, organisms that lacked chlorophyll but reproduced in a Chlorella-like manner [1,2]. Initially considered fungi, Prototheca were subsequently recognized as non-photosynthetic green algae belonging to the Trebouxiophyceae that retain a reduced plastid [3,4]. In 1959, Tubaki and Soneda described P. wickerhamii from Wickerham’s isolate YB-4330, collected from a lavatory drain in Peoria, Illinois. Their description designated YB-4330 as the type and noted oil droplets within the cells [5].
For much of this history, species assignments within the genus relied on cell morphology and carbon-source utilization, although these characters did not consistently distinguish evolutionary lineages [2,4]. Ewing and coworkers [4] provided a molecular reference in 2014 by comparing plastid 16S and 23S ribosomal RNA (rRNA) gene sequences from 23 Prototheca strains. Their clade C included UTEX 1435 (hereafter “historical UTEX 1435”), then labeled P. moriformis, and ATCC 16529, the type strain of P. wickerhamii, along with other strains showing minor differences in their plastid ribosomal sequences. By contrast, SAG 263-11, also then labeled P. wickerhamii, occupied a separate clade. Subsequent mitochondrial cytochrome b (cytb) analysis and type-based taxonomic revision improved species discrimination and recognized SAG 263-11 as P. xanthoriae [3,6]. The same revision lecto- and epitypified P. moriformis and placed it in a cluster separate from P. wickerhamii [3]. Older sequence records and species names therefore require interpretation against authenticated reference cultures [7].
During the same period, oleaginous Prototheca strains were developed for edible-oil production by heterotrophic fermentation. The earlier industrial lineage originated from historical UTEX 1435 material clonally purified as S376. Generally Recognized as Safe (GRAS) notices submitted by Solazyme and TerraVia describe engineered derivatives of this lineage producing high-oleic algal oil, S2532 in GRN 000527 and S6697 in GRN 000754, and a stearic- and oleic-acid-rich structuring fat, S7737 in GRN 000673 [8,9,10]. The notices used the historical species designation P. moriformis and identified ATCC 16525 as another deposit associated with historical UTEX 1435 [8,9,10]. The U.S. Food and Drug Administration (FDA) responded to each notice that it had no questions [11,12,13].
Whereas historical UTEX 1435 and ATCC 16525 are recorded as deposits of an original isolate designated PR-9 (Section 2.1), a second accession, UTEX 1533, underlies the more recent oil-production studies. Both UTEX 1533 and the P. wickerhamii type strain ATCC 16529 are deposits of the isolate YB-4330. Parker and coworkers [14] used classical strain improvement of UTEX 1533 to produce oil containing >86% oleic acid. Zhou and coworkers [15] combined strain improvement with expression of a lysophosphatidic acid acyltransferase to produce a human milk fat analog enriched in sn-2 palmitate. More recently, Zhou and coworkers [16] developed a palmitoleic-acid-rich oil from the same accession. All three studies referred to UTEX 1533 as P. moriformis. That label was adopted because the plastid sequences of UTEX 1533 placed it in clade C of Ewing and coworkers [4], where four of the six strains, including UTEX 1435, were labeled P. moriformis. UTEX 1533, however, traces to YB-4330, the type isolate of P. wickerhamii [5,17], a species that cytb-based revision has since separated from P. moriformis [3].
These parallel uses make it necessary to establish how UTEX 1533 relates to historical UTEX 1435, a relationship that cannot be inferred from accession labels alone. Ewing and coworkers [4] supplied the early molecular basis for that comparison, but their panel included ATCC 16529 rather than UTEX 1533 itself and examined only two loci in the plastid genome. It did not directly establish genome-wide relatedness between the two UTEX accessions. Comparisons must also distinguish the material represented by archival UTEX 1435 sequences from cultures subsequently supplied under the same catalog designation.
Long-read sequencing and improved genome assembly, together with available nuclear and organellar reference genomes, now permit relationships to be examined beyond individual marker genes [17,18,19]. Here, we extend the framework of Ewing and coworkers [4] by integrating culture provenance, markers from the plastid, nucleus and mitochondrion, single-copy nuclear-gene phylogeny, whole-genome nucleotide identity and mitochondrial gene and intron structure. We compare UTEX 1533 with archival UTEX 1435 sequences and the reference deposits ATCC 16525 and ATCC 16529. Prototheca is widespread in the environment [20], with P. wickerhamii the species most often isolated in an aquatic survey [21]. P. wickerhamii is also among the species reported to cause protothecosis, a rare opportunistic human infection [20], so we included six clinical isolates in the analysis.
The objectives of the present study are to resolve the taxonomic relationship of the two oil-production accessions and characterize their genomic relationship to the clinical isolates examined.
2. Materials and Methods
2.1. Cultures, Provenance and Reference Sequences
UTEX 1533 was obtained from the Culture Collection of Algae at the University of Texas at Austin (UTEX) in 2017, confirmed to be axenic, and clonally isolated. The retained wild-type isolate, designated UTEX 1533 (2017), is the ancestor of the engineered production strain and was sequenced in 2025. A second UTEX 1533 culture was obtained independently from UTEX in 2026 and designated UTEX 1533 (2026) to confirm the identity of UTEX 1533 (2017). Both trace to YB-4330, the original isolate described as P. wickerhamii by Tubaki and Soneda [5]. ATCC 16529, another deposit of YB-4330, served as the P. wickerhamii type-strain comparator and was represented by its published genome [17]. ATCC 16525 (PR-9) was obtained and sequenced in 2026 as the provenance-linked comparator for historical UTEX 1435. Collection records identify ATCC 16525 and historical UTEX 1435 with PR-9 and record W. B. Cooke as depositor on 10 April 1966. PR-9 and YB-4330 are therefore recorded as different original isolates.
Historical UTEX 1435 denotes the material represented by the sequence records of Ewing and coworkers [4] and by the S376 production lineage. Its archival plastid records are KM396170 (16S) and KM396205 (23S). These archival records were distinguished from the UTEX 1435 (2017 culture) and UTEX 1435 (2026 culture), the cultures received under that accession in 2017 and 2026. They were evaluated separately (Section 3.1) and were not used as genomic proxies for historical UTEX 1435. No historical UTEX 1435 nuclear genome, cytb sequence or 18S sequence was available. ATCC 16525 therefore served as the provenance-linked comparator for those analyses.
The panel comprised six clinical isolates: ATCC 30395, HMC1, UVCC 0001, InPu-22_FZ, PW26 and PWS1. These isolates had accessible genome data and a clinical source documented in a publication or repository record. The panel was assembled from genomes identified at the time of analysis. Other public genomes of clinical isolates exist and were not evaluated, so the panel is not exhaustive. Published genomes were used where available [19,22]. ATCC 30395 was assembled from public reads SRR32946134. Clinical provenance was taken from the associated publications and repository records [23]. The comparison therefore comprised ten genomes: four from the production-lineage reference group, comprising UTEX 1533 (2017), UTEX 1533 (2026), ATCC 16525 and ATCC 16529, and six clinical isolates. This group designation refers to the wild-type and reference cultures, not to engineered production strains. Assembly statistics and provenance are provided in Table S1 and Table S2.
2.2. Genome Assembly and Phylogenetic Analysis
UTEX 1533 (2017), UTEX 1533 (2026), ATCC 16525 and UTEX 1435 (2026 culture) were sequenced with Oxford Nanopore technology (Angstrom Innovation, Berkeley, CA, USA), assembled with Flye [24] and polished with Medaka [25]. Duplicate contigs were removed with purge_dups [26] from both UTEX 1533 assemblies and UTEX 1435 (2026 culture). The UTEX 1533 (2026) and UTEX 1435 (2026 culture) assemblies were scaffolded with RagTag [27]. The UTEX 1435 (2017 culture) genome was assembled from PacBio and Illumina reads using FALCON, PBJelly and Illumina-based correction [28,29]. ATCC 30395 reads were trimmed with fastp [30], assembled de novo with SPAdes [31] and processed with purge_dups. Completeness was assessed in genome mode with Benchmarking Universal Single-Copy Orthologs (BUSCO) v6.1.0 and chlorophyta_odb12, containing 1,523 reference genes [32].
Plastid 16S and 23S rRNA, mitochondrial cytb and nuclear 18S rRNA sequences were recovered by BLASTN or from annotated GenBank records [33]. Alignments were generated with MAFFT and trimmed with trimAl [34,35]. Maximum-likelihood trees were inferred with IQ-TREE 3 and ModelFinder-selected models [36,37], with 1,000 Shimodaira-Hasegawa-like approximate likelihood ratio test (SH-aLRT) and 1,000 ultrafast bootstrap replicates [38,39]. The plastid 23S tree used a fixed GTR+G4 model, because ModelFinder and the other fixed models tested gave no support within the cluster of near-identical sequences. The 30-sequence 18S alignment was trimmed to 1,711 positions, mainly by removing introns. Identities excluded columns containing a gap in either sequence. ATCC 16529 was represented by the cloned 18S record MF163504 [3]. UTEX 1533 (2026) was represented in the tree by the class A sequence from the UTEX 1533 (2017) assembly (Supplementary methods S2). Identities of the UTEX 1435 cultures to P. xanthoriae reference records were calculated from pairwise BLASTN alignments, also excluding gap columns (Table S3).
Nuclear supermatrices retained complete single-copy BUSCO orthologs present in every genome and were analyzed with one partition per gene: 115 genes and 136,406 positions across 17 taxa, and 253 genes and 302,454 positions across 14 taxa after omitting HMC1, ATCC 30395 and UVCC 0001, the three clinical assemblies with the lowest BUSCO completeness (66.7%, 68.9% and 74.7%; Table S1). P. bovis and P. ciferrii were represented by PacBio assemblies of the non-type isolates SH08 and SH13 [40], which are less fragmented than the type-strain assemblies [41]. The gene set was divided once at random into two halves, each analyzed separately, and relationships not consistently recovered across the halves are shown with dashed branches.
2.3. Genome Identity and Mitochondrial Structure
Whole-genome average nucleotide identity was calculated with OrthoANI, implemented in pyorthoani, using corresponding 1,020-bp fragments of the nuclear assemblies [42]. All pairwise values were summarized within and between the two groups. Comparisons excluding the fragmented HMC1 and ATCC 30395 assemblies were examined separately. Mitochondrial gene content and order were compared after annotation transfer from the ATCC 16529 mitochondrial genome [7]. Type-strain mitochondrial genomes of other species were taken from Wibberg and coworkers [18]. The presence or absence of two introns in the mitochondrial large subunit rRNA gene (rnl) was checked against mitochondrial and complete assemblies and against unassembled ATCC 30395 reads (Supplementary methods S3). Additional procedures are given in the Supplementary methods. Software versions and parameters are listed in Table S4.
3. Results
3.1. Historical UTEX 1435 and Marker-Sequence Identity
UTEX 1533 (2017) matched the historical UTEX 1435 plastid 16S and 23S rRNA gene records over their complete available lengths, 1,388 and 531 bp, respectively, without substitutions, insertions or deletions. ATCC 16525 had the same plastid 16S and 23S sequences. UTEX 1533 (2017), ATCC 16525 and the P. wickerhamii type strain ATCC 16529 were also identical at mitochondrial cytb. Nuclear 18S rRNA genes occur in multiple, non-identical copies, so 18S identities reflect copy sampling as well as strain divergence and are treated here as corroborative (Supplementary methods S2). At nuclear 18S, UTEX 1533 (2017) matched ATCC 16525 but differed from the cloned ATCC 16529 record MF163504 at 22 of 1,708 compared positions (98.71%; Table 1). Both plastid trees placed the archival record, both UTEX 1533 cultures and the ATCC comparators together, apart from SAG 263-11 (Figure 1; Figure S1).
Historical UTEX 1435 is represented by KM396170 (plastid 16S, 1,388 bp) and KM396205 (plastid 23S, 531 bp). ATCC 16529 is represented by KM396174 (16S), KM396182 (23S), and the cloned nuclear 18S sequence MF163504. Organellar identities were calculated over the available sequence lengths. Nuclear 18S identities used a trimmed alignment of 1,711 positions across 30 sequences. All identities exclude alignment columns containing gaps in either sequence. Nuclear 18S rRNA genes occur in multiple, non-identical copies. Genome assemblies report a consensus sequence, whereas a cloned PCR product represents a single copy, so 18S identity may reflect copy sampling as well as divergence between strains. Raw reads from both UTEX 1533 cultures contain the same two 18S sequence classes (Supplementary methods S2). The UTEX 1533 (2017) assembly retained class A, whereas the UTEX 1533 (2026) assembly retained class B and one chimeric copy, accounting for its 97.37% identity. The ATCC 16529 clone differed at 22 of 1,708 compared positions, and the UTEX 1533 (2026) assembly at 45 of 1,710 positions. *Identity was calculated from majority-base calls, excluding four positions in class A where neither nucleotide was clearly predominant. ND, no historical sequence available; –, not applicable. The UTEX 1435 (2017 culture) and UTEX 1435 (2026 culture) are not the historical comparator (Section 3.1).
The UTEX 1435 (2026 culture) was identical to the P. xanthoriae type strain SAG 263-11 at plastid 16S and 23S and cytb, and 100.00% identical across the plastid and mitochondrial genomes (Table S3). Its nuclear 18S, ITS and partial LSU sequences were 99.58–99.94% identical to P. xanthoriae records. The UTEX 1435 (2017 culture) assembly recovered only 16% of the plastid and 13% of the mitochondrial genome, and these fragments were 99.80% and 99.74% identical to SAG 263-11. The UTEX 1435 (2026 culture) shared 73.5% OrthoANI with UTEX 1533 (2017), far below identity within the production-lineage reference group and below the 79.2% shared by P. bovis SH08 and P. ciferrii SH13 [40]. Neither culture was therefore used as a genomic proxy for historical UTEX 1435. The historical comparison remained direct at the two archival plastid loci and provenance-linked through ATCC 16525 at the other loci and whole-genome level.
3.2. Multicopy 18S Variation in the Two UTEX 1533 Cultures
The two UTEX 1533 acquisitions, obtained nine years apart, were identical at 16S, 23S and cytb. Their assembled 18S sequences differed at 45 of 1,710 compared positions on the trimmed alignment (97.37% identity). Raw reads nevertheless contained the same two 18S sequence classes, A and B, in about a 54:46 ratio (Supplementary methods S2). The UTEX 1533 (2017) assembly retained class A, whereas the UTEX 1533 (2026) assembly retained class B and one chimeric copy. The apparent difference between cultures therefore likely reflects which 18S copies each assembly retained.
Using class A for UTEX 1533 (2026), the 18S tree recovered the four production-lineage sequences together at 99.4% SH-aLRT and 99% ultrafast bootstrap support (Figure S3). The 30-sequence, 1,711-position trimmed alignment contained 508 parsimony-informative positions. The 22-position difference from the cloned ATCC 16529 sequence was smaller than the 45-position difference between assemblies of the two UTEX 1533 cultures.
3.3. Assembly Characteristics of the Comparison Panel
The four production-lineage assemblies ranged from 16.51 to 20.18 Mb, with 17–187 contigs, contig N50 values of 169 kb to 1.58 Mb and BUSCO completeness of 71.1–79.9% (Table S1). PW26 and PWS1 had 17 and 14 contigs, respectively, and N50 values of 1.64 Mb, with 80.2% and 79.2% BUSCO completeness. Completeness near 80% therefore does not by itself indicate an incomplete assembly. HMC1 and ATCC 30395 contained 3,774 and 3,398 contigs, with N50 values of 31 and 11 kb and completeness of 68.9% and 66.7%. HMC1 had a 27.7-Mb assembly with 22.8% duplicated BUSCO genes. These two assemblies were evaluated separately in OrthoANI sensitivity analyses. The reduced nuclear analysis also omitted UVCC 0001 (74.7% complete). UTEX 1533 (2017) was 16.68 Mb in 35 contigs, versus 20.18 Mb in 187 contigs for UTEX 1533 (2026), and ATCC 16525 was 16.51 Mb in 17 contigs. The non-type P. bovis SH08 and P. ciferrii SH13 nuclear assemblies contained 53 and 96 contigs, respectively. The UTEX 1435 (2017 culture) and UTEX 1435 (2026 culture) assemblies contained 21,972 and 148 contigs, respectively, with 57.5% and 77.5% complete BUSCO genes. Their exclusion as historical comparators was based on marker identity, not assembly quality.
3.4. Nuclear Phylogeny and Whole-Genome Identity
All six pairwise comparisons among the four production-lineage genomes fell between 95.82% and 98.04% OrthoANI, with a mean of 96.66%. All 15 clinical-isolate comparisons fell between 96.99% and 98.43%, with a mean of 97.57%. In contrast, the 24 between-group comparisons ranged from 88.72% to 89.83%, with a mean of 89.50% (Table 2; Figure 2; Figure S4). No value occurred between 89.83% and 95.82%, leaving a 5.99-percentage-point interval separating the within-group and between-group ranges.
The production-lineage genomes are UTEX 1533 (2017), UTEX 1533 (2026), ATCC 16525 and ATCC 16529. The six clinical isolates are ATCC 30395, HMC1, UVCC 0001, InPu-22_FZ, PW26 and PWS1. Pair counts are the numbers of unique comparisons implied by the specified group sizes, and the HMC1-excluded row is a sensitivity subset, not an additional primary group. Ranges and means are those reported for the all-by-all OrthoANI matrix. No comparison fell between 89.83% and 95.82%.
HMC1 accounts for all the highest within-clinical values (98.01–98.43%). Because this short-read assembly is fragmented and contains 22.8% duplicated BUSCO genes (Section 3.3), its effect was examined separately. Without HMC1, the clinical isolates shared 96.99–97.46% (mean 97.25%). The between-group range of 88.72–89.83% was unchanged, whether HMC1 was excluded alone or together with ATCC 30395. ATCC 16529 gave the lowest within-group values (95.82–96.32%), although it derives from the same recorded isolate as UTEX 1533 (Section 4.3).
The 115-gene nuclear supermatrix, comprising 136,406 positions across 17 taxa, recovered the four production-lineage genomes and the six clinical isolates as separate clades, each with 100% SH-aLRT and ultrafast bootstrap support (Figure 3a). Omitting HMC1, ATCC 30395 and UVCC 0001 increased the retained dataset to 253 genes and 302,454 positions across 14 taxa. The four production-lineage genomes and the three remaining clinical isolates, InPu-22_FZ, PWS1 and PW26, again formed separate clades at 100% by both measures (Figure 3b). The two UTEX 1533 cultures paired at 100% in both analyses. Increasing the shared gene set therefore did not change the separation of the two groups. Branching orders not consistently recovered across the two random gene halves are shown as dashed branches and do not affect these supported groupings.
3.5. Mitochondrial Structure and Sequence Validation
Mitochondrial gene order was conserved across the ten genomes. The four production-lineage genomes had three rnl introns containing orf148, orf210 and orf236, whereas all six clinical isolates had only the orf236 intron (Figure 4). The two additional introns measured 1,073 and 1,021 bp in UTEX 1533 (2017). Both were recovered at full length and 100% identity in all four lineage genomes, but neither returned a full or partial match in any clinical mitochondrial or complete genome assembly.
A 620-bp query sequence joining the rnl sequence across both intron-free positions, including the intervening 20-bp coding segment, aligned continuously at 99.8% identity in all six clinical isolates. The matches lay at least 1.7 kb from the ends of single-contig mitochondrial assemblies measuring 52.1–52.4 kb, compared with approximately 53.9 kb in UTEX 1533 (2017).
Unassembled ATCC 30395 reads provided 321 and 385 exact 30-base matches across the two intron-free junctions and 694 matches to an rnl control sequence. No read contained the interior of either intron or an intron-exon junction. Raw reads from the other five clinical isolates were not examined.
4. Discussion
4.1. Taxonomic Relationship and Accession-Associated Material
The combined evidence places UTEX 1533 and historical UTEX 1435 in the same species, although they derive from different recorded isolates. Archival plastid sequences provide the direct historical comparison. ATCC 16525 connects those sequences to a separately maintained PR-9 deposit, and the nuclear and mitochondrial data place that comparator with UTEX 1533 and ATCC 16529. The association with the P. wickerhamii type strain supplies the nomenclatural anchor [3,5,17]. UTEX 1533 is therefore conspecific with the UTEX 1435 analyzed by Ewing and coworkers [4].
The UTEX 1435 (2017 culture) and UTEX 1435 (2026 culture) represent a different organism distributed under the same catalog number. Their marker identities to SAG 263-11 are consistent with P. xanthoriae as circumscribed by Jagielski and coworkers [3], not with historical UTEX 1435. An apparent change in accession-associated material is the explanation most consistent with the data. Labeling error or cross-contamination could account for it, but the records do not establish the mechanism, timing or point of occurrence.
4.2. Complementary Resolution of Marker and Genome Analyses
The marker results show both the value and the limits of the early plastid framework. Identity at the historical loci connects the present analysis to Ewing and coworkers [4], but high identities among the clinical and production-lineage genomes show why conserved markers alone provide limited resolution within this panel. Mitochondrial cytb is the marker used to delimit Prototheca species [3,6]. The 99.74% cytb identity between the two groups exceeds the 98.8% minimum that Jagielski and coworkers observed among P. wickerhamii strains [3]. Both groups therefore belong to P. wickerhamii, and the genomic separation described below lies within the species.
The 18S results show the effect of sampling a multicopy gene. MF163504 represents one cloned ATCC 16529 copy, whereas the UTEX assemblies reduce multiple copies to one sequence. Its 22-position difference from UTEX 1533 (2017) is smaller than the 45-position difference between assemblies of two cultures with the same sequence classes. The type-strain difference is therefore compatible with copy sampling and does not indicate a separate lineage. Representing UTEX 1533 (2026) by shared class A recovers the four-culture group at 99% bootstrap support. Jagielski and coworkers likewise found cloned 18S sequences from a single P. wickerhamii strain differing at up to 71 positions [6].
4.3. Genomic Separation and Mitochondrial Corroboration
The separation of the two groups is supported by nuclear, whole-genome and mitochondrial evidence. Removing HMC1 and ATCC 30395 leaves the between-group OrthoANI range unchanged. Separately, removing those assemblies and UVCC 0001 increases the nuclear dataset from 115 to 253 genes while retaining full support for both groups. Assembly fragmentation therefore limits the shared gene set without accounting for the observed separation. ATCC 16529 shares only 95.82% OrthoANI with UTEX 1533 (2017), although both derive from YB-4330, whereas ATCC 16525, recorded as a different isolate, shares 96.91%. This pattern is consistent with an assembly effect. UTEX 1533 (2017) is diploid (Figure S5), as expected from the heterozygosity reported for other P. wickerhamii genomes [43] and the vegetative diploidy of the related genus Auxenochlorella [44]. Each assembly reduces both haplotypes to one consensus, choosing between them region by region. ATCC 16529 was assembled from PacBio and Illumina reads and the other three production-lineage genomes from Nanopore reads, so their consensus choices need not agree. ATCC 16529 is also about 1 percentage point lower than the other three against every genome, including the clinical isolates (88.72–88.89% versus 89.61–89.83%; Figure S4), an offset that cannot reflect relatedness to UTEX 1533. Even the two UTEX 1533 assemblies, obtained nine years apart, share only 98.04%. In Auxenochlorella, likely sister cultures maintained at UTEX and CCAP also differ by loss of heterozygosity that arose during laboratory culture [44]. Fine-scale OrthoANI differences within either group therefore do not measure divergence between isolates. No whole-genome identity threshold for species has been established in Prototheca. For scale, P. bovis SH08 and P. ciferrii SH13, the most similar pair of named species in this dataset, share 79.2%, well below the 88.72–89.83% between the two P. wickerhamii groups.
The rnl intron pattern supplies a structural character independent of marker-sequence identity. Continuous intron-free junctions in all six clinical assemblies and supporting raw reads for ATCC 30395 strengthen the interpretation beyond annotation alone. However, introns with homing-endonuclease open reading frames occur throughout Prototheca mitochondria [18], and orf148 homologs also occur in the other species shown in Figure 4. The pattern is therefore a lineage-associated character in this panel, not evidence that the introns determine pathogenicity.
Jian and coworkers [45] resequenced 40 clinical isolates from China together with ATCC 16529. Six clinical isolates, including S1 and S931, grouped with ATCC 16529, apart from the remaining 34. That analysis used short reads mapped to the ATCC 16529 assembly, and the data are not public, so those isolates could not be placed relative to the groups defined here. If they fall within the group containing UTEX 1533, the separation reported here applies to the isolates examined and does not divide P. wickerhamii into clinical and non-clinical lineages.
5. Conclusions
UTEX 1533 and historical UTEX 1435 are best interpreted as conspecific members of P. wickerhamii, together with ATCC 16529 and ATCC 16525. The UTEX 1435 (2017 culture) and UTEX 1435 (2026 culture) are match P. xanthoriae. The sequence discrepancy is most consistent with a change in the material distributed by the culture collection under that designation. Both nuclear supermatrices recover the production-lineage reference group with full support and unambiguously separate it from the clinical isolates retained in each analysis. Whole-genome identity and mitochondrial intron structure corroborate this separation within the examined panel.
Supplementary Materials
The following supporting information can be downloaded at the website of this paper posted on Preprints.org, Supplementary methods; Table S1, sequencing and assembly statistics; Table S2, culture provenance and clinical sources; Table S3, marker identities of the UTEX 1435 cultures to P. xanthoriae reference records; Table S4, software versions and parameters; Figure S1, plastid 23S rRNA phylogeny; Figure S2, mitochondrial cytb phylogeny; Figure S3, nuclear 18S rRNA phylogeny; Figure S4, the ten-genome OrthoANI matrix; Figure S5, read-level evidence of diploidy in UTEX 1533 (2017).
Author Contributions
Conceptualization, L.P., A.K., C.F.D. and J.C.L.; methodology, A.K. and J.C.L.; investigation, J.P.; formal analysis, A.K. and L.P.; resources, J.P.; writing—original draft preparation, F.D.; writing—review and editing, L.P., A.K., F.D., M.O., C.F.D. and J.C.L.; supervision, J.C.L. All authors have read and agreed to the published version of the manuscript.
Funding
This research received no external funding.
Data Availability Statement
Public reference-genome and read accessions are listed in Table S1.
Conflicts of Interest
‘A.K., L.P., J.P., F.D. and J.C.L. are employees of Checkerspot, Inc., which is developing algal oils and related ingredients derived from Prototheca wickerhamii UTEX 1533 for commercial applications. C.F.D. declares no conflicts of interest.
References
- Krüger, W. Kurze Charakteristik einiger niederer Organismen im Saftflusse der Laubbäume. Hedwigia 1894, 33, 241–266.
- Pore, R.S. Prototheca taxonomy. Mycopathologia 1985, 90, 129–139.
- Jagielski, T.; Bakuła, Z.; Gawor, J.; Maciszewski, K.; Kusber, W.-H.; Dyląg, M.; Nowakowska, J.; Gromadka, R.; Karnkowska, A. The genus Prototheca (Trebouxiophyceae, Chlorophyta) revisited: implications from molecular taxonomic studies. Algal Research 2019, 43, 101639. [CrossRef]
- Ewing, A.; Brubaker, S.; Somanchi, A.; Yu, E.; Rudenko, G.; Reyes, N.; Espina, K.; Grossman, A.; Franklin, S. 16S and 23S plastid rDNA phylogenies of Prototheca species and their auxanographic phenotypes. Journal of Phycology 2014, 50(4), 765–769. [CrossRef]
- Tubaki, K.; Soneda, M. Cultural and taxonomical studies on Prototheca. Nagaoa 1959, 6, 25–34.
- Jagielski, T.; Gawor, J.; Bakuła, Z.; Decewicz, P.; Maciszewski, K.; Karnkowska, A. cytb as a new genetic marker for differentiation of Prototheca species. Journal of Clinical Microbiology 2018, 56(10), e00584-18. [CrossRef]
- Bakuła, Z.; Gromadka, R.; Gawor, J.; Siedlecki, P.; Pomorski, J.J.; Maciszewski, K.; Gromadka, A.; Karnkowska, A.; Jagielski, T. Sequencing and analysis of the complete organellar genomes of Prototheca wickerhamii. Frontiers in Plant Science 2020, 11, 1296. [CrossRef]
- Solazyme, Inc. Dossier in support of the generally recognized as safe (GRAS) status of high-oleic algal oil from a modified strain of Prototheca moriformis as a food ingredient. GRAS Notice No. GRN 000527; United States Food and Drug Administration, 2014.
- TerraVia Holdings, Inc. Algal structuring fat GRAS notification. GRAS Notice No. GRN 000673; United States Food and Drug Administration, 2016.
- TerraVia Holdings, Inc. Notification of GRAS status of high-oleic algal oil. GRAS Notice No. GRN 000754; United States Food and Drug Administration, 2017.
- United States Food and Drug Administration. Agency response letter, GRAS Notice No. GRN 000527: high-oleic algal oil from Prototheca moriformis strain S2532. 6 February 2015.
- United States Food and Drug Administration. Agency response letter, GRAS Notice No. GRN 000673: algal fat derived from Prototheca moriformis (S7737). 27 March 2017.
- United States Food and Drug Administration. Agency response letter, GRAS Notice No. GRN 000754: high-oleic algal oil from Prototheca moriformis strain S6697. 23 July 2018.
- Parker, L.; Ward, K.; Pilarski, T.; Price, J.; Derkach, P.; Correa, M.; Miller, R.; Benites, V.; Athanasiadis, D.; Doherty, B.; Edy, L.; Alnozaili, G.; Reyes, N.; Wittenberg, J.; Eliares, G.; Destaillats, F.; Rakitsky, W.; Franklin, S. Development and large-scale production of high-oleic acid oil by fermentation of microalgae. Fermentation 2024, 10, 566. [CrossRef]
- Zhou, X.; Zhao, X.; Parker, L.; Derkach, P.; Correa, M.; Benites, V.; Miller, R.; Athanasiadis, D.; Doherty, B.; Alnozaili, G.; Wittenberg, J.; Gates, D.; Destaillats, F.; Rakitsky, W.; Franklin, S. Development and large-scale production of human milk fat analog by fermentation of microalgae. Frontiers in Nutrition 2024, 11, 1341527. [CrossRef]
- Zhou, X.; Correa, M.; Athanasiadis, D.; Benites, V.; Doherty, B.; Edy, L.; Piamonte, C.; Eliares, G.; Cornejo, M.; Gong, T.; Parker, L.; Oliveira, M.; Rakitsky, W.; Lippmeier, J.C.; Walter, J.M.; Destaillats, F. Development of high palmitoleic (16:1 n-7) acid oil by fermentation of microalgae. Fermentation 2026, 12, 160. [CrossRef]
- Bakuła, Z.; Siedlecki, P.; Gromadka, R.; Gawor, J.; Gromadka, A.; Pomorski, J.J.; Panagiotopoulou, H.; Jagielski, T. A first insight into the genome of Prototheca wickerhamii, a major causative agent of human protothecosis. BMC Genomics 2021, 22, 168. [CrossRef]
- Wibberg, D.; Bakuła, Z.; García-Cunchillos, I.; Gawor, J.; Gromadka, R.; Karnkowska, A.; Bielecki, J.; Jagielski, T. Complete mitochondrial genomes of the Prototheca genus: comparative genomics and evolutionary insights. BMC Genomics 2025, 26, 766. [CrossRef]
- Fang, L.; Guo, J.; Ning, Q.; Luo, Y.; Jian, J.; Ning, J. High-quality genome assemblies of two Prototheca wickerhamii strains. Scientific Data 2026, 13, 633. [CrossRef]
- Lass-Flörl, C.; Mayr, A. Human protothecosis. Clinical Microbiology Reviews 2007, 20(2), 230–242. [CrossRef]
- Jagielski, T.; Iskra, M.; Bakuła, Z.; Rudna, J.; Roeske, K.; Nowakowska, J.; Bielecki, J.; Krukowski, H. Occurrence of Prototheca microalgae in aquatic ecosystems with a description of three new species, Prototheca fontanea, Prototheca lentecrescens, and Prototheca vistulensis. Applied and Environmental Microbiology 2022, 88(22), e01092-22. [CrossRef]
- Li, J.; He, X.; Guo, H.; Lin, D.; Wu, X.; Chen, B. Complete genome identified of clinical isolate Prototheca. Journal of Medical Microbiology 2024, 73(10), 001914. [CrossRef]
- Lee, W.-S.; Lagios, M.D.; Leonards, R. Wound infection by Prototheca wickerhamii, a saprophytic alga pathogenic for man. Journal of Clinical Microbiology 1975, 2(1), 62–66. [CrossRef]
- Kolmogorov, M.; Yuan, J.; Lin, Y.; Pevzner, P.A. Assembly of long, error-prone reads using repeat graphs. Nature Biotechnology 2019, 37(5), 540–546. [CrossRef]
- Oxford Nanopore Technologies. Medaka: sequence correction provided by ONT Research, version 2.2.1. Available online: https://github.com/nanoporetech/medaka.
- Guan, D.; McCarthy, S.A.; Wood, J.; Howe, K.; Wang, Y.; Durbin, R. Identifying and removing haplotypic duplication in primary genome assemblies. Bioinformatics 2020, 36(9), 2896–2898. [CrossRef]
- Alonge, M.; Lebeigle, L.; Kirsche, M.; Jenike, K.; Ou, S.; Aganezov, S.; Wang, X.; Lippman, Z.B.; Schatz, M.C.; Soyk, S. Automated assembly scaffolding using RagTag elevates a new tomato system for high-throughput genome editing. Genome Biology 2022, 23, 258. [CrossRef]
- Chin, C.-S.; Peluso, P.; Sedlazeck, F.J.; Nattestad, M.; Concepcion, G.T.; Clum, A.; Dunn, C.; O’Malley, R.; Figueroa-Balderas, R.; Morales-Cruz, A.; Cramer, G.R.; Delledonne, M.; Luo, C.; Ecker, J.R.; Cantu, D.; Rank, D.R.; Schatz, M.C. Phased diploid genome assembly with single-molecule real-time sequencing. Nature Methods 2016, 13, 1050–1054. [CrossRef]
- English, A.C.; Richards, S.; Han, Y.; Wang, M.; Vee, V.; Qu, J.; Qin, X.; Muzny, D.M.; Reid, J.G.; Worley, K.C.; Gibbs, R.A. Mind the gap: upgrading genomes with Pacific Biosciences RS long-read sequencing technology. PLoS ONE 2012, 7, e47768. [CrossRef]
- Chen, S.; Zhou, Y.; Chen, Y.; Gu, J. fastp: an ultra-fast all-in-one FASTQ preprocessor. Bioinformatics 2018, 34(17), i884–i890. [CrossRef]
- Bankevich, A.; Nurk, S.; Antipov, D.; Gurevich, A.A.; Dvorkin, M.; Kulikov, A.S.; Lesin, V.M.; Nikolenko, S.I.; Pham, S.; Prjibelski, A.D.; Pyshkin, A.V.; Sirotkin, A.V.; Vyahhi, N.; Tesler, G.; Alekseyev, M.A.; Pevzner, P.A. SPAdes: a new genome assembly algorithm and its applications to single-cell sequencing. Journal of Computational Biology 2012, 19(5), 455–477. [CrossRef]
- Tegenfeldt, F.; Kuznetsov, D.; Manni, M.; Berkeley, M.; Zdobnov, E.M.; Kriventseva, E.V. OrthoDB and BUSCO update: annotation of orthologs with wider sampling of genomes. Nucleic Acids Research 2025, 53(D1), D516–D522. [CrossRef]
- Camacho, C.; Coulouris, G.; Avagyan, V.; Ma, N.; Papadopoulos, J.; Bealer, K.; Madden, T.L. BLAST+: architecture and applications. BMC Bioinformatics 2009, 10, 421. [CrossRef]
- Katoh, K.; Standley, D.M. MAFFT multiple sequence alignment software version 7: improvements in performance and usability. Molecular Biology and Evolution 2013, 30(4), 772–780. [CrossRef]
- Capella-Gutiérrez, S.; Silla-Martínez, J.M.; Gabaldón, T. trimAl: a tool for automated alignment trimming in large-scale phylogenetic analyses. Bioinformatics 2009, 25(15), 1972–1973. [CrossRef]
- Wong, T.K.F.; Ly-Trong, N.; Ren, H.; Demotte, P.; Baños, H.; Roger, A.J.; Susko, E.; Bielow, C.; De Maio, N.; Goldman, N.; Hahn, M.W.; dos Reis, M.; Vinh, L.S.; Huttley, G.; Lanfear, R.; Minh, B.Q. IQ-TREE 3: phylogenomic inference software using complex evolutionary models. Molecular Biology and Evolution 2026, 43(5), msag117. [CrossRef]
- Kalyaanamoorthy, S.; Minh, B.Q.; Wong, T.K.F.; von Haeseler, A.; Jermiin, L.S. ModelFinder: fast model selection for accurate phylogenetic estimates. Nature Methods 2017, 14, 587–589. [CrossRef]
- Guindon, S.; Dufayard, J.-F.; Lefort, V.; Anisimova, M.; Hordijk, W.; Gascuel, O. New algorithms and methods to estimate maximum-likelihood phylogenies: assessing the performance of PhyML 3.0. Systematic Biology 2010, 59(3), 307–321. [CrossRef]
- Hoang, D.T.; Chernomor, O.; von Haeseler, A.; Minh, B.Q.; Vinh, L.S. UFBoot2: improving the ultrafast bootstrap approximation. Molecular Biology and Evolution 2018, 35(2), 518–522. [CrossRef]
- Guo, J.; Ming, Y.; Chen, J.; Xue, Y.; Peng, Y.; Zhu, H.; Jiang, C.; Wu, W. Two high-quality genomes of Prototheca bovis strain SH08 and Prototheca ciferrii strain SH13. Scientific Data 2026, 13, 23. [CrossRef]
- Severgnini, M.; Lazzari, B.; Capra, E.; Chessa, S.; Luini, M.; Bordoni, R.; Castiglioni, B.; Ricchi, M.; Cremonesi, P. Genome sequencing of Prototheca zopfii genotypes 1 and 2 provides evidence of a severe reduction in organellar genomes. Scientific Reports 2018, 8, 14637. [CrossRef]
- Lee, I.; Ouk Kim, Y.; Park, S.-C.; Chun, J. OrthoANI: an improved algorithm and software for calculating average nucleotide identity. International Journal of Systematic and Evolutionary Microbiology 2016, 66(2), 1100–1103. [CrossRef]
- Guo, J.; Jian, J.; Wang, L.; Xiong, L.; Lin, H.; Zhou, Z.; Sonnenschein, E.C.; Wu, W. Genome sequences of two strains of Prototheca wickerhamii provide insight into the protothecosis evolution. Frontiers in Cellular and Infection Microbiology 2022, 12, 797017. [CrossRef]
- Craig, R.J.; Dueñas, M.A.; Camacho, D.J.; Gallaher, S.D.; Avendaño-Monsalve, M.C.; Lin, Y.; Blaby-Haas, C.E.; Moseley, J.L.; Merchant, S.S. Targeted genetic manipulation and yeast-like evolutionary genomics in the green alga Auxenochlorella. The Plant Cell 2025, 37(11), koaf259. [CrossRef]
- Jian, J.; Luo, Y.; Yang, K.; Wang, S.; Guo, J. Resequencing of 41 strains reveals the diversity and adaptation of Prototheca wickerhamii. Algal Research 2026, 96, 104709. [CrossRef]
Figure 1.
Plastid 16S rRNA phylogeny. Maximum-likelihood tree including all six clinical isolates. Historical UTEX 1435 is represented by KM396170. The UTEX 1435 (2017 culture) and UTEX 1435 (2026 culture) are not included in the tree (Table S3). Both UTEX 1533 cultures, ATCC 16525, ATCC 16529 and the archival record form a terminal cluster. SAG 263-11 is labeled P. xanthoriae. Historical species labels are retained where indicated. Outgroups are Coccomyxa subellipsoidea C-169 and Chlamydomonas reinhardtii. Numbers show ultrafast bootstrap support of at least 95%, and filled circles denote 100%. The scale denotes substitutions per site.
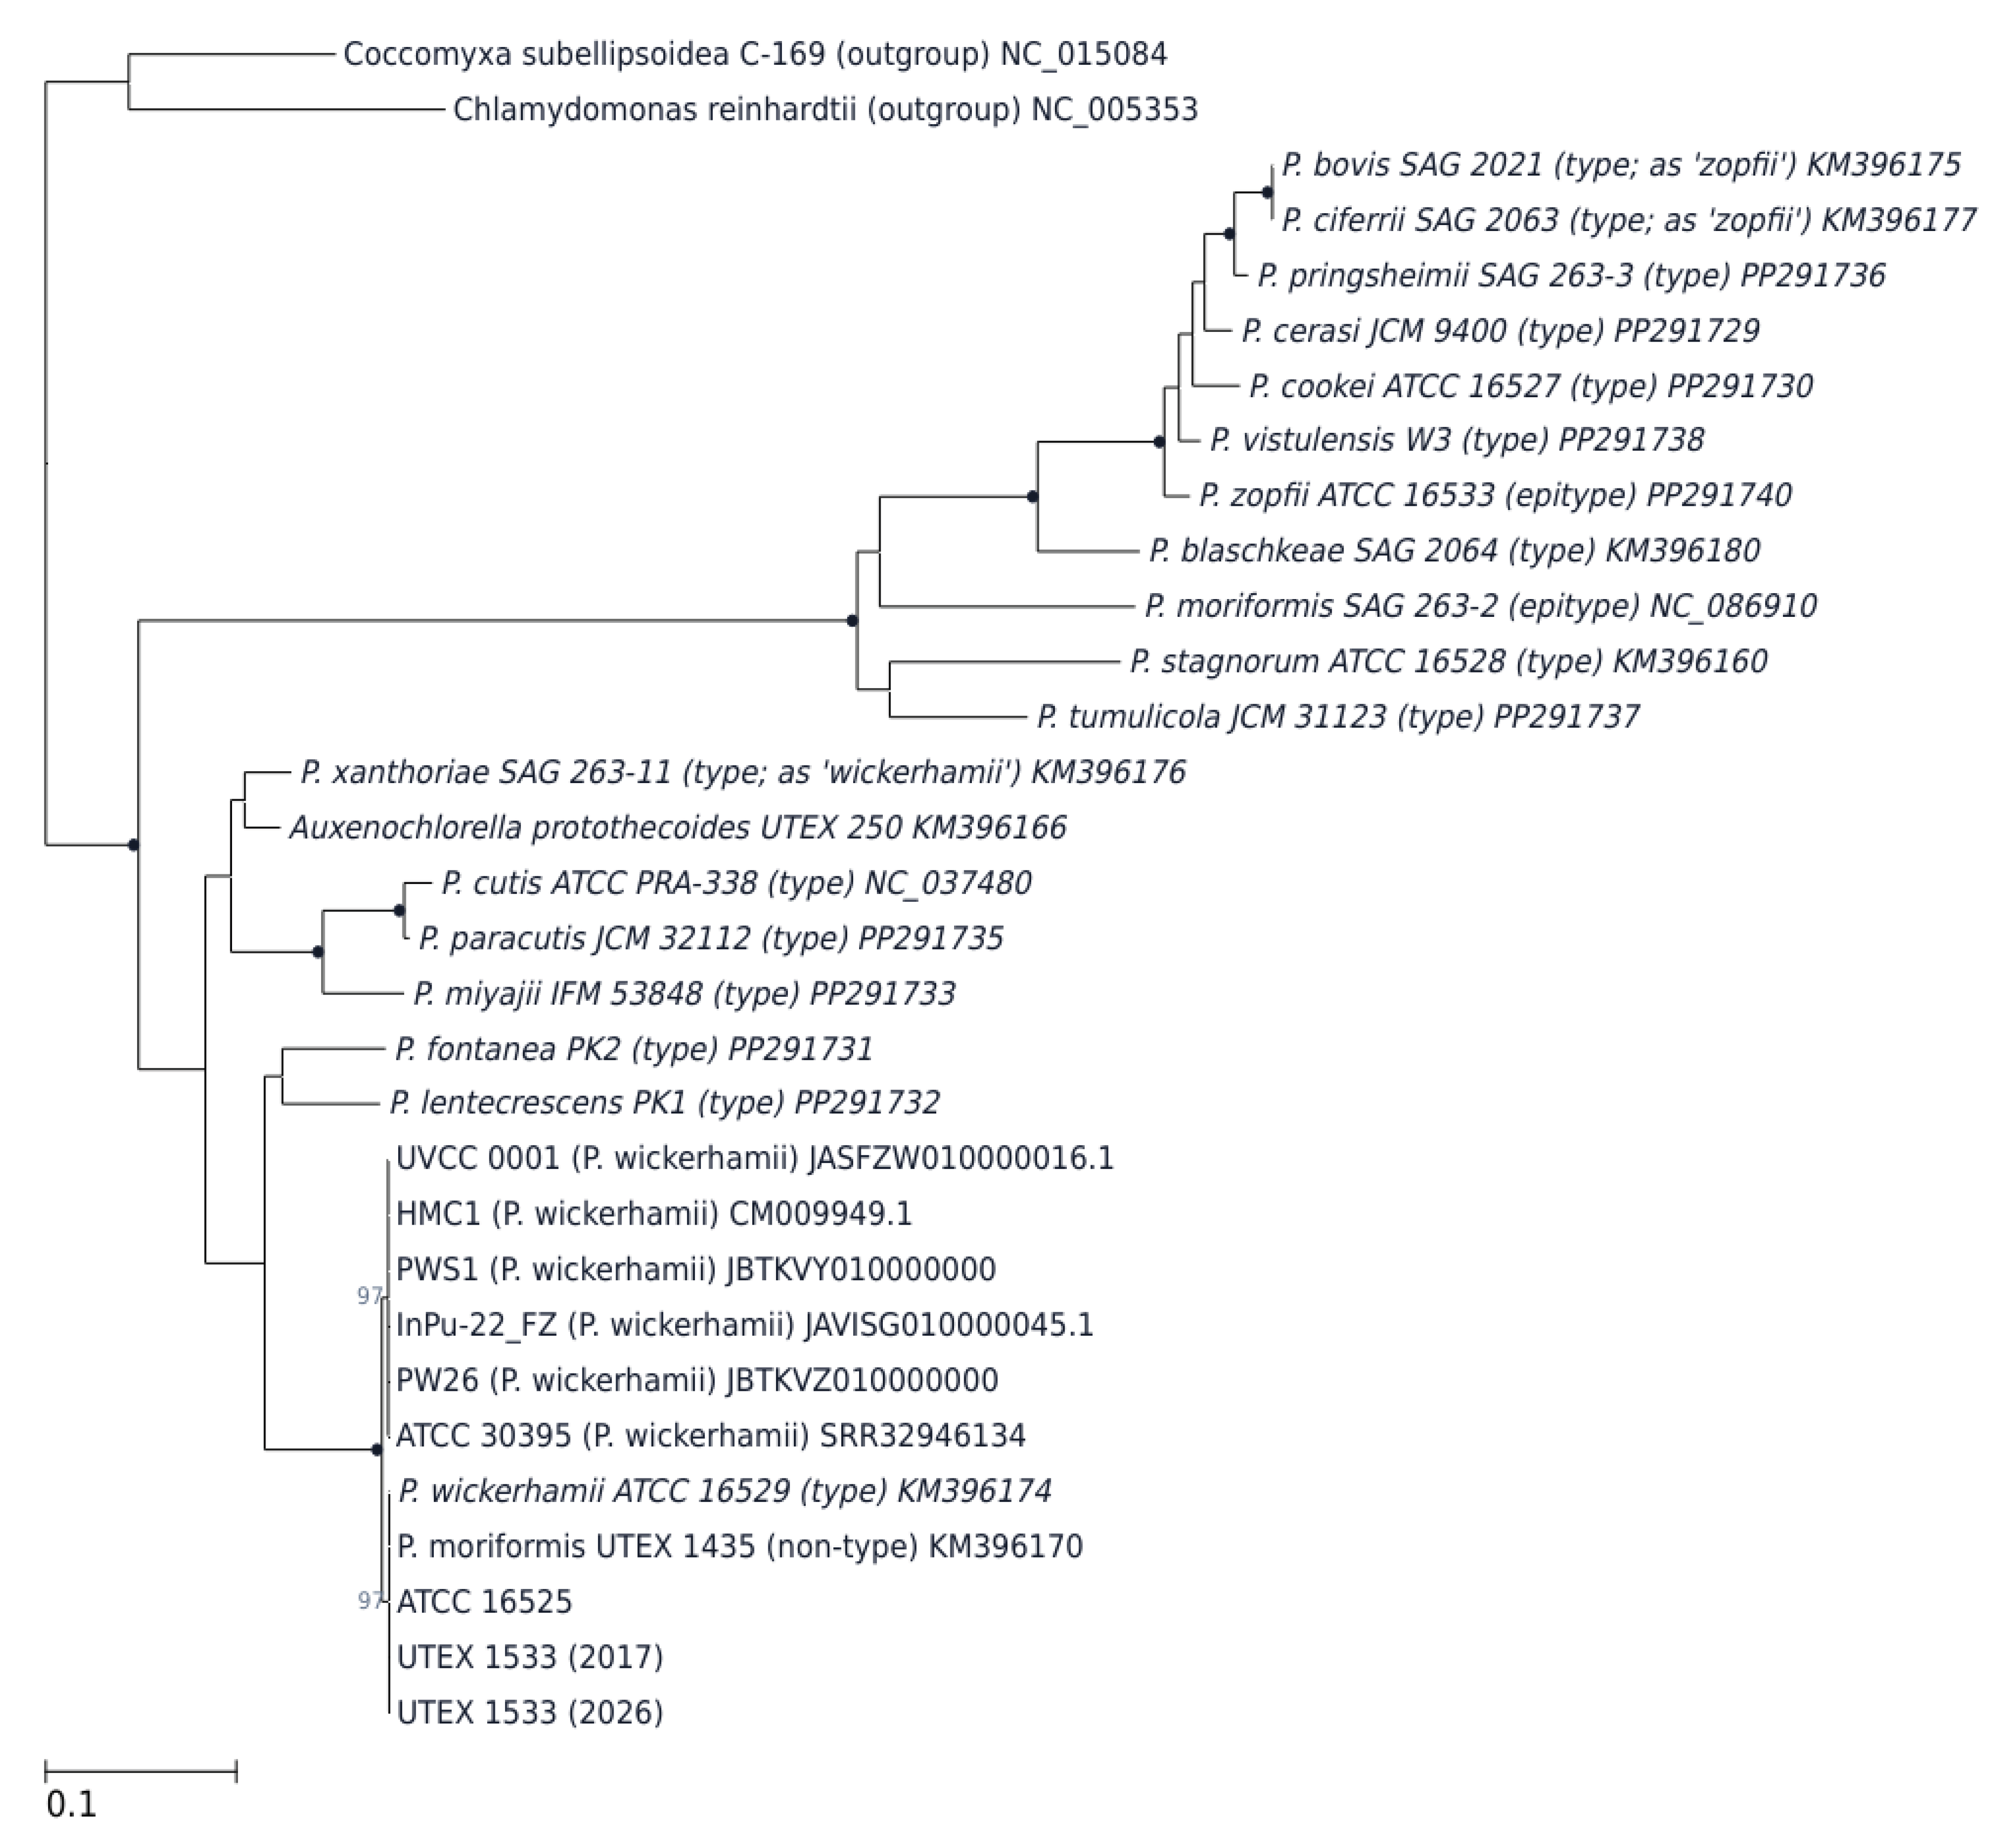
Figure 2.
Separation of within-group and between-group whole-genome identities. Each circle represents one of the 45 unique pairs among the ten genomes. Overlapping values may obscure individual circles. The upper two rows are comparisons within the four production-lineage genomes and within the six clinical isolates. The bottom row contains comparisons between groups. The shaded band marks the interval containing no pairwise value. The corresponding ten-genome matrix is given in Figure S4.
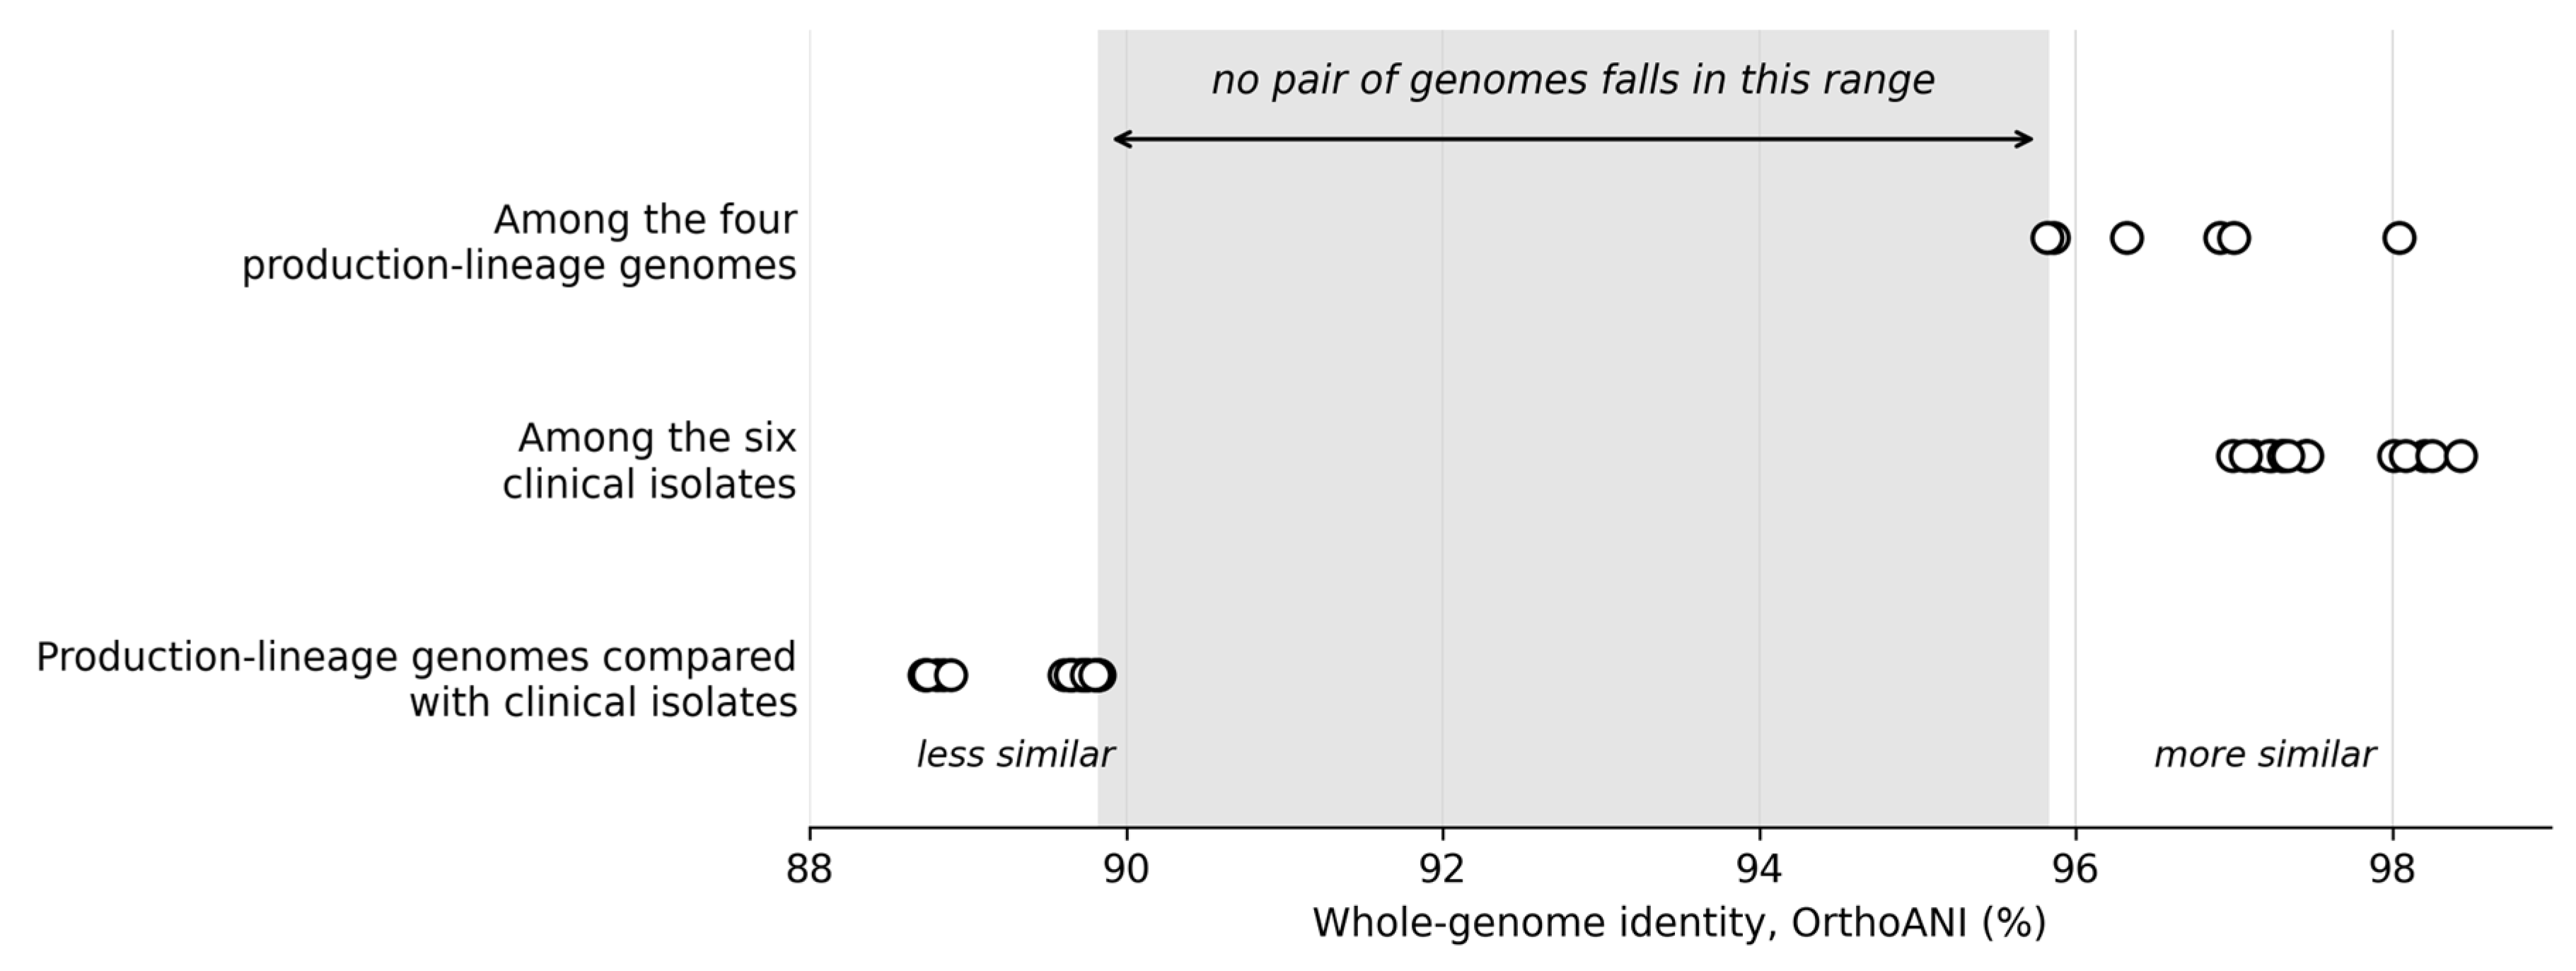
Figure 3.
Nuclear phylogeny of the production-lineage reference group and clinical isolates. (a) 115 complete single-copy BUSCO genes, 136,406 aligned positions and 17 taxa. (b) 253 genes, 302,454 positions and 14 taxa, omitting HMC1, ATCC 30395 and UVCC 0001. The four production-lineage genomes, the clinical isolates retained in each panel and the UTEX 1533 pair each receive 100% SH-aLRT and ultrafast bootstrap support. Numbers show ultrafast bootstrap support of at least 95%, and filled circles denote 100%. Dashed branches indicate relationships not consistently recovered when the gene set was divided once at random into two halves. Tip labels identify nuclear assemblies or source reads. Chlamydomonas reinhardtii CC-503 and Chlorella variabilis NC64A are outgroups. Scales denote substitutions per site.
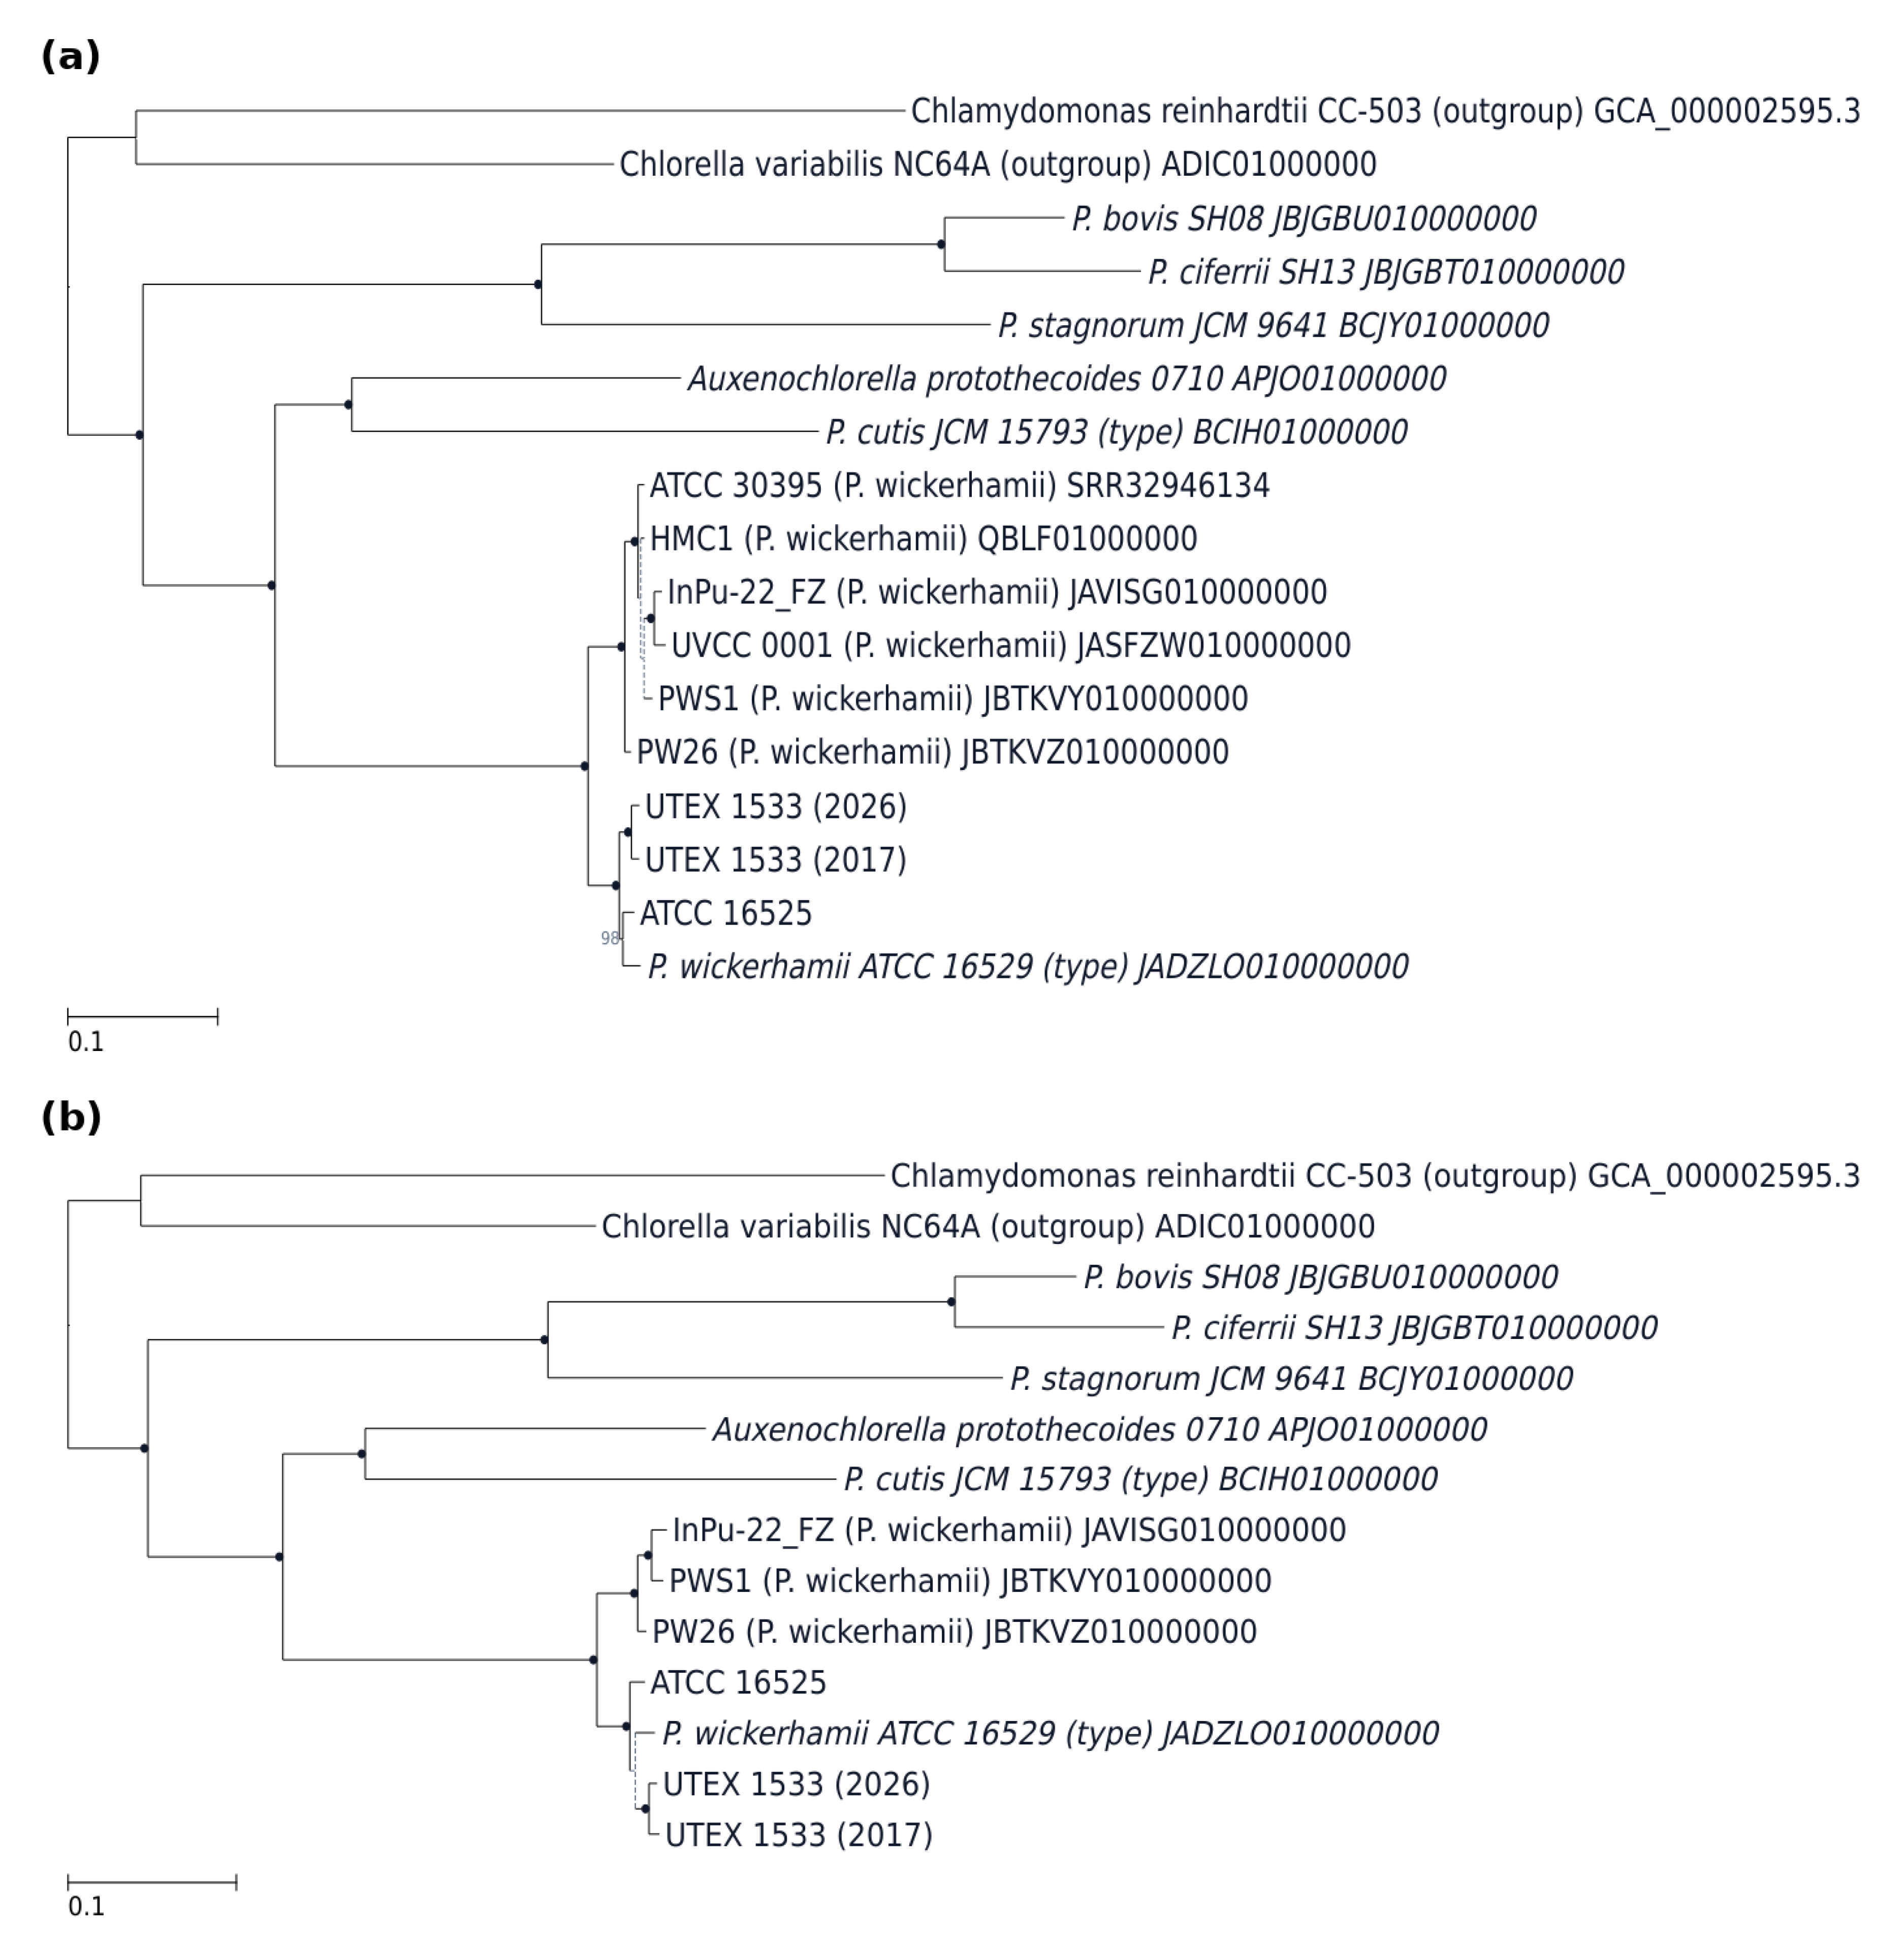
Figure 4.
Mitochondrial rnl structure. The four production-lineage genomes (top) have introns containing orf148, orf210 and orf236, and the six clinical isolates (middle) retain only the orf236 intron. Four other Prototheca species are shown for comparison. Hatched bars denote rnl containing introns, purple arrows intron-associated open reading frames, and gray bands corresponding sequences. An asterisk identifies an open reading frame homologous to orf148. Scale bar, 1.0 kb.
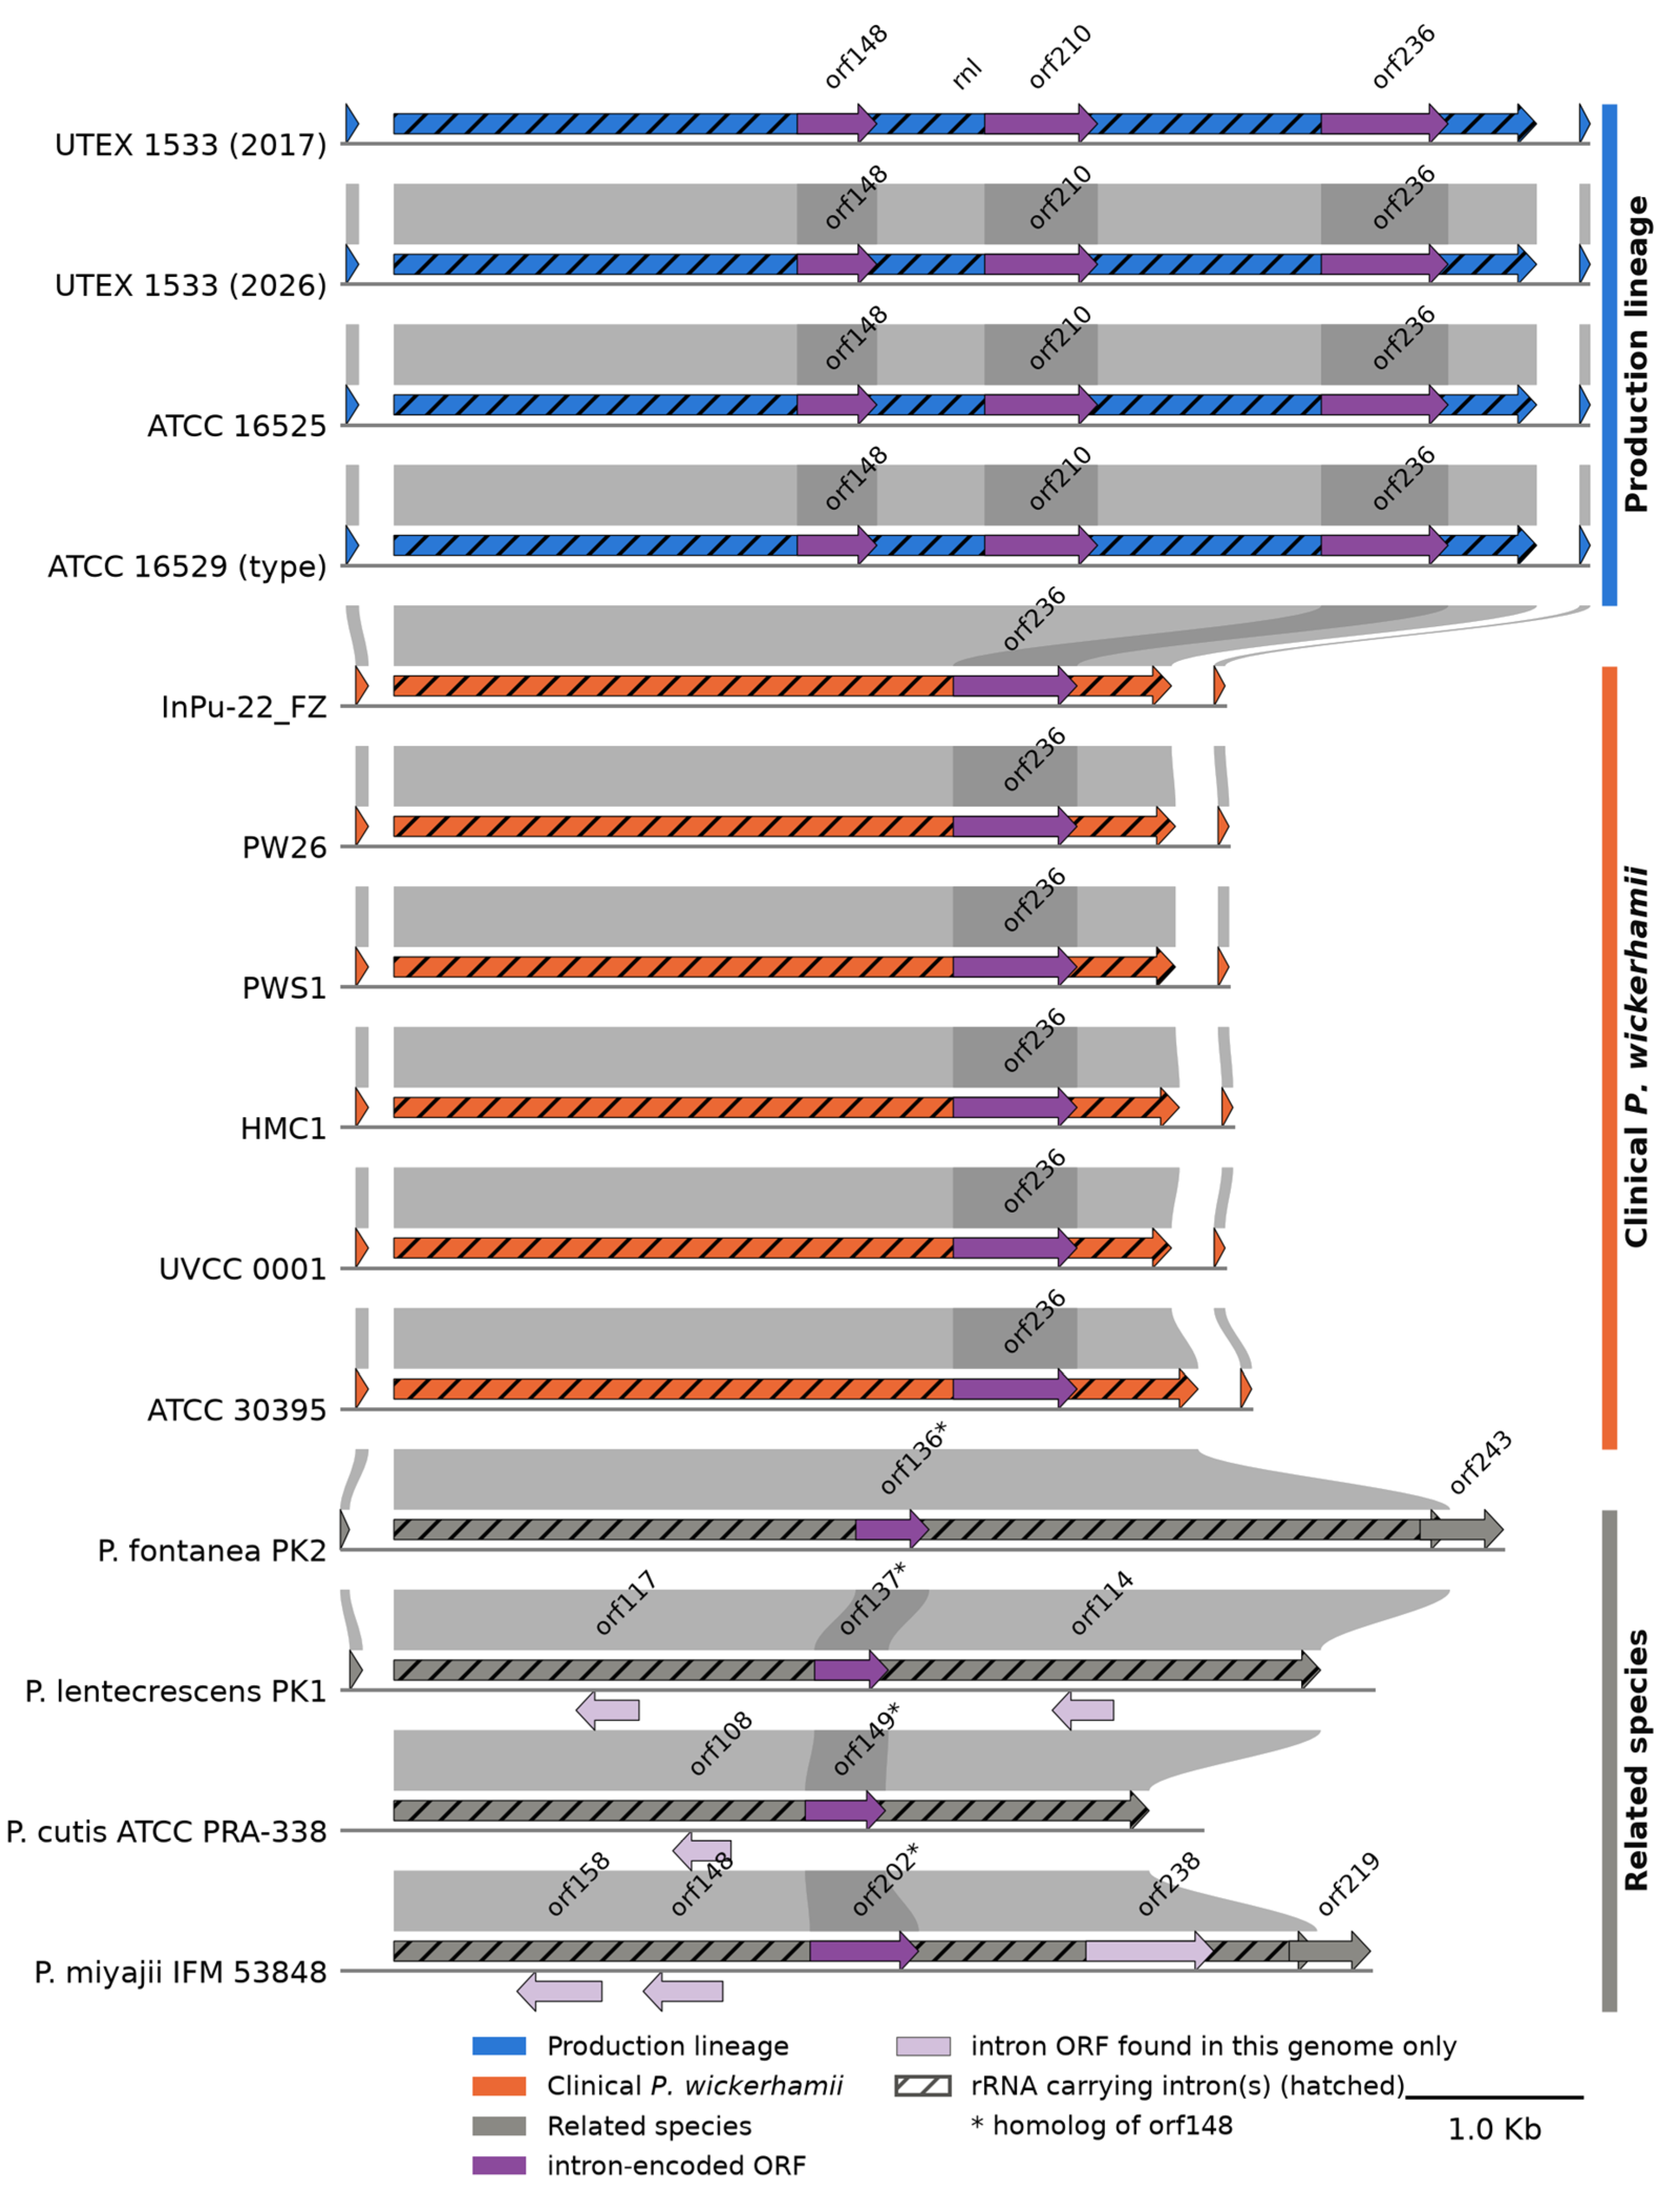

Table 1.
Marker-sequence identities to UTEX 1533 (2017).
| Comparator | Plastid 16S (%) |
Plastid 23S (%) |
Mitochondrial cytb (%) |
Nuclear 18S (%) |
|---|---|---|---|---|
| Historical UTEX 1435 | 100 | 100 | ND | ND |
| ATCC 16525 | 100 | 100 | 100 | 100 |
| ATCC 16529 (type; 18S clone) | 100 | 100 | 100 | 98.71 |
| UTEX 1533 (2026), assembled sequence | 100 | 100 | 100 | 97.37 |
| UTEX 1533 (2026), 18S read class A (vs 2017 class A) | – | – | – | 100* |
| Clinical isolates | 99.35 | 98.87 | 99.74 | 96.26–96.90 |
Table 2.
Whole-genome identity within and between the two groups.
| Comparison | Genome pairs (n) | OrthoANI range (%) | Mean (%) |
|---|---|---|---|
| Among four production-lineage genomes | 6 | 95.82–98.04 | 96.66 |
| Among six clinical isolates | 15 | 96.99–98.43 | 97.57 |
| Among clinical isolates, excluding HMC1 | 10 | 96.99–97.46 | 97.25 |
| Between the two groups | 24 | 88.72–89.83 | 89.50 |
Disclaimer/Publisher’s Note: The statements, opinions and data contained in all publications are solely those of the individual author(s) and contributor(s) and not of MDPI and/or the editor(s). MDPI and/or the editor(s) disclaim responsibility for any injury to people or property resulting from any ideas, methods, instructions or products referred to in the content. |
© 2026 by the authors. Licensee MDPI, Basel, Switzerland. This article is an open access article distributed under the terms and conditions of the Creative Commons Attribution (CC BY) license.
Copyright: This open access article is published under a Creative Commons CC BY 4.0 license, which permit the free download, distribution, and reuse, provided that the author and preprint are cited in any reuse.