

Submitted:
17 October 2026
Posted:
19 October 2026
You are already at the latest version
Abstract
Onboard processing for remote sensing satellites has long been of interest in ocean monitoring because it can provide timely information on rapidly changing ocean environments. Recently, the integration of artificial intelligence (AI) into onboard processing has emerged as an active research topic. However, application scenarios and on-orbit demonstrations of AI-based onboard processing remain limited. In this study, we achieved the first on-orbit detection of ocean eddies using AI on the Haishao-1 (HS-1) spaceborne synthetic aperture radar (SAR) satellite, marking the first attempt to monitor an ocean dynamic process directly onboard. Specifically, an onboard application module was developed for HS-1, integrating image preprocessing and deep learning-based detection based on our previously developed Eddy Detection based on YOLO (EOLO) model. On-orbit experiments verified stable execution of the application module. Ground reproduction of the tasks using hardware identical to the onboard computing units yielded an average processing time of 3.4-6.1 s per image. Evaluation against expert annotations of 288 HS-1 scenes showed that EOLO, originally developed using Sentinel-1 imagery, achieved an F1 score of 78% after threshold adjustment. The application module has also been deployed on the Haishao-2 platform for Arctic sea ice extraction, further demonstrating its extensibility. This study presents the implementation and on-orbit validation of the onboard application module, providing a practical reference for future applications.
Keywords:
onboard processing
; artificial intelligence
; ocean eddy
; object detection
; YOLO
; Haishao‐1
; synthetic aperture radar
1. Introduction
With the improvement of satellite observation capabilities, remote sensing data have increased substantially in both quality and volume. This has expanded the range of applications for remote sensing data, but has also created new challenges for the timely delivery of remote sensing information. Limited bandwidth of satellite-to-ground communication and the high computational load of ground-based processing systems often introduce delays of several hours to tens of hours between observation and application [1,2].
Onboard processing helps alleviate these limitations by moving part of the processing chain from the ground to the satellite and producing lightweight data on orbit. Since the 1990s, it has developed steadily. Early studies mainly focused on data compression to reduce the burden on satellite-ground links [3,4]. With the development of onboard computing capability, onboard processing gradually expanded to more application-oriented tasks, such as object detection and thematic mapping. A milestone was NASA’s Earth Observing-1 mission, which applied threshold methods to hyperspectral imagery for on-orbit detection of floods, lake ice, and clouds [5,6]. This enabled valuable application information to be rapidly delivered to end users. Over the past decade, attempts have been made to integrate AI into onboard processing because of its adaptability to complex tasks. For example, ESA’s ΦSat-1 carried a convolutional neural network for cloud detection, allowing only images with cloud cover below 70% to be downlinked [7]. By transmitting only clear images, this approach alleviates the pressure on satellite-to-ground communication links.
Onboard processing has long been of interest in ocean observation. The rapidly changing nature of the ocean environment makes the timely delivery of such information particularly important. Notable examples include ESA’s ΦSat-2 mission, which applies deep learning models to ship detection and coastal water-quality monitoring [8], and the HISEA-1 mission, which performs ship detection onboard using the constant false alarm rate method [9]. Nevertheless, most studies have focused either on algorithm development for a limited range of application scenarios, mainly ship detection [10,11], or on the validation of onboard processing chains in simulated environments [12,13,14]. On-orbit detection of ocean dynamic processes, an important class of ocean phenomena, has not yet been achieved.
Ocean eddies are a key component of ocean dynamics, which may evolve over timescales of only a few hours [15]. They play an important role in the transport of heat, salt, and biogeochemical tracers [16,17,18], while also generating strong local flow fields that may threaten maritime transportation and offshore platforms [19]. Timely information is therefore important for both scientific research and offshore operations. It can support rapid adjustment of observations, thereby improving the tracking of eddy evolution, and can also facilitate earlier in situ measurements and provide warnings for offshore activities.
Spaceborne SAR has been an important tool for ocean eddy monitoring, offering two-dimensional, high-resolution imagery in all weather, day and night. As the volume of SAR data has increased rapidly, deep learning has become the mainstream approach for ocean eddy detection because of its strong feature extraction capability. Among them, the You Only Look Once (YOLO) family has been widely adopted because of its balance between accuracy and speed [20,21,22,23]. This balance is particularly suited to onboard applications.
In this context, this study achieved the first on-orbit implementation of ocean eddy detection using a YOLO-based model on the HS-1 SAR satellite. As the first satellite of the Haishao series, HS-1 was designed as a technology-demonstration platform to investigate the challenges and solutions associated with the on-orbit implementation of onboard processing for ocean phenomena, thereby providing insights and references for future operational applications. For this purpose, we developed an onboard application module for the HS-1 platform, enabling image preprocessing and ocean eddy detection using our previously developed EOLO [20] deep learning model. The module has been validated through multiple on-orbit experiments, demonstrating stable operation in the space environment. This paper presents a detailed description of the development platform, technical implementation, and validation results, thereby providing a practical engineering reference for the development of future onboard processing systems.
The remainder of this paper is organized as follows. Section 2 introduces the requirements and challenges of AI-based onboard monitoring of ocean dynamic processes. Section 3 introduces the onboard processing platform and the datasets used in this study. Section 4 describes the scheme used to develop the onboard application module. Section 5 presents the experimental results. Section 6 provides the discussion and conclusions.
2. AI-Based Onboard Processing for Ocean Dynamic Monitoring: Requirements and Challenges
Ocean dynamic processes are an important research topic in oceanography because of their role in regulating the marine environment and their impacts on offshore operations. Satellite observations provide an essential means for investigating these processes over broad spatial and temporal scales. Affected by complex atmospheric conditions over the ocean, optical remote sensing is often limited by clouds, rain, fog, and variations in illumination, making it difficult to provide stable observations for ocean dynamic processes. As an active microwave imaging sensor, SAR offers all-day and all-weather observation capabilities and has therefore become an important data source. The ocean dynamic processes, such as eddies, fronts, internal waves, and waves, often exhibit complex spatial structures and weak image contrast in SAR images, making their automated detection a long-standing challenge. Advances in deep learning have greatly promoted the development of related methods [20,24,25,26] because of their adaptability to complex tasks.
Nevertheless, their rapidly evolving nature places greater demands on the timeliness of remote sensing information. For example, many submesoscale ocean eddies with spatial scales ranging from hundreds of meters to tens of kilometers may persist for only a few hours [15]. Conventional ground-based processing chains often introduce delays of several hours to tens of hours. Such latency limits timely in situ measurements and evolution tracking of ocean dynamic processes, and also weakens the capability of remote sensing information to provide warnings for ship navigation and offshore platform operations. Reducing this latency is critical for monitoring of ocean dynamic processes.
Therefore, developing AI-based onboard processing for ocean dynamic processes is of great significance. However, their development still faces two key challenges. The first issue is how to deploy AI models reliably on satellite platforms. This requires consideration of the selection of onboard computing hardware, the design of the onboard processing system, the adaptation of model inference frameworks, the deployment of software environments, and the maintainability, extensibility, and updatability of onboard functions during on-orbit operation. Second, ocean dynamic processes usually evolve rapidly and occur at variable locations, making it difficult for newly launched satellite missions to collect sufficient mission-specific training samples within a short period. In this context, training models with historical data and transferring them to new missions provides a feasible solution. However, its actual effectiveness remains a question that requires further investigation. This study takes ocean eddies, a typical ocean dynamic process, as an example to present our solutions to these challenges.
3. Materials and Data
3.1. Onboard Processing Platform
HS-1 is an X-band (9.6 GHz) micro SAR satellite designed for ocean monitoring. The satellite was launched on December 4, 2024. It operates in a very low Earth orbit (VLEO) at an altitude of approximately 350 km and a low orbital inclination of about 43°. This orbit enables HS-1 to achieve a short revisit period over low- and mid-latitude oceans while maintaining high-resolution imaging with a high signal-to-noise ratio [27]. HS-1 also mitigates azimuth ambiguity by employing a high pulse repetition frequency (PRF) acquisition strategy, which increases the azimuth sampling rate and suppresses Doppler spectral aliasing. These characteristics enable HS-1 to provide high quality data for ocean monitoring. In addition, HS-1 can receive files transmitted through the ground-to-satellite uplink and update them on orbit. This ensures that the onboard processing functions can be maintained, extended, and updated.
HS-1 is equipped with an onboard computing payload that includes a Field Programmable Gate Array (FPGA) unit and two NVIDIA Jetson AGX Xavier computing units. The FPGA is responsible for communication with the satellite platform, including routing raw echo data and processing results to the designated storage devices and collecting and reporting telemetry status from the onboard processing payload. The two Jetson AGX Xavier units can operate concurrently and provide the main computational resources for onboard processing, including workflow scheduling, SAR focusing, image processing, and deep learning inference. Each computing unit is a heterogeneous edge platform that integrates an ARM CPU and a Volta-architecture GPU and runs a Linux-based operating system. The GPU is optimized for 16-bit floating-point (FP16) operations and delivers approximately 11 TFLOPS of computing performance (i.e., about 11 trillion floating-point operations per second). It also includes 32 GB of memory shared by the CPU and GPU, which reduces data transfer time between them. For data storage, the onboard processing payload includes six 512 GB solid-state drives (SSDs) for raw echo data and processing results. Two additional 64 GB embedded MultiMediaCard (eMMC) devices are reserved for system backup.
3.2. Architecture of the Onboard Processing System
Based on the above platform, an onboard processing system was developed, consisting of three functional modules: the control module, imaging module, and application module, as illustrated in Figure 1. The control module parses ground-uploaded commands and generates the corresponding imaging and application parameters, which are described in detail in Table 1. These parameters are passed to the imaging and application modules through shared memory (SM). The imaging module reads the imaging parameters and performs SAR imaging to generate Level-2 (L2) data, which are then stored in a predefined directory on the SSD. After that, the imaging module sends an imaging complete flag to the control module through SM, which then triggers the application module using an application start flag. The application module reads the application parameters and the generated L2 data to perform application-level processing, including image preprocessing and deep learning inference. Once processing is completed, the application module returns an application complete flag to the control module. Finally, the control module packages the imaging and application results separately into binary files using a predefined protocol for downlink.
3.3. Data and Study Area
This study used HS-1 stripmap-mode imagery acquired in VV polarization, with a swath width of approximately 10 km and a spatial resolution of about 1 m. The raw data were processed by the imaging module to generate L2 data through SAR focusing, radiometric correction, and geometric correction. The focusing was performed using the Chirp Scaling algorithm [28] and accelerated on the onboard GPU. Each onboard processing task performed imaging on approximately 6 seconds of SAR echoes, generating 5-7 image scenes. The resulting L2 data were geocoded onto a regular latitude–longitude grid and stored as GeoTIFF files in digital number (DN) format. Representative examples are shown in Figure 2, with image dimensions of approximately 16,000 × 16,000 pixels.
Most of the data were acquired over the western Mediterranean, where ocean eddies occur frequently and have been extensively investigated [29,30,31]. Two groups of data were employed for different purposes. Subset A consisted of 47 scenes containing five eddies, acquired during eight on-orbit experiments conducted in May 2025. The yellow boxes in Figure 3(a) indicate their spatial distribution, with the yellow numbers denoting the task IDs. This subset was used to evaluate the stability of the onboard processing chain in the space environment. For Task 8, only the application results were successfully received, whereas the imaging data were corrupted during transmission. Subset B consisted of 288 scenes containing 31 eddies, acquired in May and July 2025, with their distribution shown by the red boxes in Figure 3(a)-(c). These data were processed on the ground-based hardware identical to the onboard computing units. The eddies were identified through visual interpretation by two specialists with experience from our previous studies[20,21]. This subset was used for parameter tuning and accuracy evaluation.
4. Methods
4.1. Overall Architecture of the Application Module
This study focuses on the development of the AI-based application module within the onboard processing system. As shown in Figure 4, the module adopts a decoupled architecture with three components: the controller, the preprocessing unit, and the deep learning inference unit, allowing each component to be maintained and updated independently. The controller receives the application start flag and application type parameters from the control module, and then invokes the preprocessing and deep learning inference units. The preprocessing unit first converts the L2 data into inputs for the deep learning model. The inference unit then performs eddy detection and outputs the results. After all processing is completed, the controller returns the application completion flag to the control module.
4.2. Ocean Eddy Detection Method
In the above workflow, two main algorithms are involved: image preprocessing and eddy detection. They are implemented in the preprocessing unit and the deep learning inference unit, respectively. The preprocessing unit first reads the L2 imagery and downsamples it by a factor of 10 using nearest-neighbor resampling to reduce the computational cost. Since the spatial scales of ocean eddies are generally larger than several hundred meters, this operation can not remove the eddy features.The 2nd and 98th percentiles of pixel intensity are then used as the lower and upper bounds for linear contrast stretching. After clipping pixel values outside this range, the remaining values are linearly rescaled to a range of 0–255. The preprocessed images are subsequently used as inputs to the eddy detection algorithm.
Since YOLO-based models are widely used for SAR ocean eddy detection, we selected our previously developed EOLO model [20], a lightweight YOLOv5-based model with 7.07 million parameters, for onboard implementation. EOLO incorporates Efficient Channel Attention (ECA), a bidirectional feature pyramid network (BiFPN), and the lightweight CARAFE upsampling operator to enhance feature extraction and multiscale feature fusion. It was trained using Sentinel-1 Interferometric Wide (IW) imagery and has achieved detection accuracy exceeding 90% on Sentinel-1 imagery from several ocean regions, including the western Mediterranean, the Red Sea, and the Baltic Sea.
The model outputs rectangular bounding boxes with corresponding confidence scores. Boxes with confidence scores lower than a predefined threshold are discarded. Non-maximum suppression is then applied using an Intersection over Union (IoU) threshold to remove duplicate detections. When multiple boxes overlap beyond this threshold, only the box with the highest confidence score is retained. Detailed information on the training data, parameter settings, and other aspects of the model can be found in Zi et al. [20].
Because EOLO’s performance on HS-1 imagery could not be evaluated before launch, the detection thresholds were empirically adjusted for the on-orbit experiments. To reduce the risk of missed detections, the confidence threshold was lowered from 0.24, which was used for Sentinel-1 imagery, to 0.1. Meanwhile, the IoU threshold was increased from 0.45 to 0.5 to avoid excessive suppression of candidate detections.
To further improve runtime efficiency, EOLO’s trained weights were converted from 32-bit floating point (FP32) to 16-bit floating point (FP16) without retraining. During the conversion, each FP32 parameter was replaced by its nearest representable FP16 value. This allowed the deep learning inference unit to exploit the onboard GPU’s optimized FP16 computing capability, thereby improving inference speed. The conversion also reduced the model size by approximately half, shortening the time to upload the updated model to the satellite and thereby reducing the risk of packet loss during transmission.
4.3. Development Scheme for the Application Module
For each unit in the application module, a tailored development approach was adopted according to its functional role and deployment requirements, as shown in the Table Ⅱ. The controller was implemented in C++ to maintain interface consistency with the control module. Shared memory was used for communication between the controller and the control module, while a command line interface (CLI) was adopted by the controller to invoke the preprocessing and deep learning inference units. This design decouples multiple functions, facilitating on-orbit updates and maintenance.
The preprocessing unit was implemented in CUDA C++, a C++-based parallel computing programming framework developed for NVIDIA GPUs. CUDA C++ enables computations to be executed on GPUs by distributing data-parallel operations across a large number of GPU cores. In this study, it was used to accelerate contrast stretching, including the extraction of the 2nd and 98th percentile pixel values, pixel value clipping, and linear rescaling. These operations involve large-scale matrix computations, making them well suited for GPU-based parallel acceleration. Thrust, a parallel algorithm library built on CUDA C++, was further used to simplify the implementation.
For the deep learning inference unit, EOLO model was converted into the Open Neural Network Exchange (ONNX) format. ONNX stores the model architecture and trained parameters in a single file and provides excellent compatibility across operating systems and hardware platforms. Models developed using mainstream deep learning frameworks, such as PyTorch and TensorFlow, on Windows or Linux systems can be converted into this format and deployed compatibly on the onboard processing platform. This facilitates model development, maintenance, and extension. The ONNX model was then executed using ONNX Runtime, an inference engine for ONNX models that supports GPU-accelerated inference.
When deploying these units on the HS-1, storage capacity was a key constraint. The onboard computing payload stores backup copies of both the onboard operating system and the onboard processing system on the eMMC for fault recovery. The total storage budget for each onboard processing system, including the control, imaging, and application modules, is limited to approximately 5 GB. However, a complete runtime environment can occupy far more storage space than this limit. For example, the CUDA toolkit alone requires approximately 3.5 GB.
To reduce the storage requirement, we adopted two strategies. First, each unit was compiled on ground-based hardware identical to the onboard computing units. The resulting executable binaries were uploaded for onboard deployment. This strategy eliminated the need to carry compilation tools onboard, thereby reducing storage consumption. Besides, it ensures consistency between the ground-based hardware and the onboard hardware, thereby facilitating subsequent issue reproduction, system maintenance, and functional updates. Second, we analyzed the external library dependencies of each executable binary and packaged only the necessary library files, rather than deploying complete software packages. With these strategies, the runtime environment for the application module was reduced to approximately 1.1 GB.

Table 2.
Technologies Used in the Onboard Application Module.
| Function | Technology | Description |
| Workflow control | C++ | Maintains interface consistency with the control module and manages the application workflow. |
| Module communication | Shared memory and command line interface | Supports parameter exchange with the control module and invocation of preprocessing and inference units. |
| Image preprocessing | CUDA C++ and Thrust | Accelerates percentile extraction, pixel clipping, and linear rescaling through GPU-based parallel computation. |
| Deployment of Deep learning model | Open Neural Network Exchange (ONNX) | Provides a model representation compatible with the onboard platform, containing both the network architecture and trained parameters. |
| Deep learning inference | ONNX Runtime | Enables GPU-accelerated inference of the ONNX model on the onboard platform. |
5. Results
5.1. Evaluation Metrics
The application module was quantitatively evaluated in terms of accuracy, processing time, power consumption, and memory usage. Three accuracy metrics were used: Precision, Recall, and F1, as defined in Eqs. (1)-(3).
Here, TP, FP and FN denote the numbers of true positives, false positives, and false negatives, respectively. Precision measures the proportion of correctly detected eddies among all detected targets, while Recall measures the proportion of correctly detected eddies among all targets. The F1 provides a balanced measure of detection performance by combining Precision and Recall.
Processing time is defined as the total time required to complete the onboard application workflow, including image preprocessing and ocean eddy detection. Power consumption is evaluated using peak power consumption (PPC), which represents the maximum instantaneous power demand during processing. Memory usage is evaluated using peak memory usage (PMU), which represents the maximum memory demand during the workflow.
5.2. On-Orbit Experimental Results
The volume of the downlinked on-orbit application results was approximately 3 MB per scene. These included preprocessed PNG images, JPG images with the detection results overlaid, and XML files containing the coordinates of the four image corners. Figure 5 presents all scenes in Subset A that contain eddies, together with their on-orbit detection results. Using the threshold configuration described in Section 4.2, all five eddies were successfully detected.
To further evaluate the runtime performance and resource consumption of the application module, seven tasks were reproduced on ground-based hardware identical to the onboard computing units. For each task, the processing time (Time), number of processed images (Number), PPC, and PMU were recorded, as summarized in Table 3. A total of 5-7 images were processed in each task, corresponding to 2-4 images per GPU. The total processing time ranged from 11.1 to 13.5 s, with an average processing time of 3.4-6.1 s per scene. Additionally, the resource usage of the computing units was monitored at 5 ms intervals during processing. The maximum PPC was 13.77 W, and the maximum PMU was 2.74 GB, which accounted for only a small fraction of the available 32 GB shared memory. These results demonstrate that the developed application module can complete onboard eddy detection within a short processing time while maintaining moderate power and memory consumption.
5.3. Accuracy Evaluation for Threshold Refinement
To further improve the performance of EOLO, the two empirically selected thresholds described in Section Ⅳ-B were refined after HS-1 data became available. Since the IoU threshold had a relatively limited influence on the detection accuracy, it was adjusted first. As shown in Figure 5(c) and (d), duplicate bounding boxes were produced for the same eddy. To suppress these duplicate boxes more effectively, the IoU threshold was reduced from 0.5 to 0.2.
The confidence threshold was then optimized to improve detection completeness. When the confidence threshold was set to 0.1, only one false positive was observed, as shown in Figure 5(b), indicating that the threshold could be further relaxed with a limited risk of introducing false positives. This adjustment was particularly important for non-specialist users, for whom missing eddies is generally less acceptable than including a small number of false alarms. Therefore, the confidence threshold was varied from 0.10 to 0.02 in steps of 0.02 and evaluated using Subset B. As shown in Table 4, the highest F1 scores were obtained at confidence thresholds of 0.06 and 0.08. Because the recall was higher at 0.06, indicating better detection completeness, 0.06 was selected as the final confidence threshold. The thresholds were updated through the ground-to-satellite uplink.
Figure 6 shows representative results obtained with an IoU threshold of 0.2 and a confidence threshold of 0.06. In Figure 6(a)-(d) and Figure 6(f), all eddies were successfully detected. One false positive appears in Figure 6(d), possibly caused by complex eddy-like sea-surface texture. In Figure 6(e), one annotated eddy is missed, likely because its surface signature is not clearly distinguishable.
6. Discussions and Conclusions
In this study, we developed an AI-based application module for HS-1 and achieved the first on-orbit implementation of ocean eddy detection. The module adopted a modular architecture that integrates multiple programming and deployment technologies. On-orbit experiments demonstrated that the module could operate stably on the HS-1 platform. Further evaluation showed that, after threshold adjustment, EOLO model originally developed for Sentinel-1 imagery achieved an F1 score of 78% on HS-1 onboard imagery, providing a quantitative baseline for future cross-sensor model adaptation.
Notably, to support reliable on-orbit operation, the development of the application module was guided by three considerations: facilitating post-launch updates and maintenance, improving computational efficiency, and minimizing storage demand. First, the module was organized into three units implemented as independent programs, so that each unit can be updated or replaced separately after launch. In addition, after evaluating several mainstream deep learning deployment solutions, we selected ONNX as the implementation framework for the deep learning inference unit. Models developed with mainstream deep learning frameworks, such as PyTorch and TensorFlow, across different operating systems and hardware platforms can be converted into a unified ONNX file compatible with the onboard runtime environment. By comparison, PyTorch offers less flexibility for expansion because models developed in other frameworks, such as TensorFlow, are not compatible with its runtime environment. Although TensorRT, which is widely used in embedded AI applications, can further improve inference efficiency, its inference engines are strongly dependent on specific operating systems, software stacks, and hardware architectures, potentially leading to compatibility issues. Developers therefore generally need to build, optimize, and validate TensorRT engines in an environment closely matching the onboard hardware and software configuration, which increases the costs of development, updating, and maintenance. More importantly, unlike conventional ground-based embedded systems, satellites cannot be physically accessed for onsite debugging or maintenance after launch. Once incompatibility arises, troubleshooting and functional recovery must rely on limited telemetry and satellite-to-ground communication links, resulting in high operational costs. Second, we used CUDA C++ and ONNX Runtime to accelerate image preprocessing and deep learning inference on the GPU, respectively, thereby improving the utilization of onboard computing resources. Finally, to minimize the storage footprint of the runtime environment, we compiled the programs on the ground and deployed only the necessary external dependencies for execution. This avoided carrying compilation tools and complete external libraries.
In addition, given the widespread use of YOLO-based models for ocean eddy detection in SAR imagery, we selected EOLO as a representative model for onboard implementation. The resulting on-orbit tests and parameter-tuning experiments offer practical guidance for deploying existing ocean eddy detection models onboard satellites. It should be noted that the threshold adjustment strategy represents only a preliminary engineering adaptation. To support operational applications, more advanced methods, such as transfer learning, domain adaptation, and continual learning, should be investigated to improve the ability of the learned features to generalize across sensors. Establishing a benchmark for evaluating cross-sensor generalization is also necessary. Such a benchmark would enable objective comparisons and facilitate the development of more generalizable methods. Meanwhile, another challenge for operational application is the limited spatial coverage of the current onboard imaging mode. Ocean eddies can range from tens to several hundred kilometers in size. Stripmap mode may not capture the complete structure of larger eddies. Therefore, onboard implementation of ScanSAR imaging is needed.
In the future, the module is expected to be extended to a wider range of ocean monitoring applications, such as internal wave detection and ship detection. For such tasks, deployment can be achieved by uploading the ONNX model file of the corresponding deep learning algorithm. In addition, the module will be further applied to subsequent satellites in the Haishao constellation, thereby enabling the establishment of a satellite network for ocean monitoring with onboard processing capability. The module has been deployed on Haishao-2 for onboard Arctic sea ice extraction, supporting operational Arctic navigation services. This application will be reported in our future work.
Author Contributions
Conceptualization, Xiao-Ming Li, Haotian Yuan and Jili Sun; methodology, Haotian Yuan, Nannan Zi, and Xiao-Ming Li; software, Haotian Yuan and Nannan Zi; validation, Haotian Yuan, Nannan Zi and Zhan Liu; formal analysis, Haotian Yuan and Nannan Zi; resources, Xiao-Ming Li; writing—original draft preparation, Haotian Yuan; writing—review and editing, Xiao-Ming Li and Ke Wu; visualization, Haotian Yuan, Nanan Zi and Han Fu; supervision,Xiao-Ming Li; funding acquisition, Xiao-Ming Li. All authors have read and agreed to the published version of the manuscript.
Funding
This work was supportted by Hainan Province Science and Technology Special Fund (Grant No. , ATIC-2023010004 and ATIC-2024010001).
Data Availability Statement
The data used in this study are commercial data but are available from the corresponding author upon request.
Acknowledgments
The authors would like to thank AIRSAT for its support during the on-orbit testing of the Haishao-1 onboard processing system.
Conflicts of Interest
The authors declare that they have no known competing financial interests or personal relationships that could have appeared to influence the work reported in this paper.
References
- NASA Earthdata. Data processing levels. Available online: https://www.earthdata.nasa.gov/learn/earth-observation-data-basics/data-processing-levels (accessed on 17 October 2026).
- Copernicus Dataspace. Sentinel-1 documentation overview: Levels 0–2 and ground segment processing. Available online: https://documentation.dataspace.copernicus.eu/Data/SentinelMissions/Sentinel1.html (accessed on 17 October 2026).
- Bierens, L.H.J.; Van Heijster, R.; van Bezouwen, H. Data reduction using real-time on-board satellite SAR processing; ESA/ESTEC: Noordwijk, The Netherlands, 1994. [Google Scholar]
- McLeod, I.H.; Cumming, I.G.; Seymour, M.S. ENVISAT ASAR data reduction: Impact on SAR interferometry. IEEE Trans. Geosci. Remote Sens. 2002, 36, 589–602. [Google Scholar]
- Doggett, T.; et al. Autonomous detection of cryospheric change with Hyperion on-board Earth Observing-1. Remote Sens. Environ. 2006, 101, 447–462. [Google Scholar] [CrossRef]
- Ip, F.; et al. Flood detection and monitoring with the Autonomous Sciencecraft Experiment onboard EO-1. Remote Sens. Environ. 2006, 101, 463–481. [Google Scholar] [CrossRef]
- Giuffrida, G.; et al. The Φ-Sat-1 mission: The first on-board deep neural network demonstrator for satellite Earth observation. IEEE Trans. Geosci. Remote Sens. 2022, 60, 1–14. [Google Scholar] [CrossRef]
- Razzano, F.; Di Stasio, P.; Mauro, F.; et al. AI techniques for near real-time monitoring of contaminants in coastal waters on board future Φ-sat-2 mission. IEEE J. Sel. Top. Appl. Earth Obs. Remote Sens. 2024, 17, 16755–16766. [Google Scholar] [CrossRef]
- Xu, P.; Li, Q.; Zhang, B.; Wu, F.; Zhao, K.; Du, X.; Yang, C.; Zhong, R. On-board real-time ship detection in HISEA-1 SAR images based on CFAR and lightweight deep learning. Remote Sens. 2021, 13. [Google Scholar] [CrossRef]
- Xu, X.; Zhang, X.; Zhang, T. Lite-YOLOv5: A lightweight deep learning detector for on-board ship detection in large-scene Sentinel-1 SAR images. Remote Sens. 2022, 14, 1018. [Google Scholar] [CrossRef]
- Yang, G.; et al. Algorithm/hardware codesign for real-time on-satellite CNN-based ship detection in SAR imagery. IEEE Trans. Geosci. Remote Sens. 2022, 60, 5226018. [Google Scholar] [CrossRef]
- Yao, Y.; et al. On-board ship detection in micro-nano satellite based on deep learning and COTS component. Remote Sens. 2019, 11, 762. [Google Scholar] [CrossRef]
- Xu, M.; et al. FPGA-based implementation of ship detection for satellite on-board processing. IEEE J. Sel. Top. Appl. Earth Obs. Remote Sens. 2022, 15, 9733–9745. [Google Scholar] [CrossRef]
- Xu, M.; et al. System design for on-board multi-mission compatibility of spaceborne SAR. Electronics 2025, 15, 62. [Google Scholar] [CrossRef]
- Payandeh, A.R.; et al. The occurrence, variability, and potential drivers of submesoscale eddies in the Southern California Bight based on a decade of high-frequency radar observations. J. Geophys. Res. Ocean. 2023, 128, e2023JC019914. [Google Scholar] [CrossRef]
- Dong, C.; McWilliams, J.C.; Liu, Y.; Chen, D. Global heat and salt transports by eddy movement. Nat. Commun. 2014, 5, 3294. [Google Scholar] [CrossRef] [PubMed]
- Omand, M.M.; D’Asaro, E.A.; Lee, C.; Perry, M.J.; Briggs, N.; Cetinić, I.; Mahadevan, A. Eddy-driven subduction exports particulate organic carbon from the spring bloom. Science 2015, 348, 222–225. [Google Scholar] [CrossRef] [PubMed]
- Storer, B.A.; Buzzicotti, M.; Khatri, H.; Pouquet, A.; Bracco, A. Global cascade of kinetic energy in the ocean and the atmospheric imprint. Sci. Adv. 2023, 9, eadi7420. [Google Scholar] [CrossRef] [PubMed]
- Kaiser, M.J.; Pulsipher, A.G. The impact of weather and ocean forecasting on hydrocarbon production and pollution management in the Gulf of Mexico. Energy Policy 2007, 35, 966–983. [Google Scholar] [CrossRef]
- Zi, N.; Li, X.-M.; Gade, M.; Fu, H.; Min, S. Ocean eddy detection based on YOLO deep learning algorithm by synthetic aperture radar data. Remote Sens. Environ. 2024, 307, 114139. [Google Scholar] [CrossRef]
- Zi, N.; Li, X.-M.; Yuan, H.; Cai, K. Deep learning for eddy detection in the Arctic marginal ice zone by spaceborne SAR. IEEE J. Sel. Top. Appl. Earth Obs. Remote Sens. 2025, 18, 22951–22964. [Google Scholar] [CrossRef]
- Sandalyuk, N.; Khachatrian, E. Automatic eddy detection in the MIZ based on YOLO algorithm and SAR images. Sci. Remote Sens. 2025, 100228. [Google Scholar] [CrossRef]
- Jiang, F.; Li, X.; Liu, Y.; Ren, Y. Deep learning detection and analysis of eddies in the East Greenland marginal ice zone from Sentinel-1 SAR imagery. Remote Sens. Environ. 2026, 334, 115177. [Google Scholar] [CrossRef]
- Zhang, S.; Li, X.; Zhang, X. Internal wave signature extraction from SAR and optical satellite imagery based on deep learning. IEEE Trans. Geosci. Remote Sens. 2023, 61, 1–16. [Google Scholar] [CrossRef]
- Cao, C.; et al. A novel method for ocean wave spectra retrieval using deep learning from Sentinel-1 wave mode data. IEEE Trans. Geosci. Remote Sens. 2024, 62, 1–16. [Google Scholar] [CrossRef]
- Xu, M.; et al. End-to-end pixel-wisely detection of oceanic eddy on SAR images with stacked attention network. IEEE J. Sel. Top. Appl. Earth Obs. Remote Sens. 2023, 16, 9711–9724. [Google Scholar] [CrossRef]
- Li, X.-M.; Chang, L.; Zhou, J.; Sun, J.; Lu, X.; Han, X.; Wang, J.; Lu, H.; Li, X.; Wang, N.; Qiu, Y.; Wu, Y. Haishao-1 satellite: Low-inclination orbit spaceborne synthetic aperture radar. The Innovation 2025, 6, 100949. [Google Scholar] [CrossRef] [PubMed]
- Moreira, A.; Mittermayer, J.; Scheiber, R. Extended chirp scaling algorithm for air- and spaceborne SAR data processing in stripmap and ScanSAR imaging modes. IEEE Trans. Geosci. Remote Sens. 1996, 34, 1123–1136. [Google Scholar] [CrossRef]
- Pujol, M.-I.; Larnicol, G. Mediterranean Sea eddy kinetic energy variability from 11 years of altimetric data. J. Mar. Syst. 2005, 58, 121–142. [Google Scholar] [CrossRef]
- Escudier, R.; et al. Eddy properties in the Western Mediterranean Sea from satellite altimetry and a numerical simulation. J. Geophys. Res. Ocean. 2016, 121, 3990–4006. [Google Scholar] [CrossRef]
- Cotroneo, Y.; et al. Connectivity analysis applied to mesoscale eddies in the Western Mediterranean Basin. Remote Sens. 2021, 13, 4228. [Google Scholar] [CrossRef]
- Traba, C.C.; Rijlaarsdam, D.; Guo, J.; Del Prete, R.; Meoni, G. Towards onboard thermal hotspots segmentation with raw multispectral satellite imagery. Int. J. Appl. Earth Obs. Geoinf. 2026, 146, 10509. [Google Scholar] [CrossRef]
Figure 1.
Architecture of the onboard processing system, which includes three modules: control, imaging, and application. The control module generates imaging and application parameters and packages the results for downlink. The imaging module performs SAR focusing, corrections, and L2 data generation. The application module conducts image preprocessing and deep learning inference.
Figure 1.
Architecture of the onboard processing system, which includes three modules: control, imaging, and application. The control module generates imaging and application parameters and packages the results for downlink. The imaging module performs SAR focusing, corrections, and L2 data generation. The application module conducts image preprocessing and deep learning inference.
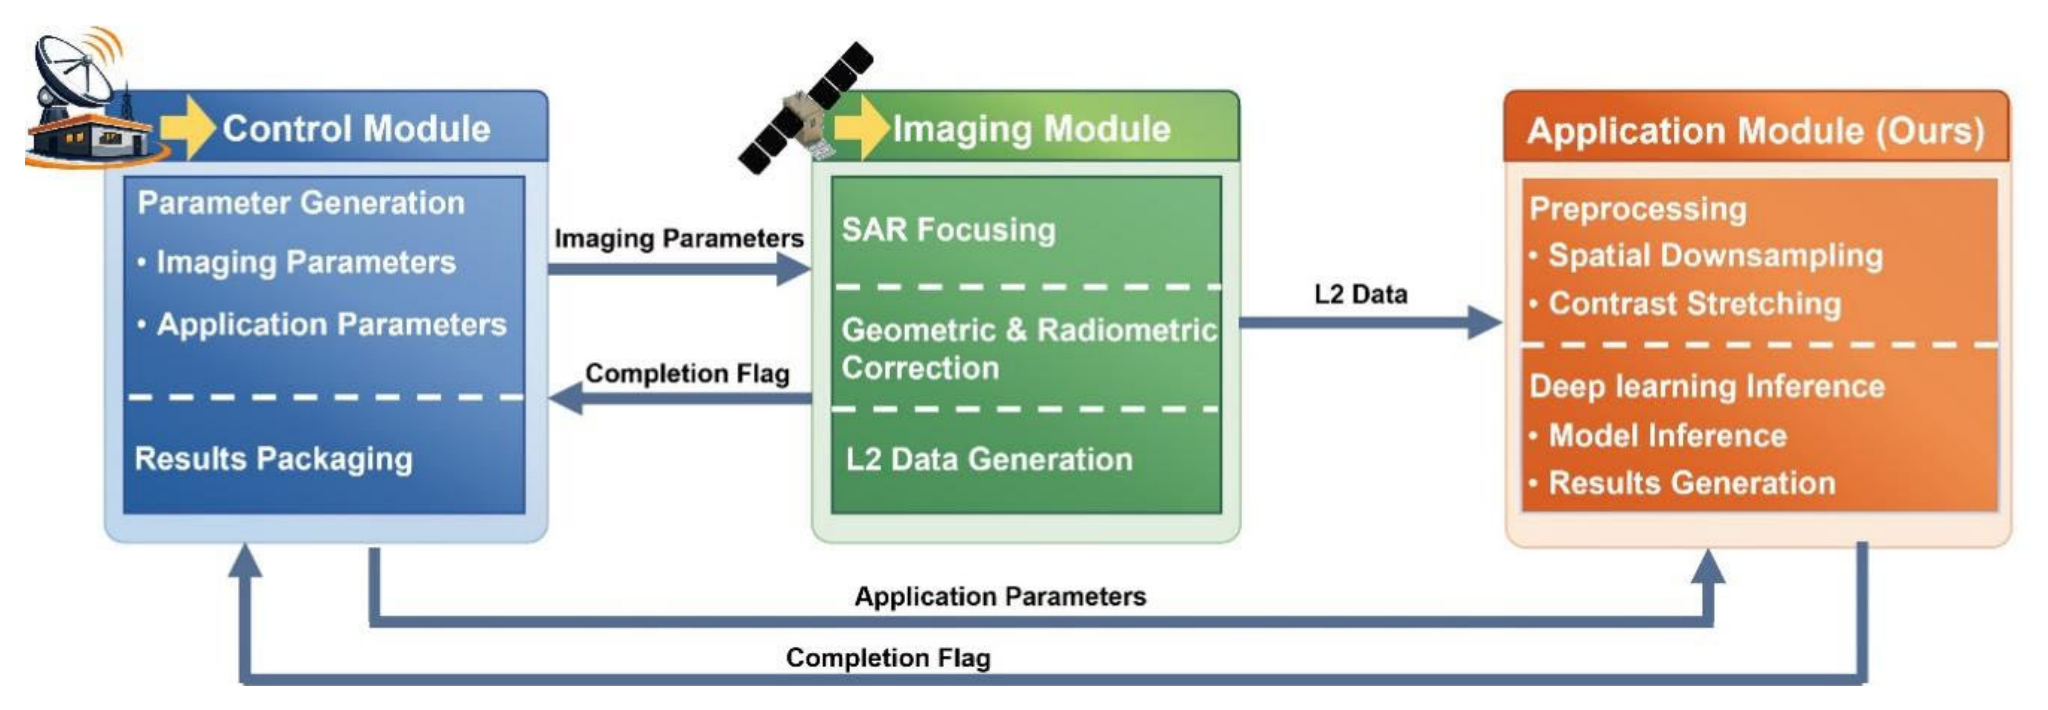
Figure 2.
Examples of HS-1 onboard imagery acquired in stripmap mode with VV polarization.
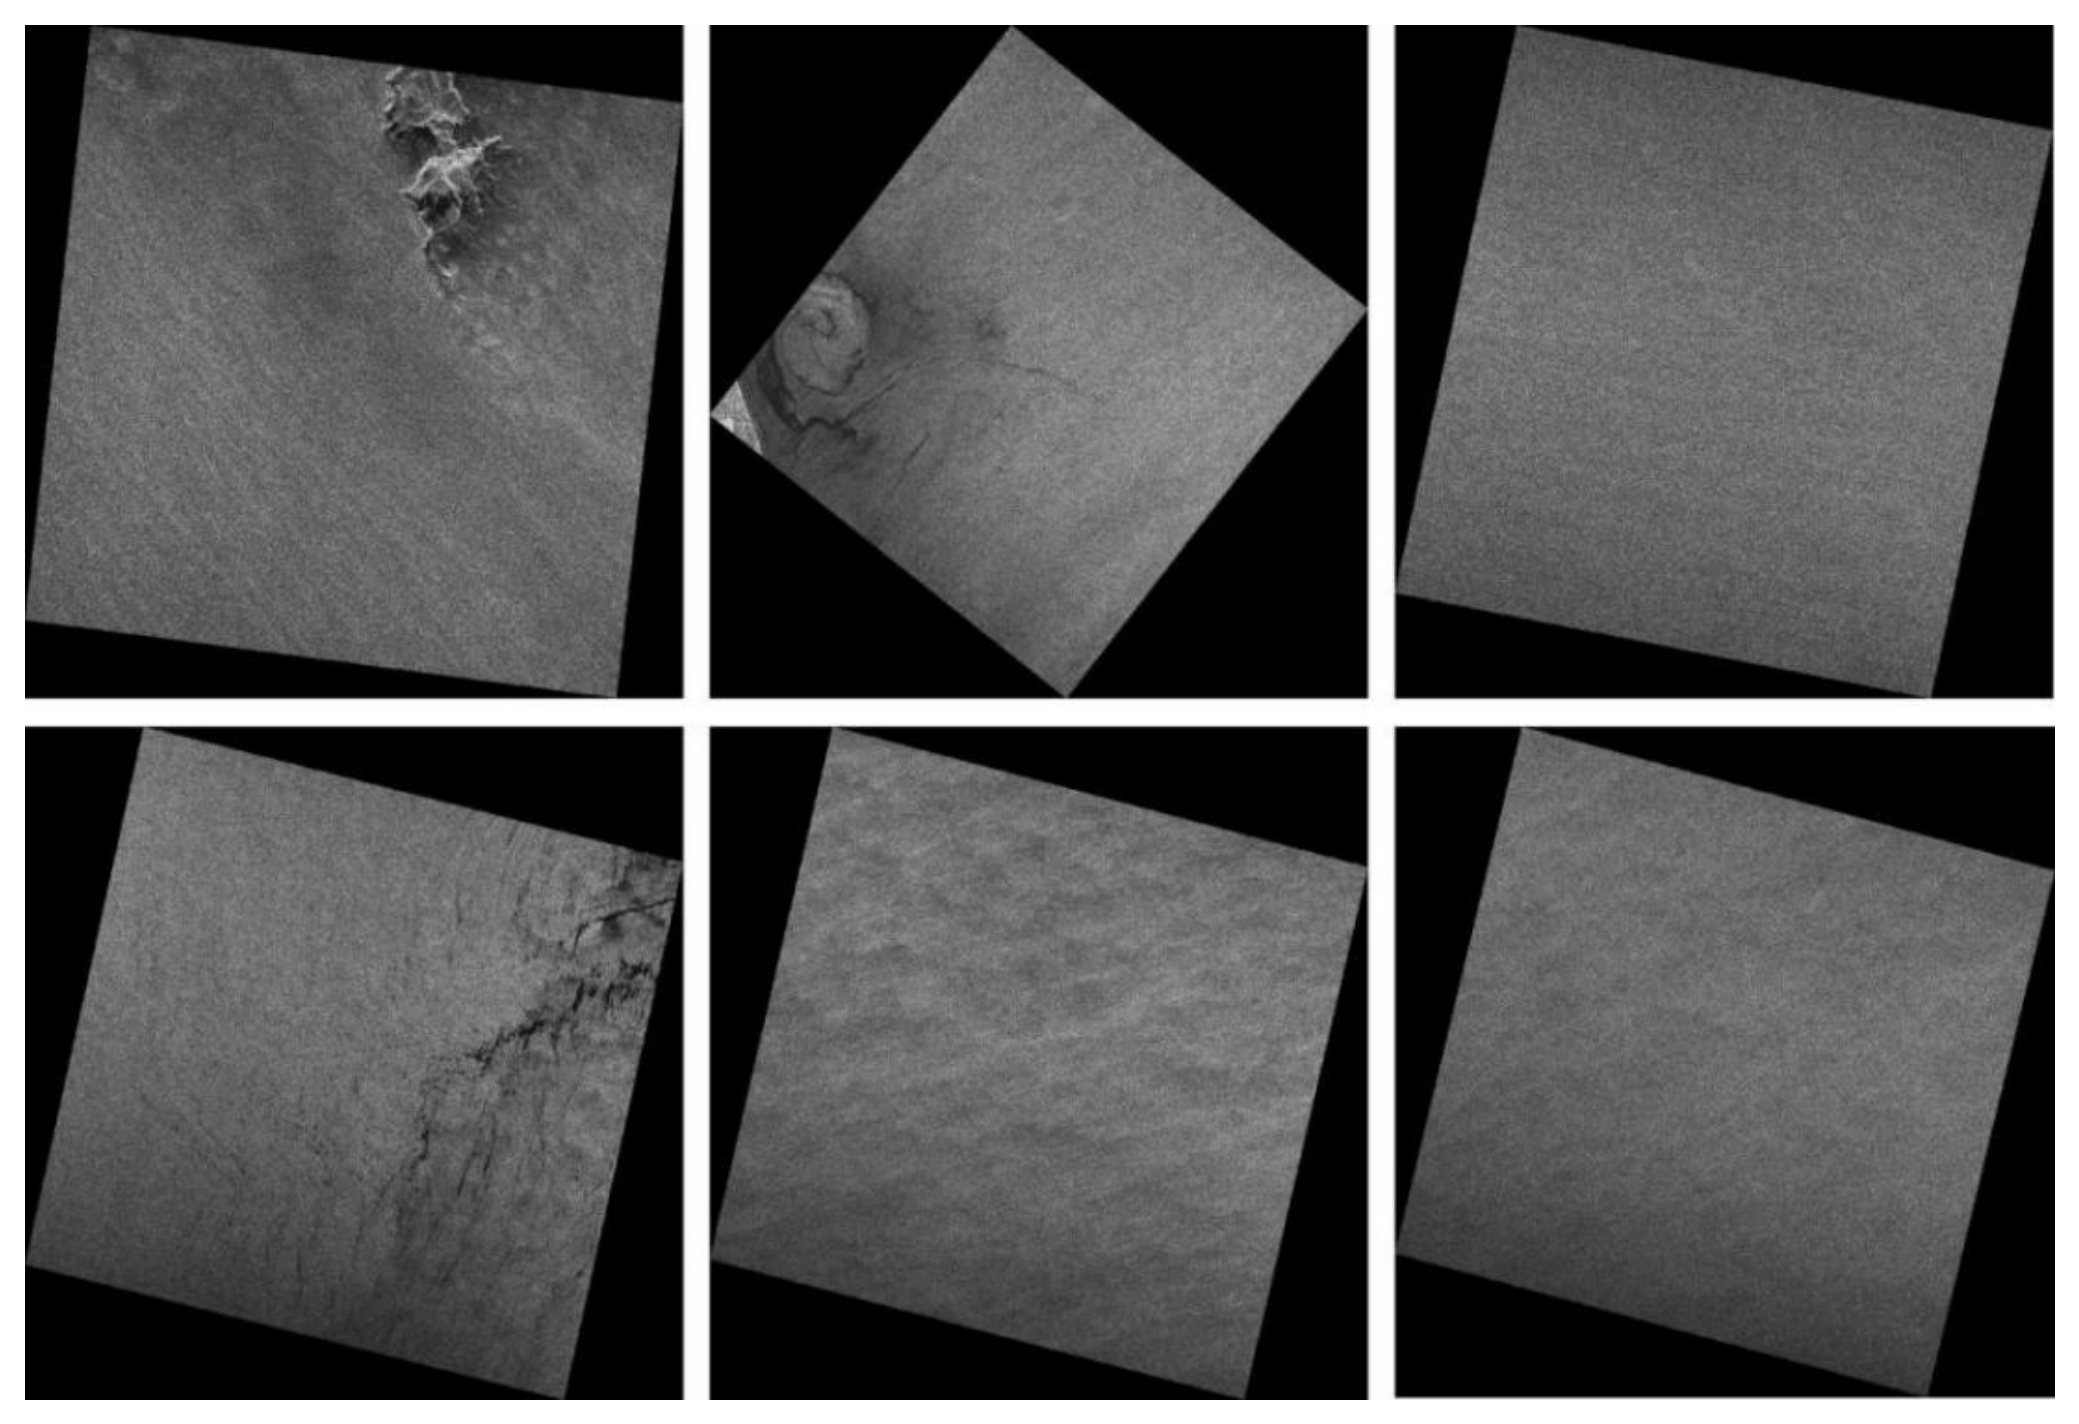
Figure 3.
Spatial distribution of the data used. Yellow boxes indicate the on-orbit data, and red boxes indicate the data processed on the ground using hardware identical to the onboard computing units. Panel (a) shows the spatial distribution of the data in the western Mediterranean. Panels (b) and (c) show data from the U.S. East Coast, including Florida and the area near the entrance to Chesapeake Bay, respectively.
Figure 3.
Spatial distribution of the data used. Yellow boxes indicate the on-orbit data, and red boxes indicate the data processed on the ground using hardware identical to the onboard computing units. Panel (a) shows the spatial distribution of the data in the western Mediterranean. Panels (b) and (c) show data from the U.S. East Coast, including Florida and the area near the entrance to Chesapeake Bay, respectively.
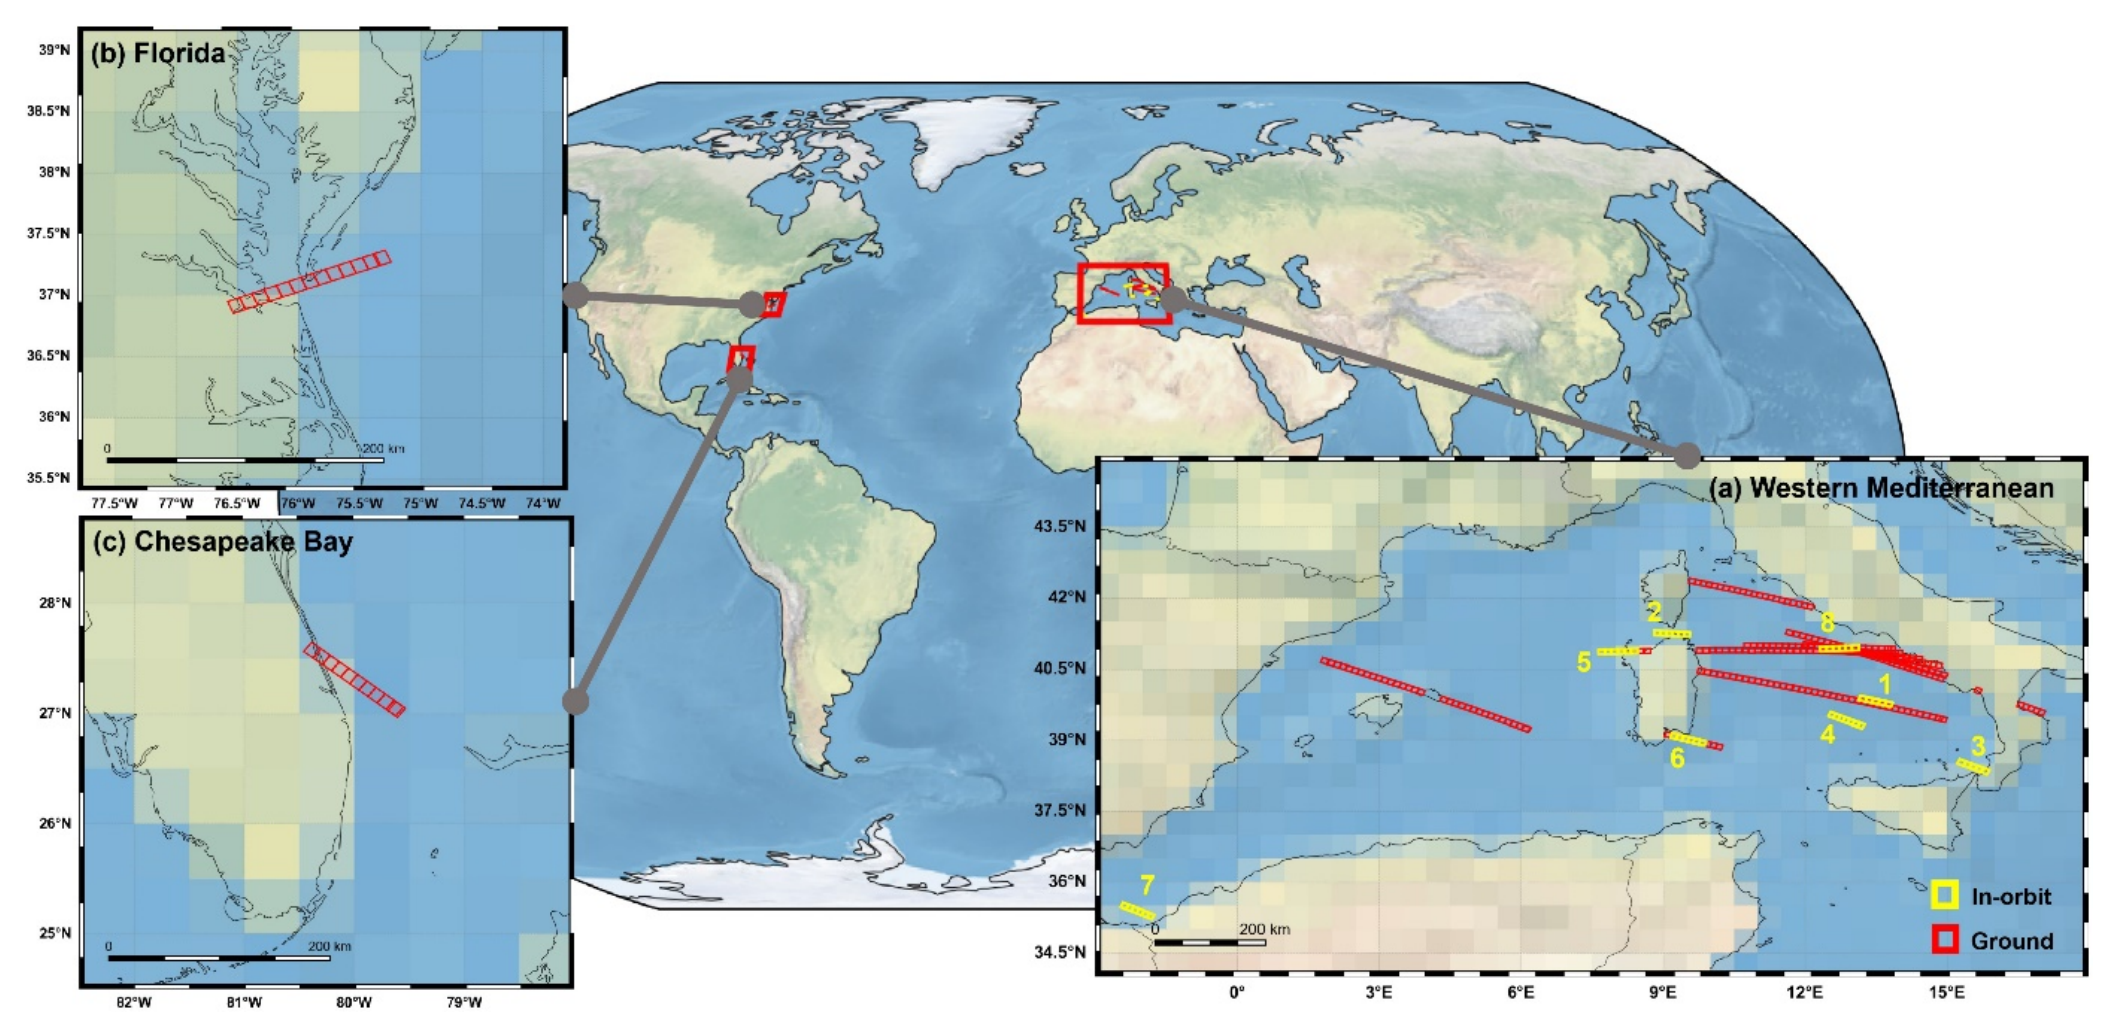
Figure 4.
Workflow of the application module, which consists of a controller, a preprocessing unit, and a deep learning inference unit. SM and CLI denote the shared memory and command line interface, respectively, which are used for communication between programs.
Figure 4.
Workflow of the application module, which consists of a controller, a preprocessing unit, and a deep learning inference unit. SM and CLI denote the shared memory and command line interface, respectively, which are used for communication between programs.
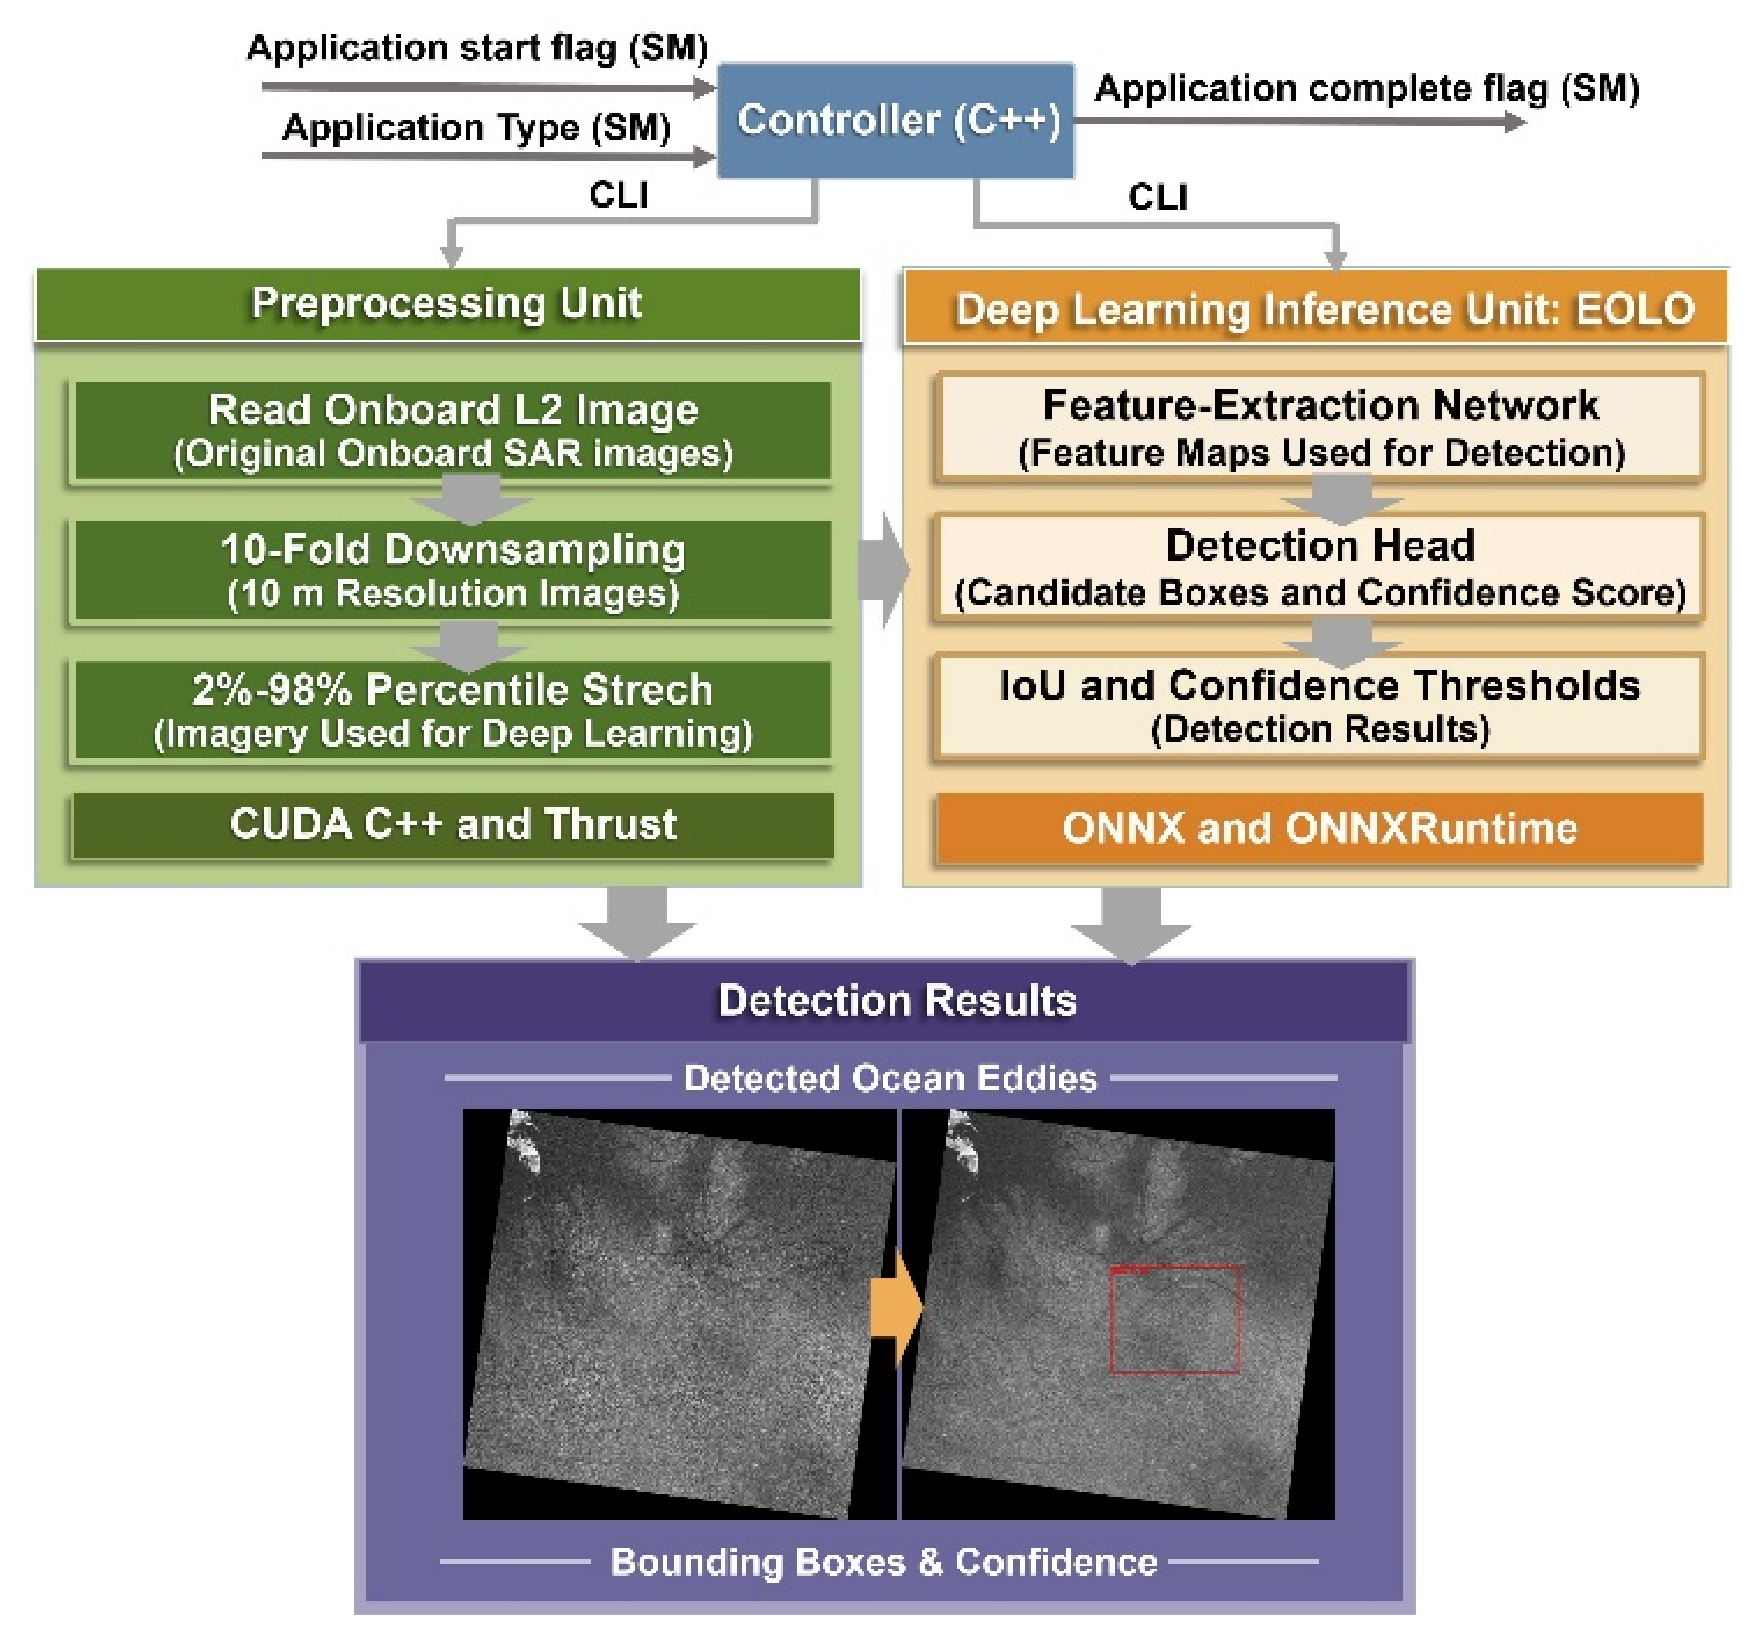
Figure 5.
Eddy detection results downlinked from HS-1. In each panel, the upper-left and upper-right annotations indicate the scene-center coordinates and acquisition date, respectively.
Figure 5.
Eddy detection results downlinked from HS-1. In each panel, the upper-left and upper-right annotations indicate the scene-center coordinates and acquisition date, respectively.
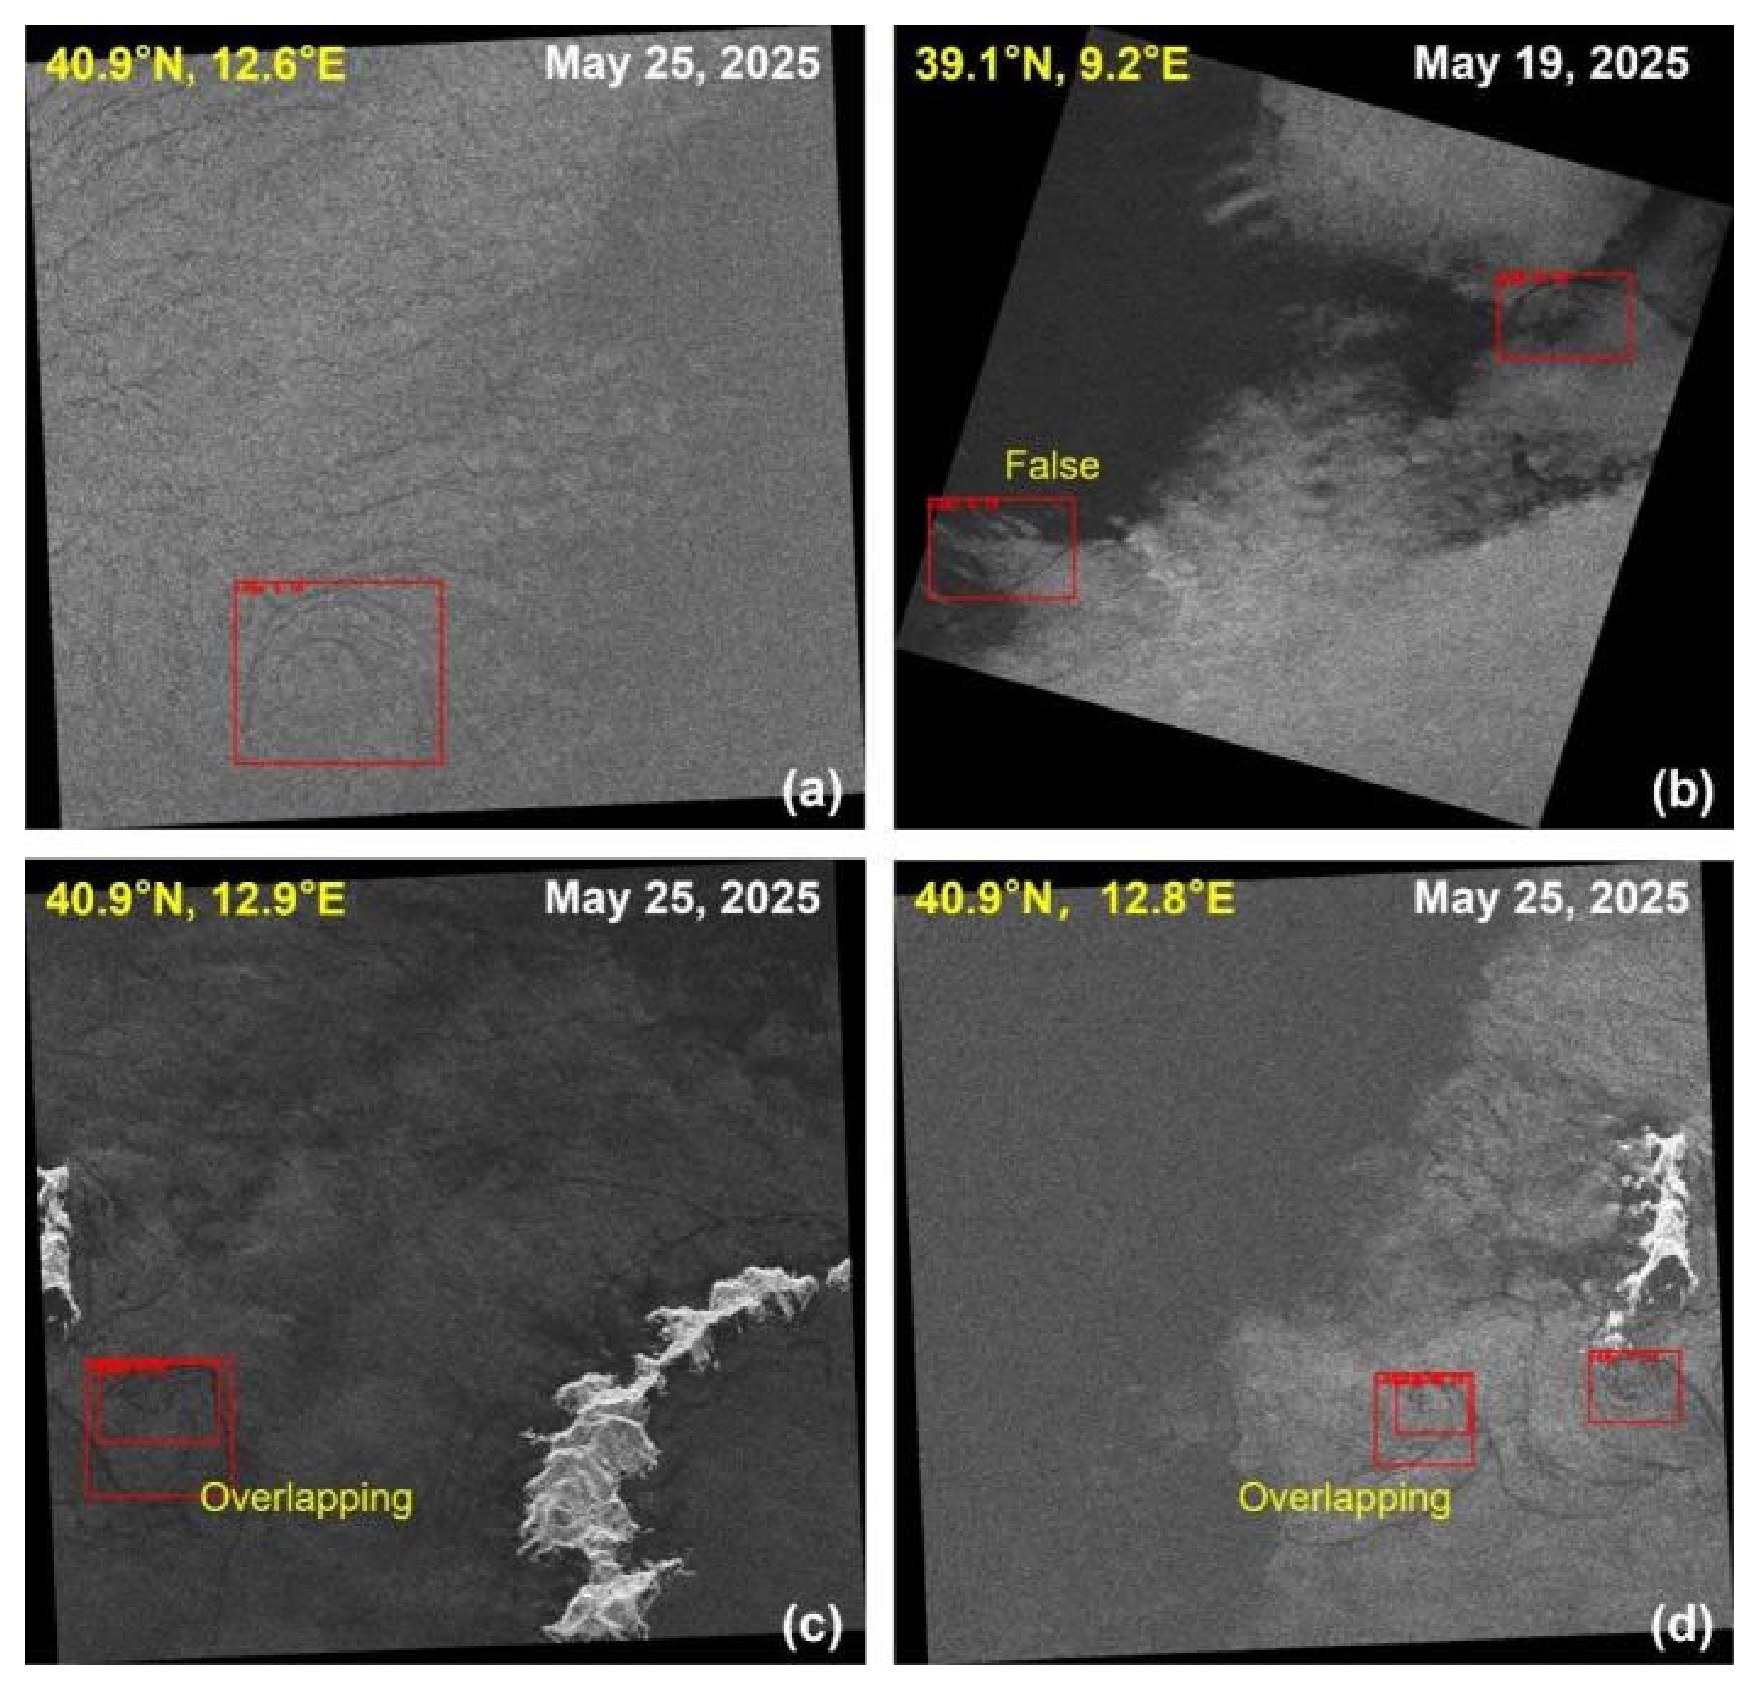
Figure 6.
Examples of eddy detection results with an IoU threshold of 0.2 and a confidence threshold of 0.06. Scene-center coordinates and acquisition date are annotated in the upper-left and upper-right corners, respectively.
Figure 6.
Examples of eddy detection results with an IoU threshold of 0.2 and a confidence threshold of 0.06. Scene-center coordinates and acquisition date are annotated in the upper-left and upper-right corners, respectively.
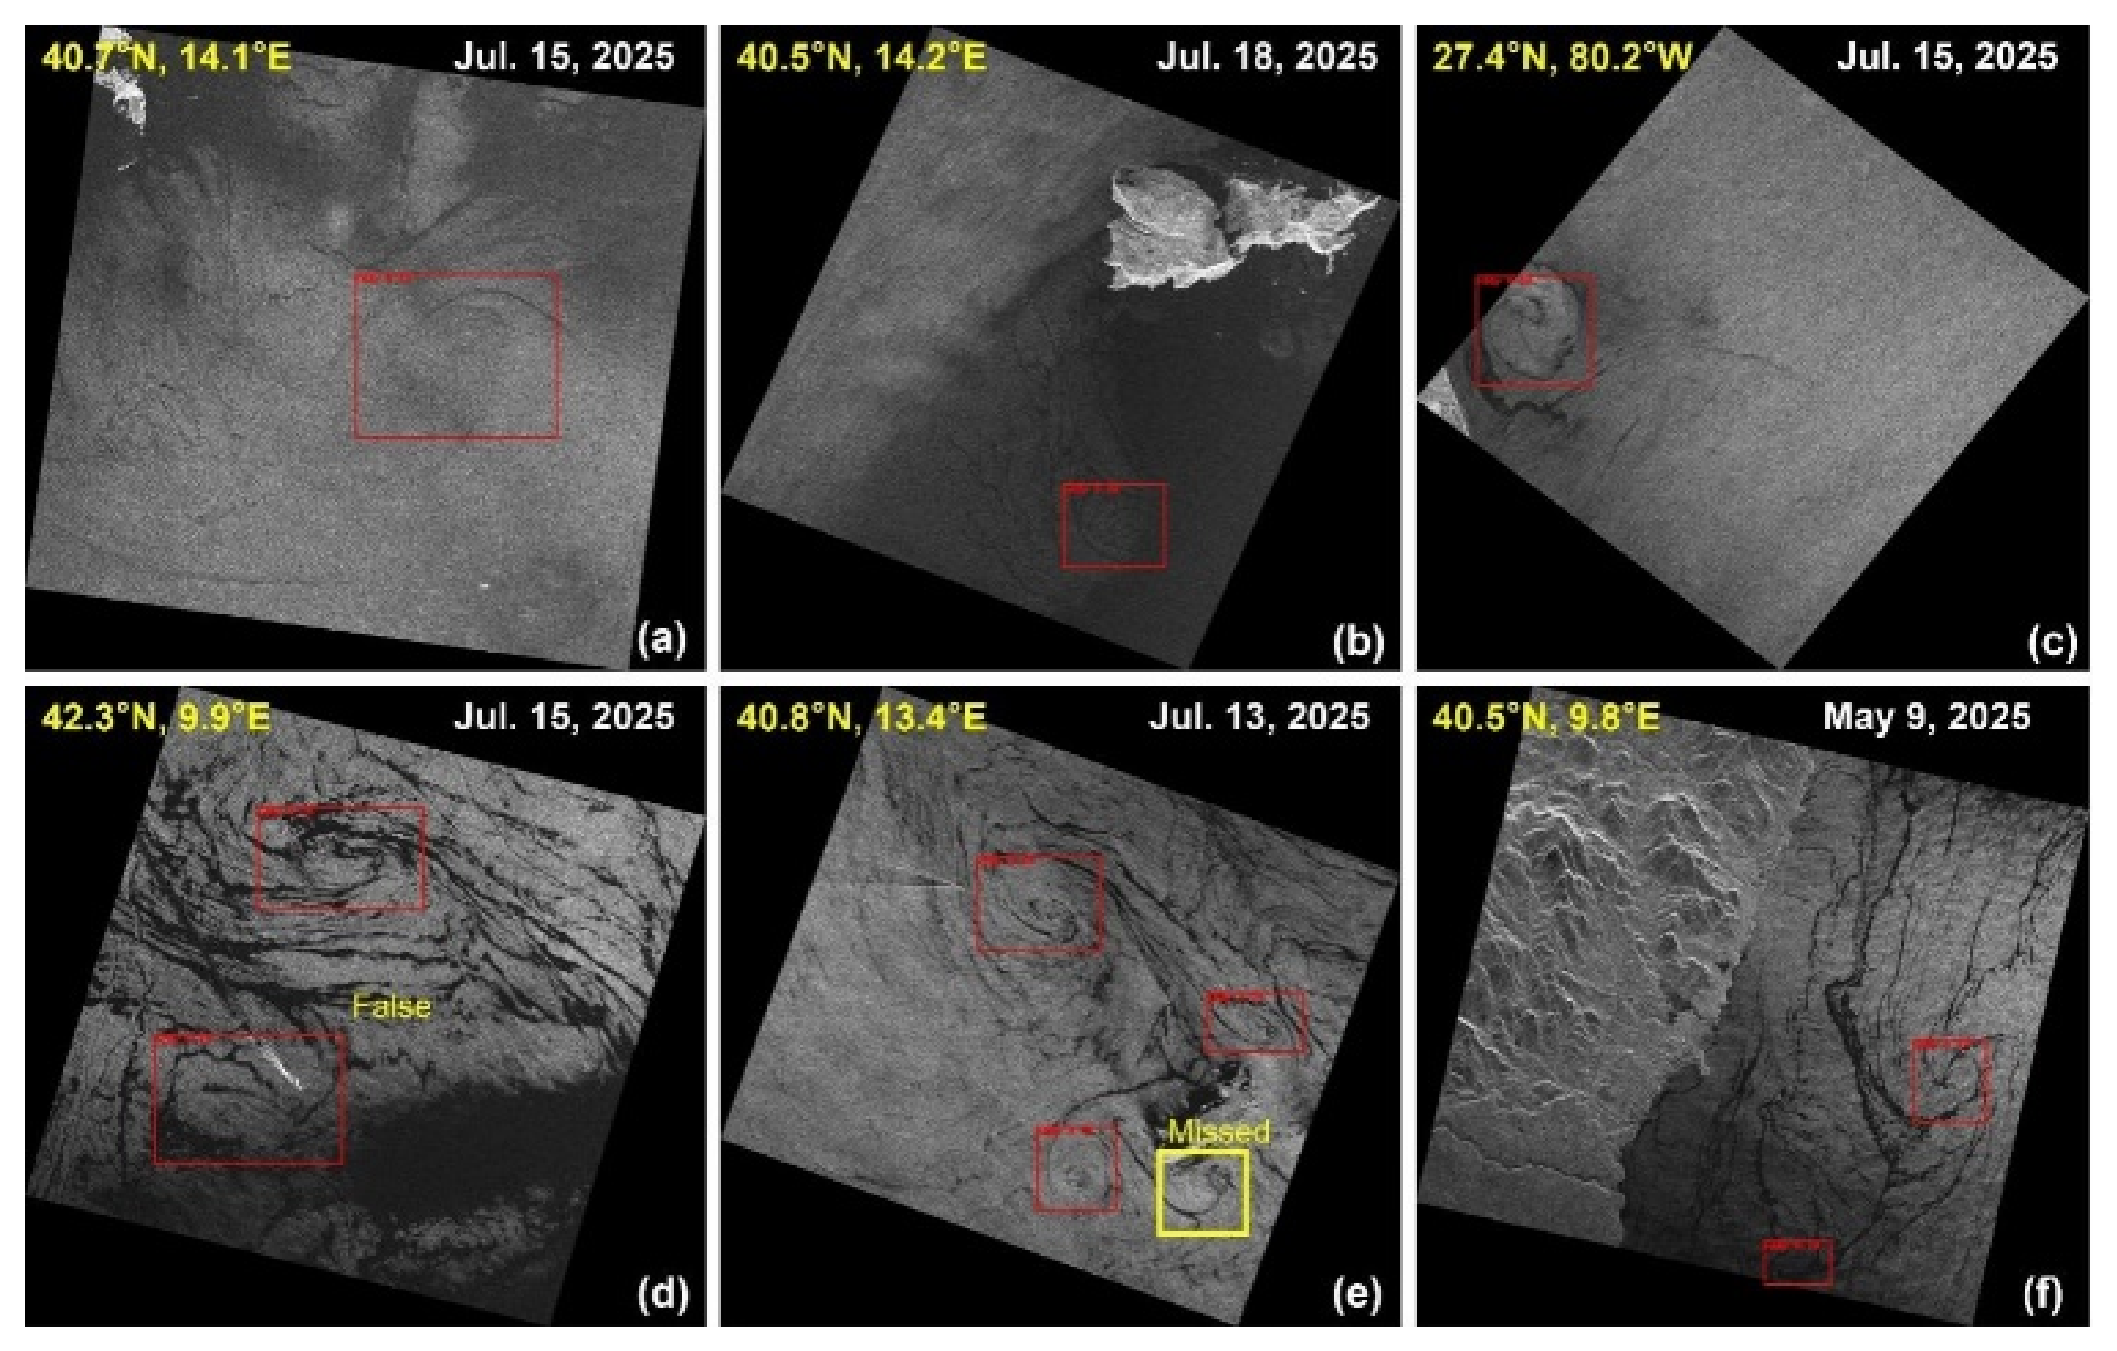
Table 1.
Control Parameters of the Onboard Processing System.
| Parameter type | Parameter name | Description |
| Imaging parameters | imaging start flag | Triggers the imaging module to start SAR imaging. |
| observation mode | Specifies the SAR imaging mode, such as stripmap or scan mode. Currently, only stripmap mode is supported. | |
| polarization mode | Specifies the polarization mode used for SAR imaging. | |
| echo segment | Defines the raw echo data segment to be processed by specifying its start and end times. | |
| GPU id | Specifies the GPU used by the imaging module. | |
| imaging complete flag | Indicates completion of SAR imaging and triggers the control module to start the next processing step. | |
| Application parameters | application start flag | Triggers the application module to start processing. |
| application type | Specifies the application task to be executed by the application module. Currently, ocean eddy detection is supported. | |
| application complete flag | Indicates completion of application-level processing and triggers the control module to package the results for downlink. |
Table 3.
Evaluation of seven on-orbit tasks.
| Task | Number | Time | PPC | PMU |
| 1 | 2 | 12.2s | 10.69W | 1.80GB |
| 3 | 13.3s | 10.61W | 1.81GB | |
| 2 | 3 | 12.5s | 10.73W | 1.81GB |
| 3 | 12.9s | 11.19W | 2.74GB | |
| 3 | 2 | 11.1s | 10.65W | 1.92GB |
| 3 | 13.5s | 10.61W | 1.93GB | |
| 4 | 3 | 12.7s | 13.37W | 2.69GB |
| 4 | 13.5s | 13.65W | 1.81GB | |
| 5 | 3 | 12.9s | 12.25W | 2.31GB |
| 3 | 13.0s | 10.69W | 2.13GB | |
| 6 | 3 | 12.8s | 10.50W | 2.13GB |
| 3 | 13.1s | 13.77W | 1.89GB | |
| 7 | 3 | 13.2s | 13.19W | 1.87GB |
| 3 | 13.0s | 10.30W | 1.79GB |
Table 4.
Performance of EOLO on HS-1 Onboard Imagery.
| Confidence | Precision | Recall | F1 |
| 0.1 | 0.75 | 0.77 | 0.76 |
| 0.08 | 0.76 | 0.81 | 0.78 |
| 0.06 | 0.71 | 0.87 | 0.78 |
| 0.04 | 0.67 | 0.90 | 0.77 |
| 0.02 | 0.57 | 0.94 | 0.71 |
Disclaimer/Publisher’s Note: The statements, opinions and data contained in all publications are solely those of the individual author(s) and contributor(s) and not of MDPI and/or the editor(s). MDPI and/or the editor(s) disclaim responsibility for any injury to people or property resulting from any ideas, methods, instructions or products referred to in the content. |
© 2026 by the authors. Licensee MDPI, Basel, Switzerland. This article is an open access article distributed under the terms and conditions of the Creative Commons Attribution (CC BY) license (http://creativecommons.org/licenses/by/4.0/).
Copyright: This open access article is published under a Creative Commons CC BY 4.0 license, which permit the free download, distribution, and reuse, provided that the author and preprint are cited in any reuse.