

Submitted:
16 October 2026
Posted:
19 October 2026
You are already at the latest version
Abstract
Maize (Zea mays L.) in Peru exhibits extensive phenotypic diversity traditionally classified into races based on morphological characteristics, but quantitative relationships among races remain insufficiently known. In the present analysis, morphological data from 43 Peruvian maize races were analyzed using principal component analysis and hierarchical clustering to identify discriminant descriptors and phenotypic groups. From 68 quantitative descriptors retained after data completeness filtering, nine non-redundant variables associated with leaf, tassel, and ear morphology captured the main patterns of phenotypic variation. The first two principal dimensions explained 77.50% of the total variation, with leaf and tassel traits predominating in the first dimension and ear characteristics in the second. Hierarchical clustering separated the races into four phenotypically differentiated groups characterized by distinct combinations of leaf, tassel, ear, and cob–rachis traits. These groups showed only partial correspondence with the historical racial classification, indicating that quantitative phenotypic similarity represents an additional dimension of maize diversity. The results provide a parsimonious quantitative basis for characterizing Peruvian maize germplasm and support the complementary use of multivariate phenotyping and historical racial classification for conservation and breeding.
Keywords:
amylaceous maize
; Andean region
; genetic diversity
; germplasm conservation
; maize races
; morphological characterization
; multivariate analysis
; plant breeding
1. Introduction
Maize (Zea mays L.) is one of the most widely cultivated cereal crops worldwide, playing a central role in global food systems due to its high productivity, broad adaptability, and diverse end uses [1]. Global maize production reaches approximately 1,137 million tons annually, making it the most produced cereal crop, with applications spanning human consumption, animal feed, and industrial processing [2]. Beyond its economic relevance, maize contributes significantly to food security, particularly in developing regions where it supports rural livelihoods and stabilizes food systems [3]. Its global success is closely linked to its domestication in Mesoamerica around 9,000 years ago and its subsequent diversification, driven by extensive genetic variation and continuous selection processes [4,5]. In the context of increasing demand for food, feed, and bio-based products, maize remains a key component of agricultural systems, although challenges related to resource use, climate variability, and sustainability continue to influence its production [6,7].
In Peru, maize represents a fundamental component of agricultural systems, with a cultivation history spanning several millennia. Archaeological evidence indicates its presence in the region between approximately 6700 and 3000 years BP, supporting early diversification across a wide range of ecological environments following its introduction from Mesoamerica [8]. This long-term cultivation has contributed to the development of substantial genetic diversity, with Peru recognized as one of the main centers of diversity for native maize races adapted to distinct agroecological conditions [9]. In the Andean region, maize is widely cultivated by smallholder farmers under variable environmental conditions, including drought and low temperatures [10]. In addition to its role in agricultural production, maize remains a staple in local diets and is deeply integrated into traditional food systems. Native pigmented varieties have also gained attention due to their content of bioactive compounds and their potential use in functional foods [9]. In the Andean region, maize is widely cultivated by smallholder farmers under variable environmental conditions, including drought and low temperatures [10]. In addition to its role in agricultural production, maize remains a staple in local diets and is deeply integrated into traditional food systems. Native pigmented cultivars have also gained attention due to their content of bioactive compounds —naturally occurring substances such as anthocyanins and phenolics that may confer health benefits—and their potential use in functional foods, which are foods that provide additional health-promoting or disease-preventing properties beyond basic nutrition [9]. These characteristics position maize in Peru as both an agricultural resource and a key component of cultural and economic systems.
Morphological characterization has long been used to describe and differentiate maize germplasm, particularly in regions with high genetic diversity. This approach involves the evaluation of vegetative, reproductive, and kernel traits, including plant height, leaf architecture, ear morphology, kernel type, and grain color, which together reflect phenotypic variation among genotypes. Previous studies have demonstrated that these descriptors are effective for identifying diversity patterns and distinguishing maize accessions, especially in landrace-based systems [11,12]. Kernel traits, such as size, density, and structural composition, provide additional information for classification and end-use quality, as they are influenced by both genetic factors and environmental conditions during development [13,14]. Considerable variation in morphological traits has been reported across maize populations, supporting their relevance for germplasm evaluation and breeding programs [15]. However, morphological descriptors may be influenced by environmental conditions, which can limit their ability to fully represent genetic relationships among maize races. Consequently, the integration of quantitative and multivariate approaches has become necessary to improve the resolution and objectivity of classification systems.
The diversity of Peruvian maize has been documented in the foundational work of Grobman [8], which provided one of the earliest comprehensive classifications of maize races in the country. Their study described a high level of variation based on vegetative, tassel, ear, and kernel traits, including plant architecture, tassel structure, ear morphology, and grain characteristics. Based on these descriptors, Grobman [8] identified 49 maize races and organized them according to their evolutionary development into primitive, anciently derived, and more recent groups, as well as introduced, incipient, and imperfectly defined races. This classification reflects the complex processes of hybridization, selection, and geographical differentiation that have shaped maize diversity in Peru. Despite its continued relevance as a reference framework, this classification relies largely on qualitative descriptors, traits assessed by visual observation or categorical scoring, and incorporates limited quantitative integration, meaning that numerical measurements and statistical analyses are not extensively used. This may restrict its ability to capture fine-scale phenotypic differentiation among maize races under diverse environmental conditions.
In this context, there is a need for a precise and integrative reevaluation of morphological variability in Peruvian maize, particularly in highland environments where phenotypic expression may be strongly influenced by environmental heterogeneity. The objectives of this study were to (i) select discriminant morphological variables that allow a more accurate differentiation of maize races based on phenotypic variability, (ii) group maize races using multivariate analysis to identify clusters with intra-group similarity and inter-group differentiation, and (iii) compare the resulting groups with the racial classification proposed by Grobman, Salhuana, and Sevilla [8] to assess their correspondence and divergence within the current classification framework.
By integrating quantitative approaches with classical morphological characterization, this study provides a more objective basis for understanding maize diversity in the Peruvian highlands. These findings contribute to improving germplasm classification and support more efficient use of genetic resources in breeding, conservation, and crop management programs within Andean maize systems.
2. Materials and Methods
2.1. Data Construction and Digitization
Morphological data were manually digitized from the race descriptions and quantitative data reported in Races of Maize in Peru: Their Origins, Evolution and Classification [8]. The resulting dataset was organized as a race × trait matrix, with each row representing a maize race and each column representing a morphological descriptor or associated race-level attribute. A total of 43 maize races were represented in the digitized matrix [8] (Table 1).
Quantitative values were transcribed directly from the original sources without recalculation or estimation from individual level observations. Thus, each value represents the published race measurement for a given morphological descriptor. Missing values were recorded as such and were neither inferred nor imputed during digitization. Because the historical dataset contains a single set of morphological descriptors for each race, the maize race was defined as the unit of analysis. The multivariate analyses characterize differences among historical race level phenotypic profiles rather than within race phenotypic variation.
The descriptors included plant, leaf, tassel, ear, kernel, and internal ear traits. Trait names and measurement units were standardized for computational analysis while preserving the definitions and values reported in the original source (Supplementary Table 1).
2.2. Data Management and Filtering
The initial data contained 126 quantitative morphological descriptors across the 43 maize races. Descriptors with at least 80% observed data were retained for the analysis. This criterion resulted in the retention of 68 quantitative morphological descriptors. No missing values were imputed; descriptors that did not meet the completeness threshold were excluded from subsequent analyses. The retained descriptors, together with their measurement units and descriptive statistics, are presented in Supplementary Table 2.
2.3. Multivariate Analysis and Selection of Informative Traits
The statistical analyses were performed in R version 4.3.1 [16] using a Quarto workflow for computational reproducibility (Supplementary Material 2). Data manipulation and preprocessing were conducted using tidyverse (version 2.0.0) [17], including dplyr (version 1.1.4) [18] and tidyr (version 1.3.0) [19]. Multivariate analyses were performed using FactoMineR (version 2.8) [20], and graphical representations were generated using factoextra, corrplot (version 0.92) [21], and ggplot2 (version 3.4.4) [22].
An initial principal component analysis (PCA) was performed using the 68 quantitative morphological descriptors retained after completeness filtering. Because the dataset included continuous measurements, counts, and dimensionless indices expressed on different numerical scales, variables were centered and scaled to unit variance (scale.unit = TRUE) before analysis. Historical racial groups and other categorical metadata were treated as supplementary qualitative variables and therefore did not contribute to the calculation of the principal components.
Variables contributing above the expected contribution threshold (100/68 = 1.47%). The squared cosine (cos²) was calculated for each quantitative variable to assess its quality of representation on the principal axes. Variables with cos² > 0.60 on at least one of the first two principal components (Dim 1 or Dim 2) were retained to construct a reduced morphological dataset.
2.4. Phenotypic Clustering and Comparison with the Historical Classification
Hierarchical clustering on principal components (HCPC) was performed on the reduced PCA representation using the HCPC function in FactoMineR. Cluster membership was determined exclusively from quantitative morphological similarity and independently of the historical racial classification.
The morphological characteristics of each cluster were evaluated using the quantitative descriptions generated by HCPC. Cluster-specific means were compared with overall means using the v-test statistics implemented in FactoMineR, and variables significantly associated with each cluster (P < 0.05) were used to characterize its phenotypic profile. The phenotypic clusters obtained from HCPC were compared descriptively with the six historical racial categories proposed by Grobman [8] using PCA ordination and the HCPC dendrogram.
3. Results
3.1. Descriptors with Most to Phenotypic Differentiation
To identify the morphological variables with the greatest contribution to the differentiation of Peruvian maize races, a principal component analysis (PCA) was performed using the 68 selected quantitative morphological descriptors (Figure 1). The first principal component (Dim 1) explained 23.0% of the total variance, followed by Dim 2 with 14.3%, Dim 3 with 7.5%, Dim 4 with 6.4%, Dim 5 with 5.6%, Dim 6 with 4.6%, Dim 7 with 3.9%, Dim 8 with 3.4%, Dim 9 with 2.9%, and Dim 10 with 2.7% (Figure 1a).
The contribution of the descriptors to Dim 1 ranged from 0.00% to 4.81%. The highest contributions were observed for leaf_width_cm (4.81%), tassel_tassel_length_cm (4.36%), tassel_length_of_branching_space_cm (4.32%), tassel_number_of_primary_branches (4.07%), and leaf_length_cm (4.05%) (Figure 1b). Other descriptors with relatively high contributions included plant_ears_height (3.88%), plant_height (3.70%), leaf_no_of_leaves (3.68%), and tassel_length_cm_largest_branch (3.65%).
For Dim 2, the highest contribution values were observed for descriptors associated primarily with ear morphology. earintcup_width_mm contributed 7.19%, followed by ear_diameter_base_cm (7.06%), earintcupindex_cob_rachis (7.02%), earint_ear_diameter_mm (6.88%), and earint_rachis_diameter_mm (5.93%) (Figure 1c). Additional descriptors with relatively high contributions included earexternal_width_cm (6.08%), ear_diameter_tip_cm (5.90%), earint_pith_diameter_mm (4.40%), earint_cob_diameter_mm (4.38%), and earintcup_length_mm (4.01%).
The quality of representation of the descriptors on the first two principal components, assessed using cos², showed nine variables with values greater than 0.60 on at least one of the two dimensions (Figure 1d). On Dim 1, the highest cos² values were recorded for leaf_width_cm (0.74), tassel_tassel_length_cm (0.67), tassel_length_of_branching_space_cm (0.66), leaf_length_cm (0.62), and tassel_number_of_primary_branches (0.63). On Dim 2, the highest values were observed for earintcup_width_mm (0.68), earintcupindex_cob_rachis (0.67), ear_diameter_base_cm (0.68), and earint_ear_diameter_mm (0.66). The remaining variables presented cos² values below 0.60 for both dimensions.
To obtain a reduced set of morphological descriptors that captured the main phenotypic variation while minimizing redundancy among traits, candidate variables were screened according to their contribution and cos² values (Table 2, Supplementary Material 2). The selection procedure retained nine non redundant descriptors from the 18 candidate variables evaluated. In Dim 1, the retained descriptors were leaf_width_cm (contribution = 4.81%, cos² = 0.74), tassel_tassel_length_cm (4.36%, 0.67), tassel_length_of_branching_space_cm (4.32%, 0.67), tassel_number_of_primary_branches (4.07%, 0.63), and leaf_length_cm (4.05%, 0.63). In Dim 2, the retained descriptors were earintcup_width_mm (7.19%, 0.69), ear_diameter_base_cm (7.06%, 0.68), earintcupindex_cob_rachis (7.02%, 0.67), and earint_ear_diameter_mm (6.88%, 0.66).
The descriptive statistics of the retained variables showed mean values of 69.33 ± 14.43 cm for leaf length, 8.49 ± 1.28 cm for leaf width, 33.24 ± 6.89 cm for tassel length, 13.80 ± 3.64 cm for tassel branching space length, and 16.67 ± 5.14 for the number of primary tassel branches. For the ear descriptors, the mean values were 4.44 ± 0.79 cm for basal ear diameter, 43.84 ± 7.34 mm for internal ear diameter, 7.71 ± 2.31 mm for internal cup width, and 1.66 ± 0.20 for the cob to rachis index. The observed ranges were 36.20 to 94.40 cm, 5.70 to 10.60 cm, 18.70 to 46.20 cm, 4.40 to 20.80 cm, and 5.90 to 25.80, respectively, for the Dim 1 descriptors, and 2.69 to 5.97 cm, 26.30 to 58.00 mm, 2.90 to 11.50 mm, and 1.40 to 2.30, respectively, for the Dim 2 descriptors.
The final subset therefore comprised nine descriptors distributed among leaf, tassel, and ear morphology. The selected variables represented the two principal dimensions, with contributions ranging from 4.05% to 4.81% for Dim 1 and from 6.88% to 7.19% for Dim 2.
3.2. Phenotypic Clustering Structure of Maize Races
To characterize the major patterns of multivariate morphological variation among the maize races a principal component analysis (PCA) was performed on the quantitative morphological descriptors retained after data filtering (Figure 2). The first two principal dimensions accounted for 77.50% of the total variation, with dimension 1 (Dim 1) explaining 43.92% and dimension 2 (Dim 2) explaining 33.58%.
At Dim 1 was primarily associated with leaf and tassel architecture (Figure 2a). Positive correlations were observed for leaf width (r = 0.876), tassel length of branching space (r = 0.871), leaf length (r = 0.831), tassel number of primary branches (r = 0.791), and tassel tassel length (r = 0.765). In contrast, ear intupindex cob rachis was negatively correlated with Dim 1 (r = −0.831), indicating an opposing association with this morphological gradient. The contribution values were consistent with these correlations, with leaf width, leaf length, tassel length of branching space, tassel number of primary branches, and tassel tassel length contributing 19.43%, 17.47%, 16.63%, 15.85%, and 14.79% to Dim 1, respectively. Dim 1 primarily represented a gradient involving vegetative development and tassel architecture, with the ear intupindex cob rachis contributing in the opposite direction.
At Dim 2 was dominated by traits describing ear size and cob rachis characteristics (Figure 2a). Positive correlations were observed for ear int ear diameter (r = 0.819), ear intupindex cob rachis (r = 0.803), ear diameter base (r = 0.788), and ear intcup width (r = 0.756). These traits also showed the major contributions to Dim 2, accounting for 22.20%, 21.32%, 20.52%, and 18.93%, respectively. Tassel traits were negatively associated with Dim 2, particularly tassel length of branching space (r = −0.433), tassel number of primary branches (r = −0.374), and tassel tassel length (r = −0.321). Dim 2 primarily described a morphological gradient related to ear dimensions and cob rachis characteristics, contrasting with aspects of tassel architecture.
The 43 maize races were classified into four clusters according to their multivariate morphological profiles (Figure 2b). Cluster 1 comprised the smallest group and was positioned predominantly toward the negative side of Dim 1. This cluster was characterized by significantly lower mean values than the overall dataset for all eight quantitative descriptors evaluated by HCPC, including ear intcup width, leaf length, ear diameter base, ear int ear diameter, leaf width, tassel number of primary branches, tassel tassel length, and tassel length of branching space (p < 0.05). Cluster 1 represented a group characterized by comparatively reduced dimensions of both ear and leaf traits, together with a less developed tassel architecture.
Cluster 2, the largest group, was mainly distributed in the upper central portion of the factor map and was distinguished by significantly higher values of ear int ear diameter (p = 0.0109) and ear diameter base (p = 0.0243). Conversely, this cluster showed significantly lower values of ear intupindex cob rachis (p = 0.0318), tassel tassel length (p = 0.0131), tassel length of branching space (p = 0.0542), leaf width (p = 0.0034), tassel number of primary branches (p = 0.0078), and leaf length (p = 0.0002). Cluster 2 was primarily differentiated by relatively larger ear diameter traits combined with reduced leaf dimensions and a less developed tassel architecture.
Cluster 3 occupied predominantly the lower region of the factor map and was characterized by significantly higher values of ear intupindex cob rachis (p = 0.0005), tassel length of branching space (p = 0.0041), and tassel tassel length (p = 0.0312). In contrast, ear int ear diameter (p = 0.0195), ear diameter base (p = 0.0014), and ear intcup width (p = 0.0003) were significantly lower than the overall means. Cluster 3 was characterized by a combination of relatively greater development of the cob rachis and tassel architecture and comparatively smaller ear dimensions.
Cluster 4 was distributed mainly toward the positive side of Dim 1 and comprised races with significantly higher values for most of the descriptors associated with leaf and tassel development. The strongest differences were observed for leaf length (p < 0.0001), leaf width (p = 0.0001), tassel number of primary branches (p = 0.0002), tassel tassel length (p = 0.0019), and tassel length of branching space (p = 0.0016). This cluster also showed higher values for ear intcup width (p = 0.0061), ear diameter base (p = 0.0256), and ear int ear diameter (p = 0.0480). In contrast, ear intupindex cob rachis was significantly lower (p = 0.0227). Cluster 4 represented a broad morphological profile combining greater leaf development, more extensive tassel branching, and larger ear dimensions, while showing comparatively lower values for the cob rachis index.
3.3. Comparison with the Racial Classification of Grobman, Salhuana, and Sevilla (1961)
To assess the correspondence between the multivariate morphological structure of Peruvian maize and the historical racial classification proposed by Grobman, Salhuana, and Sevilla [8], the distribution of races was examined in the space defined by the first two principal dimensions (Figure 3). This comparison aimed to determine whether races assigned to the same historical racial groups occupy similar regions of the quantitative morphological space.
The 43 maize races were projected onto the first two principal dimensions and colored according to their historical racial groups (Figure 3a). The 43 races comprised six historical groups: Anciently (19 races), Lately (9), Primitive (5), Introduced (5), Incipient (4), and Imperfectly (1). Their distribution in the PCA space was subsequently examined to determine whether races assigned to the same historical category occupied similar regions of the multivariate morphological space or showed substantial dispersion and overlap with other categories.
The distribution of the historical groups showed different degrees of correspondence with the principal morphological gradients. The Primitive group exhibited the strongest displacement toward negative Dim 1 values, with an average Dim 1 score of −3.05 and values ranging from −4.51 to −1.18. However, this group showed considerable dispersion along Dim 2, ranging from −3.73 for Confite Morocho to 2.22 for Confite Puñeno. The two most negative Dim1 positions in the entire ordination were occupied by Confite Morocho (Dim1 = −4.51; Dim2 = −3.73) and Confite Puntiagudo (−3.66; −0.82), whereas Confite Puñeno (−4.19; 2.22) and Kculli (−1.74; 2.08) occurred in the upper left portion of the ordination. Although the Primitive races were generally associated with negative Dim 1 scores, they did not form a homogeneous group along Dim 2.
The Anciently group, which contained the largest number of races (n = 19), showed the greatest overlap with the overall distribution of races. Its mean scores were −0.21 for Dim 1 and −0.16 for Dim 2, with ranges of −2.63 to 2.38 and −3.52 to 2.15, respectively. Some Anciently races occupied the upper portion of the PCA space, including Huancavelicano (Dim 1 = −1.15; Dim 2 = 1.97), Pisccorunto (−0.96; 2.15), Ancashino (−0.93; 1.82), and Chullpi (0.72; 1.87). In contrast, Piricinco (0.66; −3.52), Rabo de Zorro (−1.30; −3.07), and Pagaladroga (0.60; −2.17) occurred in the lower portion of the ordination. Other Anciently races, including Mochero (1.41; −0.80), Alazan (2.38; −0.27), and Sabanero (1.52; 0.37), extended into the positive Dim 1 region. Exits a broad distribution within the Anciently category.
The Lately group comprised nine races and showed a predominantly positive position along Dim 1, with a mean score of 1.17 and a range from −1.37 to 2.82. Its mean Dim2 score was 0.10, although the group exhibited the widest vertical dispersion among the historical categories, ranging from −4.08 to 2.78. Cuzco Gigante occupied the highest position of this group (Dim1 = 0.13; Dim2 = 2.78), whereas San Geronimo Huancavelicano was located at negative Dim 1 but positive Dim 2 values (−1.37; 2.34). At the opposite extreme, Rienda showed the lowest Dim 2 value among all Lately races (0.69; −4.08). Chancayano (2.82; 1.02), Huachano (2.32; 0.51), and Perla (2.77; −0.31) occupied the positive Dim1 region. Consequently, the Lately category showed a partial association with the positive direction of Dim 1 but substantial variation along Dim 2.
The Introduced group contained five races and showed the clearest concentration toward positive Dim 1 values among the categories. Its mean Dim 1 score was 1.77, with individual scores ranging from 0.28 to 2.90, while its mean Dim 2 score was 0.30. Jora showed the highest Dim 1 score (2.90; 0.57), followed by Chuncho (2.68; −0.04) and Alemán (1.95; 0.34). Arizona was positioned toward positive Dim 2 (0.28; 2.07), whereas Pardo occurred at negative Dim 2 (1.05; −1.42). The Introduced races were relatively concentrated along the positive Dim 1 gradient but remained differentiated along Dim 2.
The Incipient group consisted of four races and showed a heterogeneous distribution along Dim 1. Sarco (−2.61; 1.25), Morado Canteño (−1.03; 0.33), and Morado Cajabambino (−1.39; 0.16) were positioned on the negative side of Dim 1, whereas Coruca represented a pronounced exception, occurring at the extreme positive end of Dim 1 (4.09; 1.61). The Imperfectly category was represented by a single race, Perilla, with coordinates of 0.89 on Dim 1 and −0.24 on Dim2.
To further assess the correspondence between the historical racial classification and the multivariate structure revealed by the quantitative morphological descriptors, hierarchical clustering was performed. Cluster 1 comprised a single race, whereas clusters 2, 3, 4, 5, and 6 contained 5, 11, 7, 7, and 12 races, respectively (Figure 3 b).
Cluster 1 was composed exclusively of Confite Morocho. The PCA coordinates (Dim1 = −4.51, Dim2 = −3.73) with a large distance from the other races.Confite Morocho belonged to the Primitive historical group with a direct correspondence between its historical classification and its distinct position in the quantitative morphological structure.
Cluster 2 comprised five races, Confite Puntiagudo, Confite Puñeno, Huayleno, Morocho, and Sarco. The cluster incorporated races belonging to three historical categories: Primitive (Confite Puntiagudo and Confite Puñeno), Anciently (Huayleno and Morocho), and Incipient (Sarco). The cluster did not correspond to a single historical racial category. Within this assemblage, Confite Puntiagudo and Confite Puñeno represented the Primitive component, whereas Huayleno and Morocho provided the Anciently component.
Cluster 3 was the second largest assemblage, containing ten races, Paro, Kculli, San Geronimo Huancavelicano, Huancavelicano, Pisccorunto, Ancashino, Cuzco, Cuzco Gigante, Arizona, Chullpi. The cluster predominantly Anciently races, together with Kculli from the Primitive group, San Geronimo Huancavelicano and Cuzco Gigante from the Lately group, and Arizona from the Introduced group.
Cluster 4 contained eight races: Morado Cajabambino, Granada, Morado Canteño, Uchuquilla, Cuzco Cristalino Amarillo, Shajatu, Marañon and Pardo. The cluster comprised races from Incipient (Morado Cajabambino and Morado Canteño), Anciently (Granada, Uchuquilla, Cuzco Cristalino Amarillo, and Shajatu), and Introduced (Pardo) categories. The predominance of Anciently races, representing four of the seven members, indicates partial correspondence with the historical classification.
Cluster 5 comprised six races: Rabo de Zorro, Enano, Pagaladroga, Piricinco, Rienda, and Chimlos. This cluster was composed of races classified as Anciently (Rabo de Zorro, Enano, and Piricinco) and Lately (Marañon, Pagaladroga, Rienda, and Chimlos). There is absence of Primitive, Introduced, Incipient, and Imperfectly classified races
Cluster 6, the largest cluster with 13 races, comprised Perilla, Mochero, Sabanero, Arequipeño, Aleman, Chaparreno, Huachano, Alazan, Chuncho, Perla, Chancayano, Jora, and Coruca. The composition was particularly heterogeneous, including the Imperfectly race Perilla; the Anciently race Mochero; Introduced races Sabanero, Aleman, Alazan, and Chuncho; Lately races Arequipeño, Chaparreno, Huachano, Perla, and Chancayano; and Incipient races Jora and Coruca. The Cluster 6 represents five of the six historical categories.
4. Discussion
Peruvian maize represents an important reservoir of phenotypic and genetic diversity within Zea mays, resulting from a long history of cultivation, farmer selection, diversification, and adaptation to contrasting agroecological environments [8,9,10,23,25]. The classical racial classification proposed by Grobman et al. [8] constitutes a fundamental basis for understanding this diversity; however, the large number of morphological descriptors historically used and the predominantly categorical nature of the racial system can make it difficult to quantify the relative contribution of individual traits and identify patterns of similarity among races. The present study addresses this gap by applying quantitative multivariate methods to the morphological information available for 43 Peruvian maize races. Principal component analysis was used to identify the descriptors associated with the dominant axes of phenotypic variation, whereas hierarchical clustering was subsequently used to identify groups of races with similar multivariate groups. The resulting structure was then compared with the historical racial classification, allowing the relationship between quantitative phenotypic similarity and the traditional race concept to be evaluated.
4.1. Quantitative Descriptors to Discriminate Peruvian Maize Races
To identify morphological variables with the major discriminatory value among the 43 Peruvian maize races. The PCA was based on the 68 quantitative descriptors retained after filtering (Figure 1). Based on contribution and cos² criteria, nine non-redundant descriptors were retained, representing the principal morphological gradients in the dataset (Table 2). The selected descriptors included leaf length and width, tassel length, tassel branching-space length, number of primary tassel branches, basal ear diameter, internal ear diameter, internal cup width, and the cob–rachis index. These variables represented the major phenotypic dimensions identified in the analysis.
Previous studies have demonstrated that vegetative architecture, reproductive morphology, and ear characteristics frequently provide strong discriminatory information because they integrate developmental, reproductive, and adaptive attributes of maize plants [25]. Sharma [26] reported that a relatively limited number of morpho-agronomic traits differentiated maize landraces from the North-East Himalayan region, whereas a recent systematic review of 50 studies from 30 countries identified plant architecture, flowering traits, and ear and kernel characteristics among the most recurrent contributors to phenotypic differentiation in maize landraces [25]. The present results support the observation that morphological differentiation in landraces is often concentrated in a limited subset of highly informative structural traits rather than being distributed uniformly across all available descriptors.
The positive associations of leaf dimensions and tassel architecture indicate that vegetative development and male reproductive structure constitute a major axis of differentiation among the Peruvian races. In contrast, the positive association of ear diameter and internal ear characteristics indicates an independent axis related more directly to ear architecture. Such separation suggests that the phenotypic diversity of Peruvian maize is not reducible to overall plant size, but reflects contrasting combinations of traits associated with different developmental structures. This interpretation is consistent with studies conducted along altitudinal gradients in Andean maize, where vegetative, tassel, ear, and kernel traits jointly described morphological differentiation among landraces and were analyzed as complementary dimensions of phenotypic diversity [25,26]. The patterns observed in the present analysis is also biologically plausible because vegetative architecture, tassel morphology, and ear structure may respond differently to selection pressures associated with local adaptation, reproductive biology, farmer preferences, and production systems [8,10,25].
From a methodological and practical perspective, the identification of nine non-redundant descriptors provides a more efficient preliminary framework for the morphological characterization of Peruvian maize germplasm. PCA dimensionality reduction is particularly useful when numerous correlated descriptors are available because it allows the major gradients of variation to be summarized through a smaller number of informative variables [27]. Recent work in maize landraces has similarly demonstrated that PCA combined with clustering can identify a reduced set of informative traits while retaining substantial phenotypic information for germplasm evaluation and breeding applications [28]. These variables can therefore be considered a potential core phenotypic screening set when the objective is to obtain a rapid representation of the principal structure of morphological variation. Nevertheless, they should not be interpreted as a universal replacement for comprehensive characterization because descriptors with low contribution to the first two components may still contain information relevant to adaptation, agronomic performance, kernel quality, or taxonomic diagnosis. Thus, the value of the reduced descriptor set lies primarily in improving the efficiency of preliminary characterization rather than eliminating the need for broader phenotyping.
4.2. Multivariate Grouping Reveals Distinct Phenotypic Configurations Among Peruvian Maize Races
The analysis of multivariate morphological similarity separated the 43 races into four phenotypically differentiated clusters (Figure 2). Cluster 1 was characterized by reduced leaf, ear, and tassel dimensions; Cluster 2 combined larger ear diameter with reduced leaf and tassel development; Cluster 3 showed comparatively greater tassel development and a higher cob–rachis index together with smaller ear dimensions; and Cluster 4 combined greater leaf and tassel development with larger ears and a lower cob–rachis index (Figure 2a). The factor map provides evidence for recurring morphological groups within the Peruvian maize collection (Figure 2b).
Wei [28] used PCA and cluster analysis on 119 maize landraces and identified three groups differing in tassel morphology, grain characteristics, and agronomic traits. Similarly, morphological analyses of maize landraces along an altitudinal gradient in the Southern Andes demonstrated that combinations of vegetative, tassel, ear, and kernel characteristics could effectively describe phenotypic differentiation among populations. Such evidence supports the interpretation that landrace diversity can contain internally coherent phenotypic groups even when the accessions have been historically classified using different criteria.
The biological interpretation of these results requires caution because the dataset represents historical race-level measurements rather than replicated observations obtained from multiple environments. Each race was represented by a single published set of morphological descriptors, so the observed differences characterize phenotypic profiles among historical races rather than within race variance. Consequently, the clusters may reflect different combinations of genetic differentiation, environmental adaptation, historical selection, and phenotypic plasticity. This limitation is particularly important in Peruvian maize because the analyzed races are associated with coastal, highland, and Amazonian environments with markedly different ecological conditions. Recent evidence from Peruvian maize has also demonstrated substantial genetic diversity and interbreeding among races, with relatively low overall genetic differentiation, indicating that morphological differentiation cannot automatically be equated with genetically isolated populations [24]. Nanyangwe [25] emphasized that phenotypic expression in maize landraces reflects the combined effects of genotype, environment, and genotype × environment interactions, particularly for complex agronomic traits.
The four clusters identified in this study therefore provide a practical basis for selecting contrasting races for subsequent evaluation, for example when seeking divergent plant architectures, tassel structures, or ear phenotypes for conservation and breeding studies. Similar applications of multivariate characterization have been proposed for maize landraces, where the identification of informative traits and phenotypically distinct groups can facilitate the selection of germplasm for further evaluation [25,28]. Nevertheless, confirmation of the stability of the groups identified here requires replicated multi-environment experiments and, ideally, integration with molecular data. Such validation would determine whether the observed phenotypic configurations remain consistent across environments and would help distinguish genetically based differentiation from environmentally induced variation.
4.3. Phenotypic Groups Partially Correspond with the Historical Racial Classification
The comparison was conducted to determine the degree of correspondence between the multivariate phenotypic structure and the six historical racial categories proposed by Grobman [8]. The comparison showed that the correspondence was partial (Figure 3), and the historical categories were not recovered as discrete quantitative morphological groups. Although some categories showed broad tendencies in the multivariate analysis, substantial overlap occurred among groups, and races belonging to different historical categories were frequently included within the same phenotypic assemblage.
The partial correspondence is understandable because the classification of Grobman [8] was developed as a historical and evolutionary framework rather than exclusively as a statistical classification based on quantitative distances. The original system incorporated morphological observations together with evolutionary interpretation and geographic information, and therefore its categories need not coincide exactly with groups defined solely by multivariate phenotypic similarity. The present findings consequently do not undermine the historical information; instead, they demonstrate that quantitative morphology captures an additional dimension of diversity. Races that are historically grouped together may have undergone different selective histories or environmental adaptations, whereas races from different historical categories may converge phenotypically under similar ecological or agronomic conditions.
This interpretation is strengthened by recent genomic evidence from Peruvian maize. Arbizu [24], using 14,235 SNP markers across 423 Peruvian maize accessions, identified substantial genetic diversity and evidence of interbreeding among races, together with relatively low genetic differentiation and incomplete correspondence between individual races and genetic clusters. Their results indicate that the historical racial categories may retain broader evolutionary information while not necessarily representing genetically isolated populations. These findings are compatible with the present morphological results, traditional categories show some broad tendencies in multivariate space, but individual races frequently overlap or diverge from the central tendency of their historical group. The discordance between quantitative phenotypic clusters and historical categories should therefore be understood as evidence of the multidimensional nature of maize diversification rather than as evidence that one classification system is inherently correct and the other is incorrect [24].
The principal implication is that historical racial identity and quantitative phenotypic similarity should be retained as complementary for germplasm characterization. A race with a distinctive historical identity may possess traits that are not sufficient to define a separate multivariate cluster, whereas a phenotypic cluster may unite races that have different evolutionary histories but share similar morphological characteristics. This complementary interpretation is particularly relevant for conservation because reducing the diversity of Peruvian maize to either historical race labels or statistical clusters alone could obscure important components of its biological diversity. The integration of historical classification with quantitative phenotyping may therefore provide a more comprehensive basis for germplasm management, while genomic and multi-environment studies can subsequently clarify the biological basis of the observed patterns.
4.4. Contribution and Implications
The main contribution of the study lies in demonstrating that the complex historical descriptor set can be reduced to a comparatively small number of informative morphological variables that capture the major dimensions of phenotypic differentiation. The selected descriptors represented leaf, tassel, and ear morphology, indicating that much of the dominant structure in the dataset was associated with variation in vegetative and reproductive architecture. The present results indicate that historical racial identity and quantitative phenotypic similarity describe related but non-equivalent dimensions of maize diversity. This distinction provides a quantitative basis for complementing the classical classification with an independent description of morphological relationships and establishes a basis for subsequent integration with ecological and genomic information.
The study contributes a reproducible quantitative perspective to a classification system that has historically relied heavily on descriptive morphology and evolutionary interpretation. Its principal novelty is not simply the identification of discriminant traits or clusters, but the demonstration that these quantitative patterns reveal a level of phenotypic organization that is only partially captured by the established racial categories. The practical implication is that the nine informative descriptors identified here can provide an efficient basis for preliminary phenotypic characterization, while the four phenotypic configurations can guide the selection of contrasting germplasm for subsequent ecological, agronomic, and breeding studies. However, the race-level historical origin of the dataset means that the results should not be interpreted as estimates of heritable variation or as evidence of genetically defined groups. Future replicated evaluations across contrasting environments, combined with genomic information, will be necessary to determine whether the phenotypic characteristics observed here remain stable across environments and to separate genetic differentiation from phenotypic plasticity [24,25].
The present study therefore provides an analytical bridge between classical germplasm classification and contemporary quantitative characterization, contributing to a more objective basis for the conservation, management, and utilization of Peruvian maize diversity.
5. Conclusions
The multivariate analysis of 43 Peruvian maize races identified nine non-redundant morphological descriptors associated mainly with leaf, tassel, and ear traits, which captured the principal patterns of phenotypic variation and allowed the races to be grouped into four distinct phenotypic configurations. These groups showed only partial correspondence with the historical racial classification of Grobman [8], indicating that quantitative phenotypic similarity represents an additional dimension of maize diversity that complements, rather than replaces, the traditional race framework. The study provides a more parsimonious and quantitative basis for the characterization, conservation, and future utilization of Peruvian maize germplasm.
Supplementary Materials
All original contributions generated and analyzed in this study are included in the article and its supplementary materials. The reproducible datasets and analytical workflows are provided in Supplementary File 1 and are accessible through the GitHub repository at: https://github.com/Flavjack/flint_maize.
Author Contributions
The conceptualization of the study was undertaken by R.S., A.G., R.O., and C.I.A. Data curation and formal analysis were performed by F.L.I. and P.M.R., while L.V.C. also contributed to data curation. Methodology development was carried out by F.L.I., P.M.R., and M.G.S., and software implementation was performed by F.L.I. and P.M.R. Investigation was conducted by R.S. and A.G. Validation of the study was performed by F.L.I., while visualization was undertaken by L.V.C. Project administration was the responsibility of R.S., R.O., and C.I.A. Resources were provided by R.O. and C.I.A., with funding acquisition undertaken by C.I.A. The first draft of the manuscript was written by F.L.I., P.M.R., M.G.S., and L.V.C. Critical review and editing of the manuscript were contributed by R.S., A.G., R.O., and C.I.A. All authors approved the final manuscript.
Funding
The APC was funded by the Vice-Rectorate for Research at the Universidad Nacional Toribio Rodríguez de Mendoza de Amazonas (UNTRM). The authors acknowledge the technical and financial support of the Project N° 2671979 “Center for Plant Germplasm Research and Plant Breeding” — CIGEMP.
Data Availability Statement
All original contributions generated and analyzed in this study are included in the article and its supplementary materials. The reproducible datasets and analytical workflows are provided in Supplementary File 1 and are accessible through the GitHub repository at: https://github.com/Flavjack/flint_maize.
Acknowledgments
The authors acknowledge the Faculty of Engineering and Agricultural Sciences (FICA) and the Institute for Sustainable Development (INDES-CES) of the Universidad Nacional Toribio Rodríguez de Mendoza de Amazonas (UNTRM) for their institutional support and contributions to the development of this research. The authors also express their gratitude to the Peruvian farmers who, through generations of traditional cultivation and seed selection, have conserved and maintained the diversity of native maize, and contribute to the preservation of this valuable genetic resource for future generations.
Conflicts of Interest
The authors declare no conflicts of interest.
References
- García-Lara, S.; Serna-Saldivar, S. O. Corn. Chemistry and Technology, 3rd ed.; Serna-Saldivar, S.O., Ed.; Elsevier; Elsevier, 2019; pp. 1–18. [Google Scholar] [CrossRef]
- Erenstein, O.; Jaleta, M.; Sonder, K.; Mottaleb, K.; Prasanna, B. M. Global maize production, consumption and trade: Trends and R&D implications. Food Secur. 2022, 14(5), 1295–1319. [Google Scholar] [CrossRef]
- Poole, N.; Donovan, J.; Erenstein, O. Viewpoint: Agri-nutrition research: Revisiting the contribution of maize and wheat to human nutrition and health. Food Policy 2021, 100, 101976. [Google Scholar] [CrossRef] [PubMed]
- Kennett, D. J.; Prufer, K. M.; Culleton, B. J.; George, R. J.; Robinson, M.; Trask, W. R.; Buckley, G. M.; Moes, E.; Kate, E. J.; Harper, T.K.; O’Donnell, L.; Ray, E.E.; Hill, E.C.; Alsgaard, A.; Merriman, C.; Meredith, C.; Edgar, H.J.H.; Awe, J.J.; Gutierrez, S.M. Early isotopic evidence for maize as a staple grain in the Americas. Sci. Adv. 2020, 6(23), eaba3245. [Google Scholar] [CrossRef] [PubMed]
- Smith, J.S.; Trevisan, W.; McCunn, A.; Huffman, W. E. Global dependence on Corn Belt Dent maize germplasm: Challenges and opportunities. Crop Sci. 2022, 62(6), 2039–2066. [Google Scholar] [CrossRef]
- Grote, U.; Fasse, A.; Nguyen, T. T.; Erenstein, O. Food Security and the Dynamics of Wheat and Maize Value Chains in Africa and Asia. Front. Sustain. Food Syst. 2021, 4, 617009. [Google Scholar] [CrossRef]
- Kinnunen, P.; Guillaume, J.H.A.; Taka, M.; D’Odorico, P.; Siebert, S.; Puma, M. J.; Jalava, M.; Kummu, M. Local food crop production can fulfil demand for less than one-third of the population. Nat. Food 2020, 1(4), 229–237. [Google Scholar] [CrossRef]
- Grobman, A.; Salhuana, W.; Sevilla, R.; Mangelsdorf, P. C. Races of maize in Peru; their origins, evolution and classification; National Academy of Sciences-National Research Council, 1961; Available online: https://www.cabidigitallibrary.org/doi/full/10.5555/19631604469.
- Salvador-Reyes, R.; Clerici, M.T.P.S. Peruvian Andean maize: General characteristics, nutritional properties, bioactive compounds, and culinary uses. Food Res. Int. 2020, 130, 108934. [Google Scholar] [CrossRef] [PubMed]
- Zambrano, J.L.; Yánez, C.F.; Sangoquiza, C.A. Maize Breeding in the Highlands of Ecuador, Peru, and Bolivia: A Review. Agronomy 2021, 11(2), 212. [Google Scholar] [CrossRef]
- Kaushal, M.; Sharma, R.; Vaidya, D.; Gupta, A.; Saini, H.K.; Anand, A.; Thakur, C.; Verma, A.; Thakur, M.; Priyanka; Kc, D. Maize: An underexploited golden cereal crop. Cereal Res. Commun. 2023, 51(1), 3–14. [Google Scholar] [CrossRef]
- Patel, R.; Memon, J.; Kumar, S.; Patel, D.A.; Sakure, A.A.; Patel, M.B.; Das, A.; Karjagi, C.G.; Patel, S.; Patel, U.; Roychowdhury, R. Genetic Diversity and Population Structure of Maize (Zea mays L.) Inbred Lines in Association with Phenotypic and Grain Qualitative Traits Using SSR Genotyping. Plants 2024, 13(6), 823. [Google Scholar] [CrossRef] [PubMed]
- Evers, T.; Millar, S. Cereal Grain Structure and Development: Some Implications for Quality. J. Cereal Sci. 2002, 36(3), 261–284. [Google Scholar] [CrossRef]
- Gwirtz, J.A.; Garcia-Casal, M.N. Processing maize flour and corn meal food products. Ann. N. Y. Acad. Sci. 2014, 1312(1), 66–75. [Google Scholar] [CrossRef] [PubMed]
- Ashogbon; Maize, A.O. Chemistry of maize components, 1st Ed. ed; CRC Press, 2022; pp. 39–76. Available online: https://www.taylorfrancis.com/chapters/edit/10.1201/9781003245230-2/chemistry-maize-components-adeleke-omodunbi-ashogbon.
- R Core Team. The R Project for Statistical Computing. Available online: https://www.R-project.org/ (accessed on 14 October 2026).
- Wickham, H.; Averick, M.; Bryan, J.; Chang, W.; McGowan, L.D.; François, R.; Grolemund, G.; Hayes, A.; Henry, L.; Hester, J.; Kuhn, M.; Pedersen, T.L.; Miller, E.; Bache, S.M.; Müller, K.; Ooms, J.; Robinson, D.; Seidel, D.P.; Spinu, V.; Takahashi, K.; Vaughan, D.; Wilke, C.; Woo, K.; Yutani, H. Welcome to the tidyverse. J. Open Source Softw. 2019, 4(43), 1686. [Google Scholar] [CrossRef]
- Wickham, H.; François, R.; Henry, L.; Müller, K.; Vaughan, D. dplyr: A Grammar of Data Manipulation (Versión 1.1.4). 2023. Available online: https://CRAN.R-project.org/package=dplyr.
- Wickham, H.; Vaughan, D.; Girlich, M. tidyr: Tidy Messy Data (Versión 1.3.0). 2023. Available online: https://tidyr.tidyverse.org.
- Lê, S.; Josse, J.; Husson, F. FactoMineR: A package for multivariate analysis. J. Stat. Softw. 2008, 25(1), 1–18. [Google Scholar] [CrossRef]
- Wei, T.; Simko, V. R package "corrplot": Visualization of a Correlation Matrix (Version 0.92). 2021. Available online: https://github.com/taiyun/corrplot.
- Wickham, H.; Chang, W.; Henry, L.; Pedersen, T.L.; Takahashi, K.; Wilke, C.; Woo, K.; Yutani, H.; Dunnington, D. ggplot2: Elegant Graphics for Data Analysis (R package version 3.4.4). 2023. Available online: https://cran.r-project.org/web/packages/ggplot2/index.html.
- Grobman, A.; Bonavia, D.; Dillehay, T. D.; Piperno, D. R.; Iriarte, J.; Holst, I. Preceramic maize from Paredones and Huaca Prieta, Peru. Proc. Natl. Acad. Sci. 2012, 109(5), 1755–1759. [Google Scholar] [CrossRef] [PubMed]
- Arbizu, C.I.; Bazo-Soto, I.; Flores, J.; Ortiz, R.; Blas, R.; García-Mendoza, P.J.; Sevilla, R.; Crossa, J.; Grobman, A. Genotyping by sequencing reveals the genetic diversity and population structure of Peruvian highland maize races. Front. Plant Sci. 2025, 16. [Google Scholar] [CrossRef] [PubMed]
- Nanyangwe, S.; Ndeve, A.D.; Fato, P.; Munisse, P.; Oladiran, K.P.; Lhamine, C.F.; Kipkoech, M.C. Phenotypic Diversity in Maize Landraces: A Systematic Review of Global Patterns, Methodological Approaches, and Implications for Breeding. Genes 2026, 17(4), 413. [Google Scholar] [CrossRef] [PubMed]
- Sharma, L.; Prasanna, B.M.; Ramesh, B. Analysis of phenotypic and microsatellite-based diversity of maize landraces in India, especially from the North East Himalayan region. Genetica 2010, 138(6), 619–631. [Google Scholar] [CrossRef] [PubMed]
- Jolliffe, I.T.; Cadima, J. Principal component analysis: A review and recent developments. Philos. Trans. R. Soc. A Math. Phys. Eng. Sci. 2016, 374(2065), 20150202. [Google Scholar] [CrossRef] [PubMed]
- Wei, L.; Guo, L.; Zhao, D.; Guo, J.; Jin, Y.; Gao, J.; Cui, H.; Zhang, L.; Liu, P.; Guo, Z. Phenotypic variation and diversity assessment in maize landraces. PLoS ONE 2026, 1(8), e0355741. [Google Scholar] [CrossRef] [PubMed]
Figure 1.
Principal component analysis of morphological variation among 43 Peruvian maize races based on 68 quantitative morphological descriptors. (a) Percentage of variance explained by the first ten principal components (b) contribution of quantitative morphological descriptors to the first principal component (Dim 1); (c) contribution of quantitative morphological descriptors to the second principal component (Dim 2); and (d) quality of variable representation on the first two principal components based on cos² values. Dashed red lines indicate the expected contribution under a uniform contribution of all variables. Traits with contribution above the reference line could be considered as important in contributing to the dimension.
Figure 1.
Principal component analysis of morphological variation among 43 Peruvian maize races based on 68 quantitative morphological descriptors. (a) Percentage of variance explained by the first ten principal components (b) contribution of quantitative morphological descriptors to the first principal component (Dim 1); (c) contribution of quantitative morphological descriptors to the second principal component (Dim 2); and (d) quality of variable representation on the first two principal components based on cos² values. Dashed red lines indicate the expected contribution under a uniform contribution of all variables. Traits with contribution above the reference line could be considered as important in contributing to the dimension.
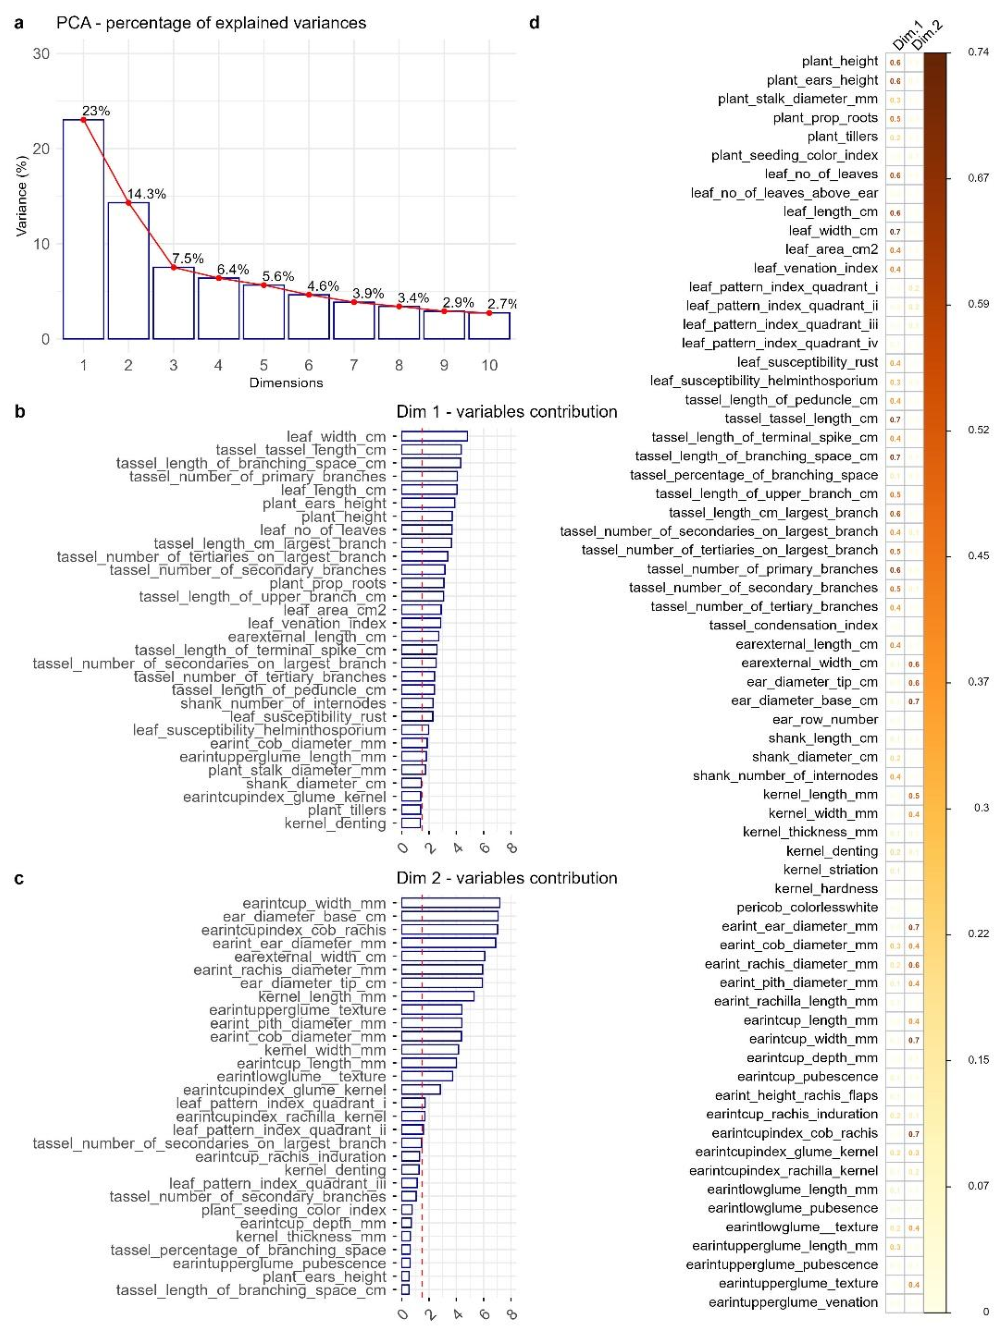
Figure 2.
Multivariate structure of quantitative morphological variation among 43 maize races. (a) Principal component analysis of quantitative morphological descriptors and their associations with the first two principal dimensions. (b) Factor map with the distribution of maize races and their classification into four morphological clusters (n = 43).
Figure 2.
Multivariate structure of quantitative morphological variation among 43 maize races. (a) Principal component analysis of quantitative morphological descriptors and their associations with the first two principal dimensions. (b) Factor map with the distribution of maize races and their classification into four morphological clusters (n = 43).
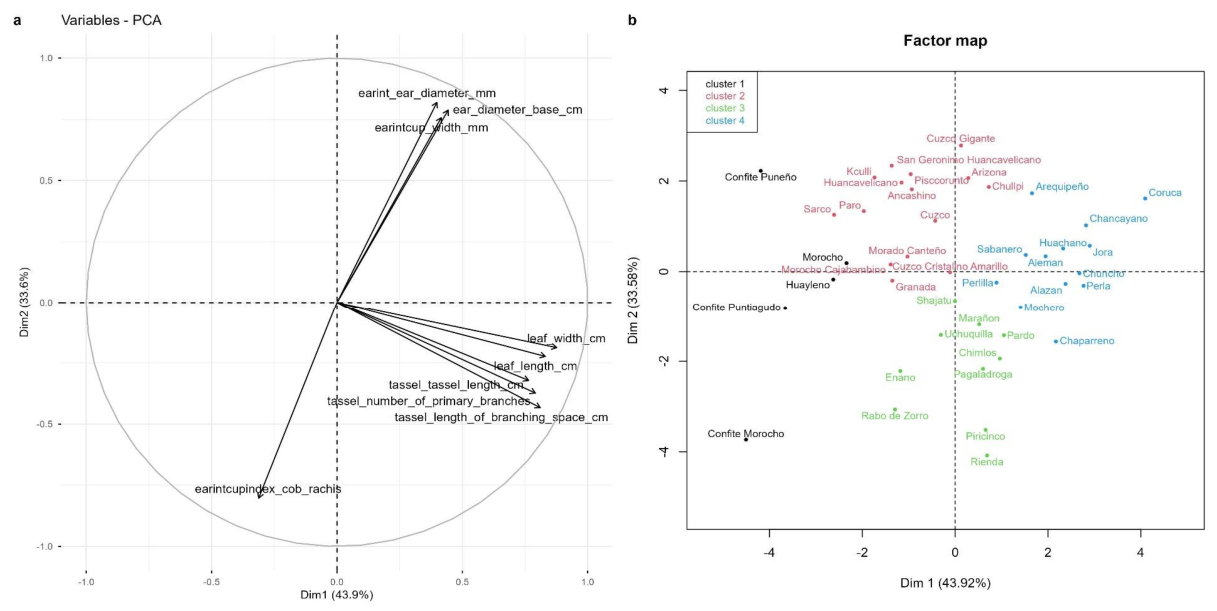
Figure 3.
Comparison between multivariate phenotypic structure and the historical racial classification of 43 Peruvian maize races (Zea mays L.). (a) PCA ordination of race-level morphological profiles colored according to the historical racial categories proposed by Grobman et al. (1961), and (b) HCPC dendrogram showing morphological relationships among races. Historical racial categories were used only for comparison and did not contribute to PCA or HCPC construction (n = 43).
Figure 3.
Comparison between multivariate phenotypic structure and the historical racial classification of 43 Peruvian maize races (Zea mays L.). (a) PCA ordination of race-level morphological profiles colored according to the historical racial categories proposed by Grobman et al. (1961), and (b) HCPC dendrogram showing morphological relationships among races. Historical racial categories were used only for comparison and did not contribute to PCA or HCPC construction (n = 43).
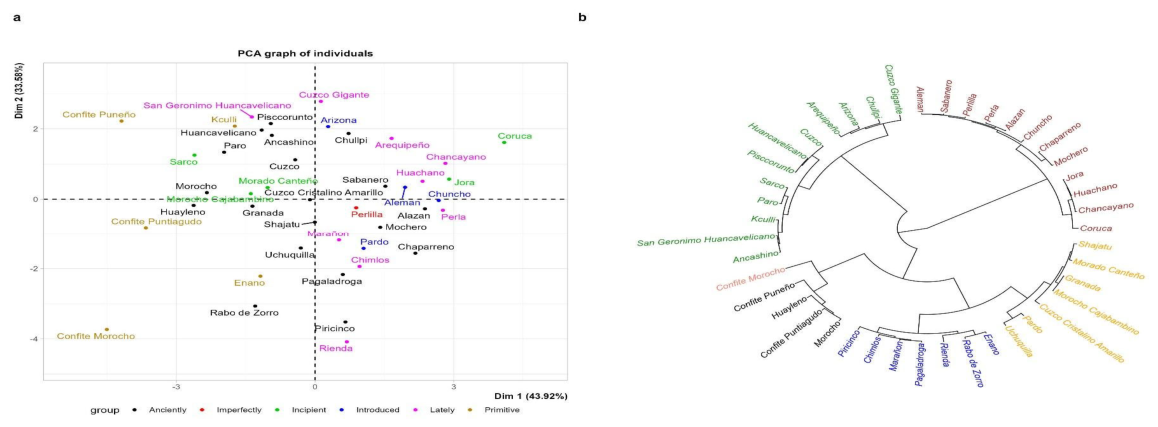

Table 1.
Group and eco-geographical characterization of 43 Peruvian maize races included in the study based on Grobman [8], including racial classification, regional distribution, representative locality of origin, and altitudinal adaptation range.
Table 1.
Group and eco-geographical characterization of 43 Peruvian maize races included in the study based on Grobman [8], including racial classification, regional distribution, representative locality of origin, and altitudinal adaptation range.
| Group | Race | Region | Locality | Altitude min (m) | Altitude max (m) | Altitudinal zone |
| Primitive | Confite Morocho | Sierra | Puno | 2800 | 3800 | Quechua–Suni |
| Confite Puntiagudo | Sierra | Puno | 3000 | 3800 | Suni | |
| Kculli | Sierra | Cuzco | 2500 | 3500 | Quechua | |
| Confite Puneño | Sierra | Puno | 3500 | 4000 | Suni–Puna | |
| Enano | Sierra | Ayacucho | 2800 | 3500 | Quechua | |
| Anciently derived | Huayleno | Sierra | Junín (Mantaro) | 2500 | 3200 | Quechua |
| Chullpi | Sierra | Cuzco | 2800 | 3600 | Quechua–Suni | |
| Granada | Sierra | Junín | 2600 | 3400 | Quechua | |
| Paro | Sierra | Junín | 2600 | 3300 | Quechua | |
| Morocho | Sierra | Junín | 2400 | 3200 | Quechua | |
| Huancavelicano | Sierra | Huancavelica | 3000 | 3800 | Suni | |
| Mochero | Coast | La Libertad | 0 | 800 | Chala | |
| Pagaladroga | Sierra | Ayacucho | 2600 | 3400 | Quechua | |
| Chaparreno | Coast/Sierra | Lima | 500 | 2000 | Yunga | |
| Rabo de Zorro | Sierra | Ayacucho | 2500 | 3300 | Quechua | |
| Piricinco | Sierra | Ayacucho | 2500 | 3200 | Quechua | |
| Ancashino | Sierra | Ancash | 2600 | 3400 | Quechua | |
| Shajatu | Sierra | Cuzco | 2800 | 3500 | Quechua–Suni | |
| Alazan | Sierra | Junín | 2500 | 3300 | Quechua | |
| Sabanero | Sierra | Junín | 2400 | 3200 | Quechua | |
| Uchuquilla | Sierra | Ayacucho | 2600 | 3400 | Quechua | |
| Cuzco Cristalino Amarillo | Sierra | Cuzco | 2800 | 3400 | Quechua | |
| Cuzco | Sierra | Cuzco | 2800 | 3400 | Quechua | |
| Pisccorunto | Sierra | Cuzco | 2800 | 3500 | Quechua | |
| Lately derived | Arequipeño | Coast | Arequipa | 0 | 1000 | Chala |
| Huachano | Coast | Lima (Huacho) | 0 | 800 | Chala | |
| Chancayano | Coast | Lima (Chancay) | 0 | 800 | Chala | |
| San Geronimo Huancavelicano | Sierra | Huancavelica | 2800 | 3600 | Quechua–Suni | |
| Perla | Coast | Lima | 0 | 800 | Chala | |
| Rienda | Coast/Sierra | Lima | 500 | 2000 | Yunga | |
| Marañon | Selva alta | Amazonas | 400 | 1500 | Rupa-Rupa | |
| Chimlos | Selva alta | Amazonas | 400 | 1500 | Rupa-Rupa | |
| Cuzco Gigante | Sierra | Cuzco | 2800 | 3400 | Quechua | |
| Introduced | Pardo | Coast | La Molina | 0 | 1000 | Chala |
| Aleman | Coast | La Molina | 0 | 1000 | Chala | |
| Chuncho | Selva | Junín | 200 | 1000 | Rupa-Rupa | |
| Arizona | Coast | La Molina | 0 | 1000 | Chala | |
| Incipient | Jora | Sierra | Junín | 2500 | 3500 | Quechua |
| Coruca | Sierra | Junín | 2500 | 3300 | Quechua | |
| Morocho Cajabambino | Sierra | Cajamarca | 2600 | 3400 | Quechua | |
| Morado Canteño | Coast/Sierra | Lima (Cañete) | 500 | 2000 | Yunga | |
| Sarco | Sierra | Ayacucho | 2600 | 3400 | Quechua | |
| Imperfectly | Perlilla | Coast | Lima | 0 | 500 | Chala |
Table 2.
Selection of non-redundant quantitative morphological descriptors based on principal component contribution, cos² among 43 Peruvian maize races.
Table 2.
Selection of non-redundant quantitative morphological descriptors based on principal component contribution, cos² among 43 Peruvian maize races.
| Trait | variable | Unit | Mean | SD | Min | Max | Dimension | Contribution | Cos2 |
| Ears external | ear_diameter_base_cm | cm | 4.44 | 0.79 | 2.69 | 5.97 | Dim.2 | 7.06 | 0.68 |
| Ears internal | earint_ear_diameter_mm | mm | 43.84 | 7.34 | 26.30 | 58.00 | Dim.2 | 6.88 | 0.66 |
| Ears internal | earintcup_width_mm | mm | 7.71 | 2.31 | 2.90 | 11.50 | Dim.2 | 7.19 | 0.69 |
| Ears internal | earintcupindex_cob_rachis | unit | 1.66 | 0.20 | 1.40 | 2.30 | Dim.2 | 7.02 | 0.67 |
| Leaf | leaf_length_cm | cm | 69.33 | 14.43 | 36.20 | 94.40 | Dim.1 | 4.05 | 0.63 |
| Leaf | leaf_width_cm | cm | 8.49 | 1.28 | 5.70 | 10.60 | Dim.1 | 4.81 | 0.74 |
| Tassel morphology | tassel_length_of_branching_space_cm | cm | 13.80 | 3.64 | 4.40 | 20.80 | Dim.1 | 4.32 | 0.67 |
| Tassel morphology | tassel_number_of_primary_branches | unit | 16.67 | 5.14 | 5.90 | 25.80 | Dim.1 | 4.07 | 0.63 |
| Tassel morphology | tassel_tassel_length_cm | cm | 33.24 | 6.89 | 18.70 | 46.20 | Dim.1 | 4.36 | 0.67 |
Disclaimer/Publisher’s Note: The statements, opinions and data contained in all publications are solely those of the individual author(s) and contributor(s) and not of MDPI and/or the editor(s). MDPI and/or the editor(s) disclaim responsibility for any injury to people or property resulting from any ideas, methods, instructions or products referred to in the content. |
© 2026 by the authors. Licensee MDPI, Basel, Switzerland. This article is an open access article distributed under the terms and conditions of the Creative Commons Attribution (CC BY) license (http://creativecommons.org/licenses/by/4.0/).
Copyright: This open access article is published under a Creative Commons CC BY 4.0 license, which permit the free download, distribution, and reuse, provided that the author and preprint are cited in any reuse.