

Submitted:
13 October 2026
Posted:
14 October 2026
You are already at the latest version
Abstract
Single-photon avalanche diodes (SPADs) have great potential in astronomy, fluorescence lifetime imaging microscopy (FLIM), quantum communication, and other high-precision sensing and imaging applications. However, further optimization of SPAD performance is often constrained by fabrication time and cost. In this work, we develop a technology computer-aided design (TCAD) simulation flow for a custom SPAD. We propose models for the I-V characteristics, breakdown voltage, dark count rate (DCR), and photon detection probability (PDP). These models are calibrated against measurements across a wide range of bias voltages and temperatures. We also investigated the effects of specific process parameters on device performance. This work provides a method for accurate SPAD design and optimization.
Keywords:
single photon avalanche diode (SPAD)
; avalanche triggering probability
; dark count rate (DCR)
; photon detection probability (PDP)
1. Introduction
With the feature of high sensitivity, digital output, low cost, and ease of integration, single-photon avalanche diodes (SPADs) are widely used in intelligent driving, quantum communication, LiDAR, fluorescence lifetime imaging microscopy, and time-resolved Raman spectroscopy[1,2,3,4,5].
SPADs typically operate in Geiger mode. When the bias voltage exceeds the breakdown voltage, photo-generated carriers are accelerated by the high electric field and multiplied by impact ionization, thereby triggering an avalanche current. As a result, signals can be detected several orders of magnitude below the noise floor. However, under this high field, thermally generated or tunneling-induced carriers can also trigger avalanches in the absence of incident photons, resulting in dark counts. Therefore, the device must be designed as a compromise between a high photon detection probability (PDP) and a low dark count rate (DCR). Because device optimization is constrained by fabrication time and cost, many physics-based models have been proposed to predict SPAD performance, including breakdown voltage and temporal response[6]. TCAD models have also been developed for CMOS SPAD pixels to simulate basic output characteristics[7,8]. However, few models have been calibrated against measurements, and many have been validated only at a single bias voltage and temperature, which limits their accuracy.
Accordingly, this work proposes TCAD-based performance models for a custom SPAD and calibrates them against experimental measurements over a wide range of bias voltages and temperatures. The models cover the I-V characteristics, the breakdown voltage, the dark count rate (DCR), and the photon detection probability (PDP). Using the calibrated models, we then analyze the effects of process parameters on SPAD performance. The results show that setting the implant dose in the avalanche region to approximately 6×1012cm-2 can improve the electric field, increase the PDP, and keep the DCR within an acceptable range. Finally, the proposed models can effectively guide device design and performance optimization.
2. Materials and Methods
The SPAD adopted in this work is manufactured using a custom process based on a reach-through structure[9], as shown in Figure 1(a). The multiplication region is formed by the N+/P-well junction. A guard ring, formed by N-well implants around the photosensitive area, prevents edge breakdown caused by large potential gradients. The doping profile and electric field distribution are shown in Figure 1(b). Under reverse bias, an electric field of approximately 105V/cm is generated, allowing avalanche breakdown.
The test method follows available standards[9,10]. An 850nm pulsed laser is used as the controlled light source, and the SPAD output is monitored using a universal counter (SR400).
Compared with conventional optoelectronic devices, SPAD simulation is unique because the finite-element model must capture not only the generation, diffusion, recombination, and collection of photogenerated carriers, but also the avalanche process. Using an impact ionization model[11], the avalanche triggering probability Ptr(x) for a single electron entering the multiplication region can be calculated, thus describing the avalanche breakdown and the I-V characteristics of SPADs under high electric fields.
Furthermore, due to lattice thermal vibrations and the presence of defects and impurities, a SPAD biased above the breakdown can undergo avalanche breakdown even in the absence of incident photons, triggered by thermal excitation or tunneling. Therefore, to simulate the dark count rate (DCR), we also include the Shockley-Read-Hall (SRH) generation-recombination model and a tunneling model. The DCR can be obtained as follows[12]:
Where Wdep is the width of the depletion region, and the avalanche trigger probability Ptr depends on the local electric-field profile within the depletion region.
The PDP depends on both the photon absorption probability (Pab) and the avalanche triggering probability (Ptr) in silicon[13]. To simulate PDP, the incident position of the photon must be considered. For a photon absorbed in the multiplication region, Ptr is equal to one, and the delay distribution depends on the carrier transit time. For carriers generated in the neutral regions, Ptr and the delay distribution are obtained by solving the drift-diffusion equations[14].
3. Results
3.1. I-V Characteristics and Breakdown Voltage
The SPAD used in this work is formed by an abrupt junction (N+/P-well) on a p-type substrate, as shown in Figure 1(a). The N+ region is implanted on the readout side, and a P-well is formed under the top electrode to create the multiplication layer. When a reverse bias voltage (>Vbd) is applied, the lightly doped p-side becomes fully depleted, forming a high-field multiplication region and an underlying drift region that drifts photo-generated electrons into the high-field region.
The Okuto-Crowell impact ionization model is an empirical model with temperature-dependent coefficients. For silicon, the ionization coefficients are calibrated at different temperatures using a quasi-physical analytical model that precisely fits the measurements[15]. By enabling the impact ionization model together with the global temperature model, we simulate the SPAD I-V characteristic and its dependence on bias voltage and temperature. As shown in Figure 2, the anode current increases with bias voltage; a cross-section of the simulated structure is shown in the inset. When the applied voltage is approximately 110V, the generated electron-hole pairs in the multiplication region are accelerated by the electric field. Then a cascade of impact ionization events occurs and the avalanche current rapidly increases from 10-11A to 10-4A (at T=293K). As the temperature rises from 245K to 293K, the I-V curve shifts to the upper right, and the dark current increases from 10-13A to 10-11A.
The breakdown voltage (Vbd) is defined as the minimum reverse bias voltage at which a diode operates in Geiger mode. We extract Vbd from the simulated I-V curve. The simulated values Vbd at 245, 273, 283 and 293K are compared to the measured data and show the same increasing trend, as shown in Figure 3. At room temperature, the breakdown voltage is approximately 110V. The slope dVbd/dT is positive, which is a signature of an avalanche process due to impact ionization. For measurements, dVbd/dT≈488.2mV/K, while simulations give dVbd/dT≈420.8mV/K, corresponding to an error of less than 15%. This agreement indicates that the model can accurately capture the I-V and breakdown behavior of the custom SPAD.
3.2. Dark Count Rate
Due to the presence of intrinsic defects and impurities in the device, when the bias voltage is greater than the breakdown voltage, even if there is no incident photon, SPAD will also generate avalanche breakdown, resulting in an increase in DCR and detection errors. Impact ionization、SRH and tunneling models were used to simulate the avalanche breakdown probability Ptr and the generation rate G, and the integral calculation was further coupled to evaluate the DCR under different bias voltages.
As shown in Figure 4, the generation rate is mainly distributed near the top of the PN junction, whereas the electron avalanche breakdown probability exhibits a vertical distribution due to the pull-through structure. The variation of the avalanche breakdown probability and the generation rate along the cutline are shown in the inset.
Figure 5(a) shows the simulated DCR as a function of the bias voltage. As the excess bias increases, the electric field across the multiplication region rises, which in turn increases the electron impact-ionization coefficient. Consequently, both the probability of electron-triggered breakdown in the depletion region and the carrier generation rate increase, leading to a higher dark-count rate.
We also investigated the influence of different tunneling models on the SPAD DCR. Under a sufficiently high electric field, local band bending can enable electrons to tunnel from the valence band into the conduction band, generating an extra electron in the conduction band and a hole in the valence band; this process is known as band to-band tunneling (B2B)[16]. In addition, electrons can also tunnel through the trap states, i.e., trap-assisted tunneling (TAT)[17]. Given the strong electric field and intrinsic defects in the SPAD, we simulated the DCR as a function of voltage using these two tunneling models and compared the results with measurements, as shown in Figure 5(b).
The results show that the simulations that include trap-assisted tunneling agree better with the measurements, indicating that, for the devices used in this work, the DCR is dominated by the TAT effect. At higher bias voltages, the measured DCR is slightly higher than the simulated value, suggesting that band-to-band tunneling becomes significant at higher electric fields and that the total DCR may be the sum of defect-assisted tunneling and band-to-band tunneling contributions. Because the SPAD typically operates at an excess bias of a few to about a dozen volts, we focus primarily on defect-assisted tunneling.
3.3. Photon Detection Probability
The PDP is the probability that an incident photon is eventually detected by the SPAD. It includes: (1) the probability that the photon reaches the APD absorption layer, which is affected by the fiber-coupling efficiency and the device-surface reflection coefficient; (2) the probability that the photon is absorbed and generates carriers in the absorption layer (absorption efficiency, or quantum efficiency), which mainly depends on the absorption layer thickness; and (3) the probability that the generated carriers trigger an avalanche in the multiplication layer, which depends on the electric-field strength in the multiplication layer.
During the PDP simulation, a light source with a wavelength of 850nm was defined; the light intensity and photo-current settings are illustrated in Figure 6(a). The simulated anode current and the available photon current under different bias conditions are also shown in Figure 6(a). The quantum efficiency is obtained as the ratio of the anode current to the available photon current. By further coupling the avalanche probability under the corresponding electric field, the PDP as a function of bias voltage is obtained, as shown in Figure 6(b). The simulated PDP follows the same trend as the experimental results. The discrepancy between the simulation and the experimental results is attributed to surface losses. Although the material’s surface reflection coefficient was included in the TCAD simulator, the actual process by which photons pass through the device surface and reach the absorption layer is more complex.
3.4. Influence of Process Parameters
A multiplication layer with a high electric field can increase the avalanche probability of carriers, thus increasing the PDP and improving the detection performance of the device. However, in the absence of incident photons, the DCR of the device also increases[18,19]. Therefore, the process parameters must be carefully optimized to achieve high detection performance with low noise.
Based on the previous simulation results, defect-assisted tunneling dominates DCR generation and is primarily governed by the electric field strength and the defect distribution. The electric field also affects the breakdown probability: as the field strength increases, the breakdown probability rises, leading to higher DCR and PDP. Because the electric field and defect distribution are largely determined by the implant process, we varied the multiplication-layer implant conditions to study their impact on device parameters.
The simulations show that the implant energy mainly changes the junction depth, with little effect on the device doping concentration or the electric-field distribution. In contrast, the implant dose significantly affects the doping concentration in the multiplication layer and the electric-field distribution, has a smaller effect on the carrier generation rate, and mainly influences the breakdown probability. Figure 7 shows the electric-field profile within the device along the vertical direction under different implant doses. Due to technical limitations, the implant dose is set between 4×1012cm-2 and 6.5×1012cm-2. The electric field near the multiplication layer exhibits a Gaussian-like profile with a pronounced peak. As the multiplication-layer implant dose increases, the Gaussian peak decreases and broadens. Meanwhile, the electric field in the drift region increases.
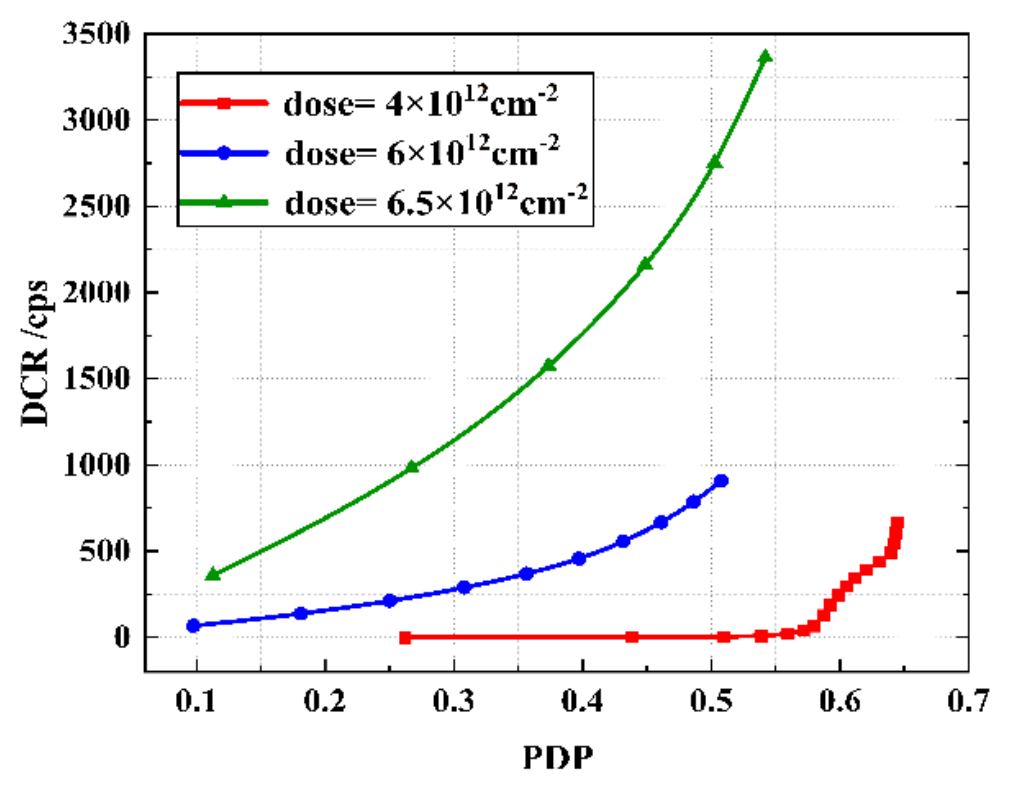
Figure 8 plots DCR versus PDP for implant doses of 4×1012 cm-2, 6×1012 cm-2 and 6.5×1012 cm-2. Because the breakdown voltage increases with implant dose, DCR and PDP are compared at the same excess voltage. The value of the DCR at PDP of 30% for 4× 1012 cm-2 is nearly zero, for 6×1012 cm-2 is approximately 300cps and for 6.5×1012 cm-2 is approximately 1000cps. The best result is obtained with dose=6×1012 cm-2, since the DRC is low while the PDP is high. The results indicate that by adjusting the implant dose of the multiplier layer, the PDE of the device can be effectively improved, while the DCR can be reduced.
4. Conclusions
In this work, we used TCAD simulations to explore low-cost approaches to optimize device performance. Using the layout and process parameters of a custom SPAD, we simulated key performances across a wide range of bias voltages and temperatures, including I-V characteristics, breakdown voltage, DCR, and PDP. Through electrical calibration, we achieved good agreement between the model and the experimental data.
In addition, we studied how the implant dose of the multiplier layer affects device performance: (1) If the implant dose of the multiplier layer is too low, the drift layer will have a relatively weak effect on regulating the electric field of the multiplier layer in the device, resulting in abnormal device performance. (2) As the implant dose increases, the Gaussian distribution peak decreases, the width expands, the equivalent area of the entire Gaussian distribution increases, and more photogenerated carriers can move to the multiplication region with a high electric field. The probability of multiplication increases. Even though the peak of the Gaussian distribution decreases, the wider equivalent area leads to a larger multiplication region, which increases the breakdown probability, offsetting the effect of the decrease in the maximum electric field. Thus, PDP and DRC are significantly increased. (3) When the implant dose is too high, an imbalance in the electric field distribution occurs. Excessive electric fields are distributed to the drift area, preventing the device from achieving an effective multiplication breakdown. A very large bias voltage must be applied to form a sufficient electric field in the multiplication layer to generate the avalanche multiplication effect, thereby affecting the performance of the device.
In summary, the models proposed in this paper can efficiently provide practical guidance for devices optimization, and significantly shorten the design cycle of the devices.
Funding
This research was funded by the National Natural Science Foundation of China, grant number 12305311 and the Natural Science Foundation of Chongqing Municipality, grant number CSTB2024NSCQ-MSX1189.
References
- Ceccarelli, F.; Acconcia, G.; Gulinatti, A.; Ghioni, M.; Rech, I.; Osellame, R. Recent Advances and Future Perspectives of Single-Photon Avalanche Diodes for Quantum Photonics Applications. Adv. Quantum Technol. 2020, 2000102. [Google Scholar] [CrossRef]
- Zickus, V.; Wu, M. L.; Morimoto, K.; Kapitany, V.; Fatima, A.; Turpin, A.; Insall, R.; Whitelaw, J.; Machesky, L.; Bruschini, C. Fluorescence lifetime imaging with a megapixel SPAD camera and neural network lifetime estimation. Sci. Rep. 2020, 10, 1–10. [Google Scholar] [CrossRef]
- Villa, F.; Severini, F.; Madonini, F.; Zappa, F. SPADs and SiPMs arrays for long-range high-speed light detection and ranging (LiDAR). Sensors 2021, vol. 21(no. 11), art. no. 3839. [Google Scholar] [CrossRef]
- Incoronato, A.; Severini, F.; Villa, F.; Zappa, F. Multi-Channel SPAD Chip for Silicon Photonics with Multi-Photon CoIncidence Detection. IEEE J. Sel. Top. Quan Electron 2022, 28(3), 1–7. [Google Scholar] [CrossRef]
- Qian, Min; Zhang, Yi; Mao, Xiaojun; Gao, Yang; Xuan, Xiaoyang; Wu, Min; Niu, Yueping; Gong, Shangqing. Flexible photoelectronic material device and investigation method for space applications. Prog. Aerosp. Sci. 2023, 139, 100901. [Google Scholar] [CrossRef]
- Xu, Yue; Xiang, Ping; Xie, Xiaopeng; Huang, Yang. A new modeling and simulation method for important statistical performance prediction of single photon avalanche diode detectors. Semicond. Sci. Technol. 2016, 31(6), 065024. [Google Scholar] [CrossRef]
- Chaves De Albuquerque, T.; Issartel, D.; Clerc, R.; Pittet, P.; Cellier, R.; Calmon, F. Lowering the dark count rate of spad implemented in cmos fdsoi technology. In 2019 Joint International EUROSOI Workshop and International Conference on Ultimate Integration on Silicon (EUROSOIULIS); IEEE, 2019; pp. pages 1–4. [Google Scholar]
- Qian, X.; Jiang, W.; Elsharabasy, A.; Deen, M.J. Modeling for Single-Photon Avalanche Diodes: State-of-the-Art and Research Challenges. Sensors 2023, 23(7), 3412. [Google Scholar] [CrossRef]
- Guo, Anran; Ma, Huaping; Li, Ruizhi; Chen, Yuwei; Fu, Jing; Li, Guowei; Lei, Renfang. Fabrication and characterization of silicon spads with doping compensated avalanche region. Nuclear Instruments and Methods in Physics Research Section A: Accelerators, Spectrometers, Detectors and Associated Equipment 2024, 1063, 169274. [Google Scholar] [CrossRef]
- Anthony, Tsikouras; Pietro, Peronio; Ivan, Rech; Nehad, Hirmiz; Deen, M.; Qiyin, Fang. Characterization of spad array for multifocal high-content screening applications. Photonics 2016, 3(4), 56. [Google Scholar] [CrossRef]
- Maiti, Chinmay K. Introducing Technology Computer-Aided Design (TCAD): Fundamentals, Simulations, and Applications; Jenny Stanford Publishing, 2017. [Google Scholar]
- Panglosse, Aymeric; Martin-Gonthier, Philippe; Marcelot, Olivier; Virmontois, Cedric; Magnan, Pierre. Dark count rate modeling in single-photon avalanche diodes for space lidar applications. 2019 17th IEEE International New Circuits and Systems Conference (NEWCAS), 2019. [Google Scholar]
- Mahmoudi, Hiwa; Saman Kohneh Poushi, S.; Steindl, Bernhard; Hofbauer, Michael; Zimmermann, Horst. Optical and electrical characterization and modeling of photon detection probability in cmos single-photon avalanche diodes. IEEE Sens. J. 2021, 21(6), 7572–7580. [Google Scholar] [CrossRef]
- Gulinatti, Angelo; Rech, Ivan; Fumagalli, Silvia; Assanelli, Mattia; Ghioni, Massimo; D Cova, Sergio. Modeling photon detection effciency and temporal response of single photon avalanche diodes. In Photon Counting Applications, Quantum Optics, and Quantum Information Transfer and Processing II; SPIE, 2009; volume 7355, pp. pages 161–177. [Google Scholar]
- Okuto, Y.; Crowell, R. Threshold energy effects on avalanche breakdown Voltage in semiconductor junctions. Solid-State Electron. 1975, Vol. 18, 161–168. [Google Scholar] [CrossRef]
- Schenk, A. Rigorous Theory and Simplified Model of the Band-to-Band Tunneling in Silicon. Solid State Electron. 1993, Vol. 36, 19–34. [Google Scholar] [CrossRef]
- Ghosh, S.; Sun, G.; Morgan, T.A.; Forcherio, G.T.; Cheng, H.-H.; Chang, G.-E. Dark Current Analysis on GeSn p-i-n Photodetectors. Sensors 2023, 23(17), 7531. [Google Scholar] [CrossRef]
- Gulinatti, F.; Ceccarelli, F.; Ceccarelli, M.; Ghioni, I. Rech, Custom Silicon Technology for SPAD-Arrays with Red-Enhanced Sensitivity and Low Timing Jitter. Opt. Express 2021, 29, 4559–4581. [Google Scholar] [CrossRef]
- Shimada, S.; Otake, Y.; Yoshida, S.; Endo, S.; Nakamura, R.; Tsugawa, H.; Ogita, T.; Ogasahara, T.; Yokochi, K.; Inoue, Y. A Back Illuminated 6 m SPAD Pixel Array with High PDP and Timing Jitter Performance. In Proceedings of the 2021 IEEE International Electron Devices Meeting (IEDM), San Francisco, CA, USA, December 2021; pp. 20.1.1–20.1.4. [Google Scholar]
Figure 1.
(a) Schematic of SPAD pixel (b) Doping concentration and electric field profile.
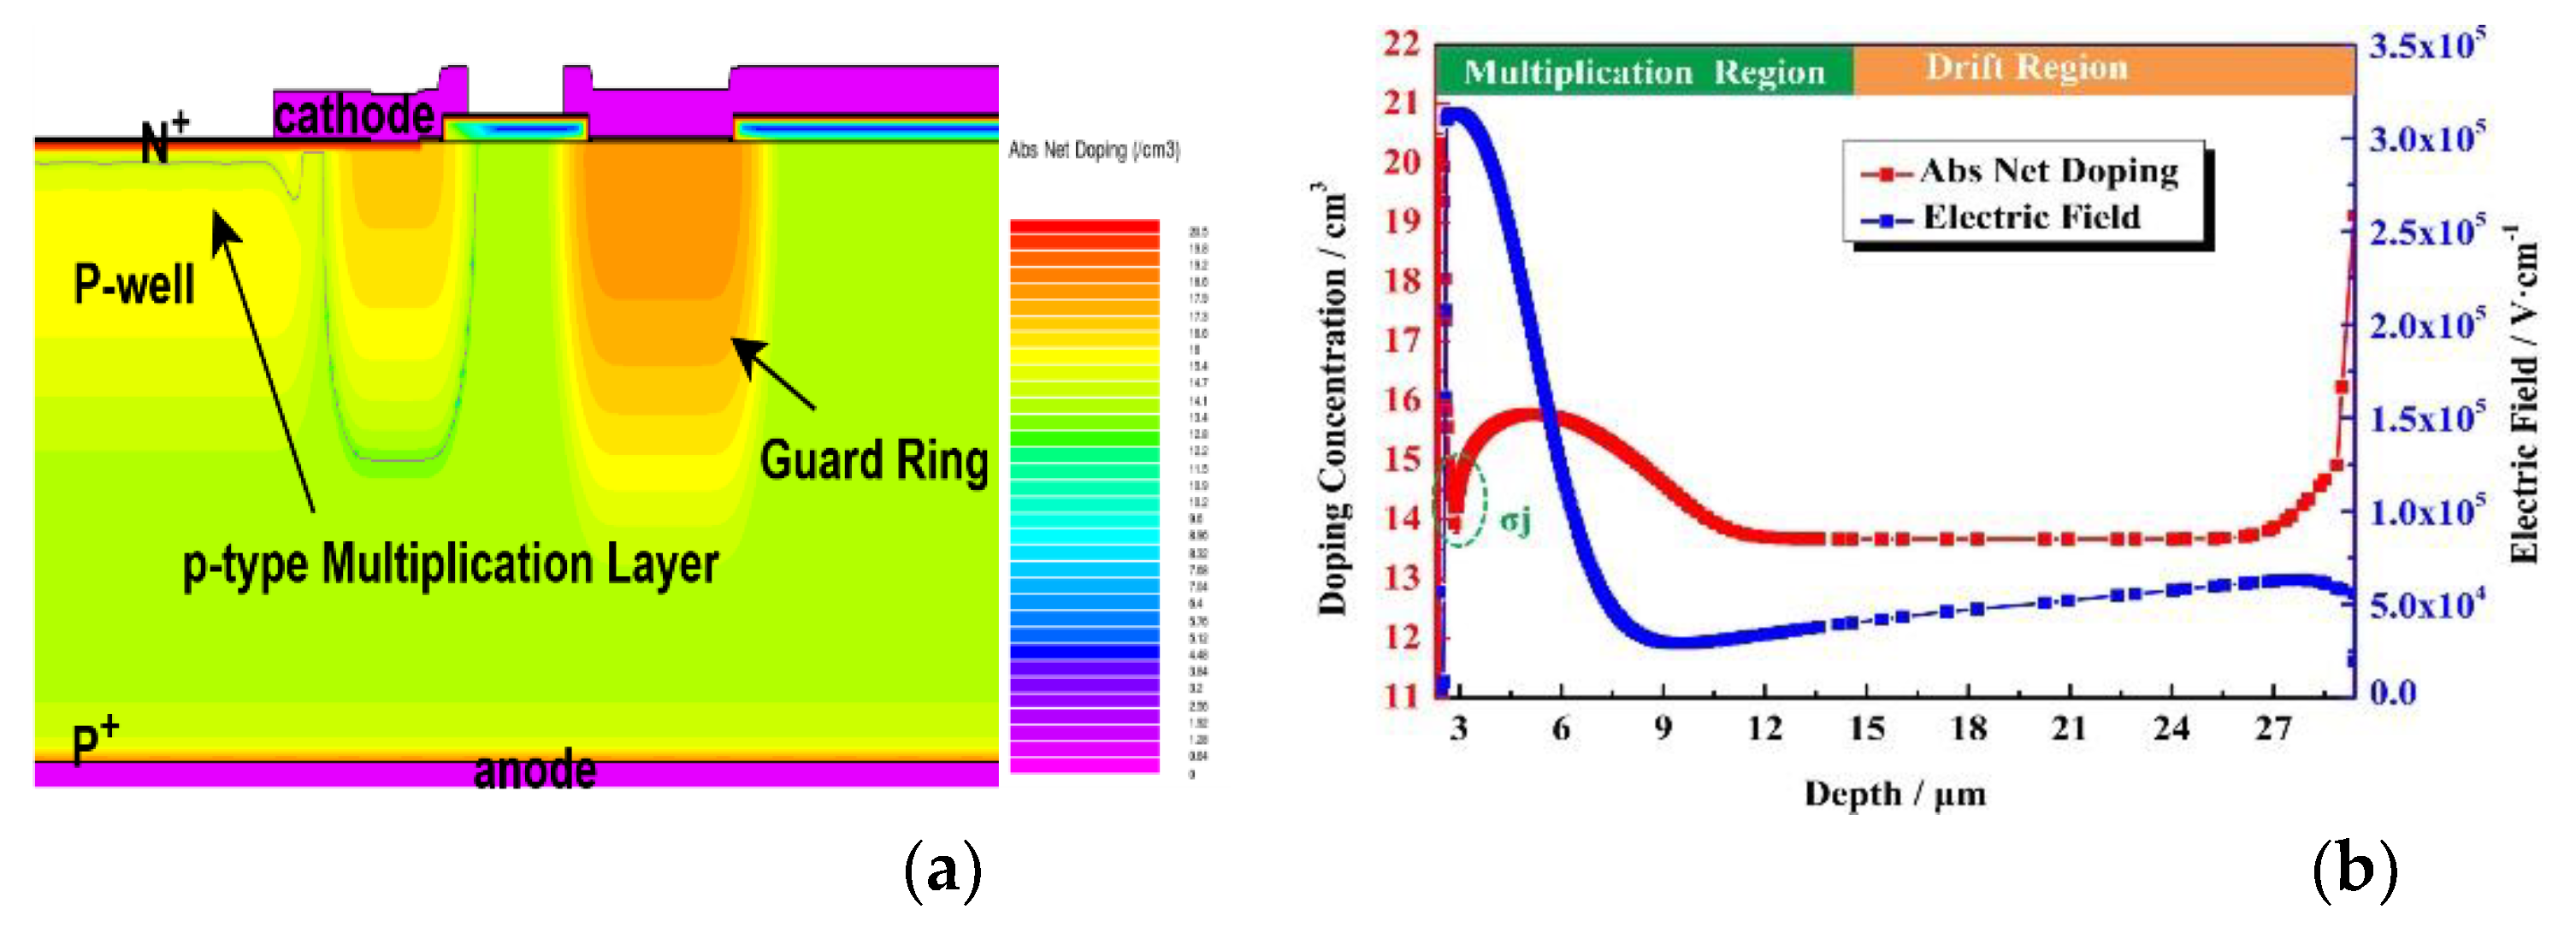
Figure 2.
I-V characteristics of SPADs under different temperatures.
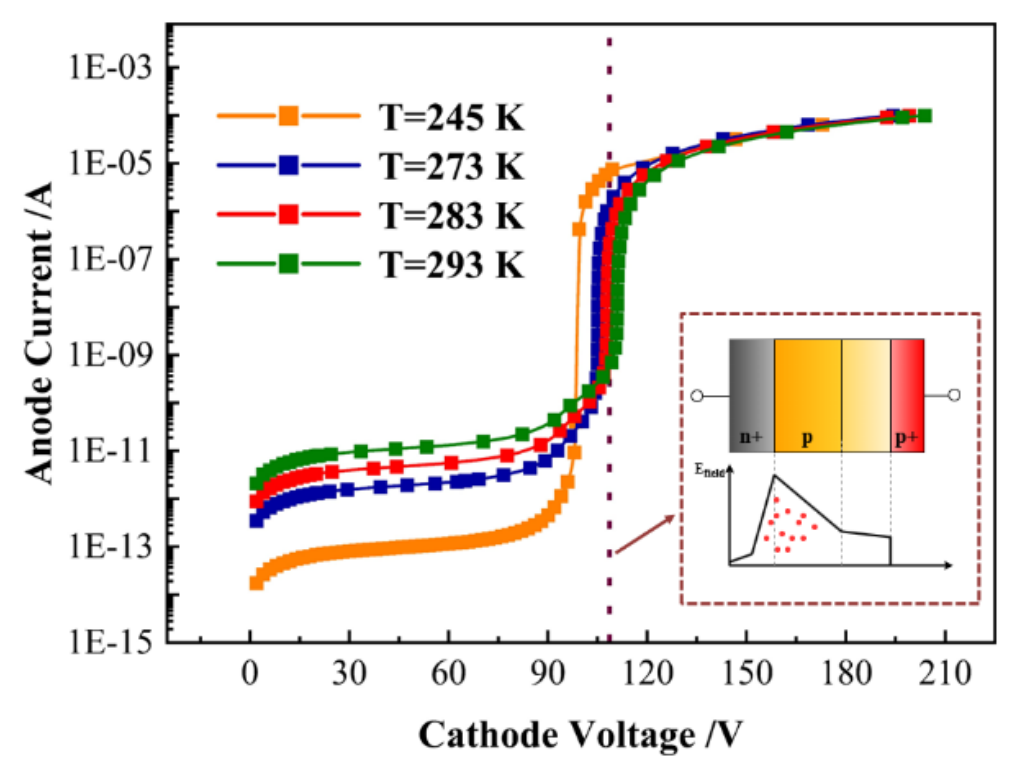
Figure 3.
Comparison of experimental and simulation results on Breakdown Voltage varies with temperature.
Figure 3.
Comparison of experimental and simulation results on Breakdown Voltage varies with temperature.
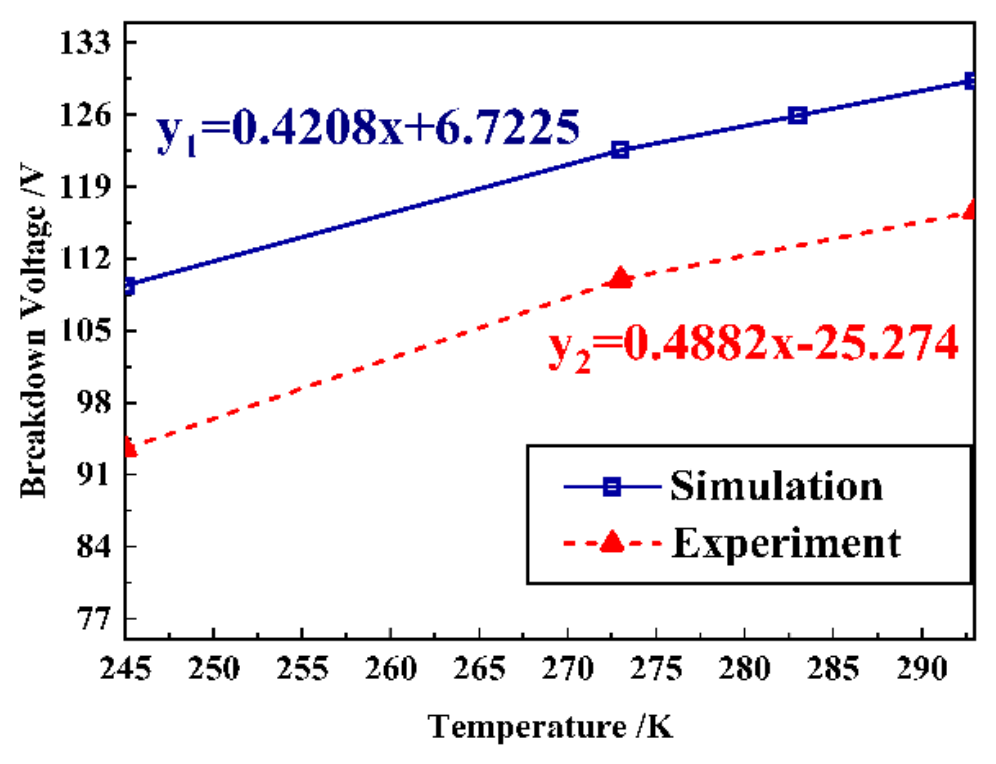
Figure 4.
The simulation results of distribution for (a) the generation rate and (b) the breakdown probability.
Figure 4.
The simulation results of distribution for (a) the generation rate and (b) the breakdown probability.
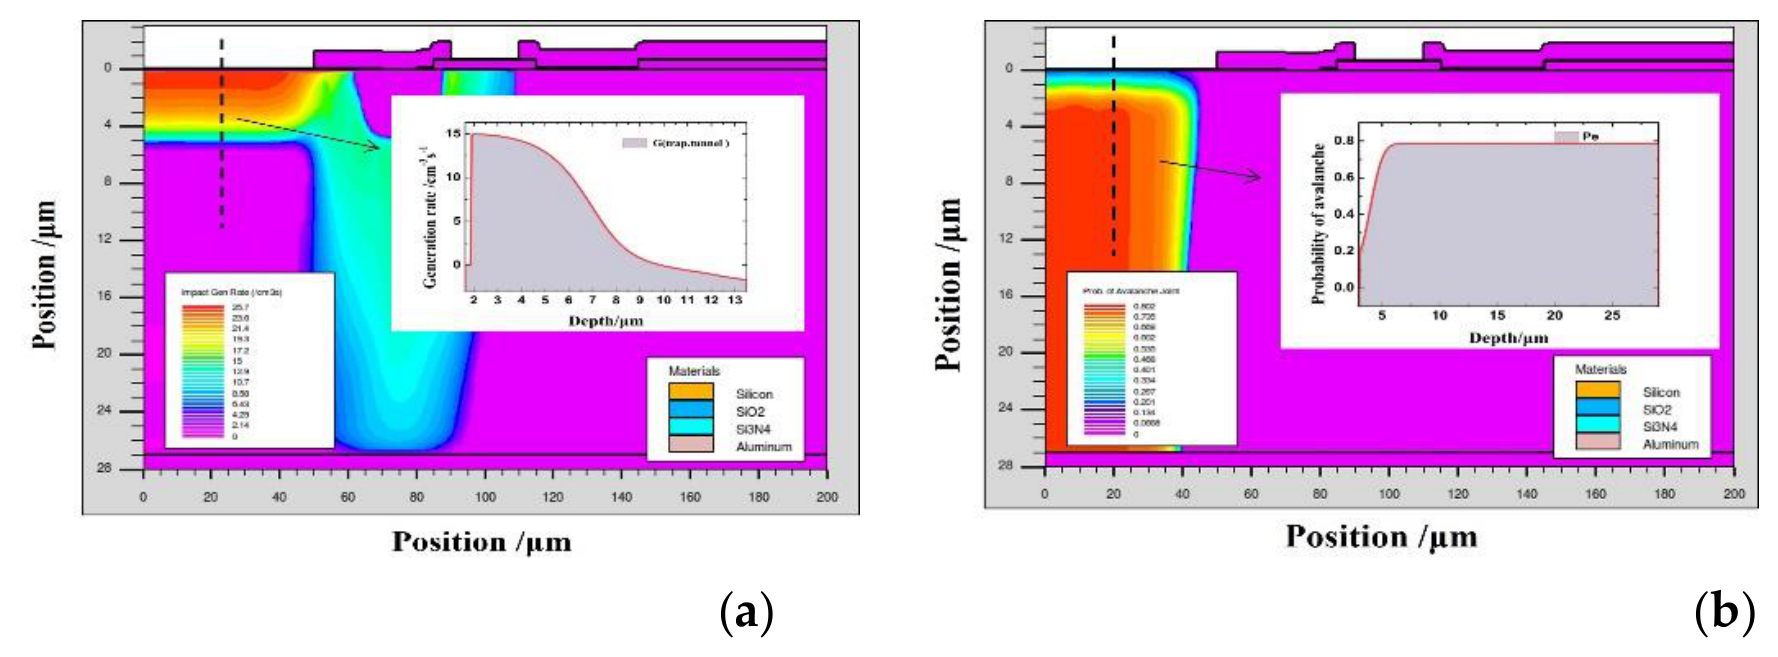
Figure 5.
(a) Simulation result of DCR varies with bias voltage (insert: Pe and GB2B vary with the bias voltage), (b) Measured and simulated DCR as a function of excess voltage.
Figure 5.
(a) Simulation result of DCR varies with bias voltage (insert: Pe and GB2B vary with the bias voltage), (b) Measured and simulated DCR as a function of excess voltage.
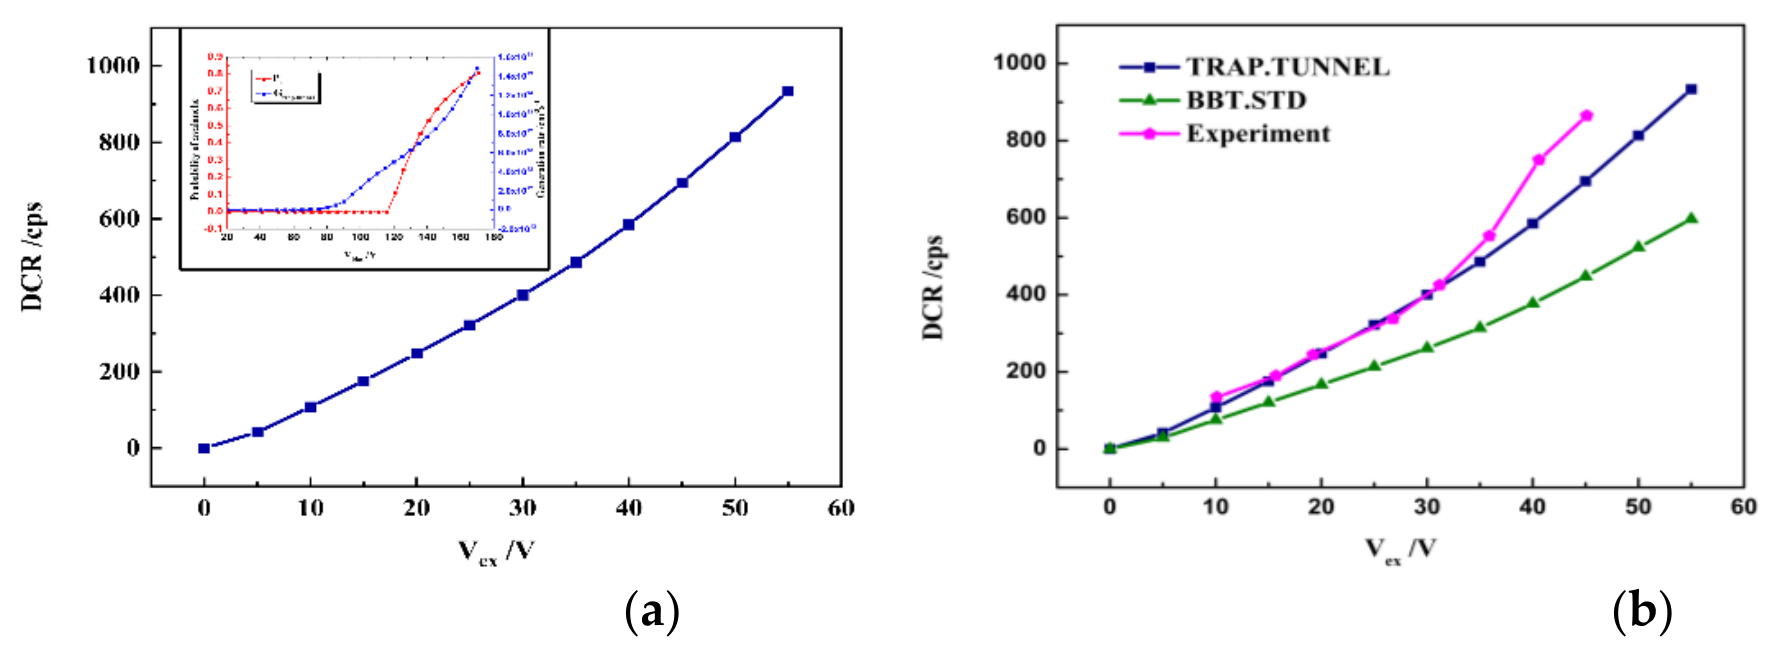
Figure 6.
(a) Simulation results of anode and available photo current (b) Measured and simulated PDP as a function of excess voltage.
Figure 6.
(a) Simulation results of anode and available photo current (b) Measured and simulated PDP as a function of excess voltage.
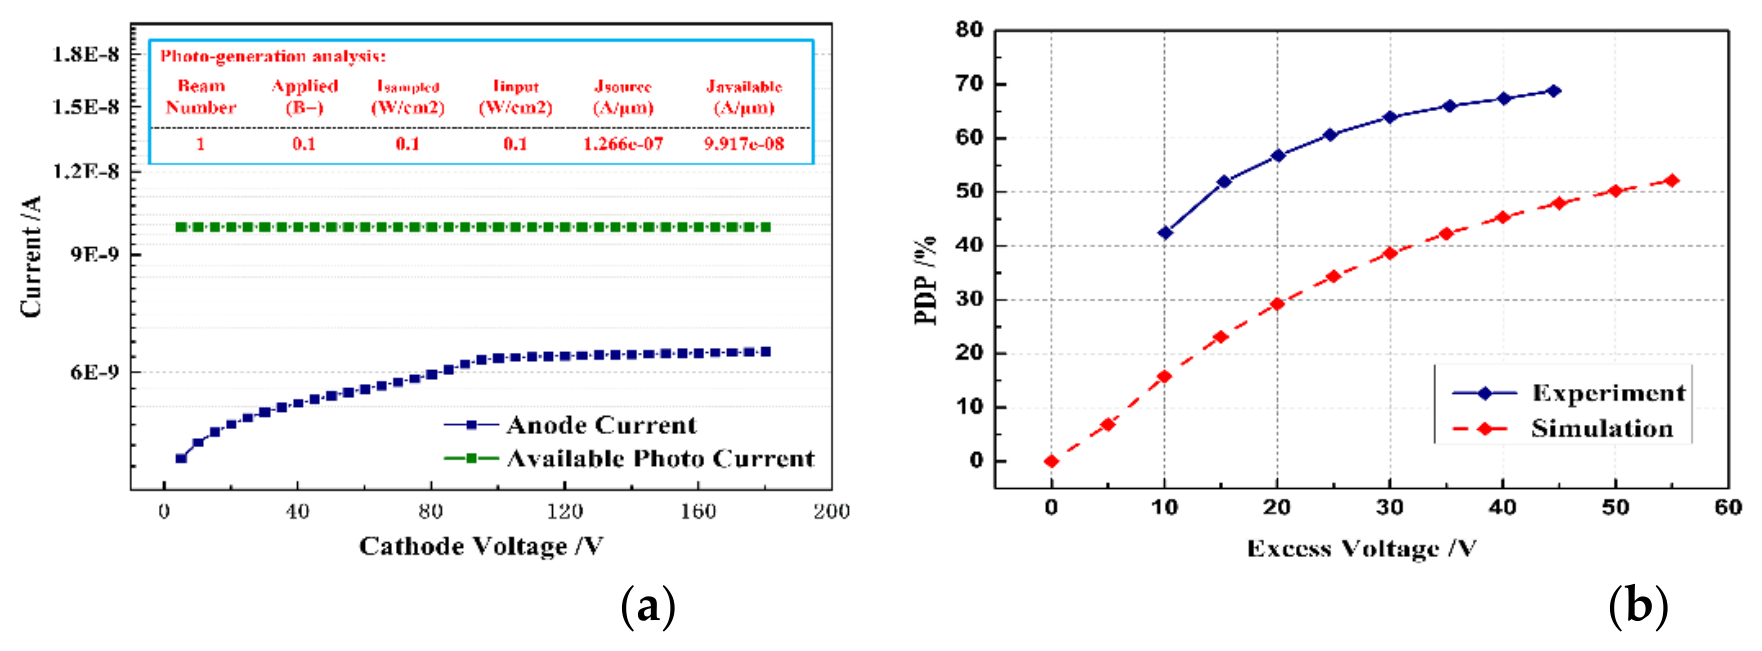
Figure 7.
The electric-field profile for implant doses of 4×1012cm-2, 6×1012cm-2, and 6.5×1012cm-2.
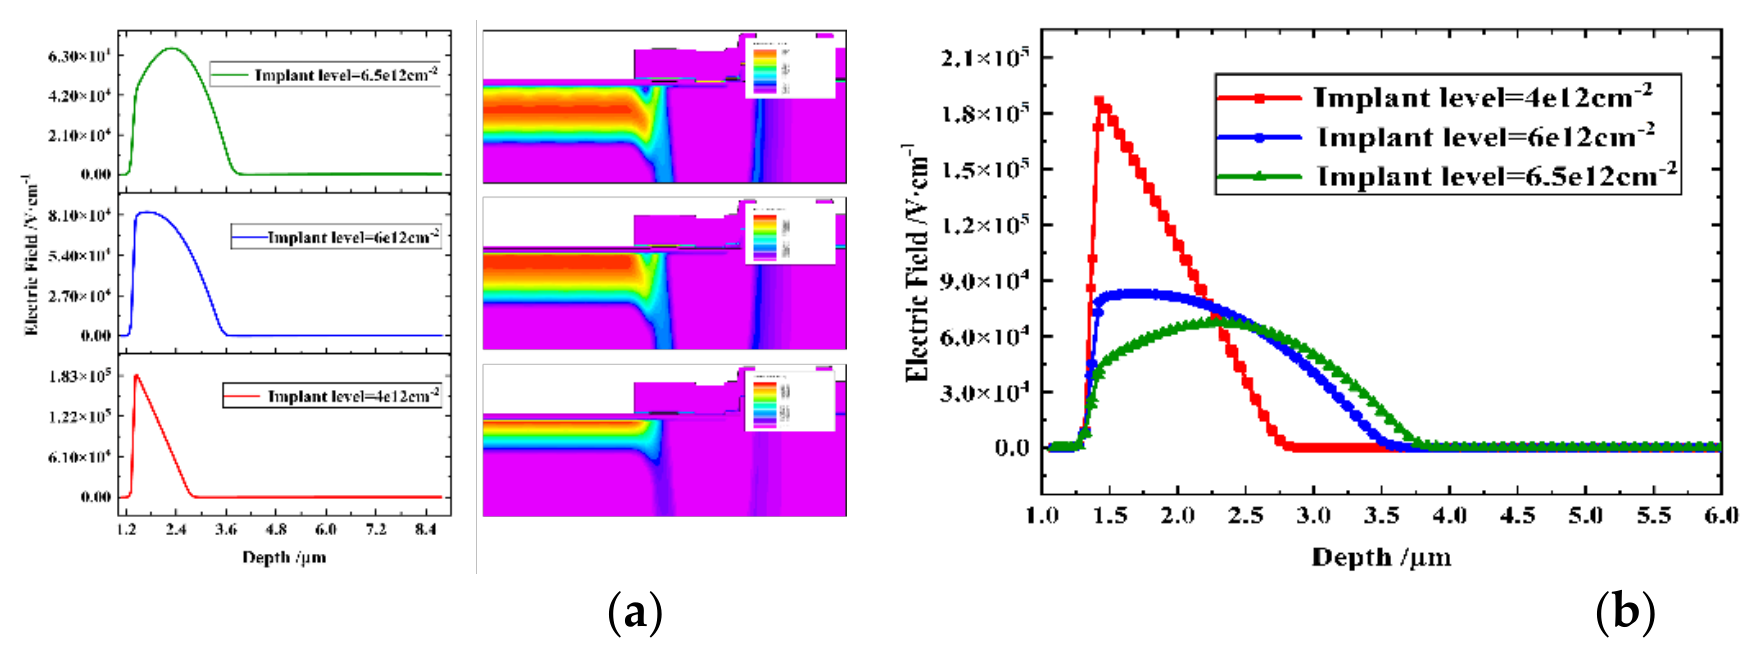
Figure 8.
DCR versus PDP for implant doses of 4×1012cm-2, 6×1012cm-2, and 6.5×1012cm-2.
Disclaimer/Publisher’s Note: The statements, opinions and data contained in all publications are solely those of the individual author(s) and contributor(s) and not of MDPI and/or the editor(s). MDPI and/or the editor(s) disclaim responsibility for any injury to people or property resulting from any ideas, methods, instructions or products referred to in the content. |
© 2026 by the authors. Licensee MDPI, Basel, Switzerland. This article is an open access article distributed under the terms and conditions of the Creative Commons Attribution (CC BY) license.
Copyright: This open access article is published under a Creative Commons CC BY 4.0 license, which permit the free download, distribution, and reuse, provided that the author and preprint are cited in any reuse.