

Submitted:
12 October 2026
Posted:
14 October 2026
You are already at the latest version
Abstract
This study empirically evaluates deep learning–based image analysis systems using real-world UAV imagery and investigates their applicability to public safety surveillance and enforcement. Field experiments were conducted with a police-operated mission drone and a high-resolution commercial UAV platform, covering daytime electro-optical (EO) and nighttime infrared (IR) imaging across varying altitudes and observation distances. Detection performance was assessed via valid detection ratio, false positive rate, and effective detection range. Results show that detection reliability is strongly constrained by input image resolution, target spatial scale, and environmental conditions, even when identical deep learning algorithms are applied. The mission drone maintained useful performance at short range and low altitude but degraded rapidly at medium and long ranges, whereas the high-resolution platform sustained stable detection over extended distances. Using ground sampling distance (GSD)-based optical equivalence, UAV imaging parameters were mapped to equivalent ground-based configurations, yielding conceptually derived performance thresholds linking image resolution and observation distance to detection reliability. These thresholds are interpreted in relation to ground-based intelligent traffic enforcement requirements, though empirical validation under fixed-camera conditions remains for future research. These findings highlight that minimum system-level imaging requirements, rather than algorithmic accuracy alone, are essential for designing, procuring, and certifying public-sector video analytics systems.
Keywords:
deep learning
; object detection
; unmanned aerial vehicles (UAVs)
; Intelligent traffic enforcement
; video analytics
; public safety surveillance
; image resolution
; performance evaluation
; drone-based monitoring
; traffic video surveillance
I. INTRODUCTION
Recent advances in deep learning–based video analytics have substantially improved performance in object detection and situational awareness, leading to their increasing adoption in public-sector applications such as traffic enforcement, crime prevention, and disaster response [1]. In particular, video analysis systems integrated with closed-circuit television (CCTV), mobile platforms, and unmanned aerial vehicles (UAVs) have emerged as effective tools for overcoming the spatial and temporal limitations of conventional manpower-based surveillance [2,3,4].
Along with global trends, law enforcement agencies have gradually incorporated drone-based video analytics into operational environments. In South Korea, police authorities have promoted the use of UAV-based surveillance systems since 2016, and operational drones equipped with onboard image analysis modules have been deployed since 2020 [5]. These initiatives reflect the transition of video analytics technologies from experimental research to practical public safety applications.
Despite the expanding deployment of intelligent video analysis systems, empirical investigations into minimum performance requirements for reliable field operation remain limited. Most existing studies evaluate detection algorithms using curated datasets and controlled environments, emphasizing metrics such as accuracy, recall, and mean average precision (mAP) [6,7]. However, real-world enforcement environments involve complex factors such as observation distance, viewing angle, illumination, and background clutter, which significantly affect system performance.
These limitations are particularly evident in intelligent traffic enforcement. Traffic violations often occur at medium to long distances under dynamically changing environmental conditions [8]. Nevertheless, many prior studies assume fixed camera positions and sufficient image quality or focus mainly on algorithmic improvements, providing limited guidance on practical system-level performance requirements [9,10].
Drone-based video analytics offer a valuable experimental platform for addressing these gaps. UAVs enable systematic data acquisition under varying altitudes, distances, and viewing conditions. Previous studies have shown that such factors significantly influence detection accuracy in drone imagery [11,12]. However, most existing research emphasizes model comparison rather than deriving operational performance standards for public safety missions.
Motivated by these gaps, this study conducts an empirical evaluation of deep learning–based image analysis systems using real-world drone video data. Optical (EO) and infrared (IR) imagery acquired from police-operated and commercial UAV platforms are analyzed and interpreted in relation to intelligent traffic enforcement scenarios. The primary objective is not to demonstrate the superiority of specific algorithms, but to identify empirically grounded minimum performance requirements for reliable public enforcement operations.
Specifically, this study analyzes detection performance according to flight altitude, object distance, and image resolution, and examines false-positive characteristics under operational conditions. Based on these analyses, preliminary performance thresholds are derived and interpreted in relation to the system-level requirements of ground-based enforcement imaging. The main contributions of this study include: (1) systematic evaluation of key environmental factors affecting detection performance using real UAV operational data; (2) development of a geometric mapping framework that translates drone-based imaging parameters into equivalent ground-based camera configurations; and (3) provision of empirically grounded evidence to inform future performance evaluation, procurement, and certification discussions for public-sector video analytics systems.
II. LITERATURE REVIEW
This study aims to empirically evaluate the performance of deep learning–based image analysis systems under real operational conditions and to extend the findings toward establishing performance requirements for intelligent traffic enforcement equipment. Accordingly, this section reviews relevant literature in three major categories: (1) deep learning–based object detection and video analytics, (2) intelligent traffic enforcement systems, and (3) empirical studies on UAV-based object detection.
A. Deep Learning–Based Object Detection and Video Analytics
Deep learning–based object detection has achieved remarkable progress with the development of convolutional neural networks (CNNs). Representative detection frameworks such as Faster R-CNN, SSD, and the YOLO series have been designed to localize and classify objects in near real time and have demonstrated strong performance on benchmark datasets [13,14,15,16]. These models have become foundational architectures for various video analytics applications in public and industrial domains.
Most existing studies primarily focus on improving detection accuracy, inference speed, and computational efficiency through architectural optimization and feature extraction techniques. Performance evaluations are typically conducted using curated public datasets such as COCO and PASCAL VOC under controlled experimental conditions [17]. Consequently, the influence of practical operational factors—including extended observation distance, reduced spatial resolution, illumination variation, motion blur, and background complexity—has received relatively limited attention.
Several studies have attempted to mitigate these challenges through multi-scale feature learning, feature pyramid networks, and resolution-adaptive processing methods [18,19]. In addition, super-resolution and image enhancement techniques have been introduced to improve detection performance in low-quality imagery [20]. Despite these advances, existing approaches remain largely algorithm-oriented and do not sufficiently address the minimum performance requirements necessary for reliable deployment in public-sector environments.
As a result, previous research has effectively addressed the question of which detection algorithms perform better under benchmark conditions, while providing limited guidance on what level of image quality and detection reliability is required for consistent real-world operation.
B. Intelligent Traffic Enforcement and Video-Based Monitoring Systems
In the field of Intelligent Transportation Systems (ITS), video analytics has been widely applied to traffic flow analysis, accident detection, and automated violation monitoring. Numerous studies have proposed deep learning–based frameworks for detecting vehicles, pedestrians, and traffic violations at intersections and road segments [1,23]. These systems have contributed to improving enforcement efficiency and traffic safety by enabling continuous and automated monitoring.
However, most existing evaluations assume fixed camera positions, stable viewing angles, and sufficient image resolution. Under such assumptions, reported performance metrics may not adequately reflect the variability of real enforcement environments. In practice, traffic monitoring systems are affected by installation constraints, extended observation distances, time-dependent illumination changes, and adverse weather conditions.
Several studies have attempted to incorporate environmental variability into detection models through adaptive background modeling and temporal analysis techniques [21]. Nevertheless, comprehensive empirical evaluations that systematically quantify performance degradation under diverse field conditions remain limited.
Moreover, reliable traffic enforcement depends not only on algorithmic accuracy but also on the physical and optical properties of imaging devices, including sensor resolution, lens quality, and effective detection range. Despite their importance, these hardware-related factors have rarely been examined in existing studies. Most research focuses on system architecture and software optimization rather than empirically validating hardware-level performance requirements. Consequently, standardized performance criteria for intelligent traffic enforcement equipment remain insufficiently established.
C. Empirical Studies on UAV-Based Object Detection
UAV-based video analytics has attracted increasing attention due to its ability to capture scenes under diverse altitudes, distances, and viewing conditions. This flexibility enables systematic investigation of how imaging parameters influence detection performance. Previous studies have demonstrated that flight altitude, camera angle, and sensor resolution substantially affect object detection accuracy in aerial imagery [11,22].
Several researchers have addressed performance degradation at higher altitudes and proposed high-resolution sensing, data augmentation, and multi-scale learning techniques to improve long-range detection [6,18]. Furthermore, specialized datasets such as VisDrone have been developed to facilitate UAV-based object detection research under realistic urban conditions [22].
Despite these contributions, most UAV-related studies emphasize algorithm benchmarking and dataset-driven performance comparison. Limited attention has been paid to deriving minimum operational standards for public safety missions. In addition, relatively few studies have attempted to interpret drone-based experimental results in relation to other public-sector applications such as traffic enforcement and surveillance.
As a result, although UAV-based experiments provide valuable insights into system behavior under diverse imaging conditions, their findings are rarely translated into practical guidelines for system design, procurement, and certification.
A notable contribution in this area is the work by Bakirci, who developed a UAV-assisted transportation monitoring framework integrating deep learning-based object detection with operational performance assessment under realistic deployment conditions. This study demonstrated that detection performance in UAV-based traffic monitoring is jointly constrained by imaging altitude, platform speed, and sensor resolution — findings that closely parallel the operational performance factors examined in the present study. The inclusion of real-world deployment constraints and performance degradation analysis in Bakirci’s framework provides additional empirical context for the minimum imaging requirements discussed in this study [23].
D. Research Gaps and Implications
In summary, previous studies on deep learning–based object detection, traffic video analytics, and UAV-based surveillance have achieved substantial progress in improving algorithmic performance. However, a common limitation lies in the lack of empirical research that establishes minimum performance requirements under realistic operational conditions.
In particular, quantitative analyses of the relationships among observation distance, image resolution, environmental conditions, and detection reliability remain insufficient. The absence of such analyses increases uncertainty in performance standardization and reduces field-level confidence in automated enforcement systems.
To address these limitations, this study conducts drone-based empirical experiments to systematically evaluate the performance characteristics of deep learning–based image analysis systems. The results are then extended to intelligent traffic enforcement scenarios to derive practical performance thresholds. By shifting the focus from algorithm-centered evaluation to operation-oriented validation, this study contributes to establishing evidence-based performance criteria applicable across public-sector surveillance and enforcement systems.
III. Methodology
A. Experimental Equipment Configuration
In this study, empirical experiments were conducted using both police-operated mission drones deployed for actual public safety operations and commercially available high-resolution UAV imaging systems. The primary objective of the comparative experiments was not to evaluate the overall performance of different drone platforms, but to investigate how variations in image resolution and visual quality influence detection performance under an identical deep learning–based analysis environment.
To ensure experimental consistency, the same detection algorithms, processing pipelines, and parameter settings were applied across all experiments. By controlling analytical variables, this study isolates the effects of input image characteristics on detection accuracy and reliability.
The police mission drone used in this study is equipped with a gimbal-mounted camera integrating both electro-optical (EO) and infrared (IR) sensors. This system has been actively deployed in public safety, search-and-rescue, and enforcement operations, ensuring that the experimental data reflect real operational conditions.
In all experiments, the gimbal camera was oriented obliquely toward the take-off point, where the designated target group (the pilot and ground crew) was standing, so that the target was kept within the field of view at every altitude–distance position (Figure 1). Consequently, the camera depression angle was not fixed but was determined by the flight geometry, θ = arctan(H/D), where H is the flight altitude and D is the horizontal distance to the target; for the EO conditions, θ ranged from approximately 7° (H = 50 m, D = 400 m) to 63° (H = 100 m, D = 50 m). This configuration was chosen for two reasons. First, it guarantees that persons of known identity and position appear in every image, which is the ground truth available in this dataset and which enables the image-level target hit rate defined in Section III.D. Second, the oblique, stand-off view reproduces the viewing geometry of roadside and pole-mounted enforcement cameras, which observe targets at shallow depression angles rather than from directly overhead; it is therefore the geometry relevant to the mapping in Section III.E. Optical zoom was deliberately not used (wide-angle end of the lens), so that the ground sampling distance at the target varied only with slant range and not with an additional, operator-dependent zoom factor.
The EO camera is based on a 1/2.8-inch CMOS sensor and supports Full HD (1920 × 1080) resolution. It provides up to 30× optical zoom capability, with a focal length range of approximately 4.3 mm to 129 mm. In the present experiments, the lens was kept at its wide-angle end (f = 4.3 mm), giving a horizontal field of view of approximately 66° and a pixel pitch of approximately 2.9 µm.
The IR camera employs a medium-resolution thermal sensor with a spatial resolution of 640 × 480 pixels and operates within a wavelength band suitable for human detection under low-light and nighttime conditions. As this equipment is currently used in real police missions, the experimental results obtained in this study directly reflect practical deployment constraints and operational feasibility.
To examine the effects of image resolution and visual quality on detection performance, a commercially available UAV platform, the DJI Mavic 3, was employed as a reference imaging system. The DJI Mavic 3 is equipped with a high-resolution optical camera based on a 4/3-inch CMOS sensor and is capable of capturing still images with a maximum resolution of 5280 × 3956 pixels. Its main camera has a fixed focal length of 12.29 mm (24 mm full-frame equivalent), a horizontal field of view of approximately 70°, and a pixel pitch of approximately 3.3 µm.
The camera supports an adjustable aperture range from F/2.8 to F/11 and provides digital zoom functionality, which was not used in this study. These features enable flexible control of image exposure and spatial resolution under different environmental conditions.
In this comparative experiment, the DJI Mavic 3 served as a representative example of high-resolution image acquisition equipment. It was designated as a benchmark system for evaluating performance differences under the same deep learning–based analysis framework. Accordingly, the observed performance variations are interpreted as consequences of differences in input image resolution and quality, rather than differences in flight dynamics, stabilization, or platform-level control capabilities.
B. Input Data, Imaging Environment, and Experimental Design
The experimental design considered both daytime and nighttime operating conditions. Daytime experiments primarily focused on electro-optical (EO) imagery, whereas nighttime experiments emphasized infrared (IR) thermal imagery. Flight altitudes were systematically configured based on ranges commonly adopted in public safety drone operations. The horizontal distance between the UAV and the target group was increased in 10 m increments, from 50 m to 400 m for EO imaging and from 50 m to 120 m for IR imaging, to evaluate distance-dependent performance variations (Figure 1 and Figure 5).
During daytime experiments, the UAV altitude was fixed while the distance to the target was gradually increased. One still image was acquired at each distance position, yielding 36 images per altitude for each EO platform and 8 images per altitude for the IR camera (Table 2). This design enabled systematic comparison between image resolution degradation caused by increased observation distance and corresponding changes in detection performance. For nighttime experiments, data acquisition followed the same procedure but was conducted within relatively lower altitude ranges, considering the sensing characteristics and effective range of the thermal camera.
Specifically, for IR nighttime experiments, altitudes of 50 m and 75 m were selected, whereas EO daytime experiments used 50 m and 100 m. This difference was intentional and reflects the inherent resolution limitations of the thermal sensor (640 × 480 pixels), whose effective human-detection range is substantially shorter than that of the EO camera (Full HD, 1920 × 1080 pixels). Preliminary field observations confirmed that reliable thermal detection of human targets became impractical above approximately 75–80 m altitude due to insufficient thermal contrast and pixel density. Consequently, to ensure that the IR experiments would yield interpretable detection data, altitude conditions were limited to 50 m and 75 m. This deliberate calibration of altitude ranges to sensor capability, rather than standardizing conditions across sensor modalities, better reflects realistic operational deployment constraints for each sensor type.
Throughout the data collection process, environmental factors frequently encountered in real operational contexts, including backlighting, shadowing, and background clutter, were intentionally preserved. No artificial filtering or exclusion of unfavorable conditions was applied. This approach ensured that the experimental results reflected realistic enforcement and search-and-rescue environments rather than idealized laboratory settings.
Input data. Table 2 summarizes the input data. All images were captured as still frames in the native output format of each camera and were analyzed at their native resolution: 1920 × 1080 pixels (Scanbee EO), 5280 × 3956 pixels (Mavic 3), and 640 × 480 pixels (Scanbee IR). No cropping, resampling, or enhancement was applied before analysis. The test site was an open sports ground (athletic track and playing field) bordered by access roads, lighting poles, signs, parking areas, fences, trees, and low-rise buildings (Figure 3 and Figure 4). These roadside structures were retained in the field of view because they are the principal sources of false detections in enforcement imagery.
Ground truth and people density. The only persons whose presence and location were controlled were the members of the designated target group standing together at the take-off point; because the camera was aimed at them, this group was within the field of view in every image. Other persons (e.g., pedestrians on adjacent roads or sports facilities) were not controlled and were not systematically annotated. The scenes are therefore of low people density: each image contains one small cluster of persons and, at most, a few incidental pedestrians, and person pixels occupy a negligible fraction of the frame. This has two consequences for interpretation. First, conventional recall—the fraction of all persons present that are detected—cannot be computed for this dataset and is not reported; instead, the image-level target hit rate (Section III.D) is used as a partial, target-based indicator of missed detections. Second, because human instances are rare relative to human-like background structures, precision is expected to be lower than in dense scenes, where a larger share of candidate regions are true persons. The results should therefore be interpreted as applying to sparse, low-density scenes typical of search, perimeter, and roadside monitoring, and not to crowd monitoring, where occlusion and overlapping instances would dominate.
Design rationale. The main design choices and their motivations are as follows. (i) Altitudes of 50 m and 100 m bracket the altitudes at which the Scanbee platform is routinely flown in police missions, while remaining below the 150 m ceiling for drone operations under Korean aviation regulations. (ii) A horizontal range of 50–400 m in 10 m steps spans typical roadside and intersection observation distances, and the spacing is fine enough to locate the distance at which detection fails. (iii) Still images, rather than video, were used because the analysis module of the operational police system processes captured frames offline, and still images allow each condition to be reproduced and inspected individually. (iv) The same software, model, and sensitivity setting were used for all images, so that the two platforms differ only in their input imagery. (v) The DJI Mavic 3 was included not as a competing operational platform, but as a reference whose larger sensor and higher pixel count provide a finer GSD at the same slant range.
C. Image Analysis Procedure
The collected image data were processed offline using the designated deep learning–based analysis system. All images were analyzed under identical sensitivity and parameter settings to ensure consistency across experimental conditions. For each image, the detection outputs—including object location, detection confidence, and duplicate detection instances—were recorded.
The analysis module of the operational police system uses a YOLOv8s detector [24]. Because the model is embedded in the operational platform, its weights and architecture could not be altered, which reflects the real deployment context. Each detection output (bounding box) was reviewed visually and labeled either as a valid detection (true positive, TP), when the box enclosed a real person, or as a false detection (false positive, FP), when it enclosed a non-human object such as a sign, pole, bicycle, or roadside structure.
In this study, the analysis was restricted to objects classified as human subjects. This focus was motivated by three considerations. First, the police-operated Scanbee drone is primarily deployed for public safety missions — including missing-person search, crowd monitoring, and perimeter surveillance — in which human detection constitutes the central operational task. Second, human targets present a well-defined and consistent reference class for isolating the effects of imaging parameters (altitude, distance, resolution) on detection reliability, without the additional variability introduced by multi-class detection. Third, the deep learning system used in this study was configured and validated for human detection, and extending to vehicle or license-plate classes would require separate model validation and calibration beyond the scope of this operational evaluation. The extension of the analytical framework to traffic-specific object categories such as vehicles, license plates, and traffic signals is acknowledged as an important direction for future research and is explicitly discussed in the Limitations section. The detection sensitivity was set to the highest available level among predefined system configurations, reflecting operational priorities in public enforcement and search scenarios where minimizing false negatives is critical.
At the same time, false-positive detections resulting from increased sensitivity were treated as a major evaluation factor. The trade-off between detection sensitivity and reliability was therefore explicitly considered in the performance analysis.
For each altitude condition, detection results were accumulated over all distance positions, and the numbers of TPs and FPs were tallied per image and per condition. Pooling over positions reduces the influence of incidental outcomes in individual images; per-position results are shown in Figure 3 and Figure 4, and the uncertainty of pooled proportions is quantified with 95% Wilson score intervals [25].
D. Performance Evaluation Metrics
To evaluate the performance of the image analysis system, the following metrics were employed in this study.
First, the detection count represents the total number of objects detected by the analysis system (TP + FP) under each imaging condition. This metric is used to provide an intuitive indication of the system’s detection sensitivity and responsiveness to visual input.
Second, the valid detection ratio is the proportion of detections that were correctly identified as human subjects, i.e., the precision, P = TP/(TP + FP). It is the primary indicator of practical usability, because it reflects the extent to which an operator alerted by the system is looking at a real person.
Third, the false discovery rate (FDR) is the proportion of detections that were non-human objects incorrectly classified as persons, FDR = FP/(TP + FP) = 1 − P. (The conventional false positive rate, FP/(FP + TN), is not used because the number of true negatives is undefined in object detection.) False detections caused by traffic signs, bicycles, roadside structures, and similar objects were analyzed to characterize error patterns.
Fourth, the image-level target hit rate is the proportion of images in which at least one valid human detection was produced, HR = nhit/nimages. Because the designated target group was within the field of view of every image, an image without any valid detection is a guaranteed miss; HR is therefore a coarse, target-based counterpart of recall. It is not equivalent to recall: it does not count how many of the persons present were detected, and a valid detection may correspond to an incidental pedestrian rather than to the target group. Conventional instance-level recall, TP/(TP + FN), requires the number of persons present in each image—without it, FN is unknown—and is therefore not reported in this study.
Finally, an effective detection range was derived by integrating detection outcomes across different altitude and distance conditions. This range represents the spatial region within which the system consistently satisfies predefined performance criteria. It serves as a key outcome variable for discussing minimum performance requirements for intelligent traffic enforcement imaging systems.
The performance criterion used to determine the effective detection range was a valid detection ratio (precision) of 50% or above—equivalently, an FDR of 50% or below—together with a contiguous run of target hits, i.e., consecutive distance positions with at least one valid detection. The selection of 50% as the operational threshold reflects two considerations. First, in the context of public safety and enforcement supplementation — where UAV-based detection serves as a screening tool rather than a sole evidentiary basis — a system that correctly identifies the target in at least half of its detection outputs provides operationally useful signal for directing human operator attention. This is consistent with the tiered reliability framework adopted in several national drone surveillance deployment guidelines, where human-in-the-loop review compensates for system-level false positives [5]. Second, below 50% precision more than half of the alerts presented to an operator are false, so that reviewing alerts begins to cost more operator effort than it saves. We acknowledge that for high-stakes enforcement contexts requiring evidentiary certainty, substantially higher thresholds (e.g., ≥80%) would be appropriate, and we recommend that future certification frameworks adopt context-specific threshold criteria calibrated to the intended use case.
In deriving the effective detection range, the projected size of the target in the image was used as the variable linking the platforms. Using the imaging geometry described in Section III.E (Equations (1)–(3)), the projected height of a standing adult can be computed for every altitude–distance position from the sensor specifications in Table 1 (Table 3 and Figure 6). The positions at which contiguous valid detection ended coincide with a projected target height of approximately 30 pixels, corresponding to a width of approximately 10 pixels and a slant-range GSD of approximately 6 cm/pixel. For the Scanbee EO camera at 50 m altitude, valid detections occurred at D = 50 m and 60 m (≈30 and ≈28 pixels) and not beyond; for the Mavic 3 at 50 m altitude, the contiguous run of valid detections ended at D = 190 m (≈33 pixels), with only sporadic detections beyond. Because an obliquely viewed standing person has an aspect ratio of roughly 3:1, the threshold is expressed as a minimum projected height rather than as a square (30 × 30 pixel) bounding box. The value was identified from the observed detection boundaries rather than through a formal optimization procedure; it is of the same order as the 32-pixel scale below which objects are categorized as small in the COCO benchmark [17], a regime known to be difficult for CNN-based detectors [6]. A formal estimate, for example by logistic regression of per-image hit outcomes on projected target height, would require more images per condition and is identified as future work.
E. Performance Mapping to Intelligent Traffic Enforcement Environments
To extend drone-based empirical findings to intelligent traffic enforcement contexts, this study conducted a geometric mapping between UAV flight parameters and ground-based monitoring conditions. The validity of this mapping rests on the optical equivalence between airborne and ground-mounted camera configurations. Specifically, the apparent pixel size of a target object—determined by the ratio of sensor resolution to field of view—follows the same geometric optics principles regardless of whether the camera is airborne or ground-mounted. This relationship is formally captured by the ground sampling distance (GSD), which defines the ground area represented by a single pixel and depends on sensor size, focal length, and imaging distance. Consequently, a UAV operating at a given altitude and horizontal distance produces imaging conditions that are geometrically equivalent to a ground-based camera positioned at a corresponding installation height and observation distance, provided that GSD and image quality remain consistent across both configurations.
Image-to-ground transformation. The transformation between image and ground coordinates follows the standard pinhole camera model [26] under a flat-ground assumption (Figure 2). Let H be the flight altitude, D the horizontal distance between the point directly below the UAV and the target, f the focal length, and p the pixel pitch of the sensor. The slant range R and the depression angle θ of the line of sight to the target are
R = √(H2 + D2), θ = arctan(H/D). (1)
The ground sampling distance measured perpendicular to the line of sight at the target (slant-range GSD) is
and, along the ground in the viewing direction, the footprint of one pixel is elongated to GSDR/sin θ. A standing person of height h, body depth d, and shoulder width w therefore projects onto approximately
pixels in height and width (h = 1.7 m, d = 0.3 m, and w = 0.5 m are used here). For a camera whose optical axis is depressed by θc, an image point with sensor-plane coordinates (x, y), measured from the principal point (y positive downward), is mapped to ground coordinates (X, Y)—origin directly below the camera, Y along the viewing direction—by
GSDR = p · R/f, (2)
hpx ≈ (h cos θ + d sin θ)/GSDR, wpx ≈ w/GSDR (3)
X = H x/(f sin θc + y cos θc), Y = H (f cos θc − y sin θc)/(f sin θc + y cos θc). (4)
Equation (4) locates a detected bounding box on the ground (using its bottom-center point), and its inverse gives the image position of a ground target at a known location. Because the gimbal was aimed at the target, θc ≈ θ and the target lies near the image center (x ≈ 0, y ≈ 0), where Equation (4) reduces to Y = H/tan θ = D. Equations (1)–(3) were evaluated for every altitude–distance position using the sensor parameters in Table 1; representative values are listed in Table 3. Their accuracy is limited by the flat-ground assumption, by the positioning accuracy of the UAV, and by lens distortion, which was not corrected; at the distances studied, these factors change R by only a few percent.
Mapping to ground-based cameras. A ground-mounted camera with pixel pitch pg and focal length fg observing a target at slant range Rg reproduces the target pixel size observed from the UAV when GSDR is equal, i.e., Rg = R · (fg/pg)/(f/p). For a required minimum projected height hpx,min, the maximum slant range at which a camera still delivers it is Rmax = h f/(hpx,min p) (for the shallow depression angles typical of roadside cameras), and the focal length required to cover a monitoring distance R is freq = hpx,min p R/h. For example, with hpx,min = 30 pixels and h = 1.7 m, a 1/2.8-inch Full HD sensor (p ≈ 2.9 µm) with a 4.3 mm lens satisfies the requirement only up to R ≈ 84 m, whereas covering 150 m with the same sensor requires f ≈ 7.7 mm; the Mavic 3 camera reaches R ≈ 211 m. These values are consistent with the detection boundaries observed in Section IV (slant ranges of ≈78 m and ≈197 m for the Scanbee and Mavic 3 at 50 m altitude, respectively).
The effective detection ranges derived from UAV experiments were interpreted in relation to typical surveillance distances observed at intersections, roadside monitoring points, and enforcement zones by applying GSD-based equivalence calculations. This approach enables a systematic translation of UAV-based performance observations into preliminary imaging requirements for ground-based deployment scenarios, while acknowledging that differences in viewing angle, platform vibration, depth-of-field behavior, and target object categories between aerial and ground-mounted systems may affect the direct applicability of the derived thresholds.
Through this approach, the empirical results obtained from UAV-based experiments serve as preliminary reference evidence for discussing the minimum imaging requirements that ground-based intelligent traffic enforcement systems should satisfy. It is important to note, however, that this mapping is conceptual in nature and does not constitute a direct empirical validation of ground-based system performance. The thresholds derived here should therefore be interpreted as informed starting points for system design and procurement discussions, subject to further validation through dedicated fixed-camera field experiments.
IV. RESULTS
This section presents the empirical findings obtained from the drone-based video analysis experiments. The results are categorized into daytime electro-optical (EO)–based experiments and nighttime infrared (IR)–based experiments. The performance of the police-operated Scanbee drone imaging system is compared with that of the high-resolution reference system (DJI Mavic 3).
All experiments were conducted under an identical deep learning–based analysis framework. The detection algorithms, processing pipelines, and parameter settings were consistently maintained throughout the experiments to ensure that observed performance differences could be attributed exclusively to variations in input image quality.
A. Results of Daytime Electro-Optical (EO) Image Analysis
The daytime experiments focused on analyzing variations in detection performance according to changes in flight altitude and object distance. Under all experimental conditions, identical detection algorithms and sensitivity settings were applied, enabling systematic observation of performance changes resulting solely from differences in input image resolution and visual quality.
1) Results Based on Scanbee Police Drone Imagery
For the Scanbee police drone at an altitude of 50 m, valid human detections were obtained only at the two closest positions (D = 50 m and 60 m, where the projected target height is ≈30 and ≈28 pixels), giving an image-level target hit rate of 2/36 (5.6%). Because the high-sensitivity setting produced false detections across the distance range, the pooled precision was only 3.2% (2 of 62 detections; Table 4).
In particular, under distance conditions exceeding 200 m, the number of false detections increased sharply. A substantial number of misclassification cases were recorded, in which traffic signs, roadside structures, and background objects were incorrectly identified as human targets.
These performance degradations are attributed primarily to reduced spatial resolution and decreased object size in the captured imagery as observation distance increased. As image detail deteriorated, the deep learning model exhibited greater difficulty in distinguishing human targets from surrounding objects.
At an altitude of 100 m, these tendencies became more pronounced. Even under identical horizontal distance conditions, an increase in flight altitude led to further reductions in valid detection ratios. This finding confirms that both altitude and distance jointly influence detection reliability, primarily through their combined effects on image resolution and target representation.
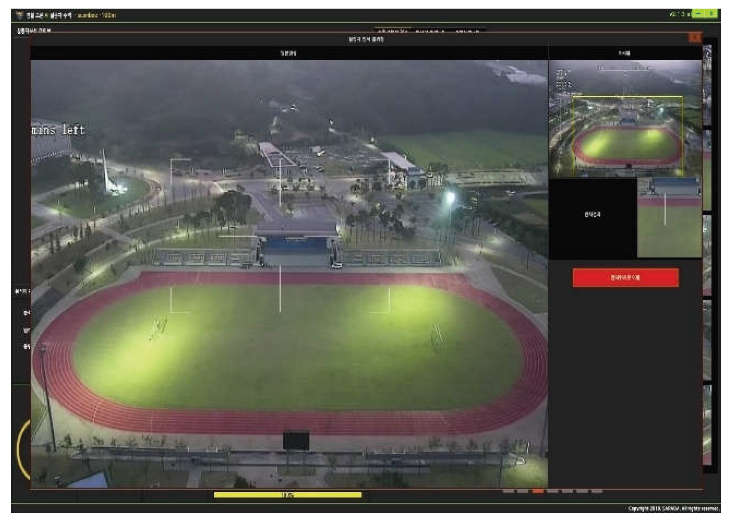
At 100 m altitude, five valid detections (precision 2.8%, 5/180) occurred at isolated positions between D = 230 m and 290 m (Figure 3), where the projected height of the target group is only ≈8–10 pixels (Table 3). At this pixel size, these detections are unlikely to correspond to resolved members of the target group and more plausibly reflect incidental persons closer to the camera or chance matches; the image-level hit rate at this altitude (5/36, 13.9%) should therefore not be read as evidence of long-range detection capability.
2) Results Based on DJI Mavic 3 Imagery
Under the same analytical framework, the experiments conducted using high-resolution imagery acquired by the DJI Mavic 3 demonstrated consistently higher valid detection ratios and lower false positive rates compared with those obtained from the police mission drone system.
At an altitude of 50 m, valid detections were obtained at 34 of the 36 positions (image-level hit rate 94.4%). Detection was contiguous from D = 50 m to 190 m, over which the projected target height decreases from ≈74 to ≈33 pixels; from 220 m onward (≤29 pixels), valid detections continued up to 400 m, but typically as single detections per image, whereas several members of the target group were detected per image at shorter distances (bubble sizes in Figure 4). The pooled precision at this altitude was 51.3% (58/113; Table 5).
At an altitude of 100 m, a gradual decline in detection performance was observed as the observation distance increased. However, compared with the police mission drone imagery under identical conditions, the reduction in valid detection ratios was substantially less pronounced. This suggests that high-resolution input imagery mitigates performance degradation associated with increased distance and altitude.
At 100 m altitude, valid detections occurred at 8 of the 36 positions (22.2%), with the largest counts at D = 110–130 m and isolated hits between 210 m and 290 m. No valid detection was obtained at D = 50–100 m, even though the projected target height there (≈34–37 pixels) exceeds the 30-pixel level. At these positions the depression angle is 45–63°, so the target is seen largely from above, a viewpoint that is under-represented in the ground-level imagery on which general-purpose detectors are trained [17,22]. This indicates that, in addition to pixel size, steep viewing angles reduce detectability, as discussed further in Section V. The pooled precision at 100 m was 26.8% (11/41).
These findings indicate that enhanced spatial resolution and richer structural information in high-quality imagery enable the deep learning–based analysis system to more effectively preserve object features, thereby improving target discrimination and reducing misclassification. Consequently, high-resolution image acquisition plays a critical role in sustaining reliable detection performance in long-range surveillance and enforcement scenarios.
3) Comparative Analysis of Daytime EO-Based Results
A comparative examination of the results obtained from the two imaging systems clearly demonstrates that differences in input image resolution and visual quality exert a substantial influence on deep learning–based detection performance. The Scanbee police drone system exhibited detection capabilities sufficient for public safety operations; however, its performance degraded relatively rapidly as flight altitude and observation distance increased.
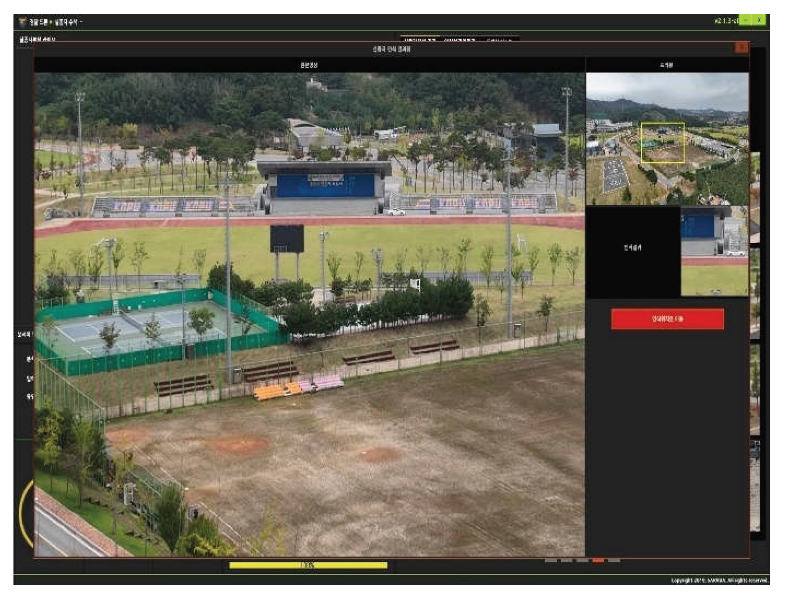
To complement the quantitative detection metrics, a qualitative comparison of detection outputs across the two imaging systems reveals further system-level differences. Under identical scene conditions at 50 m altitude, the Scanbee system images show human targets represented as blurred, low-contrast regions with indistinct body contours, resulting in the detector producing large, diffuse bounding boxes with low confidence scores that frequently overlap with background objects (e.g., road markings, signs). In contrast, DJI Mavic 3 images under the same conditions reveal clearly defined body posture and limb structure, yielding tight, high-confidence bounding boxes with minimal background overlap. At 100 m altitude, this qualitative contrast becomes more pronounced: Scanbee images render the target as a few-pixel cluster indistinguishable from background texture, whereas Mavic 3 images retain sufficient structural detail to support reliable discrimination. These qualitative observations corroborate the quantitative results and suggest that resolution-driven degradation manifests not only in detection rate but also in the spatial precision and confidence characteristics of individual detections.
In contrast, the DJI Mavic 3 system maintained a wider effective detection range under the same analytical conditions. This indicates that high-resolution image acquisition enables more stable preservation of object features, even under extended observation distances.
These findings suggest that securing a minimum level of image resolution is essential for ensuring reliable performance in intelligent traffic enforcement environments. The results empirically demonstrate that algorithmic performance alone is insufficient to guarantee operational reliability, and that adequate imaging quality constitutes a fundamental prerequisite for sustainable enforcement accuracy.
B. Results of Nighttime Infrared (IR) Image Analysis
Under nighttime conditions, human detection performance was evaluated using infrared (IR) thermal imagery. Unlike EO imagery, thermal images provide limited color and texture information; however, object contours based on temperature differentials serve as the primary cues for target detection.
Accordingly, the analysis focused on evaluating how effectively the deep learning–based system could utilize thermal contrast to distinguish human targets from surrounding objects under low-visibility conditions. The experimental results provide insights into the operational limitations and advantages of IR-based detection in nocturnal enforcement and search-and-rescue scenarios.
The analysis of thermal imagery acquired by the police mission drone indicates that, at an altitude of 50 m, human targets could be detected within a limited operational range. However, as the horizontal distance between the UAV and the target increased, the detection success rate exhibited a gradual decline.
At an altitude of 75 m, detection was achievable under certain conditions; nevertheless, stable and reliable detection was difficult to maintain due to image distortion and inherent resolution limitations of the thermal sensor.

Table 6.
IR-Based Image Analysis Results of the Police Mission Equipment.
| Altitude (m) | No. of Images | Detection image | Remarks | |
| Valid Detections | False detection | |||
| 50m | 8 | 2 | • | |
| 75m | 8 | 5 | • | |
Although the thermal imaging analysis was based on a relatively limited dataset, which constrains the generalizability of the findings, the results indicate that deep learning–based video analysis can achieve a reasonable level of detection performance under appropriate altitude and distance conditions, even in nighttime environments.
The difference in analysis time between the two platforms — approximately 3 minutes for the Scanbee system versus approximately 9 minutes for the DJI Mavic 3 — primarily reflects differences in image volume and resolution rather than platform endurance. The Scanbee system produced lower-resolution imagery that required less computational processing time per image, whereas the high-resolution DJI Mavic 3 images required substantially greater processing overhead. Battery endurance was not a constraining factor in these experiments; both platforms maintained stable flight throughout each session. The Scanbee police drone offers a rated flight endurance of approximately 35–40 minutes per charge, while the DJI Mavic 3 provides approximately 46 minutes. Neither platform approached endurance limits during the experimental sessions, which were designed to be completed well within operational battery margins.
In particular, the findings suggest that detection performance may be further enhanced in real-time video analysis settings, where continuous temporal information can be exploited, compared with still-image–based analysis.
C. Implications for Intelligent Traffic Enforcement Environments
An integrated analysis of the daytime and nighttime experimental results indicates that the performance of deep learning–based image analysis systems is highly dependent on input image resolution, observation distance, and environmental conditions. By analogy, similar dependencies are expected to arise in ground-based intelligent traffic enforcement environments, where comparable imaging constraints—such as limited sensor resolution, extended monitoring distances, and variable illumination—are commonly encountered.
Across platforms, the findings are summarized most compactly by the projected size of the target rather than by altitude or distance alone (Figure 6). For both EO cameras, contiguous valid detection was maintained while the projected height of a standing person was at least ≈30 pixels (slant-range GSD ≲ 6 cm/pixel) and the depression angle was below ≈45°; outside this region, detections were absent or sporadic. Because the Mavic 3 delivers a GSD about 2.5 times finer than the Scanbee EO camera at the same slant range, this region extended to D ≈ 190 m at 50 m altitude, compared with D ≈ 60 m for the Scanbee. Expressed in camera-independent terms, camera installation height (through θ), monitoring distance (through R), and sensor resolution and focal length (through p/f) jointly determine whether the 30-pixel condition is met; this is the quantity that should be specified for ground-based enforcement cameras (Section III.E).
Accordingly, this study provides quantitative evidence that appropriate system-level design and deployment strategies are essential for achieving sustainable and trustworthy performance in intelligent traffic enforcement systems.
V. DISCUSSION
This study empirically demonstrated, through drone-based field experiments, that the performance of deep learning–based image analysis systems varies substantially according to input image resolution, observation distance, and environmental conditions. In particular, the comparative analysis between the police-operated Scanbee drone system and the high-resolution DJI Mavic 3 platform clearly indicates that input image quality constitutes a primary determinant of detection reliability, even when identical analytical algorithms are applied.
A. Interpretation of Performance Characteristics of the Scanbee System
The Scanbee drone imaging system, which was designed for public safety missions, exhibited a fundamental level of human detection capability under both daytime EO and nighttime IR conditions. Under flight altitudes below 50 m and relatively short observation distances, valid detections of the target group were obtained, indicating potential applicability to close-range tasks such as missing-person searches, provided that the high false-detection rate is managed through operator review.
However, as flight altitude and target distance increased, detection performance deteriorated relatively rapidly, and the frequency of false-positive detections increased under medium- and long-range conditions. This tendency is primarily attributed to the limited optical resolution of the Scanbee imaging system, which restricts the availability of sufficient spatial and structural information for reliable target representation at extended distances.
These findings suggest that the observed performance limitations originate not from deficiencies in the detection algorithms, but from constraints in spatial resolution and object representation inherent in the input imagery. Consequently, evaluating system performance solely based on algorithmic accuracy is insufficient to explain operational limitations. Instead, the physical and optical characteristics of image acquisition devices must be jointly considered. To further substantiate this conclusion, replacing the Scanbee imaging system with the DJI Mavic 3 while holding the detection algorithm constant resulted in a valid detection ratio increase from 3.2% to 51.3% at 50 m altitude — a 16-fold improvement attributable to the change in input imagery (sensor size, pixel count, and optics), since the detector and its settings were unchanged. This empirical contrast directly quantifies that imaging quality exerts substantially greater influence on detection outcomes than algorithmic processing under the conditions tested. A more rigorous quantification framework — using image quality metrics such as BRISQUE or NIQE, or computing partial correlation between GSD and valid detection ratio — would enable systematic decomposition of imaging and algorithmic contributions. We identify this as an important direction for future research.
It is important to acknowledge that all experiments in this study were conducted using a single detection model (YOLOv8s) embedded in the operational Scanbee analysis system. While this reflects the real-world deployment context of the study — where the algorithm is fixed as part of the police platform — it limits the generalizability of findings with respect to detector-dependent performance variation. Different detection architectures, such as YOLOv9, YOLOv10, YOLO11, or transformer-based models, may exhibit different sensitivity to low-resolution or thermally blurred inputs, and could potentially extend effective detection ranges beyond those observed in this study. The consistent finding that performance degradation tracks with image resolution loss regardless of distance or altitude suggests that imaging quality is a platform-level constraint that operates upstream of the detection algorithm; however, the extent to which more advanced detectors could mitigate this constraint remains an open empirical question. Future studies should incorporate comparative multi-model evaluations under equivalent imaging conditions to disentangle algorithm-dependent from imaging-dependent performance factors.
B. Resolution Effects Based on Comparison with the DJI Mavic 3 System
The performance results obtained using the DJI Mavic 3 imaging system exhibited clear contrasts with those of the Scanbee platform. Despite the use of identical analytical algorithms and parameter configurations, the DJI Mavic 3 maintained relatively stable detection performance under medium- and long-range conditions.
This improvement is attributed to the high-resolution imagery generated by the 4/3-inch CMOS sensor, which provides richer information regarding object contours, posture, and background contrast. In particular, the substantial extension of detection distance observed under the 50 m altitude condition demonstrates that high-resolution input imagery can effectively expand the effective detection range of deep learning–based systems.
The Mavic 3 results at 100 m altitude also reveal a second, geometric factor. At D = 50–100 m, the projected target height (≈34–37 pixels) exceeded the level at which detection was reliable at 50 m altitude, yet no valid detection was produced; detections resumed at D = 110–130 m, where the depression angle falls below ≈42°. A plausible explanation is that, at steep depression angles, persons are seen largely from above, so that their silhouette (mainly head and shoulders) differs from the side and oblique views that dominate general-purpose training data [17,22]. Target pixel size is therefore a necessary but not sufficient condition, and performance requirements for elevated cameras should specify a maximum depression angle in addition to a minimum target pixel size. Because this inference rests on a small number of positions, it should be tested in dedicated experiments.
These findings indicate that variations in input image resolution and quality can fundamentally alter analytical outcomes, even when the same algorithms are employed. Although high-resolution imaging systems are not necessarily required for all public missions, they play a critical role in enforcement scenarios that demand reliable medium- and long-range detection.
Accordingly, performance evaluation frameworks for video analytics systems should move beyond algorithm-centered perspectives and adopt system-level approaches that incorporate image acquisition quality.
C. Interpretive Significance of Weighted Visualization Results
In this study, weighted visualization techniques were employed to enhance the interpretability of detection distribution patterns under conditions with extremely low absolute detection counts. This approach was not intended to exaggerate performance or distort numerical outcomes, but to present relative spatial patterns in detection capability more intuitively.
The weighted distributions revealed that the Scanbee system exhibited a relatively distinct boundary beyond which detection performance declined sharply. In contrast, the DJI Mavic 3 demonstrated a more gradual transition in detection reliability. These patterns provide valuable empirical evidence for determining effective detection ranges and establishing performance thresholds.
To supplement the descriptive results, 95% confidence intervals for the valid detection ratio were computed for each experimental condition using the Wilson score interval method, which is appropriate for proportional outcomes with small sample sizes. For the Scanbee system at 50 m altitude, the valid detection ratio of 3.2% (2 valid out of 62 total detections) yields a 95% CI of [0.9%, 11.0%], confirming that reliable human detection was not achieved under this condition. For the DJI Mavic 3 at 50 m altitude, the valid detection ratio of 51.3% (58 valid out of 113 total detections) yields a 95% CI of [42.2%, 60.3%], indicating statistically stable mid-range detection performance. At 100 m altitude, the Mavic 3 valid detection ratio of 26.8% (11 valid out of 41 total detections) yields a 95% CI of [15.7%, 41.9%], reflecting the broader uncertainty associated with lower detection counts. These intervals confirm that the performance differences between the two platforms are statistically meaningful and are not attributable to sampling variability alone.
Table 7 consolidates the metrics for all EO conditions, including the image-level target hit rate and its Wilson interval. The hit rate confirms the precision-based ranking of the conditions and adds information on missed targets that precision alone cannot provide: the Mavic 3 at 50 m altitude missed the target group in only 2 of 36 images (hit rate 94.4%, 95% CI [81.9%, 98.5%]), whereas the Scanbee at the same altitude missed it in 34 of 36 images (5.6%, [1.5%, 18.1%]). Fisher’s exact test confirms that the difference in precision between the two platforms at 50 m altitude is significant (p < 0.001).
Such visualization-based analyses support more informed interpretation of system behavior and contribute to the derivation of operationally meaningful performance criteria.
D. Implications for Intelligent Traffic Enforcement Systems
The comparative analysis between the Scanbee and DJI Mavic 3 systems offers important implications for the design and deployment of intelligent traffic enforcement equipment. Traffic monitoring environments frequently require reliable detection of objects occurring at medium to long distances, such as pedestrian signal violations, illegal parking, and hazardous intersection behaviors.
Under such conditions, enforcement reliability is influenced not only by algorithmic accuracy but also by camera resolution, observation distance, and installation height. The experimental results indicate that detection performance may degrade sharply beyond certain distance thresholds due to resolution limitations, thereby undermining enforcement credibility.
Therefore, performance standards for intelligent traffic enforcement systems should extend beyond simple accuracy metrics. Instead, they should incorporate operation-oriented requirements, including effective detection range, acceptable false-positive rates, and minimum resolution specifications.
E. Limitations and Future Research Directions
This study has several limitations. First, the analysis was primarily based on still-image experiments. In real traffic enforcement environments, continuous streaming video is typically used, and temporal information may enhance detection reliability through motion-based analysis and temporal aggregation.
Second, the experimental focus was limited to human target detection. Extending the analytical framework to traffic-specific targets, such as license plates, vehicle behaviors, and multi-object interactions, requires further investigation.
Third, the dataset does not contain exhaustive person-level ground truth. Only the designated target group was controlled, and incidental persons were not annotated; consequently, conventional recall could not be computed, and the image-level hit rate used in its place does not distinguish detections of the target group from detections of other persons. The scenes were also of low people density, so the precision values reported here should not be generalized to crowded scenes. Re-annotating the existing images with all visible persons would allow instance-level recall to be reported without new flights and is planned as a follow-up. Fourth, each altitude–distance position is represented by a single image, so per-position outcomes are binary, and the 30-pixel threshold was identified from observed boundaries rather than estimated statistically.
Fifth, the generalizability of the derived performance thresholds to ground-based intelligent traffic enforcement systems remains subject to empirical validation. The geometric mapping presented in this study is grounded in optical equivalence principles based on ground sampling distance (GSD); however, ground-mounted cameras differ from UAV platforms in viewing angle, vibration characteristics, depth-of-field behavior, and target object categories. These differences may affect detection performance in ways not fully captured by the current experimental framework. Future studies should therefore conduct parallel experiments using fixed ground-based cameras under equivalent GSD conditions to validate the proposed thresholds.
Future research should therefore incorporate real-time video analytics, broader object categories, and cross-platform evaluations. In addition, efforts should be made to link empirical performance outcomes to standardized certification indicators and regulatory frameworks. Such research would contribute to enhancing the reliability, institutional acceptance, and long-term sustainability of public-sector video analytics systems.
VI. CONCLUSION
This study conducted drone-based empirical experiments to examine how the performance of deep learning–based image analysis systems varies according to input image resolution, observation distance, and environmental conditions. The experimental findings were further extended to derive performance requirements for intelligent traffic enforcement imaging systems. To this end, the police-operated Scanbee drone platform and a high-resolution reference system (DJI Mavic 3) were comparatively evaluated under an identical deep learning–based analytical framework.
The empirical results indicate that the Scanbee system detected the target group only at short range and low altitude (D ≤ 60 m at 50 m altitude). However, as flight altitude and observation distance increase, detection reliability deteriorates rapidly and false-positive rates rise. In contrast, the high-resolution imaging system maintained relatively stable detection performance under medium- and long-range conditions, despite the use of the same analytical algorithms. These findings empirically demonstrate that deep learning–based video analysis performance is structurally constrained not only by algorithmic capabilities but also by the spatial resolution and visual quality of input imagery.
The results further suggest that performance evaluation frameworks for intelligent traffic enforcement systems should move beyond algorithm-centered accuracy metrics. Instead, operation-oriented performance requirements—including effective detection range, acceptable false-positive thresholds, and minimum resolution specifications—should be incorporated. In enforcement environments where medium- and long-range target detection is essential, the physical and optical characteristics of image acquisition equipment play a decisive role in ensuring operational reliability.
The academic contributions of this study can be summarized as follows. First, through drone-based empirical experiments, this research quantitatively analyzed the effects of flight altitude and observation distance on deep learning–based detection performance. Second, comparative analysis between the Scanbee system and a high-resolution imaging platform empirically validated the critical influence of input image quality on analytical outcomes. Third, by developing an explicit GSD-based geometric mapping framework and showing that a projected target height of approximately 30 pixels summarizes the observed detection boundary across platforms, this study provides a systematic methodology for translating UAV-based experimental findings into preliminary performance reference points applicable to the design and procurement discussion of public-sector video analytics and enforcement imaging systems.
Nevertheless, this study has several limitations. The analysis was primarily based on still-image experiments, whereas real-world traffic enforcement relies on continuous video streams, where temporal information may enhance detection reliability. Moreover, the analytical scope was limited to human target detection in low-density scenes without exhaustive person-level ground truth, so that precision and an image-level target hit rate, rather than recall, were reported. Extending the framework to traffic-specific applications, such as license plate recognition and vehicle behavior analysis, requires further investigation. Additionally, the performance thresholds derived through geometric mapping in this study represent conceptually informed reference points rather than empirically validated specifications for ground-based enforcement systems. Direct empirical validation using fixed ground-based cameras under equivalent imaging conditions is needed to confirm the applicability of these thresholds to real-world deployment.
Furthermore, all experiments were conducted using a single detection model (YOLOv8s) as integrated in the police platform. While this reflects the operational deployment context, it prevents direct comparison with state-of-the-art detection architectures such as YOLOv9, YOLOv10, YOLO11, and YOLO12, which have demonstrated improvements in small-object detection and inference speed. Future work should incorporate multi-model comparative evaluations under equivalent imaging conditions to quantify algorithm-dependent performance variation and to assess whether more advanced detectors can meaningfully extend effective detection ranges under the same hardware constraints.
Future research should therefore incorporate real-time video analytics, broader object categories, and large-scale field validation. In addition, efforts should be made to connect empirical performance outcomes with standardized evaluation and certification indicators. Such follow-up studies are expected to contribute to strengthening the reliability of intelligent traffic enforcement systems and facilitating the institutional adoption of artificial intelligence technologies in public-sector governance.
Acknowledgments
This work was funded by the Ministry of Science and ICT and the Korean National Police Agency, through the Institute of Forensic Science & Public Safety Promotion (Korea Institute of Police Technology), under the project entitled “Intelligent Traffic Accident Data Processing and Smart Analysis System” (Project No. RS-2025-25442072).
References
- Do, Thi-Thu-Trang; Huynh, Quyet-Thang; Kim, Kyungbaek; Nguyen, Van-Quyet. A survey on video big data analytics: architecture, technologies, and open research challenges. Appl. Sci. 2025, 15(no. 14), 8089. [Google Scholar] [CrossRef]
- Khan, Amina; Gupta, Sumeet; Gupta, Sachin Kumar. Emerging UAV technology for disaster detection, mitigation, response, and preparedness. J. Field Robot. 2022, 39(no. 6), 905–955. [Google Scholar] [CrossRef]
- Chen, Xiaozhi; Ma, Huimin; Wan, Ji; Li, Bo; Xia, Tian. Multi-view 3d object detection network for autonomous driving. In Proceedings of the IEEE conference on Computer Vision and Pattern Recognition, 2017; pp. 1907–1915. [Google Scholar]
- Zheng, Zhaohui; Wang, Ping; Liu, Wei; Li, Jinze; Ye, Rongguang; Ren, Dongwei. Distance-IoU loss: Faster and better learning for bounding box regression. Proc. AAAI Conf. Artif. Intell. 2020, vol. 34(no. 07), 12993–13000. [Google Scholar] [CrossRef]
- Kang, W. A study on effective utilization strategies of drones for public missions: Focused on drones for missing person search. J. Korean Soc. Secur. Saf. 2020, vol. 62, 65–86. [Google Scholar]
- Aldubaikhi, Ali; Patel, Sarosh. Advancements in small-object detection (2023–2025): Approaches, datasets, benchmarks, applications, and practical guidance. Appl. Sci. 2025, 15(no. 22), 11882. [Google Scholar] [CrossRef]
- Redmon, Joseph; Farhadi, Ali. Yolov3: An incremental improvement. arXiv 2018, arXiv:1804.02767. [Google Scholar]
- Li, Xiang; Sun, Jian-Qiao. Studies of vehicle lane-changing dynamics and its effect on traffic efficiency, safety and environmental impact. Physica A Stat. Mech. Its Appl. 2017, 467, 41–58. [Google Scholar] [CrossRef]
- Hou, Yuenan; Ma, Zheng; Liu, Chunxiao; Loy, Chen Change. Learning to steer by mimicking features from heterogeneous auxiliary networks. Proc. AAAI Conf. Artif. Intell. 2019, vol. 33(no. 01), 8433–8440. [Google Scholar] [CrossRef]
- Bochkovskiy, Alexey; Wang, Chien-Yao; Liao, Hong-Yuan Mark. Yolov4: Optimal speed and accuracy of object detection. arXiv 2020, arXiv:2004.10934. [Google Scholar]
- Ammar, Adel; Koubaa, Anis; Ahmed, Mohanned; Saad, Abdulrahman; Benjdira, Bilel. Vehicle detection from aerial images using deep learning: A comparative study. Electronics 2021, 10(no. 7), 820. [Google Scholar] [CrossRef]
- Zhao, Zhong-Qiu; Zheng, Peng; Xu, Shou-tao; Wu, Xindong. Object detection with deep learning: A review. IEEE Trans. Neural Netw. Learn. Syst. 2019, 30(no. 11), 3212–3232. [Google Scholar] [CrossRef] [PubMed]
- Ren, S.; He, K.; Girshick, R.; Sun, J. Faster R-CNN: Towards real-time object detection with region proposal networks. IEEE Trans. Pattern Anal. Mach. Intell. 2017, vol. 39(no. 6), 1137–1149. [Google Scholar] [CrossRef] [PubMed]
- Liu, W.; et al. SSD: Single shot multibox detector. Proc. ECCV 2016, 21–37. [Google Scholar] [CrossRef]
- Redmon, J.; Farhadi, A. YOLOv3: An incremental improvement. arXiv 2018, arXiv:1804.02767. [Google Scholar]
- Bochkovskiy, C.-Y.; Wang, H.-Y. M.; Liao. YOLOv4: Optimal speed and accuracy of object detection. arXiv 2020, arXiv:2004.10934. [Google Scholar]
- Lin, T.-Y.; et al. Microsoft COCO: Common objects in context. Proc. ECCV 2014, 740–755. [Google Scholar] [CrossRef]
- Lin, T.-Y.; et al. Feature pyramid networks for object detection. Proc. CVPR 2017, 2117–2125. [Google Scholar]
- Wang, C.-Y.; et al. CSPNet: A new backbone that can enhance learning capability of CNN. Proc. CVPR Workshops, 2020. [Google Scholar]
- Dong; Loy, C. C.; He, K.; Tang, X. Image super-resolution using deep convolutional networks. IEEE Trans. Pattern Anal. Mach. Intell. 2016, vol. 38(no. 2), 295–307. [Google Scholar] [CrossRef] [PubMed]
- Stauffer, W. E. L.; Grimson. Adaptive background mixture models for real-time tracking. Proc. CVPR 1999, 246–252. [Google Scholar]
- Zhu, P.; et al. VisDrone: A benchmark and challenge for vision-based drone surveillance. Proc. ECCV 2018, 734–750. [Google Scholar]
- Bakirci, M. Vehicular mobility monitoring using remote sensing and deep learning on a UAV-based mobile computing platform. Measurement 2025, vol. 244, Art.(no. 116579). [Google Scholar] [CrossRef]
- Jocher, G.; Chaurasia, A.; Qiu, J. “Ultralytics YOLOv8,” version 8.0.0, 2023. Available online: https://github.com/ultralytics/ultralytics.
- Wilson, E. B. Probable inference, the law of succession, and statistical inference. J. Amer. Stat. Assoc. 1927, vol. 22(no. 158), 209–212. [Google Scholar] [CrossRef]
- Hartley, R.; Zisserman, A. Multiple View Geometry in Computer Vision, 2nd ed.; Cambridge Univ. Press: Cambridge, U.K., 2004. [Google Scholar]
Figure 1.
Overall EO image acquisition and analysis procedure. At each altitude (50 m and 100 m), one still image was captured at each horizontal distance from 50 m to 400 m in 10 m increments, without optical zoom and with the camera aimed toward the pilot and target group at the take-off point.
Figure 1.
Overall EO image acquisition and analysis procedure. At each altitude (50 m and 100 m), one still image was captured at each horizontal distance from 50 m to 400 m in 10 m increments, without optical zoom and with the camera aimed toward the pilot and target group at the take-off point.
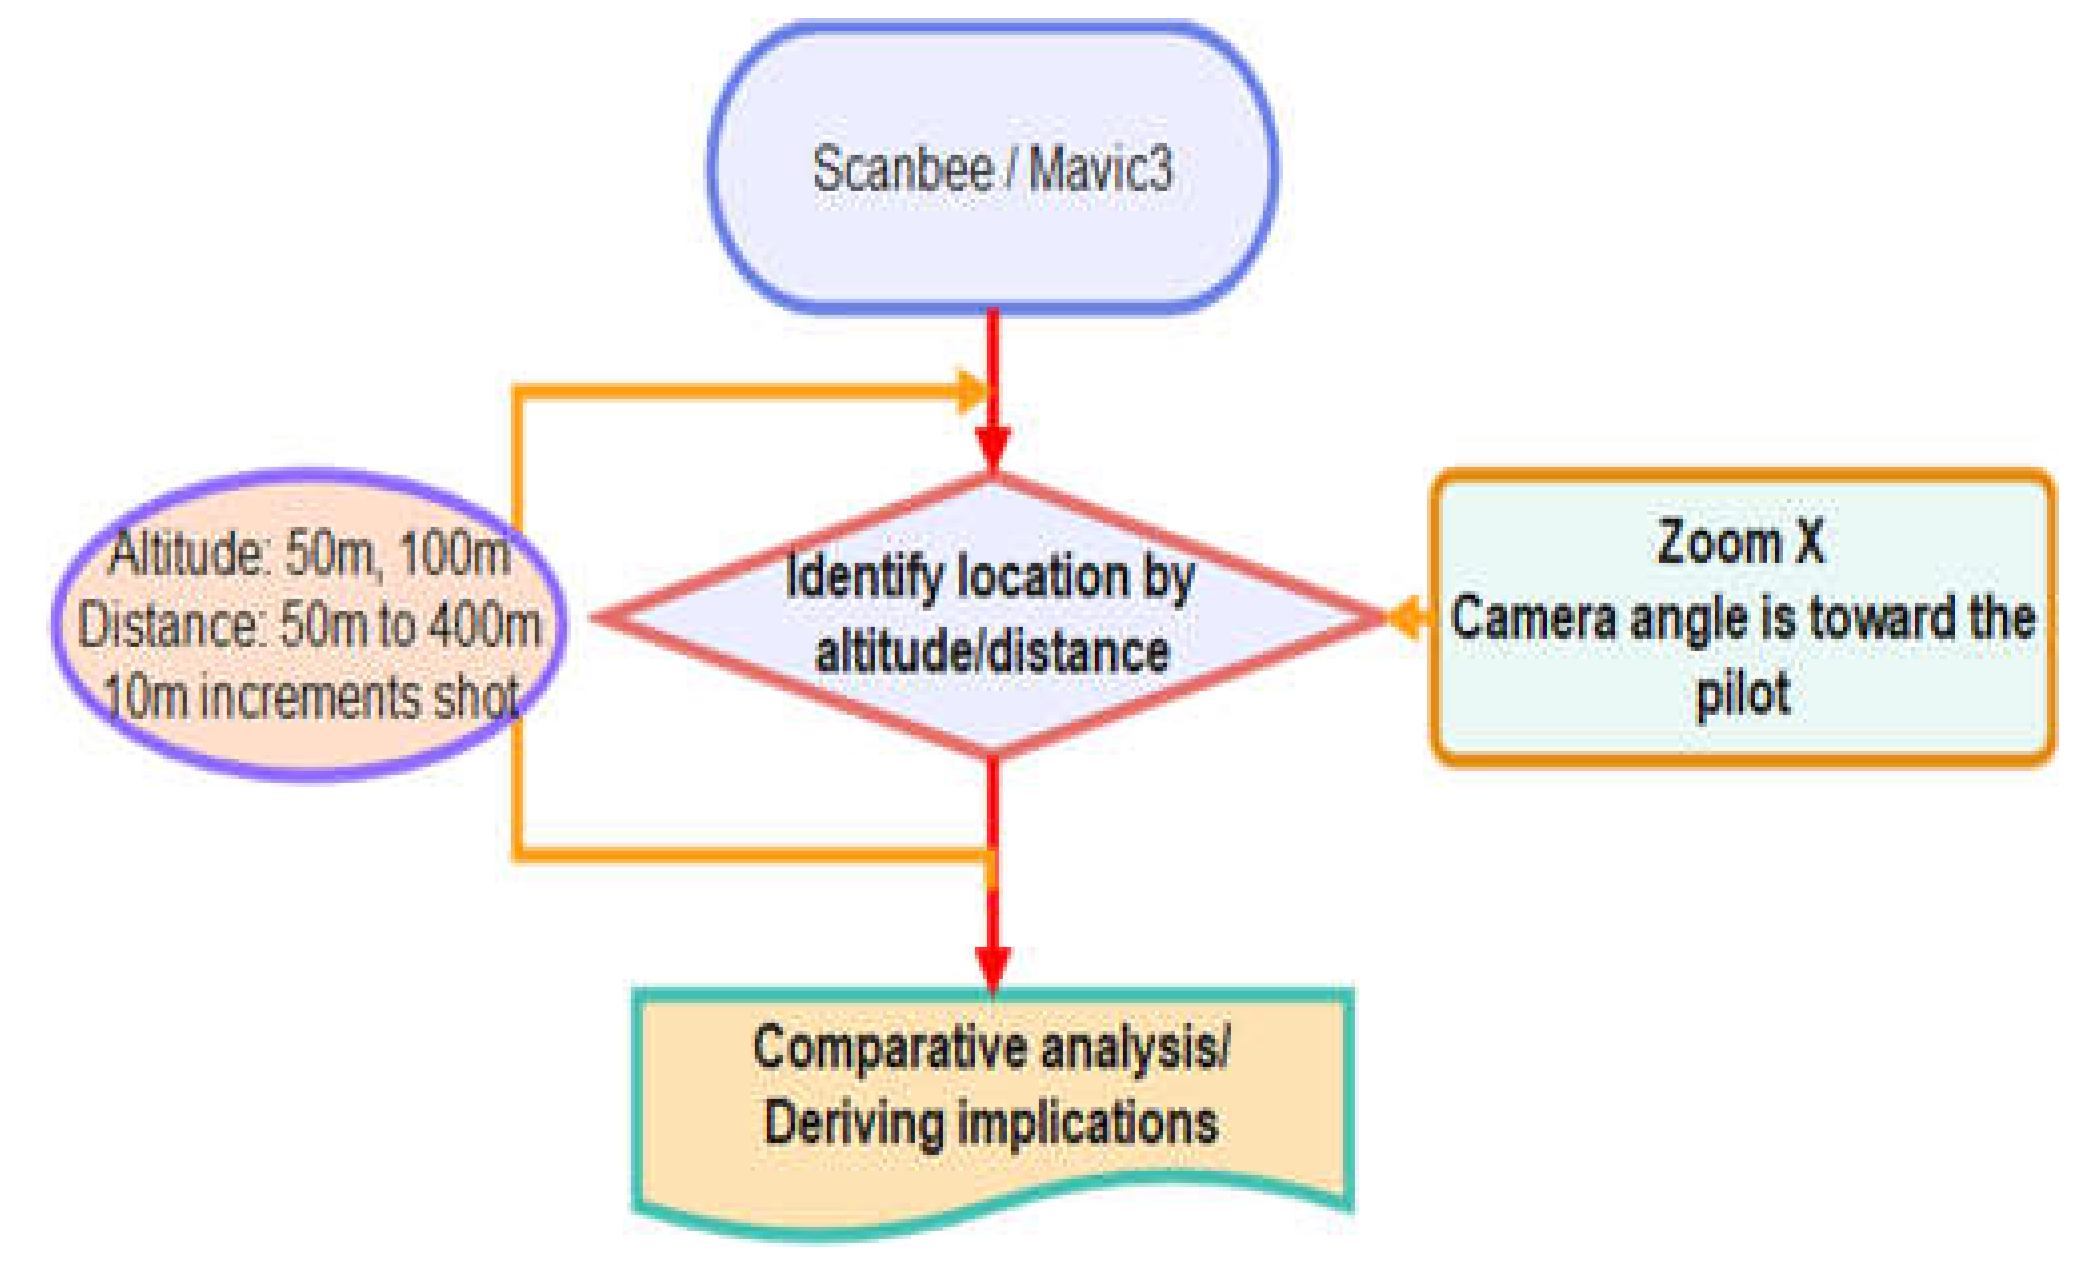
Figure 2.
Imaging geometry used to relate UAV flight parameters to target pixel size and ground coordinates. The gimbal camera is aimed at the target group at the take-off point; H, D, R, and θ are related by Equation (1), and the projected target size follows from Equations (2) and (3).
Figure 2.
Imaging geometry used to relate UAV flight parameters to target pixel size and ground coordinates. The gimbal camera is aimed at the target group at the take-off point; H, D, R, and θ are related by Equation (1), and the projected target size follows from Equations (2) and (3).
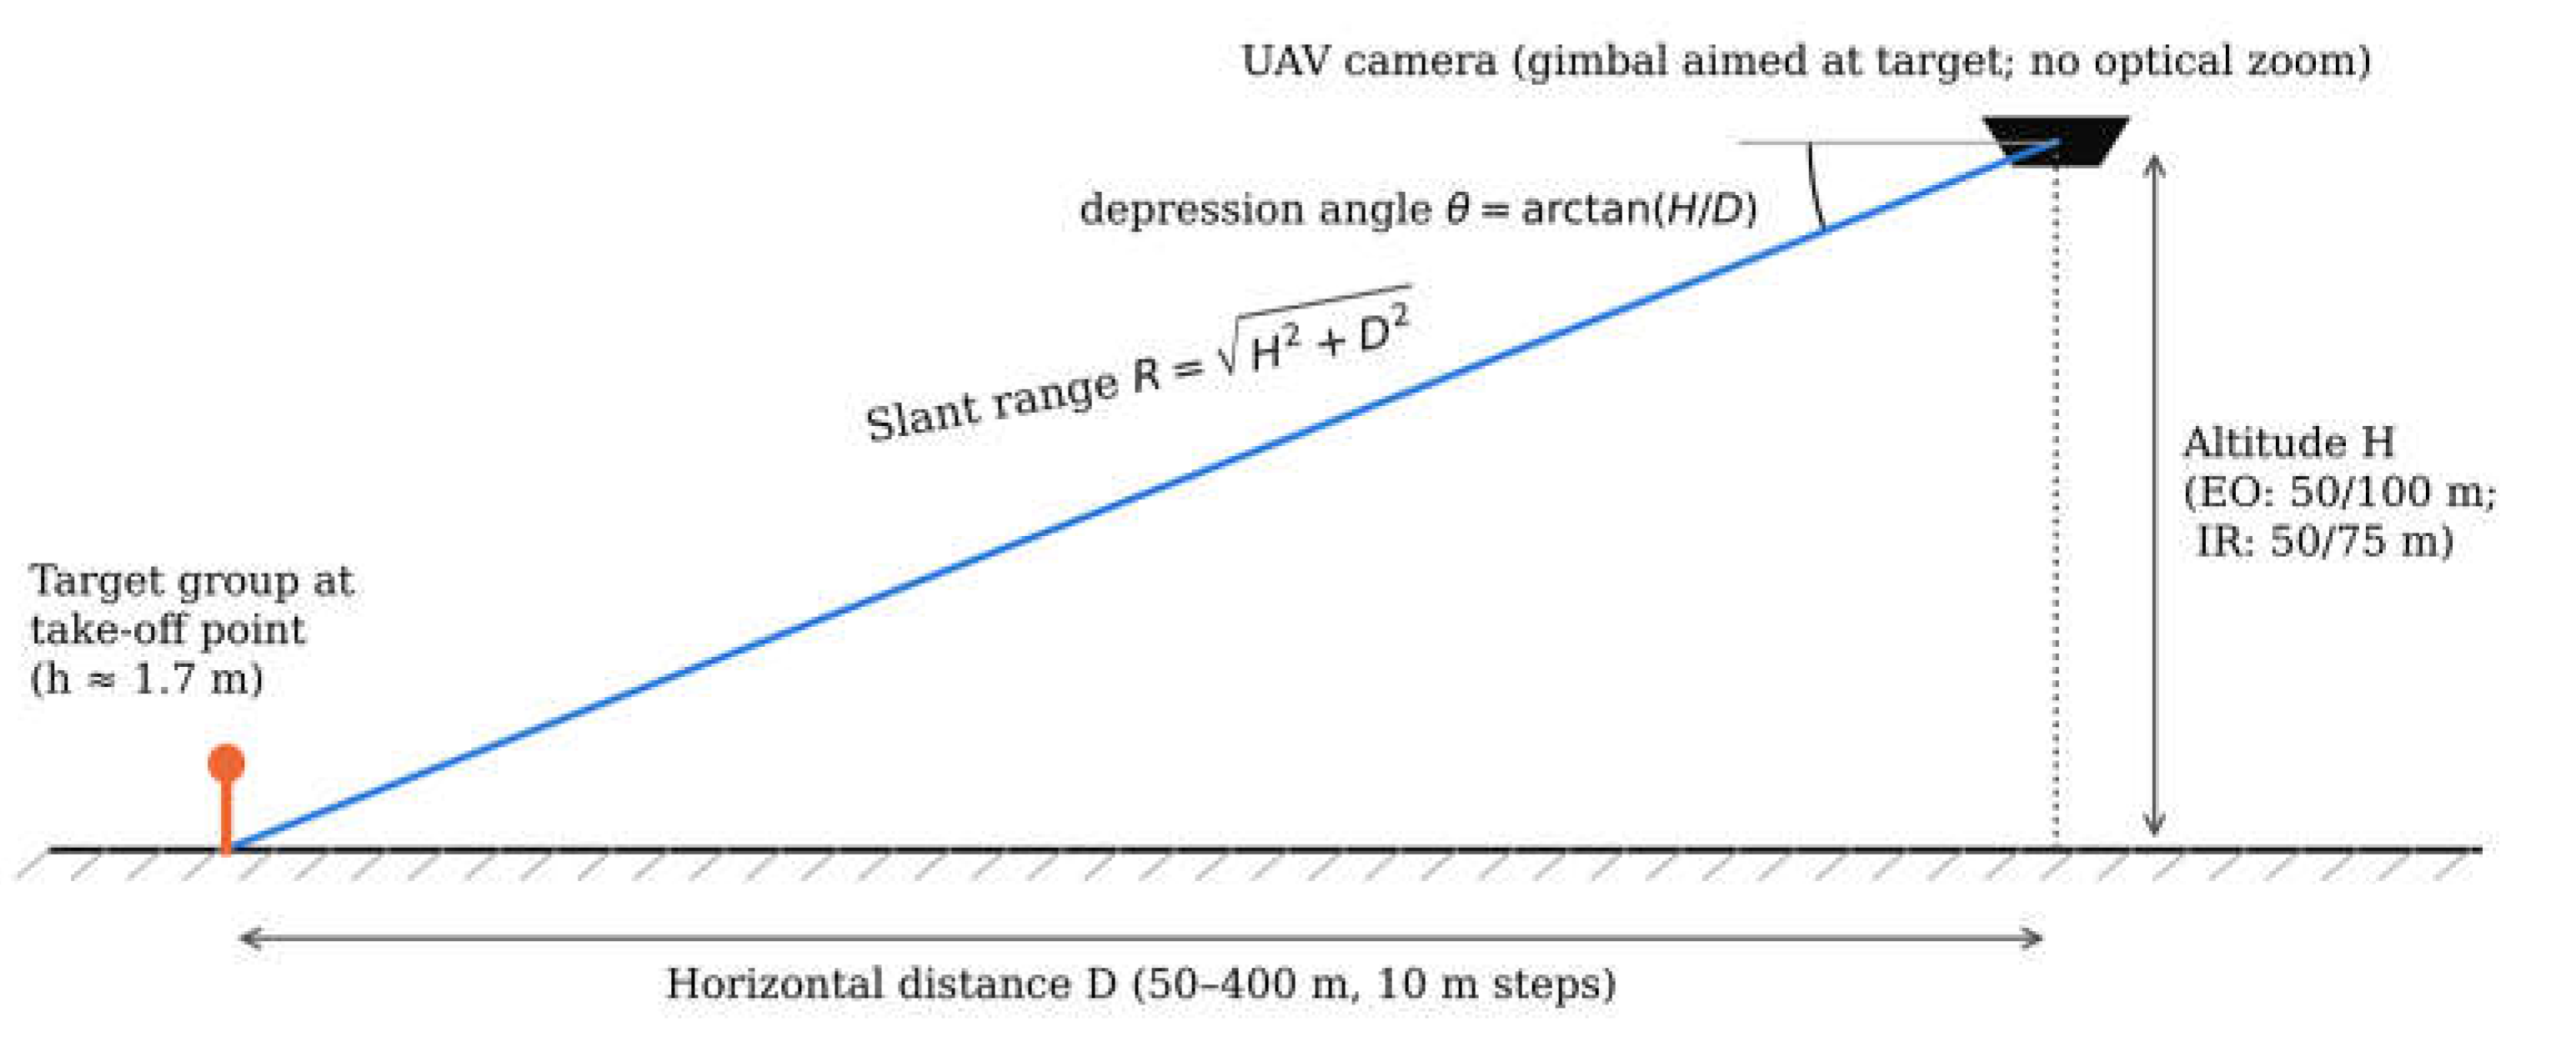
Figure 3.
EO-based human detection results of the Scanbee police drone. Bubble chart: number of valid human detections at each altitude–distance position (bubble area proportional to the count; small dots denote positions without a valid detection). Screenshot: analysis output of the operational software at 100 m altitude, shown to illustrate the processing interface.
Figure 3.
EO-based human detection results of the Scanbee police drone. Bubble chart: number of valid human detections at each altitude–distance position (bubble area proportional to the count; small dots denote positions without a valid detection). Screenshot: analysis output of the operational software at 100 m altitude, shown to illustrate the processing interface.
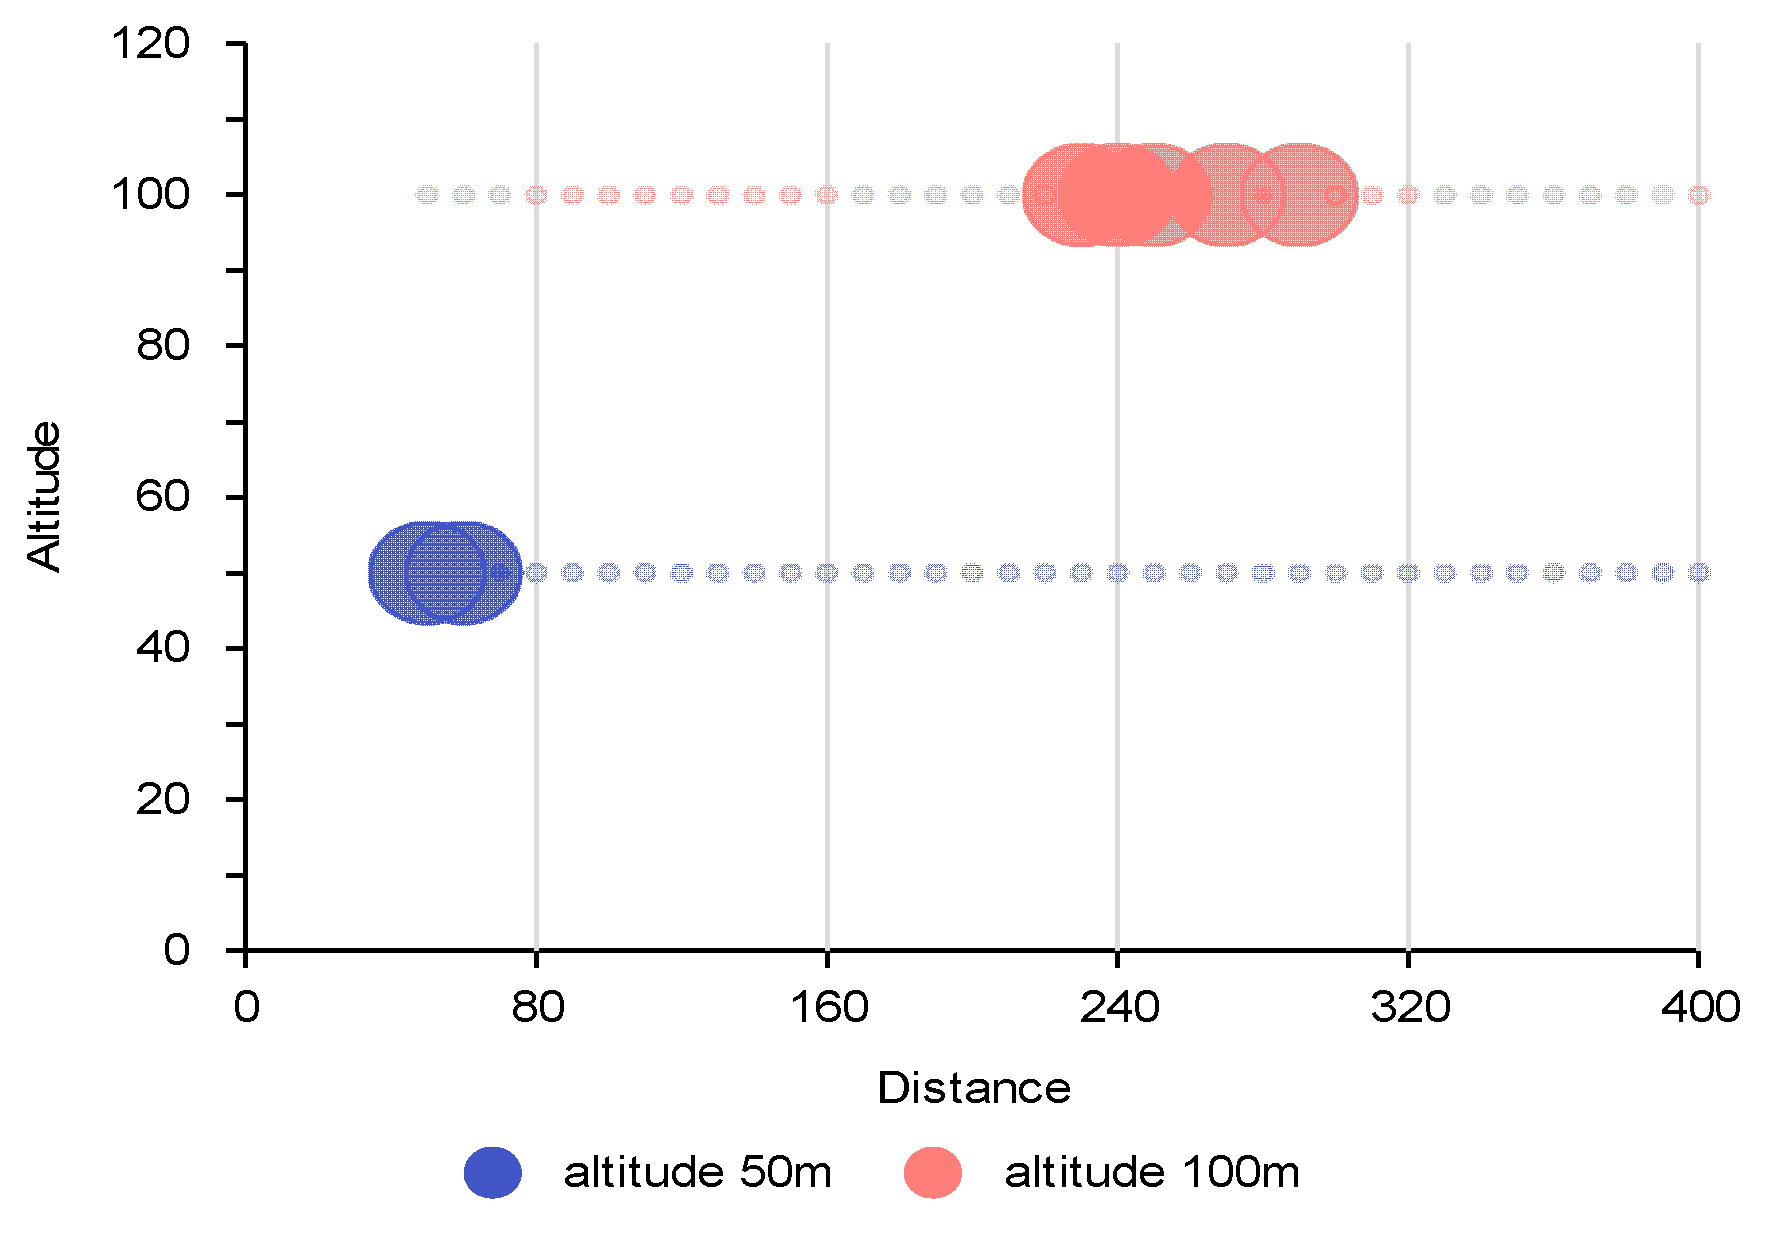
Figure 4.
EO-based human detection results of the DJI Mavic 3 (bubble chart as in Figure 3) and an analysis screenshot of the operational software.
Figure 4.
EO-based human detection results of the DJI Mavic 3 (bubble chart as in Figure 3) and an analysis screenshot of the operational software.
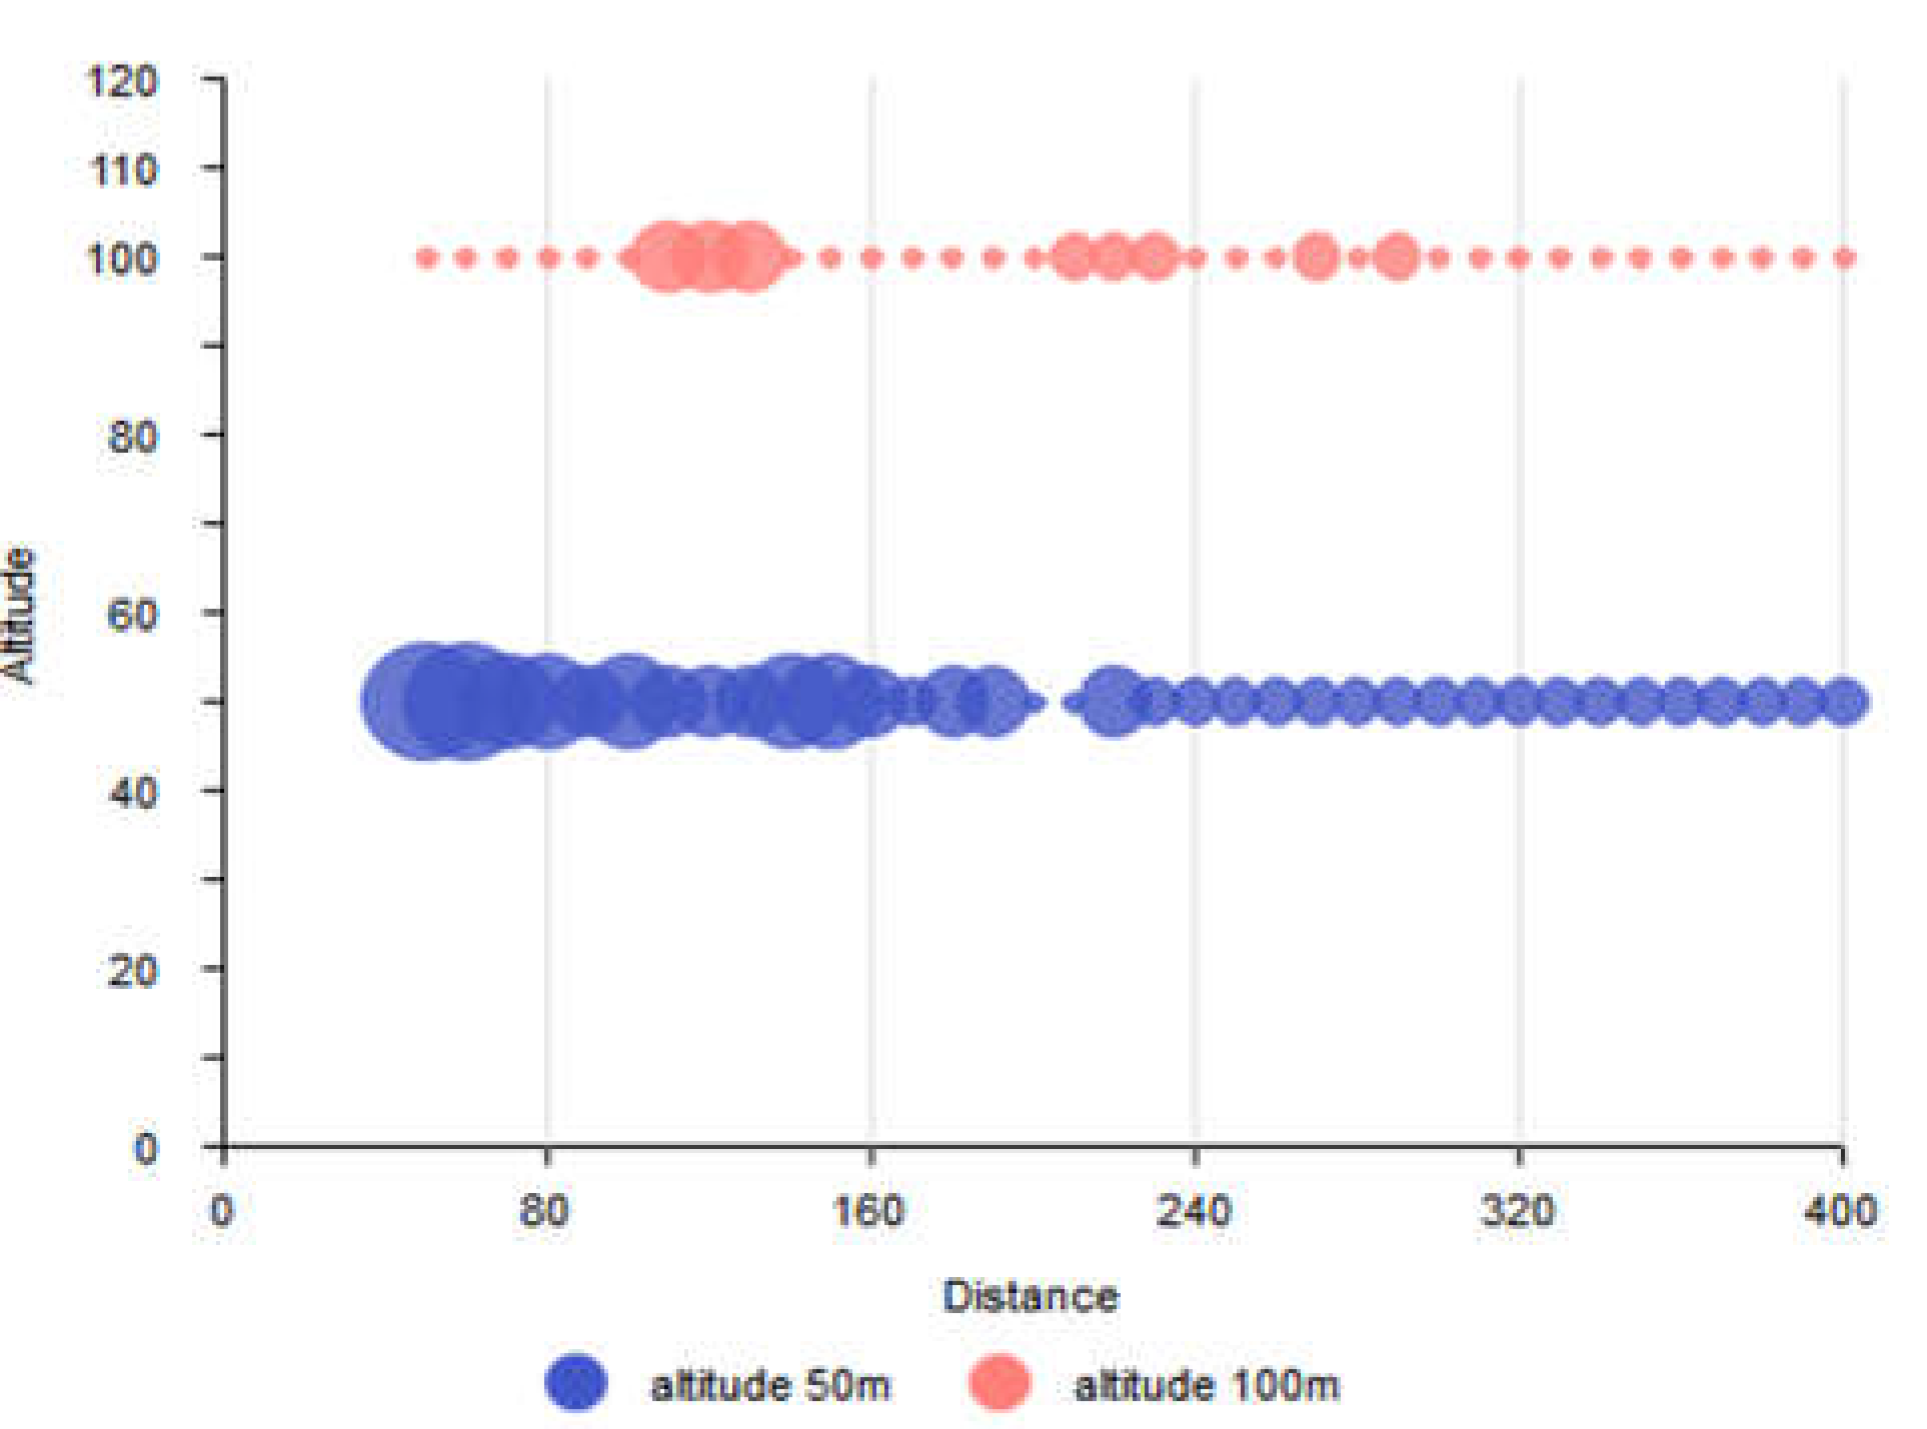
Figure 5.
Procedure for IR Camera Image Analysis of Police Mission Equipment.
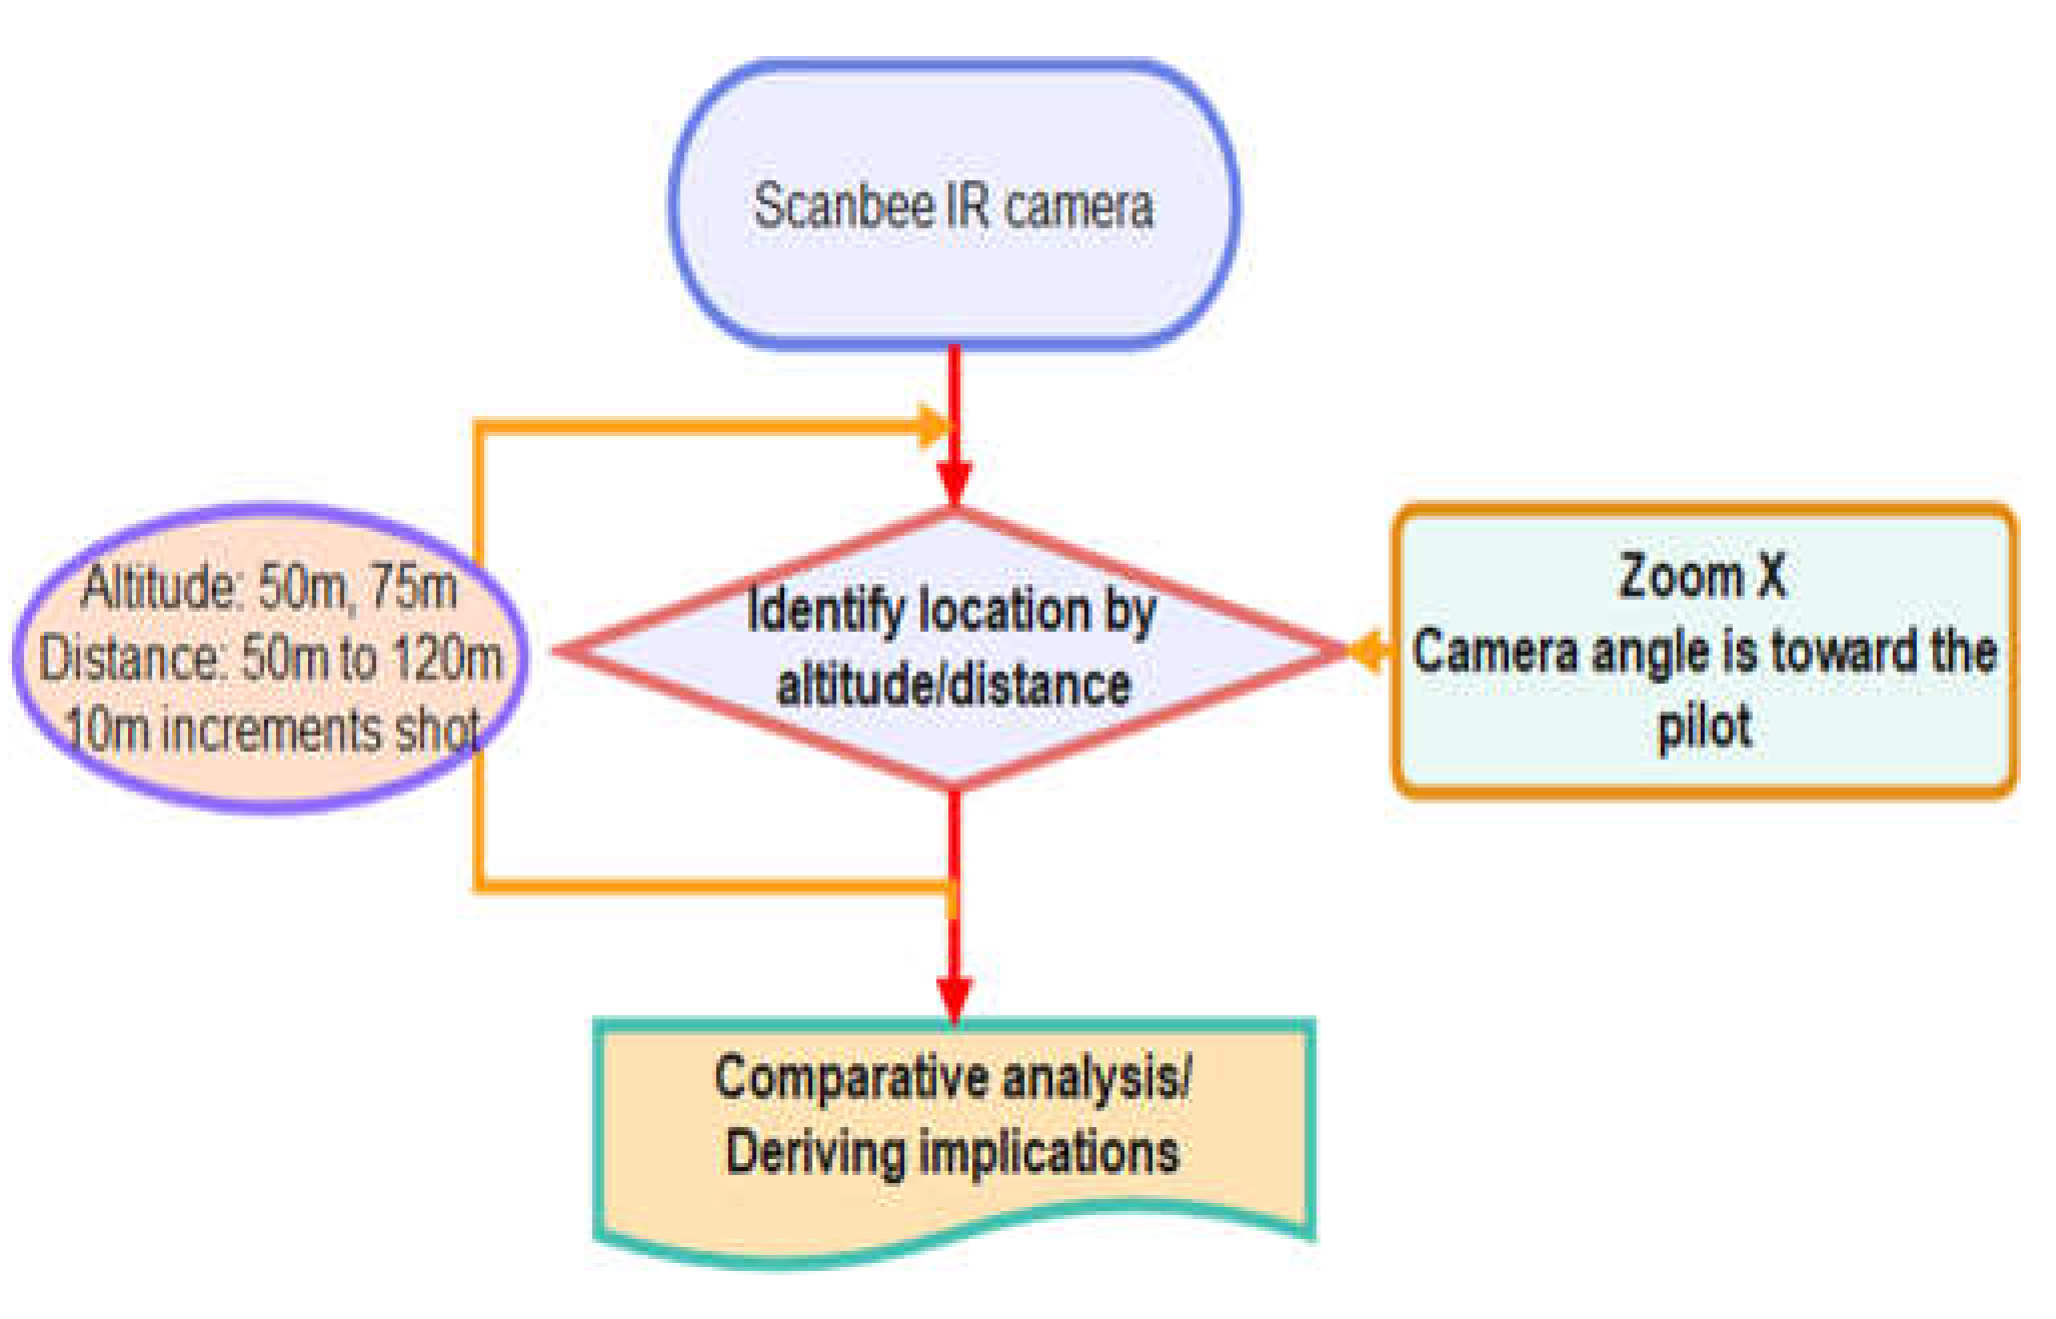
Figure 6.
Projected height of a standing adult (Equation (3)) as a function of horizontal distance for each EO platform and altitude. Filled markers, images with at least one valid human detection; open markers, images without a valid detection (per-position outcomes from Figure 3 and Figure 4). The dashed line marks the 30-pixel level.
Figure 6.
Projected height of a standing adult (Equation (3)) as a function of horizontal distance for each EO platform and altitude. Filled markers, images with at least one valid human detection; open markers, images without a valid detection (per-position outcomes from Figure 3 and Figure 4). The dashed line marks the 30-pixel level.
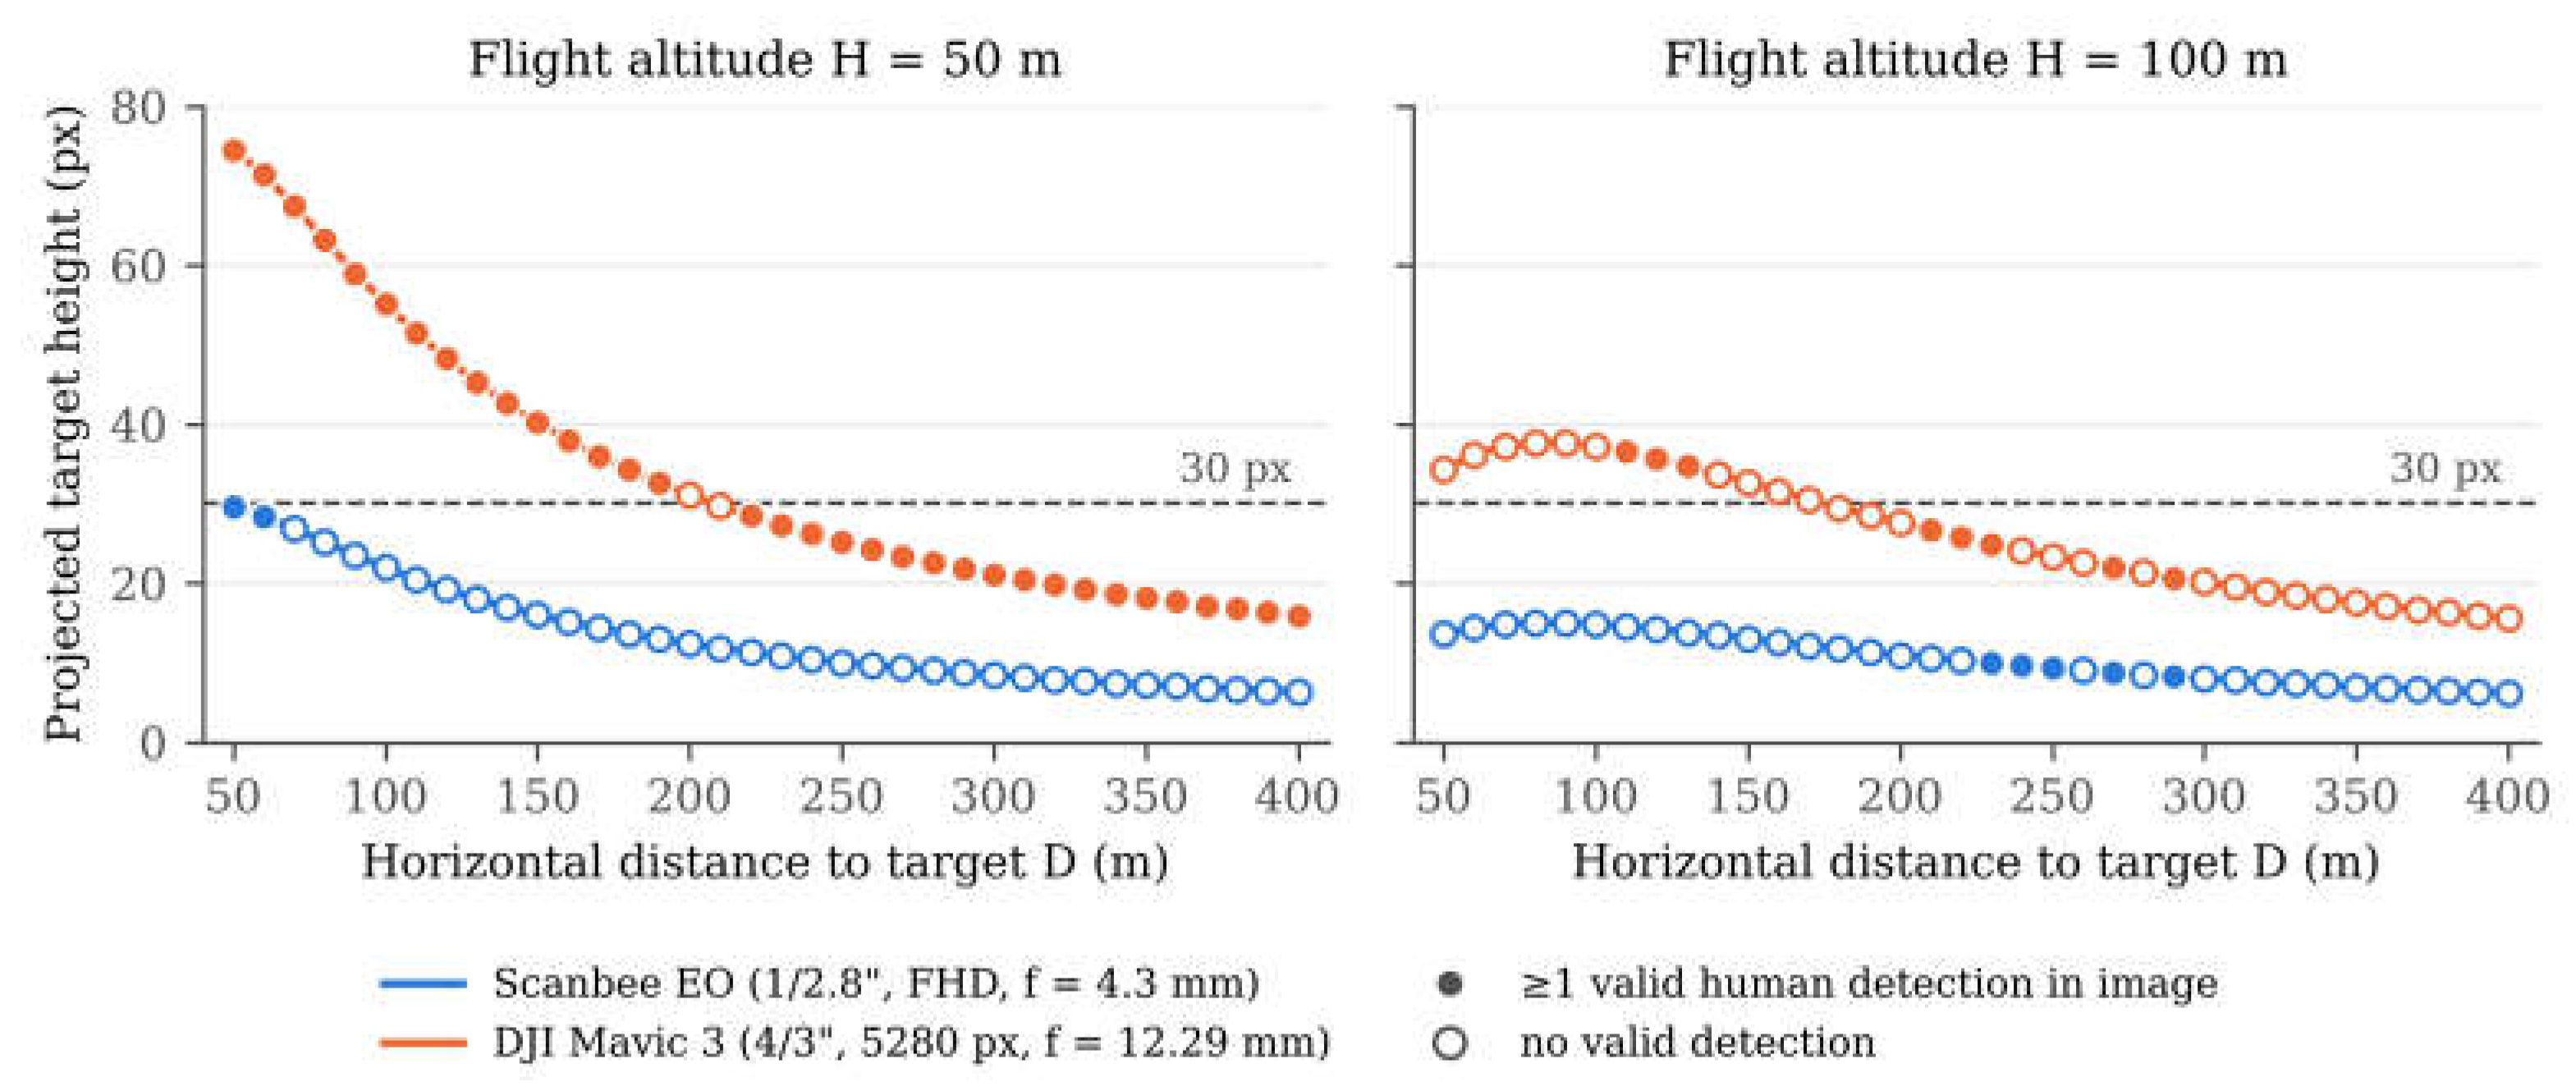
Table 1.
Specifications of Drone-Based Image Acquisition Systems Used in the Experiments.
| Category | Police drone (Scanbee) | MAVIC 3 |
| Platform type | Public mission drone | Commercial drone |
| Image sensor | 1/2.8″ CMOS | 4/3 CMOS |
| Optical resolution | 1920×1080 (FHD) | 5280×3956 |
| Zoom capability | 30× optical zoom | Digital zoom |
| Thermal imaging (IR) | 640×480 | Not available |
| Purpose of use | Target system for empirical evaluation | High-resolution reference system |
| Focal length used | 4.3 mm (wide end, no optical zoom) | 12.29 mm (fixed) |
| Pixel pitch (EO) | ≈2.9 µm | ≈3.3 µm |
| Horizontal FOV (EO) | ≈66° | ≈70° |
Table 2.
Summary of input data and acquisition conditions.
| Sensor/platform | Image size (pixels) | Altitudes (m) | Horizontal distances (m) | Images per altitude | Total images | Illumination |
| Scanbee EO | 1920 × 1080 | 50, 100 | 50–400 (10 m steps) | 36 | 72 | Daytime |
| Mavic 3 EO | 5280 × 3956 | 50, 100 | 50–400 (10 m steps) | 36 | 72 | Daytime |
| Scanbee IR | 640 × 480 | 50, 75 | 50–120 (10 m steps) | 8 | 16 | Nighttime |
| Total | 160 |
Table 3.
Slant range R, depression angle θ, slant-range GSD, and projected size (height × width, pixels) of a standing adult for selected EO positions (no zoom), computed with Equations (1)–(3).
Table 3.
Slant range R, depression angle θ, slant-range GSD, and projected size (height × width, pixels) of a standing adult for selected EO positions (no zoom), computed with Equations (1)–(3).
| H (m) | D (m) | R (m) | θ (°) | Scanbee GSD (cm/px) | Scanbee size (px) | Mavic 3 GSD (cm/px) | Mavic 3 size (px) |
| 50 | 50 | 71 | 45.0 | 4.8 | 30 × 10 | 1.9 | 74 × 26 |
| 50 | 100 | 112 | 26.6 | 7.5 | 22 × 7 | 3.0 | 55 × 17 |
| 50 | 150 | 158 | 18.4 | 10.7 | 16 × 5 | 4.2 | 40 × 12 |
| 50 | 200 | 206 | 14.0 | 13.9 | 12 × 4 | 5.5 | 31 × 9 |
| 50 | 250 | 255 | 11.3 | 17.2 | 10 × 3 | 6.8 | 25 × 7 |
| 50 | 300 | 304 | 9.5 | 20.5 | 8 × 2 | 8.2 | 21 × 6 |
| 50 | 400 | 403 | 7.1 | 27.2 | 6 × 2 | 10.8 | 16 × 5 |
| 100 | 50 | 112 | 63.4 | 7.5 | 14 × 7 | 3.0 | 34 × 17 |
| 100 | 100 | 141 | 45.0 | 9.5 | 15 × 5 | 3.8 | 37 × 13 |
| 100 | 150 | 180 | 33.7 | 12.2 | 13 × 4 | 4.8 | 33 × 10 |
| 100 | 200 | 224 | 26.6 | 15.1 | 11 × 3 | 6.0 | 28 × 8 |
| 100 | 250 | 269 | 21.8 | 18.2 | 9 × 3 | 7.2 | 23 × 7 |
| 100 | 300 | 316 | 18.4 | 21.3 | 8 × 2 | 8.5 | 20 × 6 |
| 100 | 400 | 412 | 14.0 | 27.8 | 6 × 2 | 11.1 | 16 × 5 |
Table 4.
EO-Based Human Detection Results of the Scanbee Police Drone.
| Altitude (m) | Analysis Time | Detection image | Precision (valid detection ratio) | |||
| Total Detections | Valid Detections | false detection | ||||
| 50 | 36 | 3’00’‘ | 62 | 2 | 60 | 3.2% |
| 100 | 36 | 3’11’‘ | 180 | 5 | 175 | 2.8% |
Table 5.
EO-Based Human Detection Results of the DJI Mavic 3.
| Altitude (m) | Analysis Time | Detection image | Precision (valid detection ratio) | |||
| Total Detections | Valid Detections | False detection | ||||
| 50 | 36 | 8’52” | 113 | 58 | 55 | 51.3% |
| 100 | 36 | 8’55” | 41 | 11 | 30 | 26.8% |
Table 7.
Summary of EO detection metrics with 95% Wilson confidence intervals (TP, valid detections; FP, false detections; FDR, false discovery rate; HR, image-level target hit rate).
Table 7.
Summary of EO detection metrics with 95% Wilson confidence intervals (TP, valid detections; FP, false detections; FDR, false discovery rate; HR, image-level target hit rate).
| Platform | H (m) | Images | Detections (TP + FP) | TP | FP | Precision [95% CI] | FDR | HR [95% CI] |
| Scanbee EO | 50 | 36 | 62 | 2 | 60 | 3.2% [0.9, 11.0] | 96.8% | 5.6% (2/36) [1.5, 18.1] |
| Scanbee EO | 100 | 36 | 180 | 5 | 175 | 2.8% [1.2, 6.3] | 97.2% | 13.9% (5/36) [6.1, 28.7] |
| Mavic 3 | 50 | 36 | 113 | 58 | 55 | 51.3% [42.2, 60.3] | 48.7% | 94.4% (34/36) [81.9, 98.5] |
| Mavic 3 | 100 | 36 | 41 | 11 | 30 | 26.8% [15.7, 41.9] | 73.2% | 22.2% (8/36) [11.7, 38.1] |
Disclaimer/Publisher’s Note: The statements, opinions and data contained in all publications are solely those of the individual author(s) and contributor(s) and not of MDPI and/or the editor(s). MDPI and/or the editor(s) disclaim responsibility for any injury to people or property resulting from any ideas, methods, instructions or products referred to in the content. |
© 2026 by the authors. Licensee MDPI, Basel, Switzerland. This article is an open access article distributed under the terms and conditions of the Creative Commons Attribution (CC BY) license.
Copyright: This open access article is published under a Creative Commons CC BY 4.0 license, which permit the free download, distribution, and reuse, provided that the author and preprint are cited in any reuse.