

Submitted:
12 October 2026
Posted:
13 October 2026
You are already at the latest version
Abstract
Rice feeds more than half of humanity, yet whether its yield gain under elevated CO₂ comes from a stronger source or a larger sink is unresolved, because the two are seldom measured together. From 6,120 Web of Science (WoS) and China National Knowledge Infrastructure (CNKI) records we built an evidence map; 668 met all criteria, revealing the publication was unbalanced: 460 studies (68.9%) measured source traits against 194 (29.0%) for sink traits (2.37:1); harvest index (HI) appeared in only 22 (3.3%). The split repeats in both language subsets: it reflects the field, not the databases. Seven syntheses gave photosynthesis +21.9%, panicle biomass +25.4%, little change in grain mass or HI, and grain yield +12-20% under free-air CO₂ enrichment (FACE). Extra biomass went to roots (+8.5%) and away from leaves (-8.4%). Partly disjoint and non-independent, the estimates are listed side by side, not combined. The pattern fits sequential constraints: CO₂ enlarges sink number before heading; grain filling responds little. By quantifying this source bias and locating the thinnest evidence, the map re-directs experiment, breeding and modelling to the sink, where the yield still to be won lies.
Keywords:
elevated CO₂
; source-sink relations
; rice
; grain number
; harvest index
; photosynthetic acclimation
; secondary synthesis
; evidence map
1. Introduction
Grain yield in cereals is set by the balance between assimilate supply (the source: flag leaves and the crop canopy) and assimilate demand (the sink: developing panicles and grains), not by the capacity of any single organ [1]. The standard way to separate the two is source sink perturbation: shading or defoliation lowers carbon supply, whereas spikelet thinning or partial panicle removal lowers demand. How the untreated tissue compensates then shows which process limits yield [2]. Two conclusions from this work are now widely accepted. First, grain number is source limited: it is fixed within a narrow pre-heading window, tracks crop growth rate over that window, and responds plastically to changes in assimilate supply [2]. Second, from heading onwards the crop is largely sink limited. During grain filling, treatments that leave potential grain size unchanged, moderate shading, or removing spikelets after grain number is set, have little effect on the mass of the remaining grains. Grain growth therefore appears to be capped by the capacity of the grain itself rather than by current photosynthate supply [2]. Savin et al. (2026) add a caveat that matters here: conclusions of source limitation drawn from severe treatments (50–90% shading) or from manipulations applied before grain number is fixed describe treated plants only and should not be extended to intact crops [2]. Any synthesis that adopts a source sink framework must therefore treat the pre-heading period, when grain number is set, and the grain-filling period that follows as separate stages.
Elevated atmospheric CO₂ concentration (eCO₂) is usually presented as a fertilization effect that strengthens the source: a steeper CO₂ gradient between atmosphere and chloroplast suppresses photorespiration in C₃ species. That view is incomplete in three respects. First, eCO₂ does not act on source processes alone. Exposure normally begins early in vegetative growth and runs through the pre-heading window in which grain number is set, so extra assimilate arriving in that window may enlarge the sink rather than only fill a sink of fixed size. Second, surplus photosynthate raises yield only if sink tissue can import and use it, and this is where the source sink literature bears directly on eCO₂ work. Prolonged exposure often depresses photosynthetic capacity, the phenomenon known as photosynthetic acclimation; in a cross species meta-analysis, Arp (1991) found this down-regulation to be strongest where abundant carbohydrate coincides with a small sink [3]. Acclimation is therefore better read as a symptom of a disturbed source sink balance than as a direct effect of CO₂ on the photosynthetic apparatus. Paul and Foyer (2001) supplied the mechanism: weak sink demand lets carbohydrate accumulate in leaves, which represses photosynthetic genes and accelerates senescence, and this sink-dependent control can override the stimulation by light and CO₂ [4]. Ainsworth and Bush (2011) identified carbohydrate export from the leaf as the node through which sink demand acts back on source capacity [5], and work on rice genotypes traced the same feedback to triose phosphate utilization, placing the constraint inside the leaf rather than at the CO₂ supply step [6,7]. Third, source and sink act on different schedules, so their balance shifts during development: eCO₂ raises source activity at once, whereas sink capacity is largely fixed before heading. Under eCO₂ the source:sink ratio is therefore not constant through the life cycle.
Rice is the most intensively studied cereal in Asian eCO₂ experiments, and several syntheses have quantified its yield response [8,9,10,11]. Pooled estimates converge on roughly 20%, yet field studies consistently report smaller gains than enclosed facilities [8,12]. Few of these analyses, however, divide the eCO₂ yield benefit into source and sink derived parts: most report final yield, sometimes alongside photosynthesis, without resolving the mechanism. Primary studies share the limitation. One experiment addressed it directly, Gao et al. manipulated source sink balance under free-air CO₂ enrichment (FACE) and found that the yield response to eCO₂ changed with that manipulation [13], and trials across inbred lines generally find single grain weight to be stable and insensitive to eCO₂ [14]. Source side responses are better documented: canopy carbon assimilation rises under eCO₂, but the size of the response depends on growth stage and leaf nitrogen [15]; carbohydrate reserves reflect when the carbon was fixed during development [16]; and photosynthetic capacity declines as the season advances [17,18,19]. Nitrogen uptake acclimates to high CO₂ and canopy nitrogen allocation is rearranged [20,21], and dry matter and nitrogen partitioning among organs have been quantified under combined warming and CO₂ enrichment [22]. Where assimilate supply is experimentally reduced, final yield tracks the source sink imbalance that develops during grain filling, not the instantaneous photosynthetic rate [23]. What is still missing is a framework that treats source and sink together and asks which one sets the ceiling on yield.
This study asks whether the eCO₂ yield gain in rice comes mainly from a stronger source or from a larger sink. Our hypothesis, fixed before the dataset was assembled and grounded in the source sink work outlined above, is that the gain comes from more sinks. Extra assimilate during the pre-heading critical window should raise panicle and spikelet number, whereas grain mass and harvest index should change little, because grain filling in undisturbed stands is sink limited. The distinction has practical consequences. Breeding programmes for future CO₂ conditions must choose between greater photosynthetic capacity and larger sink size, and the evidence shows the two are not interchangeable [24,25,26]. Crop models face the same choice: most implement CO₂ by scaling photosynthesis or radiation use efficiency, which assumes yield is source limited; if the gain is instead set by yield components established before heading, those models will carry a directional bias [11,27,28,29].
2. Materials and Methods
2.1. Study Design and Literature Collection
The study has two parts. The first is an evidence map [30], a scoping assessment of how much primary experimental literature exists on rice responses to elevated CO₂, what it covers and where the gaps lie [31,32,33]. The second is a secondary synthesis, in which pooled estimates already published in meta-analyses are read together within a single source sink framework. We did not re-extract primary data, recompute effect sizes or fit new random effects models. Re-pooling published estimates would break the assumption of independence and would count the same primary experiment repeatedly wherever it appears in more than one meta-analysis [34].
Two independent literature searches were executed on 10 September 2026, one in the Web of Science (WoS) (TS field) and one in China National Knowledge Infrastructure (CNKI) (professional search, SU field). Adding CNKI was necessary because a substantial share of Chinese free-air CO2 enrichment (FACE) rice experiments is published in Chinese language journals that are not indexed in the WoS. Search (TS=("elevated CO2" OR "elevated CO2 concentration" OR "elevated atmospheric CO2" OR "elevated atmospheric carbon dioxide" OR "elevated [CO2]" OR "high CO2" OR "high CO2 concentration" OR "increased CO2" OR "increased CO2 concentration" OR "increased atmospheric CO2" OR "rising CO2" OR "rising atmospheric CO2" OR "future CO2" OR "CO2 enrichment" OR "CO2 elevation" OR "enriched CO2" OR "CO2 fertilization" OR "carbon dioxide enrichment" OR "elevated carbon dioxide" OR "eCO2" OR "free-air CO2 enrichment" OR "free-air carbon dioxide enrichment" OR "FACE") AND TS=(rice OR "Oryza sativa" OR Oryza OR paddy OR "paddy rice" OR "paddy field")) was run in both databases.
2.2. Coding the Evidence Map
Screening for the evidence map used titles, abstracts, author keywords and Keywords Plus from full WoS and CNKI exported files. Five categorical variables were coded for each record. Study type separated empirical experiments from reviews, editorials and modelling work, combining the native Web of Science document label with textual indicators such as “crop model” and “DSSAT”; a record was classed as modelling only when no experimental facility was described. Crop separability recorded whether rice was grown alone, grown alongside other crops, or not measured at all. Trait class recorded source traits, sink traits, both or neither. A fourth code flagged studies that reported grain yield but no yield component. A fifth code was added after the first pass. Harvest index (HI) can be reached in two ways: it is sometimes reported directly, and it is also grain yield divided by above-ground biomass at maturity, so a study giving both quantities has the information even if it never uses the term. The two routes were kept apart. HI was recorded only where the term appeared; derivable cases were coded separately, noting whether biomass was measured at maturity, at harvest or at physiological maturity, because the quotient is undefined for biomass cut earlier than that.
Source traits encompassed light-saturated photosynthesis, net photosynthesis, leaf gas exchange parameters, chlorophyll content, rubisco, stomatal conductance, leaf area index, tiller count, plant height, plus leaf, stem and root biomass. Sink traits included panicle number, spikelet count per panicle, spikelet density, grain number per unit ground area, filled grain percentage, individual grain mass, thousand grain weight, and HI. This classification follows conventions established by prior source sink manipulation experiments [35,36].
Coding applied the predefined keyword rules to title, abstract, author keywords and Keywords Plus. Because the rules are deterministic, the same record and the same rules always return the same code, so simply repeating the procedure proves little. What matters is whether the rules capture the intended categories, and that was tested twice. In the first test a 10% random sample of records (256) was drawn with a fixed seed and coded by hand from the same four metadata fields, without sight of the automated codes; some of these records were also checked against the full text. Disagreements were discussed, and where they traced to ambiguous wording in the rules, the rules were amended. Agreement on the trait variable was then measured with Cohen’s kappa [37] and its 95% confidence interval. Gwet’s AC1 [38] was reported as well, because kappa is unstable when one class dominates the distribution and can fall far below raw agreement [39,40]; for rare trait classes we also report raw agreement, since both coefficients are unreliable at low prevalence.
In the second test the rule set was frozen. A different seed drew a further 100 records that had played no part in any rule revision, and these were coded under the same conventions with no further adjustment. Comparing the two samples therefore shows how the finished rules perform on unseen records, free of the optimism that comes from having tuned them against the first sample.
2.3. Eligibility Criteria for Included Syntheses
Published quantitative syntheses were retained only when satisfying all eligibility criteria below:
(i) the work implemented quantitative synthesis methods (meta-analysis, meta-regression, or formal data aggregation) using empirical experimental data;
(ii) rice (Oryza sativa) was a target crop, with either rice specific analysis or effect estimates reported separately from other plant species;
(iii) the study reported at least one source trait, sink trait, or grain yield;
(iv) elevated and ambient CO₂ treatments were clearly defined.
We excluded purely narrative reviews lacking quantitative synthesis, modelling papers that did not synthesize empirical experimental data, syntheses restricted to noncereal species, and datasets where rice outcomes could not be decoupled from other crops. If multiple syntheses reported estimates for the same trait using overlapping primary datasets, all eligible publications were retained; we report the full range of observed effect sizes rather than adopting a single summary value.
Traits were preassigned to three categories following standard physiological definitions: source tissues export fixed assimilates, while sink tissues receive and store assimilates:
(i) Source traits: light-saturated photosynthetic rate (Asat), net photosynthetic rate (Pn), leaf area index (LAI), plant height, leaf biomass, stem biomass, root biomass, and biochemical determinants of photosynthetic capacity (Rubisco concentration, Vcmax, Jmax).
(ii) Sink traits: panicle number, spikelet number per panicle, spikelet density, grain number per unit area, filled grain percentage, individual grain mass, grain size, and HI.
(iii) Integrated traits: grain yield and reported source: sink ratio.
Two classification ambiguities are explicitly acknowledged. First, tiller number is reported separately as sink associated morphology rather than assigned to either class, because tiller number largely determines panicle number and therefore lies at the boundary between the two domains; counting it as an unambiguous source trait would bias the source to sink ratio downwards. Second, vegetative biomass (leaf, stem, root) is treated here as a source associated structural variable because leaves function as the primary assimilates exporting organs. In contrast, panicle biomass falls under sink traits: panicles act as assimilate receiving structures, and mature panicle biomass is dominated by grain mass. We emphasize that this grouping represents a working convention. Biomass partitioning between vegetative and reproductive tissues is itself an emergent outcome of source-sink balance rather than an unambiguous marker of source or sink status. To make this distinction checkable, the proportion of biomass allocated to roots, stems, leaves and panicles was coded as a separate allocation class.
2.4. Selection of Individual Experiments and Supplementary Materials
A small number of individual experiments were considered as possible illustrations alongside the synthesis level estimates, and were identified through targeted searching rather than through the systematic searches. To prevent selection bias, these entries were admitted only under the following pre-specified conditions: (i) the study reported both a source side and a sink side trait for the same CO₂ treatment contrast; (ii) the CO₂ treatment was applied at field scale under free-air or open-top conditions; and (iii) the study was published between 2010 and 2026. Studies not meeting all three conditions were excluded. These experiments serve only to illustrate specific mechanisms. They were excluded from all frequency counts, source to sink ratios and proportional statistics reported in Section 3.1, so they cannot have influenced the quantitative conclusions. The selection was nevertheless informed by our prior expectation of a sink directed response, and we state that openly.
All materials required to reproduce this analysis accompany the article. Supplementary Table S1 reports harvest index frequencies under three alternative counting definitions. Supplementary Table S2 gives the full search strings, the stage by stage record counts for both databases, and the list of eligible syntheses. Supplementary Table S3 lists the trait classification rules, the noise exclusion rules and the treatment of ambiguous cases.
2.5. Data Extraction and Synthesis
From each contributing synthesis we extracted the target crop, the experimental platform (FACE, open-top chamber, controlled-environment chamber) and the elevated and ambient CO₂ concentrations. We also recorded the number of primary studies and observations behind each pooled estimate, the trait name, the direction and size of the response, and the significance or confidence interval reported with it.
The source syntheses used different effect size metrics, log response ratios, percentage change and standardized mean differences, and we converted every response to percentage change where that was possible. Responses were then grouped by trait class and compared descriptively. No new pooled estimate was produced and no statistical test was applied across trait classes, for two reasons: the primary datasets behind the syntheses overlap substantially, and confidence intervals were not reported consistently. The comparison therefore rests on the direction, relative size and consistency of the responses as published.
3. Results
3.1. How the Coding Held up, and What the Literature Contains
Agreement between the automated coding and the human coding was acceptable but not high. Before any rule was revised, Cohen’s κ for the trait variable was 0.46, with 64.8% raw pairwise agreement. Reading the 90 discordant records showed three systematic gaps in the rules rather than scattered disagreement. The source trait keyword list omitted common standalone terms for photosynthesis and biomass. The bare keyword yield caught papers on methane or nitrous oxide fluxes, where yield was mentioned only in passing. And unqualified root and canopy keywords misclassified work on rhizosphere carbon cycling or heavy metal accumulation as source trait research. The rules were therefore revised, and a noise exclusion class was added at title screening to flag papers centered on greenhouse gas dynamics, soil microbial processes or contaminant biogeochemistry, in which crop traits are peripheral. Coding was then repeated on the same calibration sample: κ = 0.56 (95% CI 0.47-0.65), raw agreement 74.6%. By conventional benchmarks [41] that is moderate rather than substantial. Two qualifications apply. κ is depressed when one class dominates the distribution [39,40], and the neither-trait class accounted for 58% of coded records; on the same data Gwet’s AC1, which is less sensitive to class prevalence, reached 0.70.
Applying the two searches described in Section 2.1 retrieved 6,120 records (2,940 from the Web of Science Core Collection and 3,180 from CNKI). Removing 2 duplicate records and 1,666 records excluded at download by document-type restriction left 4,452 records screened. Automated title and keyword level prescreening removed a further 2,223 records as clearly ineligible, leaving 2,229 records that underwent semantic screening against the three eligibility criteria. Application of those criteria retained 668 studies, which form the denominator for all descriptive analyses reported below. PRISMA stage-by-stage counts are given in Supplementary Table S2 and Figure 1a. Publication years spanned 1986-2026; records without a resolved publication year were retained in the corpus but excluded from temporal trend analyses.
Within this corpus, 460 studies (68.9%) reported source traits and 194 (29.0%) reported sink traits, a source to sink ratio of 2.37:1 (Figure 1). The gap is widest for the traits that matter most when deciding whether a yield response is source or sink driven. Photosynthesis was measured in 261 studies (39.1%), spikelet or grain number in 91 (13.6%), grain filling in 54 (8.1%), individual grain mass in 49 (7.3%), and HI in only 22 (3.3%). The reporting classes overlap: 114 studies (17.1%) covered both source and sink traits, 346 source traits alone, 80 sink traits alone, and 128 (19.2%) gave grain yield with no yield component, so their gain cannot be attributed to either more grains or heavier grains. The ratio is similar in the Chinese language subset (136 source versus 49 sinks; 2.78:1) and the English language subset (324 versus 145; 2.23:1), which argues against language or database coverage as the cause (Figure 1b).
Time windows over three decades show no narrowing of the imbalance. The share of studies reporting both source and sink traits rose from 10.0% (1995-2004) to 19.0% (2020-2029), which is real progress; even so, studies reporting source traits alone stayed dominant at 44.2-51.0% in every period, and those reporting neither rose from 6.7% to 20.4% as climate scenario modelling became common. Because classification used titles and abstracts only, every proportion here is a lower bound on how often a trait was actually measured. HI needs separate treatment, because it can be calculated rather than measured. It was named explicitly in 22 studies (3.3%). Because HI is the quotient of grain yield and aboveground biomass measured at maturity, a further 37 studies (5.5%) reported both quantities and stated that biomass was sampled at physiological maturity or at harvest, so HI is derivable although unnamed. Three counts are therefore possible (Supplementary Table S1): named HI only (n = 22, 3.3%); derivable cases with maturity-stage biomass confirmed (n = 37, 5.5%); or the combined upper bound (n = 59, 8.8%). These move the photosynthesis to HI ratio from 11.9:1 to 6.9:1 and 4.4:1. The main analysis uses the strict count. Two cautions attach to the looser counts. HI cannot be derived from biomass cut before physiological maturity, which is why definition B requires an explicit maturity or harvest statement rather than an inferred one; and even on the most permissive count the imbalance is reduced, not removed. Studies reporting nutrient (N, P or K) HI were excluded from all three counts, since that metric describes nutrient recovery, not carbon partitioning to grain.
These reporting patterns set two limits on what the literature can support. First, it cannot yet separate source from sink mediated yield responses. Only 114 studies measured both classes, and fewer still provide paired observations from which a within-study source sink contrast could be computed; the syntheses summarised in Section 3.2 supply paired estimates for fewer again. Second, the set of studies that measure photosynthesis under eCO₂ is not a neutral sample, because choosing to measure photosynthesis usually presumes that CO₂ acts through photosynthesis. Pooling that set to test a source limited model therefore risks testing the hypothesis on literature already inclined towards it. This is a property of the evidence base, not something that reanalyzing published data can correct.
3.2. The Published Syntheses
The same two searches also retrieved syntheses of this literature. Applying criteria (i)-(iv) to those records identified 14 quantitative syntheses of eCO₂ effects in rice, of which seven contributed estimates to Table 1. The remaining seven met all four criteria but were not extracted, either because rice specific estimates could not be separated from other crops [52,72] or because we prioritised syntheses reporting a source or sink trait contrast. A further 58 candidate records were excluded. Those reporting only greenhouse gas fluxes [46,47,48,49,50,51] or only grain quality and nutrient composition [43,44,45,75] do not satisfy criterion (iii), and those projecting future climate scenarios or crop responses to drivers other than an applied CO₂ contrast [53,54,55,56,57,58,59,60,61] do not satisfy criterion (iv).
Across the seven contributing syntheses, grain yield was the most frequently reported outcome, followed by source-side physiological and biomass traits. Sink-side yield components appeared less often, and harvest index in only two of the seven. This asymmetry repeats the bias measured in the primary literature (Section 3.1) and is the main obstacle to decomposing the eCO₂ yield gain into source and sink parts. Figure 2 describes all 14 eligible syntheses and marks those that contribute data.
The most cited rice focused synthesis is Ainsworth (2008), followed by Wang et al. (2015) and the FACE series of Hu et al. (2021, 2022). Since then, the literature has moved into questions this framework does not address grain composition and human nutrition, greenhouse gas fluxes, and interactions with warming, nitrogen and water, and cross-cereal syntheses of biomass and yield components, nutrient cycling and contaminant loads have appeared as well.
3.3. A Gradient from Source to Sink
Table 1 and Figure 3 collect the estimates from the seven contributing syntheses. Because the underlying primary datasets overlap and confidence intervals were reported unevenly, we did not test the ordering statistically; the sequence should be read as a description of published values, not as a ranking. Read that way, from source traits through allocation to sink traits, grain yield and grain quality, the responses fall along a gradient: source side and allocation variables move strongly, sink capacity variables barely move, and grain yield rises by substantially less than the source side. HI appears in only two syntheses and the two estimates disagree in sign (+9% and -2%); we record the disagreement rather than resolve it, because the estimates come from different primary datasets with different platform composition. Allocation ratios, available from one synthesis only, put the extra carbon below ground: the root fraction rose while the leaf fraction fell, and the panicle fraction did not change.
On the source side, almost every measured trait increased. Under FACE, eCO₂ raised light-saturated photosynthesis by 21.9%, root biomass by 27.9%, shoot biomass by 19.0%, maximum tiller number by 11.4%, leaf area index by 8.7% and plant height by 3.7% [10]. Shoot organs differed: leaf biomass rose 8.8%, stems 23.7% and panicles 25.4%, so allocation shifted towards reproductive tissue, with panicles responding about 2.9 times more than leaves. Carbohydrate pools grew as well, stem nonstructural carbohydrate by 18.8%, leaf soluble sugar by 11.9% (n = 8) and leaf starch by 26.3% (n = 7), which suggests that much of the extra carbon stayed in vegetative tissue instead of moving to grain.
Three patterns recur along this sequence: responses weaken from source to sink; within the shoot, allocation favours panicles over leaves; and the source side increases in Table 1 are not matched by equivalent gains in sink capacity, a point taken up in Section 4.2.
3.4. What Modifies the Response
Each included synthesis conducted independent moderator analyses. Although we did not re-pool effect sizes, we compare the directional trends of these moderators. Experimental fumigation platform exerted the most consistent influence on yield response. Ainsworth [8] found yield enhancement diminished under field realistic conditions: 12% stimulation under FACE versus 23% across all chamber and field platforms. This aligns with broader consensus that enclosure-based systems tend to overestimate crop responses observed in open fields [12,63]. Likewise, genotypic responses differed markedly. Hybrid rice achieved a 24.7% yield gain, compared with a cultivar mean of 14.0%; within conventional lines, indica rice gained 20.4% versus 12.7% for japonica rice [42]. This advantage of hybrid and indica cultivars arose primarily from greater spikelet density, reflecting expanded sink number rather than improved source capacity. Organ-scale observations support this interpretation [64,65].
Warming consistently attenuated the eCO₂ benefit. Yield rose 16.2% at ambient temperature but only 10.1% with 1-2 °C of warming [42], and further warming removed the gain altogether [8]. In source sink terms the loss came from lower filled grain percentage and lighter grains, both sink traits, rather than from impaired photosynthesis, and experiments that warmed the crop at flowering or during early grain filling show the same thing [66,67,68]. Nitrogen mattered as well: the yield response peaked at 21.1% at 21-30 g m-2 and fell away at both lower and higher rates, for different reasons at each end [42]. A higher nitrogen supply amplified the biomass response to eCO₂ while warming suppressed it [10], and nitrogen uptake itself acclimates to elevated CO₂ [20,69].
Fabre et al. [6] provide a useful test case. They defined a genotype specific index as flag leaf area divided by the spikelet number of the corresponding panicle, and compared five genotypes of differing source: sink balance. Under eCO₂, genotypes with a low ratio showed stronger photosynthetic stimulation, less nonstructural carbohydrate in flag leaves and larger gains in biomass and grain yield; high ratio genotypes became sink limited, which the authors attributed to limited triose phosphate utilization [7].
Across genotypes, photosynthetic responsiveness fell as the ratio rose, and the ratio itself is reported as stable across environments. The stimulation was also transient: biomass increments and light-saturated photosynthesis both diminished as the crop matured [10], and progressive downregulation of leaf photosynthesis under FACE has been recorded directly [17,19,70].
4. Discussion
4.1. Source-Limited and Sink-Limited Phases in Sequence
The three core patterns identified in Section 3.3 are not independent observational outcomes. Instead, they arise from a single developmental sequence in which the operative constraint differs before and after heading. Separating these two growth windows resolves what would otherwise appear as three unrelated observations.
Genotypic comparisons point the same way. Two syntheses that partition the yield response by cultivar type agree that hybrid and indica rice gain more than japonica. Hu et al. [42] report +24.7% for hybrid, +20.4% for indica, +14.2% for conventional and +12.7% for japonica; the updated FACE synthesis of Lv et al. [11] reports +32.8% for hybrid, +22.6% for indica and +13.5% for japonica. Ainsworth and Long [63] instead report a cultivar mean of +14.0% and a high potential cultivar class of +35.0%, a contrast that indicates genotypic rather than class level differences.
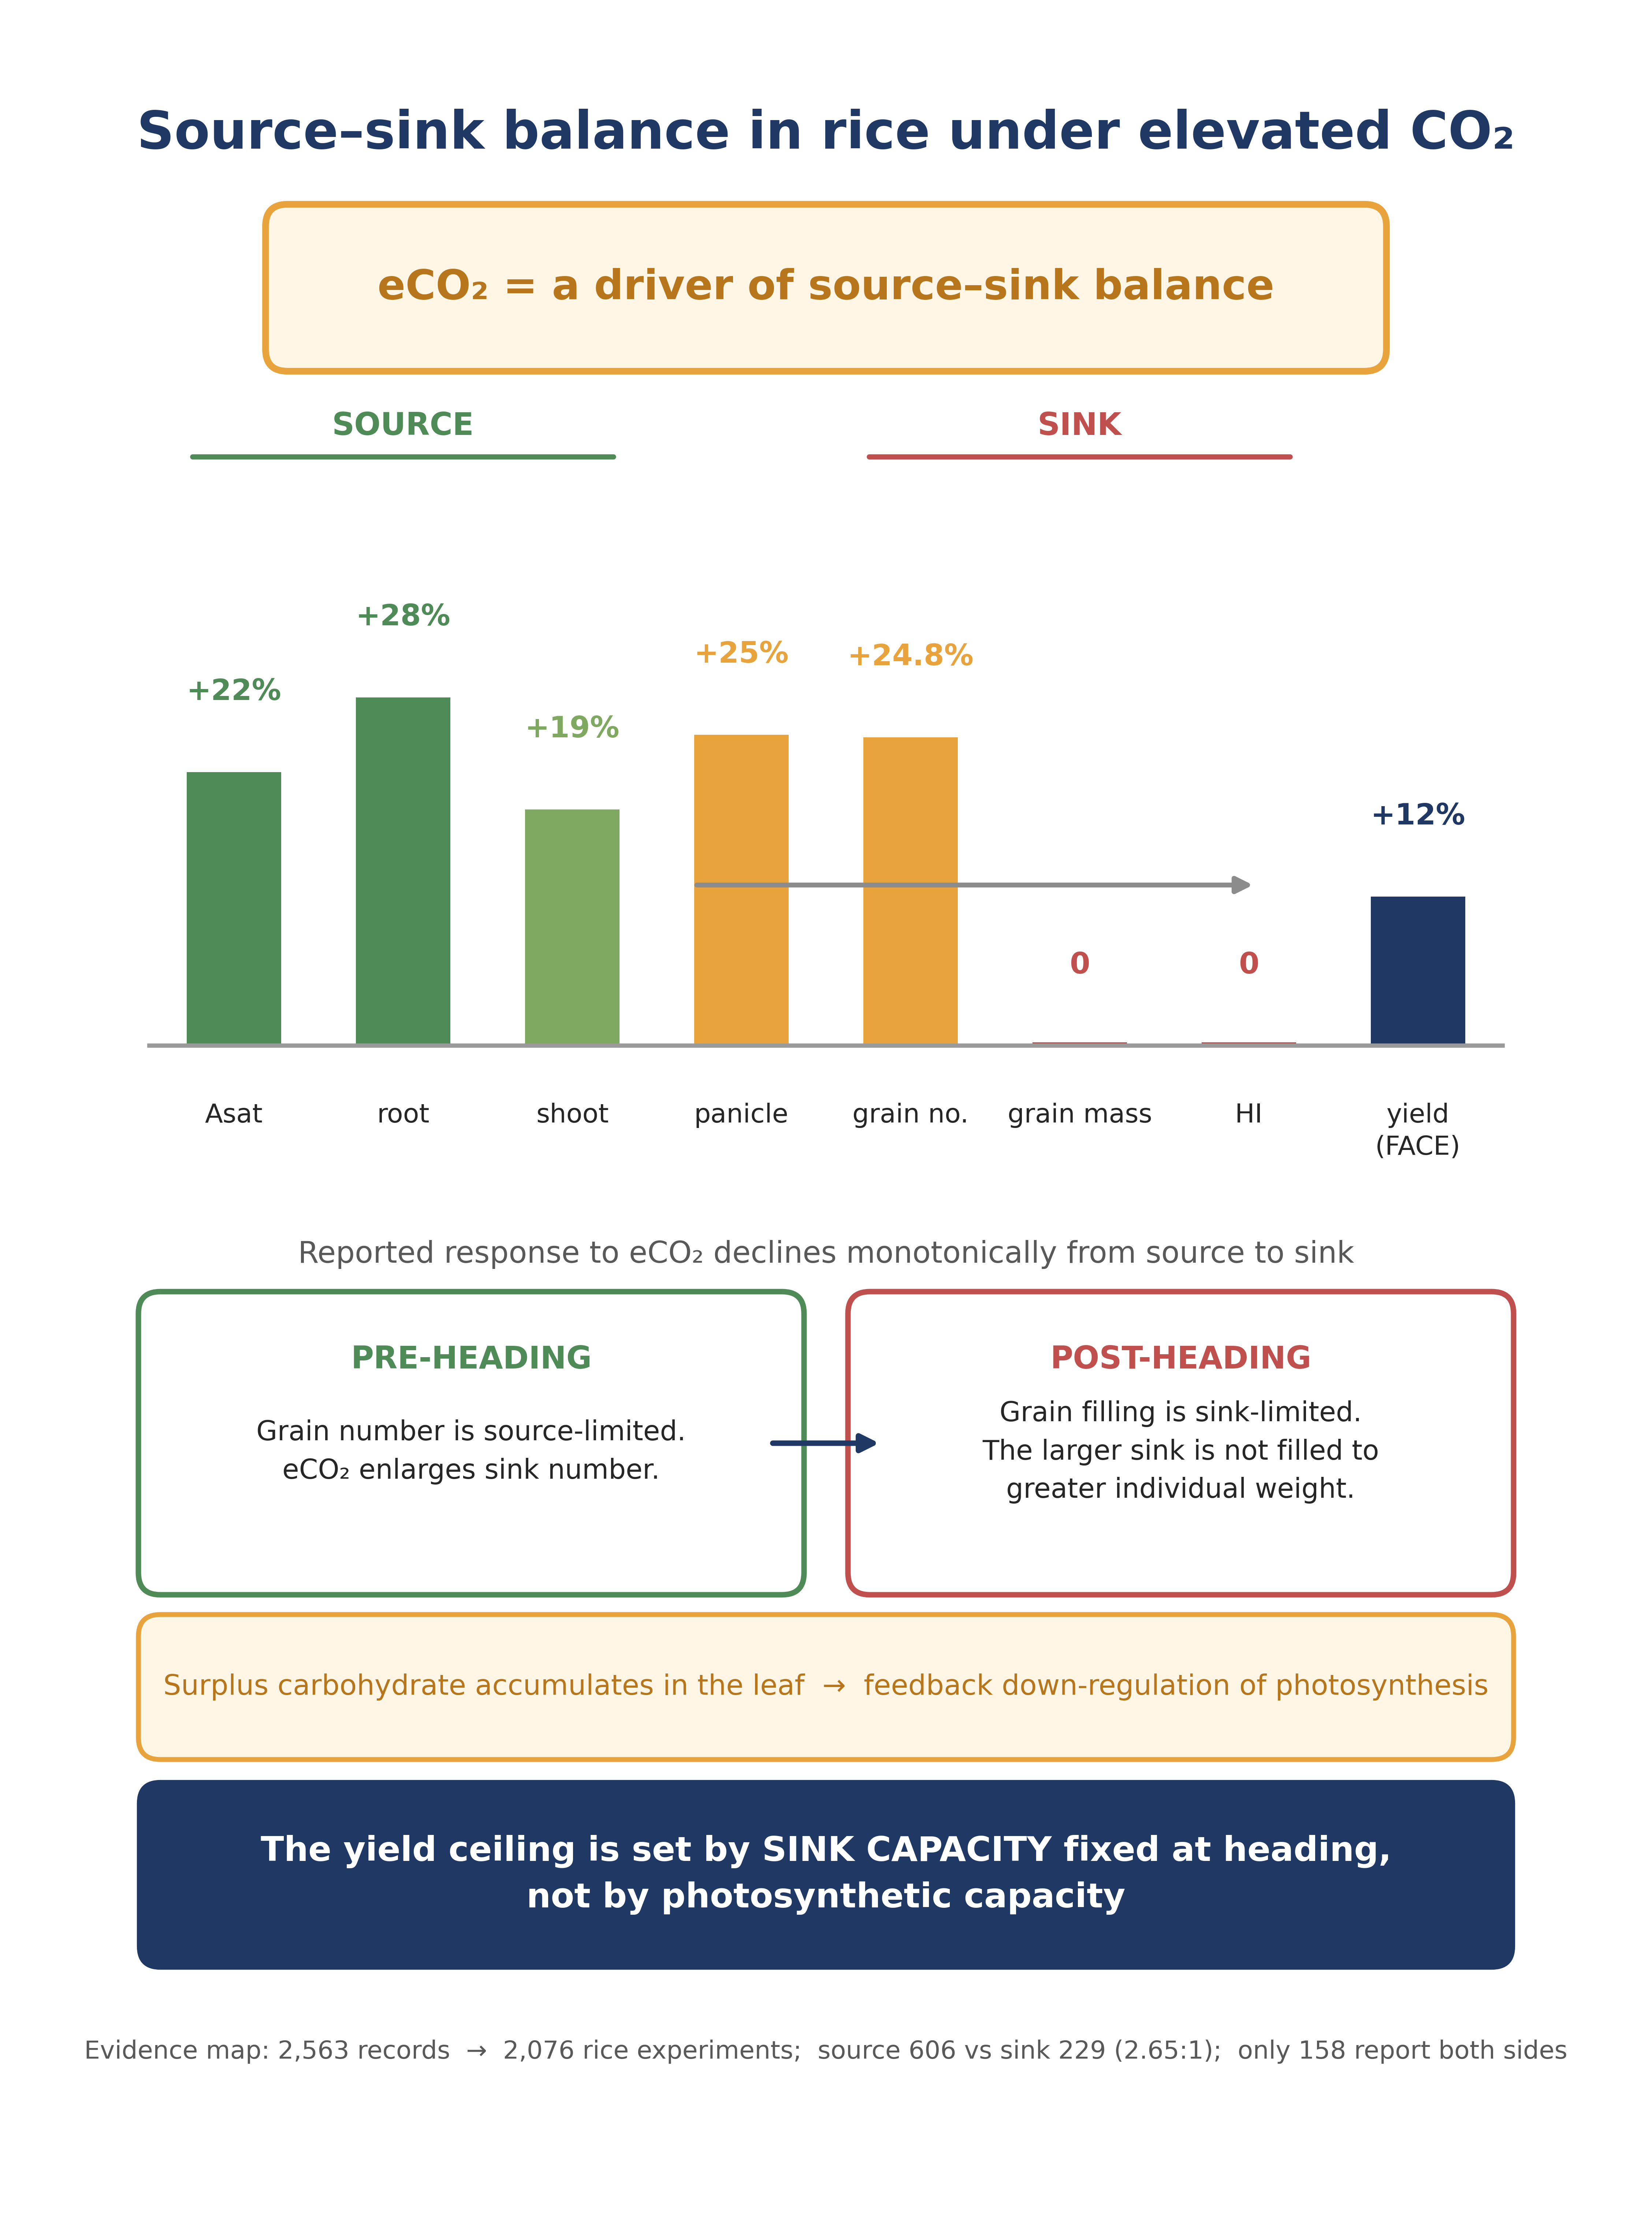
The constraint reverses after heading. In intact field grown rice populations, grain filling is predominantly sink limited. External manipulations during the filling stage cannot increase individual grain weight if the maximum potential grain size is already fixed [2]. Consistently, the expanded sink size formed pre-heading fails to produce heavier grains under elevated CO₂. Existing evidence confirms no significant changes in individual grain mass and HI under eCO₂ conditions [9]. A targeted pot-transfer experiment further verified this rule: shifting rice plants between ambient and elevated CO₂ environments at heading (when sink number was fully determined) exerted no influence on final grain weight [14].
The same sequence explains why photosynthetic acclimation is so common in eCO₂-treated rice. Extra carbon before heading enlarges the sink, but the sink size fixed after heading cannot absorb the surplus, so carbohydrate builds up in leaves and feeds back on photosynthesis. Early work showed acclimation to be strongest where abundant carbon supply meets limited sink storage [3]. The pathways are now well characterized: leaf carbon export capacity governs photosynthetic plasticity [4,5], and in rice the limitation has been traced to triose phosphate utilization, which restricts carbon fixation inside the leaf once supply is surplus [6,7]. Acclimation is therefore not an artefact of CO₂ enrichment but the expected adjustment when source capacity runs ahead of sink demand (Figure 4).
4.2. What Changes, and What Does Not
The syntheses assembled here retain their own internal validity and conclusions; the present work does not overturn those results but reexamines the mechanistic reading offered for them. The contribution of the present work is therefore a change in the organising framework, not a revision of the published estimates themselves.
A synthesis of two decades of FACE data attributed the eCO₂ gain in rice productivity to higher leaf photosynthesis, while noting that the stimulation weakens late in the season [10]. That observation matches ours; the causal reading differs. We argue that post-heading sink limitation caps final yield, so surplus assimilate raises yield only where sink size was enlarged before heading. Photosynthesis is the route; sink capacity is the constraint. This matters in practice: a genotype or a management practice that raises photosynthesis without enlarging the sink should show strong acclimation and little yield gain, whereas one that enlarges the sink should hold on to the CO₂ effect. Cross crop comparisons support the same reading: eCO₂ stimulates growth far more in C₃ than in C₄ crops, plasticity indices of 1.97 versus 1.23 for root biomass and 2.04 versus 1.16 for shoot biomass, without altering growth balance [71].
The comparison of Fabre et al. [6] is worth restating here because it is the closest available approximation to a direct test: low ratio cultivars gained more, and high ratio cultivars became sink limited. It rests on one experiment rather than on pooled estimates, so it illustrates the proposed mechanism rather than confirming it statistically. What it does add is a measurable index, flag leaf area per spikelet, that a breeding programme could score directly.
This framework also clarifies field to chamber response discrepancies in existing models. Enclosure based experiments consistently overestimate rice CO₂ fertilization effects relative to open-field FACE conditions, with yield gains of 23% versus 12% respectively [8,12]. Part of this deviation originates from source sink imbalance rather than inherent enclosure artefacts. Controlled enclosure environments alter pre-heading growth conditions critical for sink formation, inducing artificial sink expansion; meanwhile, fixed sink capacity in enclosed plants inevitably triggers late-stage photosynthetic acclimation. Recent temperature moderator analyses further confirm that photosynthesis-only models fail to predict interactive climate responses accurately in specific regions [52,72]. This testable mechanistic discrepancy is formally proposed as a targeted prediction in Section 4.6.
4.3. What the Primary Literature Cannot Yet Do
Section 3.1 does more than describe the corpus: it sets the boundary of what the primary evidence can support. Three findings define that boundary. Sink determinants of yield are seldom measured: HI in 3.3% of studies and individual grain mass in 7.3%, against photosynthesis in 39.1% and any biomass trait in 28.7%. The source to sink ratio of 2.37:1 is therefore a fact about the field’s measurement habits, not about rice physiology. The asymmetry is also persistent, as the time windows show. And the subset that measures photosynthesis under eCO₂ is not neutral, because that choice already assumes CO₂ acts through photosynthesis; testing a source limited model on that subset risks confirming the assumption built into it.
Together these constraints explain why we did not re-pool primary data, and they point to what a future rice eCO₂ meta-analysis should do differently. Syntheses should give priority to studies that measured source and sink traits together. Models should treat grain mass, spikelet number and HI as the response variables, with photosynthesis as a covariate rather than the outcome. And publications should state whether the eCO₂ treatment covered the pre-heading window in which sink size is set, a detail usually omitted, although it decides the answer. Methods for handling missing measured variables in crop meta-analysis already exist and could be applied here [34].
Secondary synthesis has known weaknesses that carry over here: publication bias, screening criteria that differ between source studies, and uneven trait coverage. Non-independent primary datasets and inconsistent confidence intervals also limit how far trait classes can be compared quantitatively. The sequential source sink model proposed below is therefore offered as a mechanistic reading of the evidence, and every inference drawn from it is stated as a testable prediction rather than as a statistical result.
4.4. Practical Implications for Rice Breeding and Field Management
The sequential model has three implications for breeding and management, given in the order of how firmly the evidence supports them.
Sink capacity, not photosynthetic rate, is the breeding target for rice adapted to future CO₂. eCO₂ raises panicle number, spikelet density and spikelets per panicle, whereas individual grain mass and harvest index stay unchanged [9,42]. Spikelet number has already been identified as the constraint on japonica yield under FACE, where spikelet degeneration occurs under high CO₂ [29,65]. Any sink-focused selection also has to be checked against lodging, which does not always move in the same direction as yield [73].
The canopy source:sink ratio could serve as a screening index, because the flag leaf area to spikelet number ratio is stable across environments, which is what a selection criterion requires [6]. Genotypes with a low intrinsic ratio show less flag leaf carbohydrate accumulation and weaker photosynthetic acclimation under elevated CO₂.
Temperature is the third piece, and it matters for climate resilient cultivation. Warming erodes the CO₂ benefit through the sink: filled grain percentage falls and grains finish lighter, whereas photosynthesis is not the failing step [8,42]. Heat tolerance of the sink, rather than thermal stability of photosynthesis, therefore appears to govern yield stability under combined eCO₂ and warming. Heat stress at flowering or early grain filling removes the CO₂ advantage by causing spikelet sterility and incomplete filling, independently of carbon supply [66,67,68], and interactions of the same sign have been reported in barley [62]. Whether the effect is specific to pre-heading warming is not yet established: few experiments separate warming applied before heading from warming applied after it, and we state this as a hypothesis to be tested.
Two qualifications temper this reading. Sink focused breeding has to be judged together with grain quality, because eCO₂ changes the nutritional composition of rice independently of yield [74,75,76], and nitrogen supply shifts the response in both directions, through demand as well as uptake [69,77,78]. Beyond rice, the framework predicts that any crop whose sink capacity is fixed before reproductive growth will show the same attenuation once the sink is filled, which offers a general explanation for why enclosure based screening overstates eCO₂ responsiveness. It also reframes the practical question: not how far photosynthesis can be pushed, but how large a sink can be built before it becomes self limiting. The predictions in Section 4.6 are stated so that this can be checked against new data.
4.5. Study Limitations
Five limitations qualify the present analysis. Screening was title- and abstract-level, so a small number of records may be misclassified. The searches covered the WoS and CNKI but not Scopus, PubMed or CAB Abstracts, and Chinese language theses were not searched; because a substantial share of Chinese FACE rice experiments originates in theses, this likely underestimates long-term FACE datasets. Secondary synthesis cannot remove publication bias or selective outcome reporting in the primary studies. Effect estimates in Table 1 are statistically non-independent, since individual experiments appear in more than one meta-analysis, which is why none was re-pooled and why each is reported as its authors derived it. Finally, the trait-class comparisons in Figure 3 are semi-quantitative: no significance test of the source to sink gradient was performed, and the ordering should not be read as a statistical ranking. None of these limits bears on the reporting frequencies of Section 3.1, which are counts of what the literature contains, nor on the direction of the effects in Table 1, which are reproduced as published.
4.6. Testable Mechanistic Predictions
The sequential source sink limitation framework developed above generates three predictions that are testable with data either already available or straightforward to generate. Each is stated together with the observation that would falsify it, so that the framework can be assessed rather than merely illustrated.
(i) Yield responses to eCO₂ are explained better by spikelet number plasticity than by the enhancement of light-saturated photosynthesis; residual variation left unexplained by sink traits should be attributed to late season photosynthetic acclimation rather than to initial stimulation. The assembled estimates already offer a check. If the source limited model were right, the FACE yield increment (+12%) should track the photosynthesis increment (+21.9%) more closely than the panicle density increment (+9.2%); in fact it lies closer to the sink-side change, which is not the pattern that model predicts.
(ii) Whatever their intrinsic photosynthetic capacity under ambient CO₂, genotypes with a low local source:sink ratio should gain more yield, keep less carbohydrate in the flag leaf and acclimate less under eCO₂ than genotypes with a high ratio.
(iii) Elevated CO₂ treatments applied exclusively after heading (with fixed sink size) will produce negligible yield improvement and stronger photosynthetic acclimation, compared with treatments covering the pre-heading sink formation window. Existing pot-transfer experiments have already validated the absent yield response of post heading CO₂ enrichment [14], supporting the core premise of this prediction.
5. Conclusions
Reading the published syntheses of rice under eCO₂ through one source sink framework gives a picture that no single synthesis provides. Three patterns recur. eCO₂ raises leaf photosynthetic capacity and vegetative biomass, most strongly root biomass (+27.9%) and panicle biomass (+25.4%). Individual grain mass and harvest index do not change consistently: the two syntheses that report harvest index give +9% and -2%, and the latter does not differ from zero. Grain yield nevertheless rises by 12-20%, less under free-air conditions than in enclosures, and more in hybrid and indica cultivars than in japonica. These estimates are listed side by side rather than reduced to a single conversion efficiency, because they come from partly disjoint primary datasets in which one trial may appear more than once; they are a range of published values, not measurements that can be added together. Milling also matters: brown and white rice yield rise by 18.8% and 15.7% while head rice yield does not change, so part of the apparent gain is lost in processing. The pattern is descriptive, rests on published estimates rather than on tests of our own, and should be read as a hypothesis consistent with the evidence rather than as an established mechanism.
These divergent responses fit a sequential constraint. Before heading, grain number depends on assimilate supply, so extra CO₂ enlarges the sink through more spikelets. After heading, filling responds little: the larger sink population does not produce heavier grains, and surplus carbohydrate accumulates in leaves, where it depresses photosynthesis through feedback. Allocation data now show this directly, under FACE the fraction of biomass in roots rose 8.5% while that in leaves fell 8.4%, with no change in the panicle fraction [10]. Carbon therefore goes below ground and into leaves rather than into grain, which is why harvest index does not rise even though total yield does.
Two consequences follow, one for modelling and one for breeding. Crop models that implement CO₂ responses by scaling photosynthesis or radiation-use efficiency implicitly assume that yield is source limited; if the increment is instead set largely by yield components established before heading, such models will carry a directional bias. And breeding for future eCO₂ environments should not treat greater photosynthetic capacity and larger sink size as interchangeable targets: the evidence assembled here indicates that sink capacity, not photosynthetic potential, sets the ceiling on realized yield. That conclusion comes from a descriptive comparison of published estimates and should be treated as a well-supported hypothesis rather than an established causal mechanism; the tests proposed in Section 4.6 provide the means to evaluate it.
Supplementary Materials
The following supporting information can be downloaded at the website of this paper posted on Preprints.org. Table S1: Harvest index reporting in the primary literature under three alternative counting definitions; Table S2: search strings, stage-by-stage record counts for both databases, and eligible versus contributing syntheses; Table S3: trait-classification rules, noise-exclusion rules and treatment of ambiguous cases.
Author Contributions
Conceptualization, G.Z. and L.T.; methodology, L.T.; software, G.Z.; validation, G.Z., Z.L. and L.W.; formal analysis, G.Z.; investigation, Z.L. and L.W.; resources, G.Z. and L.T.; data curation, G.Z., Z.L. and L.W.; writing—original draft preparation, G.Z., Z.L., L.W., and L.T.; writing—review and editing, G.Z.; visualization, G.Z., Z.L. and L.W.; supervision, G.Z. and L.T.; project administration, G.Z. and L.T.; funding acquisition, G.Z. and L.T. All authors have read and agreed to the published version of the manuscript.
Funding
This research was funded by the Ministry of Education’s Humanities and Social Sciences Projects, grant number 29YJC630133 and the National Natural Science Foundation of China, grant number 42077209.
Data Availability Statement
The data presented in this study are available on request from the corresponding author.
Acknowledgments
During the preparation of this manuscript, the authors used a generative artificial intelligence tool to assist with the drafting of the search strings, with the preparation of the R code used for the figures, and with language editing of the text. All outputs were reviewed, revised and verified by the authors, who take full responsibility for the content of this publication.
Conflicts of Interest
The authors declare no conflicts of interest.
Abbreviations
The following abbreviations are used in this manuscript:
| FACE | Free-air CO₂ enrichment |
| Asat | Light-saturated photosynthetic rate |
| Pn | Net photosynthetic rate |
| LAI | Leaf area index |
| eCO₂ | Elevated carbon dioxide |
| HI | Harvest index |
| Vcmax | Maximum rate of Rubisco carboxylation |
| Jmax | Maximum rate of electron transport |
References
- Yoshida, S. Physiological aspects of grain yield. Annu. Rev. Plant Physiol. 1972, 23, 437–464. [Google Scholar] [CrossRef]
- Savin, R.; Serrago, R.A.; Miralles, D.J.; Tamagno, S.; Calderini, D.F.; Sadras, V.O.; Slafer, G.A. Extreme treatments and data overinterpretation could lead to the unjustified conclusion that crop yield is source-limited during the effective grain filling. Field Crops Res. 2026, 337, 110264. [Google Scholar] [CrossRef]
- Arp, W.J. Effects of source-sink relations on photosynthetic acclimation to elevated CO₂. Plant Cell Environ. 1991, 14, 869–875. [Google Scholar] [CrossRef]
- Paul, M.J.; Foyer, C.H. Sink regulation of photosynthesis. J. Exp. Bot. 2001, 52, 1383–1400. [Google Scholar] [CrossRef] [PubMed]
- Ainsworth, E.A.; Bush, D.R. Carbohydrate export from the leaf: a highly regulated process and target to enhance photosynthesis and productivity. Plant Physiol. 2011, 155, 64–69. [Google Scholar] [CrossRef] [PubMed]
- Fabre, D.; Dingkuhn, M.; Yin, X.; Clement-Vidal, A.; Roques, S.; Soutiras, A.; Luquet, D. Genotypic variation in source and sink traits affects the response of photosynthesis and growth to elevated atmospheric CO₂. Plant Cell Environ. 2020, 43, 579–593. [Google Scholar] [CrossRef] [PubMed]
- Fabre, D.; Yin, X.; Dingkuhn, M.; Clement-Vidal, A.; Roques, S.; Soutiras, A.; Luquet, D. Is triose phosphate utilization involved in the feedback inhibition of photosynthesis in rice under conditions of sink limitation? J. Exp. Bot. 2019, 70, 5773–5786. [Google Scholar] [CrossRef] [PubMed]
- Ainsworth, E.A. Rice production in a changing climate: a meta-analysis of responses to elevated carbon dioxide and elevated ozone concentration. Glob. Change Biol. 2008, 14, 1642–1650. [Google Scholar] [CrossRef]
- Wang, J.; Wang, C.; Chen, N.; Xiong, Z.; Wolfe, D.; Zou, J. Response of rice production to elevated [CO₂] and its interaction with rising temperature or nitrogen supply: a meta-analysis. Clim. Change 2015, 130, 529–543. [Google Scholar] [CrossRef]
- Hu, S.; Chen, W.; Tong, K.; Wang, Y.; Jing, L.; Wang, Y.; Yang, L. Response of rice growth and leaf physiology to elevated CO₂ concentrations: a meta-analysis of 20-year FACE studies. Sci. Total Environ. 2022, 807, 151017. [Google Scholar] [CrossRef] [PubMed]
- Lv, C.; Huang, Y.; Sun, W.; Yu, L.; Zhu, J.; Wang, Y.; Yang, L. Response of rice yield and yield components to elevated [CO₂]: a synthesis of updated data from FACE experiments. Eur. J. Agron. 2020, 112, 125961. [Google Scholar] [CrossRef]
- Long, S.P.; Ainsworth, E.A.; Leakey, A.D.B.; Nosberger, J.; Ort, D.R. Food for thought: lower-than-expected crop yield stimulation with rising CO₂ concentrations. Science 2006, 312, 1918–1921. [Google Scholar] [CrossRef] [PubMed]
- Gao, B.; Hu, S.; Jing, L.; Niu, X.; Wang, Y.; Yang, L. Alterations in source-sink relations affect rice yield response to elevated CO₂: a free-air CO₂ enrichment study. Front. Plant Sci. 2021, 12, 700159. [Google Scholar] [CrossRef] [PubMed]
- Huang, Y.; Sun, W.; Hu, Z. Individual grain mass of inbred rice cultivars does not benefit from elevated [CO₂]. Environ. Exp. Bot. 2024, 226, 105888. [Google Scholar] [CrossRef]
- Sakai, H.; Hasegawa, T.; Kobayashi, K. Enhancement of rice canopy carbon gain by elevated CO₂ is sensitive to growth stage and leaf nitrogen concentration. New Phytol. 2006, 170, 321–332. [Google Scholar] [CrossRef] [PubMed]
- Sasaki, H.; Hara, T.; Ito, S.; Uehara, N.; Kakubari, Y.; Ono, K.; Hasegawa, T. Effect of free-air CO₂ enrichment on the storage of carbohydrate fixed at different stages in rice (Oryza sativa L.). Field Crops Res. 2007, 100, 24–31. [Google Scholar] [CrossRef]
- Zhu, C.; Ziska, L.; Zhu, J.; Zeng, Q.; Xie, Z.; Tang, H.; Jia, X.; Hasegawa, T. The temporal and species dynamics of photosynthetic acclimation in flag leaves of rice (Oryza sativa) and wheat (Triticum aestivum) under elevated carbon dioxide. Physiol. Plant. 2012, 145, 395–405. [Google Scholar] [CrossRef] [PubMed]
- Zhu, C.; Zhu, J.; Cao, J.; Jiang, Q.; Liu, G.; Ziska, L.H. Biochemical and molecular characteristics of leaf photosynthesis and relative seed yield of two contrasting rice cultivars in response to elevated [CO₂]. J. Exp. Bot. 2014, 65, 3427–3440. [Google Scholar] [CrossRef] [PubMed]
- Chen, C.; Sakai, H.; Tokida, T.; Usui, Y.; Nakamura, H.; Hasegawa, T. Do the rich always become richer? Characterizing the leaf physiological response of the high-yielding rice cultivar Takanari to free-air CO₂ enrichment. Plant Cell Physiol. 2014, 55, 381–391. [Google Scholar] [CrossRef] [PubMed]
- Shimono, H.; Bunce, J.A. Acclimation of nitrogen uptake capacity of rice to elevated atmospheric CO₂ concentration. Ann. Bot. 2009, 103, 87–94. [Google Scholar] [CrossRef] [PubMed]
- Muryono, M.; Chen, C.; Sakai, H.; Tokida, T.; Hasegawa, T.; Usui, Y.; Nakamura, H.; Hikosaka, K. Nitrogen distribution in leaf canopies of high-yielding rice cultivar Takanari. Crop Sci. 2017, 57, 2080–2088. [Google Scholar] [CrossRef]
- Kim, H.Y.; Lim, S.S.; Kwak, J.H.; Lee, D.S.; Lee, S.M.; Ro, H.M.; Choi, W.J. Dry matter and nitrogen accumulation and partitioning in rice (Oryza sativa L.) exposed to experimental warming with elevated CO₂. Plant Soil 2011, 342, 59–71. [Google Scholar] [CrossRef]
- Shao, L.; Liu, Z.; Li, H.; Zhang, Y.; Dong, W.; Harrison, M.T.; Liu, K.; Zhang, Y.; Yang, Y.; Xu, H.; et al. The impact of global dimming on crop yields is determined by the source-sink imbalance of carbon during grain filling. Glob. Change Biol. 2021, 27, 863–877. [Google Scholar] [CrossRef] [PubMed]
- Yang, L.; Huang, J.; Yang, H.; Zhu, J.; Liu, H.; Dong, G.; Liu, G.; Jin, C.; Wang, Y. The impact of free-air CO₂ enrichment (FACE) and N supply on yield formation of rice crops with large panicle. Field Crops Res. 2006, 98, 71–80. [Google Scholar] [CrossRef]
- Liu, H.; Yang, L.; Wang, Y.; Huang, J.; Zhu, J.; Wang, Y.; Dong, G.; Liu, G. Yield formation of CO₂-enriched hybrid rice cultivar Shanyou 63 under fully open-air field conditions. Field Crops Res. 2008, 108, 93–100. [Google Scholar] [CrossRef]
- Yang, L.; Liu, H.; Wang, Y.; Zhu, J.; Huang, J.; Liu, G.; Dong, G.; Wang, Y. Yield formation of CO₂-enriched inter-subspecific hybrid rice cultivar Liangyoupeijiu under fully open-air field condition in a warm sub-tropical climate. Agric. Ecosyst. Environ. 2009, 129, 193–200. [Google Scholar] [CrossRef]
- Usui, Y.; Sakai, H.; Tokida, T.; Nakamura, H.; Nakagawa, H.; Hasegawa, T. Rice grain yield and quality responses to free-air CO₂ enrichment combined with soil and water warming. Glob. Change Biol. 2016, 22, 3216–3227. [Google Scholar] [CrossRef] [PubMed]
- Cai, C.; Yin, X.; He, S.; Jiang, W.; Si, C.; Struik, P.C.; Luo, W.; Li, G.; Xie, Y.; Pan, G. Responses of wheat and rice to factorial combinations of ambient and elevated CO₂ and temperature in FACE experiments. Glob. Change Biol. 2016, 22, 856–874. [Google Scholar] [CrossRef] [PubMed]
- Wang, W.; Cai, C.; Lam, S.K.; Liu, G.; Zhu, J.; Chen, X.; Zheng, H.; Li, J.; Ziska, L.H. Elevated CO₂ cannot compensate for japonica grain yield losses under increasing air temperature because of the decrease in spikelet density. Eur. J. Agron. 2018, 99, 21–28. [Google Scholar] [CrossRef]
- Miake-Lye, I.M.; Hempel, S.; Shanman, R.; Shekelle, P.G. What is an evidence map? A systematic review of published definitions. Syst. Rev. 2016, 5, 28. [Google Scholar] [CrossRef] [PubMed]
- Page, M.J.; McKenzie, J.E.; Bossuyt, P.M.; Boutron, I.; Hoffmann, T.C.; Mulrow, C.D.; Shamseer, L.; Tetzlaff, J.M.; Akl, E.A.; Brennan, S.E.; et al. The PRISMA 2020 statement: an updated guideline for reporting systematic reviews. BMJ 2021, 372, n71. [Google Scholar] [CrossRef] [PubMed]
- Tricco, A.C.; Lillie, E.; Zarin, W.; O'Brien, K.K.; Colquhoun, H.; Levac, D.; Moher, D.; Peters, M.D.J.; Horsley, T.; Weeks, L.; et al. PRISMA extension for scoping reviews (PRISMA-ScR): checklist and explanation. Ann. Intern. Med. 2018, 169, 467–473. [Google Scholar] [CrossRef] [PubMed]
- Arksey, H.; O'Malley, L. Scoping studies: towards a methodological framework. Int. J. Soc. Res. Methodol. 2005, 8, 19–32. [Google Scholar] [CrossRef]
- Wang, W.; Loladze, R.A.L.; Wang, J.; Han, Y.; Gu, J.; Yang, L.; Zhu, J. Improving the accuracy of meta-analysis for datasets with missing measured variables: a case study on rice. Sci. Total Environ. 2022, 806, 150669. [Google Scholar] [CrossRef] [PubMed]
- Jing, L.; Wu, Y.; Zhuang, S.; Wang, Y.; Zhao, Y.; Yang, L.; Wang, Y. Effects of CO₂ enrichment and spikelet removal on rice quality under open-air field conditions. J. Integr. Agric. 2016, 15, 2669–2680. [Google Scholar] [CrossRef]
- Yoshinaga, S.; Tokida, T.; Usui, Y.; Sakai, H.; Nakamura, H.; Hasegawa, T. Analysis of factors related to varietal differences in the yield of rice (Oryza sativa L.) under free-air CO₂ enrichment conditions. Plant Prod. Sci. 2020, 23, 176–187. [Google Scholar] [CrossRef]
- Cohen, J. A coefficient of agreement for nominal scales. Educ. Psychol. Meas. 1960, 20, 37–46. [Google Scholar] [CrossRef]
- Gwet, K.L. Handbook of Inter-Rater Reliability: The Definitive Guide to Measuring the Extent of Agreement Among Raters, 4th ed.; Advanced Analytics: Gaithersburg, MD, USA, 2014. [Google Scholar]
- Sim, J.; Wright, C.C. The kappa statistic in reliability studies: use, interpretation and sample size requirements. Phys. Ther. 2005, 85, 257–268. [Google Scholar] [CrossRef]
- Belur, J.; Tompson, L.; Thornton, A.; Simon, M. Interrater reliability in systematic review methodology: exploring variation in coder decision-making. Sociol. Methods Res. 2021, 50, 837–865. [Google Scholar] [CrossRef]
- Landis, J.R.; Koch, G.G. The measurement of observer agreement for categorical data. Biometrics 1977, 33, 159–174. [Google Scholar] [CrossRef]
- Hu, S.; Wang, Y.; Yang, L. Response of rice yield traits to elevated atmospheric CO₂ concentration and its interaction with cultivar, nitrogen application rate and temperature: a meta-analysis of 20 years FACE studies. Sci. Total Environ. 2021, 764, 142797. [Google Scholar] [CrossRef] [PubMed]
- Taub, D.R.; Miller, B.; Allen, H. Effects of elevated CO₂ on the protein concentration of food crops: a meta-analysis. Glob. Change Biol. 2008, 14, 565–575. [Google Scholar] [CrossRef]
- Loladze, I. Hidden shift of the ionome of plants exposed to elevated CO₂ depletes minerals at the base of human nutrition. eLife 2014, 3, e02245. [Google Scholar] [CrossRef] [PubMed]
- Medek, D.E.; Schwartz, J.; Myers, S.S. Estimated effects of future atmospheric CO₂ concentrations on protein intake and the risk of protein deficiency by country and region. Environ. Health Perspect. 2017, 125, 087002. [Google Scholar] [CrossRef] [PubMed]
- van Groenigen, K.J.; Osenberg, C.W.; Hungate, B.A. Increased soil emissions of potent greenhouse gases under increased atmospheric CO₂. Nature 2011, 475, 214–217. [Google Scholar] [CrossRef] [PubMed]
- van Groenigen, K.J.; van Kessel, C.; Hungate, B.A. Increased greenhouse-gas intensity of rice production under future atmospheric conditions. Nat. Clim. Chang. 2013, 3, 148–151. [Google Scholar] [CrossRef]
- Qian, H.; Huang, S.; Chen, J.; Wang, L.; Hungate, B.A.; van Kessel, C.; Zhang, J.; Deng, A.; Jiang, Y.; van Groenigen, K.J.; Zhang, W. Lower-than-expected CH4 emissions from rice paddies with rising CO₂ concentrations. Glob. Change Biol. 2020, 26, 2368–2376. [Google Scholar] [CrossRef] [PubMed]
- Yu, H.; Zhang, G.; Xia, L.; Huang, Q.; Ma, J.; Zhu, J.; Liu, G.; Xu, H.; Zou, J. Elevated CO₂ does not necessarily enhance greenhouse gas emissions from rice paddies. Sci. Total Environ. 2022, 810, 152363. [Google Scholar] [CrossRef] [PubMed]
- Qian, H.; Zhang, N.; Chen, J.; Chen, C.; Hungate, B.A.; Zhu, C.; Chen, J.; van Groenigen, K.J. Unexpected parabolic temperature dependency of CH4 emissions from rice paddies. Environ. Sci. Technol. 2022, 56, 11803–11812. [Google Scholar] [CrossRef] [PubMed]
- Liu, S.; Ji, C.; Wang, C.; Chen, J.; Jin, Y.; Zou, Z.; Li, S.; Niu, S.; Zou, J. Climatic role of terrestrial ecosystem under elevated CO₂: a bottom-up greenhouse gases budget. Ecol. Lett. 2018, 21, 1108–1118. [Google Scholar] [CrossRef] [PubMed]
- Zhu, C.; Wolf, J.; Zhang, J.; Anderegg, W.R.L.; Bunker, D.E.; Chen, G.; Chen, J.; Dangal, S.R.S.; Li, Y.; Liu, B.; et al. Rising temperatures can negate CO₂ fertilization effects on global staple crop yields: a meta-regression analysis. Agric. For. Meteorol. 2023, 342, 109737. [Google Scholar] [CrossRef]
- Bai, Y.; Liu, L.; Li, H.; Huang, G. Synergistic interactions of CO₂ fertilization with water, heat, and nitrogen under climate change: Evidence from maize, rice, and wheat. Field Crops Res. 2025, 332, 110016. [Google Scholar] [CrossRef]
- Bai, Y.; Liu, L.; Li, H.; Peng, X.; Fa, K.; Huang, G. Differential crop yield responses to elevated CO₂ attributed to varying biomass part stimulations: a meta-analysis. Plant Soil 2025, 510, 981–996. [Google Scholar] [CrossRef]
- Chen, C.; van Groenigen, K.J.; Yang, H.; Hungate, B.A.; Yang, B.; Tian, Y.; Chen, J.; Chen, X.; Huang, J.; Zhang, J.; et al. Global warming and shifts in cropping systems together reduce China's rice production. Glob. Food Secur. 2020, 24, 100359. [Google Scholar] [CrossRef]
- Dang, P.; Ciais, P.; Peñuelas, J.; Lu, C.; Gao, J.; Yin, Y.; Bai, Y.; Wang, X.; Zhu, Z.; Xu, J. Mitigating the detrimental effects of climate warming on major staple crops in China: a meta-analysis. Agric. For. Meteorol. 2025, 367, 110524. [Google Scholar] [CrossRef]
- Li, S.; Wu, F.; Zhou, Q.; Zhang, Y. Adopting agronomic strategies to enhance the adaptation of global rice production to future climate: a meta-analysis. Agron. Sustain. Dev. 2024, 44, 23. [Google Scholar] [CrossRef]
- Liu, X.; Ma, Q.; Yu, H.; Li, Y.; Zhou, L.; He, Q.; Li, T.; Zhu, J.; Liu, G.; Zhang, H.; et al. Responses of plant biomass and yield component in rice, wheat, and maize to elevated [CO₂]: a meta-analysis. Planta 2020, 252, 90. [Google Scholar] [CrossRef] [PubMed]
- Zhou, Y.; Xu, L.; Xu, Y.; Xi, M.; Tu, D.; Chen, J.; Zhou, L. A meta-analysis of the effects of global warming on rice and wheat yields in a rice-wheat rotation system. Food Energy Secur. 2021, 10, e316. [Google Scholar] [CrossRef]
- Zhang, H.; Xiao, T.; Shi, Z.; Ren, R.; Jiang, Y.; Du, X.; Zhang, J.; Zhu, C.; Wang, W.; Yang, L.; et al. Enhanced rice phosphorus use efficiency under elevated atmospheric CO₂ and its drivers. Agric. Ecosyst. Environ. 2025, 393, 109827. [Google Scholar] [CrossRef]
- Yang, X.; Yun, P.; Zhao, X.; Zhang, Z.; Chen, C.; Zhang, J.; Zhu, C.; Wang, W.; Yang, L. Assessing impact of elevated CO₂ on heavy metal accumulation in crops: a meta-analysis. Sci. Total Environ. 2024, 952, 175949. [Google Scholar] [CrossRef] [PubMed]
- Gardi, M.W.; Haussmann, B.I.G.; Malik, W.A.; Högy, P. Effects of elevated atmospheric CO₂ and its interaction with temperature and nitrogen on yield of barley (Hordeum vulgare L.): a meta-analysis. Plant Soil 2022, 475, 535–550. [Google Scholar] [CrossRef]
- Ainsworth, E.A.; Long, S.P. 30 years of free-air carbon dioxide enrichment (FACE): what have we learned about future crop productivity and its potential for adaptation? Glob. Change Biol. 2021, 27, 27–49. [Google Scholar] [CrossRef] [PubMed]
- Zhu, C.; Xu, X.; Wang, D.; Zhu, J.; Liu, G. An indica rice genotype showed a similar yield enhancement to that of hybrid rice under free air carbon dioxide enrichment. Sci. Rep. 2015, 5, 12719. [Google Scholar] [CrossRef] [PubMed]
- Wang, W.; Yan, X.; Wei, Y.; Ji, D.; Zhang, W.; Zhang, H.; Liu, L.; Zhu, J. Enhancing japonica rice yield under elevated CO₂: addressing limitations and strategies. J. Agron. Crop Sci. 2025, 211, e70092. [Google Scholar] [CrossRef]
- Chaturvedi, A.K.; Bahuguna, R.N.; Shah, D.; Pal, M.; Jagadish, S.V.K. High temperature stress during flowering and grain filling offsets beneficial impact of elevated CO₂ on assimilate partitioning and sink-strength in rice. Sci. Rep. 2017, 7, 8227. [Google Scholar] [CrossRef] [PubMed]
- Zhang, G.; Ujiie, K.; Yoshimoto, M.; Sakai, H.; Tokida, T.; Usui, Y.; Hasegawa, T. Daytime warming during early grain filling offsets the CO₂ fertilization effect in rice. Environ. Res. Lett. 2022, 17, 114051. [Google Scholar] [CrossRef]
- Shah, F.; Nie, L.; Cui, K.; Shah, T.; Wu, W.; Chen, C.; Zhu, L.; Ali, F.; Fahad, S.; Huang, J. Rice grain yield and component responses to near 2°C of warming. Field Crops Res. 2014, 157, 98–110. [Google Scholar] [CrossRef]
- Li, Y.; Lam, S.K.; Han, X.; Feng, Y.; Lin, E.; Chen, D. Effects of elevated CO₂ on rice grain yield and yield components: is non-flooded plastic film mulching better than flooded irrigation? Eur. J. Agron. 2017, 85, 61–70. [Google Scholar] [CrossRef]
- Sasaki, H.; Hara, T.; Ito, S.; Miura, S.; Kim, H.Y.; Lieffering, M.; Kobayashi, K. Seasonal changes in canopy photosynthesis and respiration, and partitioning of photosynthate, in rice (Oryza sativa L.) grown under free-air CO₂ enrichment. Plant Cell Physiol. 2005, 46, 1704–1712. [Google Scholar] [CrossRef] [PubMed]
- Zuo, G.; Zheng, D. Elevated CO₂ and engineering photosynthesis promote root growth and maintain growth balance in crops. Field Crops Res. 2026, 340, 110388. [Google Scholar] [CrossRef]
- Song, L.; Tao, Y.; van Groenigen, K.J.; Chang, S.X.; Peñuelas, J.; Zhang, J.; Wang, C.; Liu, X.; Wang, W.; Zhu, C.; et al. Rising atmospheric carbon dioxide concentrations increase gaps of rice yields between low- and middle-to-high-income countries. Nat. Food 2024, 5, 916–925. [Google Scholar] [CrossRef] [PubMed]
- Liao, P.; Bell, S.M.; Chen, L.; Huang, S.; Wang, H.; Huang, J. Improving rice grain yield and reducing lodging risk simultaneously: a meta-analysis. Eur. J. Agron. 2023, 143, 126709. [Google Scholar] [CrossRef]
- Hu, S.; Tong, K.; Chen, W.; Wang, Y.; Wang, Y.; Yang, L. Response of rice grain quality to elevated atmospheric CO₂ concentration: a meta-analysis of 20-year FACE studies. Field Crops Res. 2022, 284, 108562. [Google Scholar] [CrossRef]
- Al-Hadeethi, I.; Li, Y.; Odhafa, A.K.H.; Al-Hadeethi, M.A.; Huang, J.; Zhou, W. Assessment of grain quality in terms of functional group response to elevated [CO₂] in rice using a meta-analysis. Ecol. Evol. 2019, 9, 7225–7234. [Google Scholar] [CrossRef] [PubMed]
- Xiong, D.; Ling, X.; Huang, J.; Peng, S. Meta-analysis and dose-response analysis of high temperature effects on rice yield and quality. Environ. Exp. Bot. 2017, 141, 1–9. [Google Scholar] [CrossRef]
- Feng, Z.; Rütting, T.; Pleijel, H.; Wallin, G.; Reich, P.B.; Agathokleous, E.; Uddling, J. Constraints to nitrogen acquisition of terrestrial plants under elevated CO₂. Glob. Change Biol. 2015, 21, 3152–3168. [Google Scholar] [CrossRef] [PubMed]
- Yin, Y.; Meng, Q.; Ying, H.; Zhang, Q.; Liu, Y.; Cui, Z. Climate change increases nitrogen concentration in rice with low nitrogen use efficiency. Earth's Future 2021, 9, e2020EF001878. [Google Scholar] [CrossRef]
Figure 1.
Evidence map of the primary literature on rice responses to elevated CO₂. (a) PRISMA screening flow from 6,120 records to 668 included studies; panel (a) also gives the contribution of each database to the final corpus. (b) Source and sink reporting counts by database; the ratio is nearly identical in the Chinese language and English language subsets, indicating that the imbalance is not an artefact of language or database coverage. (c) Frequency of individual trait reporting; the shaded bar denotes an integrated outcome rather than a source or sink trait. (d) The four mutually exclusive reporting classes, given as a percentage of the 668 included studies. (e) Research focus over time; source side and climate scenario topics increase whereas harvest index and explicit source-sink studies remain rare. (f) Research methods over time; isotope tracing, the direct measure of photoassimilate allocation, remains near zero throughout the period covered.
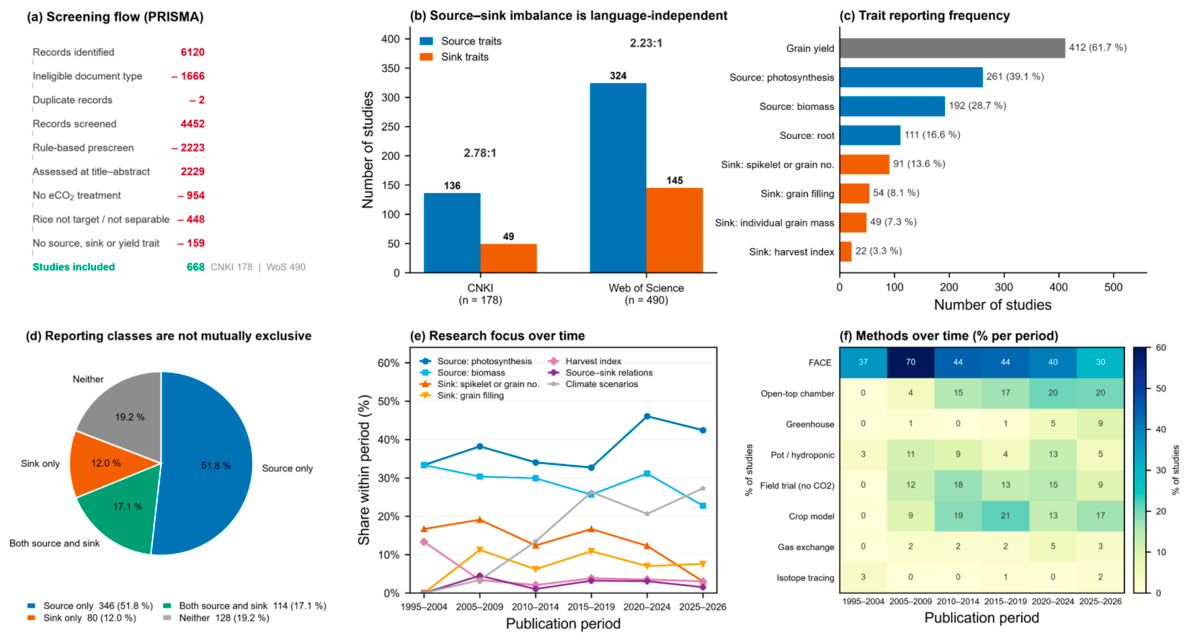
Figure 2.
Quantitative syntheses reporting CO₂ treatment effects in rice. (a) Publication year of the 14 syntheses that met all four eligibility criteria, distinguishing the seven that contribute effect estimates to Table 1. (b) Trait coverage among the contributing syntheses; harvest index appears in only two. (c) Screening outcome of the 72 candidate records: seven contributing, seven eligible but not extracted, and 58 excluded by criteria (i)–(iv). Greenhouse gas flux syntheses, grain quality and nutrient syntheses, and climate-scenario projections without an applied CO₂ contrast fall outside criteria (iii) or (iv).
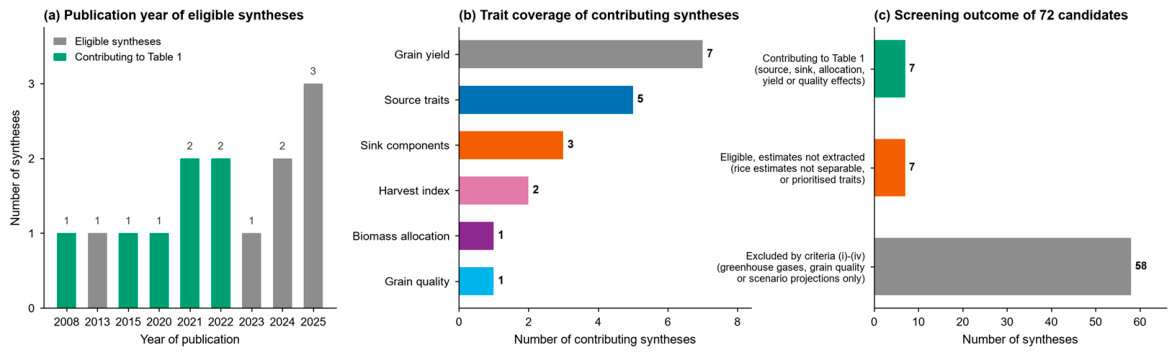
Figure 3.
Meta-analytic effect sizes of elevated CO₂ on rice source, sink, yield and quality traits. Panels (a) to (e) display effect estimates organized by trait class; bars show 95% confidence intervals were reported by the source synthesis and open symbols denote point estimates that the source reported as not significantly different from zero. Panel (f) lists the synthesis contributing each estimate; Hu 2022a and Hu 2022b are distinct publications (Science of the Total Environment 810: 151017 and Field Crops Research 284: 108562). Note that the x-axis range differs between panels. Where multiple syntheses report the same trait, estimates are shown separately and were not averaged. Cultivar-type estimates are labelled with the synthesis they come from, because the two syntheses that partition yield by cultivar type use different groupings.
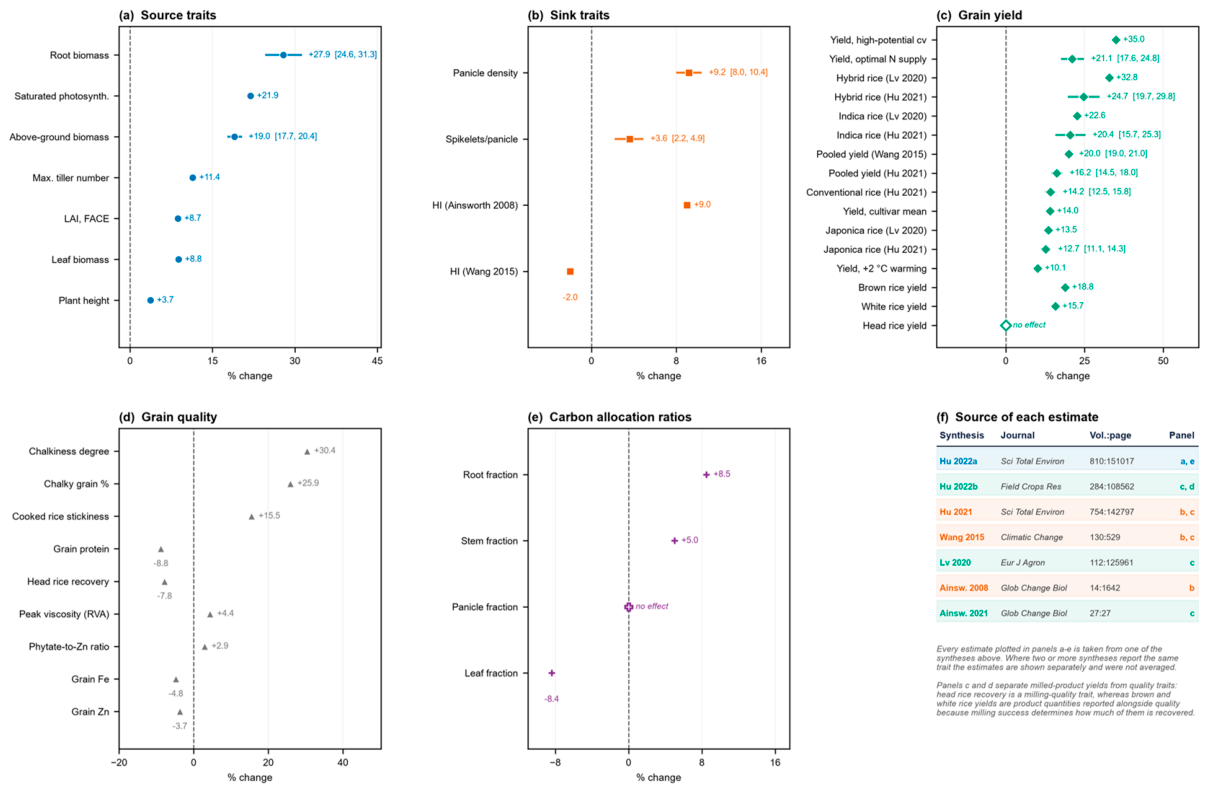
Figure 4.
Conceptual summary of the sequential source sink constraints proposed to account for the response patterns compiled in Figure 3 and Table 1. Before heading, CO₂ enhanced assimilate supply expands sink number; after heading, grain filling responds little and surplus carbon accumulates in leaves, depressing photosynthetic activity through feedback regulation. The scheme is an interpretation of the assembled evidence rather than a quantitative model, and each arrow corresponds to a measured response reported in Table 1. The Vcmax and Jmax decrements shown in the lower panel are the ranges reported for photosynthetic acclimation to elevated CO₂ in the mechanistic literature cited above [3,4]; they are illustrative of the direction and approximate magnitude of downregulation and are not pooled estimates derived from the syntheses compiled in Table 1.
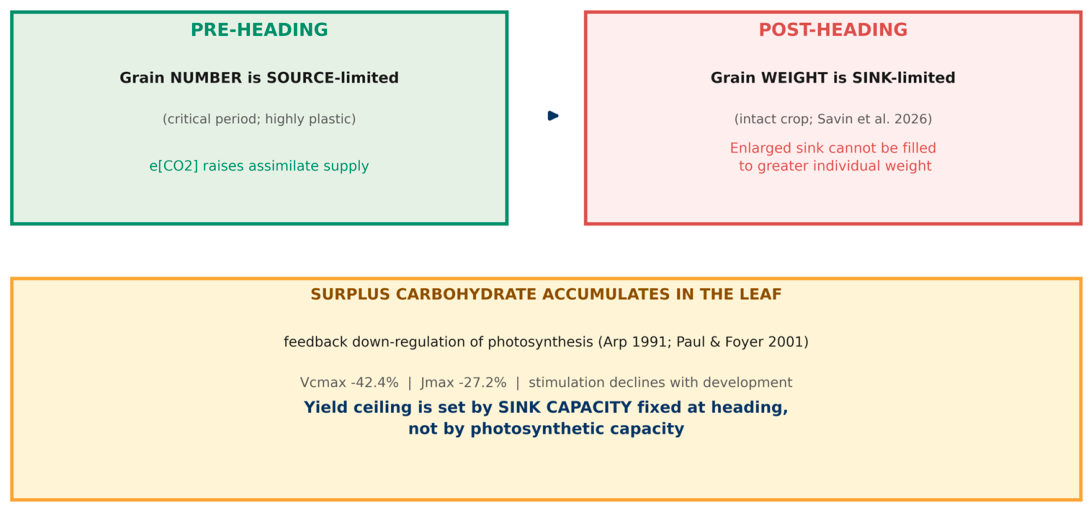

Table 1.
Effects of elevated CO₂ on source, sink, integrated and quality traits of rice, as reported in published quantitative syntheses. Values are quoted, not recomputed. Where two syntheses report the same trait, both estimates are shown; they were not averaged. Syntheses restricted to greenhouse gas fluxes or to scenario projections without an elevated-versus-ambient contrast did not contribute to this table.
| Trait | Class | Effect (%) | 95% CI | Synthesis | Platform | n |
|---|---|---|---|---|---|---|
| Asat | Source | +21.9 | — | Hu 2022 STOTEN | 20-yr FACE | 161 |
| Root biomass | Source | +27.9 | 24.6 to 31.3 | Hu 2022 STOTEN | 20-yr FACE | 137 |
| Panicle biomass | Source | +25.4 | — | Hu 2022 STOTEN | 20-yr FACE | 79 |
| Aboveground biomass | Source | +19.0 | 17.7 to 20.4 | Hu 2022 STOTEN | 20-yr FACE | 271 |
| Leaf biomass | Source | +8.8 | — | Hu 2022 STOTEN | 20-yr FACE | 106 |
| Stem nonstructural carbohydrate | Source | +18.8 | — | Hu 2022 STOTEN | 20-yr FACE | 49 |
| Leaf soluble sugar | Source | +11.9 | — | Hu 2022 STOTEN | 20-yr FACE | 8 |
| Leaf starch | Source | +26.3 | — | Hu 2022 STOTEN | 20-yr FACE | 7 |
| Root biomass fraction | Allocation | +8.5 | — | Hu 2022 STOTEN | 20-yr FACE | 32 |
| Leaf biomass fraction | Allocation | -8.4 | — | Hu 2022 STOTEN | 20-yr FACE | 148 |
| Panicle biomass fraction | Allocation | no effect | — | Hu 2022 STOTEN | 20-yr FACE | 94 |
| Panicle density | Sink | +9.2 | 8.0 to 10.4 | Hu 2021 | 20-yr FACE | 128 |
| Spikelets per panicle | Sink | +3.6 | 2.2 to 4.9 | Hu 2021 | 20-yr FACE | 122 |
| Harvest index | Sink | +9.0 | — | Ainsworth 2008 | FACE + enclosure | 30 |
| Harvest index | Sink | -2.0 | n.s. | Wang 2015 | FACE + enclosure | — |
| Grain yield | Integrated | +16.2 | 14.5 to 18.0 | Hu 2021 | 20-yr FACE | 51 studies, 160 obs |
| Grain yield | Integrated | +20.0 | 19 to 21 | Wang 2015 | FACE + enclosure | 125 studies |
| Yield, japonica cultivar (Lv 2020) | Integrated | +13.5 | — | Lv 2020 | FACE | 93 |
| Yield, indica cultivar (Lv 2020) | Integrated | +22.6 | — | Lv 2020 | FACE | 10 |
| Yield, hybrid cultivar (Lv 2020) | Integrated | +32.8 | — | Lv 2020 | FACE | 17 |
| Yield, conventional cultivar (Hu 2021) | Integrated | +14.2 | 12.5 to 15.8 | Hu 2021 | 20-yr FACE | 127 |
| Yield, hybrid cultivar (Hu 2021) | Integrated | +24.7 | 19.7 to 29.8 | Hu 2021 | 20-yr FACE | 33 |
| Yield, indica cultivar (Hu 2021) | Integrated | +20.4 | 15.7 to 25.3 | Hu 2021 | 20-yr FACE | 25 |
| Yield, japonica cultivar (Hu 2021) | Integrated | +12.7 | 11.1 to 14.3 | Hu 2021 | 20-yr FACE | 102 |
| Yield, optimal N supply (21-30 g m-2) | Integrated | +21.1 | 17.6 to 24.8 | Hu 2021 | 20-yr FACE | 49 |
| Yield, +2 °C warming | Integrated | +10.1 | — | Hu 2021 | FACE + warming | 11 |
| Yield, high-potential cultivar | Integrated | +35.0 | — | Ainsworth 2021 | FACE | — |
| Yield, cultivar mean | Integrated | +14.0 | — | Ainsworth 2021 | FACE | — |
| Brown rice yield | Milled yield | +18.8 | — | Hu 2022 FCR | 20-yr FACE | 23 |
| White rice yield | Milled yield | +15.7 | — | Hu 2022 FCR | 20-yr FACE | 21 |
| Head rice yield | Milled yield | no effect | — | Hu 2022 FCR | 20-yr FACE | 17 |
| Head rice recovery | Quality | -7.8 | — | Hu 2022 FCR | 20-yr FACE | 28 |
| Grain protein | Quality | -8.8 | — | Hu 2022 FCR | 20-yr FACE | 136 |
| Grain zinc | Quality | -3.7 | — | Hu 2022 FCR | 20-yr FACE | 103 |
| Grain iron | Quality | -4.8 | — | Hu 2022 FCR | 20-yr FACE | 85 |
Note: values are quoted as reported by the source synthesis and were not recomputed. A dash means that the source did not report the quantity, and n.s. means that the source reported the response as not significantly different from zero. Trait classes follow Section 2.3 and appear in the order in which they are discussed: source, allocation, sink, integrated (grain yield), milled product yield and quality. Where two syntheses report the same trait, both estimates are shown and neither was averaged. n is the number of primary studies or observations behind each pooled estimate, as stated by the source. Cultivar-type rows are subgroup estimates rather than pooled means, and each is labelled with the synthesis it comes from, because the two syntheses that partition yield by cultivar type use different groupings. Platform describes the fumigation facilities behind the primary data: 20-yr FACE, the long-running free-air CO₂ enrichment experiments pooled by Hu and colleagues; FACE + enclosure, syntheses that combine open-field and enclosed facilities; FACE + warming, the warmed sub-treatments of a FACE experiment. The two syntheses abbreviated Hu 2022 are distinct publications: Hu 2022 STOTEN (Science of the Total Environment 810: 151017, source traits and biomass allocation) and Hu 2022 FCR (Field Crops Research 284: 108562, grain quality and milled product yields). Abbreviations: Asat, light-saturated photosynthetic rate; HI, harvest index.
Disclaimer/Publisher’s Note: The statements, opinions and data contained in all publications are solely those of the individual author(s) and contributor(s) and not of MDPI and/or the editor(s). MDPI and/or the editor(s) disclaim responsibility for any injury to people or property resulting from any ideas, methods, instructions or products referred to in the content. |
© 2026 by the authors. Licensee MDPI, Basel, Switzerland. This article is an open access article distributed under the terms and conditions of the Creative Commons Attribution (CC BY) license (http://creativecommons.org/licenses/by/4.0/).
Copyright: This open access article is published under a Creative Commons CC BY 4.0 license, which permit the free download, distribution, and reuse, provided that the author and preprint are cited in any reuse.