

Submitted:
12 October 2026
Posted:
13 October 2026
You are already at the latest version
Abstract
Recent research advancements have revealed that phosphorylation of α-synuclein at the Serine 129 (pSer 129 α-syn, p-α-syn) possesses not only pathological implications but also significant physiological functions. However, the distribution and functions of p-α-syn in relation to lipid rafts, calcium homeostasis, and neuroinflammation warrant further investigation. In this study, we initially investigated the distribution of p-α-syn across the entire brain in both Wild-type (Wt) and Thy1-SNCA transgenic (Tg) mice. After evaluating p-α-syn levels within the cytosolic and lipid raft components of midbrain and peripheral blood cells, we identified its interaction network with CO-IP/MS in Wt group, supported by functional enrichment analyses. Subsequently, we examined calcium dynamics and inflammatory state in primary neuronal models. Our results revealed the presence of p-α-syn in midbrain and blood cells of Wt mice, where it modulated distinct protein interaction networks. Moreover, inhibiting p-α-syn did not alleviate the neuronal toxicity and calcium imbalance. Transcriptome sequencing and protein chip analysis also revealed that p-α-syn could alter the inflammatory state of neurons and significantly influence the expression and secretion of CCL2 and CCL5. Overall, this study fills a critical knowledge gap regarding p-α-syn interactomics and elucidates the essential regulatory role of p-α-syn in neuronal calcium homeostasis and neuroinflammation.
Keywords:
α-synuclein
; phosphorylation
; lipid rafts
; calcium homeostasis
; neuroinflammation
1. Introduction
The phosphorylation of α-synuclein at the Serine 129 site (pSer 129 α-syn, p-α-syn) has long been recognized as a crucial pathological hallmark of Lewy bodies (LBs) and Lewy neurites (LNs) in Parkinson’s disease (PD) and related synucleinopathies [1,2]. Moreover, for histological characterization and Western blot (WB) assessments, p-α-syn antibody is routinely employed in preference to approaches targeting pathological α-syn inclusions directly. However, advancing research has revealed that p-α-syn is also prevalent in normal brain tissues, where it contributes to the regulation of neuronal activity, synaptic function, and protein-protein interactions [3,4,5,6,7]. This subversive finding has aroused great interest in the distribution and function of p-α-syn under physiological conditions. Despite intensive investigations into its aggregation properties in pathological states, there remains a significant gap in understanding its precise molecular functions and interaction networks under physiological conditions, particularly regarding its roles in the central nervous system (CNS) and peripheral systems.
Lipid rafts are specialized microdomains within the cell membrane, that play critical roles in processes such as signal transduction, protein aggregation, and immune responses [8,9]. While the majority of prior research has concentrated on the interaction and regulation between lipid rafts and α-syn under pathological conditions [5,10,11,12,13,14], limited studies have addressed the distribution and function of p-α-syn within the cytosolic and lipid raft microdomains under physiological conditions. Previous investigations utilizing Biotinylation by Antibody Recognition (BAR) technology identified interacting proteins enriched in presynaptic vesicle transport and SNARE complex pathways [4,15]. Nevertheless, these studies did not systematically explore the differences in p-α-syn interacting proteins between the cytosolic and lipid raft fractions, leaving the specific subcellular interactome of physiological p-α-syn largely uncharted.
Recent research on synucleinopathies has also expanded its focus to peripheral systems, demonstrating that α-syn derived from bone marrow, particularly red blood cells [16,17,18]. Concurrently, abnormal elevations in α-syn and p-α-syn levels have been reported in blood cells under pathological conditions [19,20]. Despite this, a comprehensive analysis of the specific protein network of p-α-syn within the cytosolic and lipid raft components of peripheral blood cells under physiological conditions is lacking. Elucidating this peripheral interactome is crucial for understanding the potential role of blood-derived p-α-syn in the onset and progression of synucleinopathies.
Beyond its subcellular distribution, p-α-syn is intricately involved in the precise regulation of intracellular calcium signaling, a process critical for maintaining neuronal excitability and metabolic homeostasis [21]. Previous researches have demonstrated that α-syn positively influences the transfer of calcium from the endoplasmic reticulum (ER) to mitochondria (Mito) [22,23]. p-α-syn has been shown to enhance extracellular calcium influx and contribute to mitochondrial calcium overload [24,25]. Conversely, the inhibition of p-α-syn has been shown to restore mitochondrial calcium homeostasis in certain contexts [23,25,26]. While the dynamic physiological conformation of p-α-syn is crucial for sustaining neuronal activity [6,23], whether its complete inhibition alleviates calcium imbalance induced by α-syn overexpression remains elusive. Addressing this question is vital to distinguish whether p-α-syn serves merely as a pathological modifier or as an indispensable physiological maintainer of calcium equilibrium among the cytoplasm, ER, and Mito.
Furthermore, neuroinflammation is a critical component in the pathogenesis of PD, yet the mechanisms by which α-syn and its phosphorylated form influence the immune-inflammatory state of neurons remain inadequately understood [27,28,29]. While studies have indicated that neuronal injury or α-syn overexpression can alter the homeostasis of immune response regulators [30,31], the intrinsic role of p-α-syn in reshaping the neuroimmune microenvironment has been largely overlooked. Specifically, it remains to be determined whether p-α-syn directly regulate the transcription and secretion of key chemokines, thereby modulating neuroinflammatory cascades independently of glial activation.
To systematically address these critical knowledge gaps, this study elucidates the interaction networks of physiological p-α-syn and examines its influence on calcium regulation and neuroinflammation. The distribution of α-syn and p-α-syn was first characterized throughout the entire brain in both Wild-type (Wt) and Thy1-SNCA transgenic (Tg) mice. After evaluating p-α-syn levels in the cytosolic and lipid raft components of the midbrain and blood cells, we identified its interaction networks in Wt group using Co-immunoprecipitation followed by mass spectrometry (CO-IP/MS), further supported by Gene Ontology (GO) and Kyoto Encyclopedia of Genes and Genomes (KEGG) analyses. Additionally, we examined calcium dynamics using region-specific fluorescence probes in primary neurons infected with lentiviral (LV)-Con/SNCA/S129A, and evaluated transcriptomic alterations and secreted cytokines through RNA sequencing (RNA-seq) and protein chip analysis. Overall, our findings contribute to a critical gap in the understanding of the omics related to p-α-syn interactions under physiological conditions. In addition, we elucidate the essential role of p-α-syn in the regulation of neuronal calcium homeostasis and immune inflammation.
2. Materials and Methods
2.1. Animals and Ethics Statement
Herein, Wt pregnant and nonpregnant mice were purchased from Si-Bei-Fu Corporation (Beijing, China). human α-syn (h-α-syn) overexpressing Tg mice [JAX stock #017682; C57BL/6N-Tg (Thy1-SNCA) 15Mjff/J; hemizygotes] were purchased from the Jackson Laboratory (Bar Harbor, ME, USA). α-syn Knock-Out (KO) mice (C57BL/129 x 1-Sncatm1 Rosl/J) were purchased from the Model Animal Research Center of Nanjing University. All animals were on the BALB/6 background and were housed at Room Temperature (RT) conditions under a 12 h: 12 h light/dark cycle in SPF animal facility of China Rehabilitation Research Center [SYXK (Beijing) 2026-0023].
2.2. Cell Culture and Transfection
The experimental design was similar to our previous reports [32]. SHSY5Y cells (The Cell Bank of the Chinese Academy of Science, BFN60700126, Shanghai, China) were cultured in a DMEM-F12 medium (11320033, Gibco) supplemented with 10% Fetal Bovine Serum (FBS) and 1% penicillin/streptomycin. Plasmids myc/myc-h-α-syn/myc-S129A (CH884935, Vigene) were then transiently transfected into SHSY5Y cells using Transporter 5 Transfection Reagent (26008-1A, Polysciences), an amount of 2/3 µg plasmids/well was used for the six-well plate. After 48 h of transient transfection, cell morphology was observed and recorded by the IncuCyte S3 live-cell imaging system (Sartorius, USA). Cell viability was measured using the Super-Enhanced Cell Counting Kit-8 (CCK8, C0048M, Beyotime Biotechnology).
2.3. Primary Neuron Culture and Infection with Lentivirus
Primary mouse cortical neuron cultures were prepared and isolated from E16-18 C57BL/6 embryonic mouse cortices as described previously [33,34]. Neurons were seeded onto poly-D-lysine-coated confocal dishes (1 X 10⁵ cells per well)/six-well plates (5 X 10⁵ cells per well), and cultured in the neurobasal culture medium (NM, 21103049, Thermo fisher) supplemented with 50 X B27 (17504044, Thermo fisher), 2 mM L-Glutamine (A2916801, Thermo fisher) and 1% penicillin/streptomycin. After 3 days of in vitro culturing, differentiated neurons were infected with LV-Con/SNCA/S129A particles synthesized by Gene chem (Shanghai, China). After 4/7 days, the supernatant of the cell culture medium was collected. Cell viability and intracellular calcium concentration were detected and analyzed according product instructions.
2.4. Primary Microglia Culture and Treatment with Neuronal Supernatant
Mouse primary microglia were prepared and isolated from astroglia/microglia mixed cultures derived from the whole brains of C57BL/6 newborn mouse pups as described previously [35,36]. Mixed glial cells were cultured in a DMEM-F12 medium supplemented with 10% FBS and 1% penicillin/streptomycin. After 14 days in culture, microglia were isolated from cultures by shaking at 100 rpm for 5 min. After 2 days in culture, primary microglia were treated with 1,000 ng/mL LPS or the equal volume of neuronal supernatant (NM, NM-Con, NM-SNCA, NM-S129A) for 24 h, cell viability were then evaluated by the CCK8 Kit.
2.5. Live Cell Calcium Imaging of Primary Neurons
To evaluate the effect of h-α-syn overexpression on cellular calcium ion homeostasis, we used specific calcium fluorescent probes to detect the calcium levels in the cytoplasm, ER, and Mito of neurons infected with LV-Con/SNCA/S129A particles for 4 days. Neurons were washed twice with 100 μL HBSS/well, and then incubated with Fluo-3 AM [Excitation wavelength/Emission wavelength (Ex/Em): 488/525 nm] (Final concentration: 5 μM, S1056, Beyotime Biotechnology) for 60 min, Mag-Fluo-4AM (Ex/Em: 488/525 nm) (Final concentration: 5 μM, Y-TZ-0010, Shanxi New Research Bioscience) for 30 min, Rhod-2 AM (Ex/Em: 522/581 nm) (500X, S1062S, Beyotime Biotechnology) for 30 min. After washing with 100 μL HBSS/well for twice, neurons were incubated for 30 min to allow complete de-esterification of fluorescent probes. Subsequently, cell morphology was recorded by the IncuCyte S3, signal values were then detected by the fluorescent microplate reader (PerkinElmer EnSpire, USA). In the experiments, neurons were treated with 2-APB (Final concentration: 50 μM), a specific inhibitor of IP3R receptor, for 24 h to inhibit calcium transport from the ER to the Mito. Cells were preincubated with CaUp (500X) for 30 min to induce mitochondrial calcium overload.
2.6. Protein-Chip Assays for Detection the Cytokines in the Supernatant of Primary Neurons
Protein-chip assays are similar to that previously reported [37]. The supernatant of primary neurons infected with LV-Con/SNCA/S129A for 4 days were collected, and concentrated to about 10% of the original volume using an ultrafiltration tube (Millipore). The levels of 20 mouse cytokines including GM-CSF, IFNg, IL-1a, IL-1b, IL-2, IL-3, IL-4, IL-5, IL-6, IL-9, IL-10, IL-12p70, IL-13, IL-17, CXCL1, CCL2, MCSF, CCL5, TNF-α, and VEGF in supernatants were then detected using quantitative measurement of 20 mouse cytokines (Protein chip, QAM-CYT-1, Ray Biotech, USA) according to the manufacturer’s instruction.
2.7. Indirect-ELISA for Detection the Level of h-α-Syn in the Supernatant of Primary Neurons
Indirect-ELISAs were conducted to detect the level of h-α-syn in the supernatant of primary neurons. A 96-well polystyrene plate (42592, Corning) was coated with h-α-syn recombinant protein (0, 0.01, 0.1 ng/mL) and the supernatant of primary neurons (20 μL), at 100 μL/well, and incubated at 4 °C overnight. Coating buffer (CBS, 200 mM NaHCO3, pH 9.6) was used to dilute protein and supernatant samples. The plate was then washed five times with PBST (0.2% Tween-20 in 0.01 M PBS), at 200 μL/well, and then incubated with 100 μL/well of 5% BSA (Sigma Aldrich) dissolved with PBST for 1 h at 37 °C. After washing, 100 μL detection antibody (MJFR1, 1/2,000, Ab259612, Abcam) was added, and the plate was incubated for 1 h at 37 °C. Next, the plate was washed and incubated at 37 °C for 1 h with 100 μL/well of HRP-conjugated secondary antibody (AS014, Abclonal), diluted at 1/5,000. After being washed five times, each well received 100 μL TMB to react with HRP-IgG. The reaction was allowed to proceed for 15 min at 37 °C in a dark environment. The reaction was terminated by addition of the stop solution for TMB substrate, after which the absorbance was read at 450 nm with a Multiskan MK3 microplate reader (Thermo fisher).
2.8. Differential Gene Expression was Evaluated by RNA-Seq
Total RNA was extracted from primary neurons infected with LV-Con/SNCA/S129A for 4 days, using Trizol (R0016, Beyotime Biotechnology). Following quality control, mRNA was enriched via Oligo (dT) beads, fragmented, and converted into double-stranded cDNA. The purified cDNA underwent end-repair, A-tailing, and adapter ligation. Fragments (~350 bp) were size-selected and PCR-enriched to generate the final library, which was subsequently circularized. Library construction, library preparation, high-throughput sequencing and quality control were performed by Annoroad technologies (Beijing, China). For data analysis, paired-end clean reads were aligned to the reference genome using HISAT2 v2.0.5. Gene expression levels were quantified using FPKM. Differential expression analysis was conducted using DESeq2, with p-values adjusted via the Benjamini-Hochberg method. Specifically, genes with adjust P-value ≤ 0.05 and fold change ≥ 2 were considered as differentially expressed genes (DEGs).
2.9. Immunofluorescence of Mice Brain Tissue and Primary Neurons
To visualize the distribution of α-syn and p-α-syn in the brain of Wt and Tg mice, 3 μm paraffin-embedded brain sections were processed for immunofluorescence (IF). Briefly, following dewaxing, hydration and antigen retrieval, sections were immersed in PBST (0.3% Triton X-100 in 0.01 M PBS) for 10 min. For p-α-syn detection in primary neurons, neurons were washed three with PBS, incubated with 0.4% paraformaldehyde (PFA) for 10 min and then washed three times with PBST. After being blocked with 10% goat serum for 1 h at RT. p-α-syn (pSyn#64, Wako, 1/2,000), p-α-syn (D1R1R, 23706, CST, 1/500), t-α-syn (Sc69977, 1/200), MAP2 (Ab32454, Abcam, 1/1,000), Neun (94403S, CST, 1/500), and GFAP (Sc33673, Santa cruze, 1/500) antibodies were then incubated with sections and neurons for 24 h at 4 °C. After being washed in PBST for three times, sections and neurons were incubated with secondary antibodies [Goat anti-Rabbit IgG, Alexa Fluor™ 488 (A-11034, Invitrogen, 1/500), Goat anti-Mouse IgG, Alexa Fluor™ 594 (A-11032, Invitrogen, 1/500)] for 1 h at RT, followed by counterstaining with Dapi (4083, CST, 1/500) for 15 min. To identify blood vessels, sections were incubated with Lectin (L32472, Invitrogen, 1/500) for another 15 min. The sections and neurons were sealed, and digital images were acquired using the Tissue FAXS imaging system (Tissue Gnostics, Vienna, Austria) and the confocal microscope (Leica TCS SP8, Germany).
2.10. Isolation the Cytosolic and Lipid Raft Fractions from the Midbrain of Mice Brain
We used the ULTRARIPA® kit (F015, Wako) to isolate the cytosolic and lipid raft fractions from the mouse midbrain. Firstly, protease inhibitor (PI) and phosphatase inhibitor (PPI) (all from ServiceBio) were incorporated into both Buffer A and Buffer B of the kit. A volume of 300 μL of precooled Buffer A was administered to half of the midbrain tissue, followed by sonication and incubation on ice for 10 min. The samples were then subjected to centrifugation at 20,000 g for 15 min to obtain the cytosolic fraction. Subsequently, the precipitate was resuspended in another 300 μL of cold Buffer A, centrifuged again, and the supernatant discarded, leaving the cytosolic fraction. This precipitate was then mixed with 80 μL Buffer B. The mixture was sonicated, incubated at RT for 5 min, and centrifuged at 20,000 g for 10 min. The resulting supernatant was the lipid raft fraction.
2.11. Isolation the Cytosolic and Lipid Raft Fractions from the Peripheral Blood Cells of Mice
Blood samples were collected from the medial canthus vein of the mice under anesthesia, and placed in centrifuge tubes pre-rinsed with 4% EDTA-Na2 solution. After mixing and standing on ice for 15 min, the samples were centrifuged at 4 °C and 2,500 rpm for 15 min to separate plasma from blood cells. The blood cells were washed with twice the sample volume of % NaCl and centrifuged at 2,500 rpm for 5 min at 4 °C, repeated three times. Buffer A, in twice the volume of the washed hemocyte precipitate, was then added to the hemocyte precipitate, sonicated, incubated on ice, and centrifuged at 20,000 g for 15 min to obtain the cytosolic fraction. Subsequently, the precipitate was resuspended in Buffer A, centrifuged at 20,000 g for 5 min, and repeated three times to collect the cytosolic fraction. Buffer B was then added to the precipitate, sonicated, incubated at RT, and centrifuged to obtain the lipid raft fraction.
2.12. WB
We performed WB as outlined in previous research [32], Briefly, samples of mice midbrain and primary neuron homogenates were first mixed with loading buffer and then incubated at 95ºC for 10 min. After denaturation, protein samples were separated using 10% and 12% Sodium Dodecyl Sulfate Polyacrylamide Gel Electrophoresis (SDS-PAGE). The gels were then transferred to 0.22 μm Polyvinylidene Difluoride membranes at 2 mA/cm2 for 90 min. For α-syn and p-α-syn detection, the membranes were incubated with 0.4% PFA for 30 min and then washed three times with TBST. After being blocked with 5% skimmed milk for 1 h at RT, the membranes were incubated with primary antibodies overnight at 4 °C. The membranes were then washed three times with TBST and incubated with fluorophore-conjugated secondary antibodies at RT for 1 h with gentle agitation to facilitate comprehensive binding to the primary antibodies, including mouse 680, mouse 800, rabbit 680, rabbit 800 (926-68070/32210/68071/32211, LI-COR Biosciences, USA), diluted 1:10,000. The membranes were washed three times with TBST and visualized in the Odyssey imaging system (LI-COR Biosciences, USA). Primary antibodies used in this study included h-α-syn (Ab138501, Abcam, 1/2,000), p-α-syn (D1R1R, 1/2,000), t-α-syn (Sc69977, Santa Cruze, 1/1,000), Flotillin-1 (15571-1-AP, Proteintech, 1/2,000), Snap25 (14903-1-AP, Proteintech, 1/5,000), Band.3 (28131-1-AP, Proteintech, 1/1,000), β-actin (AC026, ABclonal, 1/4,000), GAPDH (A19056, ABclonal, 1/4,000).
2.13. CO-IP
CO-IP method is similar to that previously reported [32]. First, protein concentrations in the cytosolic and lipid raft fractions of midbrain/peripheral blood cells were determined using the Bicinchoninic Acid Protein Assay Kit (23225, Thermo fisher). Subsequently, 2,000 μg homogenates were incubated with p-α-syn antibody (D1R1R, 1/50) or rabbit IgG (2729S, CST, 1/50) in a 400 μL IP buffer system (25 mM Tris-HCl, 150 mM NaCl, 1 mM EDTA-Na2, 1% NP-40, 1 X PI and PPI). The mixture was incubated with constant rotation for 16 h at 4 °C. Following that, 40 μL Protein A/G Magnetic Beads (HY-K0202, MCE) were added into the system and incubated for 6 h at 4 °C. The bead–antigen-antibody complex was separated using a magnetic rack. The supernatant (40 μL, Output fraction) was mixed with 10 μL 5 X loading buffer, and the bead–antigen-antibody complex (IP fraction) was mixed with 30 μL 2 X loading buffer. Both mixtures were then incubated at 95ºC for 10 min. After denaturation, protein samples were prepared for the following WB experiment.
2.14. LC-MS/MS Assays and Data Analysis
The Genechem performed the LC-MS/MS analysis as outlined in this study [38]. Briefly, purified CO-IP protein samples were separated via SDS-PAGE. Gel slices were destained, reduced with DTT, alkylated with IAA, and digested overnight with trypsin. Extracted peptides were desalted using C18 cartridges and reconstituted in 0.1% formic acid. LC-MS/MS analysis was performed using an Easy nLC system coupled to an OE480 mass spectrometer (Thermo Fisher). Peptides were separated on a C18 reversed-phase column using a linear gradient of buffer B (80% ACN/0.1% formic acid) at 300 nL/min. Raw data were processed in Proteome Discoverer 2.4 using the Mascot 2.6 engine. Database search parameters specified a precursor mass tolerance of 10 ppm and a fragment ion tolerance of 0.05 Da. Protein identification was considered positive if the peptide score exceeded the significance threshold (FDR = 0.01).
2.15. Enrichment Analysis
The GO (gene ontology) and KEGG (Kyoto encyclopedia of genes and genomes) functional enrichment analyses on p-α-syn interacting proteins and DEGs, including: ①. p-α-syn interacting proteins in the cytosolic fraction (70 proteins) and the lipid raft fraction (48 proteins) in the midbrain of Wt mice; ②. p-α-syn interacting proteins in the cytosolic fraction (117 proteins) and the lipid raft fraction (11 proteins) in the blood cells of Wt mice; ③. DEGs among LV-Con/SNCA/S129A infected primary neurons (183 genes). Functional Annotation Clustering was performed with the Database for Annotation, Visualization and Integrated Discovery (DAVID) (https://david-d.ncifcrf.gov/), and the top 10 GO and KEGG terms were then listed.
2.16. Statistical Analysis
Statistical analyses were performed using Prism 8.0.1 software (GraphPad, La Jolla, CA, USA). Each experiment was independently conducted at least three times, and the results are presented as the mean ± standard error of the mean (SEM). Datasets were analyzed using One-way ANOVA followed by Tukey’s multiple comparisons test and Two-way ANOVA followed by Sidak’s multiple comparisons test. In all cases, a value of P < 0.05 was considered statistically significant.
3. Results
3.1. p-α-Syn Exhibites a Widespread Distribution Across all Brain Regions in Wt Mice
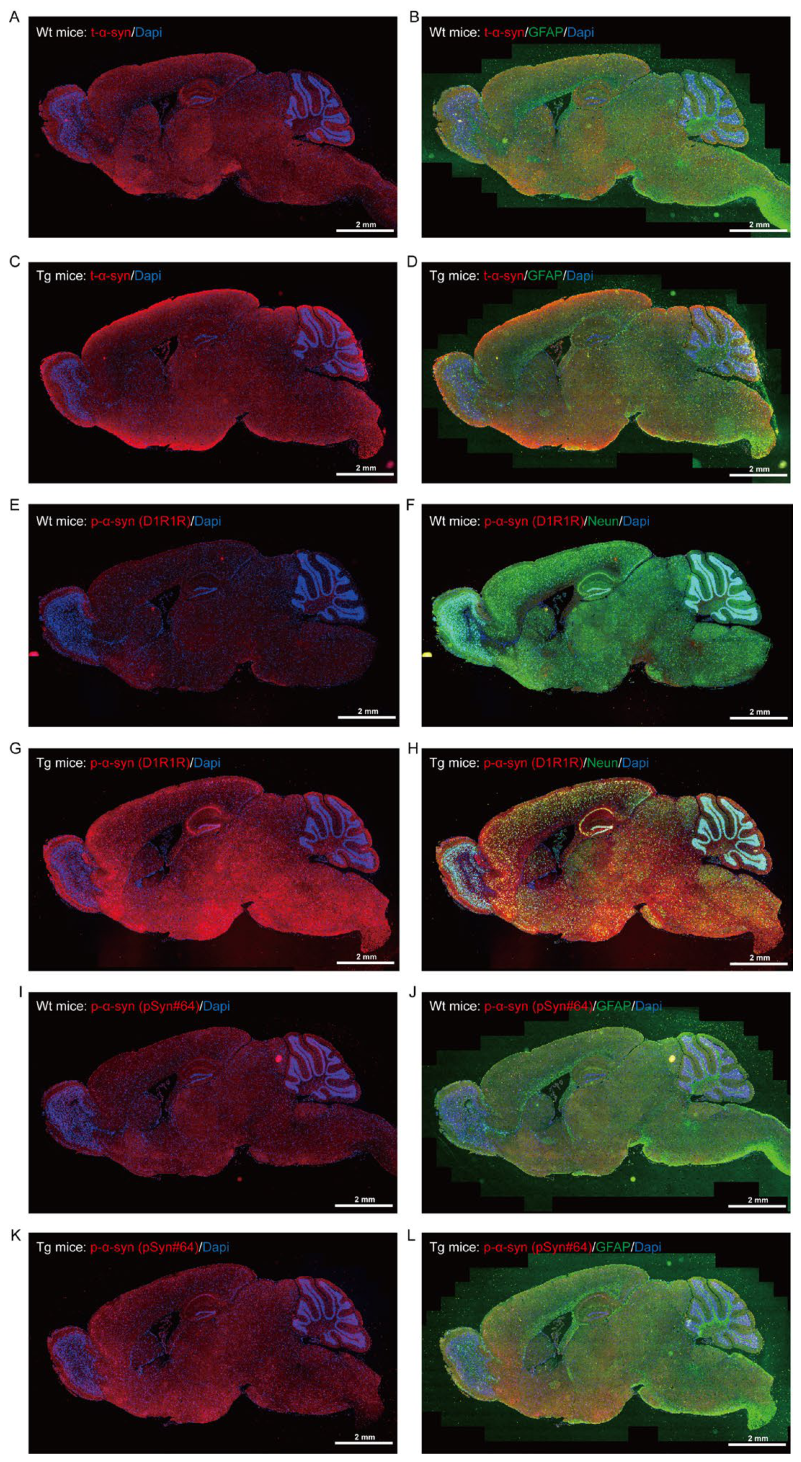
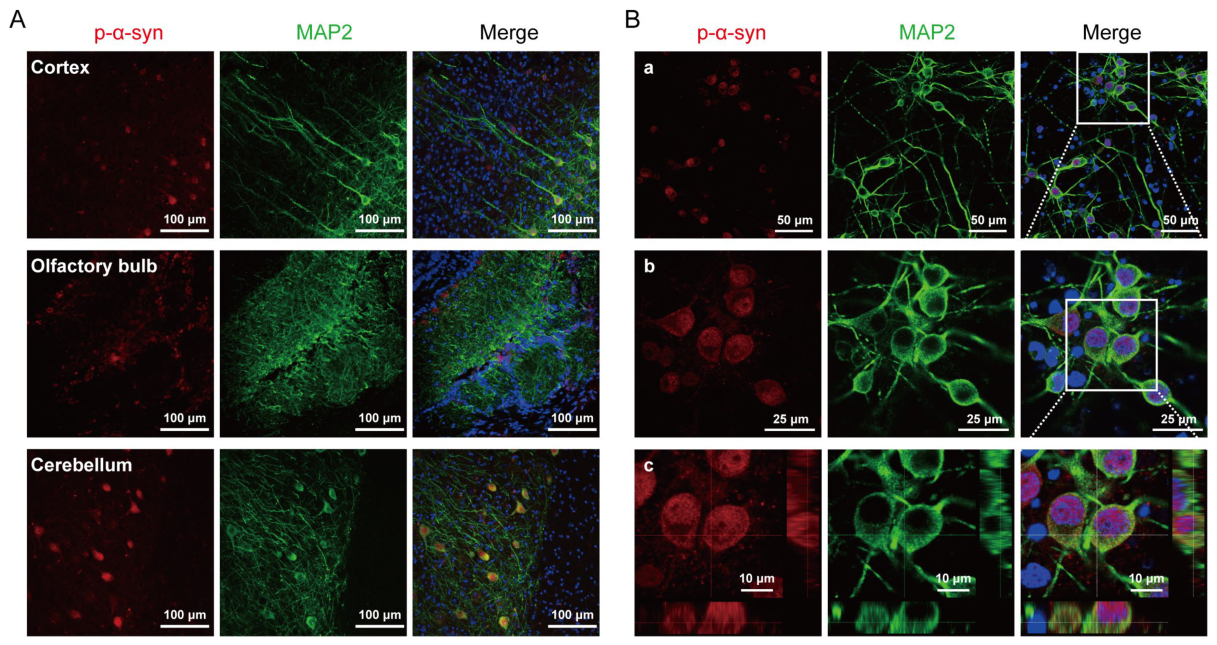
Our previous efforts established that the D1R1R antibody enables efficient capture of p-α-syn from the RIPA-soluble compartment of Wt midbrain tissue [32]. To further investigate the distribution of p-α-syn under both physiological and pathological conditions, we used a Tg mouse model, which overexpressed h-α-syn under the control of Thy1 promoter. This Tg line could mimic familial forms of PD, exhibiting typical progression of nonmotor and motor symptoms that are exacerbated with age [39,40]. IF staining of sagittal brain tissue sections showed that the expression levels of α-syn and p-α-syn were significantly higher in the 12-month-old Tg group compared to the 6-month-old Wt group (Figure S1A-D, E-L). Notably, there was a widespread distribution of p-α-syn across various brain regions in Wt mice (Figure 1A, E), especially in the olfactory bulb, cortex, striatum, hippocampus, midbrain, and cerebellum (Figure 1B, F). Besides, confocal microscopy revealed the presence of aggregated p-α-syn within the neuronal cell bodies and processes in the cortex, olfactory bulb, and cerebellum (Figure S2A). Moreover, the antibodies p-α-syn (D1R1R) and p-α-syn (pSyn#64, Wako) exhibited differential immunoreactivity in brain tissues. Specifically, the pSyn#64 antibody demonstrated a higher signal intensity in the Wt group; however, its sensitivity in discerning differences in p-α-syn levels between the Wt and Tg groups was inferior to that of the D1R1R antibody (Figure 1A, E; S1E, G, I, K). Furthermore, there was partial co-localization of α-syn and p-α-syn within neuronal and astrocytic populations (Figure 1C-E, G-H). The aforementioned results collectively indicate that p-α-syn is present in the brain of Wt mice, suggesting that p-α-syn may also contribute to brain tissue function under normal physiological conditions.
3.2. Identification of Proteins Interacting with p-α-Syn in the Midbrain of Wt Mice
Having confirmed the widespread presence of p-α-syn in the brain, we next sought to identify its molecular interaction partners to elucidate its physiological functions. Previous studies have indicated a strong association between α-syn and components of lipid rafts [10,11,14]. However, whether p-α-syn forms distinct interaction networks by subcellular localization remains unclear. To address this question, we fractionated cytosolic and lipid raft compartments to test distinct binding partners across microenvironments. Accordingly, the ULTRARIPA® kit was employed to isolate and extract the cytosolic fraction (A buffer-soluble fraction) and lipid raft fractions (B buffer-soluble fraction) from the midbrain tissues of 6-month-old Wt mice and 12-month-old Tg mice (Figure 2A). Subsequently, the levels of α-syn/p-α-syn were quantified utilizing WB. The analysis of results indicated that both α-syn and p-α-syn were present in the cytosolic and lipid raft fractions of Wt and Tg mice, and the levels of α-syn and p-α-syn of Wt group were significantly lower compared to the Tg group. Moreover, Flotillin-1 was more abundant in the lipid raft fraction, while Snap25 was more abundant in the cytosolic fraction (Figure 2B). To investigate the differential biological effects of p-α-syn mediated by the cytosolic and lipid raft fractions under physiological conditions, CO-IP/MS was employed to isolate and extract p-α-syn and its interacting proteins from 6-month-old Wt4-Wt7 midbrain samples (Figure 2C). WB analysis confirmed that the D1R1R antibody effectively enriched p-α-syn within both the cytosolic and lipid raft fractions of midbrain samples (Figure 2.D). The MS identified 70 and 48 proteins (Peptides 95% ≥ 1) that interacted with p-α-syn in the cytosolic and lipid raft fractions, respectively (Figure 2E, Table. S1-2). Notably, in our previous study, a total of 225 p-α-syn interacting proteins were identified in the RIPA-soluble fraction in the midbrain of 12-month-old Tg mice [32]. A Venn plot revealed marginally significant differences in the protein interaction networks of p-α-syn under both physiological and pathological conditions (Figure 2F).
3.3. Functional Annotation of Proteins Interacting with p-α-Syn in Both the Cytosolic and Lipid Raft Fractions of Wt Midbrain Tissue
To functionally interpret the distinct interaction networks identified in the cytosolic and lipid raft fractions, we next performed comprehensive bioinformatic analyses. We uploaded 70 and 48 candidate proteins to DAVID database for functional annotation. The top 10 GO terms for Biological Process (BP), Cellular Component (CC), and Molecular Function (MF) were subsequently identified. The GO enrichment analysis revealed that p-α-syn interacting proteins were predominantly localized within the cytoplasm and nuclear compartments of the cytosolic fraction in the midbrain of Wt mice. These proteins primarily participated in cytoskeletal assembly, protein binding, as well as RNA binding and processing (Figure 3A-C). In contrast, p-α-syn interacting proteins were predominantly localized within the myelin and cytoplasm components of lipid raft fractions, where they contributed to cytoskeletal assembly and protein binding (Figure 3D-F). Furthermore, a comparative analysis of the p-α-syn interacting proteins was conducted between the Wt and Tg cytosolic fractions. These results indicated a significant reduction in the proportion of interacting proteins associated with protein binding functions, as well as those involved in RNA binding and processing, under pathological conditions (Figure 3A-C). Overall, these findings suggest significant differences in the protein interaction networks associated with p-α-syn in the cytosolic fractions under physiological versus pathological conditions, and further support the notion that p-α-syn operates within subcellularly distinct interactomes that govern different biological processes.
3.4. Identification of Proteins Interacting with p-α-syn in the Peripheral Blood Cells of Wt Mice
The distinct subcellular interactomes identified in the midbrain raised an important question: whether p-α-syn similarly forms specialized interaction networks in peripheral tissues. Emerging evidence has indicated that α-syn is also found in the peripheral blood system, with high abundance in red blood cells [16,17]. Our IF staining of midbrain tissue from 6-month-old Wt mice revealed that p-α-syn was partially co-localized with the vascular marker Lectin and the astrocyte marker GFAP (Figure 4A), suggesting a potential vascular-bone marrow axis for p-α-syn distribution. WB results indicated that α-syn was detected in blood cells of both Wt and Tg mice, but not KO mice (Figure 4B-C). We further isolated the cytosolic fraction and lipid raft fractions from blood cells of 6-month-old Wt mice and analyzed these fractions via WB (Figure 4D). The results revealed that p-α-syn was detectable in both the cytosolic and lipid raft fractions. p-α-syn was predominantly localized within the cytosolic fraction, while a comparatively lower concentration of p-α-syn was observed in the Band.3-positive lipid raft fraction (Figure 4E). Next, CO-IP/MS was employed to identify p-α-syn interacting proteins. WB analysis confirmed that the D1R1R antibody effectively enriched p-α-syn within both the cytosolic and lipid raft fractions of blood cells from Wt4-Wt7 mice. However, WB exhibited limited ability to detect the target protein in the lipid raft fraction (Figure 4F).
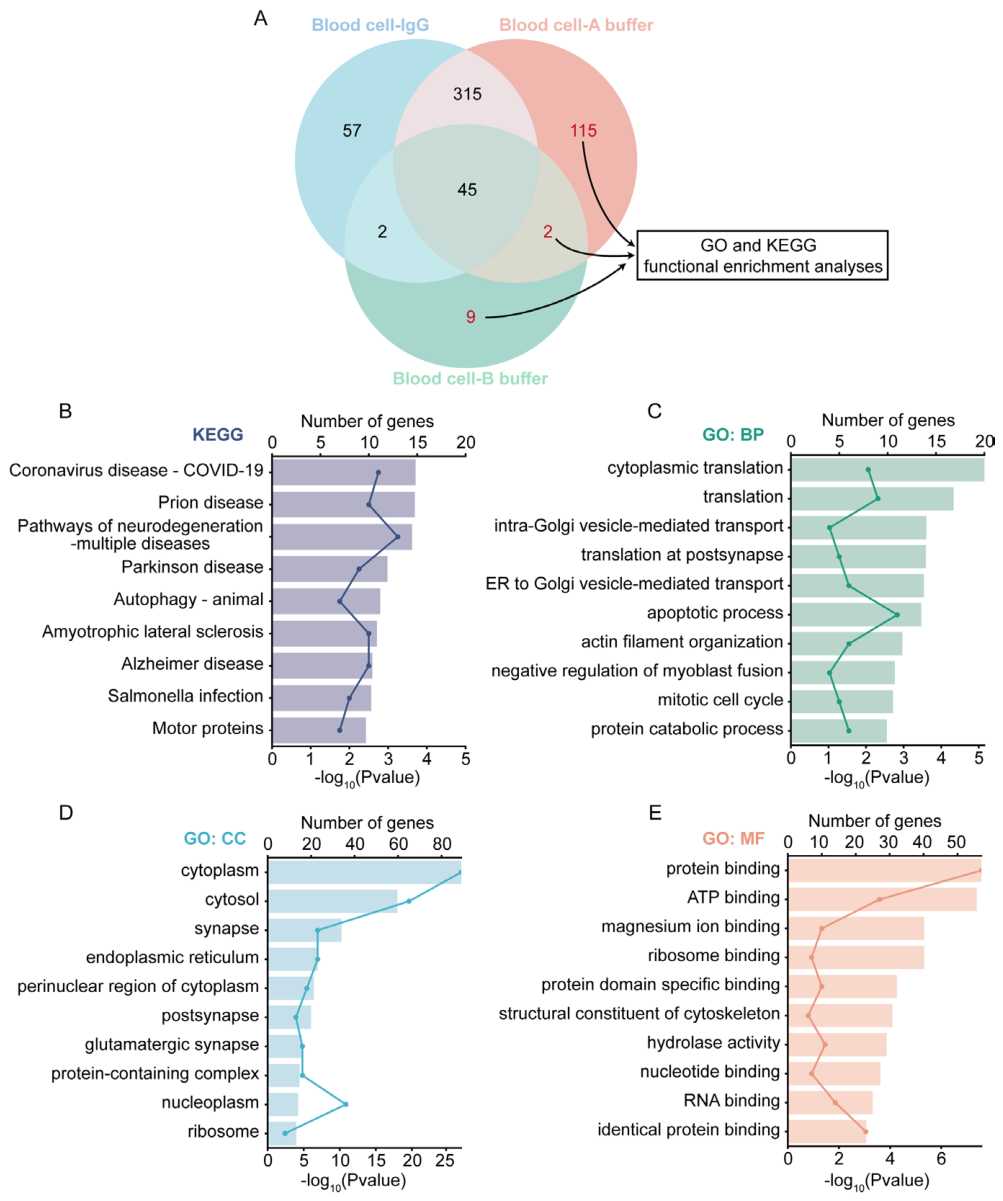
Following enrichment, the interacting proteins were identified using MS. MS results indicated that, following the exclusion of non-specific IgG-binding proteins, 117 and 11 p-α-syn interacting proteins were identified (Peptides 95% ≥ 2) in the cytosolic and lipid raft fractions, respectively (Figure S3A, Tables. S3-S5). To enhance the understanding of the role of p-α-syn in blood cells, we uploaded a total of 126 p-α-syn interacting proteins to DAVID database for functional annotation. The KEGG pathway analysis indicated that these proteins were predominantly associated with several neurodegenerative disorders, including Prion disease, PD, Amyotrophic lateral sclerosis, and Alzheimer’s disease, among others (Figure S3B). GO analysis revealed that p-α-syn interacting proteins were primarily localized in the cytoplasm and were involved in functions such as protein binding, vesicle-mediated transport, cytoskeleton assembly, RNA binding (Figure S3C-E). Notably, the functional profiles of p-α-syn interacting proteins in blood cells mirrored those observed in the midbrain, suggesting a conserved role for p-α-syn in regulating fundamental cellular processes across both central and peripheral systems.
3.5. Inhibiting of p-α-Syn did not Alleviate Cytotoxicity or Regulate Cellular Calcium ion Caused by α-syn Overexpression
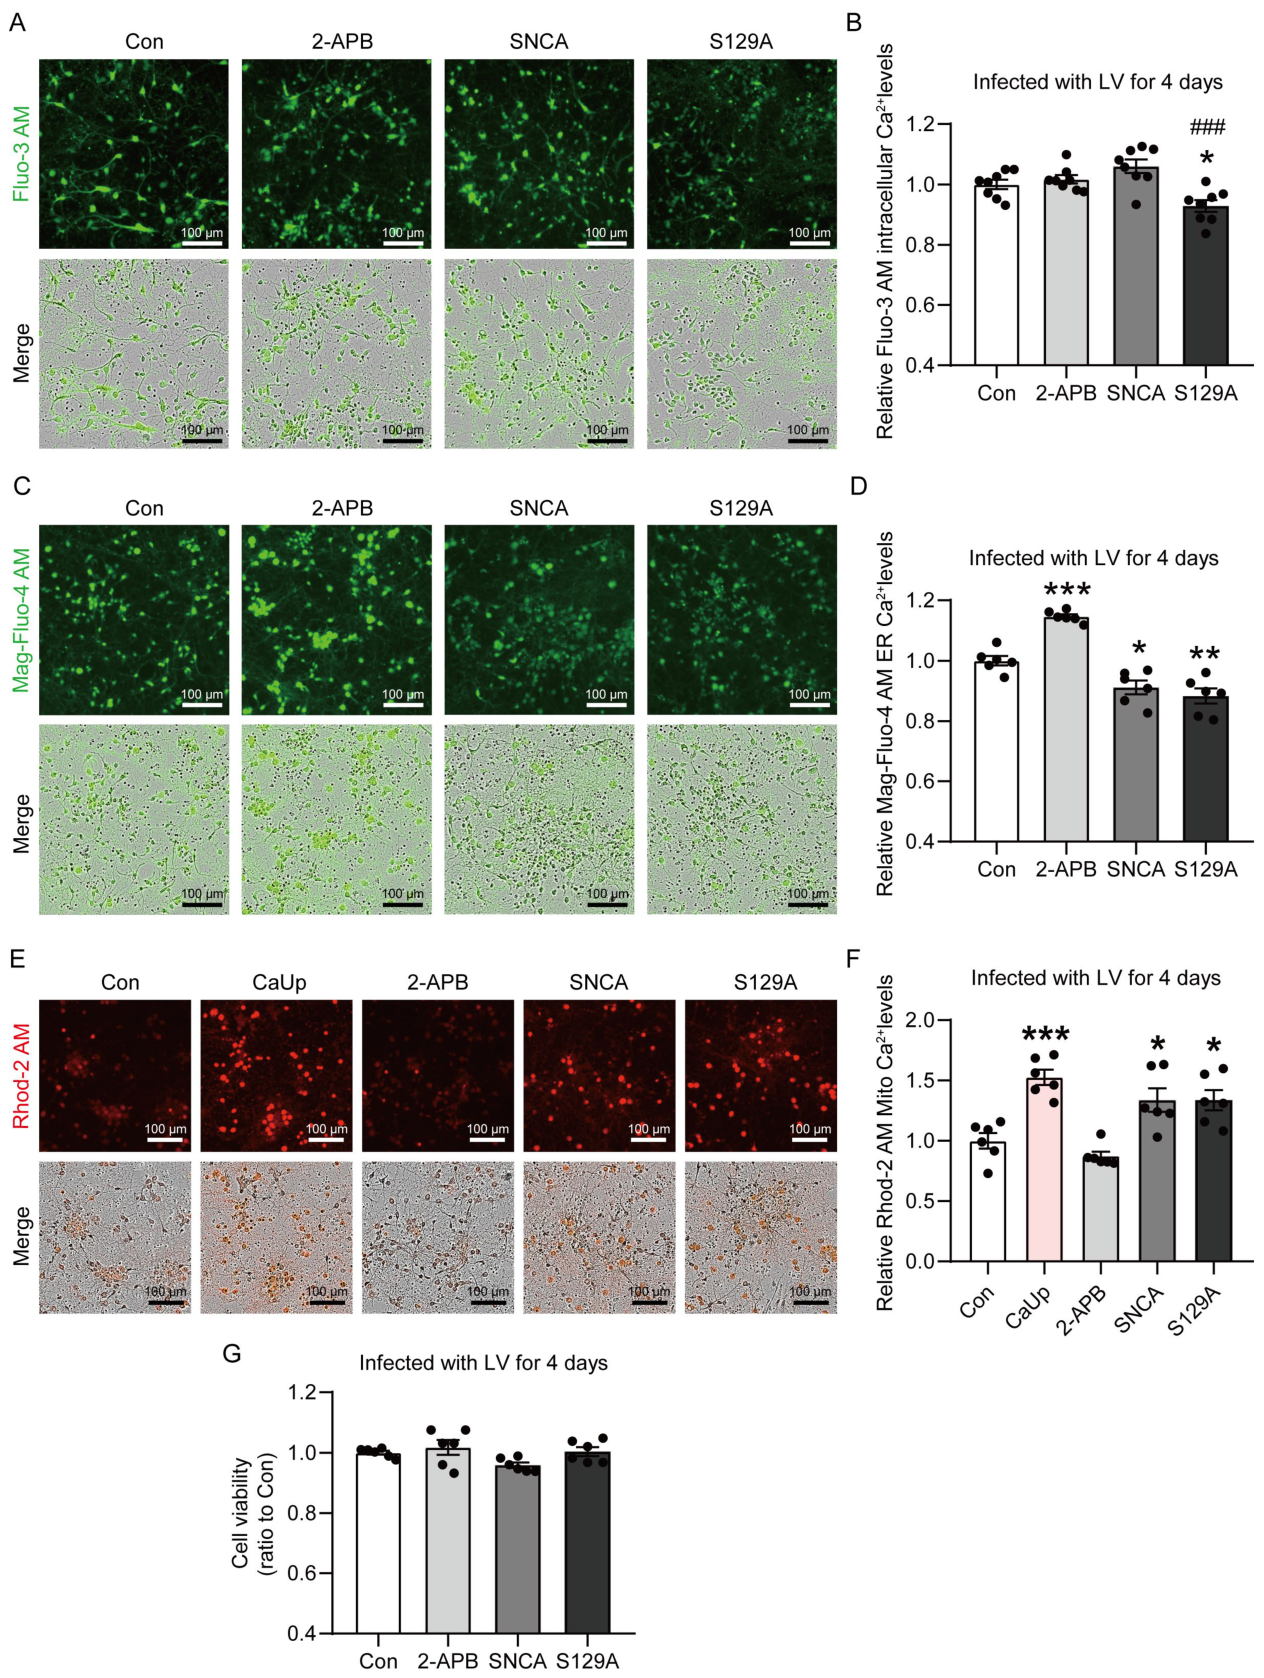
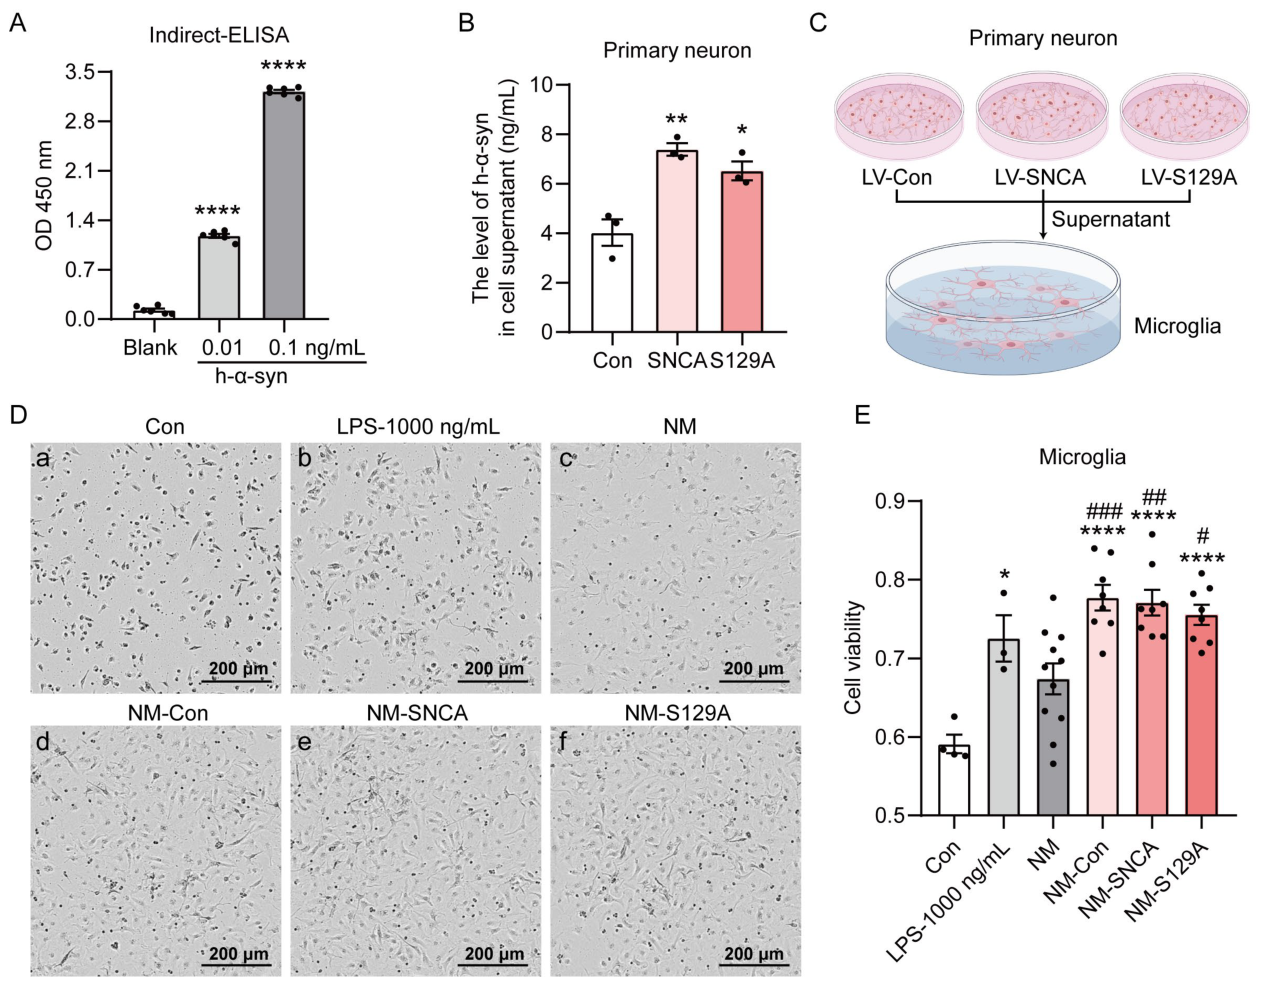
Having delineated the interaction networks of p-α-syn in both the CNS and peripheral systems, we next turned to functional validation to determine the consequences of p-α-syn modulation. To investigate the impact of p-α-syn on the neurotoxicity, a transient transfection of two different concentrations of the myc/myc-h-α-syn/myc-S129A plasmid was initially conducted into SHSY5Y cells. Our results from the cell morphology evaluations and CCK8 assay demonstrated that increased plasmid transfection doses were associated with significant cytotoxic effects due to the overexpression of myc-h-α-syn and myc-S129A, compared to the Con group (Figure 5A, B). Statistical analyses further indicated that S129A overexpression resulted in significant cytotoxicity (Figure 5B). Subsequently, we investigated the impact of p-α-syn on cytotoxicity in primary neurons. The results of the CCK8 assay indicated that LV-mediated overexpression of SNCA and S129A did not exhibit toxicity at 4 days post-infection when compared to the Con group (Figure S4G). In contrast, a significant increase in cytotoxicity was observed at 7 days post-infection (Figure 5D). The findings suggest that the inhibition of p-α-syn does not alleviate the cytotoxic effects induced by the overexpression of α-syn.
Given the extensive literature linking α-syn to calcium homeostasis dysregulation [21], we next investigated whether p-α-syn plays an essential role in maintaining intracellular calcium equilibrium. A comprehensive investigation of calcium homeostasis was conducted in primary neurons infected with the LV-Con/SNCA/S129A. To measure calcium concentrations across different cellular compartments, we utilized specific fluorescent calcium probes: Fluo-3 AM for cytosolic calcium, Mag-Fluo-4 AM for ER calcium, and Rhod-2 AM for Mito calcium. During the experimental procedure, the application of 2-APB, an inhibitor of the IP3R calcium channel, effectively blocked the transfer of calcium from ER to Mito. Conversely, introducing CaUp into the neurons resulted in mitochondrial calcium overload, serving as a positive control within the experimental framework. Our results obtained after 4 days of LV infection indicated that the overexpression of SNCA did not influence cytosolic calcium levels. In contrast, the overexpression of S129A resulted in a reduction of cytosolic calcium content compared to the Con/SNCA group (Figure S4A, B). Besides, the overexpression of SNCA and S129A resulted in a decrease in ER calcium and an increase in Mito calcium (Figure S4C-F). After 7 days of LV infection, the overexpression of SNCA and S129A also resulted in a significant mitochondrial calcium overload compared to the Con group (Figure 5C, E, F). These findings collectively indicate that the overexpression of SNCA/S129A significantly influences the regulation of intracellular calcium homeostasis, particularly in the interaction between the ER and Mito. Furthermore, inhibiting p-α-syn failed to restore the disrupted intracellular calcium homeostasis induced by the overexpression of α-syn.
3.6. RNA-Seq and Transcriptome Analysis of Primary Neurons Infected with LV-Con/SNCA/S129A
While our calcium imaging experiments revealed that the inhibition of p-α-syn does not rescue α-syn-induced calcium imbalance, we sought to identify additional downstream effectors and broader biological processes regulated by p-α-syn through unbiased transcriptomic profiling. To further investigate the role of p-α-syn, we extracted mRNA from primary neurons infected with LV-Con/SNCA/S129A for 4 days, and conducted transcriptomic analysis via RNA-seq (Figure 6A). WB analysis confirmed the successful overexpression of SNCA and S129A (Figure 6B). The principal component analysis (PCA) results indicated a clear clustering and separation among the Con, SNCA, and S129A groups, with good intra-group repeatability (Figure 6C). This finding suggests that the transcriptomic profiles of each group are significantly distinct. Furthermore, a comparative analysis of DEGs between the groups, along with accompanying heat maps, provided a visual representation of the specific clustering of gene expression patterns (Figure 6D-E).
The biological role of p-α-syn was investigated by categorizing the DEGs derived from transcriptome analysis. A total of 142 DEGs were identified by overlapping the genes upregulated in “SNCA versus Con” with those downregulated in “S129A versus SNCA”. Besides, 41 DEGs were identified by overlapping the genes downregulated in “SNCA versus Con” with those upregulated in “S129A versus SNCA” (Figure 7A). Subsequently, a total of 183 DEGs were uploaded to DAVID database for functional annotation. KEGG analysis indicated that p-α-syn was intricately associated with the modulation of the complement and coagulation cascades, extracellular matrix (ECM)-receptor interaction, viral protein interaction with cytokine and cytokine receptor, protein digestion and absorption processes, the PI3K-Akt signaling pathway (Figure 7E). Furthermore, GO analysis revealed that a significant proportion of the DEGs were associated with cell membrane and extracellular matrix components (Figure 7D). These genes were associated with various BP, including the inflammatory response, immune system processes, neutrophil chemotaxis, extracellular matrix structural constituent, and were also linked to protein binding and DNA binding activities (Figure 7B, C). Overall, these findings indicate that p-α-syn plays a significant role in modulating the immune-inflammatory state of neurons.
3.7. Differential Expression and Secretion of CCL2 and CCL5 in the Primary Neurons Infected with LV-Con/SNCA/S129A
Among the DEGs identified by RNA-seq, chemokine signaling pathways emerged as particularly prominent, prompting us to validate key findings at the protein level and assess their functional relevance. To further investigate the role of p-α-syn in modulating the α-syn-mediated immune-inflammatory state, culture medium supernatants were collected from primary neurons infected with LV-Con/SNCA/S129A for 6 days. The ELISA results demonstrated that the overexpression of SNCA and S129A significantly increased the secretion of α-syn (Figure S5A-B). Subsequently, primary microglia were treated with the collected medium for 24 h, after which cell viability was assessed. The CCK8 assay results indicated that supernatants from the Con, SNCA, and S129A groups could induce microglial proliferation, exhibiting effects comparable to those observed with LPS stimulation (Figure S5C-E). These findings suggest that the cell culture supernatants contained certain inflammatory factors. The supernatant medium was then concentrated and analyzed for the presence of inflammatory and immune-related cytokines utilizing RayBiotech protein chips (Figure 8A). The analysis revealed an upregulation in the concentrations of CXCL1, CCL2, and CCL5 within the culture medium of the SNCA and S129A groups, whereas IL-13 levels exhibited a tendency towards downregulation (Table. 1, Figure 8B-E). Moreover, RNA-seq data, presented as FPKM, demonstrated that α-syn overexpression markedly enhanced the transcriptional levels of CCL2 and CCL5 in neuronal cells. Notably, this effect was negated upon the inhibition of p-α-syn (Figure 8H-I). In contrast, no significant differences were observed in the transcript levels of IL-13 and CXCL1 across the three experimental groups (Figure 8F-G). Overall, these results suggest that the p-α-syn may play a critical role in modulating the expression and secretion of CCL2 and CCL5, thereby influencing α-syn-mediated inflammatory and immune responses.

Table 1.
The levels of cytokines in the culture medium supernatants of primary neurons infected with LV-Con/SNCA/S129A.
Table 1.
The levels of cytokines in the culture medium supernatants of primary neurons infected with LV-Con/SNCA/S129A.
| LOD | MAX | (pg/mL) | Con1 | Con2 | Con3 | SNCA1 | SNCA2 | SNCA3 | S129A1 | S129A2 | S129A3 |
|---|---|---|---|---|---|---|---|---|---|---|---|
| 8.0 | 4,000 | GM-CSF | 7.7 | 7.4 | 6.2 | 8.1 | 6.0 | 7.8 | 8.2 | 6.8 | 9.7 |
| 18.3 | 8,000 | IFNg | 11.8 | 12.9 | 11.8 | 12.4 | 12.5 | 12.9 | 18.0 | 12.0 | 18.8 |
| 3.1 | 2,000 | IL-1a | 0.3 | 0.0 | 0.0 | 0.0 | 0.9 | 0.0 | 0.0 | 0.0 | 0.1 |
| 8.4 | 4,000 | IL-1b | 13.5 | 14.6 | 13.6 | 14.3 | 11.9 | 12.3 | 14.1 | 11.2 | 16.3 |
| 2.8 | 2,000 | IL-2 | 6.3 | 4.5 | 6.4 | 5.0 | 5.7 | 5.5 | 5.3 | 5.8 | 6.0 |
| 1.8 | 2,000 | IL-3 | 0.5 | 0.4 | 0.4 | 0.2 | 0.2 | 0.2 | 0.2 | 0.1 | 0.4 |
| 1.5 | 1,000 | IL-4 | 0.0 | 0.0 | 0.0 | 0.0 | 0.0 | 0.0 | 0.0 | 0.0 | 0.0 |
| 16.5 | 10,000 | IL-5 | 0.0 | 0.0 | 0.0 | 0.0 | 0.0 | 0.0 | 0.0 | 0.0 | 0.0 |
| 6.5 | 4,000 | IL-6 | 6.6 | 4.6 | 10.4 | 5.8 | 6.5 | 8.2 | 6.8 | 6.2 | 10.3 |
| 57.1 | 40,000 | IL-9 | 9.1 | 7.3 | 14.2 | 7.6 | 5.0 | 17.1 | 17.2 | 1.9 | 15.7 |
| 5.9 | 4,000 | IL-10 | 0.0 | 0.0 | 5.2 | 0.9 | 3.4 | 1.9 | 0.0 | 0.0 | 6.1 |
| 4.7 | 4,000 | IL-12p70 | 7.5 | 6.4 | 7.6 | 8.4 | 7.4 | 7.2 | 7.4 | 6.5 | 15.0 |
| 43.1 | 40,000 | IL-13 | 22.0 | 20.2 | 21.7 | 9.2 | 15.1 | 9.1 | 16.9 | 7.8 | 20.5 |
| 3.3 | 4,000 | IL-17 | 1.1 | 1.1 | 1.4 | 1.7 | 1.4 | 1.4 | 1.1 | 1.0 | 1.5 |
| 3.6 | 2,000 | CXCL1 | 0.5 | 0.0 | 1.1 | 5.1 | 10.1 | 4.7 | 10.0 | 6.9 | 7.2 |
| 9.7 | 4,000 | CCL2 | 189.8 | 302.7 | 281.4 | 357.7 | 417.8 | 415.6 | 386.2 | 661.3 | 522.0 |
| 3.5 | 2,000 | MCSF | 0.6 | 0.0 | 0.2 | 0.0 | 0.0 | 0.0 | 0.0 | 0.0 | 0.2 |
| 2.6 | 2,000 | CCL5 | 37.0 | 37.8 | 38.5 | 46.1 | 53.8 | 61.8 | 63.4 | 74.7 | 30.2 |
| 4.6 | 2,000 | TNF-α | 11.0 | 9.6 | 12.3 | 10.3 | 7.1 | 12.4 | 10.4 | 13.6 | 11.0 |
| 8.0 | 4,000 | VEGF | 413.1 | 426.5 | 395.3 | 441.1 | 428.0 | 481.0 | 453.6 | 450.8 | 420.7 |
Scheme 1.
IF staining of p-α-syn and t-α-syn in the brain of Wt and Tg mice. Sagittal sections of Wt mice and Tg mice were prepared and analyzed with t-α-syn antibody (Sc69977, A-D), p-α-syn antibody (D1R1R, E-H), and p-α-syn antibody (pSyn#64, I-L). Red color indicates p-α-syn staining. Blue color indicates the nucleus. Green color indicates Neun (A-D) and GFAP (E-L). Scale bar, 2 mm (low magnification). The age of Wt mice: 6 months. The age of Tg mice: 12 months.
Scheme 1.
IF staining of p-α-syn and t-α-syn in the brain of Wt and Tg mice. Sagittal sections of Wt mice and Tg mice were prepared and analyzed with t-α-syn antibody (Sc69977, A-D), p-α-syn antibody (D1R1R, E-H), and p-α-syn antibody (pSyn#64, I-L). Red color indicates p-α-syn staining. Blue color indicates the nucleus. Green color indicates Neun (A-D) and GFAP (E-L). Scale bar, 2 mm (low magnification). The age of Wt mice: 6 months. The age of Tg mice: 12 months.
Scheme 2.
IF staining of p-α-syn in the brain of Wt mice and primary neurons. A. Cortex, olfactory bulb, and cerebellum tissue sections of Wt mice were prepared and analyzed with p-α-syn (pSyn#64). Scale bar, 100 μm. Mouse age: 6 months. B. Primary neurons of mice were prepared and analyzed with p-α-syn (pSyn#64) after 7 days of in vitro culture. Red color indicates p-α-syn staining. Green color indicates MAP2 (Marker of neuron). Blue color indicates the nucleus. White squares, amplified area under low magnification. Scale bar, 50 μm (low magnification) and 10/25 μm (high magnification).
Scheme 2.
IF staining of p-α-syn in the brain of Wt mice and primary neurons. A. Cortex, olfactory bulb, and cerebellum tissue sections of Wt mice were prepared and analyzed with p-α-syn (pSyn#64). Scale bar, 100 μm. Mouse age: 6 months. B. Primary neurons of mice were prepared and analyzed with p-α-syn (pSyn#64) after 7 days of in vitro culture. Red color indicates p-α-syn staining. Green color indicates MAP2 (Marker of neuron). Blue color indicates the nucleus. White squares, amplified area under low magnification. Scale bar, 50 μm (low magnification) and 10/25 μm (high magnification).
Scheme 3.
GO and KEGG pathway analysis of p-α-syn interacting proteins in the cytosolic and lipid raft fractions isolated from the peripheral blood cells of Wt mice. A. Venn diagram showing p-α-syn interacting proteins in the Blood cell-A buffer-IgG (Blood cell-IgG), Blood cell-A buffer-p-α-syn (Blood cell-A buffer), and Blood cell-B buffer-p-α-syn (Blood cell-B buffer) groups. The 126 p-α-syn-interacting proteins in the peripheral blood cells were uploaded to DAVID to perform KEGG pathway and GO analysis enrichment. The top 10 KEGG signaling pathways (B), GO terms in the BP (C), CC (D), and MF (E) are listed.
Scheme 3.
GO and KEGG pathway analysis of p-α-syn interacting proteins in the cytosolic and lipid raft fractions isolated from the peripheral blood cells of Wt mice. A. Venn diagram showing p-α-syn interacting proteins in the Blood cell-A buffer-IgG (Blood cell-IgG), Blood cell-A buffer-p-α-syn (Blood cell-A buffer), and Blood cell-B buffer-p-α-syn (Blood cell-B buffer) groups. The 126 p-α-syn-interacting proteins in the peripheral blood cells were uploaded to DAVID to perform KEGG pathway and GO analysis enrichment. The top 10 KEGG signaling pathways (B), GO terms in the BP (C), CC (D), and MF (E) are listed.
Scheme 4.
Inhibition of p-α-syn did not restore calcium homeostasis disrupted by the overexpression of α-syn. Representative Incucyte images of primary neurons infected with LV-Con/SNCA/S129A for 4 days (A, C, E). B. Fluo-3 AM measured cytoplasmic calcium via green fluorescence intensity in A-well plates. D. Mag-Fluo-4AM assessed ER calcium using green fluorescence in C-well plates. F. Rhod-2 AM determined mitochondrial calcium through red fluorescence in E-well plates. G. Quantitative analysis of the cell viability of neurons examined by CCK8 Kit. Neurons were treated with 2-APB for 24 h and preincubated with CaUp (500X) for 30 min. Scale bar, 100 μm. The results are expressed as the mean ± SEM (One-way ANOVA, Tukey’s multiple comparisons test). n = 8 (B). n = 6 (D). n = 6 (F). n = 6 (G). *P < 0.05 vs. Con. **P < 0.01 vs. Con. ***P < 0.001 vs. Con. ###P < 0.001 vs. SNCA.
Scheme 4.
Inhibition of p-α-syn did not restore calcium homeostasis disrupted by the overexpression of α-syn. Representative Incucyte images of primary neurons infected with LV-Con/SNCA/S129A for 4 days (A, C, E). B. Fluo-3 AM measured cytoplasmic calcium via green fluorescence intensity in A-well plates. D. Mag-Fluo-4AM assessed ER calcium using green fluorescence in C-well plates. F. Rhod-2 AM determined mitochondrial calcium through red fluorescence in E-well plates. G. Quantitative analysis of the cell viability of neurons examined by CCK8 Kit. Neurons were treated with 2-APB for 24 h and preincubated with CaUp (500X) for 30 min. Scale bar, 100 μm. The results are expressed as the mean ± SEM (One-way ANOVA, Tukey’s multiple comparisons test). n = 8 (B). n = 6 (D). n = 6 (F). n = 6 (G). *P < 0.05 vs. Con. **P < 0.01 vs. Con. ***P < 0.001 vs. Con. ###P < 0.001 vs. SNCA.
Scheme 5.
Supernatant from primary neurons infected with LV-Con/SNCA/S129A for 4 days promotes microglial proliferation. A. Indirect-ELISA using h-α-syn antibody (Abcam, MJFR1, Ab259612) to detect h-α-syn recombinant proteins (0, 0.01, 0.1 ng/mL). B. The contents of h-α-syn in the supernatants of neurons were detected using the indirect-ELISA in A. C. Schematic illustration of the experimental design involving primary microglia and the supernatant of primary neurons infected with LV-Con/SNCA/S129A for 4 days. D. Representative Incucyte images of primary microglia, treated with the supernatant of primary neurons for 24 h. Primary microglia were treated with 1,000 ng/mL LPS for 24 h to induce proliferation changes. Scale bar: 200 μm. E. Quantitative analysis of the cell viability of primary microglia in D examined by CCK8 Kit. The results are expressed as the mean ± SEM (One-way ANOVA, Tukey’s multiple comparisons test). n = 6 (A). n = 3 (B). n = 3-11 (E). *P < 0.05 vs. Con. **P < 0.01 vs. Con. ****P <0.0001 vs. Con. #P < 0.05 vs. SNCA. ##P < 0.01 vs. SNCA. ###P < 0.001 vs. SNCA.
Scheme 5.
Supernatant from primary neurons infected with LV-Con/SNCA/S129A for 4 days promotes microglial proliferation. A. Indirect-ELISA using h-α-syn antibody (Abcam, MJFR1, Ab259612) to detect h-α-syn recombinant proteins (0, 0.01, 0.1 ng/mL). B. The contents of h-α-syn in the supernatants of neurons were detected using the indirect-ELISA in A. C. Schematic illustration of the experimental design involving primary microglia and the supernatant of primary neurons infected with LV-Con/SNCA/S129A for 4 days. D. Representative Incucyte images of primary microglia, treated with the supernatant of primary neurons for 24 h. Primary microglia were treated with 1,000 ng/mL LPS for 24 h to induce proliferation changes. Scale bar: 200 μm. E. Quantitative analysis of the cell viability of primary microglia in D examined by CCK8 Kit. The results are expressed as the mean ± SEM (One-way ANOVA, Tukey’s multiple comparisons test). n = 6 (A). n = 3 (B). n = 3-11 (E). *P < 0.05 vs. Con. **P < 0.01 vs. Con. ****P <0.0001 vs. Con. #P < 0.05 vs. SNCA. ##P < 0.01 vs. SNCA. ###P < 0.001 vs. SNCA.
4. Discussion
Even though p-α-syn has long been recognized as a crucial pathological marker of LBs and LNs in PD, with its association with neurodegeneration extensively validated [7,41], there remains a significant gap in understanding its precise molecular function and interaction network under physiological conditions, particularly regarding the CNS and peripheral systems. Our study systematically elucidates the functional profile of p-α-syn in physiological states by presenting its interactomes within the midbrain and peripheral blood cells. The core findings reveal that p-α-syn exhibits highly specific subcellular localization and tissue distribution characteristics, regulating key biological processes such as RNA processing and vesicle transport through differential protein-protein interaction networks. Furthermore, we have elucidated its principal regulatory functions from two distinct perspectives: maintaining neuronal calcium homeostasis and reshaping the neuroimmune microenvironment. Importantly, our findings bridge the cognitive gap between the pathological mechanisms and physiological functions of p-α-syn, establishing the dual role of p-α-syn as a regulator of neuronal calcium homeostasis and neuroimmune responses.
Advancing research has revealed that physiological p-α-syn is also prevalent in normal brain tissues, where it contributes to the regulation of neuronal activity and synaptic function [3,4,5,6]. The accurate detection of physiological p-α-syn has been a subject of debate due to antibody specificity issues. Several researchers have employed p-α-syn antibody (EP1536Y, Abcam, Ab51253) in conjunction with BAR technology to detect p-α-syn in situ. However, their investigations did not yield any positive signals in normal human brain tissues [42]. Subsequent reports indicated that non-specific cross-reactivity was observed among the antibodies EP1536Y, MJF-R13 (Abcam, Ab168381), and pSyn#64 during immunohistochemical detection. The MJF-R13 antibody was utilized in the fluorescent and brightfield in situ proximity ligation assay, which enabled the successful detection of physiological p-α-syn in primary neurons, as well as in mouse and human brain tissues [3]. In addition, the EP1536Y antibody, in conjunction with the sensitive tyramide signal amplification technology, has been employed to detect p-α-syn-positive structures within the olfactory bulb tissues of non-diseased mammals and healthy humans [4]. In this study, pSyn#64 and D1R1R antibodies were utilized to conduct IF experiments. Similar to previous studies, p-α-syn was identified in sagittal sections of whole brain tissue from Wt mice, with positive signals in the olfactory bulb, cortex, striatum, hippocampus, midbrain, and cerebellum. In addition, we also found different recognition patterns between pSyn#64 and D1R1R antibodies. We hypothesize that these differences may be attributed to variations in their immunogenic peptides, sources, and recognition mechanisms [3,15,43,44].
Most previous research has focused on how lipid rafts and α-syn interact and are regulated in disease states, while few studies have explored the distribution and role of α-syn and p-α-syn in the cytosolic and lipid rafts under normal conditions [5,11,13,14]. To date, only two studies have investigated the functional role of proteins interacting with p-α-syn in physiological contexts. These studies employed BAR in conjunction with MS and found that, in normal human brain and Wt mouse olfactory bulb tissue, proteins interacting with p-α-syn were significantly enriched in pathways related to presynaptic vesicle transport and recycling, SNARE complex, RNA binding, and etc [4,15]. Our proteomic analysis further revealed distinct interaction networks for p-α-syn depending on its subcellular localization. Moreover, previous research on brain tissues from PD patients and murine models has demonstrated a significant association between p-α-syn interacting proteins and various functions such as extracellular vesicle secretion, neurotransmitter release, and synaptosome circulation under pathological conditions [6,42,45]. Consequently, a comparative analysis of p-α-syn interacting proteins was conducted in the cytosolic fraction of Wt and Tg mice. Our findings revealed a marked reduction in the proportion of proteins associated with protein binding, RNA binding and processing under pathological conditions. These results indicate that p-α-syn operates within fundamentally different interactomes in physiological versus pathological states, suggesting that its physiological functions are tightly regulated by specific subcellular microenvironments.
Beyond the CNS, our comprehensive analysis of peripheral blood cells elucidated the potential role of p-α-syn at the subcellular level in the periphery [17,18]. Our WB analysis indicated that p-α-syn predominantly resides in the cytosolic fraction of blood cells, with a minor presence in the lipid raft fraction. Notably, the proportion of p-α-syn in the lipid raft fraction of blood cells was significantly lower compared to that in the midbrain fraction. KEGG pathway enrichment analysis revealed that interacting proteins in blood cells were primarily associated with pathways involved in neurodegenerative disorders. GO enrichment analysis revealed that p-α-syn interacting proteins were involved in functions such as protein binding, vesicle-mediated transport, cytoskeleton assembly, and RNA binding, mirroring the functional roles of p-α-syn interacting proteins in the midbrain. Given that lipid rafts serve as crucial sites for the formation of extracellular vesicles (EVs). It has been observed that red blood cells and their derived EVs can traverse between the peripheral and CNS, thereby contributing to the onset and progression of synucleinopathies [17,46,47]. Consequently, further investigation into the distribution of p-α-syn and the alterations in the interacting protein network across various blood cell types and EVs subfractions is anticipated to provide significant insights.
The pathological and physiological implications of p-α-syn remain a subject of debate [7,41,48,49]. Studies have indicated that treating SHSY5Y cells with recombinant protein and subsequently assessing cell viability revealed that S129A resulted in reduced toxicity compared to SNCA [50]. Our findings indicate that inhibition of p-α-syn did not alleviate the cytotoxic effects linked to α-syn overexpression, both in SHSY5Y cells and primary neurons. Regarding calcium homeostasis, previous research has demonstrated that the inhibition of p-α-syn has been shown to restore mitochondrial calcium homeostasis [23,25,26,51]. In contrast to prior studies suggesting a protective role of S129A mutation, we detected calcium overload in the group overexpressing the S129A variant. These variations may be attributed to differences in cell models, but collectively, we provide evidence that p-α-syn is crucial for maintaining neuronal activity and calcium equilibrium [5,6].
In the context of neuroinflammation, the mechanisms by which α-syn and its p-α-syn influence the immune-inflammatory state of neurons remain inadequately understood. Consistent with a prior study demonstrating that the administration of α-syn recombinant protein to primary microglia can enhance their proliferation [52]. We also found that exposure of primary microglia to neuronal culture supernatant with overexpressed α-syn stimulated microglial proliferation. These findings suggest that α-syn and p-α-syn might modulate neuron-glia communication by regulating chemokine synthesis and secretion. Additionally, previous studies have demonstrated that the overexpression of α-syn in SHSY5Y cells can alter the homeostasis of immune response regulators such as CSF2, CCL5, and CXCL8 in the cell supernatant [31]. In the present study, 183 DEGs significantly associated with the regulation of p-α-syn were identified in neuronal transcriptomes, and the majority of these DEGs were mainly closely related to immune and inflammatory pathways. Moreover, α-syn overexpression significantly raised CCL2 and CCL5 protein and transcription levels in neurons, while inhibiting p-α-syn reduced these transcription levels. Prior research employing bioinformatics tools has identified CCL2 as a probable key upstream regulator of the α-syn signaling cascade [53]. This suggests that both CCL2 and CCL5 are highly likely to play pivotal roles in p-α-syn-mediated neuronal immune inflammatory responses, a topic that will be further investigated in the subsequent studies.
5. Conclusions
Overall, this study revises the traditional view of p-α-syn as simply a precursor to pathological aggregation, and establishing its dual physiological identity in modulating neuronal calcium homeostasis and reshaping the neuroimmune microenvironment. The regulatory mechanism of calcium homeostasis and CCL2/CCL5 secretion offers novel intervention targets for disrupting the neuroinflammatory cascade in PD. However, this study possesses certain limitations. It relies on mouse models and primary neurons, thereby necessitating further validation of the generalizability of its conclusions to human samples. Moreover, the precise molecular mechanisms by which p-α-syn modulates calcium flow remain to be fully elucidated. Future research should concentrate on investigating the distinctions between pathological and physiological p-α-syn, as well as identifying critical junctures in the transition process, to facilitate the translation of these fundamental insights into clinical intervention strategies.
Abbreviations
α-syn, α-synuclein; h-α-syn, human α-syn; t-α-syn, total α-syn; p-α-syn, pSer 129 α-syn, phosphorylation of α-syn at the Serine 129 site; PD, Parkinson’s Disease; LBs, Lewy bodies; LNs, Lewy neurites; CNS, central nervous system; Tg, Transgenic; Wt, Wild-type; KO, Knock-Out; RNA-seq, RNA sequencing; DEGs, differentially expressed genes; CO-IP/MS, Co-Immunoprecipitation and Mass Spectrometry; WB, Western blot; PI, protease inhibitor; PPI, phosphatase inhibitor; IF, immunofluorescence; PFA, paraformaldehyde; SDS-PAGE, Sodium Dodecyl Sulfate Polyacrylamide Gel Electrophoresis; LV, lentiviral; ER, endoplasmic reticulum; Mito, mitochondria; Ex, Excitation wavelength; Em, Emission wavelength; GO, Gene Ontology; KEGG, Kyoto Encyclopedia of Genes and Genomes; BP, Biological Process; CC, Cellular Component; MF, Molecular Function; PCA, principal component analysis; CCL, chemokine C-C motif ligand; CXCL, chemokine C-X-C motif ligand; RT, Room Temperature; FBS, Fetal Bovine Serum; NM, neuronal supernatant; BAR, Biotinylation by Antibody Recognition; PLA, proximity ligation assay; EVs, extracellular vesicles; ECM, extracellular matrix; SEM, standard error of the mean.
Supplementary Materials
The following supporting information can be downloaded at the website of this paper posted on Preprints.org. Figure S1: IF staining of p-α-syn and t-α-syn in the brain of Wt and Tg mice. Figure S2: IF staining of p-α-syn in the brain of Wt mice and primary neurons. Figure S3: GO and KEGG pathway analysis of p-α-syn interacting proteins in the cytosolic and lipid raft fractions isolated from the peripheral blood cells of Wt mice. Figure S4: Inhibition of p-α-syn did not restore calcium homeostasis disrupted by the overexpression of α-syn. Figure S5: Supernatant from primary neurons infected with LV-Con/SNCA/S129A for 4 days promotes microglial proliferation. Table S1: Proteins (Peptides 95% ≥ 1) that interacted with p-α-syn in the cytosolic fraction of midbrain from Wt mice. Table S2: Proteins (Peptides 95% ≥ 1) that interacted with p-α-syn in the lipid raft fraction of midbrain from Wt mice. Table S3: Proteins (Peptides 95% ≥ 2) that interacted with IgG in the cytosolic fraction of red cells from Wt mice. Table S4: Proteins (Peptides 95% ≥ 2) that interacted with p-α-syn in the cytosolic fraction of red cells from Wt mice. Table S5: Proteins (Peptides 95% ≥ 2) that interacted with p-α-syn in the lipid raft fraction of red cells from Wt mice. Additional File 1: The full Blots Images. Additional File 2: Raw data for statistical analysis. Additional File 3: AEEI-2022-073 Approved (Research Ethics). Additional File 4: AEEI-2023-247 Approved (Research Ethics). Additional File 5: FPKM of RNA sequence.
Author Contributions
Conceptualization, W.J.L., J.L., and Y.Y.; Methodology, W.J.L., S.Y.Z., X.Y.W., F.b., Y.L.J.; Software, W.J.L., S.Y.Z.; Validation, W.J.L., S.Y.Z., X.Y.W., F.b., Y.L.J.; Formal Analysis, W.J.L., J.L.; Investigation, W.J.L., S.Y.Z., X.Y.W., F.b., Y.L.J.; Resources, W.J.L., S.Y.Z.; Data Curation, W.J.L.; Writing – Original Draft Preparation, W.J.L.; Writing – Review & Editing, W.J.L.; Visualization, W.J.L.; Supervision, J.L., Y.Y.; Project Administration, W.J.L.; Funding Acquisition, W.J.L., S.Y.Z.
Funding
This work was supported by the National Natural Science Foundation of China [grant number: 82301635]; The Fundamental Research Funds for Central Public Welfare Research Institutes, conducted by China Rehabilitation Science Institute [grant number: 2021CZ-5, 2023CZ-4, CRSI-82301635].
Institutional Review Board Statement
All animal experiments adhered to the National Institute of Health’s (NIH; Bethesda, MD, USA) animal care and use guidelines. Capital Medical University’s Institutional Animal Care and Use Committee (Capital Medical University Animal Experiments and Experimental Animals Management Committee, AEEI-2023-247 and AEEI-2022-073) reviewed and approved the study protocol.
Informed Consent Statement
Not applicable.
Data Availability Statement
All data generated or analyzed during this study are included in the article/supplementary material/ additional files. Further inquiries can be directed to the corresponding authors.
Conflicts of Interest
The authors declare that they have no competing interests. All authors have read and agreed to the published version of the manuscript.
References
- Anderson, J.P.; Walker, D.E.; Goldstein, J.M.; et al. Phosphorylation of Ser-129 is the dominant pathological modification of alpha-synuclein in familial and sporadic Lewy body disease. J. Biol. Chem. 2006, 281(40), 29739–52. [Google Scholar] [CrossRef]
- Fujiwara, H.; Hasegawa, M.; Dohmae, N.; et al. alpha-Synuclein is phosphorylated in synucleinopathy lesions. Nat. Cell Biol. 2002, 4(2), 160–4. [Google Scholar] [CrossRef]
- Arlinghaus, R.; Iba, M.; Masliah, E.; et al. Specific Detection of Physiological S129 Phosphorylated alpha-Synuclein in Tissue Using Proximity Ligation Assay. J. Park. Dis. 2023, 13(2), 255–70. [Google Scholar] [CrossRef]
- Killinger, B.A.; Mercado, G.; Choi, S.; et al. Distribution of phosphorylated alpha-synuclein in non-diseased brain implicates olfactory bulb mitral cells in synucleinopathy pathogenesis. npj Park. Dis. 2023, 9(1), 43. [Google Scholar] [CrossRef]
- Ramalingam, N.; Jin, S.X.; Moors, T.E.; et al. Dynamic physiological alpha-synuclein S129 phosphorylation is driven by neuronal activity. npj Park. Dis. 2023, 9(1), 4. [Google Scholar] [CrossRef]
- Parra-Rivas, L.A.; Madhivanan, K.; Aulston, B.D.; et al. Serine-129 phosphorylation of alpha-synuclein is an activity-dependent trigger for physiologic protein-protein interactions and synaptic function. Neuron 2023, 111(24), 4006–23 e10. [Google Scholar] [CrossRef]
- Ramalingam, N.; Haass, C.; Dettmer, U. Physiological roles of alpha-synuclein serine-129 phosphorylation - not an oxymoron. Trends Neurosci. 2024, 47(7), 480–90. [Google Scholar] [CrossRef]
- Viljetic, B.; Blazetic, S.; Labak, I.; et al. Lipid Rafts: The Maestros of Normal Brain Development. Biomolecules 2024, 14(3). [Google Scholar] [CrossRef]
- Warda, M.; Tekin, S.; Gamal, M.; et al. Lipid rafts: novel therapeutic targets for metabolic, neurodegenerative, oncological, and cardiovascular diseases. Lipids Health Dis. 2025, 24(1), 147. [Google Scholar] [CrossRef]
- Perissinotto, F.; Stani, C.; De Cecco, E.; et al. Iron-mediated interaction of alpha synuclein with lipid raft model membranes. Nanoscale 2020, 12(14), 7631–40. [Google Scholar] [CrossRef]
- Ray, S.; Singh, N.; Kumar, R.; et al. alpha-Synuclein aggregation nucleates through liquid-liquid phase separation. Nat. Chem. 2020, 12(8), 705–16. [Google Scholar] [CrossRef]
- Makasewicz, K.; Linse, S.; Sparr, E. Interplay of alpha-synuclein with Lipid Membranes: Cooperative Adsorption, Membrane Remodeling and Coaggregation. JACS Au 2024, 4(4), 1250–62. [Google Scholar] [CrossRef]
- Flores-Leon, M.; Outeiro, T.F. Uncovering the Complexity of Synucleinopathies: An Ongoing Tale Between Proteins and Lipids. Mov. Disord. 2026, 41(3), 581–95. [Google Scholar] [CrossRef]
- Jacquemyn, J.; Marriott, B.; Chang, J.; et al. Glucosylceramide-induced ectosomes propagate pathogenic alpha-synuclein in Parkinson’s disease. Nat. Cell Biol. 2026, 28(3), 492–506. [Google Scholar] [CrossRef]
- Choi, S.G.; Tittle, T.; Garcia-Prada, D.; et al. Alpha-synuclein aggregates are phosphatase resistant. Acta Neuropathol. Commun. 2024, 12(1), 84. [Google Scholar] [CrossRef]
- Liu, Z.; Chan, R.B.; Cai, Z.; et al. alpha-Synuclein-containing erythrocytic extracellular vesicles: essential contributors to hyperactivation of monocytes in Parkinson’s disease. J. Neuroinflammation 2022, 19(1), 53. [Google Scholar] [CrossRef]
- Yang, Y.; Liu, Q.; Zhou, T.; et al. Parkinson’s disease beyond the brain: erythrocyte alpha-synuclein transfer across the blood-brain barrier. Brain 2026. [Google Scholar] [CrossRef]
- Yang, Y.; Nie, X.; Wang, Y.; et al. Evolving insights into erythrocytes in synucleinopathies. Trends Neurosci. 2024, 47(9), 693–707. [Google Scholar] [CrossRef]
- Abd Elhadi, S.; Grigoletto, J.; Poli, M.; et al. alpha-Synuclein in blood cells differentiates Parkinson’s disease from healthy controls. Ann. Clin. Transl. Neurol. 2019, 6(12), 2426–36. [Google Scholar] [CrossRef]
- Li, X.Y.; Li, W.; Li, X.; et al. Alterations of Erythrocytic Phosphorylated Alpha-Synuclein in Different Subtypes and Stages of Parkinson’s Disease. Front Aging Neurosci. 2021, 13, 623977. [Google Scholar] [CrossRef]
- Dong, Y.; Wang, Y.; Chen, K.; et al. Engineering versatile nanoplatforms for calcium homeostasis modulation and broad-spectrum disease therapies. Biomaterials 2026, 333, 124207. [Google Scholar] [CrossRef]
- Cali, T.; Ottolini, D.; Negro, A.; et al. alpha-Synuclein controls mitochondrial calcium homeostasis by enhancing endoplasmic reticulum-mitochondria interactions. J. Biol. Chem. 2012, 287(22), 17914–29. [Google Scholar] [CrossRef]
- Ramezani, M.; Wagenknecht-Wiesner, A.; Wang, T.; et al. Alpha synuclein modulates mitochondrial Ca(2+) uptake from ER during cell stimulation and under stress conditions. npj Park. Dis. 2023, 9(1), 137. [Google Scholar] [CrossRef]
- Arawaka, S.; Sato, H.; Sasaki, A.; et al. Mechanisms underlying extensive Ser129-phosphorylation in alpha-synuclein aggregates. Acta Neuropathol. Commun. 2017, 5(1), 48. [Google Scholar] [CrossRef]
- Jiao, J.; Liu, W.; Gao, G.; et al. Serine-129 phosphorylated alpha-synuclein drives mitochondrial dysfunction and calcium dysregulation in Parkinson’s disease model. Front Aging Neurosci. 2025, 17, 1538166. [Google Scholar] [CrossRef]
- Zhang, Q.; Huang, Y.; Wu, A.; et al. Calcium/calmodulin-dependent serine protein kinase exacerbates mitochondrial calcium uniporter-related mitochondrial calcium overload by phosphorylating alpha-synuclein in Parkinson’s disease. Int. J. Biochem Cell Biol. 2023, 157, 106385. [Google Scholar] [CrossRef]
- Tchung, A.; Even, A.; Trudeau, L.E. Cell-autonomous and non-cell-autonomous drivers of dopamine neuron vulnerability in Parkinson’s disease. Trends Neurosci. 2026, 49(5), 328–43. [Google Scholar] [CrossRef]
- Arbab, S.; Ullah, H.; Han, Y.; et al. Targeting neuroinflammation and neurodegeneration in Parkinson’s disease: Emerging natural and synthetic therapeutic strategies. Ageing Res. Rev. 2026, 121, 103263. [Google Scholar] [CrossRef]
- Wu, Y.; Lyu, W.; Xie, X.; et al. The tango of immune and neural cells: orchestrating neuroinflammation mediated brain disorders. Front Immunol. 2026, 17, 1827437. [Google Scholar] [CrossRef]
- Zhou, L.; Kong, G.; Palmisano, I.; et al. Reversible CD8 T cell-neuron cross-talk causes aging-dependent neuronal regenerative decline. Science 2022, 376(6594), eabd5926. [Google Scholar] [CrossRef]
- Keskin, E.; Gezen-Ak, D.; Dursun, E. Amyloid beta,alpha-Synuclein and Amyloid beta-alpha-Synuclein Combination Exert Significant but Different Alterations in Inflammatory Response Profile in Differentiated Human SH-SY5Y Cells. ACS Omega 2023, 8(48), 45519–34. [Google Scholar] [CrossRef]
- Liu, W.; Lu, Y.; Liu, J.; et al. Bridging the gap: investigating the role of phosphorylation at the serine 129 site of alpha-synuclein in VAPB-PTPIP51 interactions. Acta Neuropathol. Commun. 2025, 13(1), 40. [Google Scholar] [CrossRef]
- Liu, J.; Liu, W.; Lu, Y.; et al. Piperlongumine restores the balance of autophagy and apoptosis by increasing BCL2 phosphorylation in rotenone-induced Parkinson disease models. Autophagy 2018, 14(5), 845–61. [Google Scholar] [CrossRef]
- Wu, K.M.; Xu, Q.H.; Liu, Y.Q.; et al. Neuronal FAM171A2 mediates alpha-synuclein fibril uptake and drives Parkinson’s disease. Science 2025, 387(6736), 892–900. [Google Scholar] [CrossRef]
- Lian, H.; Roy, E.; Zheng, H. Protocol for Primary Microglial Culture Preparation. Bio Protoc. 2016, 6(21). [Google Scholar] [CrossRef]
- Bohlen, C.J.; Bennett, F.C.; Bennett, M.L. Isolation and Culture of Microglia. Curr. Protoc. Immunol. 2019, 125(1), e70. [Google Scholar] [CrossRef]
- Zhang, K.; Wang, Y.; Chen, S.; et al. TREM2(hi) resident macrophages protect the septic heart by maintaining cardiomyocyte homeostasis. Nat. Metab. 2023, 5(1), 129–46. [Google Scholar] [CrossRef]
- Wisniewski, J.R.; Zougman, A.; Nagaraj, N.; et al. Universal sample preparation method for proteome analysis. Nat. Methods 2009, 6(5), 359–62. [Google Scholar] [CrossRef]
- Wang, T.; Liu, W.; Zhang, Q.; et al. 4-Oxo-2-Nonenal- and Agitation-Induced Aggregates of alpha-Synuclein and Phosphorylated alpha-Synuclein with Distinct Biophysical Properties and Biomedical Applications. Cells 2024, 13(9). [Google Scholar] [CrossRef]
- Li, R.; Lu, Y.; Zhang, Q.; et al. Piperine promotes autophagy flux by P2RX4 activation in SNCA/alpha-synuclein-induced Parkinson disease model. Autophagy 2022, 18(3), 559–75. [Google Scholar] [CrossRef]
- Hassanzadeh, K.; Liu, J.; Maddila, S.; et al. Posttranslational Modifications of alpha-Synuclein, Their Therapeutic Potential, and Crosstalk in Health and Neurodegenerative Diseases. Pharmacol. Rev. 2024, 76(6), 1254–90. [Google Scholar] [CrossRef]
- Killinger, B.A.; Marshall, L.L.; Chatterjee, D.; et al. In situ proximity labeling identifies Lewy pathology molecular interactions in the human brain. Proc. Natl. Acad. Sci. U S A 2022, 119(5). [Google Scholar] [CrossRef]
- Rutherford, N.J.; Brooks, M.; Giasson, B.I. Novel antibodies to phosphorylated alpha-synuclein serine 129 and NFL serine 473 demonstrate the close molecular homology of these epitopes. Acta Neuropathol. Commun. 2016, 4(1), 80. [Google Scholar] [CrossRef]
- Lashuel, H.A.; Mahul-Mellier, A.L.; Novello, S.; et al. Revisiting the specificity and ability of phospho-S129 antibodies to capture alpha-synuclein biochemical and pathological diversity. npj Park. Dis. 2022, 8(1), 136. [Google Scholar] [CrossRef]
- Dollar, A.N.; Webb, I.K. Cross-Linking and Covalent Labeling Mass Spectrometry Reveal Proteoform-Driven Conformational Changes in Alpha Synuclein. Anal. Chem. 2026, 98(4), 2765–74. [Google Scholar] [CrossRef]
- Sheng, L.; Stewart, T.; Yang, D.; et al. Erythrocytic alpha-synuclein contained in microvesicles regulates astrocytic glutamate homeostasis: a new perspective on Parkinson’s disease pathogenesis. Acta Neuropathol. Commun. 2020, 8(1), 102. [Google Scholar] [CrossRef]
- Koros, C.; Simitsi, A.M.; Papagiannakis, N.; et al. Peripheral Immune pattern in a genetic cohort of p.A53T alpha-synuclein carriers. Park. Relat. Disord. 2025, 135, 107853. [Google Scholar] [CrossRef]
- Ramalingam, N.; Dettmer, U. alpha-Synuclein serine129 phosphorylation - the physiology of pathology. Mol. Neurodegener. 2023, 18(1), 84. [Google Scholar] [CrossRef]
- Mor, D.E. Keeping neuronal activity in check: a novel role for alpha-synuclein serine-129 phosphorylation in the healthy brain. Trends Biochem Sci. 2024, 49(5), 382–83. [Google Scholar] [CrossRef]
- Pandit, E.; Das, L.; Das, A.K.; et al. Single point mutations at the S129 residue of alpha-synuclein and their effect on structure, aggregation, and neurotoxicity. Front Chem. 2023, 11, 1145877. [Google Scholar] [CrossRef]
- Yahi, N.; Di Scala, C.; Chahinian, H.; et al. Innovative treatment targeting gangliosides aimed at blocking the formation of neurotoxic alpha-synuclein oligomers in Parkinson’s disease. Glycoconj. J. 2022, 39(1), 1–11. [Google Scholar] [CrossRef]
- Zhang, L.; Ma, P.; Guan, Q.; et al. Effect of chemokine CC ligand 2 (CCL2) on alpha-synuclein-induced microglia proliferation and neuronal apoptosis. Mol. Med. Rep. 2018, 18(5), 4213–18. [Google Scholar] [CrossRef]
- Suthar, S.K.; Lee, S.Y. Ingenuity pathway analysis of alpha-synuclein predicts potential signaling pathways, network molecules, biological functions, and its role in neurological diseases. Front Mol. Neurosci. 2022, 15, 1029682. [Google Scholar] [CrossRef]
Figure 1.
IF staining of p-α-syn in the brain of Wt mice. Sagittal sections of Wt mice were prepared and analyzed with p-α-syn antibody (D1R1R, A-D) and p-α-syn antibody (pSyn#64, E-H). Red color indicates p-α-syn staining. Blue color indicates the nucleus. Green color indicates Neun (Marker of neuron, A-D) and GFAP (Marker of astrocytes, E-H). White dashed squares, amplified area of brain section under low magnification. 1-Olfactory bulb, 2-Cortex, 3-Striatum, 4-Hippocampus, 5-Midbrain, 6-Cerebellum. Scale bar, 2 mm (low magnification) and 200 μm (high magnification). The age of Wt mice: 6 months.
Figure 1.
IF staining of p-α-syn in the brain of Wt mice. Sagittal sections of Wt mice were prepared and analyzed with p-α-syn antibody (D1R1R, A-D) and p-α-syn antibody (pSyn#64, E-H). Red color indicates p-α-syn staining. Blue color indicates the nucleus. Green color indicates Neun (Marker of neuron, A-D) and GFAP (Marker of astrocytes, E-H). White dashed squares, amplified area of brain section under low magnification. 1-Olfactory bulb, 2-Cortex, 3-Striatum, 4-Hippocampus, 5-Midbrain, 6-Cerebellum. Scale bar, 2 mm (low magnification) and 200 μm (high magnification). The age of Wt mice: 6 months.
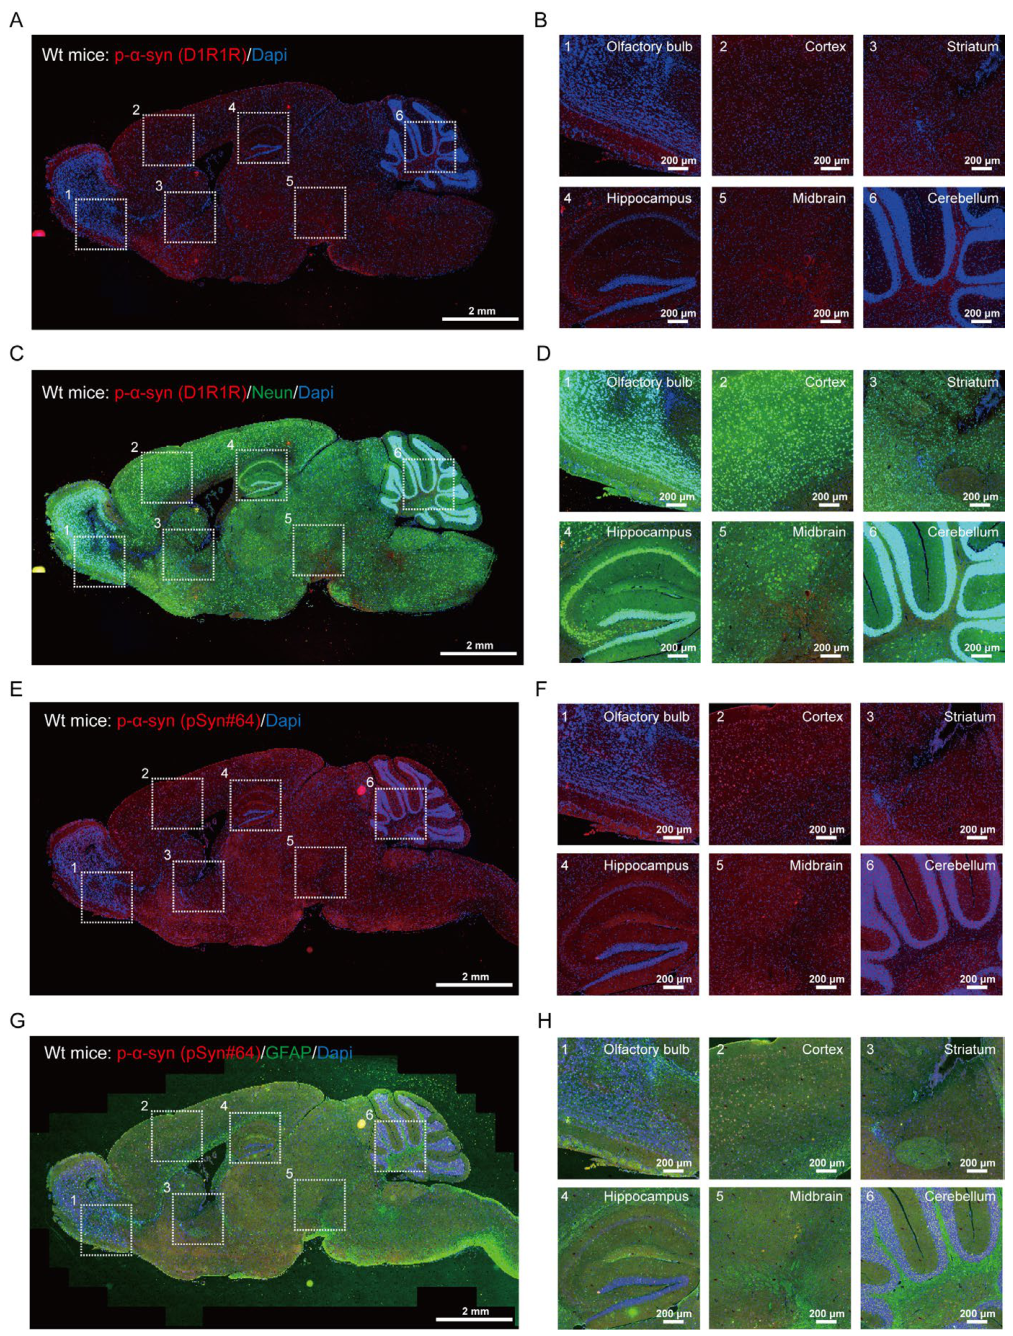
Figure 2.
p-α-syn is present in both cytosolic and lipid raft fractions isolated from the midbrain of Wt mice. A. A flowchart showing the experimental procedures for extracting the cytosolic and lipid raft fractions from the midbrain of Wt mice using the ULTRARIPA® kit, which consists of two types of detergent-containing buffers, can efficiently and rapidly extract membrane proteins/membrane-associated proteins enriched in lipid rafts with native structure and native function. B. WB analysis of protein expression and relative expression levels of p-α-syn, h-α-syn, Flotillin, Snap25 in A/B buffer-soluble fractions isolated from the midbrain of Wt/Tg mice (Wt/Tg-1/2/3). n = 3. C. WB analysis of protein expression and relative expression levels of p-α-syn in A/B buffer-soluble fractions isolated from the midbrain of Wt mice (Wt-4/5/6/7). n = 4. D. WB analysis of proteins immunoprecipitated with p-α-syn antibody in the mixture midbrain samples from 4 Wt mice (Wt-4/5/6/7). E-F. Identification of p-α-syn interacting proteins in A/B buffer-soluble fractions isolated from the midbrain of Wt mice through LC-MS/MS. E. Proteins identified with a minimum of 1 unique peptide (Peptides 95% ≥ 1) were included in analyses (Table. S1, Table. S2). F. Venn diagrams displaying the degree of overlap in numbers of proteins which differentially interacted with p-α-syn in the cytosolic fraction of Wt mice (Peptides 95% ≥ 1, includes 70 proteins) and Tg mice (includes 225 proteins). The midbrain homogenates were derived from 6-month-old Wt mice and 12-month-old Tg mice. Normal rabbit IgG served as the negative control.
Figure 2.
p-α-syn is present in both cytosolic and lipid raft fractions isolated from the midbrain of Wt mice. A. A flowchart showing the experimental procedures for extracting the cytosolic and lipid raft fractions from the midbrain of Wt mice using the ULTRARIPA® kit, which consists of two types of detergent-containing buffers, can efficiently and rapidly extract membrane proteins/membrane-associated proteins enriched in lipid rafts with native structure and native function. B. WB analysis of protein expression and relative expression levels of p-α-syn, h-α-syn, Flotillin, Snap25 in A/B buffer-soluble fractions isolated from the midbrain of Wt/Tg mice (Wt/Tg-1/2/3). n = 3. C. WB analysis of protein expression and relative expression levels of p-α-syn in A/B buffer-soluble fractions isolated from the midbrain of Wt mice (Wt-4/5/6/7). n = 4. D. WB analysis of proteins immunoprecipitated with p-α-syn antibody in the mixture midbrain samples from 4 Wt mice (Wt-4/5/6/7). E-F. Identification of p-α-syn interacting proteins in A/B buffer-soluble fractions isolated from the midbrain of Wt mice through LC-MS/MS. E. Proteins identified with a minimum of 1 unique peptide (Peptides 95% ≥ 1) were included in analyses (Table. S1, Table. S2). F. Venn diagrams displaying the degree of overlap in numbers of proteins which differentially interacted with p-α-syn in the cytosolic fraction of Wt mice (Peptides 95% ≥ 1, includes 70 proteins) and Tg mice (includes 225 proteins). The midbrain homogenates were derived from 6-month-old Wt mice and 12-month-old Tg mice. Normal rabbit IgG served as the negative control.
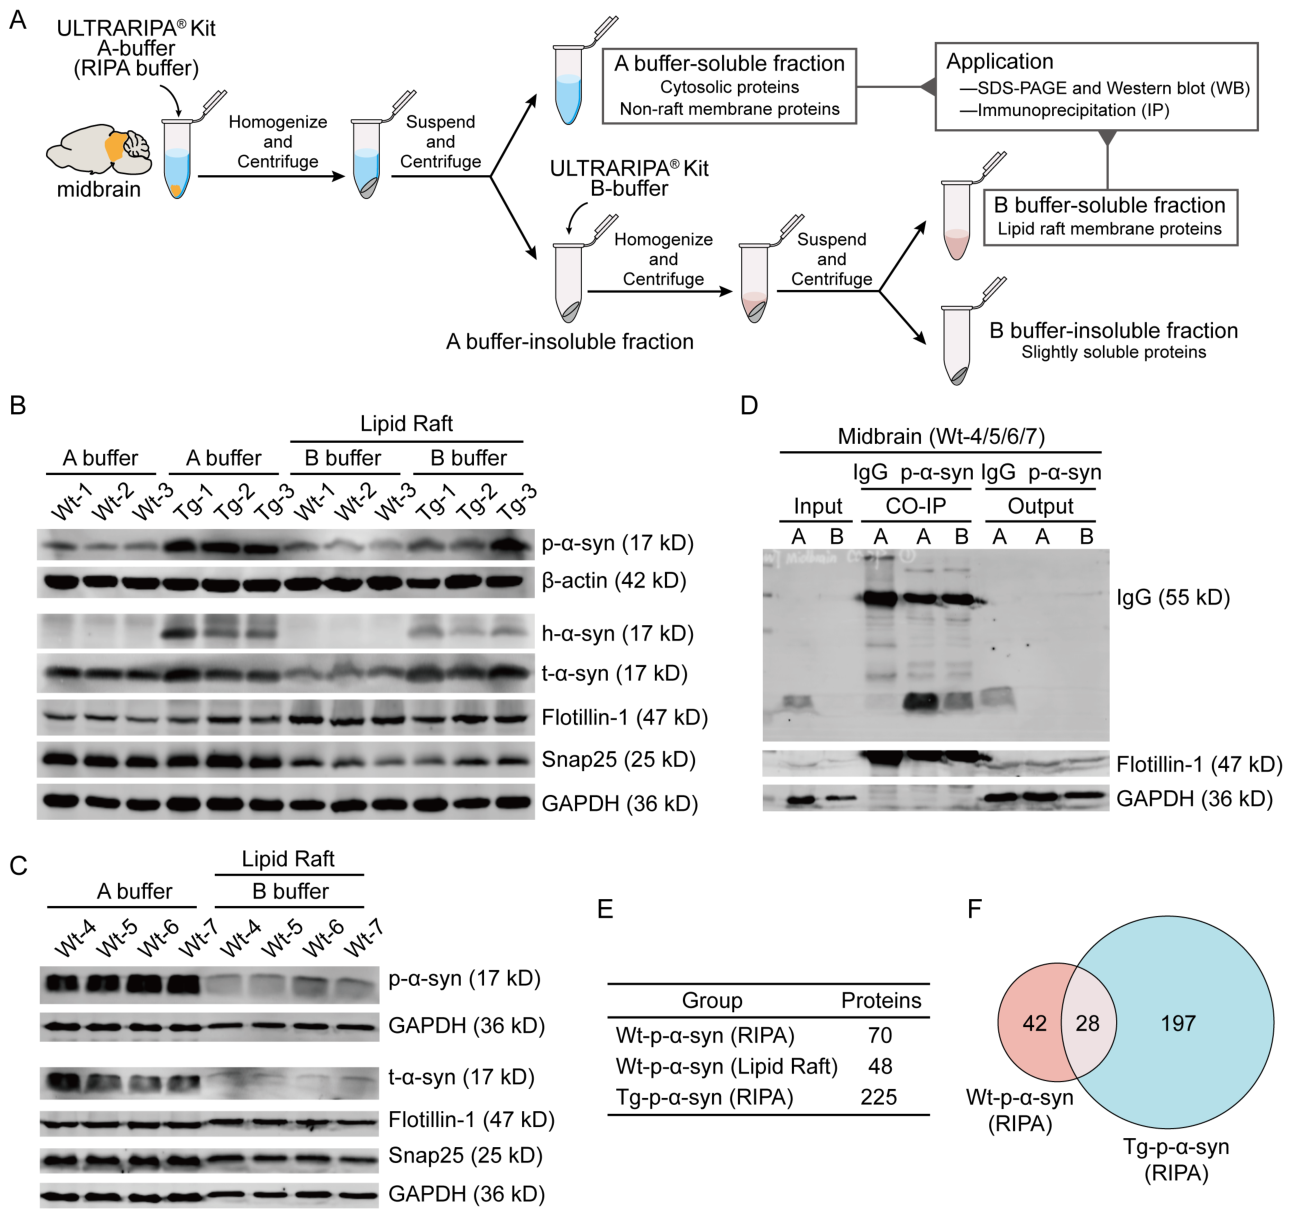
Figure 3.
GO analysis of p-α-syn interacting proteins in the cytosolic and lipid raft fractions isolated from the midbrain of Wt mice. p-α-syn interacting proteins in A buffer-soluble fraction (RIPA, includes 70 proteins) and B buffer-soluble fraction (Lipid Raft, includes 48 proteins) identified through LC-MS/MS were uploaded to DAVID to perform GO analysis. The top 10 GO terms in the BP (A, D), MF (B, E), and CC (C, F) are listed. A-C. GO analysis of p-α-syn interacting proteins in A buffer-soluble fraction. D-F. GO analysis of p-α-syn interacting proteins in B buffer-soluble fraction. The black and red numbers on the right indicate the percentage of the genes represented in the enriched pathway to the total number of genes in the pathway in the Wt and Tg groups, respectively.
Figure 3.
GO analysis of p-α-syn interacting proteins in the cytosolic and lipid raft fractions isolated from the midbrain of Wt mice. p-α-syn interacting proteins in A buffer-soluble fraction (RIPA, includes 70 proteins) and B buffer-soluble fraction (Lipid Raft, includes 48 proteins) identified through LC-MS/MS were uploaded to DAVID to perform GO analysis. The top 10 GO terms in the BP (A, D), MF (B, E), and CC (C, F) are listed. A-C. GO analysis of p-α-syn interacting proteins in A buffer-soluble fraction. D-F. GO analysis of p-α-syn interacting proteins in B buffer-soluble fraction. The black and red numbers on the right indicate the percentage of the genes represented in the enriched pathway to the total number of genes in the pathway in the Wt and Tg groups, respectively.
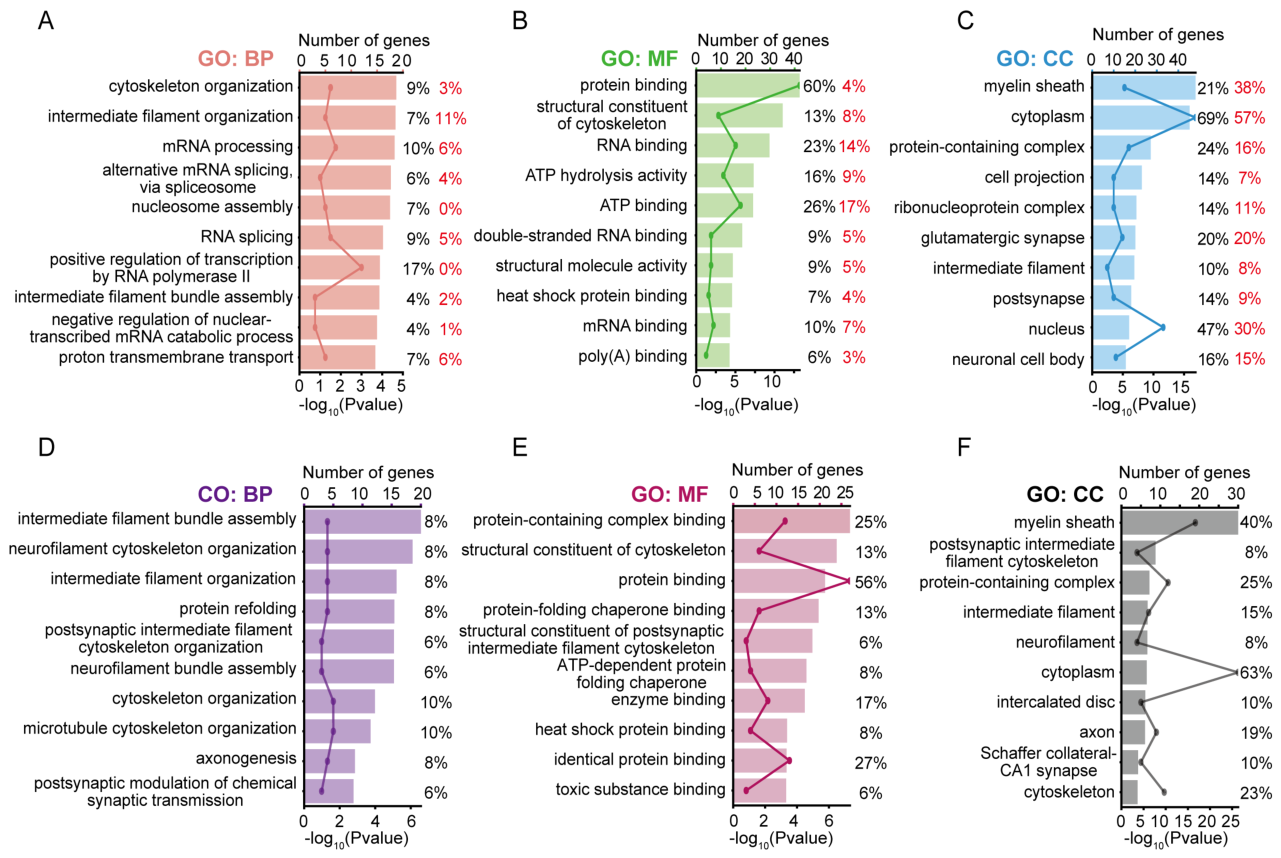
Figure 4.
p-α-syn is present in both cytosolic and lipid raft fractions isolated from the peripheral blood cells of Wt mice. A. IF staining of p-α-syn in the blood-brain barrier (BBB) of the midbrain tissue from Wt mice. Red color indicates p-α-syn staining (pSyn#64). Green color indicates GFAP. Gray color indicates Lectin. Blue color indicates the nucleus. White squares, amplified area of midbrain section under low magnification. Scale bar, 50 μm (low magnification) and 10 μm (high magnification). B. WB analysis of protein expression and relative expression levels of h-α-syn and t-α-syn in midbrains of KO/Wt/Tg mice. C. WB analysis of protein expression and relative expression levels of t-α-syn in blood cells of KO/Wt/Tg mice. 200 ng recombinant p-α-syn and h-α-syn proteins were used as positive controls. D. A flowchart showing the experimental procedures for extracting soluble and insoluble components from blood cells of Wt mice using the ULTRARIPA® kit. E. WB analysis of protein expression and relative expression levels of p-α-syn in A buffer-soluble fractions and B buffer-soluble fractions in blood cells of Wt mice. F. WB analysis of proteins immunoprecipitated with p-α-syn antibody in the mixture of blood cell samples from 4 Wt mice (Wt-4/5/6/7). p-α-syn was analyzed with p-α-syn antibody (D1R1R). The age of KO/Wt mice: 6 months. The age of Tg mice: 12 months.
Figure 4.
p-α-syn is present in both cytosolic and lipid raft fractions isolated from the peripheral blood cells of Wt mice. A. IF staining of p-α-syn in the blood-brain barrier (BBB) of the midbrain tissue from Wt mice. Red color indicates p-α-syn staining (pSyn#64). Green color indicates GFAP. Gray color indicates Lectin. Blue color indicates the nucleus. White squares, amplified area of midbrain section under low magnification. Scale bar, 50 μm (low magnification) and 10 μm (high magnification). B. WB analysis of protein expression and relative expression levels of h-α-syn and t-α-syn in midbrains of KO/Wt/Tg mice. C. WB analysis of protein expression and relative expression levels of t-α-syn in blood cells of KO/Wt/Tg mice. 200 ng recombinant p-α-syn and h-α-syn proteins were used as positive controls. D. A flowchart showing the experimental procedures for extracting soluble and insoluble components from blood cells of Wt mice using the ULTRARIPA® kit. E. WB analysis of protein expression and relative expression levels of p-α-syn in A buffer-soluble fractions and B buffer-soluble fractions in blood cells of Wt mice. F. WB analysis of proteins immunoprecipitated with p-α-syn antibody in the mixture of blood cell samples from 4 Wt mice (Wt-4/5/6/7). p-α-syn was analyzed with p-α-syn antibody (D1R1R). The age of KO/Wt mice: 6 months. The age of Tg mice: 12 months.
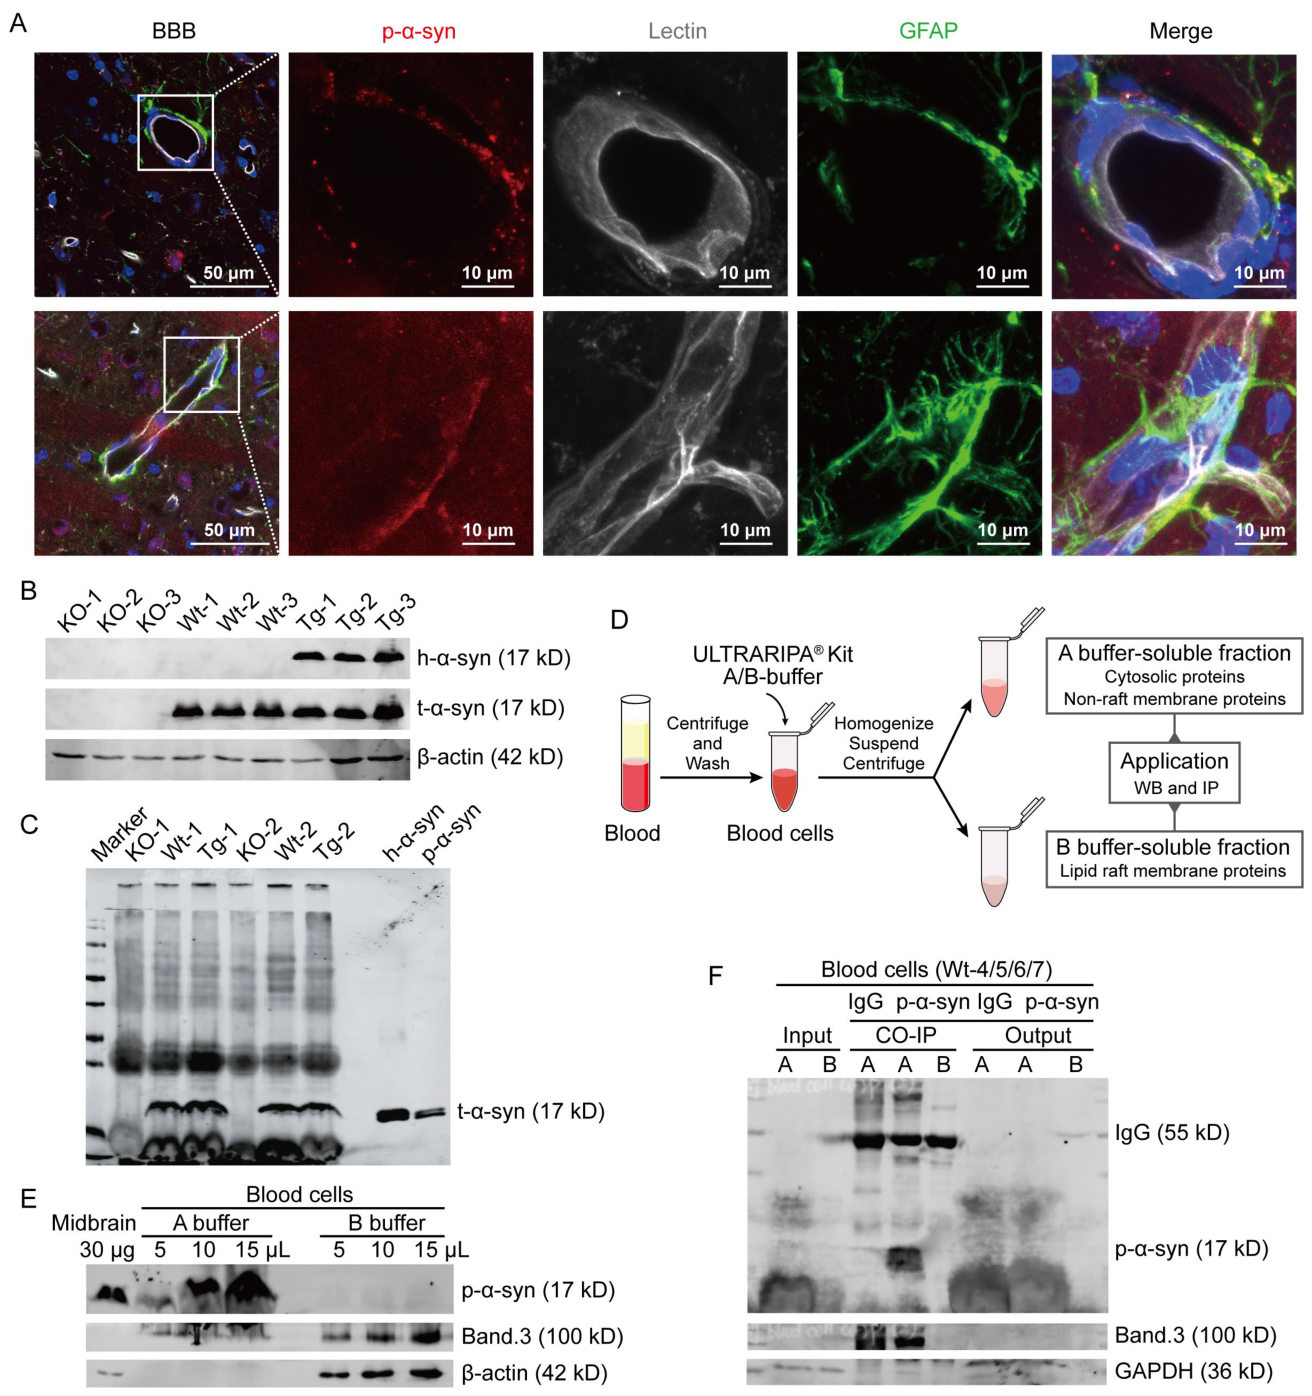
Figure 5.
Inhibition of p-α-syn did not alleviate cytotoxicity or regulate cellular calcium ion homeostasis. A. Representative Incucyte images of SHSY5Y cells, transiently transfected with 2/3 μg myc/myc-h-α-syn/myc-S129A expression plasmids for 48 h. B. Quantitative analysis of the cell viability of SHSY5Y examined by CCK8 Kit. The results are expressed as the mean ± SEM (Two-way ANOVA, Sidak’s multiple comparisons test). n = 7-8 (2 μg), n = 16 (3 μg). C. Representative Incucyte images of primary neurons, infected with LV-Con/SNCA/S129A for 7 days. Rhod-2 AM determined mitochondrial calcium through red fluorescence. Neurons were treated with 2-APB for 24 h and preincubated with CaUp (500X) for 30 min. Scale bar, 100 μm. D. Quantitative analysis of the cell viability of neurons examined by CCK8 Kit. E. Signal values in C-well. F. Statistical analysis of the relative Rhod-2AM mitochondrial calcium concentration per cell. The results (D-F) are expressed as the mean ± SEM (One-way ANOVA, Tukey’s multiple comparisons test). n = 12-25 (D), n = 5-26 (E), n = 16-26 (F). ***P < 0.001 vs. Con. ****P < 0.0001 vs. Con. #P < 0.05 vs. SNCA.
Figure 5.
Inhibition of p-α-syn did not alleviate cytotoxicity or regulate cellular calcium ion homeostasis. A. Representative Incucyte images of SHSY5Y cells, transiently transfected with 2/3 μg myc/myc-h-α-syn/myc-S129A expression plasmids for 48 h. B. Quantitative analysis of the cell viability of SHSY5Y examined by CCK8 Kit. The results are expressed as the mean ± SEM (Two-way ANOVA, Sidak’s multiple comparisons test). n = 7-8 (2 μg), n = 16 (3 μg). C. Representative Incucyte images of primary neurons, infected with LV-Con/SNCA/S129A for 7 days. Rhod-2 AM determined mitochondrial calcium through red fluorescence. Neurons were treated with 2-APB for 24 h and preincubated with CaUp (500X) for 30 min. Scale bar, 100 μm. D. Quantitative analysis of the cell viability of neurons examined by CCK8 Kit. E. Signal values in C-well. F. Statistical analysis of the relative Rhod-2AM mitochondrial calcium concentration per cell. The results (D-F) are expressed as the mean ± SEM (One-way ANOVA, Tukey’s multiple comparisons test). n = 12-25 (D), n = 5-26 (E), n = 16-26 (F). ***P < 0.001 vs. Con. ****P < 0.0001 vs. Con. #P < 0.05 vs. SNCA.
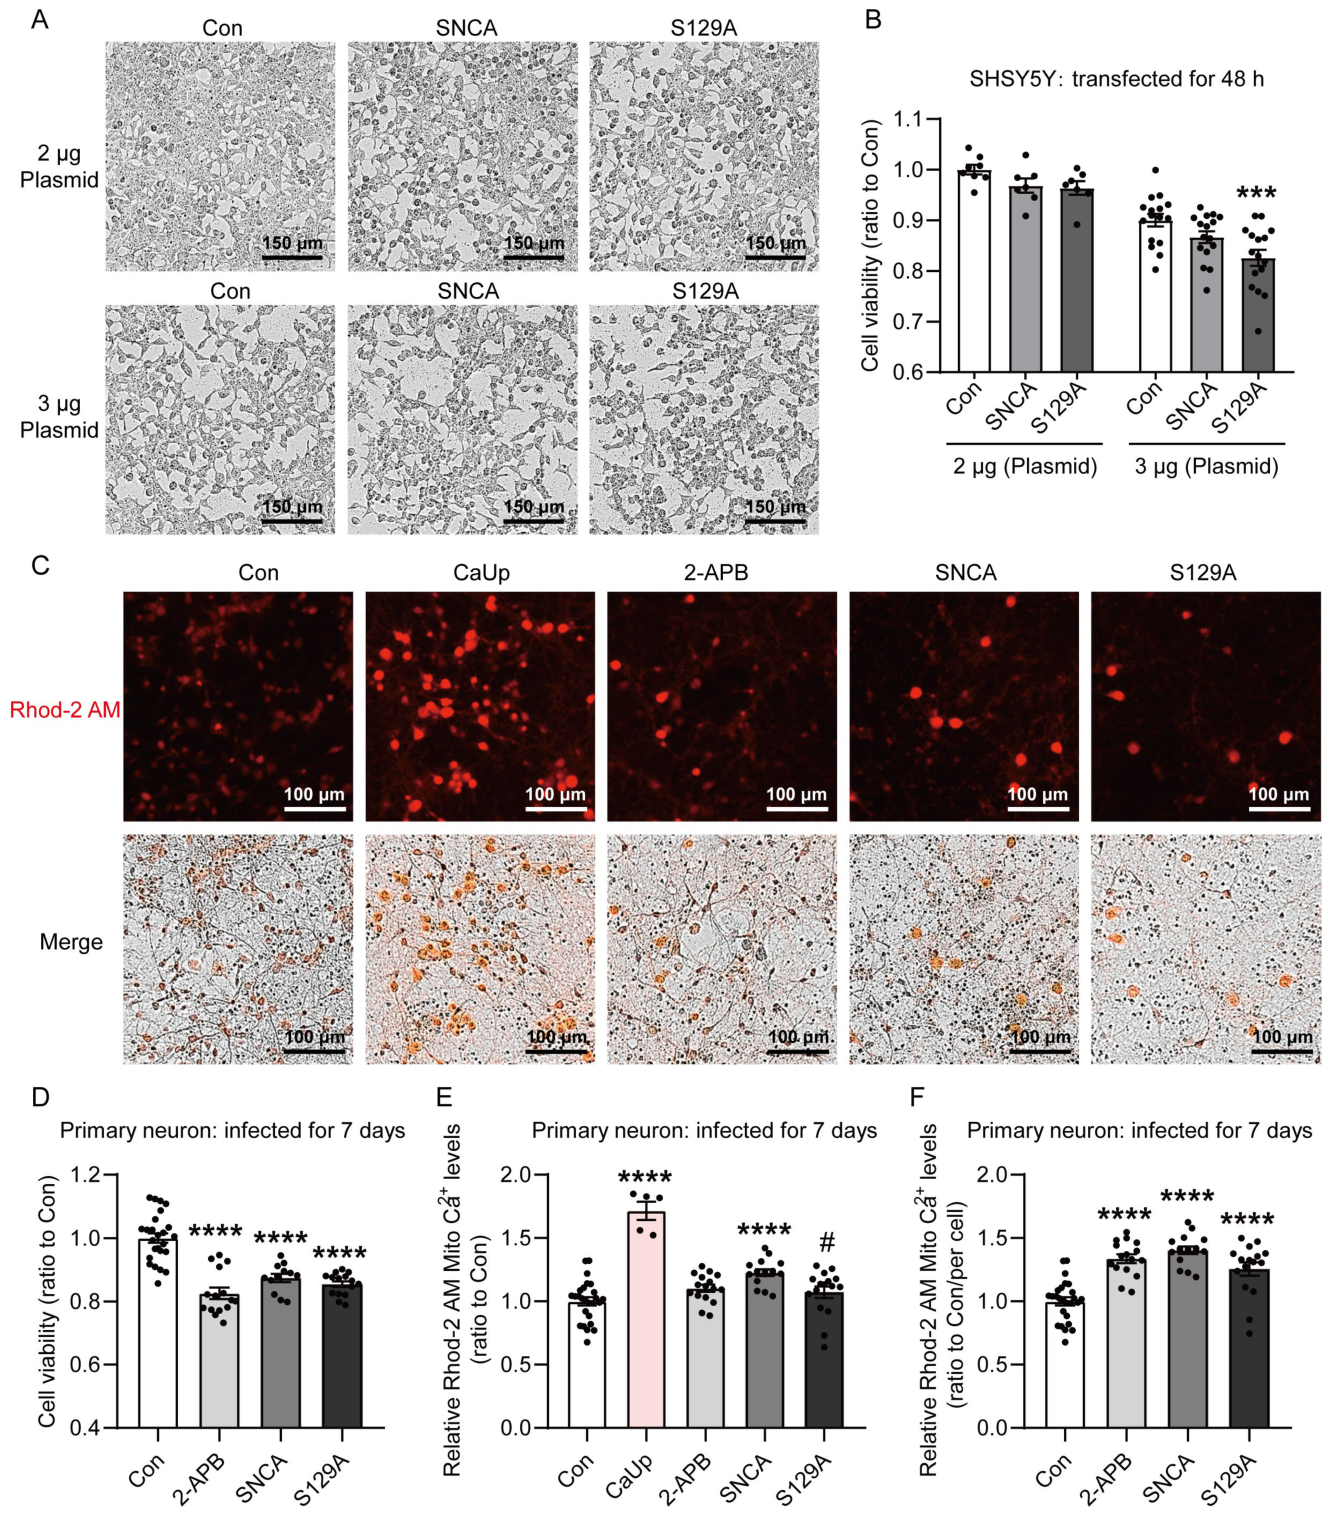
Figure 6.
Transcriptome sequencing analysis of mRNA expressions in primary neurons of mice infected with LV-Con/SNCA/S129A. Primary neurons of mice were infected with LV-Con/SNCA/S129A for 4 days. A. Computational workflow for transcriptome sequencing analysis of mRNA expression. B. WB analysis of protein expression and relative expression levels of p-α-syn and h-α-syn in neurons. C. PCA of RNA-seq data from neurons. D. The number of DEGs among Con, SNCA, and S129A groups from RNA-seq data. E. Heat map diagram based on DEGs in D.
Figure 6.
Transcriptome sequencing analysis of mRNA expressions in primary neurons of mice infected with LV-Con/SNCA/S129A. Primary neurons of mice were infected with LV-Con/SNCA/S129A for 4 days. A. Computational workflow for transcriptome sequencing analysis of mRNA expression. B. WB analysis of protein expression and relative expression levels of p-α-syn and h-α-syn in neurons. C. PCA of RNA-seq data from neurons. D. The number of DEGs among Con, SNCA, and S129A groups from RNA-seq data. E. Heat map diagram based on DEGs in D.
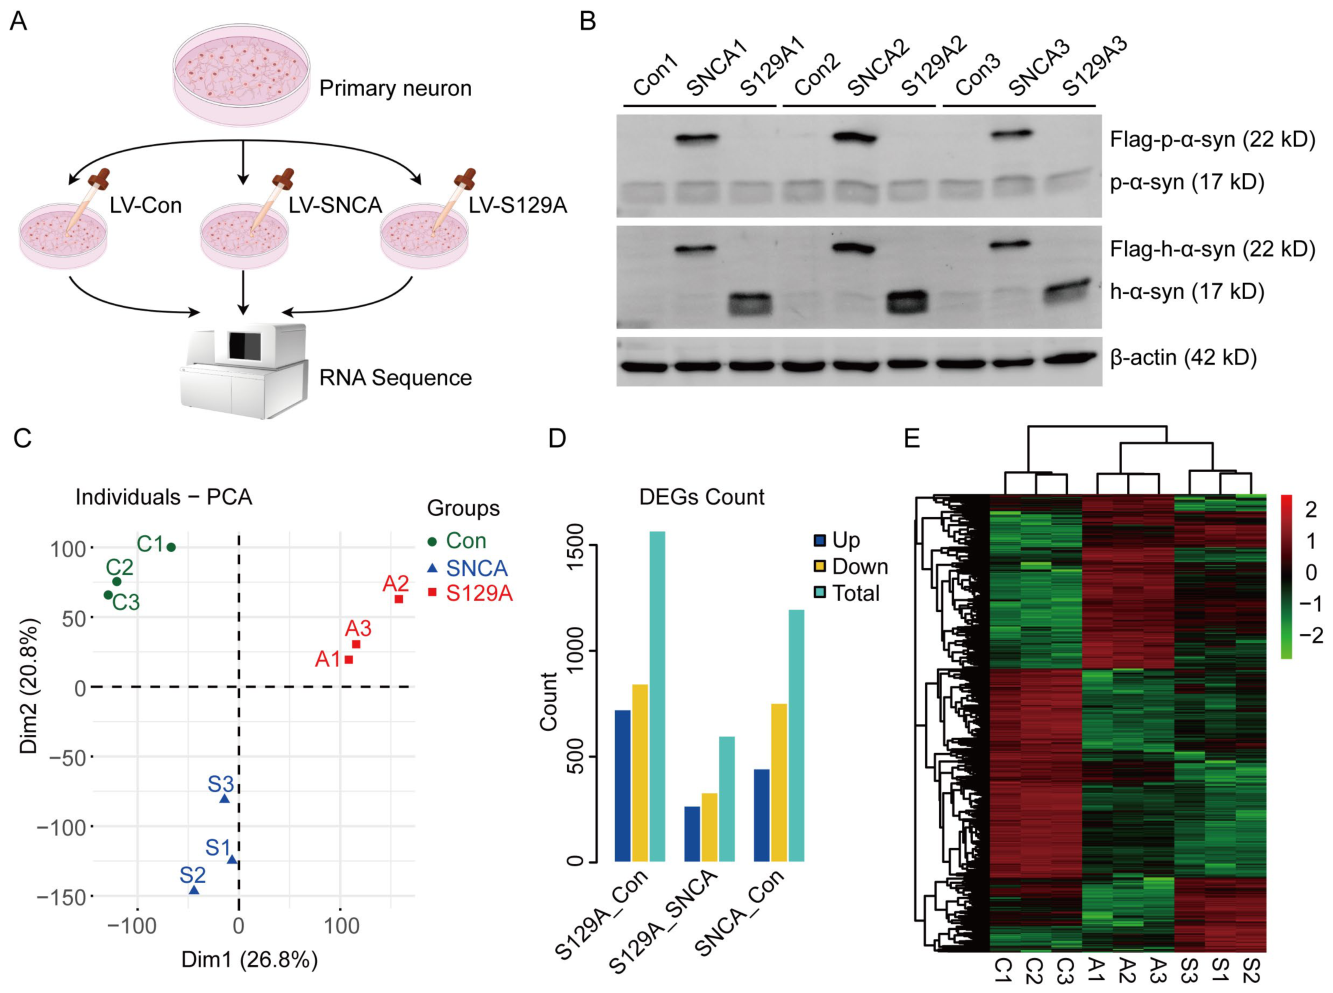
Figure 7.
GO and KEGG pathway analysis of RNA-seq data. A. Venn diagram showing cumulative gene alterations identified from RNA-seq data in Con vs. SNCA and SNCA vs. S129A groups. 183 DEGs of interest were uploaded to DAVID to perform GO analysis and KEGG pathway enrichment (B-E). The top 10 GO terms in the MF (B), BP (C), CC (D), and KEGG signaling pathways (E) are listed.
Figure 7.
GO and KEGG pathway analysis of RNA-seq data. A. Venn diagram showing cumulative gene alterations identified from RNA-seq data in Con vs. SNCA and SNCA vs. S129A groups. 183 DEGs of interest were uploaded to DAVID to perform GO analysis and KEGG pathway enrichment (B-E). The top 10 GO terms in the MF (B), BP (C), CC (D), and KEGG signaling pathways (E) are listed.
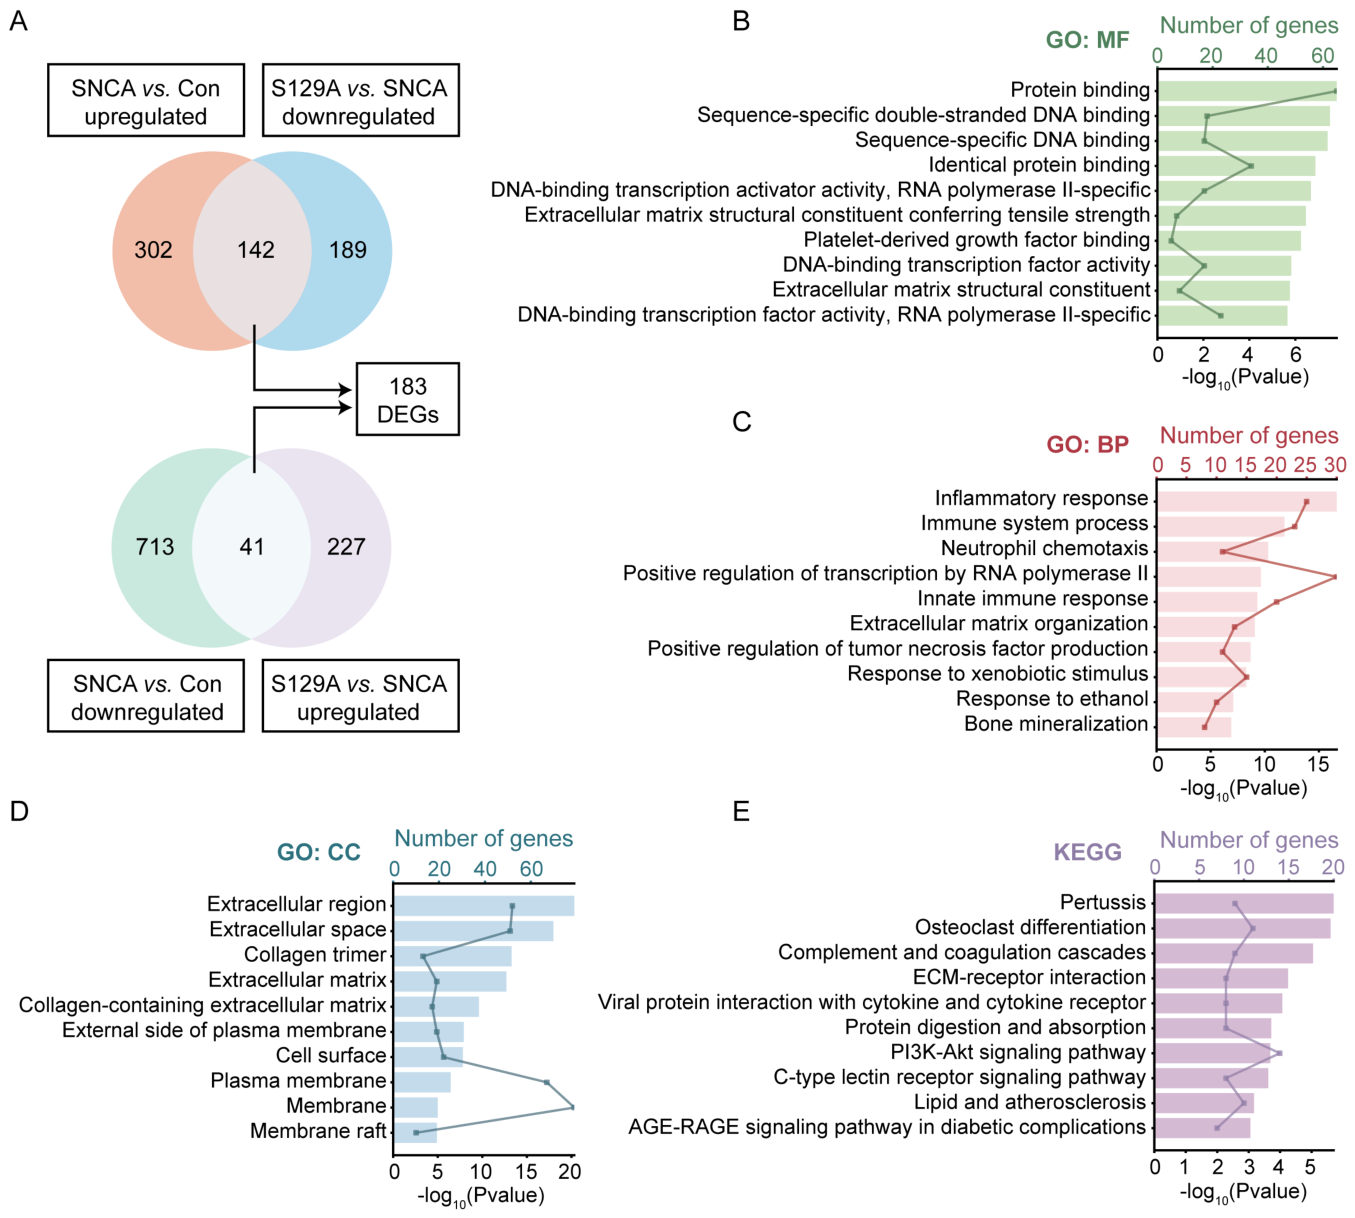
Figure 8.
Detection of immune-inflammatory-related protein secretion and gene expression patterns in LV-Con/SNCA/S129A infected primary neurons. A. Computational workflow for quantitative measurement of 20 mouse cytokines in the supernatant of primary neurons infected with LV-Con/SNCA/S129A for 4 days. B-E. The protein levels of IL-13, CXCL1, CCL2, and CCL5 in the supernatant of primary neurons. F-I. The transcript abundance data (FPKM) of IL-13, CXCL1, CCL2, and CCL5 in primary neurons. The results are expressed as the mean ± SEM (One-way ANOVA, Tukey’s multiple comparisons test). n = 3. *P < 0.05 vs. Con. **P < 0.01 vs. Con. ##P < 0.01 vs. SNCA.
Figure 8.
Detection of immune-inflammatory-related protein secretion and gene expression patterns in LV-Con/SNCA/S129A infected primary neurons. A. Computational workflow for quantitative measurement of 20 mouse cytokines in the supernatant of primary neurons infected with LV-Con/SNCA/S129A for 4 days. B-E. The protein levels of IL-13, CXCL1, CCL2, and CCL5 in the supernatant of primary neurons. F-I. The transcript abundance data (FPKM) of IL-13, CXCL1, CCL2, and CCL5 in primary neurons. The results are expressed as the mean ± SEM (One-way ANOVA, Tukey’s multiple comparisons test). n = 3. *P < 0.05 vs. Con. **P < 0.01 vs. Con. ##P < 0.01 vs. SNCA.
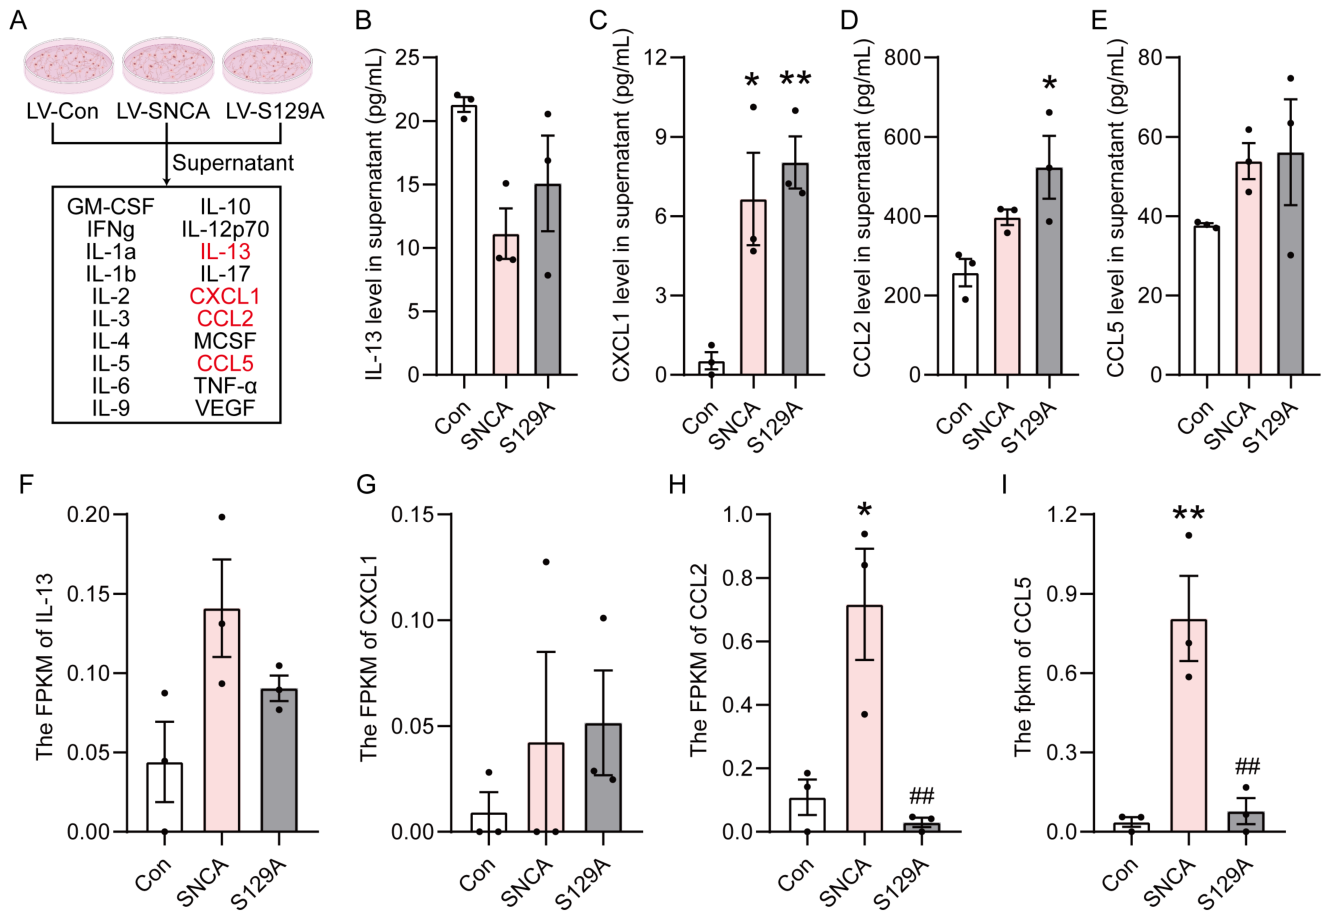
Disclaimer/Publisher’s Note: The statements, opinions and data contained in all publications are solely those of the individual author(s) and contributor(s) and not of MDPI and/or the editor(s). MDPI and/or the editor(s) disclaim responsibility for any injury to people or property resulting from any ideas, methods, instructions or products referred to in the content. |
© 2026 by the authors. Licensee MDPI, Basel, Switzerland. This article is an open access article distributed under the terms and conditions of the Creative Commons Attribution (CC BY) license.
Copyright: This open access article is published under a Creative Commons CC BY 4.0 license, which permit the free download, distribution, and reuse, provided that the author and preprint are cited in any reuse.