

Submitted:
12 October 2026
Posted:
13 October 2026
You are already at the latest version
Abstract
Venus flytrap (Dionaea muscipula) trap closure is a discrete, energetically costly commitment that requires two action potentials (APs) within a memory window. A threshold-product model, R = Φ·(A·D·C) ≥ θ, was previously applied to this system (Rahman, 2026a) and then frozen with parameters in an unpublished pre-registration, including a slow inactivation gate (recovery constant τ_φ0 = 8 s) that vetoes a second AP arriving within 4.6 s of the first. Here the frozen model is tested against trial-level data from Burri et al. (2020) and against values reported in more than a dozen further studies. In the raw voltage traces of closing events, the two APs were separated by 0.98 s (single slow deflection) and approximately 0.75–1.1 s (double deflection), and both traps closed. This bounds τ_φ0 at 1.7 s or less and falsifies the frozen veto boundary. In 31 matched fail/succeed pairs of single deflections, the AP threshold in angular-displacement × angular-velocity space was a bounded window: a model with a velocity window ranked 29 of 31 pairs correctly under leave-one-out, against 22 for a power-law product and 9 for an additive rule. All six traps that failed at fast velocity (1.4–6.5 rad/s) fired when velocity was halved at equal or larger displacement, which no rule monotone in both factors permits. Across studies, the calcium memory constant converged (30–40 s), while reported two-touch windows ranged from 16 to 50 s. Digitized temperature data (Molis et al., 2006) fit a single calcium memory with τ = 32 s at 20 °C and Q10 = 1.64, and show that the memory is partly local to the touched hair. Counts of stimuli to closure at intervals up to 20 min (Brown, 1916) require a second, slow component with a time constant of hours. A revised model, frozen before independent calcium-imaging data (Suda et al., 2020) were examined, predicted a two-stimulus closure window of 13.5 s; the measured 50% closure duration was 30.9 s (95% CI 21.4–45.4 s), which locates the failure in a closure threshold imported from another preparation. Two independent trigger-hair transcriptomes over-express CYP710A1, which converts sitosterol to stigmasterol, so any sterol-dependent gate is more likely in the sensor than across the trap. Because stigmasterol also activates the H⁺-ATPase, such a gate would act on drive as well as on Φ. A flat-lobed mutant (DYSCALCULIA) shows that a deficit in A can be offset by more APs, but it cannot separate a product from a sum. The data support conjunctive gating with vetoes at both edges of the stimulus window and a fast baseline recovery gate. The multiplicative A·D·C product and a sterol-dependent Φ remain untested; six experiments are specified with kill conditions and sample sizes, including a factorial with independent measurement of drive and sterol analysis of the trigger hair.
Keywords:
Dionaea muscipula
; action potential
; refractory period
; threshold
; conjunctive gating
; electromechanical model
; trigger hair
; phytosterols
; ARCH × Φ
Introduction
Many biological systems commit to discrete, costly actions only when several conditions hold at once. The ARCH × Φ framework states this as a threshold on a product, R = Φ·(A·D·C) ≥ θ, where A is the executing architecture, D the drive or energetic supply, C the triggering context and Φ a permissive field (Rahman, Zorumski & Meloy, 2025; Rahman & Zorumski, 2026). Two properties follow from the product form and are testable: a zero-term veto, in which any term at zero abolishes execution, and multiplicative integration, in which a partial deficit in one term is compensated in inverse proportion by another.
The framework has been applied across levels of organization and across kingdoms: to DNA replication initiation (Rahman, 2025), Venus flytrap closure (Rahman, 2026a), protandrous sex change in clownfish (Rahman, 2026b), filial imprinting in the domestic chick (Rahman, 2026c), and mating and maternal behavior in the female rat (Rahman & Zorumski, in press), with the sterol pathways proposed to implement Φ reviewed across systems by Rahman and Zorumski (2026). The flytrap offers public trial-level data, so a parameterized version of the model can be frozen and scored against measurements it was not built from. This paper is that test.
The Venus flytrap is a tractable test system. Closure is binary, fast and costly: a trap closed without prey reopens only after 16–44 h (Durak et al., 2022), and charge-induced closure can be repeated only 2–3 times per trap (Volkov et al., 2009). Closure normally requires two APs within about 30 s (Hedrich & Neher, 2018). Each term has a candidate physical implementer: the snap-buckling lobe geometry (A), H⁺-ATPase–maintained electrochemical drive (D), the trigger-hair receptor potential and its calcium memory (C), and the trap-wide excitability that governs a second AP (Φ) (Scherzer et al., 2022; Armada-Moreira et al., 2023).
A previous correspondence mapped the four terms onto flytrap physiology, with Φ defined as Phase: the permissive interval of about 20 s within which a second stimulus summates (Rahman, 2026a). An unpublished pre-registration by the author then parameterized that mapping and froze it before testing, implementing Φ as a slow inactivation gate on the AP calcium current. The frozen model makes specific, falsifiable predictions about AP timing and about how stimulus features combine. Burri et al. (2020) later deposited trial-level mechanical and electrical data from 21 double-deflection and 31 single-deflection experiments, together with voltage traces of closing events. This paper confronts the frozen model with those data and with values reported across the flytrap literature. It asks which predictions survive, which fail, and what experiment would decide the claims that published data cannot reach.
Frozen Model and Pre-Specified Predictions
The frozen model (the author’s unpublished pre-registration, version 5) was fixed before any of the data below were examined, and no parameter was refit here. It has two layers.
The context layer is a leaky calcium integrator. Each AP adds one unit of cytosolic calcium, which decays with time constant τ_Ca = 30 s. Closure occurs when the summed calcium reaches θ_Ca = 1 + e^(−1) ≈ 1.368 units, so two APs close the trap if they fall within 30 s of each other.
The permissive layer is a slow inactivation gate on the AP calcium current, written in Hodgkin–Huxley form as I_Ca = g_Ca · m · h · h_slow · (V − E_Ca). After an AP, h_slow falls to h_post = 0.02 and recovers as h_slow(t) = 1 − (1 − h_post) · exp(−t · Φ / τ_φ0), with τ_φ0 = 8 s. A second AP can fire only when h_slow exceeds h_crit = 0.45. The veto boundary is therefore t_veto = τ_φ0 / Φ · ln[(1 − h_post) / (1 − h_crit)], which equals 4.62 s at Φ = 1.
Four predictions follow and were tested.
| Prediction | Frozen value | Data used |
| P1. A second AP within t_veto of the first is vetoed, so the trap cannot close | t_veto = 4.62 s at Φ = 1 | Burri S1 voltage traces; reported minimum AP spacing |
| P2. Stimulus features combine as a product at the AP threshold (the framework’s integration rule applied within C) | Iso-threshold contour hyperbolic (log-linear) | Burri S1 single-deflection pairs |
| P3. No closure at any stimulus count when intervals exceed the integrator limit | No closure for intervals above ~31 s | Reported long-interval summation |
| P4. Within the 5–30 s band, responses to a second stimulus improve with interval as h_slow recovers | Gate availability rises from 0.48 at 5 s to 0.98 at 30 s | Reported second-AP propagation and closure latency |
Data and Methods
Primary data. S1 Data of Burri et al. (2020) was obtained from the article’s supporting information. All experiments were done in vivo at 19–21 °C on intact, well-watered plants, with a 2-min wait between deflections. Three sheets were used: voltage traces of closing events (Figure 1C, double deflection; Figs 4C and 4D, single slow deflections; sampling interval about 0.017 s), the 31 single-deflection fail/succeed pairs (Figure 4B), and the 21 double-deflection thresholds (Figure 1D).
AP timing. APs were located as sharp voltage transients that coincided with, or followed, a hair deflection. Each AP was timed at its extremum within a manually set window. Inter-AP interval was the difference between the two extrema. In Figure 1C the second AP rides on the repolarization of the first, so its timing is reported as a range bounded by the extremum and the onset of the second deflection.
Threshold rule. Each Figure 4B pair contains a non-triggering deflection and the triggering deflection that followed it on the same trap. Three rules for the AP threshold were compared, each as a logistic model of displacement θ (rad) and angular velocity ω (rad/s):
- Additive: linear in θ and ω.
- Product (power law): linear in ln θ and ln ω, which contains the pure product θ·ω as a special case.
- Velocity window: the product model plus a (ln ω)² term, which allows the threshold to rise again at high velocity.
Models were fit as conditional logistic regressions on within-pair differences, which removes trap-level variation, and compared by leave-one-pair-out log-likelihood and by the number of held-out pairs ranked correctly. Unconditional fits gave AIC as a secondary criterion. The relation between threshold displacement and velocity in double deflections was summarized by Spearman correlation.
Literature values. Reported quantities were taken from full texts: calcium decay constants (Suda et al., 2020; Scherzer et al., 2022), the electromechanical model parameters (Burri et al., 2020), charge thresholds and inhibitor effects (Volkov et al., 2008a, 2008b, 2009), minimum AP spacing (Volkov et al., 2007, 2009), second-AP propagation and latency (Armada-Moreira et al., 2023), stimulus-count windows (Böhm et al., 2016), and long-interval summation (Brown, 1916, Tables VII–VIII, read in the original).
Out-of-sample test. A revised model (v2) was written down with its parameters, five predictions and pass criteria, then timestamped and hashed before the full text of Suda et al. (2020) was opened. Scores were taken from that paper’s text, Table 1, Figure 3 and Extended Data Figure 8, without refitting.
Software. Analyses used Python 3 with NumPy and SciPy. Scripts are available from the author.
Results 1. A Second AP About 1 s After the First Closes the Trap
Prediction P1 failed. In both closing events with short spacing, the second AP fired well inside the frozen 4.62 s veto boundary and the trap closed.
| Trace (Burri S1) | Stimulus | Interval between the two APs | Outcome |
| Figure 4C | One slow deflection (two APs during bending) | 0.98 s | Closed |
| Figure 1C | Two fast deflections, onsets 1.10 s apart | ~0.75–1.1 s (second AP on the first’s repolarization) | Closed |
| Figure 4D | One slow deflection (one AP on bending, one on return) | 7.42 s | Closed |
Two earlier reports from one laboratory agree. Volkov et al. (2007) and Volkov et al. (2009) describe APs separated by 0.75–1 s, and Volkov et al. (2009) report closure with two mechanical stimuli 0.75–40 s apart.
With h_post and h_crit fixed, a closing pair at 0.98 s requires τ_φ0 ≤ 0.98 / ln(0.98/0.55) = 1.70 s, and the 0.75 s reports require τ_φ0 ≤ 1.30 s. The frozen value of 8 s is excluded by a factor of at least 4.7. Three traces fix an upper bound and do not estimate τ_φ0.
The bound changes where a sterol manipulation of Φ can be seen. With τ_φ0 = 1.7 s, halving Φ moves the veto boundary to about 2 s rather than 9 s. Pushing it to 9 s needs Φ ≈ 0.11, and abolishing closure within a 30 s window needs Φ ≈ 0.03. The discriminating inter-stimulus intervals are therefore 0.5–4 s, not the 9–29 s band specified in the original pre-registration.
Results 2. The AP Threshold Is a Bounded Velocity Window
Prediction P2 failed. A single deflection fired only when angular velocity lay inside a window, and neither a sum nor a product of displacement and velocity reproduced it.
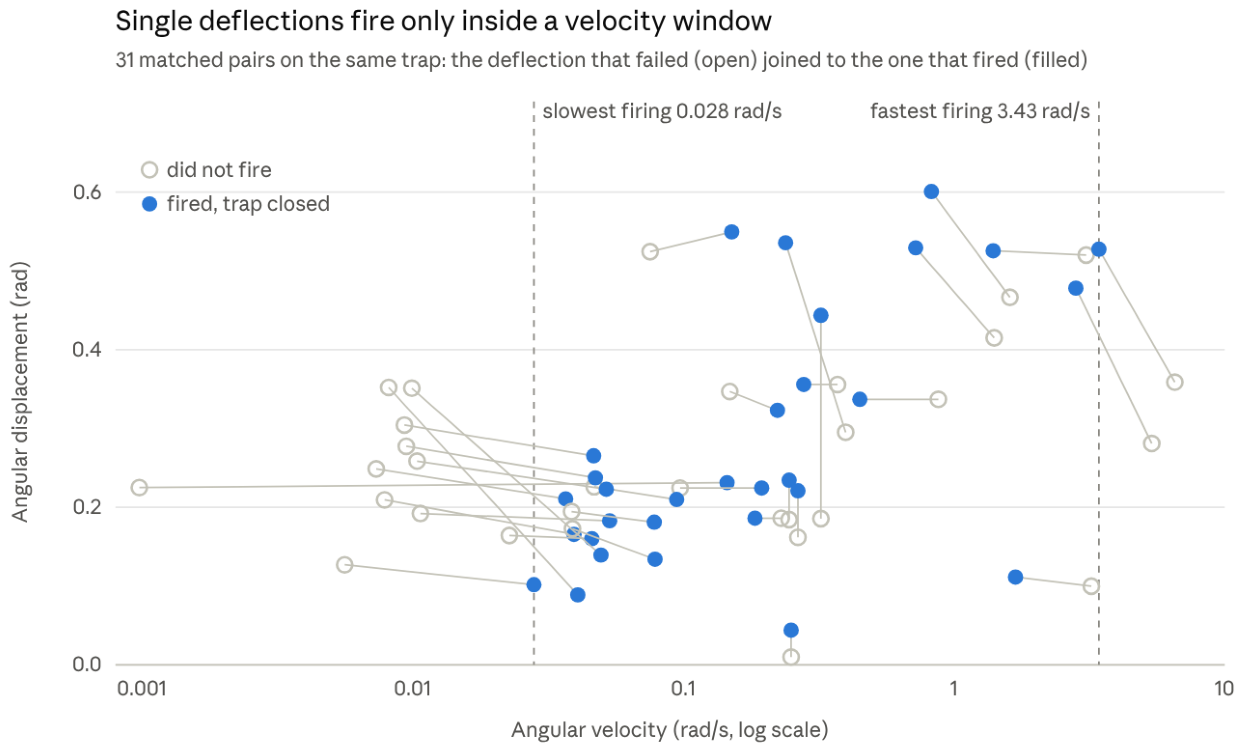
Figure 1.
Matched single-deflection pairs. Each line joins a deflection that did not fire to the deflection on the same trap that fired and closed it. Dashed lines mark the slowest and fastest velocities at which any deflection fired. Burri et al. (2020) S1 Data, sheet Figure 4B · 31 single-deflection pairs, 19–21 °C.
| Threshold rule | Parameters | Held-out pairs ranked correctly | Held-out log-likelihood | AIC |
| Velocity window (product + (ln ω)²) | 4 | 29/31 | −3.3 | 78.9 |
| Product, power law (ln θ + ln ω) | 3 | 22/31 | −18.2 | 90.4 |
| Additive (θ + ω) | 3 | 9/31 | −19.7 | 90.2 |
The window has two edges, and each is a veto.
- Upper edge. All six traps that failed at 1.4–6.5 rad/s fired when velocity was roughly halved at equal or larger displacement. Any rule that rises with both factors forbids this.
- Lower edge. Deflections slower than about 0.01 rad/s did not fire at displacements up to 0.35 rad. At 0.041 rad/s, a displacement of 0.089 rad fired. Below a minimum velocity, no displacement compensates.
Double deflections at 11–25 rad/s show the same upper-edge behavior. Faster deflections needed larger displacements to fire (Spearman ρ = +0.66, p < 0.01, n = 21), the opposite of the inverse relation a product predicts. The median double-deflection threshold was 0.178 rad (IQR 0.145–0.218).
The window matches the mechanism in Burri’s electromechanical model. Receptor-potential leak (τ_RP = 0.64 s) sets the lower edge, because a slow deflection cannot outpace decay. A limit on charge flux (93.2 µC/s) and the 1.03 s refractory period set the upper edge, because a fast deflection ends before a second AP can fire.
Each pair was tested sequentially on one trap at 2-min spacing, so slow summation over minutes could have aided the later, triggering deflection. Two observations make both edges independent of that bias. All 21 double-deflection experiments show that a single fast deflection above threshold gives one AP and no closure. Sustained displacement never closed the trap (n = 11), and initial deflections slower than 0.009 rad/s never did (Burri et al., 2020).
Results 3. Constraints from the Wider Literature
The calcium memory constant converges across laboratories and methods, while the closure window, long-interval behavior and the sign of second-stimulus effects contradict the frozen model.
| Quantity | Reported values | Source | Bearing on the model |
| Calcium memory time constant | ~30 s window; 33.24 ± 0.16 s decay; 39.71 s fitted | Suda et al. (2020); Scherzer et al. (2022); Burri et al. (2020) | Supports τ_Ca of 30–40 s from three methods (imaging, imaging, electromechanical fit) |
| Two-stimulus closure window | 16.1 s (implied by Burri’s 10 µC threshold over 6 µC per AP); 15–20 s; 0.75–20 s; ~30 s; 0.75–40 s; charge summation within 50 s | Burri et al. (2020); Böhm et al. (2016); MacFarlane (1892) in Volkov et al. (2008b); Suda et al. (2020); Volkov et al. (2009); Volkov et al. (2008a) | The ratio of closure threshold to per-AP calcium is not pinned; the frozen θ_Ca is one choice among values spanning a 3-fold window |
| Closure after many widely spaced stimuli (P3) | At 21 °C, stimuli needed for complete closure rise from 2.0 (20 s apart) to 6.3 (2 min), 12.6 (10 min) and 19.1 (20 min); closure completes even at 20 min intervals, once after 26 stimuli over 8 h 20 min | Brown (1916), Tables VII–VIII; also MacFarlane (1892) and Brown & Sharp (1910) | P3 fails: a single 30–40 s integrator allows no closure beyond ~31–37 s. A fast plus a slow leaky component (τ_slow ≈ 2.5–3 h) fits Brown’s counts; a single component does not (see below) |
| Second-AP propagation and latency (P4) | Second AP 41.14 ± 2.39 vs first 11.22 ± 0.82 cm/s, measured with ≥ 1 min between stimuli; faster from any combination of hairs and whether or not the trap closes; amplitude not reduced; closure onset later by 12 ms per s of interval | Armada-Moreira et al. (2023) | P4 fails: closure onset worsens steadily with interval across 5–30 s, with no recovering gate. Propagation stays facilitated for at least 1 min across the whole trap, outlasting the closure memory, so trap-wide excitability (Φ) and the closure memory (C) are separable in time and space |
| Drive deficit compensated by charge | Threshold 13.63 ± 1.51 µC (n = 41); 70 µC with 10 µM CCCP; 84 µC with 9-anthracenecarboxylic acid (9-AC) | Volkov et al. (2008a) | Partial loss of D is compensable by 5–6-fold more C. One dose per inhibitor fits a product (D factor 0.19 and 0.16) and a sum (deficit 56 and 70 µC) equally, so product versus sum is undecided |
Two sets of absolute charge thresholds disagree between studies from one laboratory: 13.63 µC (Volkov et al., 2008a) against 8–9 µC (Volkov et al., 2009). Only ratios within a study are used above.
Long-interval summation. Brown (1916) stimulated a single hair at fixed intervals of 20 s to 20 min at 21 °C and counted the stimuli needed for complete closure (11 intervals, 5–12 leaves each). A model in which each stimulus adds one unit to a fast and a smaller slow leaky store, with closure at a fixed threshold, was fitted to his means by least squares on log counts. With the fast constant free, the fit gives τ_fast = 86 s, τ_slow = 182 min, a slow increment 0.16 of the fast one, and a root-mean-square error of 9% (4 parameters, 11 points). Fixing τ_fast at 30.6 s, the Molis value at 21 °C, gives τ_slow = 153 min and a 17% error, with systematic misses at 1 min and 10–15 min. A single store fits poorly: its sum of squared log errors is 2.72, against 0.09 and 0.30 for the two-store fits. Brown’s endpoint is complete, often slow, closure rather than the snap, which may explain the longer fast constant. The slow component, unparameterized in the v2 model, is therefore on the order of hours, and its parameters here are post hoc.
Results 4. A Frozen Revised Model Fails Its Window Prediction on Independent Data
A revised model (v2) was frozen with five scored predictions before the calcium-imaging data of Suda et al. (2020) were examined. It failed its central prediction, the two-stimulus closure window: it predicted 13.5 s, and Suda measured 30.9 s.
Frozen parameters. None came from Suda et al. (2020). The C layer was Burri’s electromechanical model unchanged (k = 40.2 µC/rad, τ_RP = 0.64 s, flux limit 93 µC/s, refractory period 1.03 s). The fast memory constant was τ_fast = 33.24 s, from direct calcium imaging (Scherzer et al., 2022). Charge per AP and closure threshold were Burri’s Q_AP = 6 µC and Q_th = 10 µC, a threshold ratio r = 1.667. A slow memory component was included but left unparameterized, and the baseline Φ gate was set equal to the 1.03 s refractory period. Two stimuli then close the trap when Q_AP · exp(−Δt / τ_fast) + Q_AP ≥ Q_th, which gives Δt ≤ −τ_fast · ln(r − 1) = 13.5 s.
| Prediction | Pre-set pass criterion | Suda et al. (2020) | Score |
| V2-1. Single-stimulus calcium decay, τ = 33.24 s | 25.0–41.6 s | Normalized fluorescence at 30.88 s: lateral 0.463 ± 0.072, implied τ = 40.1 s; central 0.264 ± 0.078, implied τ = 23.2 s (n = 6). Two-phase decay preferred over one-phase by AIC | Lateral pass; central fail |
| V2-2. Two-stimulus closure window, 13.5 s | Window 6.7–20.2 s; fail if reliable closure at ≥ 25 s | 50% closure at 30.88 s (95% CI 21.4–45.4 s; n = 30) | Fail |
| V2-3. Three equally spaced stimuli close up to 26.0 s | Third-stimulus closures within that range | Five leaves that failed at a second stimulus 40–80 s after the first closed with a third about 4–11 s later (read from Extended Data Figure 8) | Consistent but uninformative: the second and third stimuli alone fall inside the window |
| V2-4. Linear summation: second peak = 1 + residual | Rise after the second stimulus equals the first | Rises of about 0.55–0.8 of the first (Figure 3a; Extended Data Figure 8); the 50% thresholds F_res = 0.506 and F_max = 1.327 differ by 0.82 | Fail, confounded by the nonlinear GCaMP6f readout |
| V2-5. No veto of a second AP at ≥ 1.03 s | Requires sub-second intervals | None tested | Untested |
Disclosure. The frozen record wrote the window formula as τ_fast · ln(r / (r − 1)), which evaluates to 30.5 s. The derivation above and the committed value are −τ_fast · ln(r − 1) = 13.5 s. The model was scored on the committed value; agreement between the mistyped expression and Suda’s measurement is not counted. Suda’s summary figure of about 30 s was known before freezing. The record was timestamped and hashed (SHA-256 696f5f7d3f8ce528a5eb3e2e4d332138dbe5ce826868b62824bd8a9dbcfb71a0) before the paper was opened and is available from the author; the hash fixes its content, not its time. Future frozen records will state every derived quantity twice, as a formula and as its evaluated number, with a script that recomputes the number from the formula before the record is hashed.
Where the failure lies. The window failed because the threshold ratio was imported from another preparation. In Suda’s leaves, 50% closure required a residual of 0.506 of the first peak (lateral area), against the 0.667 that r = 1.667 requires. Their slow decay tail also held the residual near 0.46 at 30.88 s. Both lengthen the window. The closure threshold relative to per-AP calcium therefore has to be measured in the preparation being predicted. A refit with r ≈ 1.5 and two-phase decay would reproduce a window near 31 s, but that fit would be in-sample and needs a further dataset to test.
What held. Suda’s two-phase decay, preferred by AIC, is independent support for the two-component memory proposed in the Discussion. It was a structural feature of v2 rather than a scored prediction. Values were read from the paper’s text, Table 1 and figures; the Extended Data Figure 8 intervals are approximate readings from the plot.
Results 5. Temperature, Light, Age and Position
A single leaky calcium memory explains most of the temperature dependence of two-touch closure. Its time constant, fitted only to the Molis data, is 32.2 s at 20 °C, matching the 30 s frozen τ_Ca and the 33.24 s fast decay of Scherzer et al. (2022). Molis et al. (2006) report closure against temperature, light regime, trap age and touch position; their figures were digitized for this analysis.
Model. Each touch adds one unit of calcium, which decays with τ(T) = τ20 · Q10^(−(T−20)/10). Closure occurs when the summed level exceeds a threshold that varies across traps. Molis excluded traps that closed on the first touch from the two-touch series, so the model was fitted to two-touch closure conditional on no closure after the first touch. Fitting both series unconditionally is misspecified: at 40 °C the observed two-touch rate (0.05) falls below the single-touch rate (0.14).
| Temperature (°C) | Two touches 60 s apart, observed | Fitted | Single touch, observed (n) | Fitted | Fitted τ (s) |
| 15 | 0.950 | 0.962 | 0.027 (265) | 0.047 | 41.3 |
| 20 | 0.835 | 0.798 | 0.050 (180) | 0.066 | 32.2 |
| 25 | 0.495 | 0.504 | 0.150 (181) | 0.092 | 25.2 |
| 30 | 0.215 | 0.253 | 0.141 (177) | 0.124 | 19.6 |
| 35 | 0.120 | 0.111 | 0.189 (170) | 0.163 | 15.3 |
| 40 | 0.050 | 0.041 | 0.141 (142) | 0.209 | 12.0 |
Fit. Five parameters for 12 observations give τ20 = 32.2 s and Q10 = 1.64, with deviance 16.93 on 7 df (p = 0.018). Letting the threshold spread also vary with temperature does not remove the misfit (deviance 13.19 on 6 df, p = 0.040; τ20 = 49.8 s). The two-touch series fits closely. The residual is a step in single-touch closure between 20 and 25 °C, from 0.05 to 0.15, that a smooth Q10 cannot reproduce. A temperature-sensitive change in the per-touch charge or the threshold would produce such a step. Huang and Hedrich (2023) found that heat-evoked calcium waves start in the trigger-hair podium, which would place that change in the sensor. Scherzer et al. (2019) give an independent estimate at the hair: the delay from touch to AP fell from 1.45 s at 7 °C to 0.47 s at 33 °C, a Q10 of about 1.5, close to the 1.64 fitted here. At 0.25 Hz the fraction of touches that fired an AP rose from 33% at 10 °C to 65% at 20 °C and 100% at 30 °C.
Light. Under continuous light the two-touch window is about 10–15 s longer than under an 8 h short day: closure at 60 s is 0.67 against 0.44, and at 80 s 0.27 against 0.08. Light could act through D, by raising the energy available for the ion fluxes, or through C, by slowing calcium clearance. One curve per regime cannot separate a D × C product from a pure change in C, so this comparison leaves the composition question open.
Age. The time for 50% two-touch closure rises from 25 s in 1-week-old traps to 57 s at 6 weeks, and closure at 45 s from 0.11 to 0.67. Iosip et al. (2020) found that trigger hairs of immature traps express little KDM1 and cannot be excited (Results 6). A maturing sensor is one testable explanation for the age effect.
Position. The memory is local. With touches 25 s apart, closure was 0.90 when both touches hit the same hair, 0.60 for a different hair on the same lobe, and 0.17 for a hair on the opposite lobe. At 30 s these values were 1.00, 0.25 and 0.01. A single trap-wide charge pool, as in the ECB model, predicts no effect of position. These results imply that at least part of C resides at or near the stimulated hair, with a faster-decaying contribution spreading across the trap. Two other reports fit this split. Desensitization under rapid stimulation is hair-specific: a silenced hair fails while an untouched hair on the same trap still fires (Scherzer et al., 2019). In contrast, the faster propagation of a second AP appears whichever hairs are touched and whether or not the trap closes (Armada-Moreira et al., 2023). Closure memory is partly local, while propagation facilitation is trap-wide.
Results 6. Sterol Genes and K⁺ Recovery in the Trigger Hair
The trigger hair over-expresses CYP710A1, the sterol C-22 desaturase that converts β-sitosterol to stigmasterol, in two independent transcriptomes, while most of the core sterol pathway is lower than in the trap blade. This pattern predicts a stigmasterol-biased membrane in the sensory structure. It places any sterol-dependent gate at the sensor rather than across the trap.
| Gene | Step | Procko et al. (2021): hair / trap, CPM | Fold | Iosip et al. (2020): hair / trap, FPKM | Fold |
| CYP710A1 | Sitosterol → stigmasterol | 43.0 / 15.4 (FDR 1.0 × 10⁻⁵) | 2.8 | 17.6 / 1.1 | 15.8 |
| HMG1 | HMG-CoA reductase | 41.3 / 103.5; 4.7 / 13.9 (two transcripts) | 0.40; 0.36 | 1.5 / 5.3 to 15.6 / 9.4 (three copies) | 0.3–1.7 |
| SMT1 | Sterol C-24 methyltransferase | — | — | 57.1 / 142.3 | 0.40 |
| DWF5 | Sterol Δ⁷ reductase | — | — | 85.5 / 154.3 | 0.55 |
| DWF1 | Sterol Δ²⁴ reductase | — | — | 8.2 / 16.8 | 0.49 |
| KDM1 (KAT1 ortholog) | Inward-rectifying K⁺ channel | — | — | 122.1 / 14.2 | 8.6 |
Procko et al. (2021) compared dissected trigger hairs with trap tissue from which the hairs had been removed; Iosip et al. (2020) profiled seven tissues. Dashes mark genes absent from Procko’s lists of differentially expressed genes. In the Iosip data, CYP710A1 lies in the top 1% of genes for hair-versus-trap enrichment.
Sterols act on D as well as Φ. Stigmasterol stimulates the plasma-membrane H⁺-ATPase reconstituted into liposomes, and sitosterol inhibits it (Grandmougin-Ferjani et al., 1997). Partial sterol extraction with methyl-β-cyclodextrin first stimulates and then inhibits active H⁺ transport (Lapshin et al., 2021). A stigmasterol-rich hair membrane is therefore expected to change the energy supply for ion recovery (D), not only the membrane gating that the framework assigns to Φ.
KDM1 is an energy-dependent recovery gate in the sensor. KDM1 is a hair-specific, acid-activated, inward-rectifying Shaker K⁺ channel that restores the K⁺ gradient after each action potential, with re-uptake energized by the H⁺-ATPase (Iosip et al., 2020). Blocking it with 30 mM Cs⁺ shortened AP series: at 0.25 Hz, 20 stimulations gave about 10 APs in control hairs and only 4 in treated hairs. In the authors’ model, full recovery took five times longer with reduced K⁺ uptake. Once turgor fell below a critical level, stimuli failed until it recovered, producing dropouts in the AP train. This is a veto at the sensor whose recovery rate depends on D. It acts over repeated stimulation, so it is consistent with the fast refractory bound of Results 1, which concerns a single pair of APs.
Results 7. The DYSCALCULIA Mutant and the A Term
The DYSCALCULIA (DYSC) mutant shows that a deficit in A, the mechanical capacity to execute closure, can be offset by more C. It cannot distinguish a product from a sum, because wild-type traps are at ceiling under every tested condition. DYSC traps do not close after the two APs that close wild-type traps (Iosip et al., 2023). Trebing et al. (2025) attribute the defect to cell-wall biomechanics rather than signaling.
Closure with more APs. In the supplement of Trebing et al. (2025), wild-type traps closed fully after 2 APs (normalized opening angle about 0.15; n = 6). After 10 APs, the median DYSC opening angle at 20 min was 0.92–0.97 across stimulation rates of 1 AP per 15, 30 or 60 s (n = 12 per group). After 20 APs it fell to 0.46, 0.33 and 0.69 at those three rates: partial closure, short of the full snap. The time course for 10 APs at 1 per 15 s (their Figure S1A) shows a median near 0.45 at 20 min. That conflicts with the 0.92–0.97 boxplot said to summarize the same condition (their Figure S1C), so the values are used here only qualitatively: partial closure requires five to ten times the wild-type AP count.
Geometry. Resting lobe curvature is 0.012 mm⁻¹ in DYSC against 0.037 mm⁻¹ in wild type, a ratio of about 3.1 (medians read from their Figure S2B; n = 36–54). Snap-through of the lobe is a buckling instability whose onset depends on lobe curvature (Forterre et al., 2005). If the drive required for closure scales with the square of curvature, the mutant needs about 3.1² ≈ 9.5 times the wild-type input, or about 19 APs. This falls within the range of 10–20 APs at which DYSC traps partially close. The κ² scaling is an assumption, and the comparison was made after seeing the data.
Scope of the test. A product rule predicts that lowering A raises the C needed for closure in proportion; a sum predicts a fixed offset. With one mutant, one wild type at ceiling and no graded A, both fit. A pre-specified test is available within wild type: lobe curvature varies naturally between traps, so the number of APs needed to close should scale as 1/κ² under the product reading and should follow a fixed additive offset under a sum. Sterol-pathway genes, including CYP710A1, do not differ between DYSC and wild type in the Trebing et al. (2025) expression data, which is consistent with a deficit in A rather than in Φ.
Discussion
The flytrap data support the conjunctive, veto-bearing structure the framework proposes, and reject all four frozen quantitative predictions. Supported: closure requires conditions that hold jointly, and at each edge of the stimulus window one condition vetoes the outcome regardless of the others. Rejected: the 8 s recovery gate (P1), the product rule within C (P2), the single-timescale integrator (P3), and a recovering gate in the 5–30 s band (P4). A revised model built from these corrections then failed its closure-window prediction on independent data (Results 4).
A revised model. The data are consistent with three changes, stated here as hypotheses for testing.
- C is a window function of the stimulus, C(θ, ω), set by receptor-potential leak at low velocity and by flux limitation and refractoriness at high velocity. It enters execution as a gate.
- The calcium memory has at least two timescales: a 30–40 s component that sets the two-touch window and a slower component, on the order of hours (Results 3), that supports summation of widely spaced stimuli into slow or partial closure. Suda et al. (2020) independently found two-phase calcium decay.
- The baseline permissive gate recovers within about 1.7 s. A sterol-dependent Φ, if present, would show as a lengthened short-interval veto in the 0.5–4 s range rather than as loss of closure at 9–29 s.
What remains untested. The central claim of the framework, multiplicative integration across A, D and C, has no decisive test in published flytrap data. Every manipulation of D in the literature is a single dose of one inhibitor, which a product and a sum fit equally. The DYSCALCULIA mutant does not settle it either, because wild-type closure is at ceiling (Results 7). The proposal that Φ is set by membrane sterol composition is also untested: no study has measured or manipulated Dionaea sterols against excitability. The transcriptomes give only an indirect lead, CYP710A1 enrichment in the hair (Results 6).
Φ and C are hard to tell apart in timing data alone. The Plant Science correspondence defined Φ as a phase variable with a window of about 20 s (Rahman, 2026a), and the BioSystems analysis tabulated the calcium decay window as its flytrap value (Rahman & Zorumski, 2026). In closure data, both behave like the calcium memory assigned here to C. A window measured from closure probability alone therefore cannot separate them. Two measurements can. Propagation facilitation persists for at least 1 min and spreads across the trap (Armada-Moreira et al., 2023), whereas closure memory decays within about 30 s and is partly local to the hair (Molis et al., 2006). If Φ is identified with trap-wide excitability, it has a longer time course and a different spatial extent from C, and recording propagation speed alongside closure in E0 would measure both.
A sterol-dependent gate, if present, is more likely in the sensor than across the trap, and it would load on D as well as Φ. CYP710A1 enrichment in two independent hair transcriptomes predicts a stigmasterol-biased sensory membrane. Stigmasterol activates the H⁺-ATPase that powers K⁺ re-uptake through KDM1, so a sterol manipulation would change recovery energetics (D) along with any gating (Φ). Separating them requires measuring H⁺-ATPase activity in the same hairs. One result points against a membrane-lipid basis for at least one hair-level gate. After heat inactivation, a repeated heat ramp evokes a calcium-AP with 50% probability at a 171 s interval; after cold inactivation the interval is 134 s. Heat-inactivated traps still respond to cold, voltage and glutamate; Huang and Hedrich (2023) interpret this stimulus specificity as a property of channel proteins rather than membrane lipids. A bulk change in membrane order would be expected to shift all of these responses together, so the stimulus-specific recovery is a testable contrast for E2.
Status of each result. The results differ in evidential weight, from pre-specified tests on primary data to post hoc fits and qualitative readings. Only the first two kinds bear directly on the frozen models.
| Result | Data | Status |
| Recovery gate ≤ 1.7 s (P1) | Burri S1 voltage traces | Pre-specified test of the frozen model on primary data |
| Velocity window (P2) | Burri S1, 31 matched pairs | Pre-specified test; rules compared by leave-one-out |
| Long-interval and second-AP behavior (P3, P4) | Published values | Pre-specified tests against reported values |
| Closure window 13.5 s predicted, 30.9 s measured | Suda et al. (2020) | Out-of-sample test of a frozen model |
| Calcium memory τ = 32.2 s, Q10 = 1.64 | Molis et al. (2006), digitized | Post hoc fit; parameters estimated |
| Slow memory component of hours | Brown (1916), Table VIII | Post hoc fit; its prediction is tested by E3 |
| CYP710A1 and KDM1 enrichment in the hair | Procko et al. (2021); Iosip et al. (2020) | Reported expression values; no model fitted |
| Curvature-squared account of DYSCALCULIA | Trebing et al. (2025), digitized | Qualitative and post hoc; the scaling is assumed and is tested by E5 |
| Separation of Φ from C | Armada-Moreira et al. (2023); Molis et al. (2006) | Interpretation; tested by E0 |
Limitations. The timing bound rests on three voltage traces from one study plus two reports from one laboratory. Burri’s pairs were tested sequentially on the same trap, and only the edge evidence described in Results 2 protects the window against slow summation. All Burri data come from 19–21 °C, and temperature changes both charge thresholds and stimulus requirements (Volkov et al., 2009). The Molis data constrain the temperature dependence of the calcium memory (Q10 ≈ 1.6) but not of the refractory bound. The long-interval result rests on one 1916 table of means without measures of spread. The Molis and DYSCALCULIA values were digitized from published figures, which adds reading error of a few percent, and the DYSCALCULIA supplement is internally inconsistent for one condition (Results 7). Assigning physical implementers to A, D, C and Φ is itself a hypothesis; the tests here constrain timing and composition, not the identity of the implementers. Finally, the closure threshold relative to per-AP calcium did not transfer between preparations (Results 4), so a prediction for a new preparation needs that ratio measured in it.
Proposed Decisive Experiments
Six experiments would settle what published data leave open; the first two decide the framework’s central claims. All scales are fixed in advance, because a product on raw scales is a sum on log scales: charge in µC, drive as a measured ratio to untreated control, intervals in seconds.
| Experiment | Design | Prediction | Kill condition | Traps (approx.) |
| E0. Baseline gate recovery | Paired stimuli at 0.5, 1, 2, 4 and 8 s in untreated traps, with surface recording of both APs | Second-AP failure confined below ~1.7 s; yields τ_φ0 directly | Second-AP failure at intervals ≥ 2 s, which would contradict the Burri traces | 100 |
| E1. Multiplicative integration of C and D | Injected charge (5 levels, 7–90 µC) × CCCP (0 to 10 µM, 4 levels), with D measured per trap as midrib ATP or H⁺-ATPase hyperpolarization amplitude | Iso-closure contour C·D = constant: at D = 0.6, 50% closure near 23 µC (an additive rule anchored to the same two points predicts about 42 µC) | Additive contour fits as well or better by held-out likelihood | 60–100 |
| E2. Sterol-dependent Φ | Methyl-β-cyclodextrin (0, 1, 3, 10 mM) × interval (0.5–8 s), plus a sterol-loaded cyclodextrin rescue arm; trap sterols by GC-MS | Short-interval veto lengthens in proportion to sterol loss; closure at long intervals preserved; rescue reverses the shift | No shift in the veto boundary; equal loss at all intervals (a drive or tissue effect); or no reversal on rescue | 200–240 |
| E3. Slow memory component | One hair stimulated at fixed intervals of 10, 20, 25, 30 and 40 min at 21 °C, up to 40 stimuli, scoring complete closure | The two-store fit to Brown (1916) predicts about 20 stimuli at 20 min and no complete closure at 30 min or longer, at any count | Complete closure at 30 or 40 min intervals (a slower store, or a non-leaky integrator); or failure at 20 min (Brown’s result does not replicate) | 40 |
| E4. Sterols of the sensor | GC-MS of dissected trigger hairs against hair-free trap blade from the same traps; then CYP710A1 knockdown or a C-22 desaturase inhibitor, with hair AP series at 0.25 Hz and H⁺-ATPase activity measured in the same hairs | Higher stigmasterol-to-sitosterol ratio in hairs; lowering it shortens AP series at 0.25 Hz | Equal ratios in hair and blade; or an AP-series effect fully explained by lower H⁺-ATPase activity (a D effect) | 30 for GC-MS; 60 for knockdown |
| E5. Lobe curvature and A | Wild-type traps measured for resting lobe curvature, then stimulated at 1 AP per 15 s until closure | APs needed for closure scale as 1/κ² across traps | No relation between curvature and APs needed, or a relation better fitted by an additive offset | 80 |
For E1, simulation of the design at the measured between-trap spread of threshold charge (coefficient of variation 11%; Volkov et al., 2008a) selected the correct rule in at least 96% of simulated datasets with 3 traps per cell (60 traps), allowing 25% error in the drive measurement. Without an independent measurement of D the test is undecidable, because a nonlinear dose–drive curve can turn a straight contour into a hyperbola. Each trap contributes one closure per day, and charge-induced closure can be repeated only 2–3 times per trap (Volkov et al., 2009).
Data Availability Statement
All primary data are the S1 Data file of Burri et al. (2020), published under a CC BY 4.0 license with the article. Secondary data are values digitized from figures in Molis et al. (2006) and Trebing et al. (2025), Table VIII of Brown (1916), Supplementary file 1 of Procko et al. (2021) and S2 Data of Iosip et al. (2020); the extracted tables accompany the analysis scripts. The authors’ electromechanical model code is at github.com/wittelf/ECB (Zenodo DOI 10.5281/zenodo.3799873). Analysis scripts for this paper are available from the author on request.
Conflicts of Interest
None declared.
Use of AI tools
Data extraction, analysis code and drafting were assisted by Claude (Anthropic). The author reviewed all analyses and text and takes responsibility for the content.
References
- Armada-Moreira, A.; Dar, A.M.; Zhao, Z.; Cea, C.; Gelinas, J.; Berggren, M.; Costa, A.; Khodagholy, D.; Stavrinidou, E. Plant electrophysiology with conformable organic electronics: deciphering the propagation of Venus flytrap action potentials. Sci. Adv. 2023, 9(30), eadh4443. [Google Scholar] [CrossRef]
- Böhm, J.; Scherzer, S.; Krol, E.; Kreuzer, I.; von Meyer, K.; Lorey, C.; Mueller, T.D.; Shabala, L.; Monte, I.; Solano, R.; Al-Rasheid, K.A.S.; Rennenberg, H.; Shabala, S.; Neher, E.; Hedrich, R. The Venus flytrap Dionaea muscipula counts prey-induced action potentials to induce sodium uptake. Curr. Biol. 2016, 26(3), 286–295. [Google Scholar] [CrossRef]
- Brown, W.H. The mechanism of movement and the duration of the effect of stimulation in the leaves of Dionaea. Am. J. Bot. 1916, 3(2), 68–90. Available online: https://www.jstor.org/stable/2435207. [CrossRef]
- Brown, W.H.; Sharp, L.W. The closing response in Dionaea. Bot. Gaz. 1910, 49(4), 290–302. [Google Scholar] [CrossRef]
- Burri, J.T.; Saikia, E.; Läubli, N.F.; Vogler, H.; Wittel, F.K.; Rüggeberg, M.; Herrmann, H.J.; Burgert, I.; Nelson, B.J.; Grossniklaus, U. A single touch can provide sufficient mechanical stimulation to trigger Venus flytrap closure. PLoS Biol. 2020, 18(7), e3000740. [Google Scholar] [CrossRef]
- Durak, G.M.; Speck, T.; Poppinga, S. Shapeshifting in the Venus flytrap (Dionaea muscipula): morphological and biomechanical adaptations and the potential costs of a failed hunting cycle. Front. Plant Sci. 2022, 13, 970320. [Google Scholar] [CrossRef]
- Forterre, Y.; Skotheim, J.M.; Dumais, J.; Mahadevan, L. How the Venus flytrap snaps. Nature 2005, 433(7024), 421–425. [Google Scholar] [CrossRef]
- Grandmougin-Ferjani, A.; Schuler-Muller, I.; Hartmann, M.A. Sterol modulation of the plasma membrane H⁺-ATPase activity from corn roots reconstituted into soybean lipids. Plant Physiol. 1997, 113(1), 163–174. [Google Scholar] [CrossRef]
- Hedrich, R.; Neher, E. Venus flytrap: how an excitable, carnivorous plant works. Trends Plant Sci. 2018, 23(3), 220–234. [Google Scholar] [CrossRef]
- Huang, S.; Hedrich, R. Trigger hair thermoreceptors provide for heat-induced calcium-electrical excitability in Venus flytrap. Curr. Biol. 2023, 33(18), 3962–3968.e2. [Google Scholar] [CrossRef]
- Iosip, A.L.; Böhm, J.; Scherzer, S.; Al-Rasheid, K.A.S.; Dreyer, I.; Schultz, J.; Becker, D.; Kreuzer, I.; Hedrich, R. The Venus flytrap trigger hair-specific potassium channel KDM1 can reestablish the K⁺ gradient required for hapto-electric signaling. PLoS Biol. 2020, 18(12), e3000964. [Google Scholar] [CrossRef]
- Iosip, A.L.; Scherzer, S.; Bauer, S.; Becker, D.; Krischke, M.; Al-Rasheid, K.A.S.; Schultz, J.; Kreuzer, I.; Hedrich, R. DYSCALCULIA, a Venus flytrap mutant without the ability to count action potentials. Curr. Biol. 2023, 33(3), 589–596.e5. [Google Scholar] [CrossRef]
- Lapshin, N.K.; Piotrovskii, M.S.; Trofimova, M.S. Sterol extraction from isolated plant plasma membrane vesicles affects H⁺-ATPase activity and H⁺-transport. Biomolecules 2021, 11(12), 1891. [Google Scholar] [CrossRef]
- MacFarlane, J.M. Contributions to the history of Dionaea muscipula, Ellis; University of Pennsylvania Press: Philadelphia, 1892. [Google Scholar]
- Molis, A.; Patten, G.; Weidner, M. The time memory of the Venus flytrap (Dionaea muscipula Ellis). Carniv. Plant Newsl. 2006, 35(4), 108–118. [Google Scholar] [CrossRef]
- Procko, C.; Murthy, S.; Keenan, W.T.; Mousavi, S.A.R.; Dabi, T.; Coombs, A.; Procko, E.; Baird, L.; Patapoutian, A.; Chory, J. Stretch-activated ion channels identified in the touch-sensitive structures of carnivorous Droseraceae plants. eLife 2021, 10, e64250. [Google Scholar] [CrossRef]
- Rahman, T. A multiplicative behavioral model of DNA replication initiation. Open Life Sci. 2025, 20, 20251229. [Google Scholar] [CrossRef]
- Rahman, T. Threshold decision-making in the Venus flytrap. Plant Sci. 2026a, 365, 113010. [Google Scholar] [CrossRef]
- Rahman, T. Sex change in clownfish as an ARCH-governed biological decision. Horm. Behav. 2026b, 180, 105907. [Google Scholar] [CrossRef]
- Rahman, T. How transient experience produces durable commitment: a recursive execution–encoding architecture for filial imprinting. Horm. Behav. 2026c, 185, 105999. [Google Scholar] [CrossRef]
- Rahman, T.; Zorumski, C.F. ARCH × Φ: sterols and the evolution of gated biological execution. BioSystems 2026, 265, 105812. [Google Scholar] [CrossRef]
- Rahman, T.; Zorumski, C.F. Access, not capacity: neuroendocrine threshold gating of mating and maternal behavior. Front. Neuroendocrinol. in press. [Google Scholar]
- Rahman, T.; Zorumski, C.F.; Meloy, J.R. The ARCH model: a neuroevolutionary framework for behavioral execution. Front. Psychiatry 2025, 16, 1669530. [Google Scholar] [CrossRef]
- Scherzer, S.; Federle, W.; Al-Rasheid, K.A.S.; Hedrich, R. Venus flytrap trigger hairs are micronewton mechano-sensors that can detect small insect prey. Nat. Plants 2019, 5(7), 670–675. [Google Scholar] [CrossRef]
- Scherzer, S.; Böhm, J.; Huang, S.; Iosip, A.L.; Kreuzer, I.; Becker, D.; Heckmann, M.; Al-Rasheid, K.A.S.; Dreyer, I.; Hedrich, R. A unique inventory of ion transporters poises the Venus flytrap to fast-propagating action potentials and calcium waves. Curr. Biol. 2022, 32(19), 4255–4263.e5. [Google Scholar] [CrossRef]
- Suda, H.; Mano, H.; Toyota, M.; Fukushima, K.; Mimura, T.; Tsutsui, I.; Hedrich, R.; Tamada, Y.; Hasebe, M. Calcium dynamics during trap closure visualized in transgenic Venus flytrap. Nat. Plants 2020, 6(10), 1219–1224. [Google Scholar] [CrossRef]
- Trebing, S.; Freund, M.; Iosip, A.; Diblasi, C.; Krennerich, V.; Kirshner, J.; Sato, M.P.; Marques, A.; Saitou, M.; Becker, D.; Albert, V.A.; Tessmer, I.; Fukushima, K.; Hedrich, R.; Kreuzer, I. Impaired trap closure in the counting-deficient Venus flytrap mutant DYSCALCULIA is caused by cell wall biomechanics. bioRxiv 2025. [Google Scholar] [CrossRef]
- Volkov, A.G.; Adesina, T.; Jovanov, E. Closing of Venus flytrap by electrical stimulation of motor cells. Plant Signal. Behav. 2007, 2(3), 139–145. [Google Scholar] [CrossRef]
- Volkov, A.G.; Adesina, T.; Markin, V.S.; Jovanov, E. Kinetics and mechanism of Dionaea muscipula trap closing. Plant Physiol. 2008a, 146(2), 694–702. [Google Scholar] [CrossRef]
- Volkov, A.G.; Carrell, H.; Adesina, T.; Markin, V.S.; Jovanov, E. Plant electrical memory. Plant Signal. Behav. 2008b, 3(7), 490–492. [Google Scholar] [CrossRef]
- Volkov, A.G.; Carrell, H.; Baldwin, A.; Markin, V.S. Electrical memory in Venus flytrap. Bioelectrochemistry 2009, 75(2), 142–147. [Google Scholar] [CrossRef]
Disclaimer/Publisher’s Note: The statements, opinions and data contained in all publications are solely those of the individual author(s) and contributor(s) and not of MDPI and/or the editor(s). MDPI and/or the editor(s) disclaim responsibility for any injury to people or property resulting from any ideas, methods, instructions or products referred to in the content. |
© 2026 by the author. Licensee MDPI, Basel, Switzerland. This article is an open access article distributed under the terms and conditions of the Creative Commons Attribution (CC BY) license.
Copyright: This open access article is published under a Creative Commons CC BY 4.0 license, which permit the free download, distribution, and reuse, provided that the author and preprint are cited in any reuse.