

Submitted:
11 October 2026
Posted:
13 October 2026
You are already at the latest version
Abstract
Closed-loop acoustic stimulation can enhance slow-wave sleep and sleep spindle activity, but evidence has largely been obtained under controlled laboratory conditions. Translat-ing this approach to the home environment is important for developing scalable interven-tions for the myriad of disorders featuring deep sleep reduction, including insomnia. We evaluated the feasibility and electrophysiological effects of modeling-based closed-loop neurostimulation (M-CLNS) using a self-applied wireless EEG headband (ZMax) during unsupervised home use in adults with self-reported maintenance insomnia symptoms. Sixty-two participants completed two habituation nights followed by two counterbalanced five-night periods of stimulation or sham. Forty-nine participants contributed 330 record-ings that met signal-quality criteria. Acoustic stimuli were phase-locked to the onset of the positive slow oscillation deflection (0°). Across 230,139 phase-targeting events, stimula-tion was delivered close to the intended phase for both stimulation (mean −10.2° ± 74.5°) and sham (−4.1° ± 72.4°). Compared with sham, stimulation elicited a significant stimu-lus-locked SO response and increased spectral power in both the SO (0.5–4 Hz) and sleep-spindle (9–14 Hz) bands. Sleep architecture was not measurably altered. These findings demonstrate the feasibility of phase-targeted acoustic stimulation using wearable EEG during repeated unsupervised home use. This scalable approach provides a founda-tion for longitudinal studies investigating whether sustained enhancement of SO activity can improve sleep and daytime functioning or alleviate insomnia symptoms.
Keywords:
wearable EEG
; closed-loop acoustic stimulation
; EEG headband
; slow oscillations
; modeling-based closed-loop neurostimulation
; insomnia
; sleep
; home monitoring
1. Introduction
Slow-wave sleep (SWS), the deepest stage of non-rapid eye movement (NREM) sleep, plays an important role in physical and mental restoration. Indeed, SWS has been linked to a wide range of physiological processes involved in growth and recovery. Examples of these processes include immune function (Besedovsky et al., 2012), energy metabolism (Dworak et al., 2010), cardiovascular health (Huwiler et al., 2024), glucose homeostasis (Tasali et al., 2008), memory consolidation (Diekelmann & Born, 2010), and the clearance of metabolic waste from the brain (Xie et al., 2013).
A defining electrophysiological feature of SWS is the slow oscillation (SO; approximately 0.5–1.5 Hz), which can be measured non-invasively using electroencephalography (EEG). Alterations in SO activity have been reported across various psychiatric, neurological, somatic, and sleep disorders (Pillai et al., 2011; Lee et al., 2020; Ratnavadivel et al., 2009; Carrier et al., 2011), including insomnia (Schneider-Helmert et al., 2001; Neu et al., 2015; Zhao et al., 2021; Hogan et al., 2020). Insomnia disorder affects approximately 6–10% of adults, although insomnia symptoms are more common, affecting approximately 10–20% of the general population (Ohayon, 2002; Roth, 2007; Riemann et al., 2017; Morin & Jarrin, 2022). This sleep disorder also carries a substantial individual and socioeconomic burden through impaired daytime functioning, increased healthcare use, and lost productivity (Riemann et al., 2017).
Despite the high prevalence of insomnia and the documented SO deficits associated with the disorder, current treatments for insomnia do not directly target these deficits. Benzodiazepines and related hypnotics, prescribed broadly for disturbed sleep, primarily increase light NREM sleep while suppressing SWS (Sousa Martins Silva et al., 2023). This effect is consistent with the reduced delta power observed with chronic use (Manconi et al., 2017). Benzodiazepines are further associated with side effects, including suppressed REM sleep (Sousa Martins Silva et al., 2023), dependence, and impaired cognitive performance (Proctor & Bianchi, 2012; Holbrook et al., 2000; Barker et al., 2004). Cognitive behavioral therapy for insomnia (CBT-I), the best-established non-pharmacological alternative, avoids these drawbacks but is costly, time-consuming, and not readily available to most patients. Moreover, it does not directly modulate SWS or SO activity either (Koffel et al., 2021). These limitations underscore the need for scalable, non-pharmacological approaches that directly enhance SWS.
Acoustic stimulation phase-locked to SOs offers such an approach. Brief acoustic stimuli delivered at specific phases of the SO can influence ongoing brain activity during sleep. Individual, phase-targeted stimuli reliably evoke immediate SO-like responses and can produce longer-term increases in SO and delta activity across sleep (Cox et al., 2014; Ngo et al., 2013; Papalambros et al., 2017; Ong et al., 2016). The effectiveness of this approach depends critically on accurately determining the phase of the ongoing SO and delivering stimulation at the appropriate time (Navarrete et al., 2020). Stimuli that are not precisely phase-locked produce smaller effects (Danilenko et al., 2020), while the benefits of rhythmic stimulus trains diminish across successive stimuli (Ngo et al., 2015) or interfere with intrinsic traveling slow waves (Roüast et al., 2025).
Modeling-based closed-loop neurostimulation (M-CLNS) provides a flexible and precise approach to real-time phase estimation. The algorithm performs real-time, nonlinear modeling of the raw EEG signal to predict and target a selected oscillatory phase with millisecond precision, without requiring participant-specific calibration (Jongejan et al., 2024). M-CLNS has been used to phase-lock acoustic stimuli to SOs, producing both immediate stimulus-locked responses and a longer-term increase in SO activity, typically interpreted as sleep deepening (van Poppel & Talamini, 2019; Pathak et al., 2021; Koller et al., 2025). However, these applications have relied on laboratory-grade polysomnography (PSG). PSG requires specialized equipment and technical overnight supervision by trained staff. These requirements constrain PSG-based closed-loop stimulation studies to relatively short interventions and limited sample sizes in laboratory settings.
Wearable EEG offers an opportunity to overcome these practical constraints, enabling repeated measurements in more naturalistic settings. A recent study validated M-CLNS acoustic stimulation on a self-applied, wireless EEG headband with frontal derivations against simultaneous PSG in healthy participants, showing that headband-derived signals can support accurate SO-phase targeting and capture stimulation-evoked EEG changes. More specifically, these stimulation-evoked EEG changes included immediate enhancement of SO dynamics, as well as sustained increases in SO density and power spectral density within the SO and delta frequency range (0.75–5 Hz) during deep sleep (Jongejan et al., 2025). While this provides important validation of the approach under controlled laboratory conditions, it does not necessarily establish its feasibility for reliable, self-administered use in the home environment. Applying wearable EEG in the home setting introduces additional challenges, including variability in sensor placement, changes in electrode contact, and an increased likelihood of recording artifacts.
Until now, evidence for acoustic stimulation in insomnia populations remains limited and has been conducted under laboratory conditions involving small samples. For instance, Piorecky et al. (2021) studied nine patients with chronic insomnia during a single overnight laboratory recording, comparing real-time detection algorithms for SO-phase targeting. Dudysová et al. (2024) examined 17 patients with chronic insomnia across two laboratory nights, testing two-click, amplitude-threshold closed-loop auditory stimulation. To our knowledge, no previous study has evaluated longitudinal deployment of home-based phase-targeted acoustic stimulation using headband EEG in adults with maintenance insomnia.
The present study addressed this translational gap by deploying M-CLNS with acoustic stimulation in an unsupervised, three-week at-home protocol in adults with self-reported maintenance insomnia symptoms. For each participant, the protocol included two habituation nights, followed by a stimulation and a sham stimulation block of five nights each, in randomized order, applied using the wireless ZMax headband. We evaluated three aspects of this home implementation: the signal quality of fully self-administered, unsupervised recordings; the accuracy of M-CLNS SO-phase targeting; and the acute electrophysiological response to phase-targeted stimulation, focusing on SO and sleep spindle activity.
2. Materials and Methods
2.1. Participants
Sixty-two adults with self-reported maintenance insomnia symptoms completed the full study protocol. A pre-screening procedure was used to identify candidates who were 18–75 years of age; did not sleep with in-ear devices intended to block sound (e.g., earplugs); were not currently diagnosed with a neurological or psychiatric disorder or with sleep apnea; were not undergoing treatment with drugs that influence sleep (e.g., sedatives or stimulants); did not have irregular sleep–wake cycles due to shift work; and indicated both trouble staying asleep and frequent awakenings at least 3 nights per week during the past month. Candidates who met all of these criteria were invited to complete a full screening questionnaire that included the Insomnia Severity Index (ISI; Bastien et al., 2001). Inclusion required a total ISI score of 8 or higher, corresponding to at least subthreshold insomnia, together with a score of 2 (moderate) or higher on ISI item 2 (“Difficulty staying asleep”).
Recordings were screened separately from participant eligibility. Each recording was inspected visually and was retained for analysis only if it contained at least 4 hours of interpretable EEG, not necessarily consecutive, at least 10 minutes of stable N3 sleep, and at least 50 stimulation or sham markers in N2 and N3. Participants were retained in the final dataset only if at least one stimulation night and one sham night met these criteria. The final sample (n = 49) had a mean age of 44.0 ± 12.7 years and comprised 32 women (65.3%; mean age 44.5 ± 12.5 years, range 25–64 years) and 17 men (34.7%; mean age 42.9 ± 13.2 years, range 20–65 years). At screening, ISI scores ranged from 8 to 23 (14.2 ± 3.6, mean ± SD).
2.2. Procedure
Eligible participants attended an in-person introductory session before starting the home protocol. During the session, they completed a hearing test, were instructed on fitting the EEG headband and sleep headphones, and practiced the steps required to start an overnight recording.
Each participant was provided with one ZMax headband fitted with a custom-made head strap, proprietary hydrogel electrode stickers, a tablet running the M-CLNS software and EventIDE data-acquisition software (OkazoLab, Delft, The Netherlands), an external USB sound card, and soft textile sleep headphones attached to the ears with medical tape. The tablet also ran a user interface that instructed participants on how to handle and maintain the recording equipment.
The home protocol spanned three weeks. Week 1 was a habituation period of two consecutive nights during which participants became accustomed to wearing the experimental device. These nights were not included in the analyses. On the weekdays of weeks 2 and 3, participants underwent five consecutive nights of either the stimulation or the sham condition, presented in randomized, counterbalanced order across participants (Figure 1). During weekends, participants did not record their sleep and were not required to comply with experimental requirements (e.g., regarding consumption of alcohol and stimulants, and adhering to bedtimes).
Participants were instructed to abstain from recreational drug use, as well as caffeine and theine, during the 6 hours preceding bedtime. They were asked to limit alcohol consumption to a maximum of two units per day and to refrain from napping throughout the study period. All procedures were approved by the Ethics Committee of the University of Amsterdam.
2.3. Data Acquisition
EEG data were collected using the ZMax headband (Hypnodyne Corp., Sofia, Bulgaria), connected to a Microsoft Surface Pro 9 tablet, at a sampling rate of 256 Hz. The ZMax recorded a two-channel forehead EEG derivation (F8-Fpz, EEG right; F7-Fpz, EEG left) via the proprietary hydrogel patch electrodes with the ground electrode located above the Fpz electrode.
The tablet ran M-CLNS software and data acquisition through EventIDE experimental control software (OkazoLab, Delft, The Netherlands). Each morning, data were automatically transferred from the tablet to a secure server for inspection and analysis by the experimenters.
Sound was delivered through an external USB sound card (UGREEN, model 80864, UGREEN Group Limited, Shenzhen, China) plugged into the tablet, and custom soft textile sleep headphones attached to the ears with medical tape.
2.4. M-CLNS Algorithm and Targeted Sound Stimulation
A modeling-based closed-loop neurostimulation (M-CLNS) algorithm was used for slow oscillation detection and slow oscillation phase prediction (Jongejan et al., 2025).
The ZMax EEG right channel was selected as the target channel. The intended physiological target was halfway along the positive-going slope of the slow oscillation, defined as 0° in the conventional PSG polarity. Because the ZMax forehead derivation inverts this polarity relative to conventional mastoid-referenced PSG, the M-CLNS algorithm targeted 180° in the recorded ZMax signal. Subsequent phase histograms are expressed relative to this intended physiological target (0°).
The M-CLNS algorithm has been described in a previous study from our lab (Jongejan et al., 2024). In brief, the M-CLNS algorithm continuously performed nonlinear sine fitting on the unfiltered target EEG signal, using the most recent 1 s of data. It scanned for ongoing slow oscillatory activity in the 0.5–1.5 Hz range and predicted the upcoming activity. To compensate for computational and data-transmission delay, the SO target phase was sought in a prediction window 24–44 ms after the end of the data stream. If a fitting threshold was met and the target phase was encountered in the search window, the sound stimulus was released so that it coincided with the target phase. A minimum 500-ms interstimulus interval was adopted.
Sound stimuli were 50 ms of pink noise with a 5 ms rise and 5 ms fall in sound intensity. Stimulus volume was calibrated to 40 dB(A) using a Rion NA-27 sound level meter. During sham stimulation, the same stimulation algorithm was used to determine stimulus timing, but the corresponding acoustic stimuli were muted. Timestamps of stimulation and sham events were recorded for later analyses.
2.5. Data Processing
All processing was performed in Python 3.11.9 (Van Rossum & Drake, 2009) using MNE 1.11.0 (Gramfort et al., 2013), YASA 0.6.5 (Vallat & Walker, 2021), SciPy 1.16.3 (Virtanen et al., 2020), NumPy 1.26.4 (Harris et al., 2020), and pandas 2.2.2 (McKinney, 2010). A 0.1 Hz high-pass filter was applied to detrend data from both EEG channels. Automatic sleep staging was performed using YASA.
Stimulation and sham trials were created from −1 to +2 seconds around the corresponding markers that were presented during N2 or N3 sleep for the EEG right channel. Before epoching, the data were filtered between 0.3 and 35 Hz. Trials containing artifacts were removed using interquartile range (IQR)-based outlier detection, performed separately for each recording and independently for N2 and N3. Trials were rejected based on baseline peak-to-peak amplitudes (−1 to 0 s), with values more than 1.5 × IQR below the first quartile or above the third quartile classified as outliers. On average, 12.8 ± 12.5 (4.7% ± 3.7%, mean ± SD) trials were rejected per recording. The remaining trials of each condition were then grouped across nights and averaged to create a subject-level event-related potential (ERP). These were then averaged across participants to create a grand-average ERP.
Time-frequency analysis was performed on the same condition trials by isolating trials in a time frame from −6 to +6 seconds around the stimulation marker. Morlet wavelet decomposition was applied to compute the power distribution in the range of 0.5–30 Hz. Frequencies from 0.5 to 30.0 Hz were used (divided into 60 steps). The number of wavelet cycles was frequency-dependent and defined as 0.30 × f, constrained to a minimum of 3 cycles and a maximum of 9 cycles. A log-ratio baseline correction was applied separately for each participant and condition using the interval from −1 to −0.2 s. For each frequency, power at each time point was divided by the mean power during the baseline interval, and the resulting ratio was log-transformed. The baseline-corrected trials were then averaged separately for the stimulation and sham conditions to obtain participant-specific time–frequency maps. These maps were subsequently averaged across participants for each condition, and the sham grand average was subtracted from the stimulation grand average to obtain the grand-average time–frequency difference map.
To evaluate M-CLNS targeting precision, the signal was bandpass filtered between 0.5 and 1.5 Hz, and the Hilbert transform was applied to obtain instantaneous phase at each stimulus marker, and π/2 was subtracted to account for the phase shift associated with the Hilbert transform. Phase values in degrees were extracted for all conditions at stimulus onset and plotted as a circular histogram of the offset from the intended physiological target phase (0°, halfway along the positive-going SO slope), with all trials across participants counting equally. Targeting precision was further quantified using the mean vector length (MVL), a circular measure of phase concentration. Higher MVL values indicate that stimulus phases were more consistently clustered around a common phase, whereas lower values indicate greater dispersion of stimulation phases. The mean and median target phase were also provided.
2.6. Statistical Analysis
For the ERP results, statistical analysis used two-tailed paired t-tests of the within-participant difference between stimulation and sham nights (SciPy, Python). To account for multiple comparisons, a one-dimensional cluster-based correction was also applied (MNE, Python; 5000 permutations; alpha = 0.05). Significant time points were overlaid on the ERP.
For time–frequency results, the same paired approach was used. Subject-specific stimulation-minus-sham differences were evaluated at every time–frequency coordinate with two-tailed paired t-tests against zero. Multiple comparisons across the time–frequency plane were controlled with the Benjamini–Yekutieli false discovery rate (FDR; Benjamini & Yekutieli, 2001), which is robust to arbitrary dependencies among tests. Points with an FDR-adjusted p-value less than 0.01 were treated as statistically significant.
3. Results
3.1. Headband EEG Signal Quality
Of the 62 participants who completed the protocol, 13 were excluded from the analytic sample (seven primarily because of sweat-related artifacts, two because of technical issues, two because of insufficient N3 sleep, and two due to a combination of these problems). The remaining 49 participants contributed 497 recorded experimental nights. Of these, 330 nights (66.4%) were retained for analysis (167 stimulation and 163 sham nights) and 167 nights (33.6%) were excluded. From all nights of the 49 included participants, 67 (13.5%) were excluded because of poor data quality, 64 (12.9%) because they contained fewer than 50 stimuli, and 36 (7.2%) because of a combination of these issues. Visual inspection showed that sweat-related artifact was a major source of signal degradation and was most prominent during N3. Poor electrode contact was also noted in a subset of recordings.
3.2. Sleep Architecture
Participants slept on average 426.8 ± 57.4 minutes on stimulation nights and 429.0 ± 68.7 minutes on sham nights (mean ± SD), of which 18.1% ± 4.3% and 17.8% ± 4.5% was spent in N3, respectively (Table 1). Average total recording duration was 458.7 ± 56.0 minutes for stimulation and 465.9 ± 60.8 minutes for sham. Sleep efficiency was high in both conditions (STIM: 92.9% ± 4.1% and SHAM: 91.8% ± 6.5%), and sleep onset latency was short (STIM: 6.9 ± 4.5 minutes and SHAM: 7.6 ± 5.8 minutes). No differences in sleep architecture were observed between stimulation and sham nights. These findings indicate that repeated acoustic stimulation did not measurably alter the assessed aspects of sleep continuity or stage composition.
3.3. SO-Phase Targeting Accuracy
A total of 119,332 stimulation events and 110,807 sham markers were presented during the 330 retained experimental nights (167 stimulation and 163 sham nights), corresponding to 230,139 phase-targeting events. On average, 621.9 ± 439.1 stimuli were presented during stimulation nights, and 629.6 ± 443.8 during sham nights. Across N2 and N3, the phase offsets for the stimulation condition were −10.2° ± 74.5° (mean ± SD; median −6.3°) and for the sham condition −4.1° ± 72.4° (median −1.24°; Figure 2). Targeting was therefore slightly earlier than the intended physiological 0°, but the 50 ms stimulus still spanned the intended rising-to-positive half-wave. Of all stimulation events, 41.08% occurred in N2, 56.49% in N3, and 2.43% in other stages. Mean vector length was 0.45 for stimulation events, and 0.46 for sham, showing moderate concentration around the target phase in both conditions.
These findings demonstrate that home-based M-CLNS can target SO phase accurately during unsupervised home use.
3.4. Event-Related Potentials
Grand-average ERPs revealed a clear enhancement of an SO-like dynamic in the stimulation condition relative to sham. Statistical comparison showed two significant time ranges (0.52–0.87 s and 1.03–1.39 s after stimulus onset; cluster-corrected p < 0.05), reflecting a sequence of more pronounced slow deflections that extended across approximately one additional SO cycle (Figure 3).
These results show an immediate enhancement of the SO-like deflection. This may indicate increased amplitude or occurrence of slow oscillations, or a more stereotyped morphology of the stimulation-evoked slow wave leading to stronger phase alignment.
3.5. Time-Frequency Analyses
To assess short-term spectral effects of M-CLNS, stimulation-minus-sham time–frequency power was compared around each marker. The comparisons revealed a significant increase in the SO range after stimulus onset, together with a significant increase in the sleep spindle frequency range, indicating that the evoked response extended beyond the directly targeted SO band. The first significant cluster spanned 0.36–1.09 s and 0.5–12.03 Hz (extending to 17.30 Hz), coinciding approximately with the stimulation-enhanced negative deflection in the ERP. The second cluster spanned 1.09–1.67 s and 9.31–19.08 Hz (Figure 4), coinciding approximately with the stimulation-enhanced positive deflection in the ERP.
These findings show that M-CLNS using acoustic stimulation can enhance SO activity in the seconds after each stimulus, and that this short-term effect is accompanied by increased power in the spindle range.
4. Discussion
In this study, we examined whether a self-administered EEG headband can support repeated, phase-targeted acoustic stimulation outside the controlled laboratory environment in adults with maintenance insomnia symptoms. Across hundreds of nights in a real-world home setting, real-time SO-phase targeting remained accurate and elicited a stimulus-locked SO response accompanied by increased power in the SO and sleep spindle bands. These findings provide initial evidence for the feasibility of modeling-based closed-loop acoustic stimulation of slow oscillations during unsupervised, longitudinal home use.
The evoked SO response and the two stimulus-locked power clusters closely resemble the electrophysiological signature reported in laboratory studies of acoustic stimulation, characterized by an early SO range increase followed by a later spindle band increase around the evoked upwave (Cox et al., 2014; Ngo et al., 2013, 2015; Papalambros et al., 2017). In these studies, the later cluster has been shown to reflect fast spindle activity nested within the evoked SO, consistent with SO–spindle coupling and, in some protocols, associated with declarative memory retention (Ngo et al., 2013; Staresina et al., 2023; Koller et al., 2025). The present findings indicate that unsupervised home M-CLNS in individuals with maintenance insomnia symptoms can reproduce an acute electrophysiological response previously observed with acoustic stimulation under controlled laboratory conditions.
The amplitude of the pre-stimulus SOs and of the evoked response was lower than typically observed with laboratory-based mastoid-referenced EEG recordings. This is consistent with the use of a short-distance forehead derivation, which captures more local potential differences than a frontal–mastoid montage (Esfahani et al., 2023; Jongejan et al., 2025). From a stimulation perspective, low amplitude is relevant because polysomnography-based closed-loop studies have typically required SOs to exceed a fixed amplitude threshold for stimulation (Piorecky et al., 2021; Dudysová et al., 2024). This threshold excludes lower-amplitude SOs from stimulation, thereby reducing the number of available stimulation opportunities. This drawback may be compounded in sleep disorders like insomnia, where reduced slow-wave activity may already result in fewer SOs being available for stimulation (Zhao et al., 2021; Hogan et al., 2020). In their PSG-based acoustic stimulation study of 17 insomnia patients, Dudysová et al. (2024) reported a mean of only 126 two-click cycles per night. M-CLNS instead uses a flexible, amplitude-agnostic detection approach. This resulted in a high density of approximately 600 stimulation events per night. Thus, despite the relatively low absolute amplitudes of forehead EEG and potentially altered SO characteristics in insomnia, the M-CLNS approach allowed a substantial number of SOs to remain eligible for closed-loop stimulation.
A remaining constraint was the signal quality of the self-applied headband EEG. Of 497 experimental nights, only 330 (66.4%) were retained. Sweat-related artifacts were the primary source of signal degradation and were visually most evident during N3. This may be particularly problematic for the forehead montage used here, as the recording electrodes, reference, and ground are positioned close together over the same glabrous skin, a region characterized by a high density of eccrine sweat glands and high local sweat output (Taylor & Machado-Moreira, 2013). Sweating may therefore alter the electrode–skin impedance at one or more contacts, with impedance changes at even a single electrode potentially introducing artifacts into each derivation containing that electrode. This experience is consistent with previous wearable EEG literature describing sweat-related changes in electrode impedance in dry and minimally gelled electrode systems, including forehead-mounted sleep EEG devices (Kalevo et al., 2020; Leach et al., 2020). Overall, the extensive data loss substantially reduced the number of usable consecutive nights and, consequently, the opportunity to assess enduring effects of SO stimulation across multiple nights. Longitudinal effects of repeated SO stimulation were therefore not evaluated. Importantly, these observations indicate engineering constraints associated with the electrode configuration and skin–electrode interface that affected data retention and recording quality, rather than a fundamental limitation of real-time SO-phase targeting.
Such constraints may be addressed through optimization of the headband configuration. Salfi et al. (2026), for example, adapted the ZMax headband by relocating the reference electrode from the forehead site to the mastoid and using alternative Ag/AgCl electrodes, resulting in more consistent, polysomnography-comparable signal quality. Building on this approach, future unsupervised home acoustic stimulation implementations could adopt a similarly adapted montage, complemented by online signal-quality monitoring and feedback to identify deteriorating electrode contact, for instance, during placement of the equipment, and thereby improve data retention and recording robustness.
With regard to sleep composition, we did not observe differences in sleep architecture between stimulation and sham nights, indicating that the acoustic stimulation protocol did not measurably alter overall sleep structure. Specifically, total sleep time and sleep efficiency were preserved across participants, providing no evidence that repeated exposure to the stimulation disrupted sleep continuity. This finding is consistent with laboratory M-CLNS studies (Jongejan et al., 2025; Koller et al., 2025; van der Heijden et al., 2024) and with closed-loop auditory stimulation in insomnia (Dudysová et al., 2024; Piorecky et al., 2021). The absence of detectable sleep disruption at the level of sleep composition may be particularly relevant for individuals with insomnia symptoms, as interventions that introduce additional nocturnal discomfort or adversely affect sleep initiation, maintenance, or perceived sleep quality could be difficult to sustain. Consistent with this, participants completed the full three-week protocol despite their underlying sleep difficulties, providing preliminary evidence that M-CLNS-based acoustic stimulation with the EEG headband can be tolerated over repeated nights in poor sleepers. These findings extend the previous laboratory-based application of M-CLNS-based acoustic stimulation in patients with post-traumatic stress disorder (van der Heijden et al., 2024), supporting the tolerability of the intervention in individuals suffering from hyperarousal and sleep difficulties.
Several limitations of this study should be considered. First, eligibility was based on self-reported maintenance insomnia symptoms using the ISI rather than a clinician-confirmed diagnosis. The sample was also restricted to individuals with maintenance insomnia symptoms, so the findings may not generalize to other insomnia phenotypes, including sleep-onset insomnia. Second, recordings were obtained in participants’ own homes. Temperature, environmental noise, bed partners, and other contextual factors were therefore not controlled, and their influence on sleep cannot be separated from the effects of stimulation in the present design. Third, ISI scores were obtained only at screening, for inclusion/exclusion decisions, and not after the stimulation and sham weeks. Consequently, associations between electrophysiological effects and changes in symptom severity could not be examined.
Taken together, these findings support the feasibility of repeated, self-administered acoustic stimulation in adults with maintenance insomnia symptoms and demonstrate that phase-targeted stimulation can elicit SO and spindle activity under unsupervised home conditions. At the same time, they underscore the challenges associated with reliable EEG recording using self-applied wearables in uncontrolled home conditions. Despite a decade of development, the trade-offs between comfort and ease of use for untrained users, on the one hand, and signal quality, on the other, remain a challenge. This holds especially for sleep EEG, where comfort is essential and head movements against the pillow tend to displace sensors. These issues will need to be solved before the benefits of EEG-based longitudinal interventions can be deployed and assessed.
The present study, thus, primarily examined the feasibility of operating acoustic stimulation during unsupervised home use in individuals with self-reported insomnia symptoms, rather than its potential efficacy for treating insomnia disorder. An outstanding question is whether the observed acute SO enhancement, when sustained over longer periods, contributes to deeper sleep, better daytime functioning, or reduced insomnia symptom severity. Future longitudinal studies, using more reliable self-applied EEG setups, should therefore assess whether repeated acoustic stimulation produces sustained changes in sleep architecture and daytime functioning that are accompanied by clinically meaningful alleviation of insomnia symptoms.
5. Conclusions
This study shows that real-time, phase-targeted acoustic stimulation of slow oscillations can be implemented during unsupervised, longitudinal home use with a self-applied EEG headband in adults with self-reported maintenance insomnia symptoms. By showing that SO-phase targeting, stimulus-locked SO enhancement, and spindle-band activity can be maintained outside the laboratory in poor sleepers, it provides a technical foundation for clinical trials in insomnia and potentially other populations with SWS depletion.
6. Patents
Lucia Talamini is an inventor of the patented modeling-based closed-loop neurostimulation method utilized in this study.
Author Contributions
Conceptualization & Methodology: S. L. J. and L. M. T.; Data collection: S. L. J.; Programming: S. L. J., F. C.; Formal Analysis: S. L. J., F. C.; Writing – original draft preparation, F.C., A. C. v. d. H.; writing – review and editing, S. L. J., R.C., A. C. v. d. H., L. M. T; Supervision: R.C., A. C. v. d. H., L M. T.; Writing: all authors contributed to manuscript writing and editing; All authors have read and agreed to the published version of the manuscript.
Funding
This research received no external funding.
Institutional Review Board Statement
The study was conducted in accordance with the Declaration of Helsinki, and approved by the Ethics Committee of the University of Amsterdam for studies involving humans.
Informed Consent Statement
Informed consent was obtained from all subjects involved in the study.
Data Availability Statement
The datasets presented in this article are not readily available due to privacy restrictions. Requests to access the datasets should be directed to the corresponding author.
Conflicts of Interest
Lucia M. Talamini is an inventor of the patented modeling-based closed-loop neurostimulation method utilized in this study. Authors are employed by (FC, ACvdH), and/or hold a financial stake in (LMT, RC, SLJ), Deep Sleep Technologies. The authors declare no other conflicts of interest.
References
- Barker, M. J., Greenwood, K. M., Jackson, M., & Crowe, S. F. (2004). Cognitive effects of long-term benzodiazepine use: A meta-analysis. CNS Drugs, 18(1), 37–48. [CrossRef]
- Bastien, C. H., Vallières, A., & Morin, C. M. (2001). Validation of the Insomnia Severity Index as an outcome measure for insomnia research. Sleep Medicine, 2(4), 297–307. [CrossRef]
- Benjamini, Y., & Yekutieli, D. (2001). The control of the false discovery rate in multiple testing under dependency. The Annals of Statistics, 29(4), 1165–1188. [CrossRef]
- Besedovsky, L., Lange, T., & Born, J. (2012). Sleep and immune function. Pflügers Archiv, 463(1), 121–137. [CrossRef]
- Carrier, J., Viens, I., Poirier, G., Robillard, R., Lafortune, M., Vandewalle, G., Martin, N., Barakat, M., Paquet, J., & Filipini, D. (2011). Sleep slow wave changes during the middle years of life. European Journal of Neuroscience, 33(4), 758–766. [CrossRef]
- Cox, R., Korjoukov, I., de Boer, M., & Talamini, L. M. (2014). Sound asleep: Processing and retention of slow oscillation phase-targeted stimuli. PLOS ONE, 9(7), e101567. [CrossRef]
- Danilenko, K. V., Kobelev, E., Yarosh, S. V., Khazankin, G. R., Brack, I. V., Miroshnikova, P. V., & Aftanas, L. I. (2020). Effectiveness of visual vs. acoustic closed-loop stimulation on EEG power density during NREM sleep in humans. Clocks & Sleep, 2(2), 172–181. [CrossRef]
- Diekelmann, S., & Born, J. (2010). The memory function of sleep. Nature Reviews Neuroscience, 11(2), 114–126. [CrossRef]
- Dudysová, D., Janků, K., Piorecký, M., Hantáková, V., Orendáčová, M., Piorecká, V., Štrobl, J., Kliková, M., Ngo, H.-V. V., & Kopřivová, J. (2024). Closed-loop auditory stimulation of slow-wave sleep in chronic insomnia: a pilot study. Journal of Sleep Research, 33(6), e14179. [CrossRef]
- Dworak, M., McCarley, R. W., Kim, T., Kalinchuk, A. V., & Basheer, R. (2010). Sleep and brain energy levels: ATP changes during sleep. The Journal of Neuroscience, 30(26), 9007–9016. [CrossRef]
- Esfahani, M. J., Weber, F. D., Boon, M., Anthes, S., Almazova, T., van Hal, M., van Keuren, Y., Heuvelmans, C., Simo, E., Bovy, L., Andrade, K. C., Appel, K., Aumayer, L., Boussetta, A., Brandl, A., van den Bulk, L., Coppens, J., Diushekeeva, A., Evrard, A., ... Dresler, M. (2023). Validation of the sleep EEG headband ZMax. bioRxiv. [CrossRef]
- Gramfort, A., Luessi, M., Larson, E., Engemann, D. A., Strohmeier, D., Brodbeck, C., Goj, R., Jas, M., Brooks, T., Parkkonen, L., & Hämäläinen, M. (2013). MEG and EEG data analysis with MNE-Python. Frontiers in Neuroscience, 7, 267. [CrossRef]
- Harris, C. R., Millman, K. J., van der Walt, S. J., Gommers, R., Virtanen, P., Cournapeau, D., Wieser, E., Taylor, J., Berg, S., Smith, N. J., Kern, R., Picus, M., Hoyer, S., van Kerkwijk, M. H., Brett, M., Haldane, A., del Río, J. F., Wiebe, M., Peterson, P., ... Oliphant, T. E. (2020). Array programming with NumPy. Nature, 585(7825), 357–362. [CrossRef]
- Hogan, S. E., Delgado, G. M., Hall, M. H., Nimgaonkar, V. L., Germain, A., Buysse, D. J., & Wilckens, K. A. (2020). Slow-oscillation activity is reduced and high frequency activity is elevated in older adults with insomnia. Journal of Clinical Sleep Medicine, 16(9), 1445–1454. [CrossRef]
- Holbrook, A. M., Crowther, R., Lotter, A., Cheng, C., & King, D. (2000). Meta-analysis of benzodiazepine use in the treatment of insomnia. CMAJ, 162(2), 225–233. https://www.cmaj.ca/content/162/2/225.
- Huwiler, S., Carro-Domínguez, M., Stich, F., Sala, R., Aziri, F., Trippel, A., Ryf, T., Markendorf, S., Niederseer, D., Bohm, P., Stoll, G., Laubscher, L., Thevan, J., Spengler, C. M., Gawinecka, J., Osto, E., Huber, R., Wenderoth, N., Schmied, C., & Lustenberger, C. (2024). Slow waves during deep sleep support cardiac function. Current Issues in Sport Science, 9, 004. [CrossRef]
- Jongejan, S. L., van der Heijden, A. C., & Talamini, L. M. (2025). Deepening sleep using an EEG wearable featuring modelling-based closed-loop neurostimulation. bioRxiv. [CrossRef]
- Jongejan, S. L., van der Heijden, A. C., Patriota, J., & Talamini, L. M. (2024). Predicting and phase targeting brain oscillations in real-time. bioRxiv. [CrossRef]
- Kalevo, L., Miettinen, T., Leino, A., Kainulainen, S., Korkalainen, H., Myllymaa, K., Töyräs, J., Leppänen, T., Laitinen, T., & Myllymaa, S. (2020). Effect of sweating on electrode-skin contact impedances and artifacts in EEG recordings with various screen-printed Ag/AgCl electrodes. IEEE Access, 8, 50934–50943. [CrossRef]
- Koffel, E., Branson, M., Amundson, E., & Wisdom, J. P. (2021). “Sign me up, I’m ready!”: Helping patients prescribed sleeping medication engage with cognitive behavioral therapy for insomnia (CBT-I). Behavioral Sleep Medicine, 19(5), 629–639. [CrossRef]
- Koller, D. P., Hubregtse, K., van der Heijden, A. C., & Talamini, L. M. (2025). Precisely phase-locked acoustic stimuli globally enhance slow oscillations, but depress fast spindles. bioRxiv. [CrossRef]
- Leach, S., Chung, K., Tüshaus, L., Huber, R., & Karlen, W. (2020). A protocol for comparing dry and wet EEG electrodes during sleep. Frontiers in Neuroscience, 14, 586. [CrossRef]
- Lee, Y. F., Gerashchenko, D., Timofeev, I., Bacskai, B. J., & Kastanenka, K. V. (2020). Slow wave sleep is a promising intervention target for Alzheimer’s disease. Frontiers in Neuroscience, 14, 705. [CrossRef]
- Manconi, M., Ferri, R., Miano, S., Maestri, M., Bottasini, V., Zucconi, M., & Ferini-Strambi, L. (2017). Sleep architecture in insomniacs with severe benzodiazepine abuse. Clinical Neurophysiology, 128(6), 875–881. [CrossRef]
- McKinney, W. (2010). Data structures for statistical computing in Python. In S. van der Walt & J. Millman (Eds.), Proceedings of the 9th Python in Science Conference (pp. 56–61). [CrossRef]
- Morin, C. M., & Jarrin, D. C. (2022). Epidemiology of insomnia: Prevalence, course, risk factors, and public health burden. Sleep Medicine Clinics, 17(2), 173–191. [CrossRef]
- Navarrete, M., Schneider, J., Ngo, H.-V. V., Valderrama, M., Casson, A. J., & Lewis, P. A. (2020). Examining the optimal timing for closed-loop auditory stimulation of slow-wave sleep in young and older adults. Sleep, 43(6), zsz315. [CrossRef]
- Neu, D., Mairesse, O., Verbanck, P., & Le Bon, O. (2015). Slow wave sleep in the chronically fatigued: Power spectra distribution patterns in chronic fatigue syndrome and primary insomnia. Clinical Neurophysiology, 126(10), 1926–1933. [CrossRef]
- Ngo, H.-V. V., Martinetz, T., Born, J., & Mölle, M. (2013). Auditory closed-loop stimulation of the sleep slow oscillation enhances memory. Neuron, 78(3), 545–553. [CrossRef]
- Ngo, H.-V. V., Miedema, A., Faude, I., Martinetz, T., Mölle, M., & Born, J. (2015). Driving sleep slow oscillations by auditory closed-loop stimulation—A self-limiting process. The Journal of Neuroscience, 35(17), 6630–6638. [CrossRef]
- Ohayon, M. M. (2002). Epidemiology of insomnia: What we know and what we still need to learn. Sleep Medicine Reviews, 6(2), 97–111. [CrossRef]
- OkazoLab. (2019). EventIDE (Version 21.11.2019) [Computer software]. https://www.okazolab.com/.
- Ong, J. L., Lo, J. C., Chee, N. I. Y. N., Santostasi, G., Paller, K. A., Zee, P. C., & Chee, M. W. L. (2016). Effects of phase-locked acoustic stimulation during a nap on EEG spectra and declarative memory consolidation. Sleep Medicine, 20, 88–97. [CrossRef]
- Papalambros, N. A., Santostasi, G., Malkani, R. G., Braun, R. G., Weintraub, S., Paller, K. A., & Zee, P. C. (2017). Acoustic enhancement of sleep slow oscillations and concomitant memory improvement in older adults. Frontiers in Human Neuroscience, 11, 109. [CrossRef]
- Pathak, V., Juan, E., van der Goot, R., & Talamini, L. M. (2021). The looping lullaby: Closed-loop neurostimulation decreases sleepers’ sensitivity to environmental noise. bioRxiv. [CrossRef]
- Pillai, V., Kalmbach, D. A., & Ciesla, J. A. (2011). A meta-analysis of electroencephalographic sleep in depression: Evidence for genetic biomarkers. Biological Psychiatry, 70(10), 912–919. [CrossRef]
- Piorecky, M., Koudelka, V., Piorecka, V., Strobl, J., Dudysova, D., & Koprivova, J. (2021). Real-time excitation of slow oscillations during deep sleep using acoustic stimulation. Sensors, 21(15), 5169. [CrossRef]
- Proctor, A., & Bianchi, M. T. (2012). Clinical pharmacology in sleep medicine. ISRN Pharmacology, 2012, 914168. [CrossRef]
- Ratnavadivel, R., Chau, N., Stadler, D., Yeo, A., McEvoy, R. D., & Catcheside, P. G. (2009). Marked reduction in obstructive sleep apnea severity in slow wave sleep. Journal of Clinical Sleep Medicine, 5(6), 519–524. [CrossRef]
- Riemann, D., Baglioni, C., Bassetti, C., Bjorvatn, B., Dolenc Groselj, L., Ellis, J. G., Espie, C. A., Garcia-Borreguero, D., Gjerstad, M., Gonçalves, M., Hertenstein, E., Jansson-Fröjmark, M., Jennum, P. J., Leger, D., Nissen, C., Parrino, L., Paunio, T., Pevernagie, D., Verbraecken, J., ... Spiegelhalder, K. (2017). European guideline for the diagnosis and treatment of insomnia. Journal of Sleep Research, 26(6), 675–700. [CrossRef]
- Roth, T. (2007). Insomnia: Definition, prevalence, etiology, and consequences. Journal of Clinical Sleep Medicine, 3(5 Suppl.), S7–S10. [CrossRef]
- Roüast, N. M., Kumral, D., Gais, S., & Schönauer, M. (2025). Random auditory stimulation disturbs traveling slow waves and declarative memory. bioRxiv. [CrossRef]
- Salfi, F., Corigliano, D., Amicucci, G., Mombelli, S., D'Atri, A., Axelsson, J., & Ferrara, M. (2026). The potential of ensemble-based automated sleep staging on single-channel EEG signal from a wearable device. Journal of Sleep Research, 35(4), e70282. [CrossRef]
- Schneider-Helmert, D., Whitehouse, I., Kumar, A., & Lijzenga, C. (2001). Insomnia and alpha sleep in chronic non-organic pain as compared to primary insomnia. Neuropsychobiology, 43(2), 54–58. [CrossRef]
- Sousa Martins Silva, A., de Mendonça, F. M. R., de Mendonça, G. P. R. R., Souza, L. C., Galvão, L. P., Paiva, H. S., de Azevedo Marques Périco, C., Torales, J., Ventriglio, A., & Castaldelli-Maia, J. M. (2023). Benzodiazepines and sleep architecture: A systematic review. CNS & Neurological Disorders - Drug Targets, 22(2), 172–179. [CrossRef]
- Staresina, B. P., Niediek, J., Borger, V., Surges, R., & Mormann, F. (2023). How coupled slow oscillations, spindles and ripples coordinate neuronal processing and communication during human sleep. Nature Neuroscience, 26(8), 1429–1437. [CrossRef]
- Tasali, E., Leproult, R., Ehrmann, D. A., & Van Cauter, E. (2008). Slow-wave sleep and the risk of type 2 diabetes in humans. Proceedings of the National Academy of Sciences, 105(3), 1044–1049. [CrossRef]
- Taylor, N. A. S., & Machado-Moreira, C. A. (2013). Regional variations in transepidermal water loss, eccrine sweat gland density, sweat secretion rates and electrolyte composition in resting and exercising humans. Extreme Physiology & Medicine, 2, 4. [CrossRef]
- Vallat, R., & Walker, M. P. (2021). An open-source, high-performance tool for automated sleep staging. eLife, 10, e70092. [CrossRef]
- van der Heijden, A. C., van der Werf, Y. D., van den Heuvel, O. A., Talamini, L. M., & van Marle, H. J. F. (2024). Targeted memory reactivation to augment treatment in post-traumatic stress disorder. Current Biology, 34(16), 3735–3746.e5. [CrossRef]
- van Poppel, E. A. M., & Talamini, L. (2019). Manipulating memory during sleep. Sleep Medicine, 64, S398–S399. [CrossRef]
- Van Rossum, G., & Drake, F. L. (2009). Python 3 reference manual. CreateSpace.
- Virtanen, P., Gommers, R., Oliphant, T. E., Haberland, M., Reddy, T., Cournapeau, D., Burovski, E., Peterson, P., Weckesser, W., Bright, J., van der Walt, S. J., Brett, M., Wilson, J., Millman, K. J., Mayorov, N., Nelson, A. R. J., Jones, E., Kern, R., ... van Mulbregt, P. (2020). SciPy 1.0: Fundamental algorithms for scientific computing in Python. Nature Methods, 17(3), 261–272. [CrossRef]
- Xie, L., Kang, H., Xu, Q., Chen, M. J., Liao, Y., Thiyagarajan, M., O’Donnell, J., Christensen, D. J., Nicholson, C., Iliff, J. J., Takano, T., Deane, R., & Nedergaard, M. (2013). Sleep drives metabolite clearance from the adult brain. Science, 342(6156), 373–377. [CrossRef]
- Zhao, W., Van Someren, E. J. W., Li, C., Chen, X., Gui, W., Tian, Y., Liu, Y., & Lei, X. (2021). EEG spectral analysis in insomnia disorder: A systematic review and meta-analysis. Sleep Medicine Reviews, 59, 101457. [CrossRef]
Figure 1.
Overview of the study protocol. Participants attended an in-person introductory session. The study started with a habituation period, followed by stimulation and sham weeks in randomized order.
Figure 1.
Overview of the study protocol. Participants attended an in-person introductory session. The study started with a habituation period, followed by stimulation and sham weeks in randomized order.
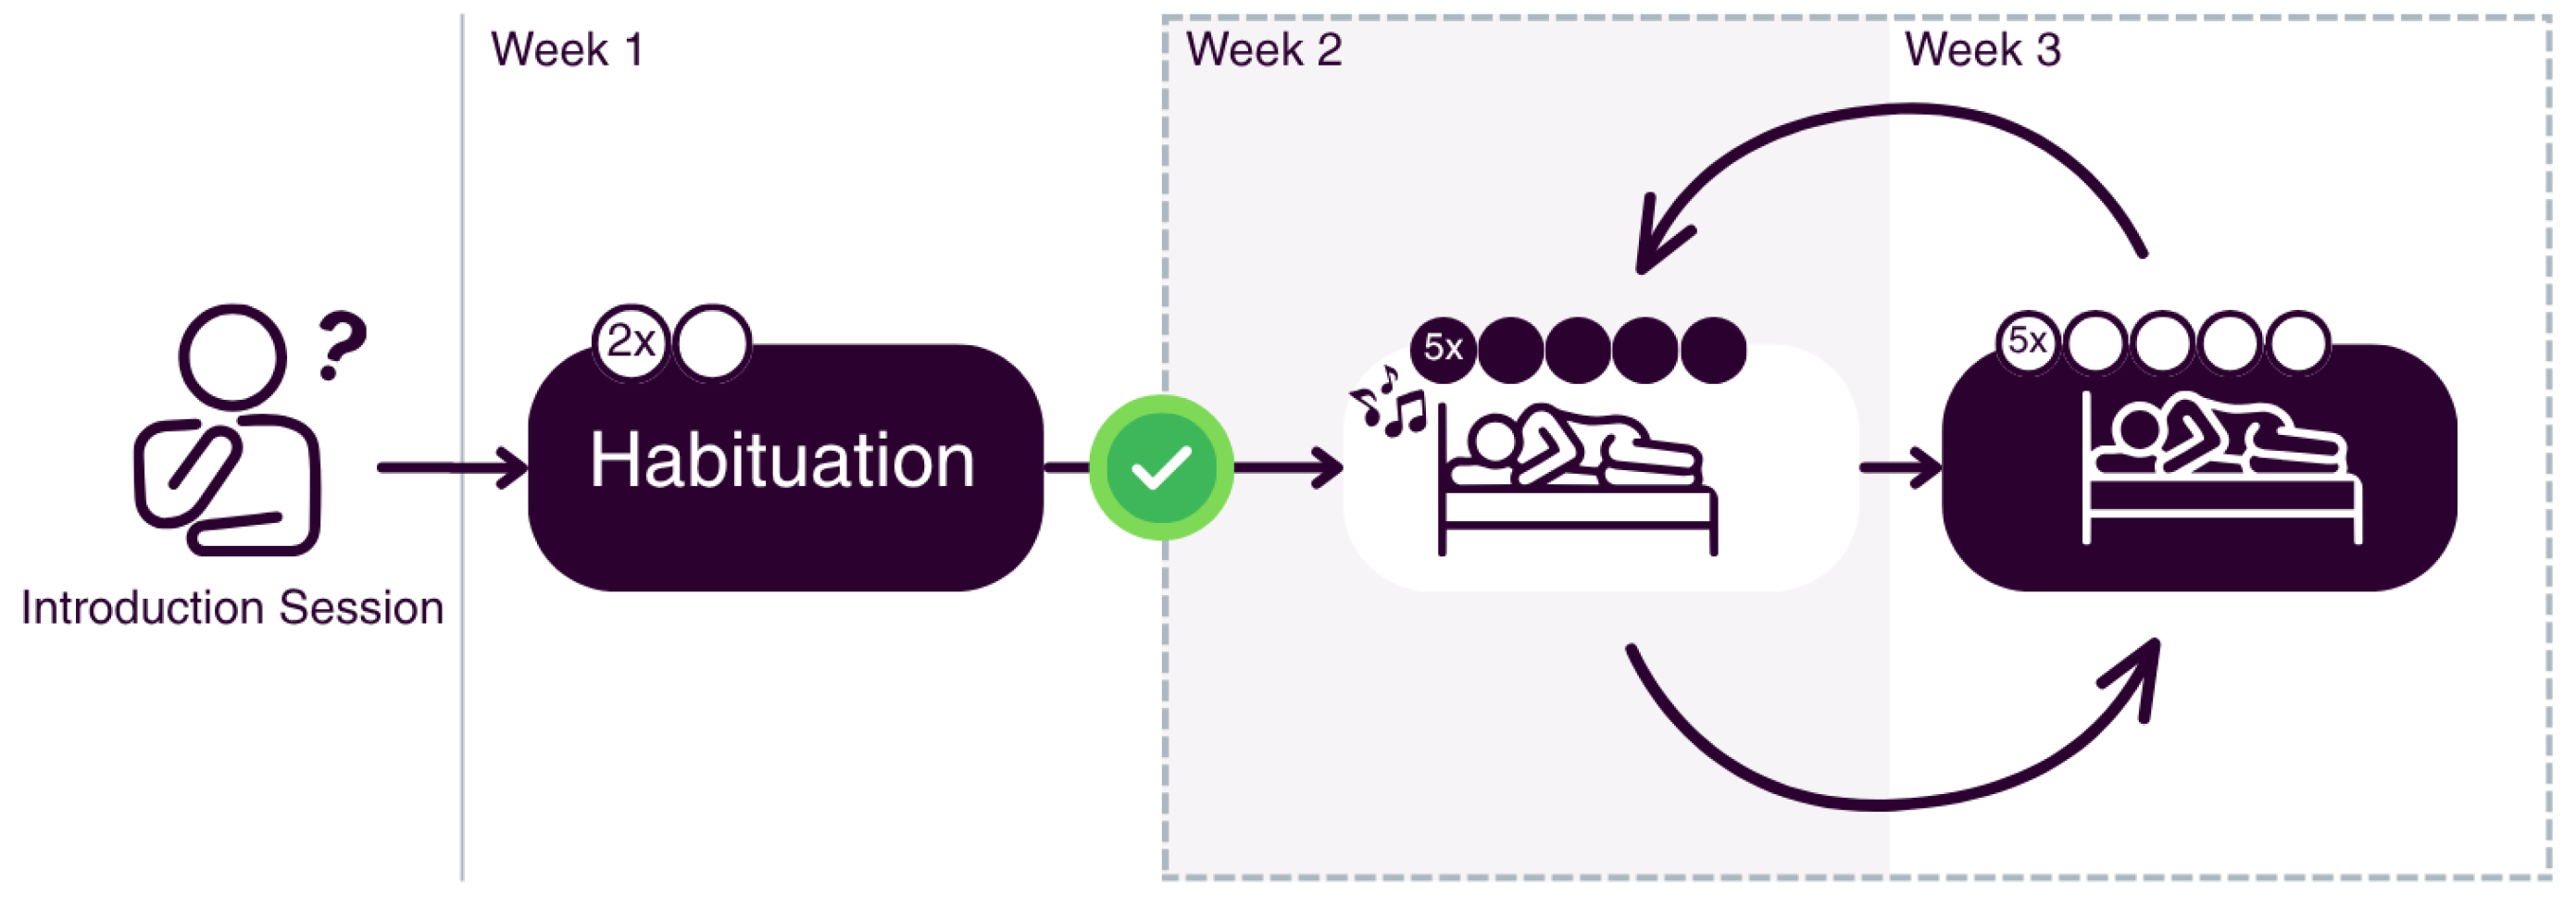
Figure 2.
Phase-targeting performance for slow oscillations recorded from the forehead headband derivation. Circular histograms show stimulus-marker offsets from the intended physiological target (0°, the rising-to-positive SO half-wave after accounting for ZMax polarity inversion) during N2 (left) and N3 (right). Mean and median offsets are indicated. Stimulation: mean −10.2° ± 74.5°, median −6.3°; sham: mean −4.1° ± 72.4°, median −1.24°.
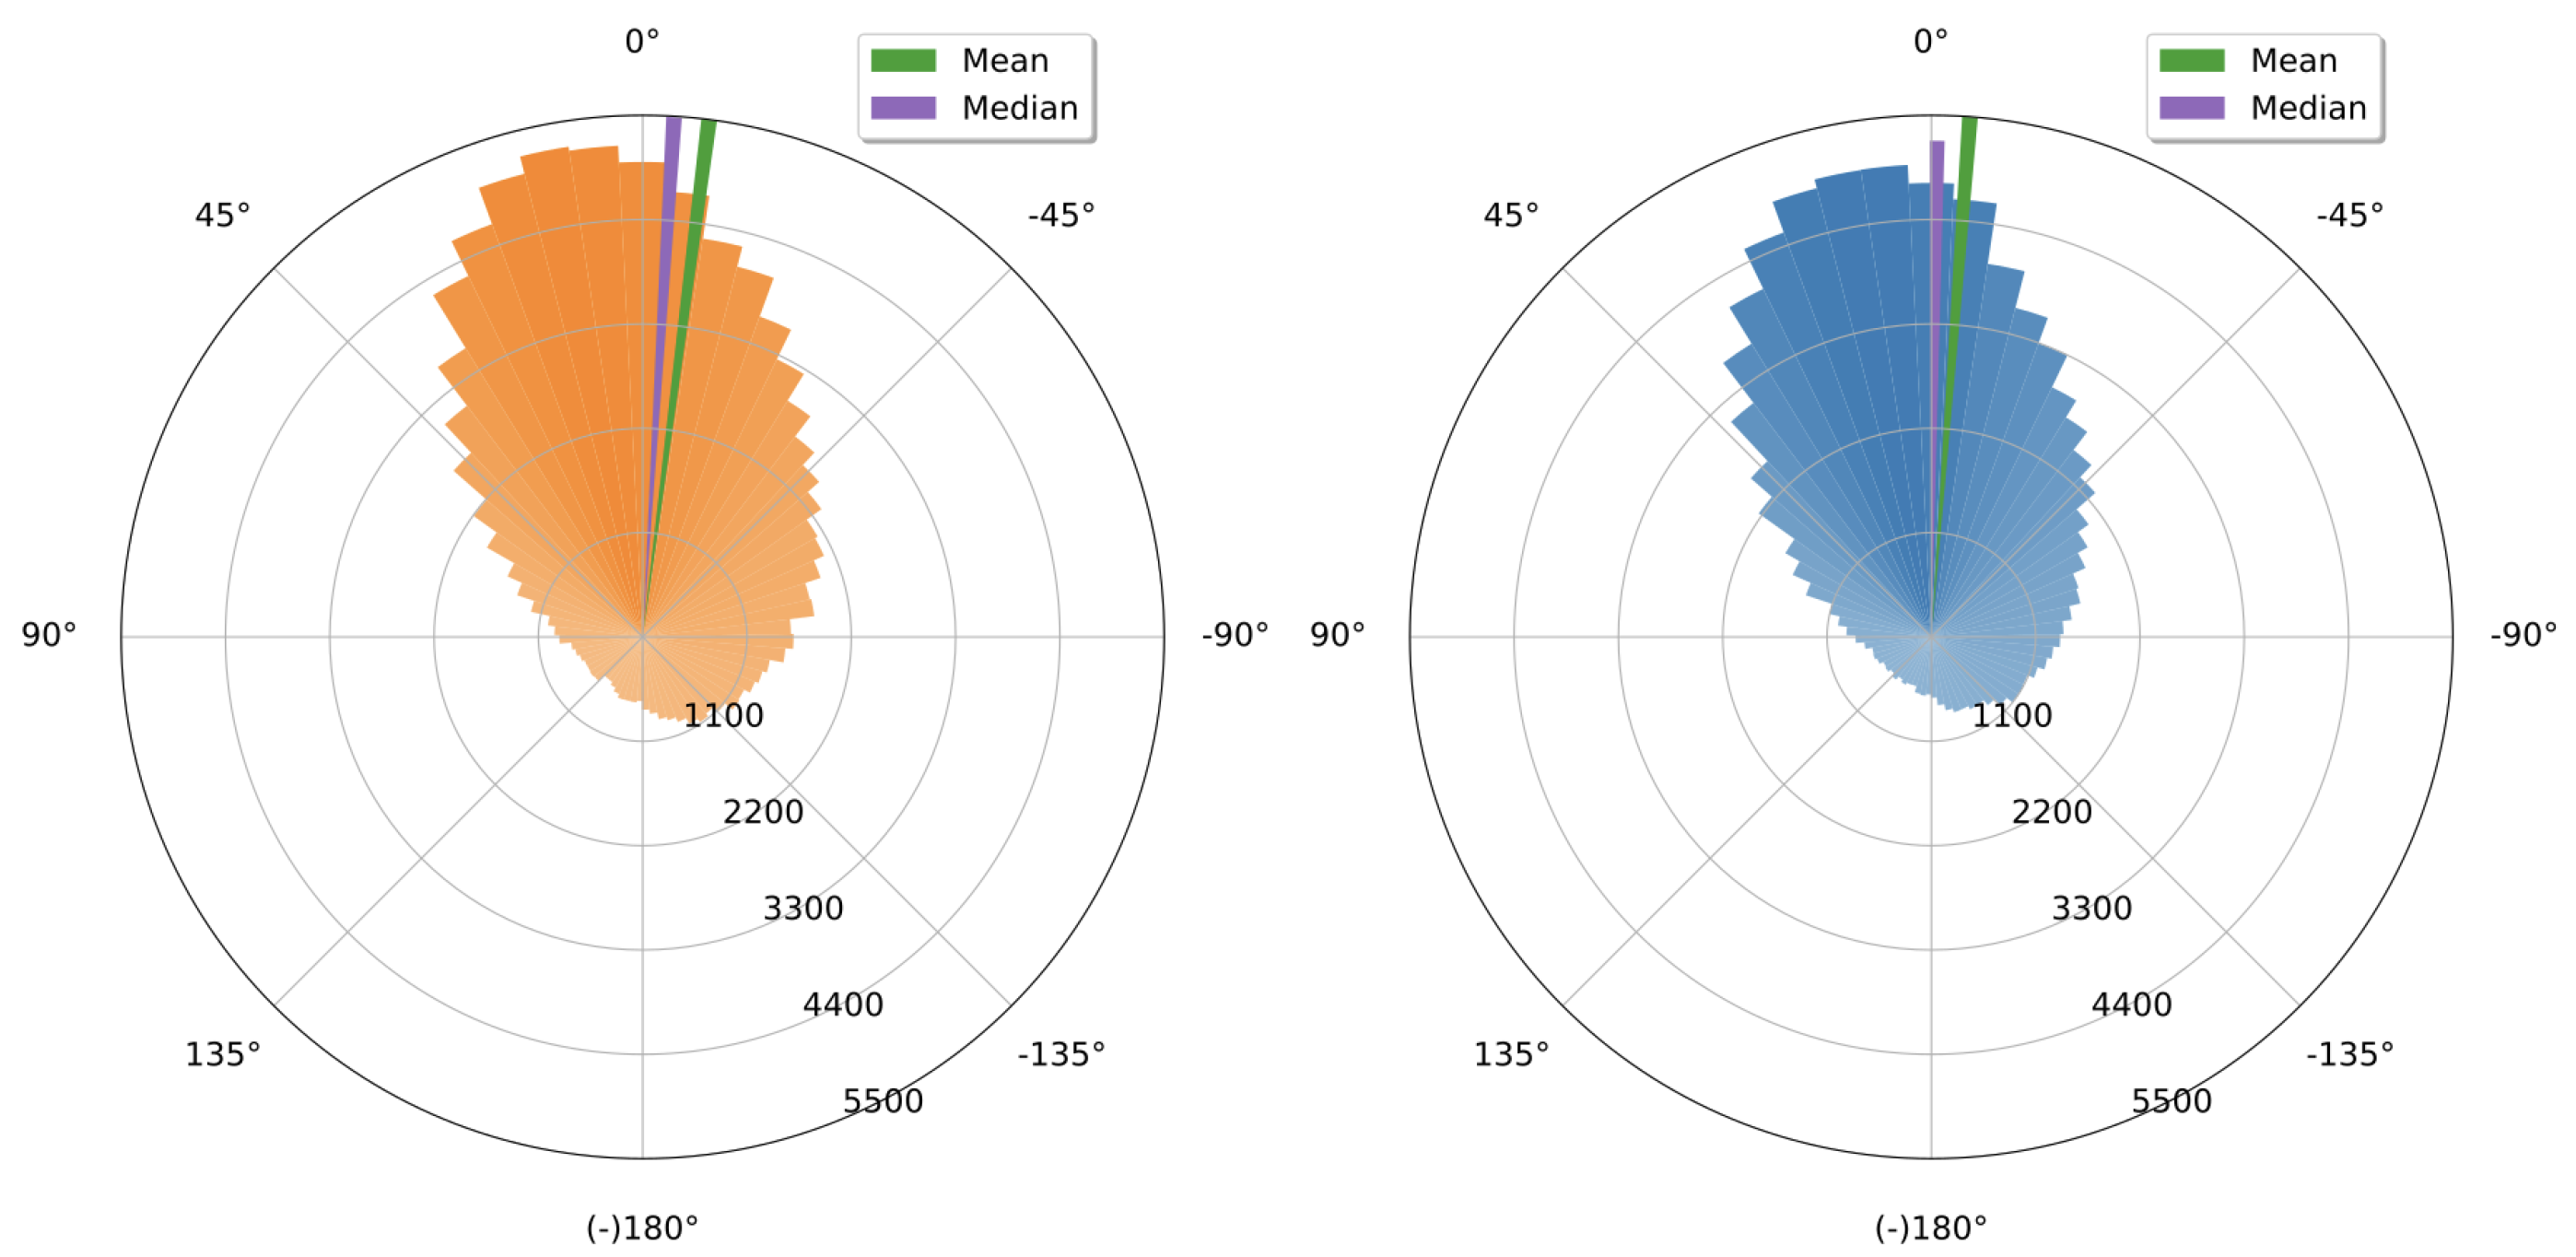
Figure 3.
Stimulus-locked effects of M-CLNS with acoustic stimulation targeting SOs in unsupervised home headband EEG. Grand-average ERPs compare stimulation and sham during N2 and N3 (−1 to +2 s relative to the stimulus onset). Shaded intervals indicate significant stimulation–sham differences after one-dimensional permutation-based cluster correction (p < 0.05) at 0.52–0.87 s and 1.03–1.39 s.
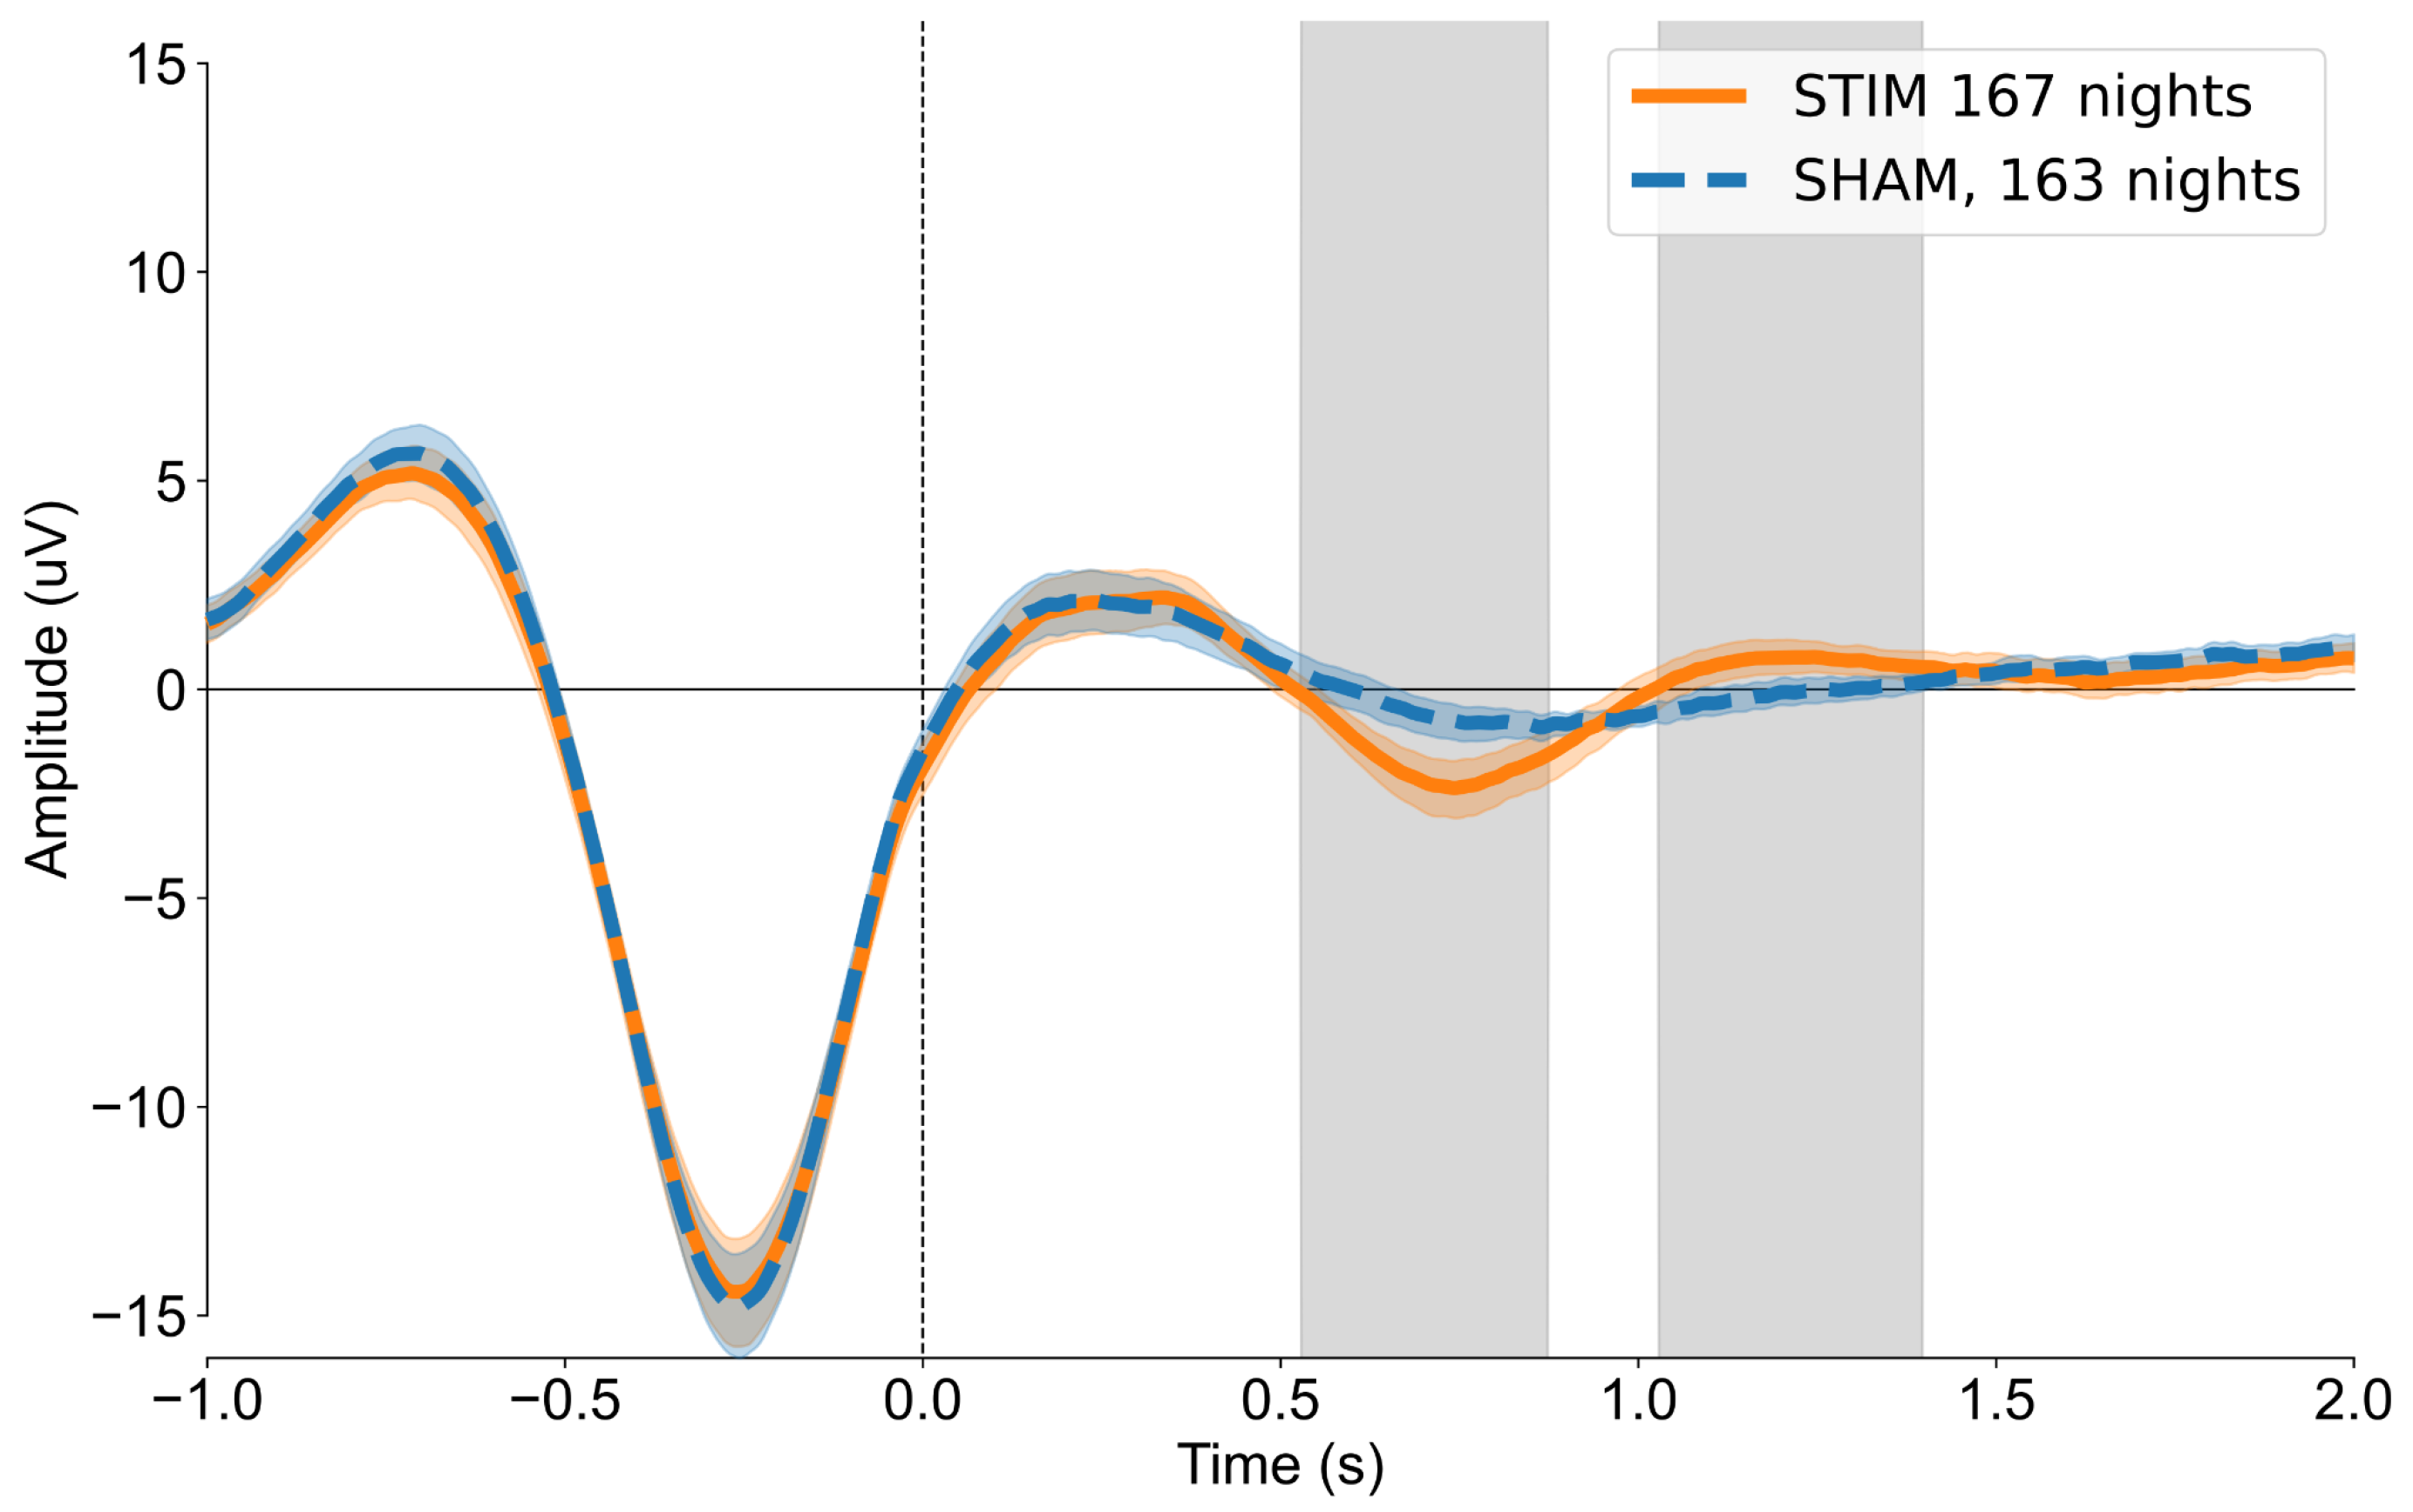
Figure 4.
Stimulus-locked time–frequency difference between stimulation and sham during N2 and N3. Displayed power is the within-subject difference between averaged stimulation and sham trials, with the evoked potential overlaid. Highlighted areas indicate statistically significant clusters after Benjamini–Yekutieli FDR correction (p < 0.01). Warm colors indicate higher power in the stimulation condition. Significant clusters: 0.36–1.09 s, 0.5–12.03 Hz (extending to 17.30 Hz); and 1.09–1.67 s, 9.31–19.08 Hz.
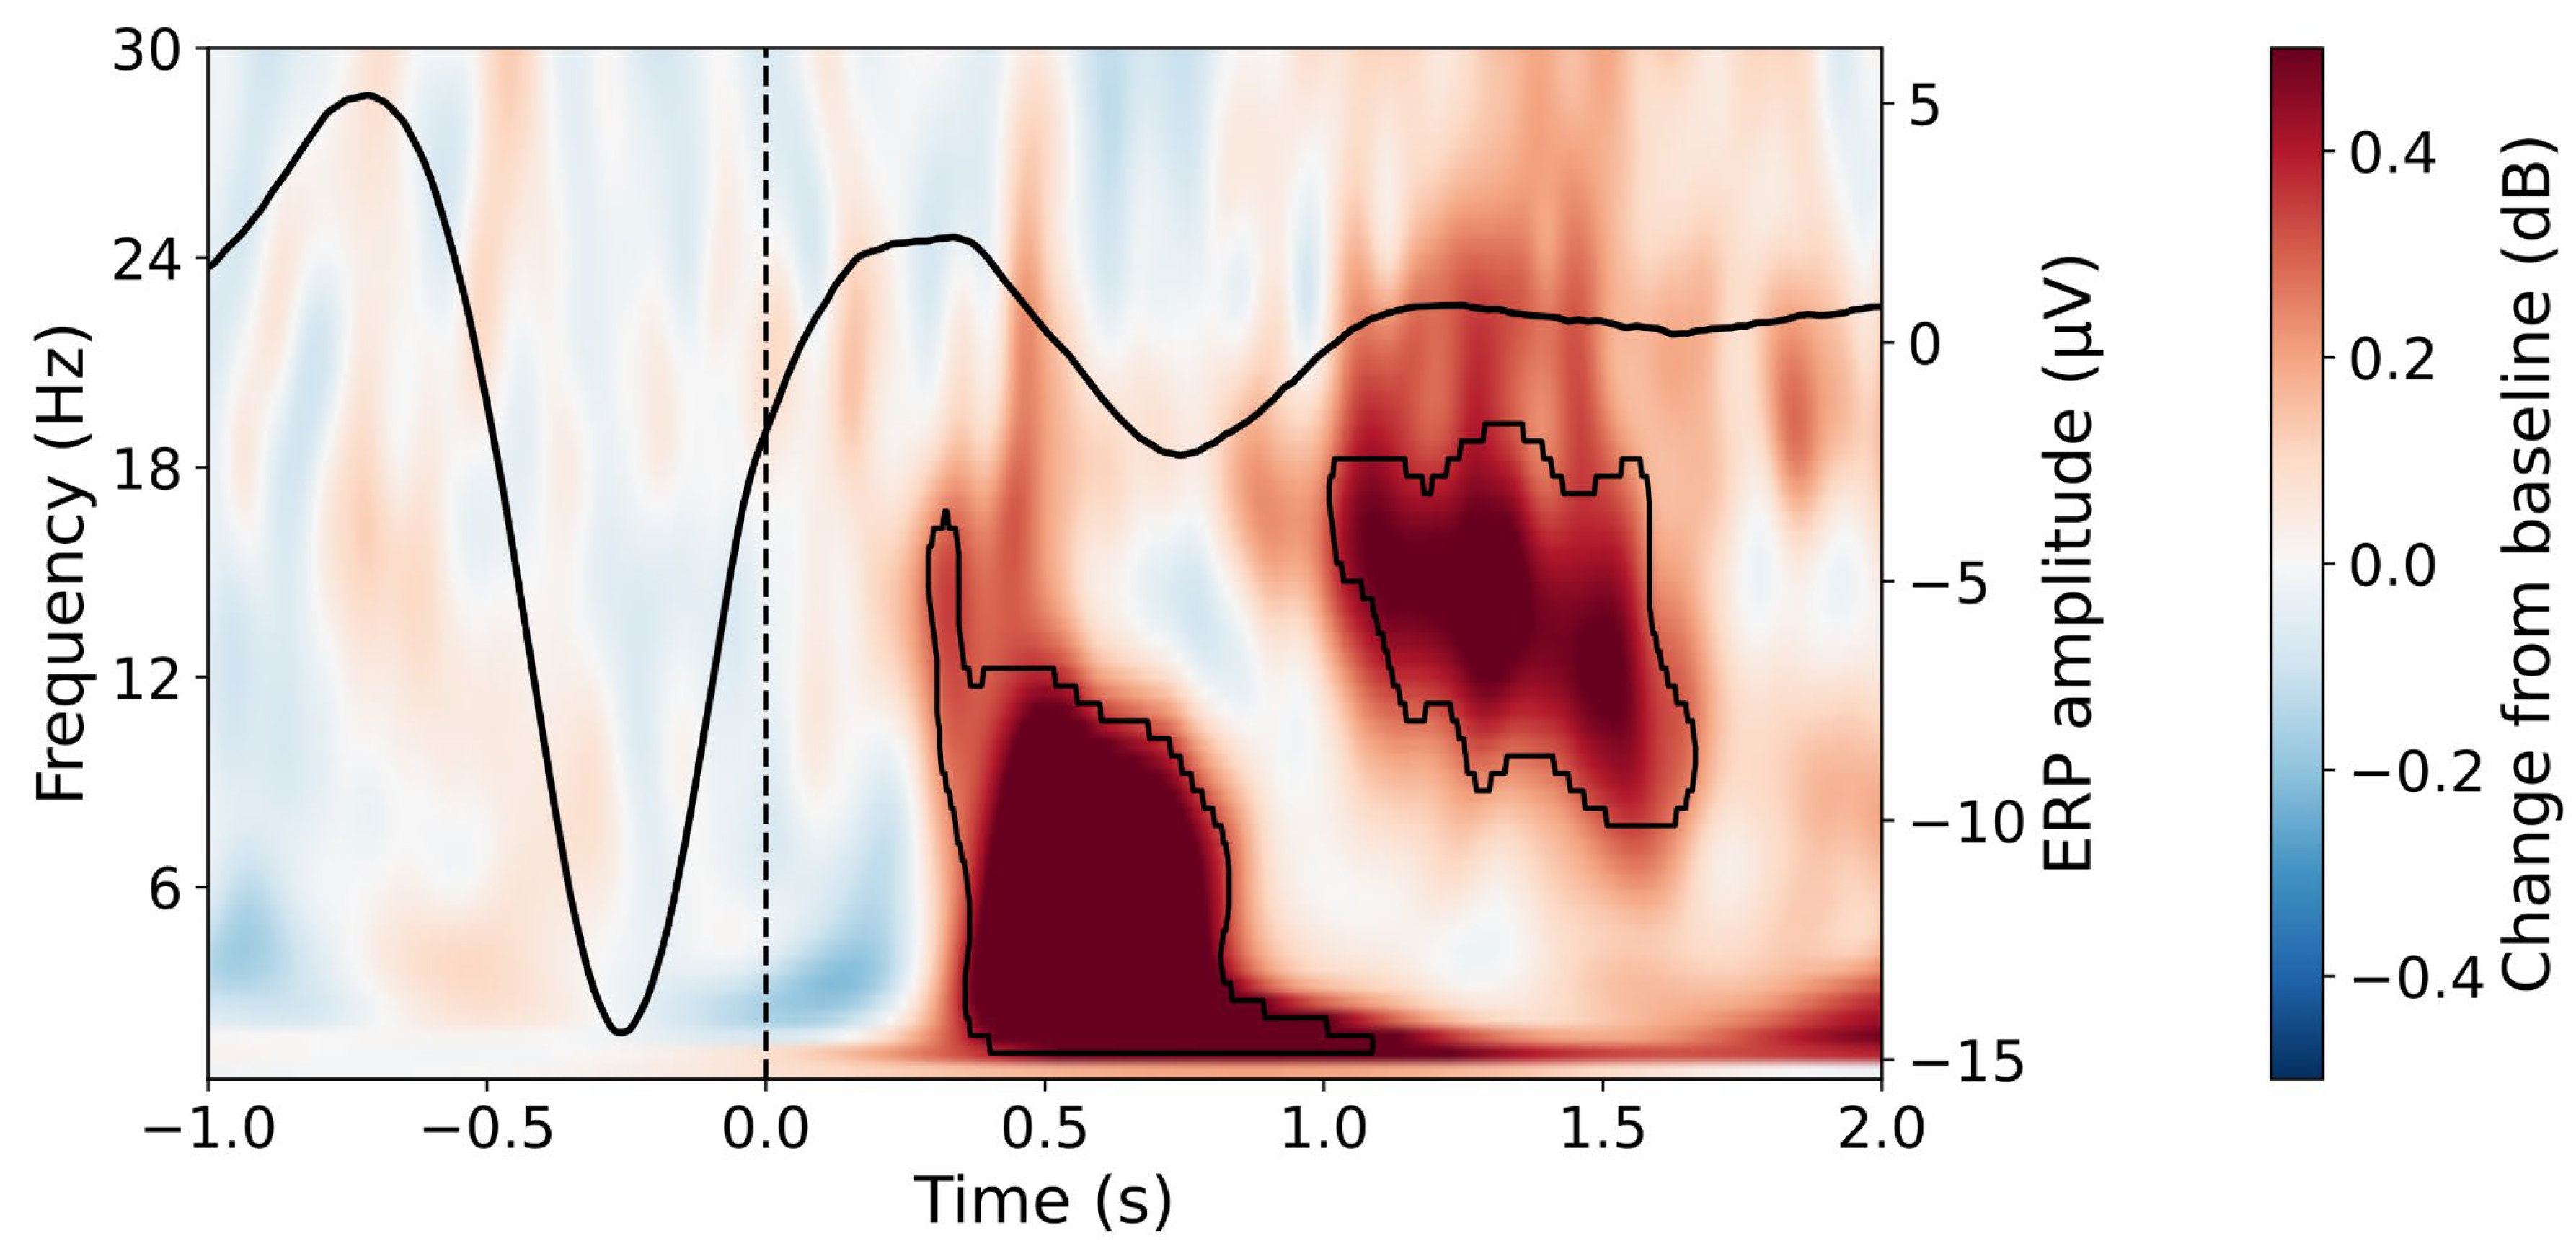

Table 1.
Sleep architecture based on headband EEG. Values are mean ± SD.
| Metric | STIM (mean ± SD) | SHAM (mean ± SD) | p |
|---|---|---|---|
| Sleep onset latency (min) | 6.9 ± 4.5 | 7.6 ± 5.8 | 0.40 |
| N2 latency (min) | 11.1 ± 5.6 | 11.8 ± 8.0 | 0.50 |
| N3 latency (min) | 37.0 ± 21.1 | 38.7 ± 24.9 | 0.60 |
| REM latency (min) | 94.2 ± 33.0 | 89.5 ± 41.7 | 0.40 |
| N1 (%) | 7.8 ± 4.6 | 7.8 ± 4.8 | 1.00 |
| N2 (%) | 59.8 ± 6.6 | 60.1 ± 7.1 | 0.70 |
| N3 (%) | 18.1 ± 4.3 | 17.8 ± 4.5 | 0.60 |
| REM (%) | 14.3 ± 5.1 | 14.3 ± 5.6 | 1.00 |
| WASO (min) | 23.3 ± 15.1 | 27.3 ± 26.5 | 0.20 |
| Sleep efficiency (%) | 92.9 ± 4.1 | 91.8 ± 6.5 | 0.20 |
| Sleep maintenance efficiency (%) | 94.8 ± 3.6 | 93.8 ± 6.3 | 0.30 |
| Total recording duration (min) | 458.7 ± 56.0 | 465.9 ± 60.8 | 0.20 |
| Total sleep duration (min) | 426.8 ± 57.4 | 429.0 ± 68.7 | 0.80 |
WASO: wake after sleep onset. p-values were obtained from paired comparisons between STIM and SHAM. Statistical significance was defined as two-sided p < 0.05.
Disclaimer/Publisher’s Note: The statements, opinions and data contained in all publications are solely those of the individual author(s) and contributor(s) and not of MDPI and/or the editor(s). MDPI and/or the editor(s) disclaim responsibility for any injury to people or property resulting from any ideas, methods, instructions or products referred to in the content. |
© 2026 by the authors. Licensee MDPI, Basel, Switzerland. This article is an open access article distributed under the terms and conditions of the Creative Commons Attribution (CC BY) license (http://creativecommons.org/licenses/by/4.0/).
Copyright: This open access article is published under a Creative Commons CC BY 4.0 license, which permit the free download, distribution, and reuse, provided that the author and preprint are cited in any reuse.