

Submitted:
10 October 2026
Posted:
13 October 2026
You are already at the latest version
Abstract
Nepal’s coffee sector is promoted as a high-value, climate sensitive opportunity for mid-hill smallholders, yet its progress is usually judged by planted area. We harmonise official statistics spanning three decades a national series (1994/95–2013/14), five later national observations (2014/15–2024/25) and district tables for 2013/14 and 2024/25 and triangulate them against FAO yields, trade records and a recent plot level study. Reported plantation area grew from 136 ha to 5,501 ha (10.1% yr⁻¹ after 2013/14), whereas green bean output reached only 642 t; yield on plantation area fell from about 225 kg ha⁻¹ (2013/14) to 117 kg ha⁻¹ (2024/25), 17.5% of Ethiopia’s FAO reported yield. Between 2000/01 and 2013/14, production moved one-for-one with area (elasticity 1.01, R² = 0.94) and yield showed no trend (p = 0.74), a pattern consistent with area-derived production estimates. In 24 matched districts, median yield fell from 238 to 111 kg ha⁻¹ (21 declines; Wilcoxon p < 0.001), but the fall was unrelated to expansion speed (Spearman ρ = -0.05) and occurred in all six slowly expanding districts, which weakens an immature plantation explanation. Three districts (Kavre, Nuwakot, Ilam) supply 46% of output, and Koshi Province holds 31.5% of area but 20.0% of output. Meeting claimed demand of 6,000–8,000 t would need 51,000–69,000 ha at today’s reported yield but 12,000–22,000 ha at plot-level yields of 364–486 kg ha⁻¹. Nepal’s coffee constraint is therefore productivity and measurement rather than land. We propose a bearing area census and plot-level monitoring as preconditions for evidence-based coffee policy.
Keywords:
Coffea arabica
; smallholder agriculture
; yield gap
; agricultural statistics
; Himalayan mid-hills
1. Introduction
Arabica coffee (Coffea arabica L.) is among the few perennial export crops that can be grown profitably on small mid-hill holdings in Nepal. Introduced to Gulmi district in 1938, it remained a curiosity crop for decades before commercial plantings began in the late 1970s and early 1980s, followed by a first processing mill in 1983, the National Tea and Coffee Development Board Act in 1993, a first recorded green-bean export in 1994 and a national Coffee Policy in 2004 (KC et al., n.d.). Successive plans and strategies have since framed coffee as a high-value, organic, export-oriented commodity (Government of Nepal & International Trade Centre [GoN & ITC], 2017; National Tea and Coffee Development Board [NTCDB], 2018). Official documents place the area biophysically suitable for coffee at roughly 1.19 million ha (GoN & ITC, 2017), against a planted area of a few thousand hectares.
Two literatures bear on this opportunity but have rarely been connected. The first is climate-suitability modelling: Ranjitkar et al. (2016) estimate that suitable coffee land covers about 7% of Nepal and warn that, by 2050, it may shrink by about 73% in its current zone while shifting upward by roughly 150 m. This echoes global projections of large losses of Arabica-suitable land (Bunn et al., 2015; Davis et al., 2012). The second is the production-statistics and value-chain literature, which describes smallholder plantings of 100–150 plants, a persistent pest problem and rising but unmet demand (KC et al., n.d.; Tuladhar & Khanal, 2020, as cited in Lotz et al., 2026). What is missing is a systematic, quantitative reading of the official production record itself: how fast did Nepal’s coffee sector actually grow, where, and with what productivity?
This matters because policy targets, donor programmes and investment cases (including seedling subsidies and area-based export targets) are anchored in these statistics. If reported area and reported output diverge, or if production is not measured independently of area, then planting-based indicators may overstate progress, and strategies built on them may misdirect resources. A recent plot-level study in four mid-hill districts reports mean yields of 364 kg ha−1 and a clear shade optimum near 40% canopy cover (Lotz et al., 2026), more than three times the national figure implied by the statistics, which sharpens the question of what the national numbers actually measure.
We therefore ask four questions. (RQ1) How have area, production and yield evolved nationally since 1994/95? (RQ2) How are area and output distributed across provinces and districts, and how did district yields change between 2013/14 and 2024/25? (RQ3) Can the “expansion without yield” pattern be explained by the immaturity of new plantings, or does it point to other mechanisms, including statistical artefacts? (RQ4) What do the data imply for the land area, and the productivity, needed to meet claimed domestic demand? We contribute (i) the first harmonised national–district dataset on Nepali coffee that spans three decades, with a documented data-quality audit; (ii) a falsification-style test of competing explanations for the yield decline; (iii) benchmarking against FAO and plot-level yields; and (iv) a measurement agenda for policy.
2. Background and Conceptual Framework
2.1. Institutional History and Policy Emphasis
Table 1 summarises the institutional milestones documented in the sector literature. Coffee promotion intensified after 2002–2004, when the Coffee Policy and donor supported programmes (notably HELVETAS led coffee promotion from 2003) encouraged farmer groups, wet processing and organic certification (KC et al., n.d.). A 2018–2022 coffee development strategy sought to double output from 434 t by expanding area across 41 districts identified as suitable and by managing pests and diseases (The Himalayan Times, n.d.). A national sector export strategy (GoN & ITC, 2017) pursued quality and certification. All of these instruments emphasise expansion of planted area, and area is the headline indicator in the official statistics.
2.2. Climate Suitability and Agronomy
Ranjitkar et al. (2016) model coffee suitability at roughly 600–1350 m elevation across the mid-hills, estimate that about 7% of Nepal (11% of the agricultural landscape) is currently suitable, and project a loss of 72.6% (±4.4%) of the current coffee-suitable area by 2050, partly offset by 11.9% (±2.3%) of newly suitable land at higher elevations. They also find that coffee banana intercropping is feasible in about 37% of currently suitable areas. Plot-level evidence from four mid-hill districts (n = 27 plots, 525–1275 m) shows yields of 36–1081 kg ha−1 (mean 364), a quadratic response to canopy cover peaking near 40% and a trade off between shade-tree carbon storage and yield (Lotz et al., 2026). The coffee white stem borer (Xylotrechus quadripes) is reported as the most harmful pest in Nepal (Pandey et al., 2022, as cited in Lotz et al., 2026), and mid-hill agriculture is affected by outmigration driven land abandonment (Bhawana & Race, 2020; Paudel et al., 2014, both as cited in Lotz et al., 2026).
2.3. Conceptual Framework and Hypotheses
Figure 1 organises candidate explanations for a divergence between planted area and output. Policy emphasis on area generates rapid planting. Five mechanisms can then depress reported yield per plantation hectare:
H1, a growing share of immature, non-bearing plants;
H2, statistical artefacts (area derived production estimates, duplicated or stale district entries);
H3, climate stress;
H4, pest and management gaps; and
H5, abandonment of plots that remain in the area register.
With official statistics alone we cannot test H3–H5 directly. We can, however, derive observable implications of H1 and H2 and check whether H3–H5 are at least consistent with the spatial pattern. H1 predicts that yield declines should be larger where area expanded faster. H2 predicts a near unit elasticity of production with respect to contemporaneous area and a stationary yield, with rounded district yields.
3. Data and Methods
3.1. Data Sources
We used only documents whose figures could be read directly in the source and traced to an official or peer-reviewed origin (Table 2). The national series for 1994/95–2013/14 (area, green bean production, district profile for 2013/14 and trade) is reproduced from National Tea and Coffee Development Board and Ministry of Agricultural Development tabulations in KC et al. (n.d.). Later national observations come from GoN and ITC (2017; 2014/15), The Himalayan Times (n.d.; 2015/16), NTCDB (2018; 2017/18), the Ministry of Agriculture and Livestock Development as reported by Lotz et al. (2026; 2022/23) and the Ministry of Agriculture, Forests and Environment (MoAFE, 2026; 2024/25). District level 2024/25 data are from Table 2.8 of MoAFE (2026). Comparator yields are FAO values distributed by Our World in Data (FAO, 2026). Nepal’s fiscal year runs from mid-July to mid-July; we label years by fiscal year and plot them at the fiscal-year end.
3.2. Harmonisation
Area is plantation area (all planted coffee, including non-bearing plants), production is green-bean tonnes, and yield is production divided by plantation area. District names were harmonised (Sindhupalchowk = Sindhupalchok; Kabhrepalanchok = Kavre; Nawalpur = Nawalparasi East). Because the 2013/14 table lists 24 named districts and an aggregate of 15 others, panel comparisons use the 24 named districts (45 districts report coffee in 2024/25). Production in 2013/14 is reported in tonnes with one decimal, so district yields are subject to rounding error.
3.3. Analytical Methods
(A1) Growth was summarised by compound annual growth rates (CAGR). (A2) To test H2 we regressed ln(production) on ln(area) for 2000/01–2013/14 (the period of consistent, single-source reporting), tested a linear time trend in yield, and repeated the elasticity regression with area lagged 0–4 years to examine the maturity lag implied by H1. (A3) Spatial concentration was measured by shares, the Herfindahl Hirschman index (HHI, 0–10,000) and Gini coefficients. (A4) For the 24 matched districts we compared yields in 2013/14 and 2024/25 with Wilcoxon signed rank tests, computed area-weighted yields, and related the area multiplier (2024/25 area ÷ 2013/14 area) to the yield change by Spearman rank correlation (H1 predicts a negative association). (A5) Sensitivity analyses excluded the Lamjung and Syangja entries, which report identical values in 2024/25. (A6) Benchmarking compared Nepal’s reported yield with FAO yields and plot-level yields. (A7) Area-requirement scenarios divide claimed demand by alternative yields; they are arithmetic illustrations, not forecasts. Analyses were run in Python (pandas, SciPy); code and the harmonised tables will be deposited with the final submission.
3.4. Data Quality Audit
Table 3 lists the inconsistencies found. None invalidates the series, but each constrains inference and motivates the sensitivity checks above. Most importantly, the statistics report plantation area, so national yields are not like-for-like with FAO yields, which are based on harvested area.
4. Results
4.1. National Trajectory (RQ1)
Reported plantation area rose from 136 ha in 1994/95 to 1911 ha in 2013/14 and 5501 ha in 2024/25 (Figure 2, Table 4), a roughly 40-fold increase. Area grew at 14.9% yr−1 over 1994/95–2013/14 and 10.1% yr−1 over 2013/14–2024/25. Production grew faster in the first period (20.2% yr−1, from 13.0 t to 429.4 t) but only 3.7% yr−1 in the second (to 642.1 t). Yield on plantation area rose from 95 to a plateau of about 230 kg ha−1 (mean 230.1, SD 28.6 over 2000/01–2013/14) and then declined: 195 (2014/15), 166 (2015/16), 194 (2017/18), 108 (2022/23) and 117 kg ha−1 (2024/25).
Two features of the 2000/01–2013/14 record are informative about H1 and H2. First, production tracked contemporaneous area almost proportionally: the log–log elasticity was 1.005 (SE 0.076; R2 = 0.94), and yield showed no trend (slope −0.66 kg ha−1 yr−1, p = 0.74) even though area grew 4.5-fold. Second, the fit deteriorated monotonically as area was lagged: R2 fell from 0.96 (lag 0) to 0.93, 0.88, 0.81 and 0.76 for lags of one to four years (n = 15). If production depended mainly on the age structure of plantings, lagged area should fit at least as well as contemporaneous area. The pattern is instead what one would expect if output were estimated as area multiplied by a norm yield the footprint of H2 although independent measurement with a stable yield cannot be excluded.
4.2. Spatial Structure (RQ2)
Output is concentrated, and not where the area is (Figure 3, Table 5). Kavre (121 t), Nuwakot (90.5 t) and Ilam (83 t) supply 45.9% of national production from 20.9% of area; the five largest producing entries supply 56.1% of output (HHI 880 for production vs. 490 for area; Gini 0.69 vs. 0.57). Bagmati Province holds 28.7% of area but 45.5% of output (185 kg ha−1), whereas Koshi holds 31.5% of area but 20.0% of output (74 kg ha−1), driven by large new or underperforming areas such as Dhankuta (491 ha; 17 kg ha−1), Taplejung (207 ha; 51 kg ha−1) and Panchthar (180 ha; 25 kg ha−1), with Ilam the exception (241 kg ha−1). Districts with yields below 100 kg ha−1 account for 56.5% of national plantation area. Karnali and Sudurpashchim, which have been the focus of westward-expansion arguments, together report 55.9 ha and 2.8 t.
4.3. District Yield Dynamics, 2013/14 to 2024/25 (RQ2–RQ3)
Across the 24 matched districts, plantation area grew from 1858 to 4244 ha (2.3-fold), while the area-weighted yield fell from 231 to 139 kg ha−1 and the median district yield fell from 238 to 111 kg ha−1 (Figure 4, Table 6). Yields declined in 21 of 24 districts (Wilcoxon signed-rank p < 0.001). Excluding Lamjung and Syangja (identical entries), 19 of 22 districts declined (median 241 to 112 kg ha−1; p < 0.001). Only Kavre, Nuwakot and Rasuwa recorded higher yields.
The decline was unrelated to how fast area expanded (Spearman ρ = −0.05, p = 0.81). Yields fell by 131, 175, 104, 81, 346 and 58 kg ha−1 in Lalitpur, Arghakhanchi, Palpa, Baglung, Makwanpur and Myagdi, the six districts whose area grew at most 1.5-fold (mean change −149 kg ha−1), while the fast-expanding districts of Kavre (3.2-fold) and Ilam (6.6-fold) held yields at 244 and 241 kg ha−1. A pure immaturity mechanism (H1) predicts the opposite gradient. H1 may contribute Panchthar, Khotang, Dhading and Gorkha expanded 4–5-fold and recorded large losses but it does not explain the decline in stable districts, where H2 (stale or estimated data), H4 (pests, management) and H5 (abandonment) are more plausible, and H3 (climate) cannot be ruled out.
4.4. Benchmarking (RQ3–RQ4)
Nepal’s reported yield of 117 kg ha−1 equals 17.5% of Ethiopia’s FAO yield in 2024 (667 kg ha−1), 16% of India’s (739), 12% of Colombia’s (1003) and 6% of Brazil’s (1743) (Figure 5). Because Nepal’s denominator is plantation area, the gap overstates the agronomic shortfall. Plot-level data point the same way: Lotz et al. (2026) measured a mean of 364 kg ha−1 (range 36–1081; median plot age about 7 years), 3.1 times the national statistic, though their sample was drawn from cooperative farms and may be biased towards well-managed plots. The gap between 117 and 364 kg ha−1 is therefore a plausible bracket for the combined effect of non-bearing area, abandonment, and measurement error.
4.5. Trade and Value Signals
Export volumes of green beans remained small and volatile (Figure 6): 35.7 t in 2004/05 and 66.5 t in 2013/14, excluding the anomalous 508.6 t recorded in 2008/09. Unit export values, however, rose from NPR 302 kg−1 to NPR 788 kg−1 over the same period (11.2% yr−1, nominal). Imports exceeded exports in value in 11 of 20 years between 1994/95 and 2013/14. Later data show 111.2 t exported and 105.0 t imported in 2015/16 and 84.2 t exported against 163.4 t imported in 2017/18 (as cited in a farm-economics study of Arghakhanchi and Gulmi); we do not use these in the analysis because the primary table was not retrievable. The picture is of a sector whose price signal is strong but whose export base is thin; domestic consumption absorbs most output.
4.6. Land and Yield Requirements for Claimed Demand (RQ4)
Claimed domestic and export demand ranges from about 6000 t (KC et al., n.d.) to 8000 t (NTCDB, 2018). At the 2024/25 reported yield, supplying 6000–8000 t would require 51,400–68,600 ha, which is 4.3–5.8% of the 1.19 million ha described as suitable (GoN & ITC, 2017) but about 9–12.5 times today’s area (Table 7). At the 2013/14 yield (225 kg ha−1) the requirement falls to 26,700–35,600 ha, and at plot-level yields of 364–486 kg ha−1 (Lotz et al., 2026) to 12,300–22,000 ha. Even after the projected 72.6% loss of suitable area by 2050 (Ranjitkar et al., 2016; roughly 0.28 million ha remaining if 7% of Nepal is suitable today), land is not the binding constraint; yield, quality and the reliability of statistics are.
5. Discussion
5.1. What the Pattern Does and Does Not Show
The central empirical result is a divergence: area multiplied about 2.9-fold between 2013/14 and 2024/25 while output rose 1.5-fold. The tests in Section 4 narrow the explanations. H1 (immature plantings) has some support in fast-expanding eastern districts but fails as a general account because yield fell in slowly expanding districts and was unrelated to expansion speed. H2 (estimation artefacts) is supported by near-unit elasticity, a trendless yield, rounded district yields, duplicated entries and non-monotonic national output; however, it is an inference from statistical signatures, not proof of how the figures are compiled. H3–H5 cannot be tested here, but they are consistent with the geography: the largest reported falls are in the traditional western districts (Gulmi, Arghakhanchi, Palpa, Kaski), where the oldest plantings are exposed to pests and abandonment, and in newer frontier districts where site selection may be marginal. The national yield of 117 kg ha−1 should thus be read as an administrative productivity indicator, not as the productivity of bearing coffee.
5.2. Implications for Policy and Investment
Area-based targets reward planting but not production. We suggest four changes. First, replace plantation area with bearing area and verified cherry or parchment deliveries as headline indicators, reported by district and altitude band. Second, establish a bearing-area census and farmer register, supplemented by remote sensing (optical and radar) to detect abandonment. Third, prioritise yield-enabling services white stem borer management, shade-canopy management near the 40% optimum reported by Lotz et al. (2026), pruning and processing quality over additional seedling distribution, particularly in districts with yields below 100 kg ha−1. Fourth, align site selection with suitability mapping (Ranjitkar et al., 2016), which advises upward shifts of about 150 m and discourages expansion into low-suitability districts; the near zero output of the far western districts in Table 5 illustrates the risk of area led expansion.
For investors and parliamentary policymakers, the region’s case rests on price premia rather than volume: unit export values rose 2.6-fold in nominal terms over 2004/05–2013/14, but export tonnage is small and a yield shortfall is the main risk to financial returns. Cost–benefit analyses that assume long-run yields near the 225–486 kg ha−1 range should state which statistic they rely on and test sensitivity to the 117 kg ha−1 official value.
5.3. Limitations
This study is based on secondary data and cannot separate H1–H5 without plot-level information on tree age, bearing status, pest incidence and abandonment. Several national observations are drawn from policy documents and press reports that cite NTCDB or ministry tables; their definitions may differ over time. The 2013/14 district table is available from a secondary compilation (KC et al., n.d.) whose original publication details should be verified in the final manuscript. District yields in 2013/14 are subject to rounding. The comparison with FAO yields mixes plantation and harvested area. Finally, our scenarios use claimed demand figures that are themselves unsourced estimates.
5.4. Research Agenda
Priority work includes (i) a national bearing-area and tree-age census with GPS plot boundaries; (ii) remote-sensing detection of coffee plots and abandonment; (iii) a panel of farm-level yield and cost data stratified by altitude, shade and pest incidence; (iv) attribution of yield change to climate using local weather records and the suitability projections of Ranjitkar et al. (2016); and (v) integration of coffee agroforestry carbon and yield trade-offs (Lotz et al., 2026) into district level planning.
6. Conclusions
Nepal’s official coffee statistics tell a story of rapid expansion and falling productivity: plantation area rose about 40-fold in three decades, whereas reported yield on that area halved in the last decade to 117 kg ha−1. The decline cannot be explained solely by young trees, because it occurs in slowly expanding districts, and the statistical signatures of area-derived production, duplicated entries and rounded yields suggest that measurement quality is itself part of the problem. Output is concentrated in a few districts, and the claimed demand could be met on a small fraction of the suitable land if plot-level yields were realised. For a climate exposed smallholder crop, the policy priority is therefore to measure bearing area and yields credibly and to invest in productivity enhancing services rather than in planted area alone.
Funding
This research did not received any funding from any kinds of agencies.
Declarations
CRediT authorship contribution statement. Prabin Gauli: Conceptualization, Data curation, Formal analysis, Writing original draft.
Data Availability
All inputs are published documents cited in the reference list. The harmonised dataset and analysis code will be deposited in a public repository.
Appendix A. District-Level Coffee Statistics, 2024/25
| Province | District | Area (ha) | Production (t) | Yield (kg/ha) |
| Koshi | Ilam | 345 | 83 | 240.6 |
| Koshi | Taplejung | 207 | 10.5 | 50.7 |
| Koshi | Dhankuta | 491 | 8.5 | 17.3 |
| Koshi | Sankhuwasabha | 85.8 | 7.8 | 91.0 |
| Koshi | Panchthar | 180 | 4.5 | 25.0 |
| Koshi | Morang | 140.8 | 4 | 28.4 |
| Koshi | Solukhumbu | 61.7 | 3 | 48.6 |
| Koshi | Terhathum | 71.7 | 2.3 | 32.1 |
| Koshi | Bhojpur | 28 | 2 | 71.4 |
| Koshi | Khotang | 66.5 | 1.5 | 22.6 |
| Koshi | Okhaldhunga | 12.5 | 1 | 80.0 |
| Koshi | Udayapur | 45 | 0.45 | 10.0 |
| Bagmati | Kavre | 497 | 121 | 243.5 |
| Bagmati | Nuwakot | 305 | 90.5 | 296.7 |
| Bagmati | Dhading | 253 | 20.7 | 81.8 |
| Bagmati | Sindhupalchok | 148 | 18 | 121.6 |
| Bagmati | Lalitpur | 122 | 16 | 131.1 |
| Bagmati | Rasuwa | 70 | 12 | 171.4 |
| Bagmati | Chitwan | 37 | 4 | 108.1 |
| Bagmati | Ramechhap | 19 | 3.3 | 173.7 |
| Bagmati | Sindhuli | 38 | 3.2 | 84.2 |
| Bagmati | Dolakha | 51 | 3 | 58.8 |
| Bagmati | Makwanpur | 38 | 0.75 | 19.7 |
| Gandaki | Lamjung | 377 | 33 | 87.5 |
| Gandaki | Syangja | 377 | 33 | 87.5 |
| Gandaki | Kaski | 212 | 24 | 113.2 |
| Gandaki | Gorkha | 182 | 20 | 109.9 |
| Gandaki | Parbat | 144 | 16 | 111.1 |
| Gandaki | Tanahu | 57 | 11 | 193.0 |
| Gandaki | Baglung | 58 | 9 | 155.2 |
| Gandaki | Nawalpur | 22 | 6 | 272.7 |
| Gandaki | Myagdi | 22 | 4 | 181.8 |
| Lumbini | Gulmi | 335 | 30 | 89.6 |
| Lumbini | Palpa | 145 | 20 | 137.9 |
| Lumbini | Arghakhanchi | 154 | 8 | 51.9 |
| Lumbini | Pyuthan | 42.8 | 4 | 93.5 |
| Lumbini | Rukum East | 2.4 | 0.24 | 100.0 |
| Lumbini | Rolpa | 2 | 0.05 | 25.0 |
| Karnali | Surkhet | 20.5 | 1 | 48.8 |
| Karnali | Salyan | 7.8 | 1 | 128.2 |
| Karnali | Jajarkot | 11.5 | 0.6 | 52.2 |
| Karnali | Dailekh | 4.5 | 0.1 | 22.2 |
| Sudurpashchim | Doti | 2.6 | 0.05 | 19.2 |
| Sudurpashchim | Baitadi | 7 | 0.04 | 5.7 |
| Sudurpashchim | Kailali | 2 | 0 | 0.0 |
| Source: MoAFE (2026, Table 2.8), as published; yield recalculated from area and production. Lamjung and Syangja carry identical published values. | ||||
References
- Bunn, C.; Läderach, P.; Ovalle Rivera, O.; Kirschke, D. A bitter cup: Climate change profile of global production of Arabica and Robusta coffee. Clim. Change 2015, 129, 89–101. [Google Scholar] [CrossRef]
- Davis, A.P.; Gole, T.W.; Baena, S.; Moat, J. The impact of climate change on indigenous Arabica coffee (Coffea arabica): Predicting future trends and identifying priorities. PLoS ONE 2012, 7, e47981. [Google Scholar] [CrossRef] [PubMed]
- Food and Agriculture Organization of the United Nations. Coffee Bean Yields [Dataset]. Our World in Data (Data from FAOSTAT, with Major Processing by Our World in Data). 2026. Available online: https://ourworldindata.org/grapher/coffee-yields.
- Government of Nepal; Ministry of Commerce; International Trade Centre. Nepal National Sector Export Strategy: Coffee 2017–2021. Trade and Export Promotion Centre. 2017. Available online: https://tepc.gov.np/tepc_pub/NepalNationalExportStrategyCoffee.pdf.
- International Trade Centre. Making Nepal’s Specialty Coffee Sector Competitive. n.d. Available online: https://www.intracen.org/news-and-events/news/making-nepals-specialty-coffee-sector-competitive.
- KC, R.B.; Shrestha, B.K.; Dhimal, S. Coffee as a niche crop for mid-hills of Nepal. In Horticulture in Nepal over the Last Six decades; Nepal Horticulture Society: Lalitpur, Nepal, n.d.; pp. 186–209. Available online: https://horticulturenepal.org/uploads/main_attachment/1630665868_Horticultural%20In%20last%20six%20decades-192-215.pdf.
- Lotz, S.; Pandit, B.H.; Schmidt, H.-P.; Hölscher, D. Trade-off between yield and carbon storage in Nepali coffee agroforestry. Agrofor. Syst. 2026, 100, 49. [Google Scholar] [CrossRef]
- Ministry of Agriculture; Forests and Environment. Statistical Information on Nepalese Agriculture 2081/82 (2024/25). Government of Nepal, Planning & Development Cooperation Coordination Division, Statistics and Analysis Section. 2026. Available online: https://giwmscdnone.gov.np/media/pdf_upload/URL%20Stat%20Book%20%202083%2003%2016%20_blzj7t6.pdf.
- National Tea and Coffee Development Board. Nepal Coffee Policy [Presentation, International Coffee Council, Item 13]. International Coffee Organization. 2018. Available online: https://www.ico.org/documents/cy2018-19/Presentations/council-item-13-nepal-coffee-policy.pdf.
- Ranjitkar, S.; Sujakhu, N.M.; Merz, J.; Kindt, R.; Xu, J.; Matin, M.A.; Ali, M.; Zomer, R.J. Suitability analysis and projected climate change impact on banana and coffee production zones in Nepal. PLoS ONE 2016, 11, e0163916. [Google Scholar] [CrossRef] [PubMed]
- The Himalayan Times. Ministry to Endorse Coffee Development Strategy. n.d. Available online: https://thehimalayantimes.com/business/ministry-endorse-coffee-development-strategy/.
- Secondary citations (“as cited in Lotz et al., 2026”) are listed only through the citing source, following APA 7.
Figure 1.
Conceptual framework for the expansion productivity divergence. Note. H1–H5 are hypotheses examined in Section 4.1, Section 4.2 and Section 4.3. Authors’ synthesis based on Ranjitkar et al. (2016), Lotz et al. (2026) and the sources cited in Section 2.2.
Figure 1.
Conceptual framework for the expansion productivity divergence. Note. H1–H5 are hypotheses examined in Section 4.1, Section 4.2 and Section 4.3. Authors’ synthesis based on Ranjitkar et al. (2016), Lotz et al. (2026) and the sources cited in Section 2.2.
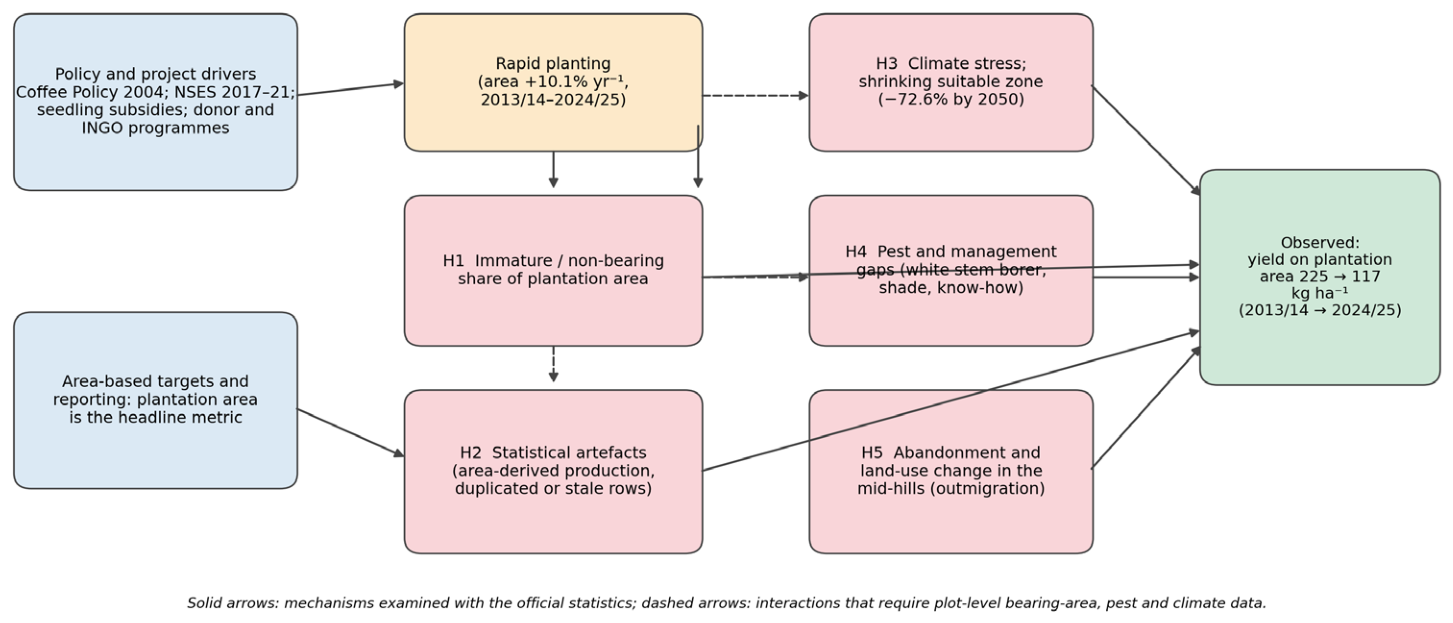
Figure 2.
Data-quality audit of the official coffee statistics. Note. Blue line: continuous NTCDB/MoAD series in KC et al. (n.d.). Red diamonds: later single year observations from GoN and ITC (2017), The Himalayan Times (n.d.), NTCDB (2018), MOALD (2024, as reported in Lotz et al., 2026) and MoAFE (2026); the series are not strictly comparable (see Table 3). Years are plotted at fiscal-year end.
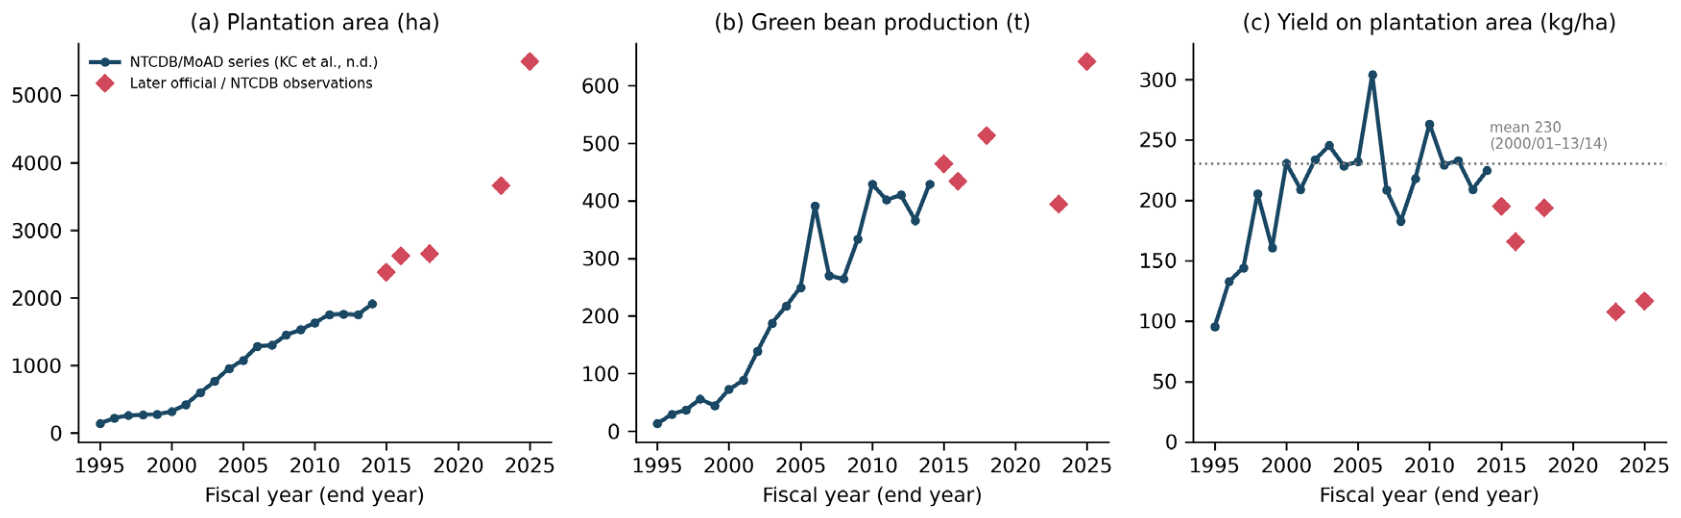
Figure 3.
Provincial shares and district area–yield relationship, 2024/25. Source: MoAFE (2026, Table 2.8); authors’ calculations. Syangja and Lamjung carry identical published values (Table 3).
Figure 3.
Provincial shares and district area–yield relationship, 2024/25. Source: MoAFE (2026, Table 2.8); authors’ calculations. Syangja and Lamjung carry identical published values (Table 3).
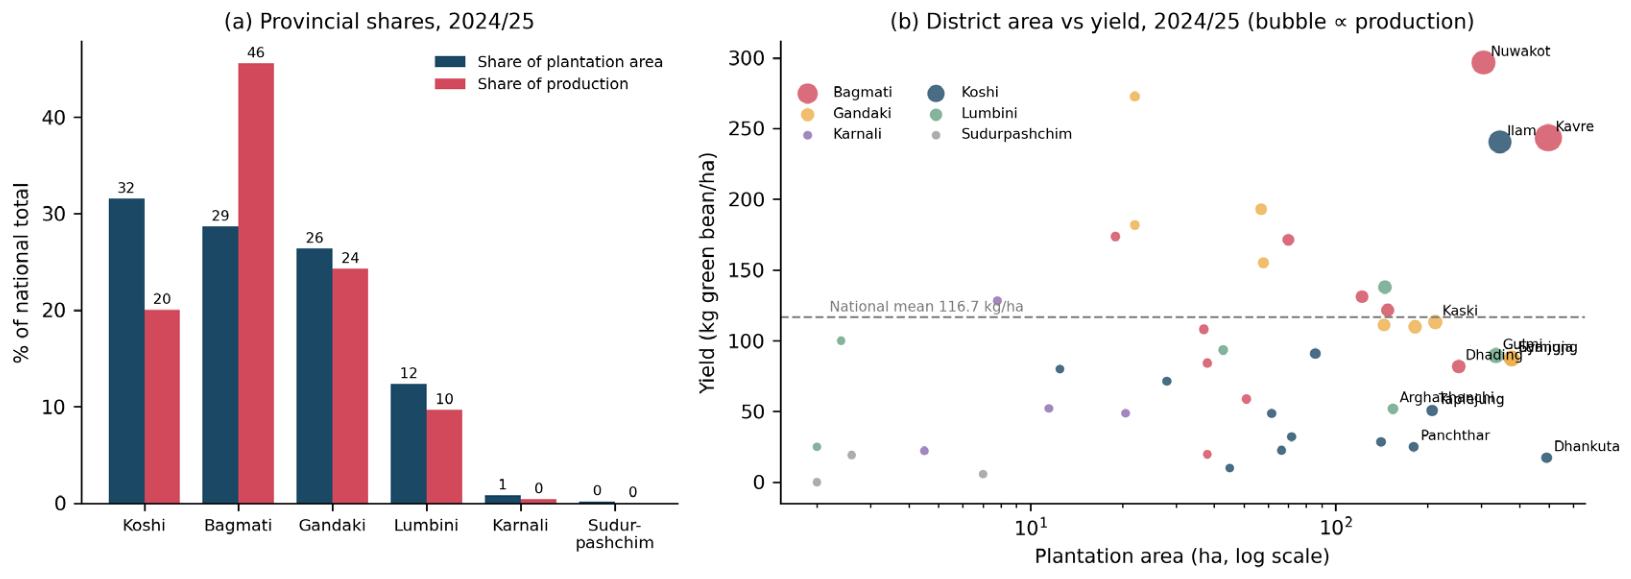
Figure 4.
Paired district yields in 2013/14 and 2024/25 (24 matched districts). Source: KC et al. (n.d., Table 3) and MoAFE (2026, Table 2.8); authors’ calculations. Districts ordered by 2013/14 yield.
Figure 4.
Paired district yields in 2013/14 and 2024/25 (24 matched districts). Source: KC et al. (n.d., Table 3) and MoAFE (2026, Table 2.8); authors’ calculations. Districts ordered by 2013/14 yield.
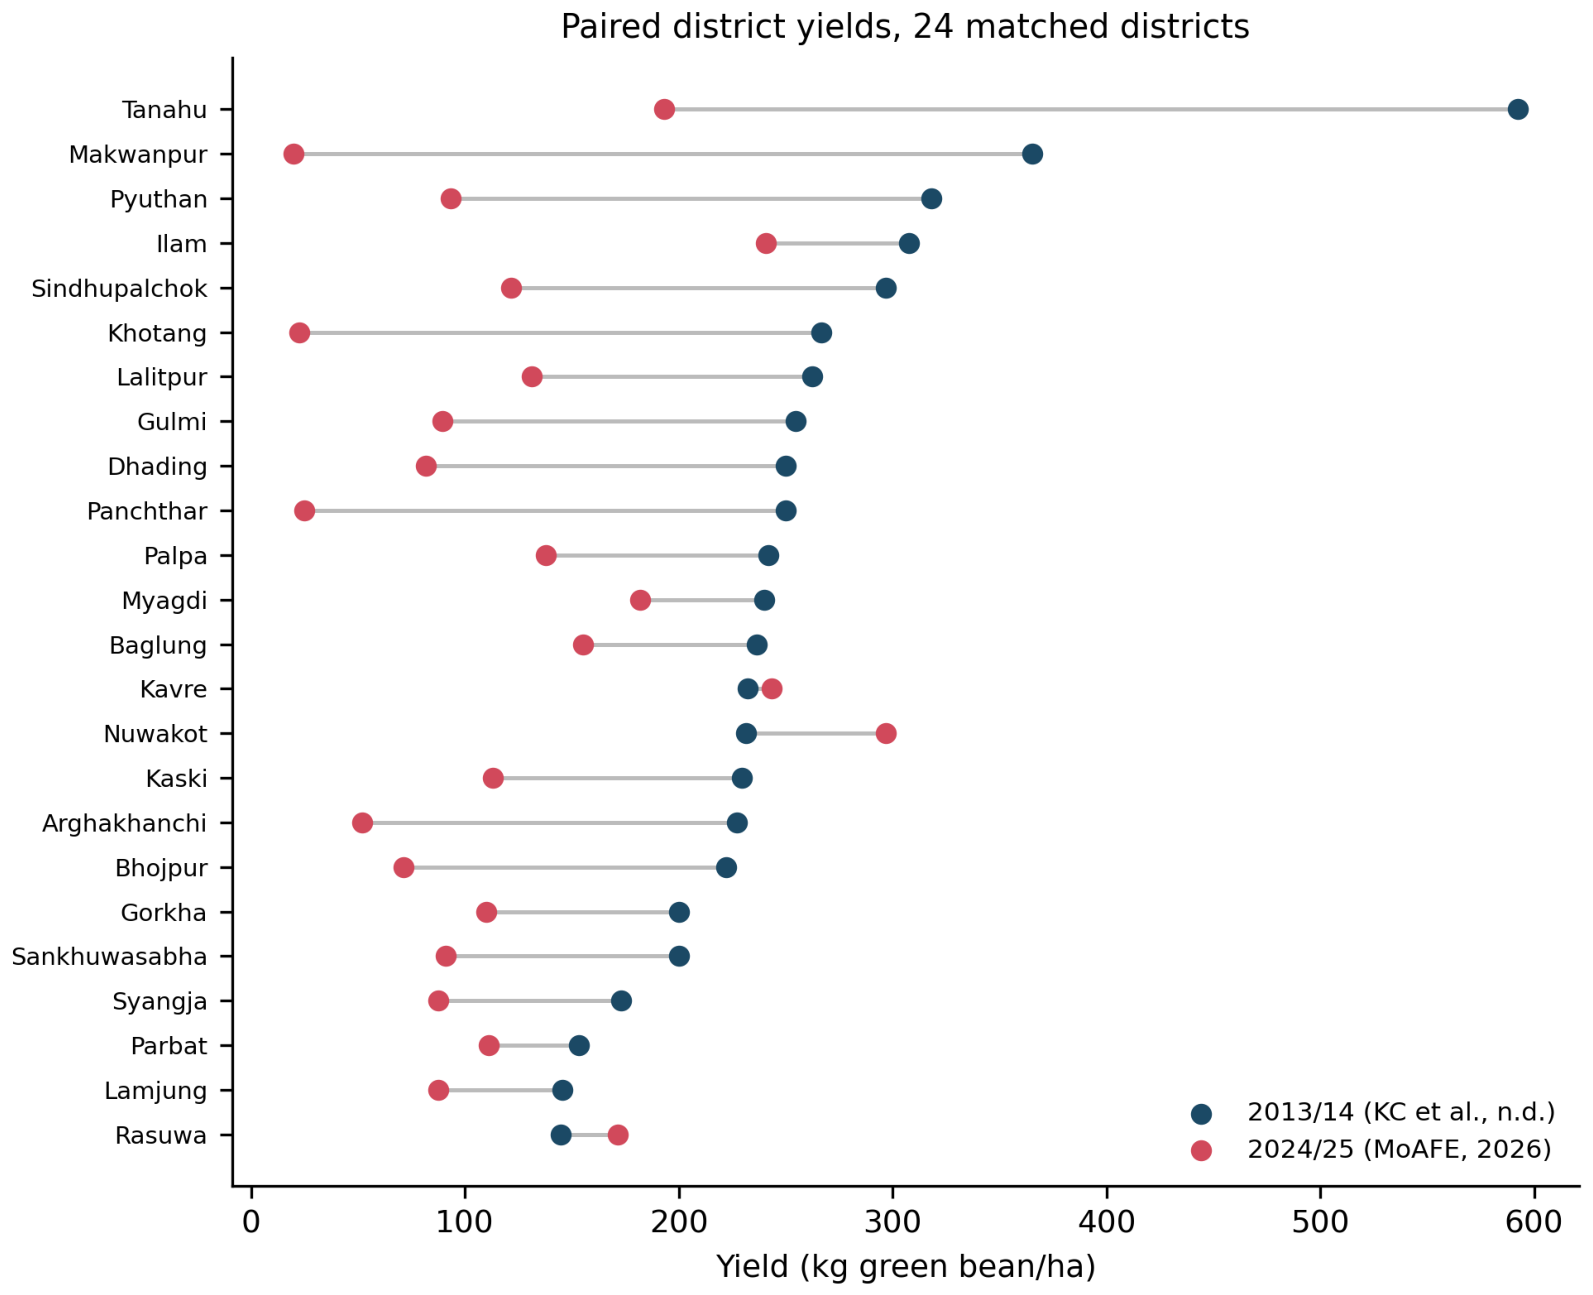
Figure 5.
Green coffee yield in 2024: FAO values for selected producers and Nepal’s reported plantation area yield. Source: FAO (2026) via Our World in Data for comparators; MoAFE (2026) for Nepal (authors’ calculation). Definitions differ: FAO yields use harvested area.
Figure 5.
Green coffee yield in 2024: FAO values for selected producers and Nepal’s reported plantation area yield. Source: FAO (2026) via Our World in Data for comparators; MoAFE (2026) for Nepal (authors’ calculation). Definitions differ: FAO yields use harvested area.
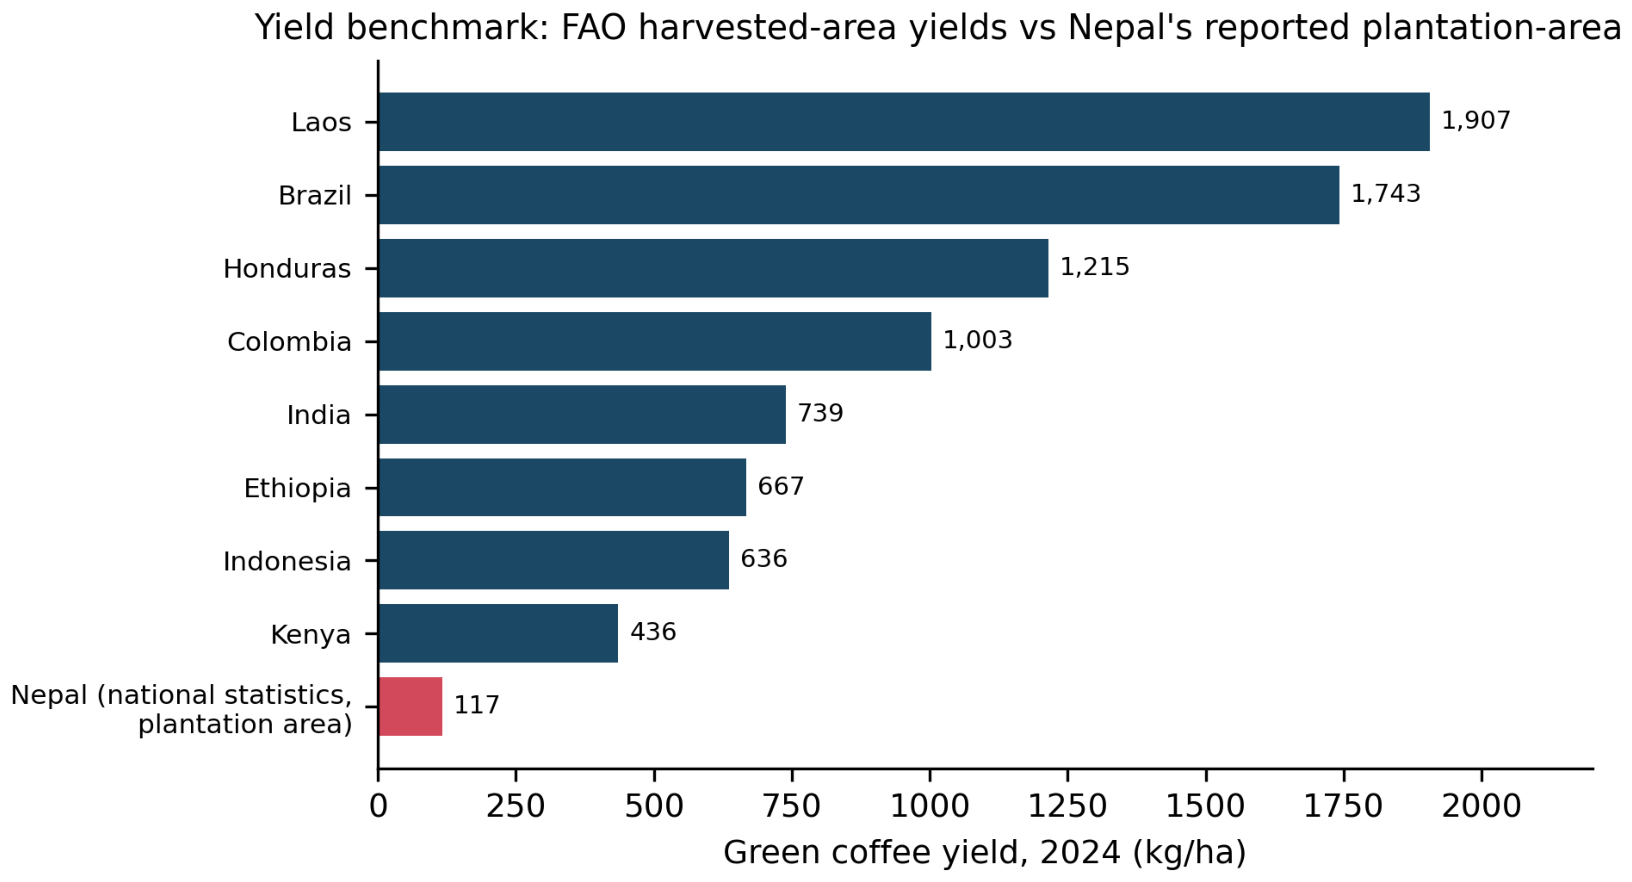
Figure 6.
Green-bean exports, unit export values and trade value, 1994/95–2013/14. Source: KC et al. (n.d., Table 5), citing NTCDB; authors’ calculations. Nominal values. The 2008/09 export figure exceeds reported national production and is treated as an outlier.
Figure 6.
Green-bean exports, unit export values and trade value, 1994/95–2013/14. Source: KC et al. (n.d., Table 5), citing NTCDB; authors’ calculations. Nominal values. The 2008/09 export figure exceeds reported national production and is treated as an outlier.
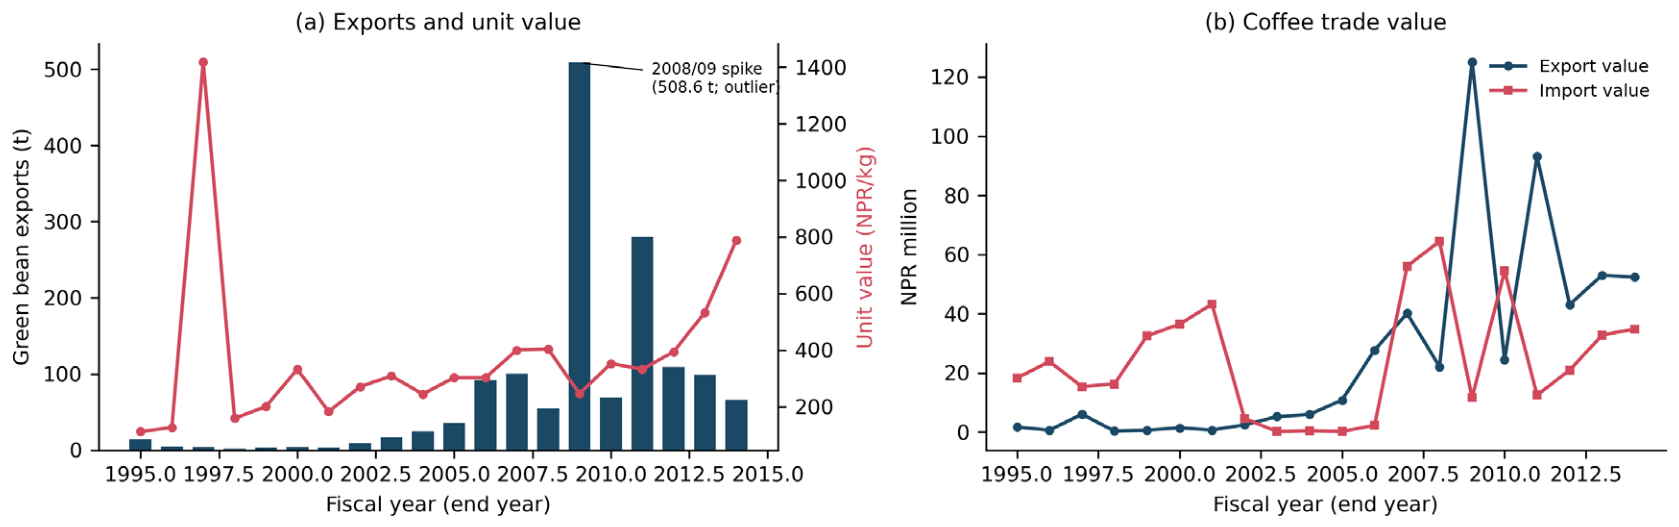

Table 1.
Selected milestones in the development of Nepal coffee sector.
| Year | Event |
|---|---|
| 1938 | First coffee introduced to Gulmi district (KC et al., n.d.) |
| 1981–1984 | First commercial nursery (1981); Nepal Coffee Company mill, Rupandehi (1983); Coffee Development Centre, Gulmi (1984) |
| 1993 | National Tea and Coffee Development Board Act; Tea and Coffee Development Section established |
| 1994 | First recorded export of dry-processed green beans (to Japan) |
| 2003–2004 | HELVETAS Coffee Promotion Programme begins (2003); National Coffee Policy implemented (2004) |
| 2010 | National coffee logo approved |
| 2017 | National Sector Export Strategy: Coffee 2017–2021 (GoN & ITC, 2017); ratification of ICO membership (2017) |
| 2018–2022 | Coffee Development Strategy targeting a doubling of output (The Himalayan Times, n.d.) |
Source: KC et al. (n.d., Table 1), GoN and ITC (2017), The Himalayan Times (n.d.). ICO = International Coffee Organization.
Table 2.
Data sources, coverage and use.
| Source | Coverage | Variables | Use in This Study |
|---|---|---|---|
| KC et al. (n.d.), citing NTCDB/MoAD | National 1994/95–2013/14; 24 districts 2013/14 | Area, green-bean production, yield, farmers, trade | Long national series; 2013/14 district baseline |
| GoN & ITC (2017) | 2014/15 | Area (2381 ha), production (464 t), potential area (1190,769 ha) | National point; potential area |
| The Himalayan Times (n.d.) | 2015/16 | Area (2618 ha), production (434 t), farmers | National point |
| NTCDB (2018) | 2017/18 | Area (2650 ha), production (513 t); demand claim | National point; demand scenario |
| Lotz et al. (2026), citing MOALD (2024) | 2022/23 | Area (3659 ha), production (394 t) | National point; plot-level yields (n = 27) |
| MoAFE (2026), Table 2.8 | 2024/25; 45 districts | Area, production, yield | District analysis; national end-point |
| FAO (2026) via Our World in Data | 2024; countries | Green coffee yield (t/ha) | Benchmarking |
| Ranjitkar et al. (2016) | Nepal | Suitability and 2050 projections | Context and scenarios |
Note. All monetary and quantity values are as published; no price deflation was applied.
Table 3.
Data quality audit of the official coffee statistics.
| Issue | Evidence | Treatment |
|---|---|---|
| Identical district entries | Lamjung and Syangja both report 377 ha, 33 t, 87.5 kg/ha in 2024/25; both are included in the Gandaki and national totals (Gandaki area 1451 ha is the sum including both) | Retained for reconciliation; sensitivity analysis excluding both |
| Aggregation check | Provincial totals equal district sums (area exactly; production within ±0.5 t, rounding) | Confirms arithmetic consistency, not independent measurement |
| Export exceeds production | 2008/09 exports of 508.6 t exceed that year’s reported production (334 t) | Treated as outlier; likely non-Nepali-origin or misrecorded coffee; excluded from trend statements |
| Non-monotonic production | 513 t (2017/18), 356 t (2020/21, ITC n.d.), 394 t (2022/23) despite area growth | Reported as observed; used as evidence of reporting volatility |
| Rounded district yields (2013/14) | Four of 24 districts have yields of exactly 200 or 250 kg/ha | Consistent with estimated rather than measured output (H2) |
| Area basis | Plantation area includes non-bearing and possibly abandoned plots | Benchmarks interpreted as lower bounds on productivity gaps |
| Series break | Production drops from 391 t (2005/06) to 270 t (2006/07) while area is flat | Retained; yield volatility is reported with the series |
Source: Authors’ audit of KC et al. (n.d.), MoAFE (2026), NTCDB (2018), ITC (n.d.) and Lotz et al. (2026).
Table 4.
Selected national observations.
| Fiscal Year | Area (ha) | Production (t) | Yield (kg/ha) | Source |
|---|---|---|---|---|
| 1994/95 | 136 | 13.0 | 95 | KC et al. (n.d.) |
| 2000/01 | 424 | 88.7 | 209 | KC et al. (n.d.) |
| 2005/06 | 1285 | 391.0 | 304 | KC et al. (n.d.) |
| 2010/11 | 1752 | 401.5 | 229 | KC et al. (n.d.) |
| 2013/14 | 1911 | 429.4 | 225 | KC et al. (n.d.) |
| 2014/15 | 2381 | 464 | 195 | GoN & ITC (2017) |
| 2015/16 | 2618 | 434 | 166 | The Himalayan Times (n.d.) |
| 2017/18 | 2650 | 513 | 194 | NTCDB (2018) |
| 2022/23 | 3659 | 394 | 108 | Lotz et al. (2026), citing MOALD (2024) |
| 2024/25 | 5501 | 642 | 117 | MoAFE (2026) |
Note. Yield = production ÷ plantation area, calculated by the authors.
Table 5.
Coffee area, production and yield by province, 2024/25.
| Province | Districts | Area (ha) | % Area | Prod. (t) | % Prod. | Yield (kg/ha) |
|---|---|---|---|---|---|---|
| Koshi | 12 | 1735.0 | 31.5 | 128.5 | 20.0 | 74.1 |
| Bagmati | 11 | 1578.0 | 28.7 | 292.4 | 45.5 | 185.3 |
| Gandaki | 9 | 1451.0 | 26.4 | 156.0 | 24.3 | 107.5 |
| Lumbini | 6 | 681.2 | 12.4 | 62.3 | 9.7 | 91.4 |
| Karnali | 4 | 44.3 | 0.8 | 2.7 | 0.4 | 60.9 |
| Sudurpashchim | 3 | 11.6 | 0.2 | 0.1 | 0.0 | 7.8 |
| Nepal | 45 | 5501.1 | 100.0 | 642.1 | 100.0 | 116.7 |
Source: MoAFE (2026, Table 2.8); sums of district entries. Official province totals match to rounding.
Table 6.
District area and yield, 2013/14 versus 2024/25 (24 matched districts).
| District | Area 2013/14 (ha) | Area 2024/25 (ha) | Area × | Yield 2013/14 | Yield 2024/25 | Δ yield |
|---|---|---|---|---|---|---|
| Syangja | 262 | 377 | 1.4 | 173 | 88 | −85 |
| Kavre | 155 | 497 | 3.2 | 232 | 243 | +11 |
| Gulmi | 143 | 335 | 2.3 | 255 | 90 | −165 |
| Nuwakot | 136 | 305 | 2.2 | 232 | 297 | +65 |
| Kaski | 122 | 212 | 1.7 | 230 | 113 | −116 |
| Lalitpur | 120 | 122 | 1.0 | 262 | 131 | −131 |
| Arghakhanchi | 110 | 154 | 1.4 | 227 | 52 | −175 |
| Lamjung | 110 | 377 | 3.4 | 145 | 88 | −58 |
| Palpa | 100 | 145 | 1.4 | 242 | 138 | −104 |
| Sindhupalchok | 96 | 148 | 1.5 | 297 | 122 | −175 |
| Parbat | 75 | 144 | 1.9 | 153 | 111 | −42 |
| Dhading | 60 | 253 | 4.2 | 250 | 82 | −168 |
| Baglung | 55 | 58 | 1.1 | 236 | 155 | −81 |
| Ilam | 52 | 345 | 6.6 | 308 | 241 | −67 |
| Panchthar | 40 | 180 | 4.5 | 250 | 25 | −225 |
| Rasuwa | 38 | 70 | 1.8 | 145 | 171 | +27 |
| Gorkha | 35 | 182 | 5.2 | 200 | 110 | −90 |
| Tanahu | 27 | 57 | 2.1 | 593 | 193 | −400 |
| Makwanpur | 26 | 38 | 1.5 | 365 | 20 | −346 |
| Myagdi | 25 | 22 | 0.9 | 240 | 182 | −58 |
| Sankhuwasabha | 25 | 85.8 | 3.4 | 200 | 91 | −109 |
| Pyuthan | 22 | 42.8 | 1.9 | 318 | 93 | −225 |
| Khotang | 15 | 66.5 | 4.4 | 267 | 23 | −244 |
| Bhojpur | 9 | 28 | 3.1 | 222 | 71 | −151 |
Source: KC et al. (n.d.) and MoAFE (2026); authors’ calculations. Yields in kg ha−1. Tanahu’s 2013/14 yield (593 kg ha−1; 27 ha) is an outlier of small number rounding.
Table 7.
Area required (ha) to supply claimed demand under alternative yields.
| Yield Scenario (kg/ha) | Source of Yield | 6000 t | 8000 t |
|---|---|---|---|
| 117 | National statistic, 2024/25 (MoAFE, 2026) | 51,414 | 68,552 |
| 225 | National statistic, 2013/14 (KC et al., n.d.) | 26,667 | 35,556 |
| 364 | Mean of plots, Lotz et al. (2026) | 16,484 | 21,978 |
| 486 | Modelled optimum at 40% canopy, Lotz et al. (2026) | 12,346 | 16,461 |
Note. Arithmetic illustration (demand ÷ yield); not a forecast. Rounded to the nearest hectare.
Disclaimer/Publisher’s Note: The statements, opinions and data contained in all publications are solely those of the individual author(s) and contributor(s) and not of MDPI and/or the editor(s). MDPI and/or the editor(s) disclaim responsibility for any injury to people or property resulting from any ideas, methods, instructions or products referred to in the content. |
© 2026 by the authors. Licensee MDPI, Basel, Switzerland. This article is an open access article distributed under the terms and conditions of the Creative Commons Attribution (CC BY) license (http://creativecommons.org/licenses/by/4.0/).
Copyright: This open access article is published under a Creative Commons CC BY 4.0 license, which permit the free download, distribution, and reuse, provided that the author and preprint are cited in any reuse.