

Submitted:
09 October 2026
Posted:
10 October 2026
You are already at the latest version
Abstract
Serve return in tennis requires continuous integration between visual information and action regulation, a process that, according to ecological dynamics, emerges from the coupling between perception and action. The present pilot study explored gaze behaviour in competitive and recreational tennis players during serve return, considering fixation duration and count, spatial dispersion of gaze coordinates, and differences between the pre- and post-bounce phases. Four university students who play tennis (two competitive, two recreational) each completed 40 serve returns under representative conditions, wearing a Pupil Labs Neon eye-tracking system. Data were analysed at the block level and at the single-response level using descriptive statistics and mixed-effects models: competitive players showed on average longer fixations, a lower number of fixations, and less spatial dispersion of gaze; in both groups, fixation duration was greater in the pre-bounce phase than in the post-bounce phase; and competitive players descriptively achieved higher serve-return scores, with high-scoring serve returns showing greater overall fixation time. Given the exploratory nature of the study, these patterns suggest that the temporal and spatial organisation of gaze may help characterise the serve return, and point to the usefulness of representative protocols that preserve the functional rela-tionships between visual information and action.
Keywords:
gaze behaviour
; representativeness
; ecological dynamics
; perception-action
; eye-tracking
; tennis
1. Introduction
Serve return is a particularly demanding task in tennis, as it requires the player to organise and rapidly adapt the motor action under conditions of high spatiotemporal pressure [1,2]. Its effectiveness depends on the ability to integrate the kinematic information arising from the server's movement [3] with information about the ball's trajectory [4], coordinating the receiver's body displacements and racket action accordingly. Information available before racket-ball impact can contribute to preparing the response, while information drawn from the early phases of ball flight allows the receiver's movement organisation to be progressively guided [1,5].
From an ecological dynamics perspective, this behaviour does not derive from the execution of a fully pre-planned response, but emerges from the continuous coupling between perception and action, through which the player progressively adapts their movement to the demands emerging from the game situation [6]. Performance is therefore considered an emergent outcome of the dynamic interaction between the athlete, task constraints, and contextual information, which define the action possibilities available to the player [7,8]. Within this framework, anticipation contributes to orienting and regulating action as it unfolds within the athlete-environment relationship [9,10]. It follows that practice and assessment contexts should preserve the main sources of information and the action possibilities that characterise competitive performance. According to the principles of Representative Learning Design, task representativeness depends on maintaining the functional relationships between environmental information and motor responses, so that the perception-action couplings developed during practice can transfer effectively to competition [6,7,11]. In this sense, analysing gaze behaviour under conditions similar to actual play can help describe how visual exploration is organised in relation to environmental information [12,13]. Specific evidence in tennis further shows that visual behaviour during serve return can vary depending on the experimental context, highlighting the importance of considering the characteristics of the setting when studying visual search [14].
Gaze behaviour is therefore a relevant component of perceptual-motor processes, as it represents one of the ways in which the athlete explores the environment and gathers information useful for regulating action [15,16]. Research on perceptual-cognitive expertise generally shows that more expert athletes are more effective at identifying relevant information sources and organising their acquisition in relation to the temporal unfolding of the action; however, the specific characteristics of visual search vary depending on the sport, the task, and the information available, without configuring a universally valid strategy [17,18,19]. Visual search strategies are generally examined through the number, duration, and location of fixations, as well as through their temporal distribution during the sport-specific task performed [20,21,22]. However, the meaning of these parameters depends on the specific characteristics of the performance: in tennis serve return, expertise appears to be expressed mainly through the ability to modulate gaze behaviour in relation to the opponent and the unfolding of the action, rather than through the adoption of a rigid, invariant visual strategy [23].
The spread of wearable eye-tracking systems has made it possible to analyse visual behaviour during actions performed directly on court, better preserving the perceptual-motor demands of real performance [22]. In tennis, the available evidence indicates that skill level is associated with differences in the selection and spatiotemporal organisation of visual information during serve return. In a protocol based on observing serves presented via video, Lin et al. [24] found that, compared with novice players, expert players showed longer gaze times on the head-shoulders, racket, and ball in forehand return trials, while in backhand trials these differences also involved the trunk area. Rosker and Majcen Rosker [23] found that, compared with national-level players, international-level players showed a greater ability to adapt their visual strategy to the characteristics of the specific server, suggesting that expertise is also expressed through the modulation of gaze as a function of information emerging from the game situation. Sáenz-Moncaleano et al. [25] further found that, compared with intermediate-level players, high-level players showed longer fixation/tracking periods on the ball before the bounce and a longer quiet eye duration; both measures were also greater in higher-scoring serve returns. The study by Murray and Hunfalvay [26] identified different visual search profiles as a function of tennis players' competitive level, observing on average longer fixations and less variability in visual behaviour in higher-ranked participants compared with medium- and lower-ranked players.
Overall, this evidence indicates that gaze behaviour during serve return varies in relation to skill level and the conditions under which the action is performed, and must therefore be interpreted in relation to the specific task demands and the performance outcome.
In light of these considerations, the present pilot study aims to describe and compare serve-return performance in competitive and recreational tennis players, examining the quantitative and spatial characteristics of gaze behaviour. Using a wearable eye-tracking system, the number and duration of fixations, the dispersion of gaze coordinates along the horizontal and vertical axes, and — at a finer temporal level of detail — the distribution of these same parameters in the phases preceding and following the ball bounce within each response were analysed, consistent with the role attributed to these two phases in the anticipatory organisation of action [1,5]. The serve-return score, calculated according to an adapted version of the system proposed by Sáenz-Moncaleano et al. [25], is reported descriptively as a complementary measure of performance. The experimental design was developed from the protocol proposed by Sáenz-Moncaleano et al. [25], extending the analysis to the overall number of fixations, the spatial dispersion of gaze coordinates, and their articulation at the single-response level.
Given the small sample size, the study is exploratory and has a pilot character. In line with what was reported by Sáenz-Moncaleano et al. [25], competitive players were expected to show, on average, longer fixation durations than recreational players, and higher-scoring serve returns were expected to be associated with greater overall fixation time. Differences in the number of fixations and in the spatial dispersion of gaze were instead examined on an exploratory basis. To account for the non-independence of repeated observations within athlete, a mixed-effects modelling approach was also adopted, the results of which are presented and interpreted in light of the small sample size.
2. Materials and Methods
2.1. Participants and Study Design
Four university students who play tennis, all right-handed, took part in the study (mean age: 24±1.5 years). Participants were divided into two groups based on their level of tennis participation: competitive players (n = 2) and recreational players (n = 2). Competitive players had, on average, more than six additional years of tennis experience than recreational players and had taken part in international-level competitions, whereas participants in the recreational group had reached at most regional-level competitions.
Inclusion criteria required participants to be university students with experience playing tennis and to be classified as either competitive or recreational players. Participants presenting injuries that could interfere with task execution, or requiring the use of glasses during the trial, were excluded from the study. Contact lenses were allowed.
All athletes provided written informed consent before the start of the study. This study was conducted in accordance with the Declaration of Helsinki [27] and was approved by the Ethical Committee of the Department of Human Sciences, Philosophy & Education at the University of Salerno (protocol number: 0348390)
For each athlete, gaze behaviour was recorded in four separate blocks, corresponding to four task conditions (right-inside, right-outside, left-inside, left-outside court zones). Each block comprised 10 serve returns, for a total of 40 serve-return trials per athlete, following the general structure of the Sáenz-Moncaleano et al. [25] protocol, in which each participant performed 40 serve-return trials distributed across four serve zones.
Serves were performed by a professional tennis coach, the same for all participants, in order to keep serve characteristics as comparable as possible across trials.
Time markers embedded in the raw recordings (events.csv) delimited each response into three phases (response start, ball bounce, response end), consistent with the pre-bounce/bounce/post-bounce segmentation adopted in the reference study. These per-response markers were used in a later stage of the pipeline for the single-response analysis (Section 2.4.4).
Given the small sample size, the present study was conceived as a pilot and exploratory study, primarily aimed at describing gaze behaviour patterns and evaluating the proposed data-processing pipeline, rather than as a statistically powered comparison between skill levels. Group-level aggregated values are therefore reported descriptively, complemented by mixed-effects modelling on the single-response-level data (Section 2.4.5), which explicitly accounts for the non-independence of observations within athlete.
2.2. Instrumentation
Gaze behaviour was recorded with a Pupil Labs Neon wearable eye-tracking system (binocular gaze mode, 200 Hz). Raw data were exported via Pupil Cloud in the standard "Timeseries Data" format (data format version 2.6). Each recording session produced a set of files, including gaze.csv (gaze coordinates over time), fixations.csv (automatically detected fixations, with duration), saccades.csv, blinks.csv, 3d_eye_states.csv, imu.csv, events.csv, world_timestamps.csv, and sections.csv. Only gaze.csv and fixations.csv were used in the block-level pipeline; events.csv (response start/bounce/end markers) was later incorporated into the single-response-level analysis pipeline (Section 2.4.4).
Serve returns were also recorded using a smartphone with a video capture rate of 60 fps, mounted on a tripod and positioned behind the server's side of the court, so as to frame the entire playing surface and allow identification of the ball's landing zone after the serve return.
2.2.1. Serve-Return Score Assessment
In addition to the ocular parameters, each serve return was assigned a performance score (0-4), obtained through video analysis, according to an adapted version of the system used by Sáenz-Moncaleano et al. [25]: 0 points when the ball went beyond the baseline or hit the net, 1 point for a landing in the central zone of the court (between the net and the additional lines), 2 points for a landing in the central zone beyond the second half of the service line, and scores of 2-4 for landings in the side alley, depending on the zone hit and the serve side (deuce/advantage), with an attempt to take the intent of the shot into account, at least in part. Serve-return trials were subsequently classified into two categories, following the same threshold adopted in the reference study: low score (≤ 2) and high score (≥ 3).
This score constitutes a data stream distinct from, and complementary to, the automated eye-tracking pipeline: it was assigned manually and does not derive from the Pupil Cloud files. In this analysis, score data were summarised descriptively at the group and score-category level, without being integrated into the mixed-effects model applied to the eye-tracking data.
2.3. Procedures
The study was designed and conducted by the Laboratory for Innovative Teaching Methodologies and Analysis of Sports Performance at the University of Salerno (Italy), while data collection took place at the indoor tennis court of the University Sports Centre, on a synthetic rubberised surface and under controlled artificial lighting conditions. Before the actual data collection, a pre-test was carried out in the same environment and following the same protocol, aimed at verifying correct instrument functioning and procedure adequacy.
At the start of the session, participants were briefed on the task and the scoring system, and a warm-up phase was carried out ahead of the task. The eye-tracking system was then fitted, and participants were allowed to perform a few familiarisation serve returns until they reported feeling comfortable with the equipment.
The task involved 40 serve returns, divided into four blocks of 10 trials, corresponding to the four serve conditions set out in the protocol. Block order was randomised for each participant, while within each block the player knew in advance the zone the serve would be directed to, in accordance with the procedure used by Sáenz-Moncaleano et al. [25].
Participants were asked to treat every serve as a second serve and to try to produce an effective response, prioritising depth and shot angle. All serves were performed by a professional tennis coach, who was asked to keep force and spin characteristics as constant as possible across trials. Whenever a serve was judged invalid with respect to the intended bounce zone, the trial was cancelled and repeated; each block therefore ended once 10 valid serves had been reached.
A 1-minute break was given between blocks. At the end of the four blocks, the eye-tracking system was removed.
2.4. Data Processing Pipeline
The entire data processing was carried out in R (packages data.table, ggplot2, zoo, with the addition of lme4 and lmerTest for mixed-effects modelling) through a pipeline organised into four phases: (i) per-athlete extraction of block-level metrics from the raw Pupil Labs exports, (ii) group-level aggregation, (iii) statistical summary and visualisation, and (iv, later extension) single-response-level segmentation and mixed-effects modelling.
2.4.1. Phase 1 — Per-Athlete Metric Extraction
A dedicated script was written for each athlete (identical structure, parameterised by participant ID and group label), operating directly on the four raw Pupil Labs export folders. For each of the four blocks, the script identified the session subfolder containing both gaze.csv and fixations.csv, computing eight summary metrics (Table 1): number of gaze samples, number of fixations, mean and total fixation duration, and mean and standard deviation of gaze position on the X and Y axes. Each script exported two files: a block-level table (four rows, one per condition) and an athlete-level average across the four blocks.
As part of Phase 1, each script also produced diagnostic visualisations for the individual athlete: bar charts of mean fixation duration, number of fixations, and gaze dispersion by condition, together with plots of the raw and smoothed gaze-X trajectory. Smoothing was performed using a centred moving average (window = 300 samples; zoo::rollmean), calculated separately for each condition.
2.4.2. Phase 2 — Group-Level Aggregation
A separate script merged the four block-level tables produced in Phase 1 (one file per athlete) using data.table::fread and rbindlist(fill = TRUE), after labelling each record with its own Group (competitive/recreational) and Athlete identifier. This produced a single dataset of 16 block-level observations (4 athletes × 4 blocks). The anisotropy index (Y_X_Difference = Gaze_Dispersion_Y − Gaze_Dispersion_X) was calculated at this stage on the merged dataset.
2.4.3. Phase 3 — Statistical Summary and Visualisation
Group-level descriptive statistics (mean ± SD) were calculated for each metric by aggregating the 8 block-level observations available per group (2 athletes × 4 blocks; Table 2). Between-group comparisons are reported descriptively; no formal inferential test was conducted at this level, given the non-independence of blocks within athlete and the resulting limited effective sample size (Section 2.6).
Group-level bar charts (gaze dispersion by axis, number of fixations, Y−X difference) and per-variable histograms split by group were generated with ggplot2.
2.4.4. Single-Response Segmentation via Event Markers
To move beyond the block-level aggregation described above, a dedicated pipeline extension (Phase 1b) used the start/bounce/end markers embedded in events.csv to segment gaze.csv and fixations.csv at the single-response level. For each of the 10 serve-return trials per block, the corresponding time interval was further split into two phases relative to the ball bounce: pre-bounce and post-bounce. The same eight metrics used in the block-level pipeline (Table 1) were recalculated for each Response × Phase combination, producing a long-format dataset of 320 observations (4 athletes × 4 conditions × 10 trials × 2 phases).
Before segmentation, automated quality checks were performed on the event markers, verifying for each block: the completeness of the start/bounce/end triplet for all 10 trials, the absence of duplicate markers, chronological consistency (start < bounce < end), and any anomalous response durations relative to the block median. All 16 blocks (4 athletes × 4 conditions) passed these checks with no missing, duplicate, or chronologically inconsistent markers. In 110 of the 320 response × phase observations, no fixation was detected within the segment window (63 of 160 in the post-bounce phase, 47 of 160 in the pre-bounce phase); these observations were kept in the dataset (Number_of_Fixations = 0) rather than discarded, and treated as missing data for the fixation-duration models (Section 2.4.5).
2.4.5. Mixed-Effects Modelling
To formally account for the non-independence of repeated observations within athlete — a limitation so far only acknowledged descriptively in the block-level analysis (Section 2.6) — linear mixed-effects models were fitted on the single-response-level dataset (metric ~ Group + (1 | Athlete)), with Group (competitive vs. recreational) as a fixed effect and Athlete as a random intercept. Models were estimated with the lme4 [28] and lmerTest [29] packages, the latter used to compute p-values via the Satterthwaite approximation [30] for degrees of freedom. Two key metrics were modelled: mean fixation duration and number of fixations. For both metrics, given that the response × phase dataset includes two correlated observations for each response (pre- and post-bounce), extended models were also fitted to formally test the effect of Phase and the Group × Phase interaction (Number_of_Fixations ~ Group × Phase + (1 | Athlete); Mean_Fixation_Duration_ms ~ Group × Phase + (1 | Athlete)).
Standardised effect sizes (Cohen's d) were derived from the model's t statistic and Satterthwaite degrees of freedom via the t_to_d function of the effectsize package, which uses directly the t statistic and degrees of freedom of the mixed-effects model; a descriptive Cohen's d (cohens_d function, same package) based on per-athlete means (n = 2 vs. 2) is also reported as a less precise, indicative complement, since it reflects the actual independent replication unit in this pilot design (the athlete, not the single response).
2.5. Extracted Variables

Table 1.
Eye-tracking metrics extracted by the pipeline, with R computation and operational definition.
Table 1.
Eye-tracking metrics extracted by the pipeline, with R computation and operational definition.
| Variable | R Calculation | Operational Definition |
|---|---|---|
| Number_of_Gaze_Points | nrow(gaze) | Total number of gaze samples recorded in the block. |
| Number_of_Fixations | nrow(fix) | Total number of fixations detected by the Pupil Labs algorithm. |
| Mean_Fixation_Duration_ms | mean(fix$duration, na.rm=TRUE) | Mean fixation duration in the block. |
| Total_Fixation_Duration_ms | sum(fix$duration, na.rm=TRUE) | Sum of the durations of all fixations. |
| Gaze_Dispersion_X/Y | sd(gaze$x/y, na.rm=TRUE) | Standard deviation of gaze coordinates; a proxy for the breadth of visual exploration. |
| Mean_Gaze_X/Y | mean(gaze$x/y, na.rm=TRUE) | Mean gaze position on the horizontal/vertical axis. |
| Y_X_Difference | Gaze_Dispersion_Y– Gaze_Dispersion_X | Anisotropy index; relative prevalence of vertical over horizontal dispersion. |
| Return_Score* | Assigned manually from video (60 fps) | Score 0-4 based on the ball's landing zone at the first bounce, adapted from Sáenz-Moncaleano et al. (2018); used for aggregated descriptive analyses only. |
*Note. Unlike the other metrics, Return_Score does not derive from the R pipeline: it was assigned manually from video at the individual-response level and was used only for aggregated descriptive analyses (
Section 2.2.1
).
2.6. Statistical Treatment and Limitations
Table 2 reports descriptive statistics treating the four blocks per athlete as repeated observations. Because these blocks come from the same two individuals per group, they are not statistically independent (pseudo-replication): the variability observed within group partly reflects within-athlete, between-condition variability rather than between-athlete variability alone. Consequently, no inferential test (e.g., t-test) was conducted at the block level on the eight observations per group; group-level values are reported as descriptive statistics, consistent with a pilot/demonstrative framing of the dataset.
At a finer level of granularity, the mixed-effects modelling on the single-response-level dataset (Section 2.4.5) explicitly addresses this limitation: the athlete-level random structure recognises that within-athlete observations are not independent. The residual limitation — one that cannot be resolved with a more sophisticated model — is that, with only two athletes per group, the number of random levels (clusters) remains equal to two per group, producing wide confidence intervals around the group effect (Table 5) despite the substantially larger number of response-level observations.
Regarding the serve-return score (Section 2.2.1), group mean values (competitive: 2.08; recreational: 1.24) and the distribution across high/low score categories are reported purely descriptively, as is the cross-comparison between skill group and score category on fixation times; although the score was assigned to each individual response, the response-level score data were not integrated into the dataset used for the mixed-effects models; consequently, this variable was not included in the inferential analysis.
2.7. Software Availability and Reproducibility
All analyses were conducted in R (version 4.3.1, 2023-06-16; aarch64-apple-darwin20 platform, macOS Monterey 12.7), using the packages data.table (1.16.0), ggplot2 (3.5.1), zoo (1.8-12), lme4 (1.1-35.5), lmerTest (3.1-3), and effectsize (1.0.1).
3. Results
This study analysed the visual behaviour of four tennis players during serve return, comparing competitive and recreational athletes across three different levels of analysis. The first, conducted at the block level, provides an initial description of the differences between the two groups on the main ocular metrics. The second builds on this analysis by exploiting the temporal structure of individual responses, made available by the event markers, and estimates its effect via a mixed-effects model that accounts for the non-independence of observations within athlete. The third, finally, considers descriptively the aggregated data on serve-return score and fixation times.
To facilitate the presentation of individual results, participants are indicated with pseudonymised codes: C1 and C2 for competitive athletes and R1 and R2 for recreational athletes.
3.1. Block-Level Analysis
Table 2 reports the descriptive statistics (mean ± SD) calculated on the 16 block-level observations (4 athletes × 4 conditions). The recreational group shows, on average, a higher number of fixations than competitive players (193.6 ± 83.2 vs. 144.4 ± 25.0), but a lower mean fixation duration (539.7 ± 167.7 ms vs. 609.3 ± 55.8 ms). Gaze dispersion, on both axes, is descriptively greater in recreational players than in competitive players (Dispersion_X: 120.6 ± 32.3 vs. 91.8 ± 10.6 px; Dispersion_Y: 150.5 ± 51.0 vs. 127.1 ± 34.8 px).
Table 2.
Descriptive comparison between groups, block level (mean ± SD).
| Group | Fixations | Mean Fixation Duration [ms] | Gaze Dispersion X [px] | Gaze Dispersion Y [px] |
|---|---|---|---|---|
| Competitive (n = 2) | 144.4 ± 25.0 | 609.3 ± 55.8 | 91.8 ± 10.6 | 127.1 ± 34.8 |
| Recreational (n = 2) | 193.6 ± 83.2 | 539.7 ± 167.7 | 120.6 ± 32.3 | 150.5 ± 51.0 |
At this level of aggregation, the anisotropy index showed marked variability in the recreational group, with a standard deviation of a magnitude similar to the group mean. This is visible in Figure 1, Figure 2 and Figure 3, where error bars (± SD) are reported together with group means, and is further documented in the distribution histograms for the eight observations per group (available in the OSF repository; see Data Availability Statement).
Given the small sample size (n = 2 per group), Table 3 reports statistics disaggregated by individual athlete (mean ± SD across the four conditions), complementing Table 2. The individual comparison highlights substantial heterogeneity within the recreational group: R2 shows a markedly higher number of fixations (253.5 ± 80.9) and a shorter mean duration (392.2 ± 39.8 ms) than R1 (133.8 ± 6.6 fixations; 687.2 ± 77.4 ms), whose individual profile is in fact more similar to that of the two competitive athletes. A single block of R2 (Timeseries Data 2, DX-outside condition) shows an isolated value of 371 fixations, recognisable as the outlier already flagged in the distribution histograms. This individual heterogeneity suggests that the descriptive difference observed at the group level (Table 2) is substantially influenced by the profile of a single athlete, and should therefore be interpreted with caution.
Table 3.
Descriptive statistics by individual athlete, block level (mean ± SD across the four conditions).
Table 3.
Descriptive statistics by individual athlete, block level (mean ± SD across the four conditions).
| Athlete | Group | Fixations | Mean Duration [ms] | Disp. X [px] | Disp. Y [px] |
|---|---|---|---|---|---|
| (C1) | Competitive | 161.0 ± 24.5 | 566.6 ± 12.4 | 100.6 ± 6.1 | 158.2 ± 13.9 |
| (C2) | Competitive | 127.8 ± 11.2 | 652.0 ± 47.5 | 83.0 ± 4.6 | 95.9 ± 6.7 |
| (R1) | Recreational | 133.8 ± 6.6 | 687.2 ± 77.4 | 92.3 ± 7.2 | 131.6 ± 23.3 |
| (R2) | Recreational | 253.5 ± 80.9 | 392.2 ± 39.8 | 148.9 ± 15.9 | 169.5 ± 67.6 |
No formal inferential test was conducted on these comparisons, for the pseudo-replication reasons discussed in Section 2.6.
3.2. Single-Response Analysis and Mixed-Effects Modelling
Single-response-level segmentation (Section 2.4.4) produced a dataset of 320 response × phase observations (160 pre-bounce, 160 post-bounce). In 110 of these observations, no fixation was detected within the phase window (63 in post-bounce, 47 in pre-bounce). These observations were kept as Number_of_Fixations = 0 and treated as missing data for the fixation-duration models (Table 4).
In both groups, mean fixation duration, when present, was descriptively greater in the pre-bounce phase than in the post-bounce phase (Competitive: 587.6 vs. 245.0 ms; Recreational: 450.5 vs. 163.2 ms), while the number of fixations did not show a systematic difference of similar magnitude between phases. The between-group difference in fixation duration maintains the same direction (Competitive > Recreational) in both phases.
The mixed-effects model (Section 2.4.5) applied to the response × phase observations was used to estimate the overall group effect while accounting for the dependence of repeated observations within athlete (Table 5). Mean fixation duration was higher in competitive than in recreational players by 163.4 ms (95% CI [-55.2, 381.9]; Cohen's d from the model = 4.15, 95% CI [-0.46, 8.59]); the number of fixations showed a smaller difference in the same direction (+0.09, 95% CI [-0.31, 0.49]; d = 1.43, 95% CI [-1.76, 4.36]). In both cases the confidence interval of the model-level Cohen's d is very wide, reflecting the small number of independent clusters (2 athletes per group). Neither contrast reached the conventional threshold of significance (p = 0.087 and p = 0.42, respectively), while the wide confidence intervals of the effect sizes reflect the high uncertainty of the estimates associated with the small number of independent participants. Consistent with the individual heterogeneity already discussed in Section 3.1 (Table 3), it should nonetheless be noted that, even at the single-response level, R2's profile systematically deviates from R1's within the same recreational group.
Table 5.
Group effect (Competitive − Recreational) from the mixed-effects model (metric ~ Group + (1 | Athlete)).
Table 5.
Group effect (Competitive − Recreational) from the mixed-effects model (metric ~ Group + (1 | Athlete)).
| Metric | Estimate | 95% CI (Satterthwaite) | p (Satterthwaite) | N Observations | Cohen's d | 95% CI (d) |
|---|---|---|---|---|---|---|
| Mean fixation duration [ms] | +163.4 | [-55.2, 381.9] | .087 | 210 (110 excluded for NA) | 4.15 | [-0.46, 8.59] |
| Number of fixations | +0.09 | [-0.31, 0.49] | .42 | 320 | 1.43 | [-1.76, 4.36] |
The extended model with Phase and the Group × Phase interaction (Section 2.4.5) shows, for number of fixations, a significant Group effect (estimate = 0.39, p = 0.021), a significant Phase effect (estimate = 0.35, p < 0.001), and a significant Group × Phase interaction (estimate = -0.59, p < 0.001): the between-group difference in number of fixations is therefore not constant across the two phases. For mean fixation duration, the same model shows the Phase effect (p < 0.001) but not a significant Group × Phase interaction (p = 0.30).
Figure 4 shows the complete distribution of single-response × phase observations, overlaid with individual means. For mean fixation duration, the means of the two competitive athletes are both located above the means of the two recreational athletes, whereas for number of fixations the individual means of the two groups overlap more substantially.
3.3. Serve-Return Score
The mean serve-return score (Section 2.2.1) was 2.08 in competitive players and 1.24 in recreational players. In the competitive group, 50% of serve returns fell into the high-score category (≥ 3) and the remaining 50% into the low-score category (≤ 2); in the recreational group, 29% of serve returns fell into the high-score category and 71% into the low-score category (Table 6).
Overall mean total fixation times were 2.970 s in competitive players and 2.623 s in recreational players. Broken down by score category, in competitive players mean total fixation times were 3.299 s (high score) and 2.642 s (low score); in recreational players, 3.103 s and 2.429 s respectively (Table 7). Considering both groups jointly, mean total fixation times were 3.227 s in high-scoring serve returns and 2.517 s in low-scoring serve returns.
4. Discussion
This pilot study explored gaze behaviour during serve return in competitive and recreational tennis players, considering the number and duration of fixations, the spatial dispersion of gaze coordinates, and their temporal distribution relative to the ball bounce. Overall, the results highlighted some patterns that vary in relation to competitive level and response phase. At the block level, competitive players showed on average longer fixations, a lower number of fixations, and less gaze dispersion along both axes than recreational players (Table 2). However, the high individual variability, particularly evident in the recreational group, suggests caution when interpreting these differences. The single-response-level analysis also showed, in both groups, longer fixation duration in the pre-bounce phase than in the post-bounce phase (Table 4). Finally, the mean serve-return score was descriptively higher in competitive players (Table 6), and, regardless of group, higher-scoring serve returns showed greater overall fixation time (Table 7).
Regarding fixation duration, both in the block-level aggregated analysis and in the single-response-level observations, competitive players showed on average higher values than recreational players. The direction of this pattern is compatible with part of the perceptual-cognitive expertise literature, according to which greater experience may be associated with longer fixations on task-relevant information [17,26]. However, the relationship between expertise and fixation duration does not appear uniform across different sport contexts, as evidence on differences between experts and non-experts is heterogeneous and frequently non-significant [18]. Therefore, longer fixation duration should not be interpreted, in isolation, as an indicator of a more efficient visual strategy.
In tennis, Sáenz-Moncaleano et al. [25] observed longer fixation/tracking in high-level players compared with intermediate-level players, particularly in the phase preceding the ball bounce, while differences in overall fixation/tracking time did not reach statistical significance. In this sense, the results of the present study suggest, on an exploratory basis, that interpreting competitive-level differences may benefit from considering the temporal structure of the response, rather than relying on a single overall measure. This is particularly evident from the pre- and post-bounce segmentation. In both groups, mean fixation duration was descriptively greater before the bounce than in the subsequent phase (Table 4). This pattern is consistent with the role attributed to the early phases of ball flight in regulating the serve return. Information emerging around racket-ball impact and in the early phases of ball flight can indeed contribute to organising and progressively adapting the receiver's movement under conditions of high temporal demand [1,5]. Similarly, Sáenz-Moncaleano et al. [25] found significantly longer pre-bounce fixation/tracking both in high-level players and in higher-scoring serve returns. In the present study, the longer duration observed in the pre-bounce phase in both groups could be consistent with greater functional relevance of this portion of the trajectory for regulating the response. This interpretation must nonetheless remain cautious. Although the extended mixed-effects model indicated a Phase-related difference in mean fixation duration, the very small number of independent participants substantially limits the precision, stability, and generalisability of this estimate. Regarding number of fixations, at the block level recreational players showed on average higher values than competitive players (Table 2). This result might appear consistent with the traditional expertise-related pattern, according to which more expert athletes would tend to use a lower number of longer-duration fixations [17]. However, the individual data caution against interpreting this difference as a stable characteristic of the two groups. In particular, R2 showed a higher mean number of fixations than R1 (253.5 ± 80.9 vs. 133.8 ± 6.6) and contributed substantially to the higher mean observed in the recreational group. Moreover, in the single-response-level analysis, number of fixations showed greater overlap between participants than fixation duration did (Figure 4). These results are consistent with reviews questioning the existence of a univocal relationship between expertise level and number of fixations, highlighting how such differences may vary depending on task and context characteristics [16,18]. Therefore, in the present sample, number of fixations appears to provide a less stable indication than their duration and should be interpreted together with the temporal and spatial distribution of gaze.
A further aspect investigated in this study concerns the spatial dispersion of gaze coordinates. At the block level, competitive players showed descriptively lower values along both axes than recreational players, indicating, descriptively, a more concentrated spatial distribution of gaze coordinates on average (Table 2; Figure 2). This finding is consistent with evidence that players of different levels may show different modes of spatial organisation of visual search during serve return [23,26]. However, gaze coordinate dispersion does not allow direct identification of which information was used by the athlete, nor can it be considered, in itself, a measure of greater efficiency or attentional stability. Rather, it describes the breadth of the spatial distribution of gaze during the action. In addition, considerable individual heterogeneity also emerged for this variable, which limits the extent to which the observed pattern can be attributed exclusively to competitive level. In this sense, the dispersion results should be regarded as an exploratory extension of the measures commonly used to describe gaze behaviour, to be further examined in larger samples and, ideally, in association with the identification of the specific informational areas observed.
Performance-related results also show a direction consistent with participants' competitive level. Mean serve-return score was higher in competitive than in recreational players (2.08 vs. 1.24) and a higher percentage of competitive players' serve returns fell into the high-score category (50% vs. 29%; Table 6). This pattern is consistent with what was observed by Sáenz-Moncaleano et al. [25], in whose study high-level players achieved higher response scores than intermediate-level players. In the present study, moreover, high-scoring serve returns showed descriptively greater overall fixation times than low-scoring serve returns, both in competitive players (3.299 vs. 2.642 s) and in recreational players (3.103 vs. 2.429 s; Table 7). Sáenz-Moncaleano et al. [25] also observed longer total fixation/tracking times in high-scoring serve returns, although this difference was not statistically significant, while high-scoring serve returns showed significantly longer pre-bounce fixation/tracking and quiet eye durations. In the present study, however, although score was assigned to each individual response, the response-level score data were not integrated into the dataset used for mixed-effects modelling; consequently, the relationship between fixation duration and serve-return quality could not be subjected to inferential modelling and must be regarded solely as descriptive evidence.
Taken together, these results appear to support the value of analysing gaze behaviour during serve-return tasks performed under representative conditions. In the present protocol, the player observed an actual serve and performed a functional response on court, preserving a functional relationship between the available information and the action produced. This is relevant in light of the principles of Representative Learning Design, according to which the study of perceptual-motor processes should, as far as possible, preserve the information-action couplings characteristic of performance [11,12]. From an ecological dynamics perspective, the differences observed should therefore not be interpreted as expressions of rigid visual strategies independent of context, but as patterns emerging from the relationship between athlete characteristics, available information, and specific task demands [6,8]. This interpretation appears particularly important in light of the high individual variability observed in the present study and of previous evidence showing that even high-level players can modulate gaze behaviour depending on the specific server and the characteristics of the situation [23].
The present study has several limitations. The main one concerns the extremely small sample size, with two participants per group. Although the use of mixed-effects models allowed the dependence of repeated observations within athlete to be formally accounted for, the number of independent units remains four, resulting in considerable uncertainty in the estimates and limiting the generalisability of the results. The heterogeneity observed between the two recreational participants concretely illustrates how much group-aggregated values can be influenced by the profile of a single individual. Future studies should therefore primarily increase the number of participants, rather than the number of serve returns collected per athlete.
A second limitation concerns the lack of integration of the response-level performance score into the single-response-level eye-tracking dataset used for mixed-effects modelling; its integration would allow the relationship between gaze behaviour and performance effectiveness to be modelled directly. This would also allow the relationship between fixation duration and serve-return quality suggested by the reference literature [25] and by the descriptive observations to be tested directly, with the same statistical rigour already applied to the between-group comparison. Moreover, since no specific areas of interest were coded, the analysis of gaze coordinate dispersion does not allow one to establish whether the observed differences reflect a different selection of relevant information sources; in future studies, this analysis could be integrated with area-of-interest (AOI) mapping procedures or with dynamic gaze analysis methods. Finally, although the same server was maintained for all participants and was asked to reproduce serves that were as comparable as possible, no objective quantification of the speed and spin of each serve was carried out; any variation in ball characteristics may therefore have contributed to the variability in visual behaviour.
From an applied perspective, and while considering the exploratory nature of the study, the results suggest the value of designing serve-return training activities in tennis that preserve the perceptual-motor characteristics of the real situation and require the player to continuously adapt gaze and action to the information emerging from the serve. In particular, the longer fixation duration observed in the pre-bounce phase may suggest to coaches the opportunity to preserve, in training, the visual information available in the early phases of ball flight through tasks representative of the competitive context. To this end, priority could be given to drills that preserve the functional relationships between the server's movement, the ball's trajectory, and the receiver's motor response, so as to maintain the main perceptual-motor demands of the competitive context.
Overall, the results of this pilot study suggest that competitive level may be associated with differences in the duration and spatial distribution of gaze behaviour during serve return, while number of fixations appears to be more strongly influenced by individual variability. The longer fixation duration observed in the pre-bounce phase in both groups also underscores the potential relevance of the early phases of ball flight for organising the response. However, given the small sample size, these results must be regarded as exploratory patterns to be verified in future studies with larger samples and with a more direct integration between visual behaviour measures and single-response outcome.
5. Conclusions
This pilot study explored gaze behaviour during serve return in competitive and recreational tennis players using wearable eye tracking under conditions representative of performance. The results showed, descriptively, on average longer fixations and less spatial gaze dispersion in competitive players, while number of fixations showed greater individual variability. In addition, in both groups, fixation duration was greater in the pre-bounce phase than in the post-bounce phase, and higher-scoring serve returns showed greater overall fixation time.
Overall, these patterns suggest that the temporal and spatial analysis of gaze behaviour may help describe how serve return in tennis is organised under representative conditions. However, the small sample size requires that the results be interpreted purely on an exploratory basis. Future studies with larger samples and with performance measures available at the single-response level will be needed to verify these patterns and further examine the relationship between visual behaviour, competitive level, and serve-return effectiveness.
Author Contributions
Conceptualization, C.C. and S.C.; methodology, C.C., M.T. and S.C.; software, M.T.; validation, C.C., M.T. and S.C.; formal analysis, M.T.; investigation, C.C.; data curation, M.T.; writing—original draft preparation, C.C. and M.T.; writing—review and editing, C.C., M.T., S.C. and R.V.; visualization, C.C. and M.T.; supervision, R.V.; project administration, S.C. All authors have read and agreed to the published version of the manuscript.
Funding
This research received no external funding. .
Institutional Review Board Statement
These trials were conducted in accordance with the ethical principles of the Declaration of Helsinki [27]. The study has been approved by the Ethical Committee of the Department of Human Sciences, Philosophy & Education at the University of Salerno (protocol number: 0348390; approved on 16 September 2026).
Informed Consent Statement
Informed consent was obtained from all subjects involved in the study.
Data Availability Statement
The data that support the findings of this study, including raw eye-tracking recordings (gaze, fixation, saccade, and pupillometric time series), processed results, and R analysis scripts, are openly available in the Open Science Framework (OSF) repository at https://doi.org/10.17605/OSF.IO/DP4ZU.
Conflicts of Interest
The authors declare no conflicts of interest.
References
- Avilés, C.; Navia, J.A.; Ruiz, L.M.; de Quel, Ó.M. Do Expert Tennis Players Actually Demonstrate Anticipatory Behavior When Returning a First Serve under Representative Conditions? A Systematic Review including Quality Assessment and Methodological Recommendations. Psychol. Sport Exerc. 2019, 43, 16–26. [CrossRef]
- Prăjescu, M.P.; Abalașei, B.A. Anticipation and Decision-Making in Return Situations in Tennis: A Systematic Review. Sport Soc. 2025, 25, 1. [CrossRef]
- Carboch, J.; Brenton, J.; Reischlova, E.; Kocib, T. Anticipatory Information Sources of Serve and Returning of Elite Professional Tennis Players: A Qualitative Approach. Int. J. Sports Sci. Coach. 2023, 18, 761–771. [CrossRef]
- Vernon, G.; Farrow, D.; Reid, M. Returning Serve in Tennis: A Qualitative Examination of the Interaction of Anticipatory Information Sources Used by Professional Tennis Players. Front. Psychol. 2018, 9, 895. [CrossRef]
- Navia, J.A.; Avilés, C.; Dicks, M.; Ruiz-Pérez, L.M. The Spatiotemporal Control of Expert Tennis Players When Returning First Serves: A Perception-Action Perspective. J. Sports Sci. 2022, 40, 16–23. [CrossRef]
- Renshaw, I.; Davids, K.; O'Sullivan, M.; Maloney, M.A.; Crowther, R.; McCosker, C. An Ecological Dynamics Approach to Motor Learning in Practice: Reframing the Learning and Performing Relationship in High Performance Sport. Asian J. Sport Exerc. Psychol. 2022, 2, 18–26. [CrossRef]
- Woods, C.T.; McKeown, I.; Shuttleworth, R.J.; Davids, K.; Robertson, S. Training Programme Designs in Professional Team Sport: An Ecological Dynamics Exemplar. Hum. Mov. Sci. 2019, 66, 318–326. [CrossRef]
- Araújo, D.; Brito, H.; Carrilho, D. Team Decision-Making Behavior: An Ecological Dynamics Approach. Asian J. Sport Exerc. Psychol. 2023, 3, 24–29. [CrossRef]
- Huesmann, K.; Loffing, F. Perception-Action Coupling in Anticipation Research: A Classification and Its Application to Racket Sports. Front. Psychol. 2024, 15, 1396873. [CrossRef]
- Araújo, D.; Lopes, H.; Farrokh, D.; Davids, K. The Ecological Dynamics of Cognizant Action in Sport. Psychol. Sport Exerc. 2025, 80, 102935. [CrossRef]
- Pinder, R.A.; Davids, K.; Renshaw, I.; Araújo, D. Representative Learning Design and Functionality of Research and Practice in Sport. J. Sport Exerc. Psychol. 2011, 33, 146–155. [CrossRef]
- Dicks, M.; Button, C.; Davids, K. Examination of Gaze Behaviors under In Situ and Video Simulation Task Constraints Reveals Differences in Information Pickup for Perception and Action. Atten. Percept. Psychophys. 2010, 72, 706–720. [CrossRef]
- Gawin, W.; Fries, U.; Maiwald, C. Superior Gaze Strategies of Elite Badminton Players and the Significance of Natural Research Conditions. Int. J. Racket Sports Sci. 2022, 4. [CrossRef]
- Lin, Y.N.; Pacheco, M.M.; Lin, Y.F.; Huang, C.T.; Lin, J.H. The Influence of Expertise and Experimental Paradigms on the Visual Behavior of Tennis Athletes in Returning a Serve. Kinesiology 2021, 53, 271–279. [CrossRef]
- Miller-Dicks, M.; Davids, K.; Araújo, D. An Ecological Approach to Gaze Behaviour in Sport. In Gaze and Visual Perception in Sport; Routledge: Abingdon, UK, 2025; pp. 46–58.
- Silva, A.F.; Afonso, J.; Sampaio, A.; Pimenta, N.; Lima, R.F.; Castro, H.D.O.; et al.; Murawska-Ciałowicz, E. Differences in Visual Search Behavior between Expert and Novice Team Sports Athletes: A Systematic Review with Meta-Analysis. Front. Psychol. 2022, 13, 1001066. [CrossRef]
- Mann, D.T.; Williams, A.M.; Ward, P.; Janelle, C.M. Perceptual-Cognitive Expertise in Sport: A Meta-Analysis. J. Sport Exerc. Psychol. 2007, 29, 457–478. [CrossRef]
- Klostermann, A.; Moeinirad, S. Fewer Fixations of Longer Duration? Expert Gaze Behavior Revisited. Ger. J. Exerc. Sport Res. 2020, 50, 146–161. [CrossRef]
- Hodges, N.J.; Wyder-Hodge, P.A.; Hetherington, S.; Baker, J.; Besler, Z.; Spering, M. Topical Review: Perceptual-Cognitive Skills, Methods, and Skill-Based Comparisons in Interceptive Sports. Optom. Vis. Sci. 2021, 98, 681–695. [CrossRef]
- Aksum, K.M.; Magnaguagno, L.; Bjørndal, C.T.; Jordet, G. What Do Football Players Look At? An Eye-Tracking Analysis of the Visual Fixations of Players in 11 v 11 Elite Football Match Play. Front. Psychol. 2020, 11, 562995. [CrossRef]
- Vítor de Assis, J.; Costa, V.; Casanova, F.; Cardoso, F.; Teoldo, I. Visual Search Strategy and Anticipation in Tactical Behavior of Young Soccer Players. Sci. Med. Footb. 2021, 5, 158–164. [CrossRef]
- Kredel, R.; Hernandez, J.; Hossner, E.J.; Zahno, S. Eye-Tracking Technology and the Dynamics of Natural Gaze Behavior in Sports: An Update 2016–2022. Front. Psychol. 2023, 14, 1130051. [CrossRef]
- Rosker, J.; Majcen Rosker, Z. Skill Level in Tennis Serve Return Is Related to Adaptability in Visual Search Behavior. Front. Psychol. 2021, 12, 689378. [CrossRef]
- Lin, Y.N.; Wang, J.; Su, Y.; Wang, I.L. Exploring the Gaze Behavior of Tennis Players with Different Skill Levels When Receiving Serves through Eye Movement Information. Appl. Sci. 2021, 11, 8794. [CrossRef]
- Sáenz-Moncaleano, C.; Basevitch, I.; Tenenbaum, G. Gaze Behaviors during Serve Returns in Tennis: A Comparison between Intermediate- and High-Skill Players. J. Sport Exerc. Psychol. 2018, 40, 49–59. [CrossRef]
- Murray, N.P.; Hunfalvay, M. A Comparison of Visual Search Strategies of Elite and Non-Elite Tennis Players through Cluster Analysis. J. Sports Sci. 2017, 35, 241–246. [CrossRef]
- World Medical Association. World Medical Association Declaration of Helsinki: Ethical Principles for Medical Research Involving Human Participants. JAMA 2025, 333, 71–74. [CrossRef]
- Bates, D.; Mächler, M.; Bolker, B.; Walker, S. Fitting Linear Mixed-Effects Models Using lme4. J. Stat. Softw. 2015, 67, 1–48. [CrossRef]
- Kuznetsova, A.; Brockhoff, P.B.; Christensen, R.H. lmerTest Package: Tests in Linear Mixed Effects Models. J. Stat. Softw. 2017, 82, 1–26. [CrossRef]
- Satterthwaite, F.E. An Approximate Distribution of Estimates of Variance Components. Biom. Bull. 1946, 2, 110–114. [CrossRef]
Figure 1.
Number of fixations by group (mean ± SD).
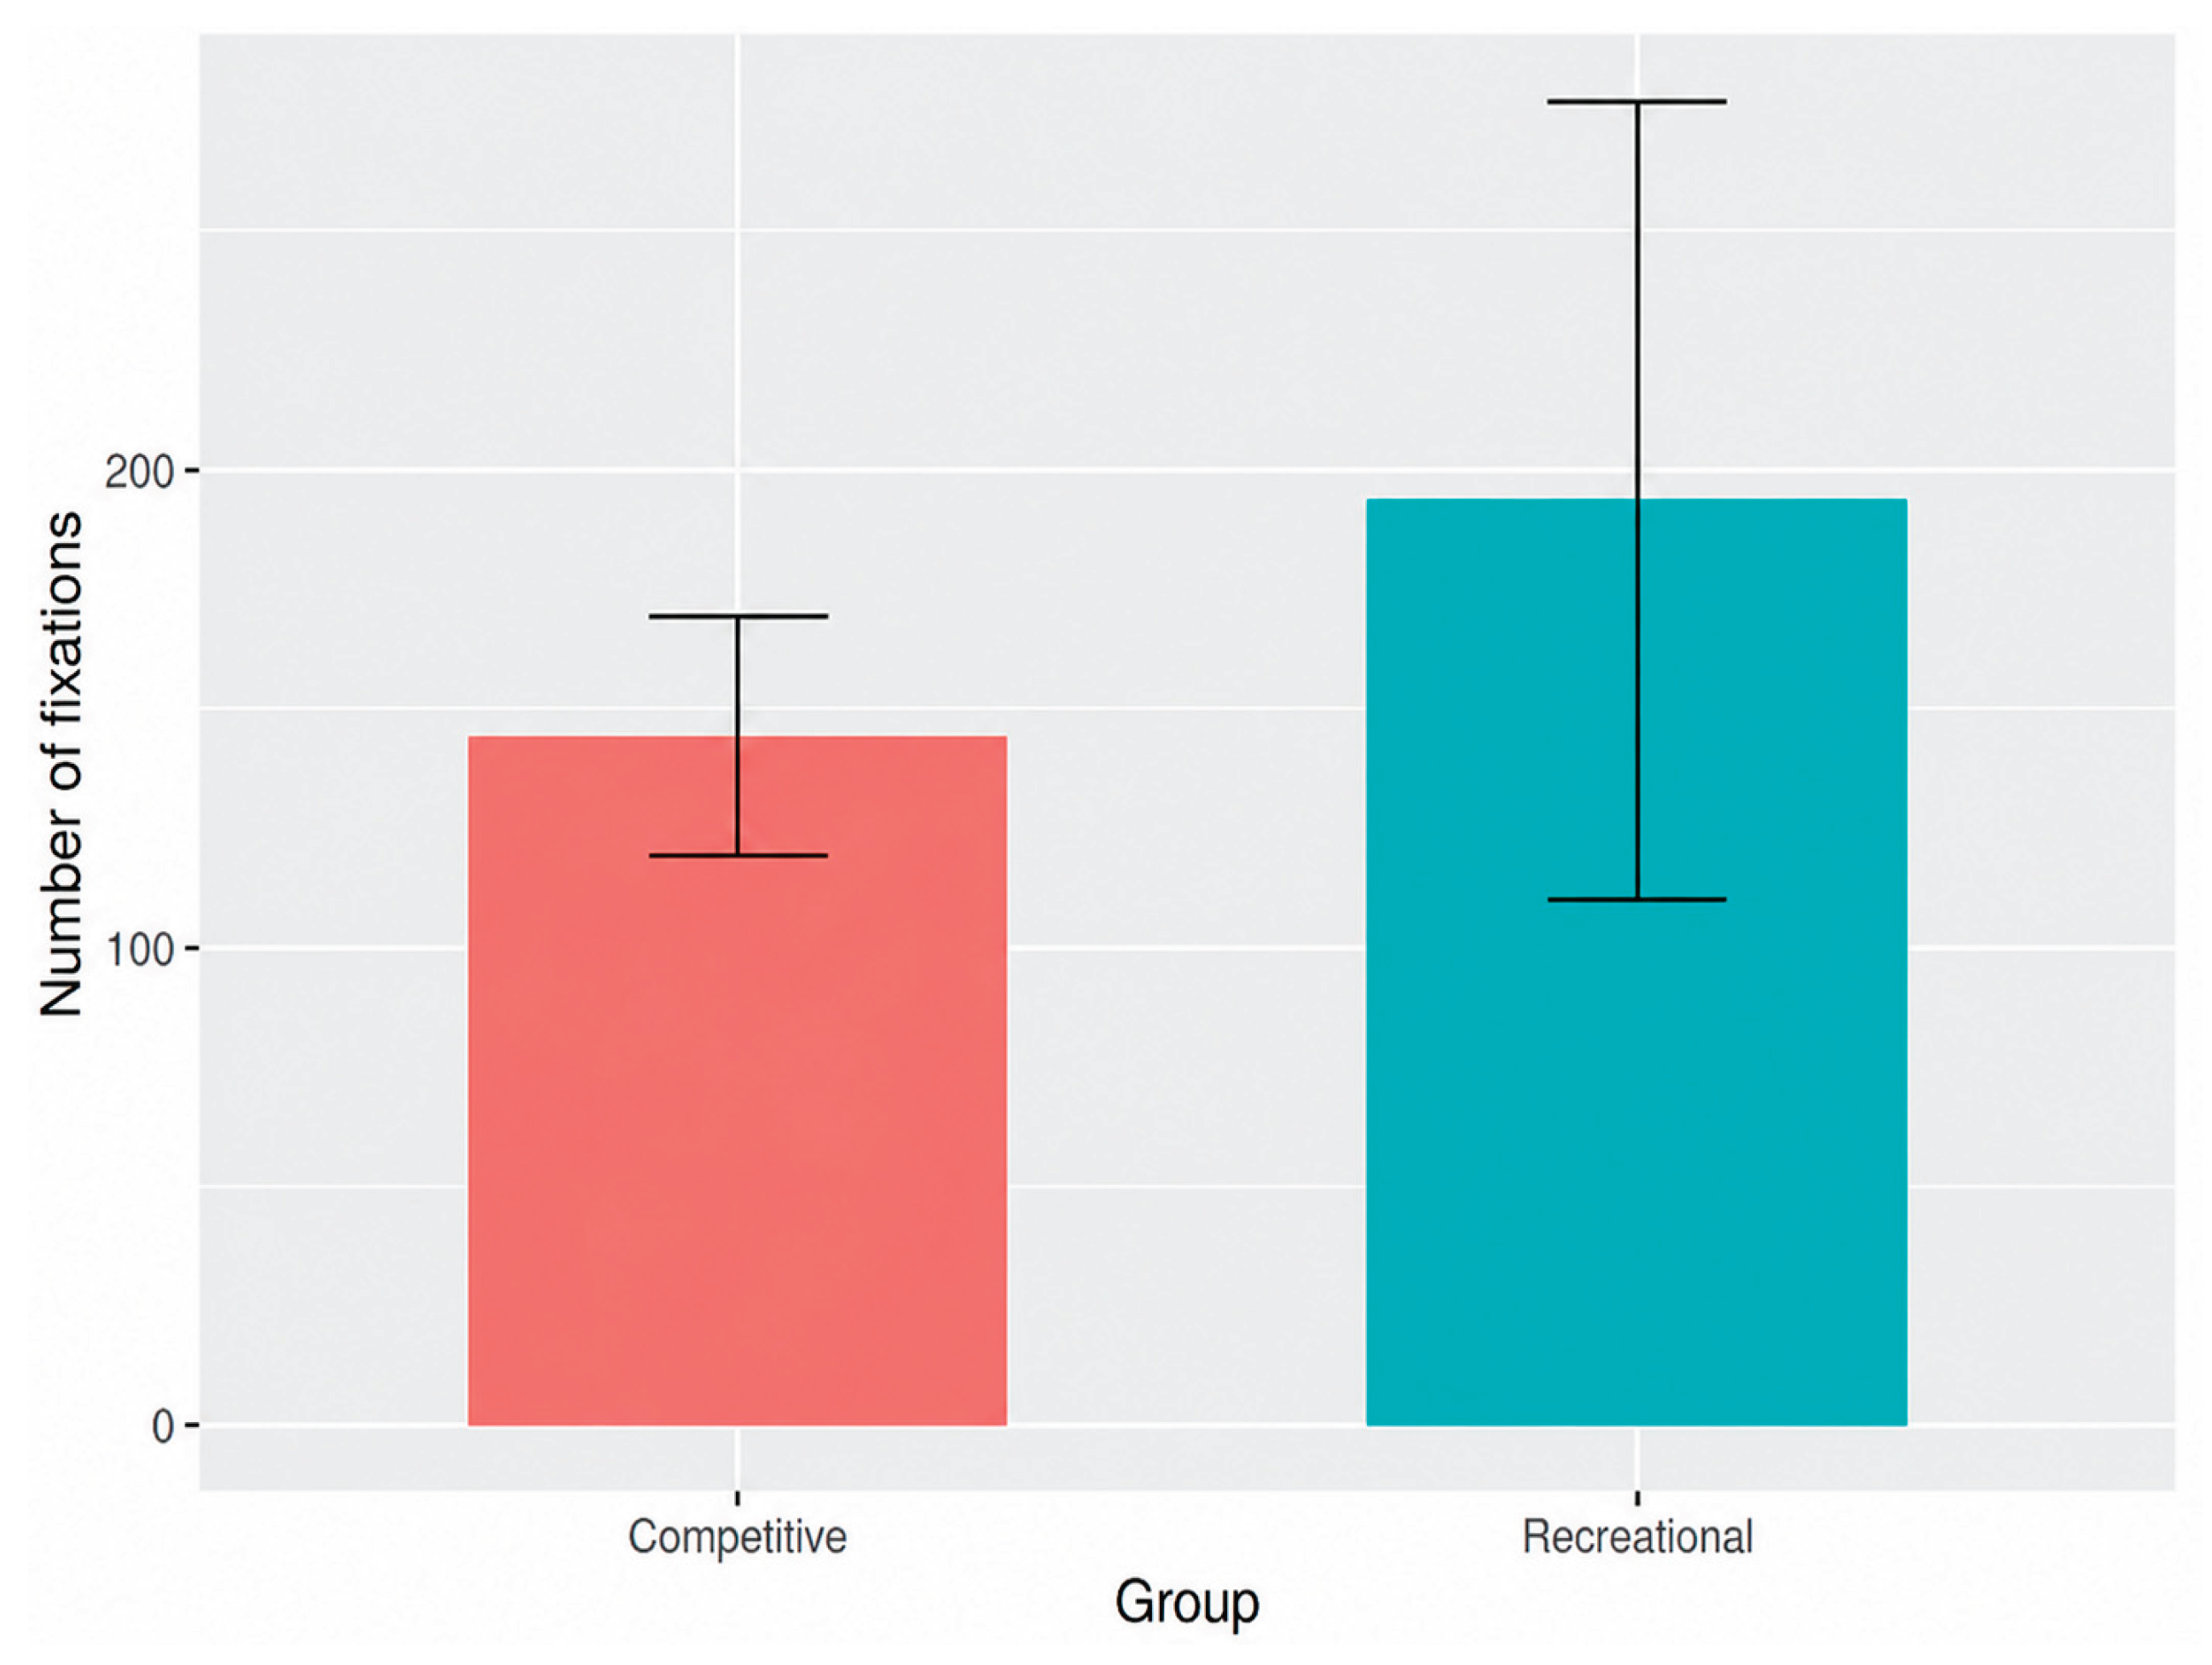
Figure 2.
Gaze dispersion on the X and Y axes by group (mean ± SD).
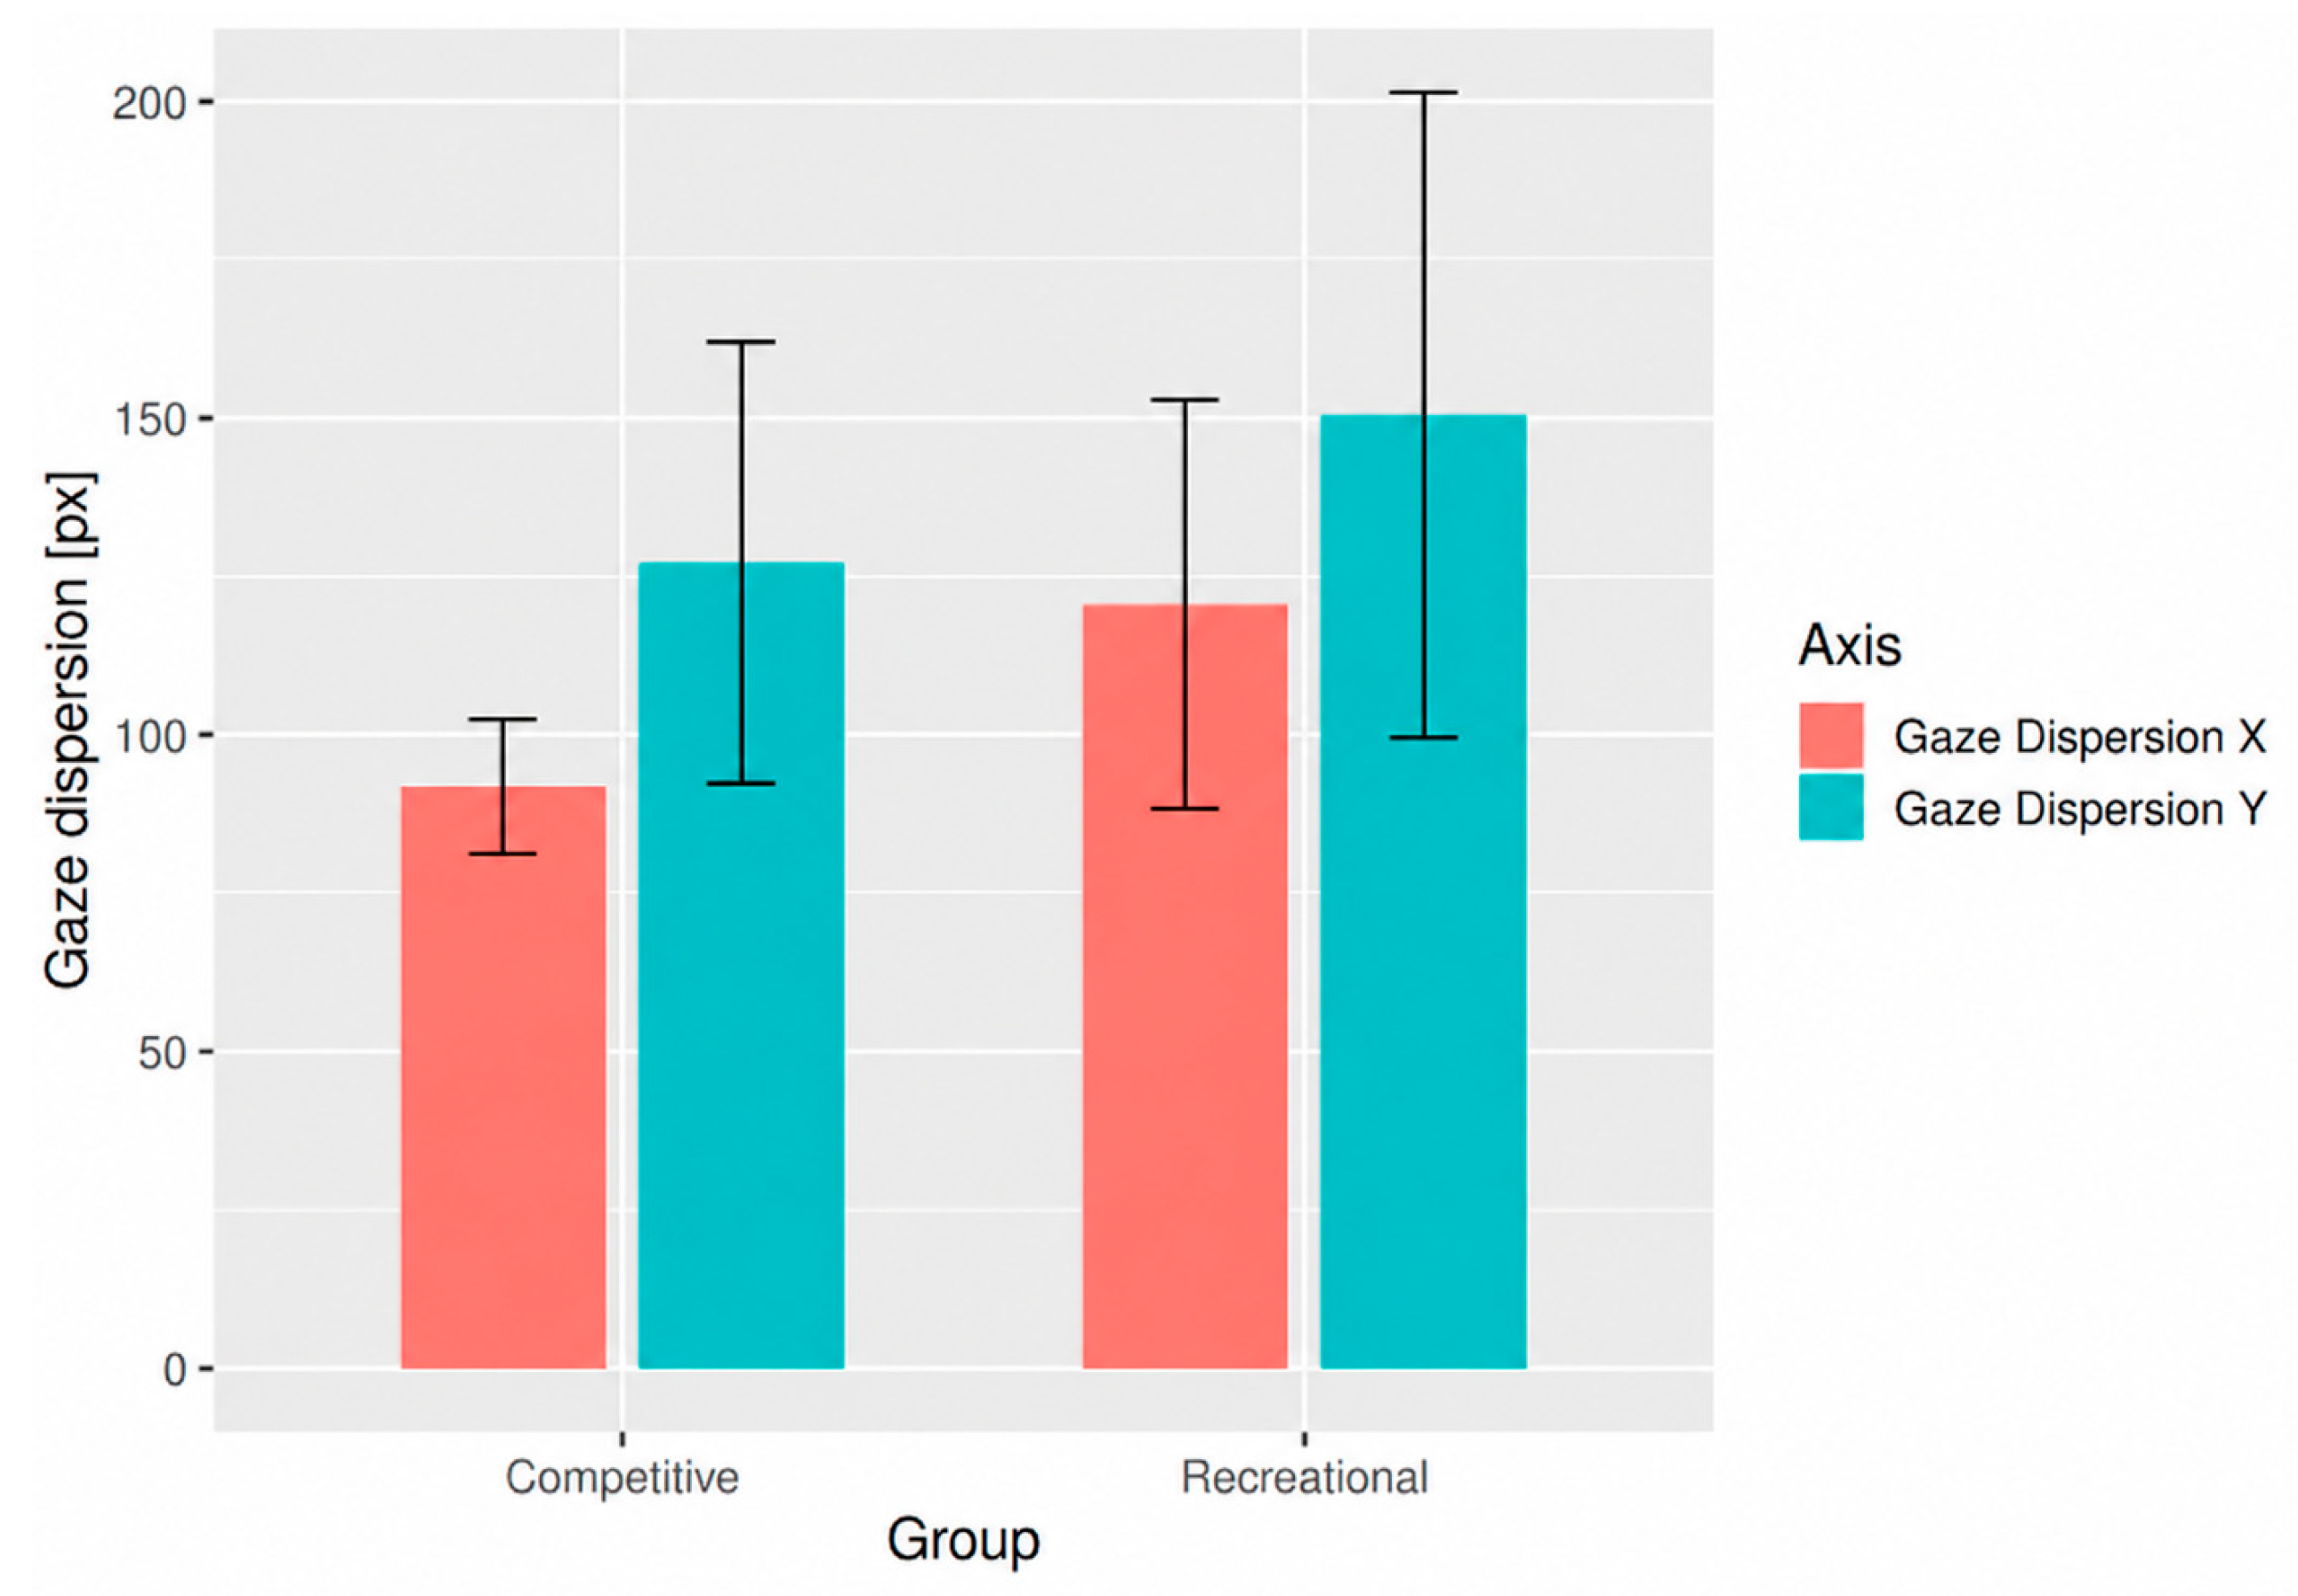
Figure 3.
Difference between vertical and horizontal dispersion (anisotropy index) by group (mean ± SD).
Figure 3.
Difference between vertical and horizontal dispersion (anisotropy index) by group (mean ± SD).
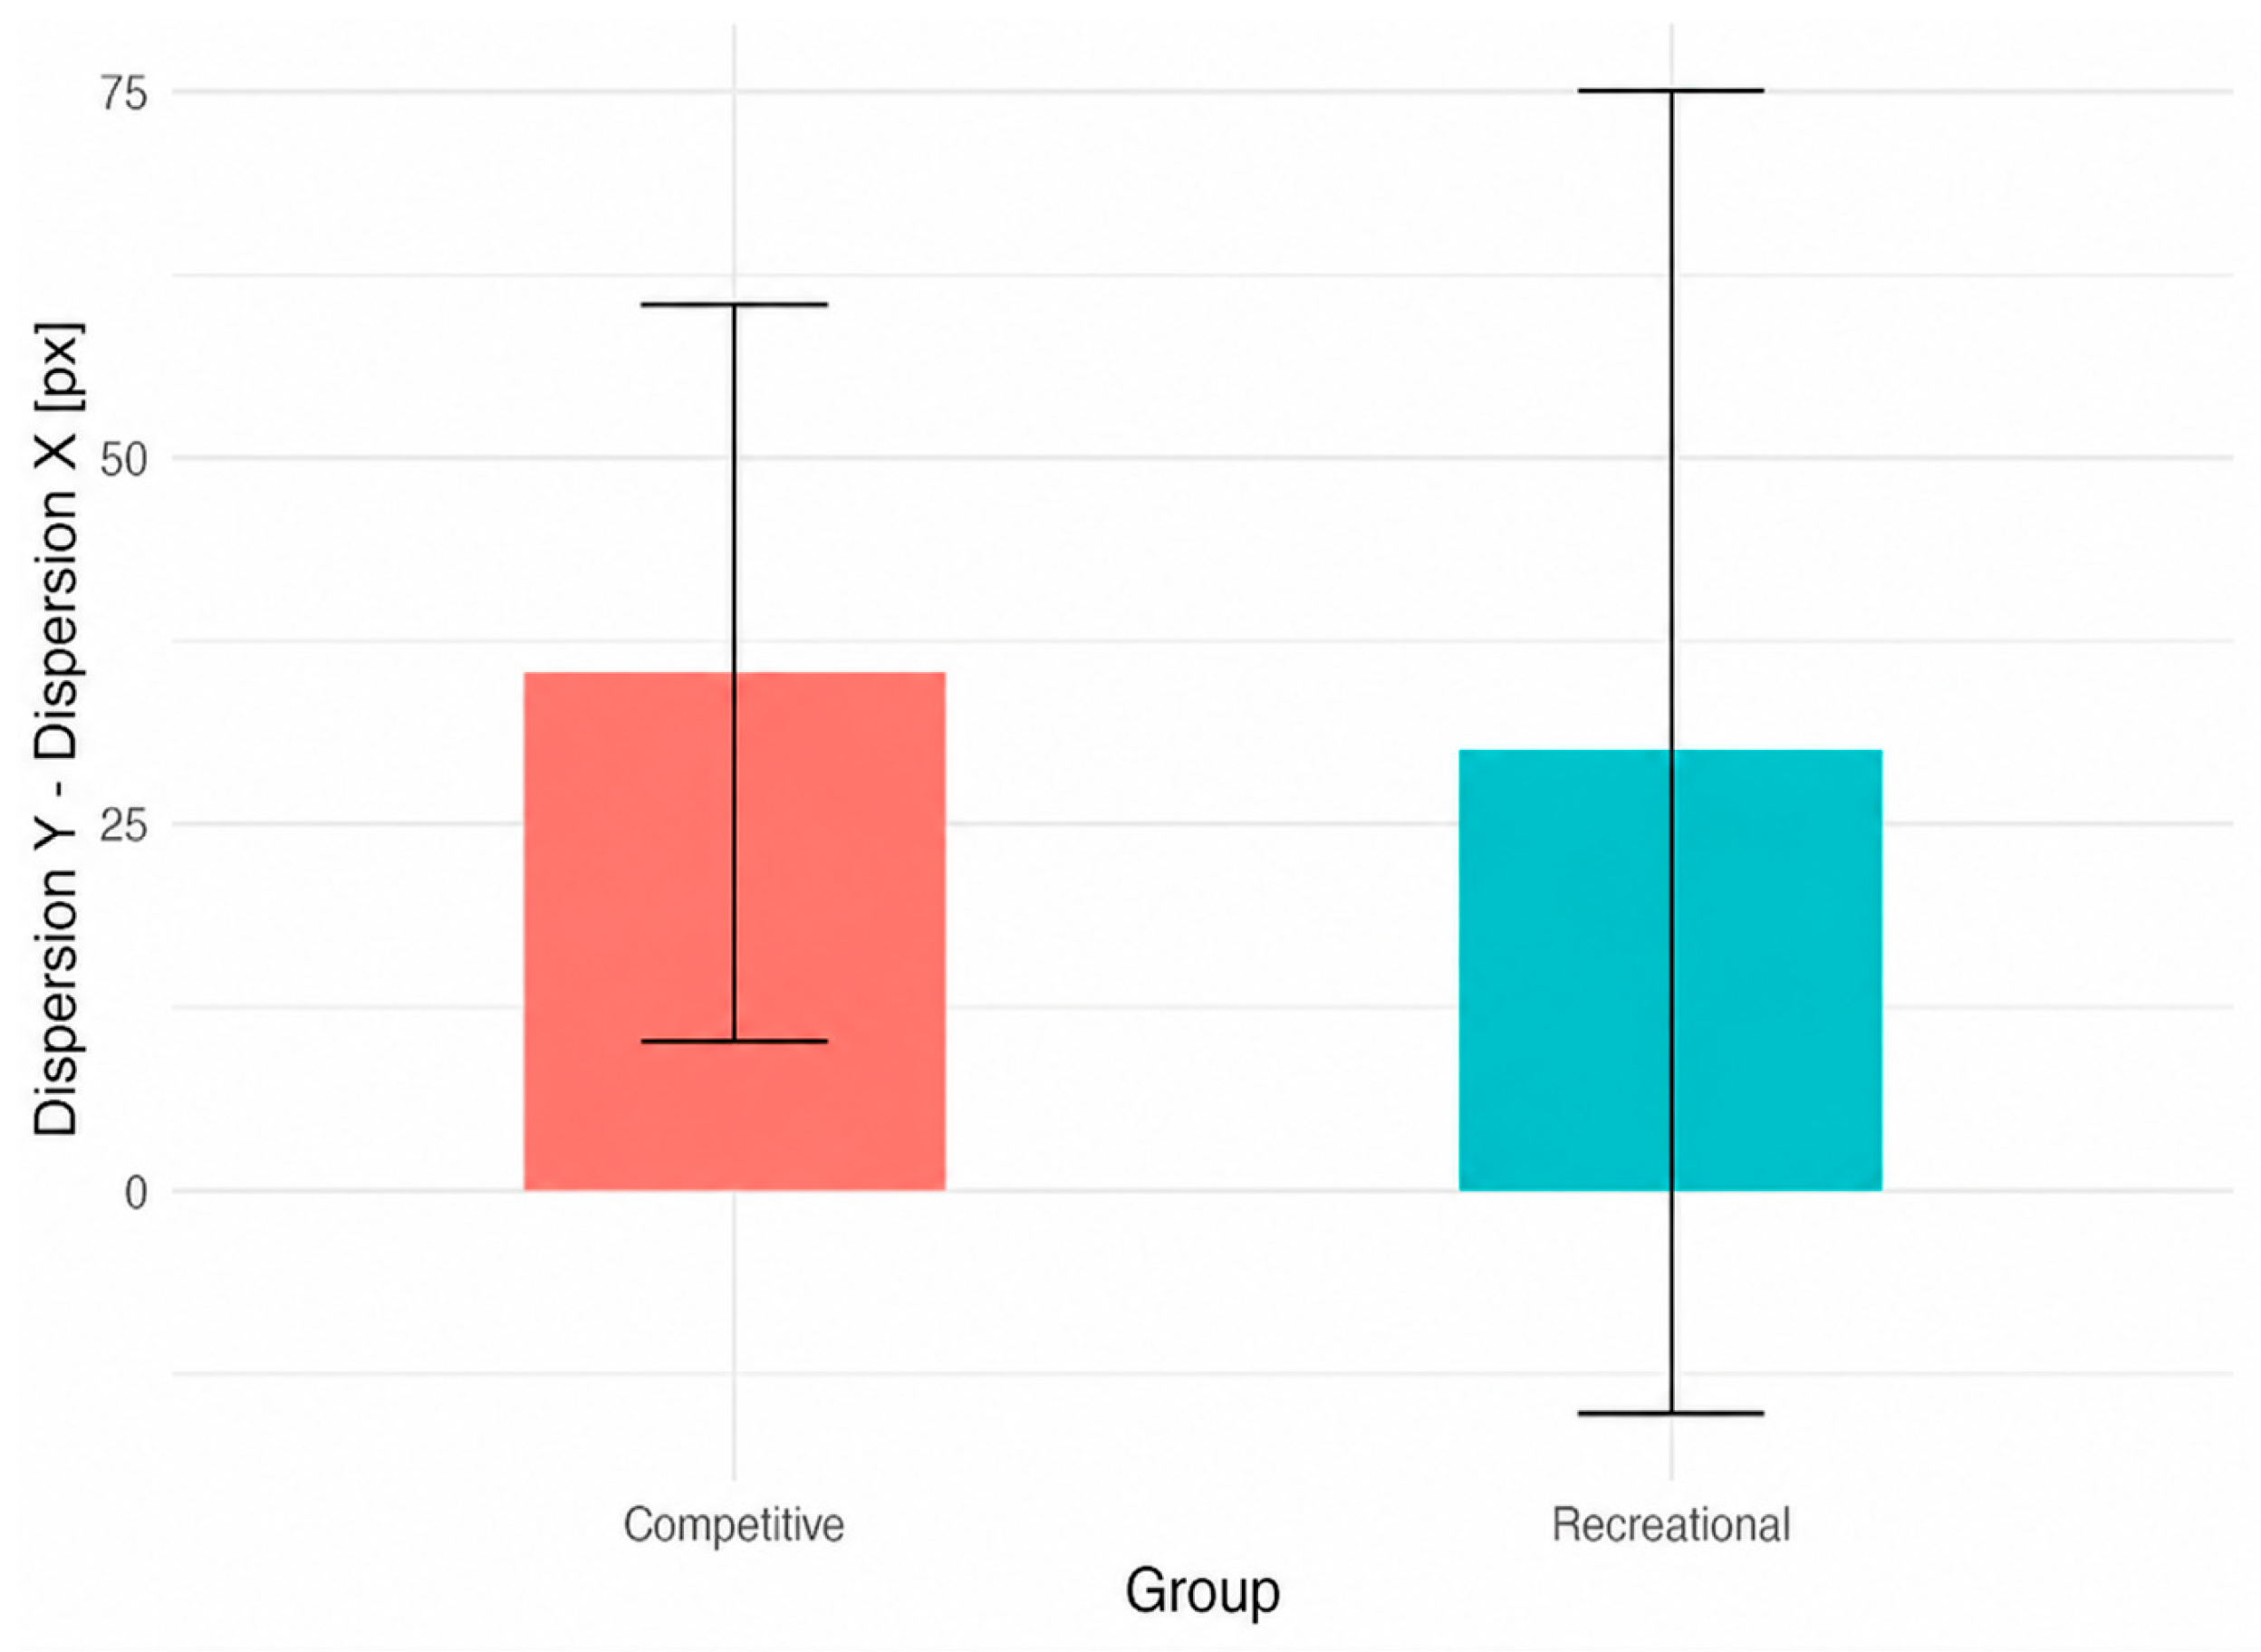
Figure 4.
Distribution of single-response × phase observations for mean fixation duration and number of fixations in competitive and recreational players. Overlaid points indicate individual participants' means.
Figure 4.
Distribution of single-response × phase observations for mean fixation duration and number of fixations in competitive and recreational players. Overlaid points indicate individual participants' means.
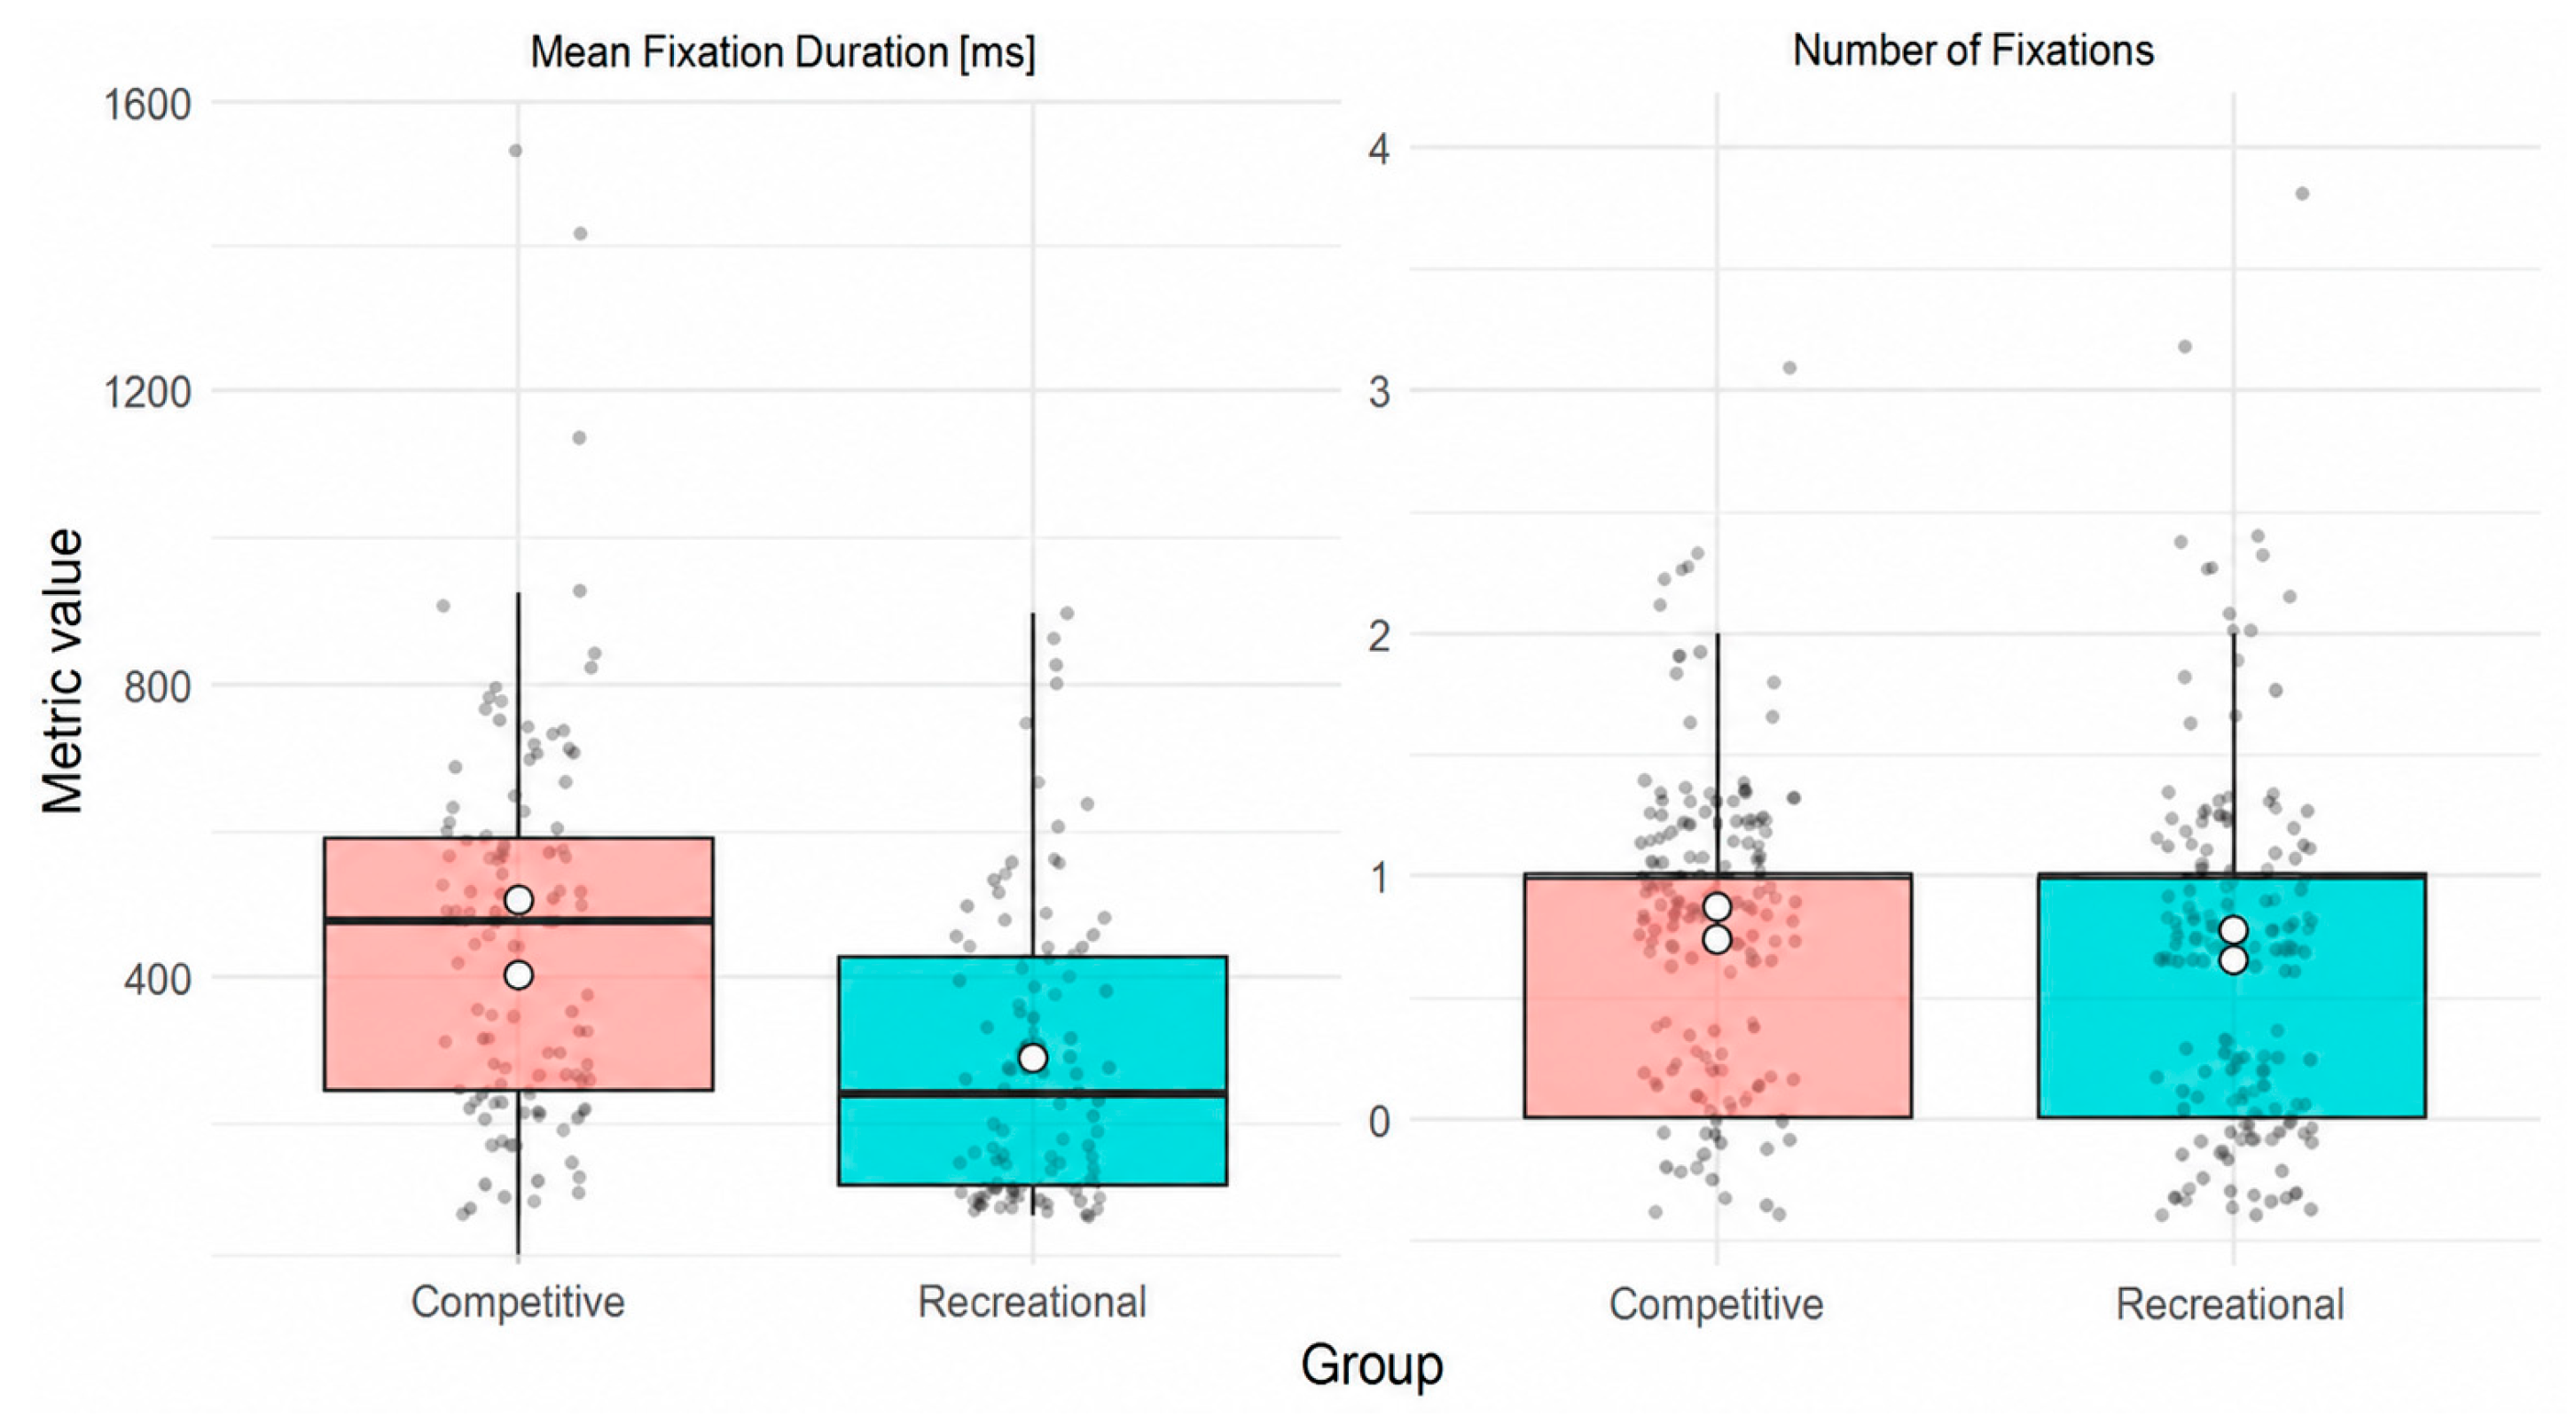
Table 4.
Descriptive statistics at the response × phase level (mean ± SD).
| Group | Phase | N with Fix. | No. Fixations | Mean Duration [ms] | Disp. X [px] | Disp. Y [px] |
|---|---|---|---|---|---|---|
| Competitive | pre-bounce | 71/80 | 0.92 ± 0.38 | 587.6 ± 232.2 | 17.4 ± 5.5 | 23.9 ± 8.7 |
| Competitive | post-bounce | 44/80 | 0.69 ± 0.72 | 245.0 ± 126.6 | 29.8 ± 20.5 | 32.7 ± 13.3 |
| Recreational | pre-bounce | 42/80 | 0.54 ± 0.53 | 450.5 ± 194.9 | 47.1 ± 33.2 | 30.5 ± 11.6 |
| Recreational | post-bounce | 53/80 | 0.89 ± 0.81 | 163.2 ± 90.7 | 68.0 ± 39.2 | 27.9 ± 11.3 |
Note. "N with fix." indicates the number of segments in which at least one fixation was detected, out of the 80 observations available for each group × phase combination.
Table 6.
Mean score and high/low score distribution, by group.
| Group | Mean Score | % High Score (≥3) | % Low Score (≤2) |
|---|---|---|---|
| Competitive | 2.08 | 50% | 50% |
| Recreational | 1.24 | 29% | 71% |
Table 7.
Mean total fixation times [s] by group and score category.
| Group | High Score (≥3) | Low Score (≤2) |
|---|---|---|
| Competitive | 3.299 | 2.642 |
| Recreational | 3.103 | 2.429 |
| Overall | 3.227 | 2.517 |
Note. Although serve-return scores were assigned at the individual-response level, they were summarised here at the group and score-category level and were not integrated into the mixed-effects modelling pipeline; these comparisons are therefore reported descriptively, without inferential testing, consistent with the pilot design of the study (Section 2.6).
Disclaimer/Publisher’s Note: The statements, opinions and data contained in all publications are solely those of the individual author(s) and contributor(s) and not of MDPI and/or the editor(s). MDPI and/or the editor(s) disclaim responsibility for any injury to people or property resulting from any ideas, methods, instructions or products referred to in the content. |
© 2026 by the authors. Licensee MDPI, Basel, Switzerland. This article is an open access article distributed under the terms and conditions of the Creative Commons Attribution (CC BY) license.
Copyright: This open access article is published under a Creative Commons CC BY 4.0 license, which permit the free download, distribution, and reuse, provided that the author and preprint are cited in any reuse.